Article

A Comparison of the Energy Expenditure in Different Storage Tank Geometries to Maintain H2 in the Liquid State

by
Joaquim Monteiro
1,2,*,
Leonardo Ribeiro
1,2,
Gustavo F. Pinto
1,2,
Adélio Cavadas
3,
Beatriz Coutinho
1 and
Andresa Baptista
1,2
1
CIDEM, ISEP, Polytechnic of Porto, Rua Dr. António Bernardino de Almeida, 4249-015 Porto, Portugal
2
INEGI—Instituto de Ciência e Inovação em Engenharia Mecânica e Engenharia Industrial, 4200-465 Porto, Portugal
3
ProMetheus—Escola Superior de Tecnologia e Gestão, Instituto Politécnico de Viana do Castelo, Rua Escola Industrial e Comercial de Nun’Álvares, 4900-347 Viana do Castelo, Portugal
*
Author to whom correspondence should be addressed.
Energies 2024, 17(22), 5557; https://doi.org/10.3390/en17225557
Submission received: 8 October 2024 / Revised: 4 November 2024 / Accepted: 5 November 2024 / Published: 7 November 2024
(This article belongs to the Special Issue Advances in Hydrogen Production and Hydrogen Storage)

Abstract

:
The aim of this paper is the study of the storage of hydrogen in the liquid state, LH2, with a focus on the thermal gains for cylindrical and spherical tank geometries. A given tank volume was assumed; three geometries for such a tank were taken, similar to the most common tanks for LH2 storage: cylindrical (vertical and horizontal) and spherical. An integrated refrigeration system was considered for LH2 stored at a temperature around 22 K and at a pressure around 3 bar. Then, the energy expenditure by the refrigeration system to maintain LH2 in the liquid state was determined and compared with the value of the energy contained in the LH2, in order to compare such a storage method to other hydrogen storage methods, namely compressed hydrogen, in the gaseous state. The most important conclusion was that spherical tanks had lower thermal gains than tanks with other geometries.

1. Introduction

1.1. Importance of Hydrogen

Presently, owing to the high energy consumption by Western economies and the worldwide exorbitant dependence on fossil fuels [1], humankind is faced with multiple problems to solve with reference to the deterioration of the environment. As a short-term objective, the European Union is committed to lowering its emissions by at least 55% by 2030, compared to 1990 levels [2].
It is also necessary to consider the fossil fuel reserves, as it is expected that they will cease to be economically viable by 2112 [3,4].
Therefore, it is necessary to develop new methods of production and storage of energy in order to satisfy the growing global energy consumption. Multiple concepts and alternatives to fossil fuels are emerging, one of which is hydrogen [5]. Hydrogen is seen as the cleanest energy vector [6] and can be produced by wind turbines during hours of lower electric energy consumption [7].
With the increasing interest in hydrogen, attention has turned to the main problems this fuel presents: its production and storage.
As would be expected, the production of any synthetic fuel, such as hydrogen, has significantly higher cost than the direct utilization of a fossil fuel [8]. Since about 95% of hydrogen production comes from the conversion of fossil fuels, there is high interest in research on this subject [9].

1.2. Energy Content

As for storage, although hydrogen has a very high heating value, its low density entails a low energy density. Therefore, to obtain a large mass of gaseous hydrogen within a container, high pressure will be required.
Under normal conditions of pressure and temperature in the Earth’s atmosphere, hydrogen appears as a colorless, odorless, tasteless, highly flammable gas, lighter than air. When subjected to extremely low temperatures, like 22 K, the gas changes to a liquid state and can then be stored in cryogenic systems [10,11].
As aforementioned, hydrogen has a high HHV of 141.9 J∙kg−1. However, in terms of energy per unit volume, in the liquid state, it has a very low heating value of 10.10 J∙m−3 [12]. In Table 1, such values can be compared with the homologous values of other fuels.
Through Table 1, we can verify that, comparing the fuels mentioned in the liquid state, hydrogen is the one that occupies more space for a given amount of energy. Comparing hydrogen with gasoline, 1 kg of LH2 represents the same amount of energy as, approximately, 3 kg of gasoline. However, once again, the volume occupied by gasoline will be much smaller, about 29% of the volume occupied by LH2. As for gaseous fuels, natural gas will occupy about 32% of the volume occupied by hydrogen for an equal amount of energy.

1.3. Safety Questions

Like any other fuel, hydrogen is flammable and potentially dangerous. However, it is incorrect to consider it more dangerous than other fossil fuels.
In order to facilitate the safety analysis of precautions needed when storing or using hydrogen as a fuel, Table 2 is presented. It presents safety-relevant properties for hydrogen and other fossil fuels.
The lower the density of a fuel, the safer its use will be as its dispersion, in the event of a leak, becomes easier. For the same reason, the higher the diffusion coefficient of a fuel, the safer its use will be. Regarding both these parameters hydrogen stands out.
High values of specific heat also make the fuel safer, as it lowers the temperature increase for a given thermal input. Again, hydrogen has a substantial advantage.
The wider the flammability range, the lower the ignition energy, or the ignition temperature, the more dangerous is the fuel. However, in the case of hydrogen, it is necessary to analyze these values cautiously, in particular the flammability limit and the ignition energy. The wide flammability range of hydrogen is, from the outset, a disadvantage when compared to the flammability range of the other fuels presented. However, since the minimum values are similar for all fuels, which is of high importance since, in real accident situations, as soon as the fuel reaches the minimum flammability concentration, hydrogen will be in a situation similar to the other gaseous fuels before a heat source [14].
Hydrogen has a very low minimum ignition energy, which could be a disadvantage. However, the decisive aspect will be the need for weak sources of ignition, such as sparks or electrical equipment, which produce more than the minimum energy required to ignite all the fuels in Table 2 [15,16].
Finally, the flame of hydrogen is invisible, which could be potentially dangerous for untrained individuals [11,17].

1.4. Storage Methods

As of the early 2000s, annual hydrogen production was around 50 billion m3. However, only 5% of the hydrogen produced was commercialized, which is explained by the difficulty in storing and transporting hydrogen. Large consumers of hydrogen have their own production facilities [18].
Storage system requirements are primarily determined by the final intended application. In the case of vehicles, the total weight of the hydrogen installation should be as low as possible, but this will not be a determining factor in the case of a stationary installation [18].
Hydrogen storage can be classified as physical or chemical, depending on the type of processes the hydrogen is subjected to [18,19]. Currently, physical methods are widely used, despite their disadvantages, and chemical methods are still in a developmental stage. For this reason, only physical storage methods (liquid and gaseous state) will be explored [11,20].

1.4.1. Storage—Gaseous State

The simplest way to store hydrogen is within pressurized cylinders, but this method is suitable only for small quantities of gas. Normally, hydrogen is used as a chemical reactant in some production processes; if the intention is to use it as an energy vector, this solution is less satisfactory [11].
As a rule, due to material strength and operating costs, hydrogen is not stored at pressures exceeding 100 bar in surface-mounted tanks and at pressures exceeding 200 bar in underground facilities [21]. Since operating pressures are limited, the density of hydrogen will be limited too. At 100 bar and 298 K, the density will be around 7.8 kg∙m−3. The reduced density will entail large volumes of the storage facility and expensive investments [22].
Underground storage facilities are cheaper compared to above-ground facilities. Large amounts of hydrogen are currently stored in salt cavities at Teeside, UK, and Texas, USA, which demonstrate the feasibility of this type of storage process [22].
As for surface-mounted tanks, the most common storage systems operate with pressures around 200 bar, if constructed of steel, and can reach 800 bar using composite materials. At 800 bar, the density of hydrogen reaches 36 kg∙m−3 [11,23].
The main disadvantage of the gaseous storage of hydrogen is the weight of the containers. Accordingly, to improve the characteristics of this storage process, it will be necessary to use light materials that guarantee structural integrity when subjected to high pressures. A viable solution is shown in Figure 1 and consists of using a liner of aluminum or polymer, reinforced by another layer of fiberglass or carbon, both of which are protected by an outer layer [24].

1.4.2. Storage—Liquid State

Liquid hydrogen storage is carried out at a temperature of approximately 22 K. Currently, this is the only method used to store large volumes of hydrogen [11].
With this storage method, a greater hydrogen storage density is achieved, but it presents some relevant technical obstacles: firstly, the liquefaction process entails a very high energy consumption, about 30% of the total energy stored; secondly, the energy required to maintain hydrogen in the liquid state; finally, the difficult effective design of the thermal insulation of the tank [19].
Regarding the energy consumption of the hydrogen liquefaction process, there are basically two factors that explain its high value: the extremely low boiling temperature (22 K at 1 bar) and the fact that gaseous hydrogen does not cool down during isenthalpic expansion processes at temperatures below 200 K. This last feature makes it necessary to introduce a pre-cooling step [22,25].
With hydrogen being in a liquid state, it will be necessary to store it within a thermally insulated container to minimize hydrogen evaporation, which not only represents loss of energy but also the loss of the hydrogen itself, since eventually it will be necessary to release evaporated hydrogen to prevent a dangerous pressure buildup inside the container [22].
Over time, this releasing of hydrogen allows the evaluation of the evaporation rate and of the percentage of stored hydrogen lost daily. The evaporation rate depends on the size, shape, and thermal insulation of the container. Theoretically, a spherical tank has the best geometrical characteristics due to the lowest surface-to-volume ratio; the counterpart is its difficult construction. Bearing in mind that the thermal losses are proportional to the relationship between the surface and the volume, for a given surface, the losses will decrease with the increase in the volume of the container. A spherical tank’s evaporation rate will be about, for the volumes of 50 m3, 100 m3, and 20,000 m3, respectively, 0.4%, 0.2%, and 0.06% [25,26].
Several container concepts with zero evaporation rates are being explored, and cooling systems for small-scale containers have already been successfully developed [26]. In 2017, NASA presented a large-scale container with an integrated cooling system that showed zero evaporation rates during a 13-month test period [26].

1.5. VED and GED

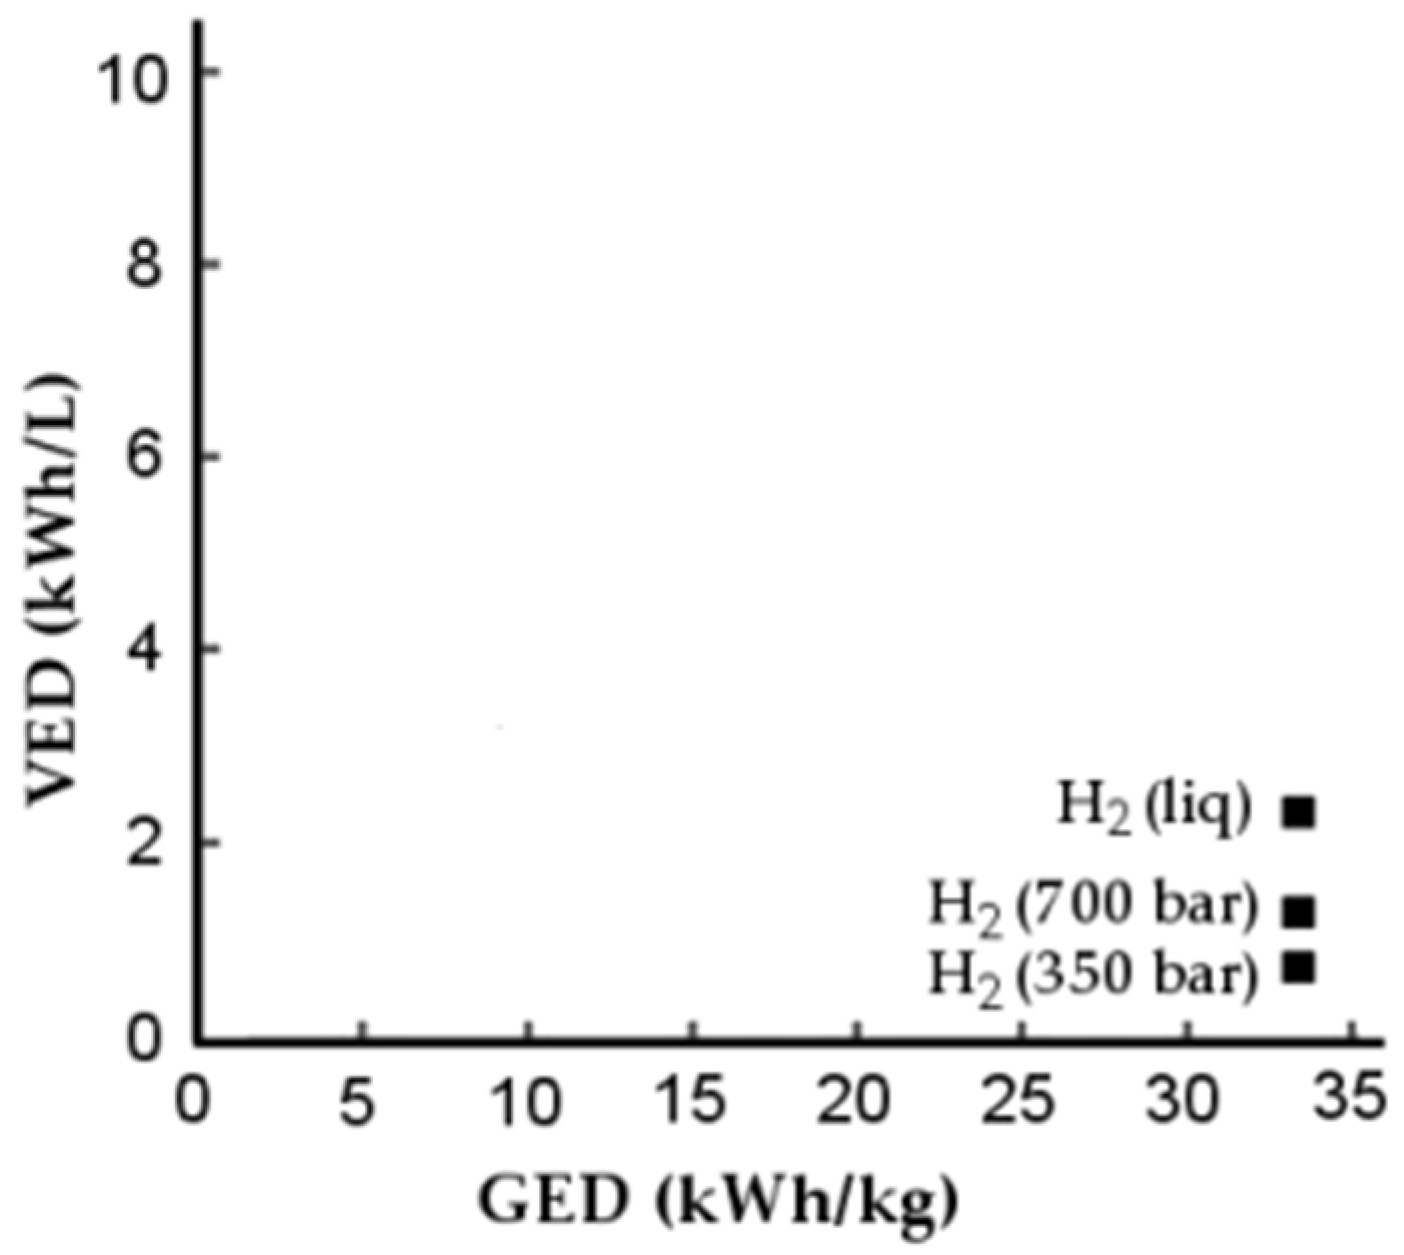
To assess the performance of the storage system, the energy stored in relation to the mass of the storage system, GED, and the energy stored in relation to the volume of the system, VED, can be compared. This comparison is shown in Figure 2.
Figure 2 shows that storage in the liquid state has the highest VED value; the GED value has similar values for both gas and liquid storage methods. This gives support to the storage of hydrogen in the liquid state.

2. Methodology

2.1. Geometry

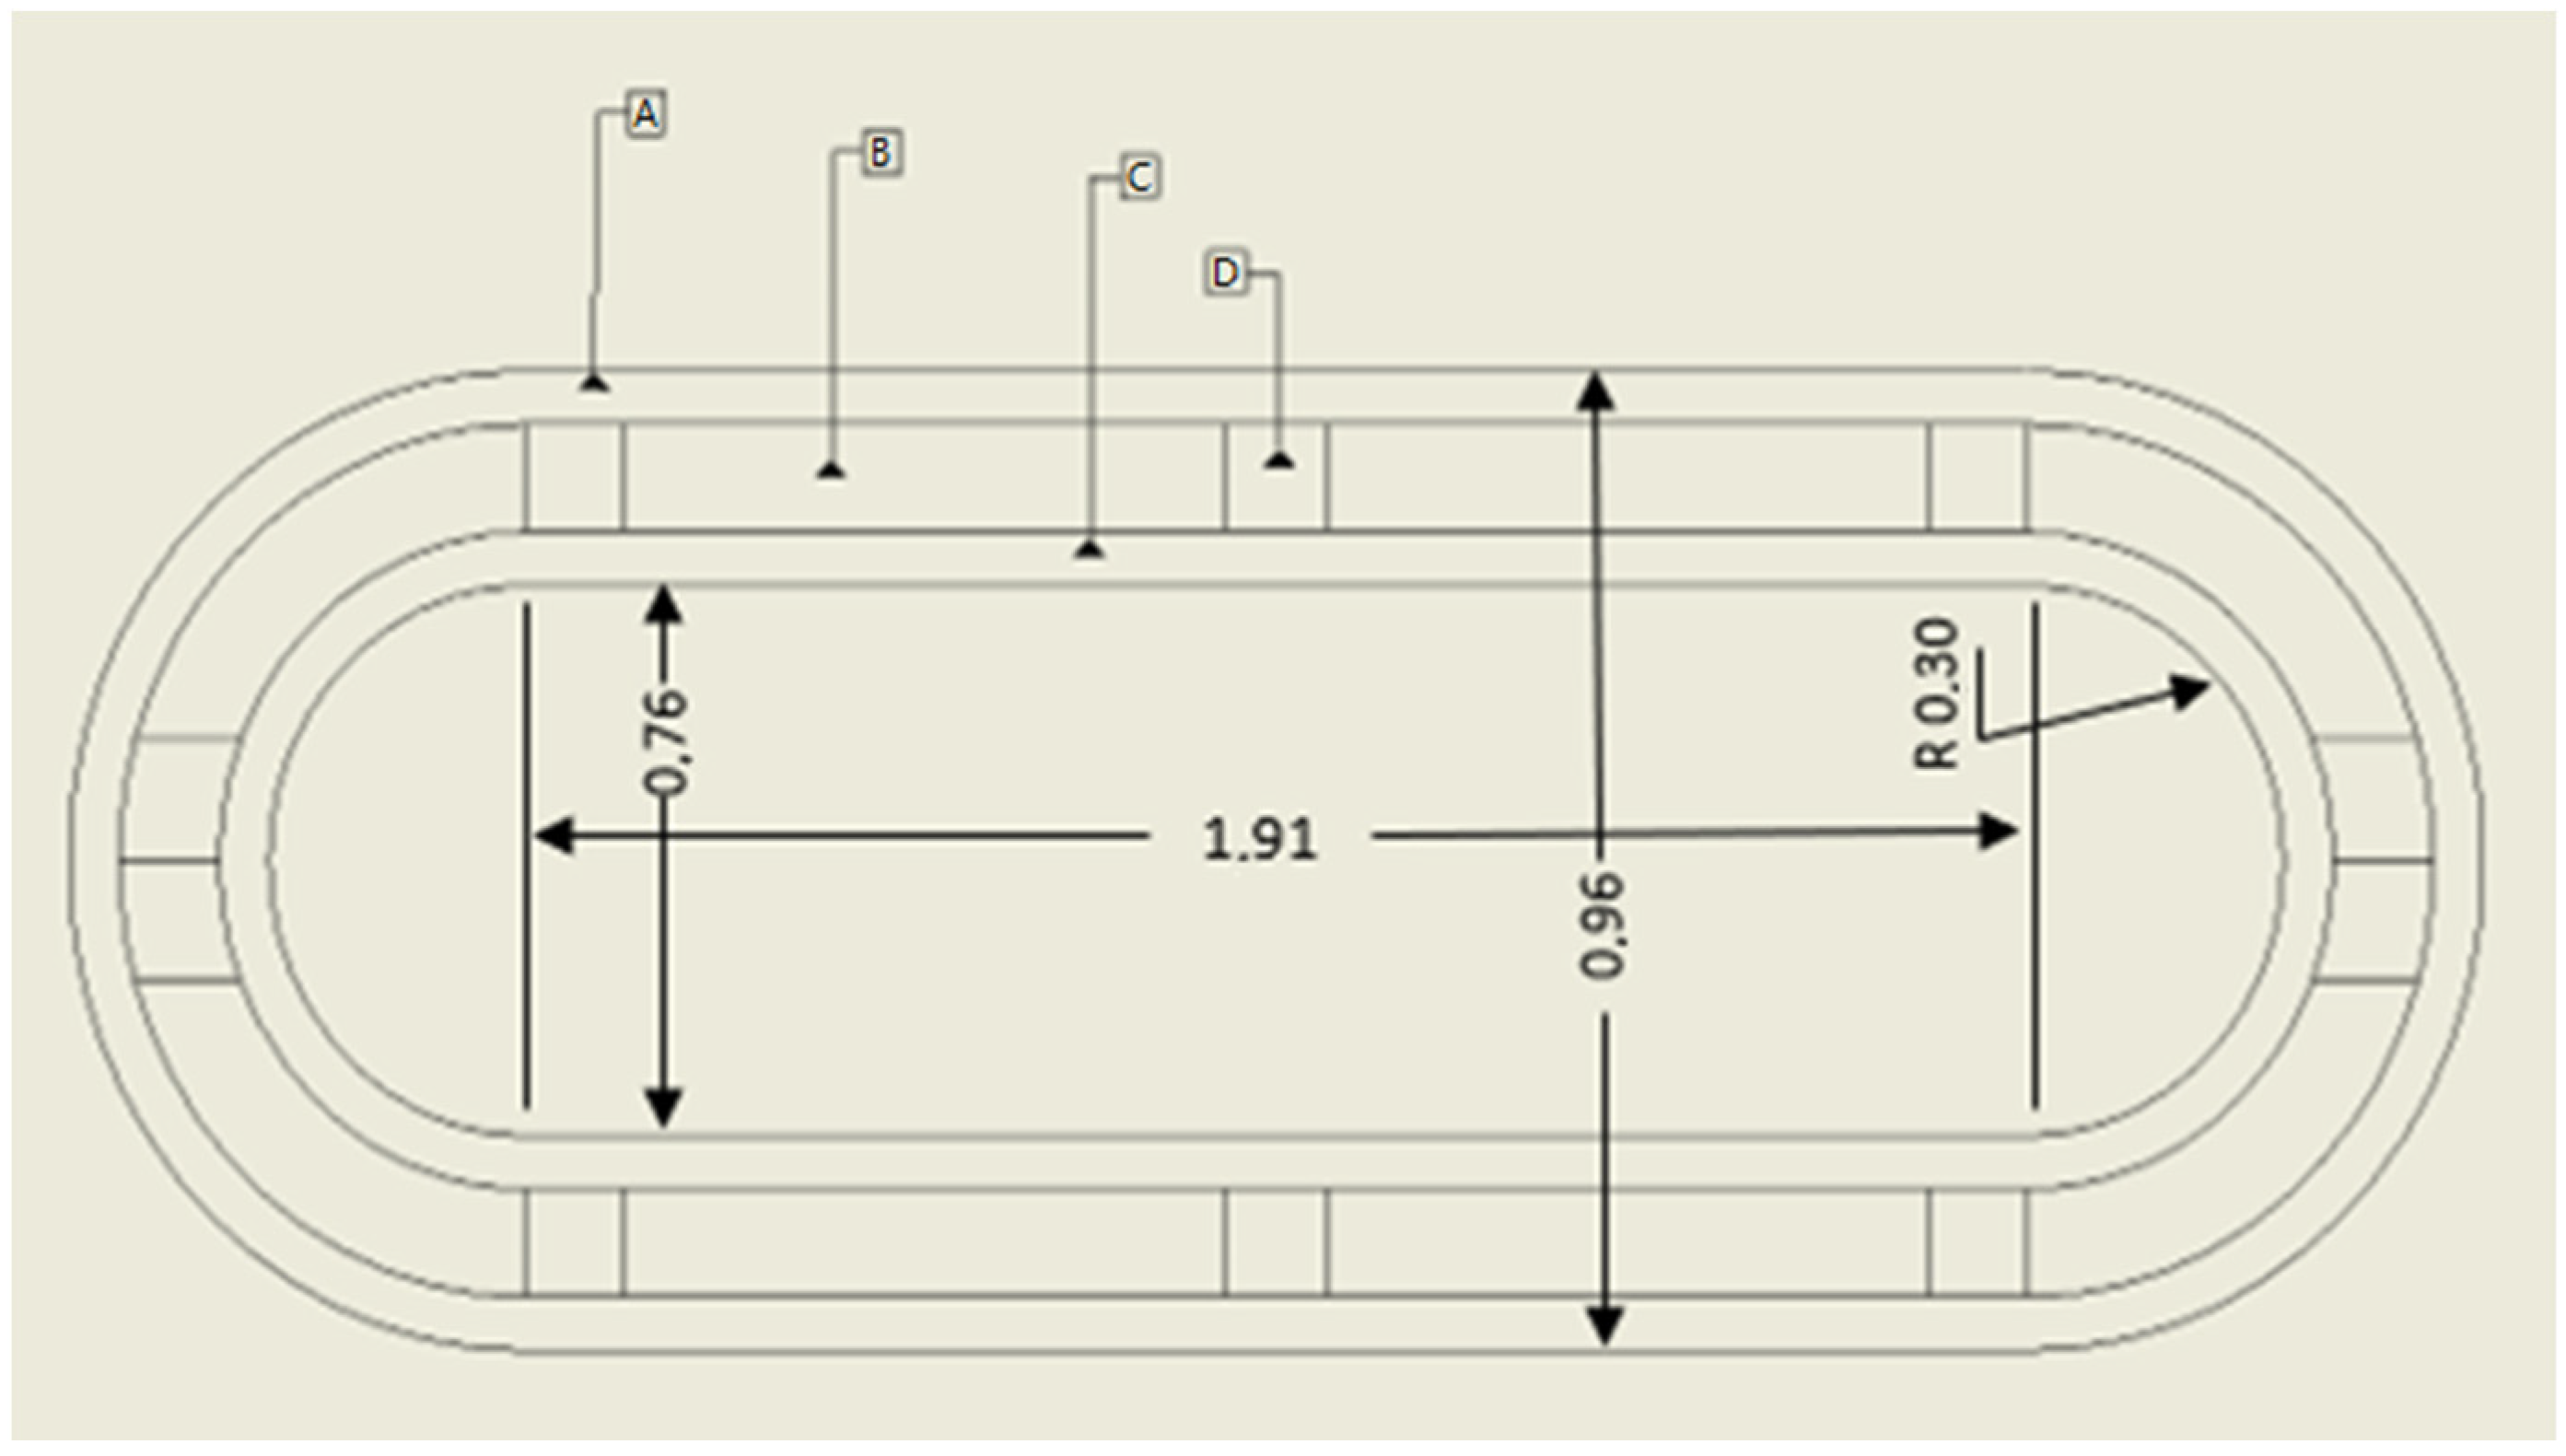
Figure 3 shows one of the tanks considered in this study; the spherical geometry was also considered. Anyway, the structural elements will be the same for both geometries. Moreover, all calculations considered an inner volume of 1 m3 for both geometries.
This study began by determining the thermal gain of the tank, after which a refrigeration system by compression was designed.
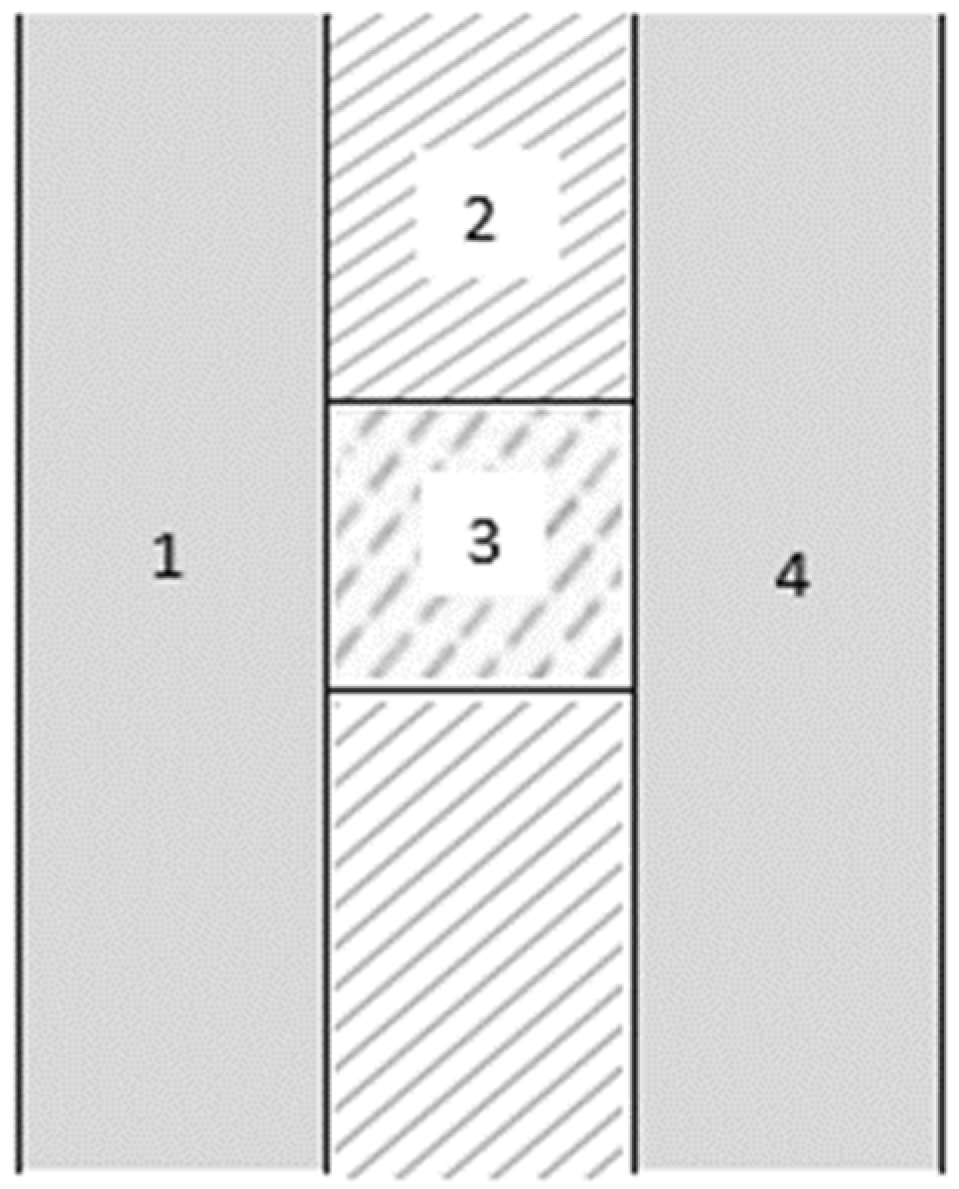
In the case of the cylindrical tank, the parameters that need to be defined are the ratio between the diameter and the length, D/L; the radius of the dished head cap ends; and the thickness of the different layers of the walls, taken to be the same for both tanks. In Figure 4, a cross-section of the container wall is shown: 1 is the inner layer in contact with hydrogen; 2 is the insulation layer; 3 is an element for structural integrity; 4 is the outer layer in contact with ambient air.
The importance of the D/L parameter depends on the orientation of the cylindrical tank (horizontal or vertical); it can assume different values depending on the application of the container and the characteristics of the place in which the container is set up. Usually, for the storage of natural gas in the liquid state, D/L ranges between 2 and 9. In this study, D/L = 5 was chosen.
As for the dished head cap ends, they were assumed to be of the Korbbogen type, Figure 5, suitable for medium/high pressures, namely 3 bar, which is the common maximum pressure for liquid hydrogen storage. For this type of cap end, the inner spherical radius varies between 0.8 and 0.9 of the inner diameter of the tank; in this study, the value 0.9 was chosen.
As for the thickness of the container wall, see Figure 4, the thicknesses of layers 1 and 4 are decisive for the structural integrity of the container, but this is not the focus of the current study; its contribution to the thermal insulation of the container is minimal, due to the high thermal conductivity associated with typical construction materials. Bearing in mind that the structural design is not relevant for our scope, a thickness of 10 mm was assumed for both internal and external walls, which is a common value for these containers [28].
The layer of insulation has, by far, the greatest influence on the thermal gain of the container. In the calculations below, the assumed thickness values of 10, 20, 30, 40, and 50 mm were considered; for each value, the thermal gain of the container was determined.
At last, the structural supporting rods were assumed as cylinders, with 0.1 m radius and length equal to the insulation thickness.

2.2. Materials

Materials must have a high modulus of elasticity, yield strength, fracture strength, and rigidity, as well as low density and low hydrogen permeability. However, there is no material with all these characteristics at the same time, so the elastic modulus and density are the parameters that prevail on the container design. Moreover, in cryogenic applications, the critical crack size is relevant [29,30].
Besides those properties, it is also important that the material presents characteristics that allow failures to be detected before they become catastrophic, namely yielding or leakage before failure. In case the material yields, as the cracks propagate, the material undergoes plastic deformation, which is a warning before the cracks reach critical size [29].
Composite materials have a high tensile strength associated with reduced density. It is recommended to use discontinuously reinforced metallic composite materials (hybrid structures), more specifically discontinuously reinforced aluminum. Despite the promising features of this group of materials, their use would dramatically increase the cost of the container production process. Furthermore, there is also the problem of hydrogen permeation and the fact that composite materials have different coefficients of thermal expansion (TECs), which can induce unwanted stresses on the material [29,30].
Ceramic materials also have high rupture strength, but, owing to their brittle behavior, they are not suitable for this type of application [29].
Similarly, metallic materials have sufficiently high rupture strengths associated with a density between 1500 and 7800 kg∙m−3, which together with the different problems presented by composite materials makes this group of materials suitable for LH2 storage. Due to the wide use of this group of materials, its behavior is predictable in the most varied applications [30].
According to the literature [29], aluminum alloy 2219 is considered the most suitable material for the inner wall of the container, since it has an excellent compromise between the different characteristics that are required. This material, at cryogenic temperatures, 20 K, has a density of 2825 kg∙m−3 and a rupture strength of 172 MPa [30].
The choice of the insulation material is of the highest importance for this storage system: it will determine the cooling needs of the system and the correlated energy costs.
The materials employed for hydrogen handling, including pipes, vessels, valves, and fittings, must be selected carefully to be compatible with the hydrogen’s characteristics.
The main considerations for materials used to handle liquid hydrogen include hydrogen embrittlement, permeability, and capability to withstand very low temperatures. This embrittlement weakens the material. However, as hydrogen solubility decreases with decreasing temperature, hydrogen embrittlement for liquid hydrogen is significantly lower than that for gaseous hydrogen.
There are two options regarding insulation: active or passive. Active systems are those that require an external energy source (for example, a system that uses a vacuum pump). Passive systems do not require any type of energy source [31].
One of the main problems regarding the insulation system is the infiltration of atmospheric gases, which at the temperature of liquid hydrogen will condense or even solidify. To solve this problem, an active insulation system can be used, making it necessary to maintain a pressure of about 0.133 kPa [30]. However, maintaining the vacuum level necessary to ensure that the thermal properties do not degrade is difficult. It is also necessary to consider the different coefficients of thermal expansion between the walls of the tank that could jeopardize the insulation properties [29].
To select the best thermal insulation, its conductivity is evaluated together with its density. The ideal would be a material with low conductivity and low density. However, it is necessary to consider that, as a rule, materials with low conductivity have a high coefficient of thermal expansion. Thus, materials that have a low coefficient of thermal expansion and low conductivity are desirable [29].
According to a study carried out by NASA [31], in which 15 possible insulation materials were selected, it was concluded that the best material, in terms of performance and safety, would be a rigid cell foam; an insulation system based on steel microspheres held in vacuum was also considered.
Equally effective are multilayer insulation systems, with the drawback of being extremely sensitive and dependent on the level of vacuum used [32].
As an example of a multilayer insulation system, a solution based on two sections of Rohacell® foam together with two vapor barriers is shown; see Figure 6 [30]. The vapor barrier is separated from the Rohacell® foam using a polyester film and two aluminum sheets [30].
Table 3 shows suitable insulating materials, as well as some respective important characteristics. Of the materials presented in this table, it is worth noting that the Airgel and Pearlite materials could hardly be equated due to their advisable temperature ranges (minimum temperature 73 K).

2.3. Summary of Characteristics of the Containers Studied

A summary of all dimensions concerning the cylindrical and spherical containers is presented in Table 4 and Table 5, respectively.
The material of the inner wall and of the supports will be aluminum of alloy 2219, Al 2219. For the external wall, since it is not in contact with hydrogen, there will be no problem of permeation and embrittlement; furthermore, since one function of the external wall is to avoid the crumbling of the insulation and the other function is to protect insulation from impacts, dust, and humidity, stainless steel 4301 Cr-Ni was selected. The characteristics of these metal alloys are shown in Table 6.
The material chosen as the insulating material was the MLI, see Table 7, which has a conductivity that depends on the number of layers used; in the current case, the conductivity k = 10−4 W∙m−1∙K−1.

3. Method for the Evaluation of Thermal Gain

The thermal resistance scheme considered to calculate the thermal gain is shown in Figure 7. The thermal gain was calculated through the quotient between the numerator as the temperature difference TLH2 (hydrogen temperature inside the tank) and Tamb (temperature of the environment outside the tank) and the denominator as the sum of the thermal resistances shown in Figure 7.
The supporting rods were neglected in thermal calculations since their joint cross-section area is very small when compared with the total area of heat transfer—it only represents 0.68% of the surface area of the tank. Moreover, the temperature gradients are greater in the direction perpendicular to the surface of the container than along the layers; thus, one-dimensional conduction perpendicular to the layers was considered.
Another important assumption was neglecting the thermal stratification within the tank: it was considered that both temperature and pressure are homogeneous inside the tank.
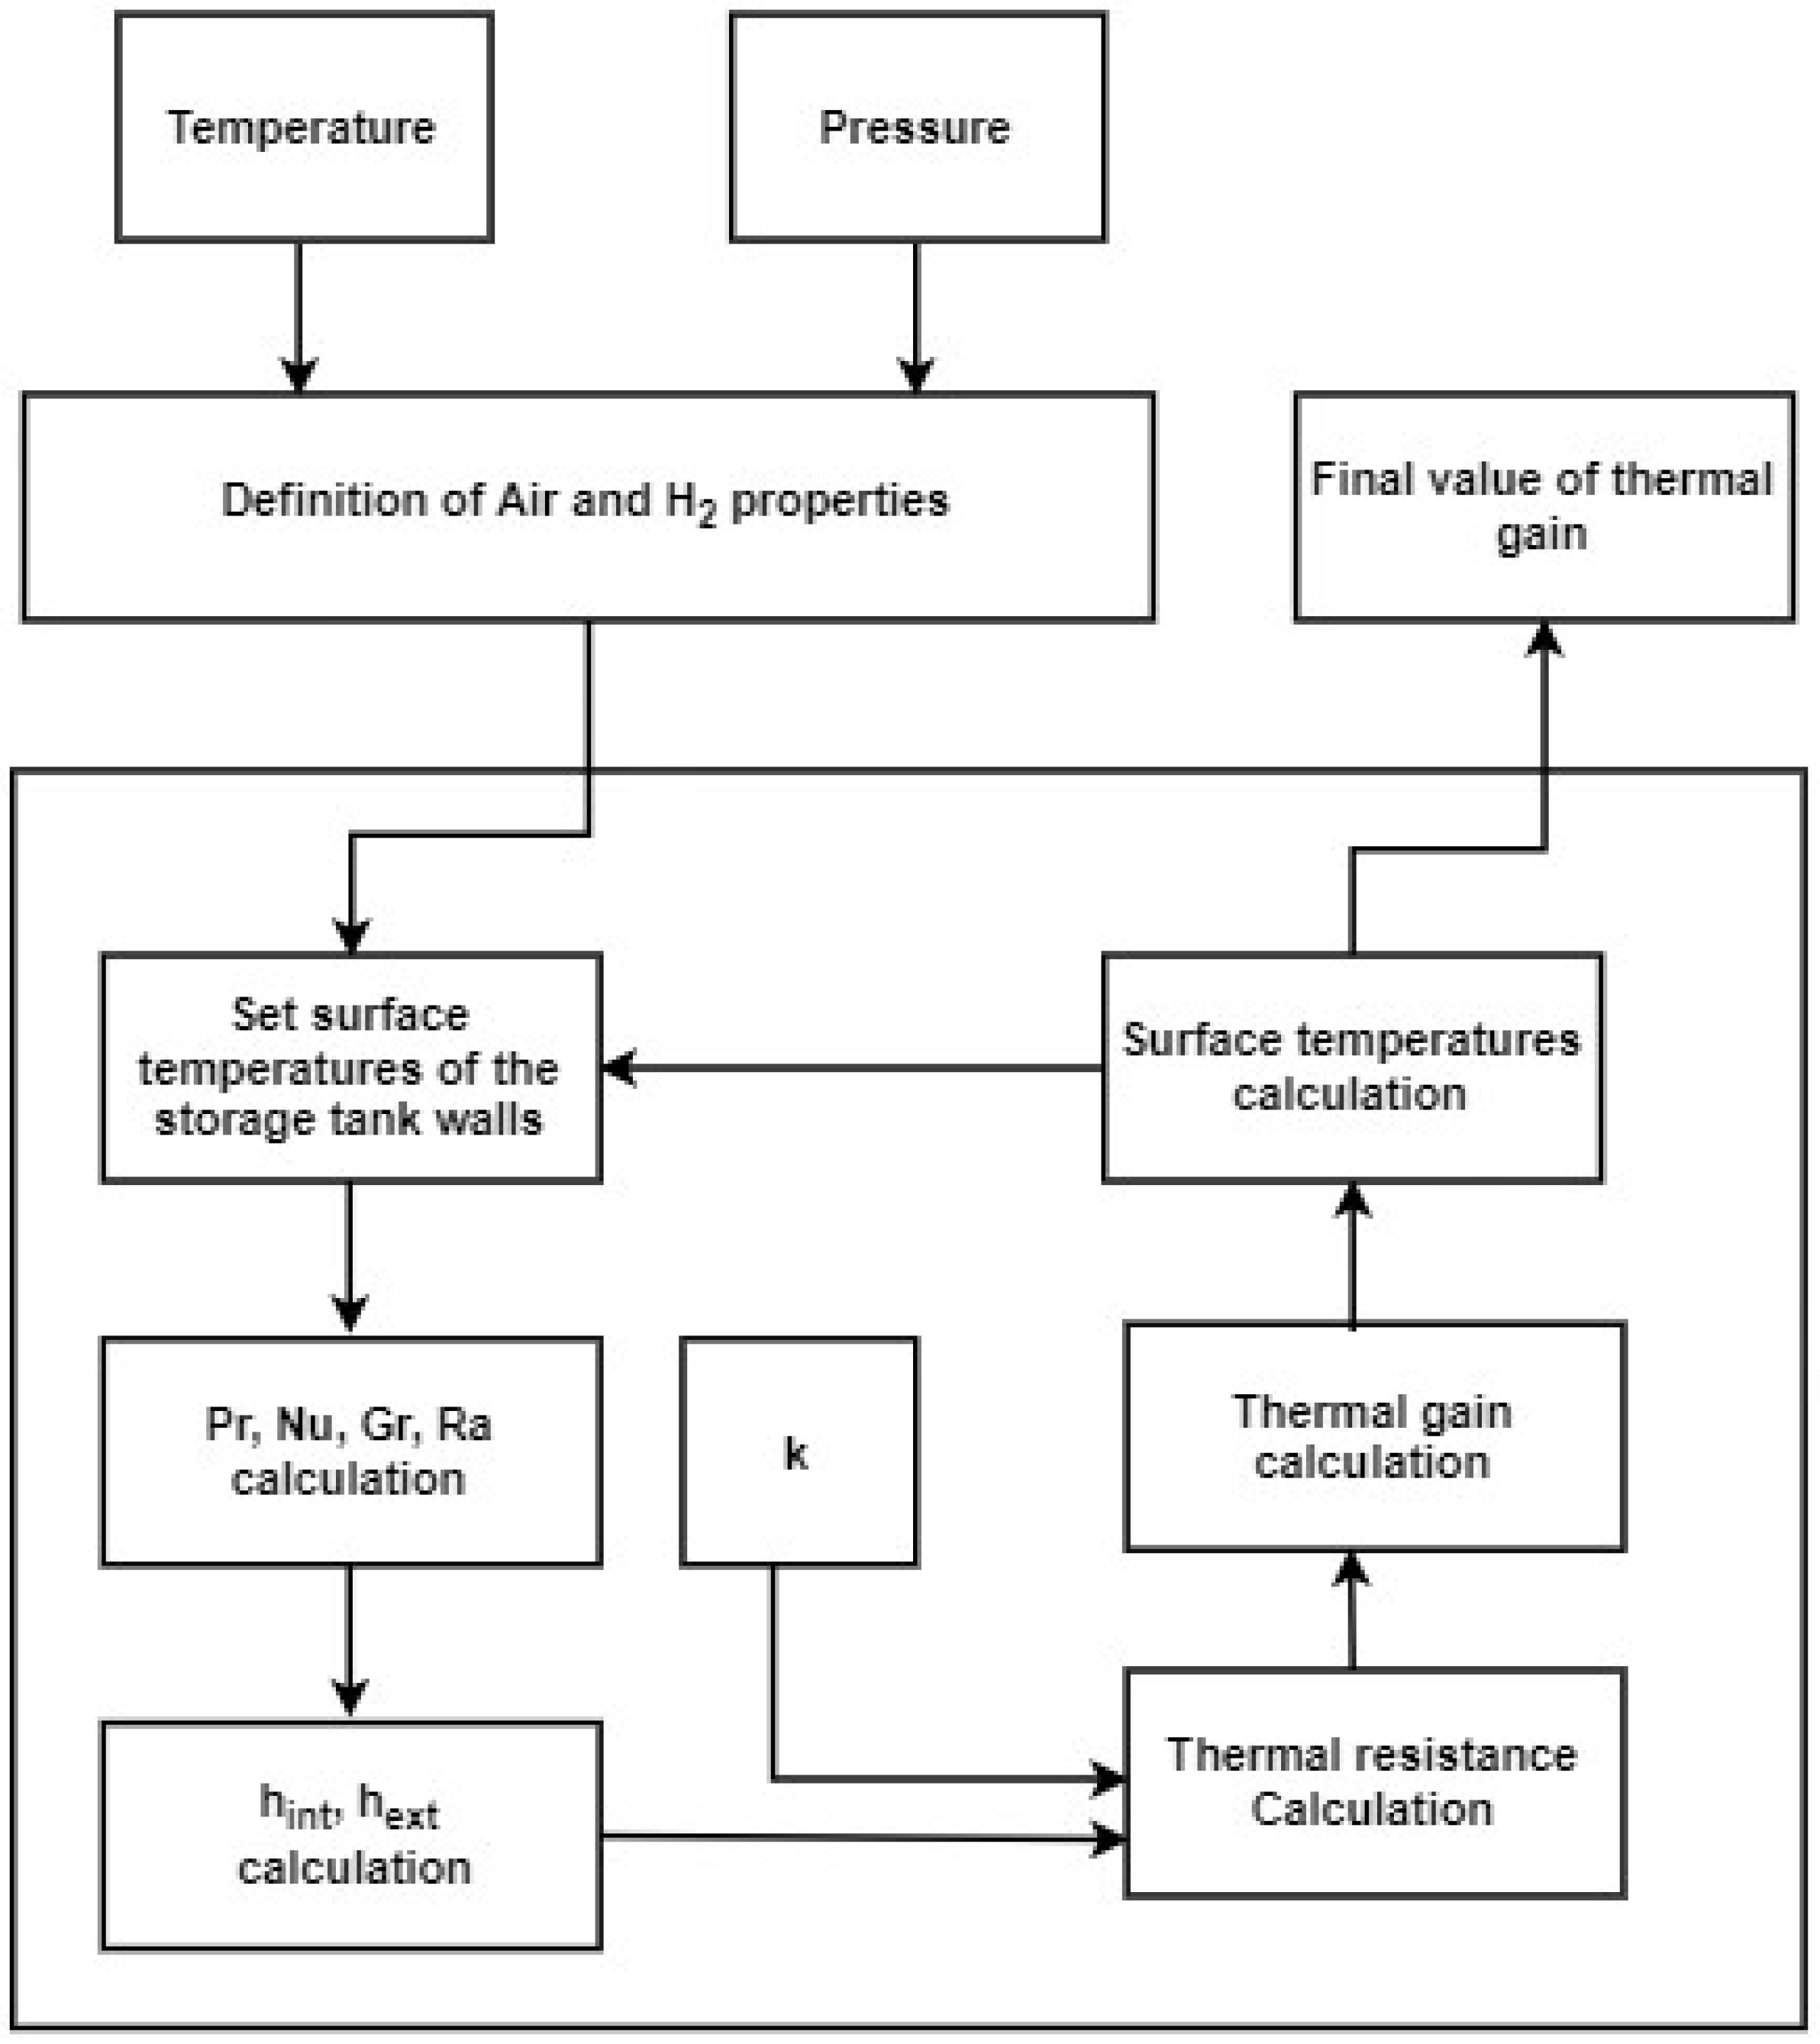
Taking these assumptions into account, it is then possible to start the calculation of the thermal gain according to the flow diagram in Figure 8. The temperature and pressure of the ambient air were taken, respectively, as 293.15 K and 1 bar; for the stored hydrogen, the temperature and pressure were taken, respectively, as 22 K and 3 bar.
The thermophysical properties of the ambient air were determined, namely the thermal diffusivity, α, through Equation (1); kinematic viscosity, ν, through Equation (2); and thermal expansion coefficient, β, through Equation (3) [33]; the thermal conductivity, k, was withdrawn from [34].
The thermophysical properties of hydrogen were also determined from tables, particularly the density, ρ; dynamic and kinematic viscosity, μ and ν; specific heat at constant pressure, cp; and thermal conductivity, k [34].
Initially, the temperatures of the interior face of the walls of the container were arbitrated; then, the inner Pr, Nu, Ra, and Gr were determined.
A cylindrical container, regardless of being disposed horizontally or vertically, has three inner convection coefficients, hint: two for the caps and another for the cylindrical wall.
To determine the last one, for the inner convection resistance, it was considered that the cylindrical wall approximates a plane wall, so Equation (4) was used to calculate the corresponding Nu [35]:
α = 3.119 × 10 6 + 3.541 × 10 8 × T a m b + 1.679 × 10 10 × T a m b     2 ,
ν = 2.079 × 10 6 + 2.77 × 10 8 × T a m b + 1.077 × 10 10 × T a m b 2 ,
β = 1 T a m b ,
N u D ¯ = C 1 R a × D / L 2 + C 2 R a × D / L 1 2 1 2     ,
Parameters C1 and C2 of Equation (4) have tabulated values, depending on the temperature and thermal flow conditions of the walls [35]. Parameters D and L refer to the diameter and height (vertical disposition) or length (horizontal disposition) of the container.
In the case of the dished head end caps, since their geometry is close to that of a sphere, the Nu for the inner convection was calculated with correlation (5), which was obtained through numerical analysis of finite differences performed by [36]; this correlation was also used to calculate the Nu of the spherical tank; this correlation should be used in the range 7.2 × 10⁶ < Ra < 4.1 × 10¹⁰:
N u D ¯ = 0.934 R a 0.177     ,
as for the outer heat transfer, hex, if the tank is set vertically and respects
D 35 L G r L 1 4     ,
then, the container can be approximated to a vertical plate, and the Nusselt for the cylindrical surface was calculated through Equation (7) [35]:
N u L ¯ = 0.825 + 0.387 R a L 1 / 6 1 + 0.492 / P r 9 / 16 8 / 27 2   .
But, if the tank was set horizontally, the Nusselt for the cylindrical surface was calculated using Equation (8) [35];
N u D ¯ = 0.60 + 0.387 R a D 1 / 6 1 + 0.559 / P r 9 / 16 8 / 27 2     ,
provided that RaD ≤ 1012.
With the aforementioned, the convection and conduction thermal resistances of Figure 7 were determined.
The thermal gain was obtained by an iterative process initiated with the setting of arbitrary surface (inner and outer) temperatures and ended when such arbitrate values reached a stabilized value.

4. Cooling System

4.1. Simplified Scheme

The energy consumption of a storage system for LH2 depends on the heat gain and the COP of the refrigeration cycle. Thus, it is necessary to ensure optimal operating conditions for the different equipment of the cooling system.
If the cooling system consists of a compression vapor cycle, compression ratios must guarantee the maximum efficiency of the compressor: the smaller the temperature ratio between the condensation and evaporation pressures, the more efficient the cycle will be. Accordingly, in the current case, a cascade refrigeration cycle with five sub-cycles was selected. In each of the sub-cycles, a particular refrigerant was used. Each of the five sub-cycles was characterized by multistage compression and expansion, i.e., it included two or more stages, as indicated in Table 8. The flowrate of refrigerant in each of the levels was different. A simplified scheme of the system with the five sub-cycles is shown in Figure 9.

4.2. Levels of Temperature and Refrigerants

There are two temperature levels defined at the outset: the evaporating temperature in Evaporator I and the condensing temperature in Condenser VI.
As for the temperature in Condenser VI, considering the ambient temperature, a condensing temperature of 308.15 K was assumed.
In the case of Evaporator I, an evaporation temperature of 18 K was assumed. The intermediate temperatures and pressure levels will depend on the selected refrigerants, together with the desired compression ratios.
When it comes to cascade compression cycles of refrigeration, the best examples are presented in the natural gas liquefaction industry; these systems are also applicable for the active cooling of hydrogen in the liquid state.
Currently, larger industries use systems with three or more sub-cycles. In the case of hydrogen liquefaction, the process is initially divided into three temperature ranges, in each of which the refrigerants to be used will be different. The sequence of temperature ranges is 300 to 220 K, 220 to 73 K, and 73 K down to storage temperature.
Between 300 and approximately 220 K, it is common to use three-stage compression refrigeration cycles, in which propane is used as a refrigerant. Propane, of course, can be replaced by several fluids suitable for this temperature range.
For the temperature range between 220 and 73 K, compression cycles are still suitable, provided, of course, the operating temperatures of the refrigerant are included in this range. As possible refrigerants, we have methane and nitrogen.
For the final temperature range, 73 to 22 K, the suitable refrigerants are fewer. There is a choice between neon, hydrogen, and helium, and their main properties have already been presented [37,38].
As can be seen in Table 8, there was a concern to maintain the compression ratios of all compressors at similar values. The refrigeration setting was assumed as indicated in Table 8.
For the present study, temperature levels and the selected refrigerants were as follows:
  • 308 K down to 263 K—tetrafluorotane (R-134a).
  • 263 K down to 183 K—ethane (R-170).
  • 183 K down to 115 K—methane (R-50).
  • 115 K a 75 K—nitrogen (R-728).
  • 75 K a 22 K—hydrogen (R-702p).

4.3. Refrigeration Cycle Characteristics

Two parameters are defined depending on the data obtained from the different sub-cycles that make up the cycle: the power of the compressors and evaporators. These parameters are obtained from the sum of the power of each component. From these values, it is possible to calculate the COP using Equation (9). For reasons of calculation simplification, a compression efficiency of 100% was considered; moreover, superheating at the evaporator outlet and subcooling at the condenser outlet were neglected.
C O P = Q e v a p W c o m p     ,
In addition to the COP, it will also be interesting to calculate the ratio between the power of the compressors and the evaporators. Thus, it is possible to check the effort on the cycle considering the necessary refrigeration effect. These parameters are presented in Table 9.

5. Results and Conclusions

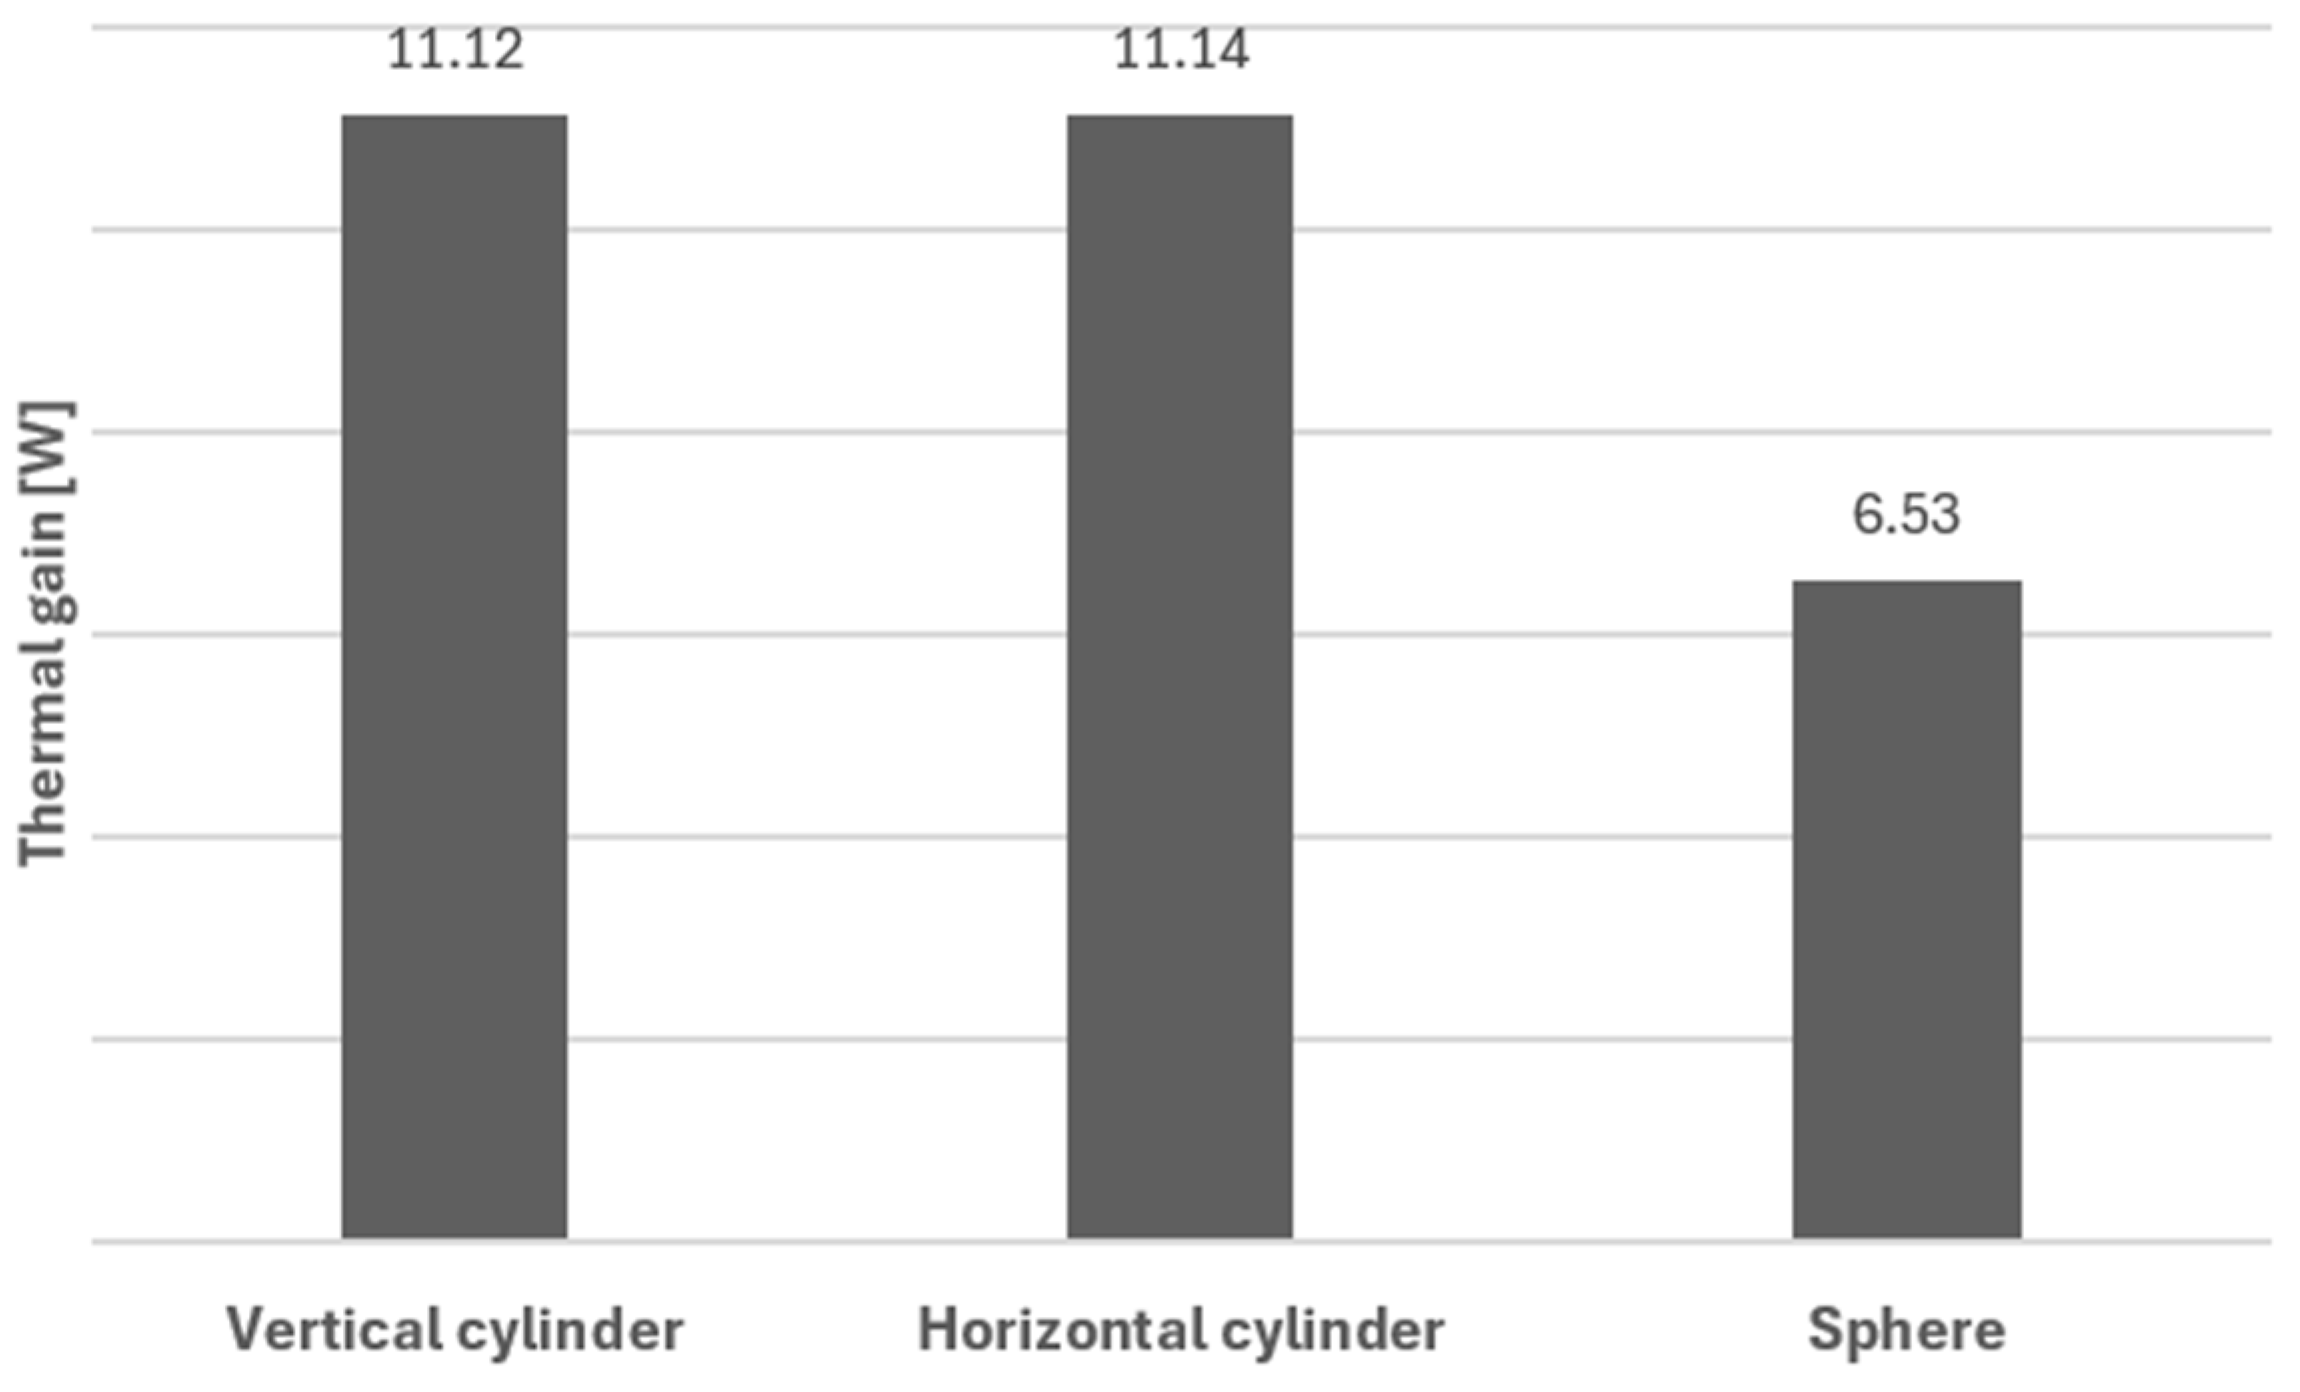
As expected, an important factor to take into consideration is the shape of the tank, as this influences heat transfer rates. A comparison of thermal gains was made between the three geometries under study: cylindrical tanks (either vertical or horizontal), with cupped bottoms, and spherical tanks. Thermal gains were calculated according to the method described in Section 3. The results of such calculations show that the spherical tank presents the lowest thermal gain value of 6.53 W; see Figure 10. This value is approximately 1.7 times lower when compared to that for a cylindrical tank arranged vertically or horizontally. This value is understandable since, for a given inner volume, the spherical surface area is the smallest, which lowers heat transfer.
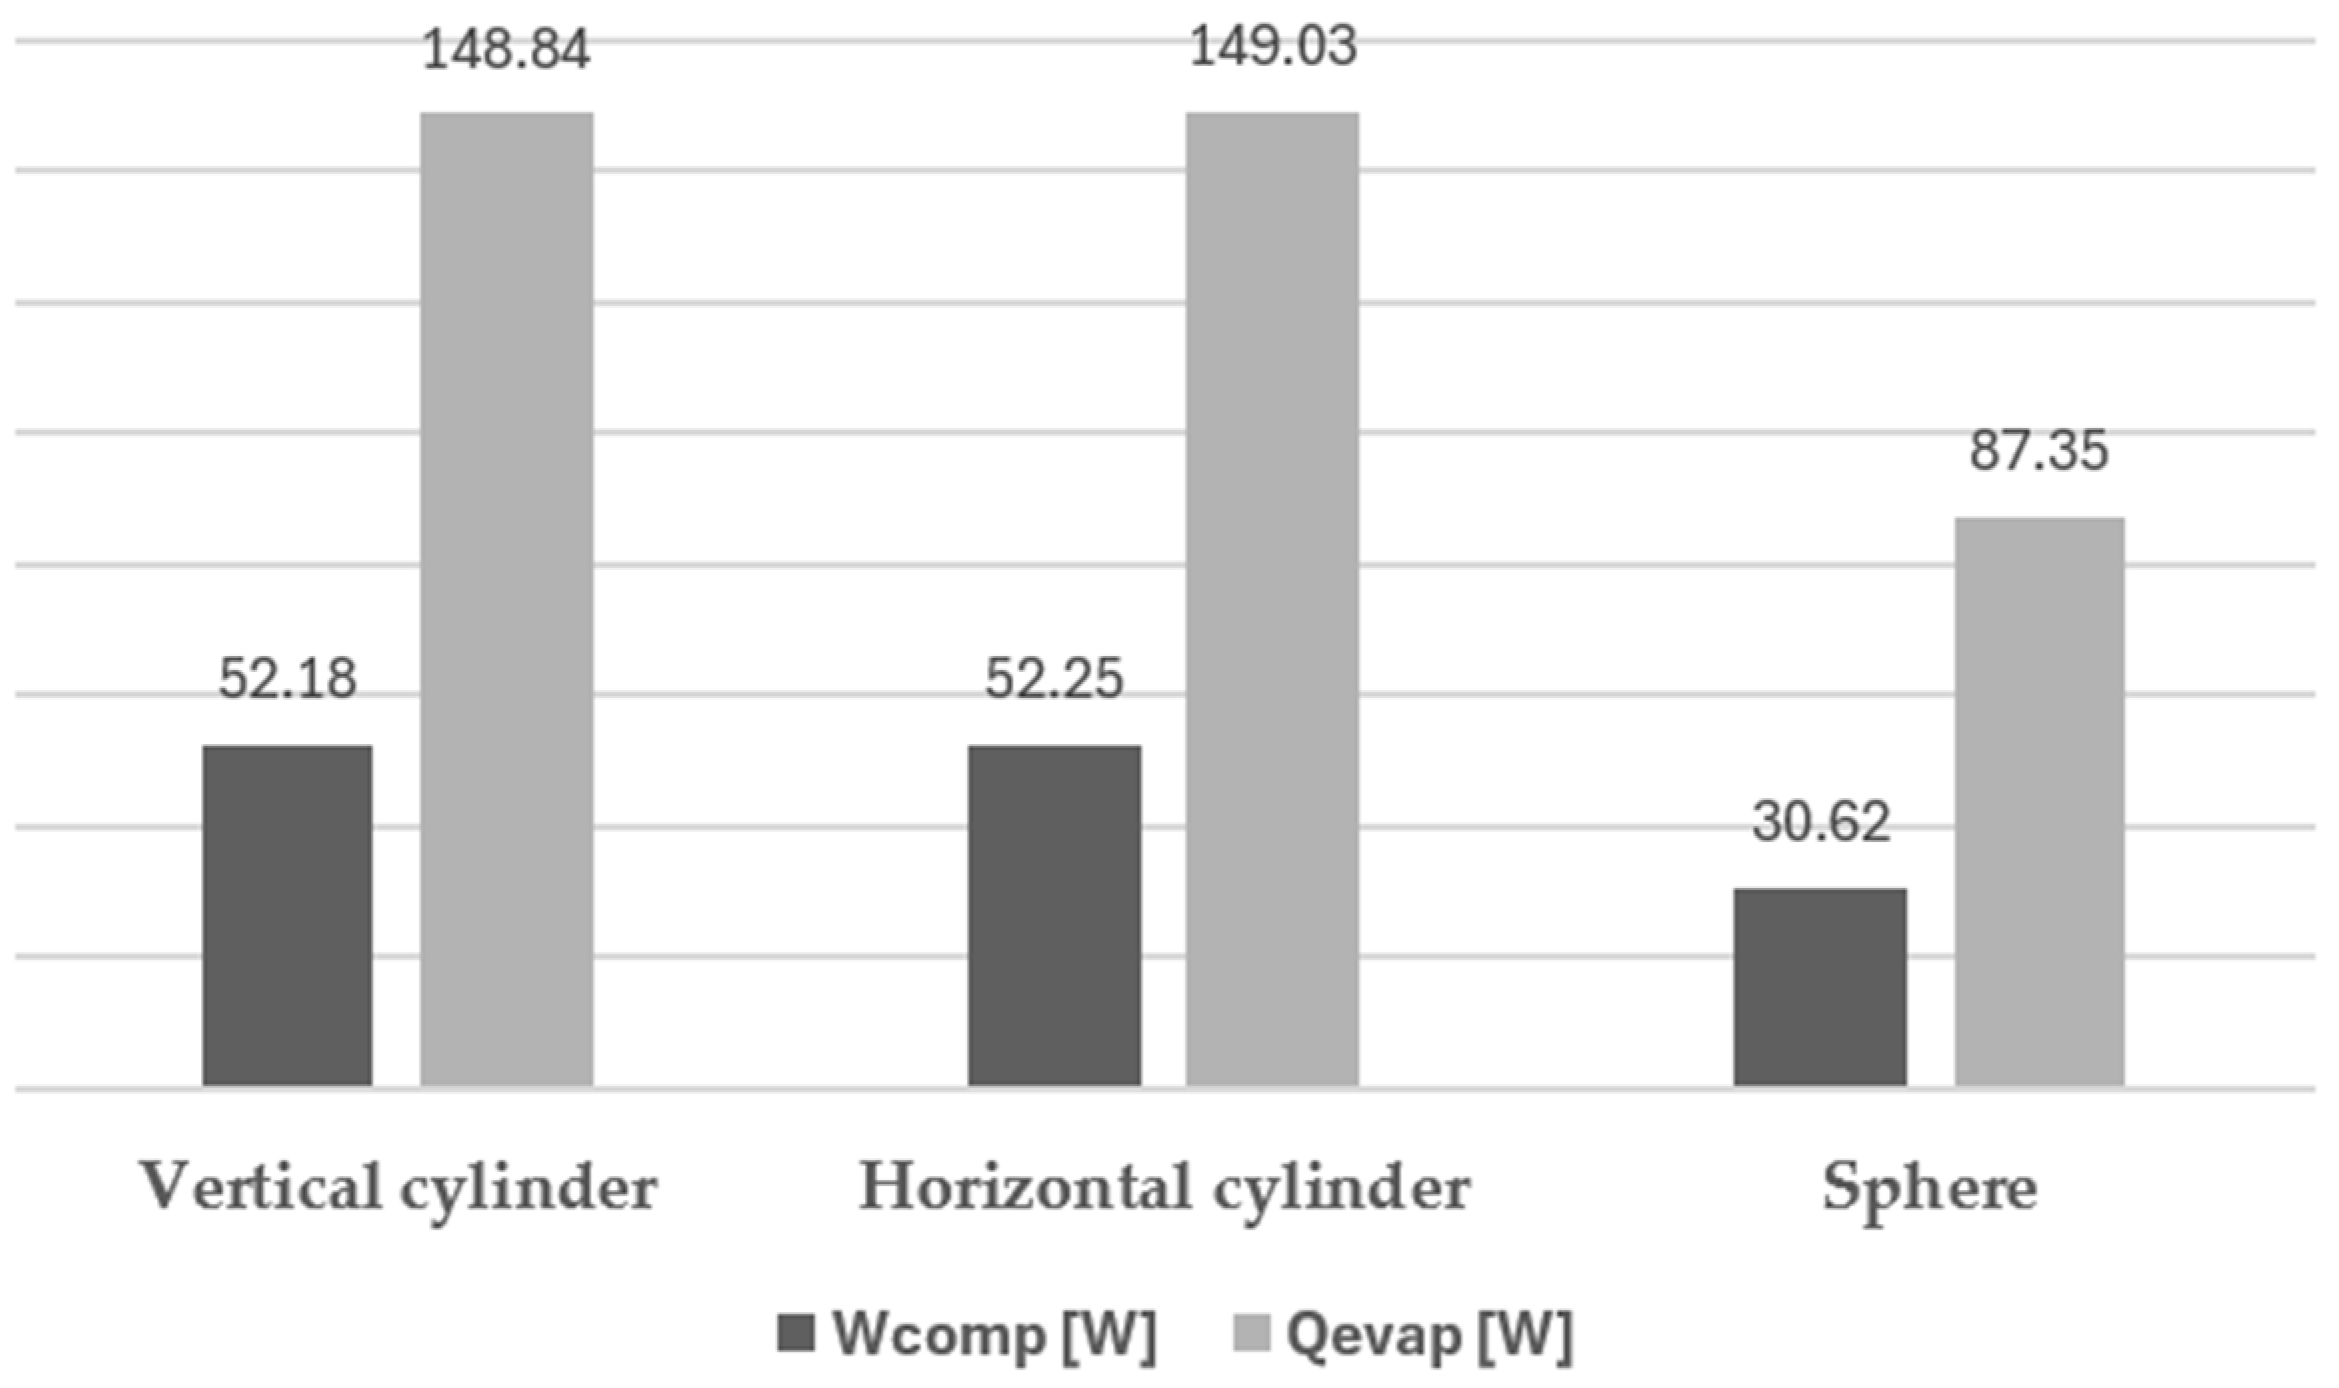
In Figure 11 are shown the total values of evaporation power and compression useful power for the same three situations.
In Table 10 are the values obtained for the energy initially stored and that corresponding to the mass of hydrogen evaporated within a week.
Through Table 10, it can be seen that the hydrogen losses reach values of 22% of the initial stored energy in the case of cylindrical geometry and 12.9% in the case of spherical geometry. Of course, the greater the thermal gains of the tank, the greater the hydrogen evaporation rate, which translates into greater hydrogen or energy loss.
Table 11 shows the principal calculations concerning the refrigeration process.
So, in short, unless reasons related to layout or space availability are at stake, spherical reservoirs should be preferred to cylindrical ones for LH2 storage. This statement does not consider reasons linked to the price or ease of construction of such reservoirs.
Evaluating the storage method considered, it is worth to highlight that the storage of LH2 has the advantage of occupying a much smaller volume when compared to other storage methods; another advantage is in terms of safety, as low pressures of up to around 3 bar are involved.
In this type of storage, the study of the material to be used is essential, since hydrogen can affect the materials it comes in contact with.
In order to have LH2, it is necessary to account for and control the thermal gains of the reservoir, since hydrogen is stored at 22 K, which implies heat transfer from the environment to the reservoir, thus reducing the available energy. The energy consumption to liquefy and maintain the hydrogen in the liquid state places high demands on tank insulation and the type of refrigeration system to be used.

Author Contributions

B.C.: investigation and writing—original draft preparation; L.R. and A.C.: conceptualization, supervision, and writing—review and editing; J.M.: supervision and writing—review and editing; G.F.P.: writing—review; A.B. formal analysis and main research. All authors have read and agreed to the published version of the manuscript.

Funding

This research received no external funding.

Data Availability Statement

The original contributions presented in this study are included in the article, further inquiries can be directed to the corresponding author.

Conflicts of Interest

The authors declare no conflicts of interest.

Nomenclature

COPCoefficient of performanceQevapEvaporator heat gain [W]
cpSpecific heat at constant pressure (J∙kg−1∙K−1)RaRayleigh number
DDiameter [m]RconvRconv Convective thermal resistance [K.W−1]
einner wallStorage tank inner wall thickness [m]rend capsEnd caps radius [m]
ELH2,storedHydrogen energy stored [J]RisoRiso Conduction thermal resistance [K.W−1]
eouter wallStorage tank outer wall thickness [m]rtankStorage tank radius [m]
Ew,evWeekly hydrogen energy loss [J]TTemperature [K]
GEDGravimetric energy density [J∙Kg−1]TambAmbient temperature [K]
GrGrashof numberTECCoefficients of thermal expansion [K−1]
HHVHigher heating value [J∙Kg−1]VEDVolumetric energy density [J∙m−3]
kThermal conductivity [W∙m−1∙K−1]VtankStorage tank radius [m3]
LLength [m]WcompCompressor work [W]
LtankTank length [m]αThermal diffusivity [m2∙s−1]
NuNusselt numberβThermal expansion coefficient [K−1]
PPressure [Pa]σcedYield stress [MPa]
PrPrandtl numberμDynamic viscosity [N∙s∙m−2]
QCTThermal gain [W]νKinematic viscosity [m2∙s−1]
QcondCondenser heat power [W]ρDensity [kg∙m−3]

References

  1. Goldemberg, J. The Promise of Clean Energy. Energy Policy 2006, 34, 2185–2190. [Google Scholar] [CrossRef]
  2. European Commission. 2030 Climate Targets. 2023. Available online: https://climate.ec.europa.eu/eu-action/climate-strategies-targets/2030-climate-targets_en (accessed on 13 March 2024).
  3. Shafiee, S.; Topal, E. When Will Fossil Fuel Reserves Be Diminished? Energy Policy 2009, 37, 181–189. [Google Scholar] [CrossRef]
  4. Radetzki, M. Fossil fuels will not run out. Miner. Energy—Raw Mater. Rep. 1996, 12, 26–30. [Google Scholar] [CrossRef]
  5. Mandal, T.; Gregory, D.H. Hydrogen: Future energy vector for sustainable development. Proc. Inst. Mech. Eng. Part C J. Mech. Eng. Sci. 2010, 203–210, 539. [Google Scholar] [CrossRef]
  6. Kovács, K.L.; Maróti, G.; Rákhely, G. A novel approach for biohydrogen production. Int. J. Hydrogen Energy 2006, 31, 1460–1468. [Google Scholar] [CrossRef]
  7. Kottenstette, R.; Cotrell, J. Hydrogen storage in wind turbine towers. Int. J. Hydrogen Energy 2004, 29, 1277–1288. [Google Scholar] [CrossRef]
  8. Balat, M.; Balat, M. Political, economic and environmental impacts of biomass-based hydrogen. Int. J. Hydrogen Energy 2009, 34, 3589–3603. [Google Scholar] [CrossRef]
  9. Balat, H.; Kırtay, E. Hydrogen from biomass–present scenario and future prospects. Int. J. Hydrogen Energy 2010, 35, 7416–7426. [Google Scholar] [CrossRef]
  10. Calise, F.; D’Accadia, M.D.; Santarelli, M.; Lanzini, A.; Ferrero, D. Solar Hydrogen Productions. Processes, Systems anda Technologies; Academic Press: San Diego, CA, USA, 2019. [Google Scholar]
  11. Larminie, J.; Dicks, A. Fuel Cell Systems Explained; Wiley: Hoboken, NJ, USA, 2003. [Google Scholar]
  12. Barbir, F.; Veziroğlu, T.N. Effective costs of the future energy systems. Int. J. Hydrogen Energy 1992, 17, 299–308. [Google Scholar] [CrossRef]
  13. Nicoletti, G.; Arcuri, N.; Nicoletti, G.; Bruno, R. A technical and environmental comparison between hydrogen and some fossil fuels. Energy Convers. Manag. 2015, 89, 205–213. [Google Scholar] [CrossRef]
  14. Fischer, M. Safety aspects of hydrogen combustion in hydrogen energy systems. Int. J. Hydrogen Energy 1986, 11, 593–601. [Google Scholar] [CrossRef]
  15. Hoagland, W. Safe Handling of Hydrogen. In Hydrogen Science and Engineering: Materials, Processes, Systems and Technology; Stolten, P., Emonts, B., Eds.; Wiley: Hoboken, NJ, USA, 2016; ISBN 9783527674268. [Google Scholar] [CrossRef]
  16. Mckinley, K.R.; Browne, S.H.; Richard Neill, D.; Seki, A.; Takahashi, P.K. Hydrogen Fuel from Renewable Resources. Energy Sources 1990, 12, 105–110. [Google Scholar] [CrossRef]
  17. Najjar, Y.S. Hydrogen safety: The road toward green technology. Int. J. Hydrogen Energy 2013, 38, 10716–10728. [Google Scholar] [CrossRef]
  18. Yartys, V.A.; Lototsky, M.V.; Veziroglu, S.V.; Yu, T.N.; Zaginaichenko, S.; Schur, D.V.; Shpak, A.P. Hydrogen Materials Science and Chemistry of Carbon Nanomaterials; Kluwer Academic Publishers: Dordrecht, The Netherlands, 2004. [Google Scholar]
  19. Zhang, Y.; Shi, J.; Han, G.; Li, M.; Ji, Q.; Ma, D.; Liu, Z. Chemical vapor deposition of monolayer WS2 nanosheets on Au foils toward direct application in hydrogen evolution. Nano Res. 2015, 8, 2881–2890. [Google Scholar] [CrossRef]
  20. Lim, K.L.; Kazemian, H.; Yaakob, Z.; Daud, W.R.W.; Cunningham, M. Solid-state Materials and Methods for Hydrogen Storage: A Critical Review. Chem. Eng. Technol. 2010, 33, 213–226. [Google Scholar] [CrossRef]
  21. Moseley, P.T.; Garche, J. (Eds.) Electrochemical Energy Storage for Renewable Sources and Grid Balancing; Elsevier: Amsterdam, The Netherlands, 2014. [Google Scholar]
  22. Andersson, J.; Grönkvist, S. Large-scale storage of hydrogen. Int. J. Hydrogen Energy 2019, 44, 11901–11919. [Google Scholar] [CrossRef]
  23. Züttel, A. Hydrogen storage methods. Naturwissenschaften 2004, 91, 157–172. [Google Scholar] [CrossRef]
  24. Lototsky, M.V.; Yartys, V.A.; Zavaliy, I.Y. Vanadium-based BCC alloys: Phase-structural characteristics and hydrogen sorption properties. J. Alloys Compd. 2005, 404, 421–426. [Google Scholar] [CrossRef]
  25. Valenti, G. 2—Hydrogen liquefaction and liquid hydrogen storage. In Compendium of Hydrogen Energy; Ram, B., Gupta, A., Basile, T., Nejat, V., Eds.; Woodhead Publishing Series in Energy; Woodhead Publishing: Cambridge, UK, 2016; pp. 27–51. ISBN 9781782423621. [Google Scholar] [CrossRef]
  26. Notardonato, W.U.; Swanger, A.M.; Fesmire, J.E.; Jumper, K.M.; Johnson, W.L.; Tomsik, T.M. Zero boil-off methods for large-scale liquid hydrogen tanks using integrated refrigeration and storage. In IOP Conference Series: Materials Science and Engineering; IOP Publishing: Philadelphia, PA, USA, 2017; Volume 278, p. 012012. [Google Scholar]
  27. Pinto, G.; Monteiro, J.; Baptista, A.; Ribeiro, L.; Leite, J. Study of the Permeation Flowrate of an Innovative Way to Store Hydrogen in Vehicles. Energies 2021, 14, 6299. [Google Scholar] [CrossRef]
  28. VMolkov, M.; Dadashzadeh, S.; Kashkarov, D.M. Performance of hydrogen storage tank with TPRD in an engulfing fire. Int. J. Hydrogen Energy 2021, 46, 36581–36597. [Google Scholar] [CrossRef]
  29. Mital, S.K.; Gyekenyesi, J.Z.; Arnold, S.M.; Sullivan, R.M.; Manderscheid, J.M.; Murthy, P.L. Review of Current State of the Art and Key Design Issues with Potential Solutions for Liquid Hydrogen Cryogenic Storage Tank Structures for Aircraft Applications. 2006. NASA/TM-2006-214346. Available online: https://ntrs.nasa.gov/citations/20060056194 (accessed on 13 March 2024).
  30. Winnefeld, C.; Kadyk, T.; Bensmann, B.; Krewer, U.; Hanke-Rauschenbach, R. Modelling and Designing Cryogenic Hydrogen Tanks for Future Aircraft Applications. Energies 2018, 11, 105. [Google Scholar] [CrossRef]
  31. Coutinho, B. Armazenamento de Hidrogénio no Estado Líquido. Master’s Thesis, ISEP, Polytechnic of Porto, Porto, Portugal, 2023. [Google Scholar]
  32. Baptista, A.; Pinho, C.; Pinto, G.; Ribeiro, L.; Monteiro, J.; Santos, T. Assessment of an Innovative Way to Store Hydrogen in Vehicles. Energies 2019, 12, 1762. [Google Scholar] [CrossRef]
  33. Alkhaledi, A.N.; Sampath, S.; Pilidis, P. A hydrogen fuelled LH2 tanker ship design. Ships Offshore Struct. 2022, 17, 1555–1564. [Google Scholar] [CrossRef]
  34. Haynes, W.M. (Ed.) CRC Handbook of Chemistry and Physics, 97th ed.; CRC Press: Boca Raton, FL, USA, 2016. [Google Scholar] [CrossRef]
  35. Bergman, T.L.; Lavine, A.S.; Incropera, F.P.; DeWitt, D.P. Introduction to Heat Transfer; John Wiley & Sons: Hoboken, NJ, USA, 2011. [Google Scholar]
  36. JHutchins, E. Marschall. Int. J. Heat MassTransfer 1989, 32, 2047e2053. [Google Scholar]
  37. Kanoǧlu, M. Exergy analysis of multistage cascade refrigeration cycle used for natural gas liquefaction. Int. J. Energy Res. 2002, 26, 763–774. [Google Scholar] [CrossRef]
  38. Stolzenburg, K.; Berstad, D.; Decker, L.; Elliott, A.; Haberstroh, C.; Hatto, C.; Walnum, H.T. Efficient liquefaction of hydrogen: Results of the IDEALHY project. In Proceedings of the XXth Energie—Symposium, Stralsund, Germany, 7–9 November 2013; pp. 7–9. [Google Scholar]
Figure 1. Scheme of the wall of a tank.
Energies 17 05557 g001
Figure 2. Comparison of VED and GED for different storage methods [27].
Energies 17 05557 g002
Figure 3. Tank considered in the current study. Legend: A—external wall in contact with ambient air; B—insulation; C—inner wall in contact with hydrogen; D—elements for structural integrity.
Energies 17 05557 g003
Figure 4. Container wall.
Energies 17 05557 g004
Figure 5. Dished head cap ends of Korbbogen.
Energies 17 05557 g005
Figure 6. Thermal insulation system based on foam Rohacell [31].
Energies 17 05557 g006
Figure 7. Scheme of thermal resistances.
Energies 17 05557 g007
Figure 8. Diagram with the flow of calculations for the thermal gain.
Energies 17 05557 g008
Figure 9. Simplified scheme of a refrigeration cycle [31].
Energies 17 05557 g009
Figure 10. Thermal gains for the different configurations.
Energies 17 05557 g010
Figure 11. Evaporation and compression (useful) power for different configurations.
Energies 17 05557 g011
Table 1. HHV of various fuels. Adapted from [12].
FuelHHV (J∙kg−1)HHV (J∙m−3)
Liquid state
Methanol22.318.10
Ethanol29.923.60
Fuel oil45.538.65
Gasoline for aviation46.535.30
Gasoline47.434.85
LH2141.910.10
Gaseous state
Natural gas500.04
GH2141.90.013
Table 2. Physical and chemical properties useful when considering safety for hydrogen, methane, propane, and gasoline. Adapted from [11,13].
PropertiesFuel
HydrogenMethanePropaneGasoline
Density, PTN (kg∙m−3)0.0840.652.014.40
Flammability range in air, PTN (% v/v)4.0–774.4–16.51.7–10.91.0–7.6
Ignition temperature (°C)560540487228–471
Minimum ignition energy in air (MJ)0.020.30.260.24
Diffusion coefficient in air (cm2∙s−1)0.610.160.120.05
Specific heat at constant pressure (J∙kg−1∙K−1)14.892.221.671.2
Table 3. Properties of insulation materials, [29,30].
Material/Systemk (W∙m−1∙K−1)Density (kg∙m−3)
Multilayer vacuum insulation (MLI)10−5–10−8-
Microspheres in vacuum10−6–10−7-
Rohacell® foam35 × 10−3–5 × 10−335.24
Airgel10−2–10−7100–500
Pearlite10−5–10−6128
Polyurethane foam10−2–10−432–64
Polyamide3.5 × 10−11430
Table 4. Dimension of the cylindrical tank.
Material/SystemDimensionUnit
rtank0.382m
Ltank1.913m
Vtank1m3
einner wall10mm
Insulation thickness10/20/30/40/50mm
eouter wall10mm
Number of supporting rods8
rend caps0.306m
Table 5. Dimensions of the spheric tank.
Material/SystemDimensionUnit
rtank0.620m
Vtank1m3
einner wall10mm
Insulation thickness10/20/30/40/50mm
eouter wall10mm
No. of supporting rods8
Table 6. Properties of studied materials adapted from [32].
Materialk [W∙m−1∙K−1]ρ [kg∙m−3]σced [MPa]
Al 22191712825172
4301 Cr-Ni157900270
Table 7. Properties of insulation materials [32].
Material/Systemk (W∙m−1∙K−1)ρ (kg∙m−3)
Multilayer vacuum insulation (MLI)10−5–10−8-
Microspheres in vacuum10−6–10−7-
Rohacell® foam35 × 10−3–5 × 10−335.24
Airgel10−2–10−7100–500
Pearlite10−5–10−6128
Polyurethane foam10−2–10−432–64
Polyamide3.5 × 10−11430
Table 8. Definition of sub-cycles and stages.
Sub-CycleStageLevel of EvaporationLevel of Condensation
T [K]P [MPa]T [K]P [MPa]
R-702p
(Hydrogen)
1st18.00.0525.70.36
R-728
(Nitrogen)
1st70.00.0479.00.12
2nd79.00.1290.00.36
R-50
(Methane)
1st110.00.09123.00.22
2nd123.00.22137.00.56
3rd137.00.56159.01.40
R-170
(Ethano)
1st178.00.07197.00.18
2nd197.00.18219.00.44
3rd219.00.44248.01.10
R-134a
(Tetrafluorotane)
1st264.00.21284.00.42
2nd284.00.42306.00.84
Table 9. Refrigeration cycle characteristics adapted from [31].
Parameters Units
Wcomp0.0175kW
Qevap0.123kW
Wcomp/Qevap0.142-
COP7.03-
Table 10. Comparison between the energy stored in tanks and lost through evaporation weekly.
ParameterVertical CylinderHorizontal CylinderSphere
Ew,ev [J]1.79 × 1091.79 × 1091.05 × 109
E LH2,stored [J]8.15 × 1098.15 × 1098.15 × 109
Table 11. Refrigeration cycle characteristics adapted from [31].
Sub-CycleStageLevel of EvaporationLevel of CondensationQevap/QCTQcondenser/QCT
T [K]P [MPa]T [K]P [MPa]--
R-702p
(Hydrogen)
1st18.00.0525.70.3611.79
R-728
(Nitrogen)
1st70.00.0479.00.121.792.07
2nd79.00.1290.00.362.072.34
R-50
(Methane)
1st110.00.09123.00.222.342.65
2nd123.00.22137.00.562.652.71
3rd137.00.56159.01.402.713.41
R-170
(Ethano)
1st178.00.07197.00.183.413.75
2nd197.00.18219.00.443.754.20
3rd219.00.44248.01.104.204.77
R-134a
(Tetrafluorotane)
1st264.00.21284.00.424.775.13
2nd284.00.42306.00.845.135.69
Disclaimer/Publisher’s Note: The statements, opinions and data contained in all publications are solely those of the individual author(s) and contributor(s) and not of MDPI and/or the editor(s). MDPI and/or the editor(s) disclaim responsibility for any injury to people or property resulting from any ideas, methods, instructions or products referred to in the content.