Article

Flow Separation Control and Aeroacoustic Effects of a Leading-Edge Slat over a Wind Turbine Blade

1
Energy Systems Technology Laboratory, LTSE, National Higher School of Technology and Engineering, Annaba 23005, Algeria
2
Mechanical of Materials and Industrial Maintenance Laboratory LR3MI, Mechanical Engineering Department, Badji Mokhtar University, Annaba 23000, Algeria
3
Mechanical Engineering Department, École de Technologie Supérieure, Université du Québec, 1100 rue Notre-Dame Ouest, Bureau A-1966, Montréal, QC H3C 1K3, Canada
*
Author to whom correspondence should be addressed.
Energies 2024, 17(22), 5597; https://doi.org/10.3390/en17225597
Submission received: 10 October 2024 / Revised: 31 October 2024 / Accepted: 4 November 2024 / Published: 9 November 2024

Abstract

:
To enable wind energy to surpass fossil fuels, the power-to-cost ratio of wind turbines must be competitive. Increasing installation capacities and wind turbine sizes indicates a strong trend toward clean energy. However, larger rotor diameters, reaching up to 170 m, introduce stability and aeroelasticity concerns and aerodynamic phenomena that cause noise disturbances. These issues hinder performance enhancement and social acceptance of wind turbines. A critical aerodynamic challenge is flow separation on the blade’s suction side, leading to a loss of lift and increased drag, ultimately stalling the blade and reducing turbine performance. Various active and passive flow control techniques have been studied to address these issues, with passive techniques offering the advantage of no external energy requirement. High-lift devices, such as leading-edge slats, are promising in improving aerodynamic performance by controlling flow separation. This study explores the geometric parameters of slats and their effects on wind turbine blades’ aerodynamic and acoustic performance. Using an adequate turbulence model at Re = 106 for angles of attack from 14° to 24°, 77 slat configurations were evaluated. Symmetric slats showed superior performance at high angles of attack, while slat chord length was inversely proportional to aerodynamic improvement. A hybrid method was employed to predict noise, revealing slat-induced modifications in eddy topology and increased low- and high-frequency noise. This study’s main contribution is correlating slat-induced aerodynamic improvements with their acoustic effects. The directivity reveals a 10–15 dB reduction induced by the slat at 1 kHz, while the slat induces higher noise at higher frequencies.

1. Introduction

For wind energy to outreach fossil fuels on a global and urbanized scale, the power-to-cost ratio related to using wind turbines has to be competitive. A rise in installation capacities and wind turbine size reflects the strong tendency towards clean energy [1]. Tripling the rotor diameter leads to nine times the power output, and the wind turbine rotor diameter reached 170 m compared to a 40 m diameter 25 years ago [2]. This leads to stability and aeroelasticity concerns alongside aerodynamic phenomena occurring over wind turbine blades that generate noise disturbances. These phenomena represent significant impediments to performance enhancement and optimal energy extraction from the wind and restrain the expansion and social acceptance of wind structures.
One of the significant concerns in wind turbine aerodynamics is the flow separation phenomenon. Fluid flow attachment around the blade profile induces high lift and low drag coefficients [3]. Flow separation occurs when fluid flow on the blade’s suction side decelerates. At the trailing edge, the pressure increases, and a positive pressure gradient occurs between the maximum velocity position and the trailing edge of the blade’s suction side. Viscosity effects reduce the fluid’s ability to move forward within the boundary layer against the rise in pressure. Finally, the fluid’s kinetic energy fails to overcome the adverse pressure gradient, which triggers separation from the blade’s surface. Due to an adverse pressure gradient, reverse flow occurs downstream of separation, and the boundary layer considerably thickens [4]. This negatively affects aerodynamic lift and drag and induces the detachment of flow streamlines over the wind turbine’s blade suction surface, leading to lift loss. At that point, the blade stalls, limiting the whole turbine performance and energy extraction ratio and generating turbulence noise. Extensive research has been conducted in this field to achieve (i) boundary layer control and stall delay, (ii) laminar/turbulent transition or delay, (iii) turbulence augmentation, and (iv) noise reduction [5].
Flow control techniques are classified as passive and active control techniques. Active control technology uses moving objects, fluidic actuators, or plasma actuators [6]. Smart active control is used as an open or closed loop and applies to all methods [7]. However, these methods are complex to implement in the engineering system, requiring external energy injection and generally inducing higher costs [8]. In comparison, passive control does not require energy spending and exploits blade geometry and aerodynamics to modify and add momentum to the boundary layer.
The principles on which passive control acts upon the blade’s boundary layer can be categorized as (a) flow manipulation and modification around the blade, (b) action on the viscous sublayer and skin friction reduction, and (c) boundary layer vorticity and kinetic energy enhancement [9].
High-lift devices such as leading-edge slats are one of the oldest control devices initially implemented on airplane wings. They are known as Handley Page slats, and due to their effectiveness, research, application, and improvement series have been followed up to explore and exploit the advantages of slats at the leading edge of wind turbine airfoils. Slat profiles generated by introducing slots in the 2D aerodynamic profile of airfoils were realized by [10]. Another approach was to use the main element profile as a slat [11]. The pursued goal of flow separation control is achieved by the kinetic energy transfer from the mean flow to the airfoil’s boundary layer and between the main body and the slat [11]. The results highlighted the importance of the geometric parameters of slats, i.e., relative position/gap, slat profile, and spacing in performance enhancement of the S809 profile and phase VI blade. The effective shift in separation point was recorded from 47% to 67% chord position, alongside a maximum lift coefficient rise from 1.17 to 1.79. Additionally, torque improves for the phase VI blade with a slat system at 15 m/s and 20 m/s wind speeds.
The results of [12,13] highlighted the importance of the slat’s position, gap, and inclination angle in achieving a linear increase in lift coefficient. The leading-edge slat eliminates the laminar separation bubble at 30% chord length. The slat global effect on the main element was summarized by [14] as a (i) reduction in pressure peak due to circulation around the slat, and (ii) the interaction of the highly energized slat boundary layer influences the adverse pressure gradient, which leads to separation alleviation. Ref. [15] proposed basic design rules for slats: 12% airfoil chord is the minimum limit for slat chord length, a forward extension greater than or equal to 60%, 3% airfoil chord is the approximate slot gap, and slat thickness should be equal to 2% airfoil chord. The circulation around the slat reduces the sharp increase in the flow velocity over the main airfoil body, thus regulating the flow separation and causing an improved pressure recovery [13]. However, the slat profile camber as a distinctive influential parameter for flow separation control has not been investigated in detail. In addition, the negative camber profile of slats is seldom tackled in the literature; thus, studying various slat profiles is one of the goals of this study.
Flow control device studies are usually limited to improving aerodynamic performance and alleviating the extent of the suction surface flow detachment. The acoustic influence of a proposed flow control method should be investigated as wind turbine acceptance and compatibility with international acoustic regulation standards are directly related to the noise produced by rotating blades. Airfoil aerodynamic self-noise is generated by the wind turbine blade’s interaction with the unsteady turbulent boundary layer [16]. This interaction leads to pressure fluctuations over the solid surface. The mechanisms of airfoil self-noise generation are identified as follows:
(a)
Turbulent boundary layer interaction with trailing edge, commonly known as trailing edge noise.
(b)
The flow separation at stalls induces detached eddies that impact the loading distribution over the blade surface, known as stall separation noise.
(c)
The high- and low-pressure difference in the blade’s pressure and suction side drives the flow field at the blade’s tip, creating a trailing tip vortex [17].
Slats noise generation has been computationally studied by [18,19,20,21], shedding light on various aeroacoustic inherent mechanisms; however, separation stall noise and identification of the slat aeroacoustic effect were not correlated.
Numerous researchers have assumed a dominating dipole character of rotating blade noise, especially at the trailing edge [22,23], while quadrupole noise is associated with flow turbulence [24]. Dipole sources are stronger than quadrupoles, and the latter are usually neglected in low-Mach-number studies. Although the latter premise was accepted, it was reinvestigated to assert the influence of quadrupole noise [25,26,27]. The blade tip region was found to be a more dominating noise source as frequencies grow while aggravated at stall in a tunnel noise measurement of a 12% S809 phase VI wind turbine [28]. The airfoil self-noise simultaneous generation mechanisms render their identification more ambiguous. The stall separation noise mechanism is less treated in the literature than trailing edge noise, and the complete underlying features of its production are lacking [29]. This motivates the purpose of this paper to relate the slat aerodynamics improvements and impact (separation control) to its acoustics influence.
Hybrid methods in computational aeroacoustics (CAAs) aim to achieve sound generation and the decoupled determination of sound transport due to aerodynamic and acoustic where backscattering is irrelevant [30]. Aerodynamic noise sources near field flow information are gathered using either Large Eddy Simulation (LES), where computational efforts are prohibitive, or Detached Eddy Simulation (DES) as viable alternatives for its efficiency versus cost outcome. The data are analytically exploited by sound transport tools based on acoustic analogies to predict far-field generated noise using Ffowcs Williams–Hawkings (FWH) equations [31]. Surface integration is performed over an arbitrary control surface, usually coincident with the blade surface in the solid formulation, which allows for the seizing of surface noise sources (monopoles and dipoles) [29,32]. A formulation by [33] uses a porous surface away from the blade, including the effect of all nonlinear noise sources. The permeable surface should encapsulate all turbulent structures and position them in an adequate grid resolution. Ref. [34] reported that the resolution and structure size of permeable surface elements that cross these same elements are essential for acoustic calculation precision. Ref. [35] noted that acoustic results deteriorate when a smaller radius permeable surface is used. Spurious values can emerge due to the turbulent eddies crossing the periphery of the permeable surface. Rectifications using an open surface have been proposed; however, they can violate the condition of turbulence encapsulation.
Hybrid methods based on FWH efficiency and maturity have driven their broad use in jet noise problems and, more recently, wind turbines [36]. However, the efficiency of such coupling methods still relies on the insightful judgment of specific turbulence modeling to accurately capture case-related turbulence. The necessity of reliably describing turbulence influences the radiated noise estimation. Thus, the choice of turbulence model is central, and LES is usually presented as well suited for capturing large-scale fluctuations responsible for aerodynamic noise [30]. However, DES uses near-wall (Reynolds Averaged Navier–Stokes) RANS and LES in detached eddies areas. It is judged as a meritorious alternative due to its flexibility and affordability while proving to be as reliable as full-scale LES.
Meanwhile, superior to RANS, as reported by [37], k-ω SST weakness compared to DES was revealed for a flow around a cube in a 2D channel. The RANS model failed to capture flow recovery downstream of the cube. The transition from modeled RANS and resolved LES generates problematic behaviors known as a gray area and log layer mismatch (LLM) [38]. The latter motivated numerous improvements by [39,40,41], with [42] finally formulating the Improved Detached Delayed Eddy simulation (IDDES) to answer previous technical ambiguities related to the blending functions and ensure a smooth transition between the RANS/LES junction. The (IDDES-FWH) approach is considered a compromise that allows for highlighting the problem physics to avoid the high computational costs of the entire domain LES.
Grid resolution requirements must be met to ensure resolution by the grid density of the smallest length scale in regions where LES is meant to be activated within IDDES. Ref. [43] estimated that the mesh should be able to resolve 80% of the turbulent kinetic energy, a statement largely adopted in the literature. However, it was criticized by [44], who opted for using a two-point correlation. The ratio of modeled to resolved Reynolds stresses is commonly used for grid evaluation, although it is considered simplistic. Ref. [45] validated grid resolution by using the filter-width-to-turbulent-length-scale ratio from prior RANS results before LES. Another widely accepted verification criterion is the LES_IQ (Index of Resolution Quality) by [46].
This study aims to identify the acoustic influence of an optimal performance slat configuration over a S809 blade profile. An exhaustive parametric study is conducted using the RANS model, and the optimal slat profile is then acoustically investigated via a hybrid method (IDDES-FWH).
This paper is organized as follows: Section 2 details the numerical flow and acoustic methodologies for both two-dimensional and three-dimensional studies. Section 3 presents the simulation results of the parametric slat study, followed by the three-dimensional aerodynamic and acoustic results. Finally, the conclusions are summarized in Section 4.

2. Methodology

2.1. Problem Definition

The NREL S809 wind turbine airfoil profile is equipped with a surface passive flow control device. The aerodynamic control method for flow separation and aerodynamic performance improvement using various slat profiles is thoroughly investigated. The geometric parameters affecting correlations must be considered in such a parametric study. Any variation in a given geometric factor implies other factors’ alteration and thus influences the approach’s soundness. Slat profile (camber), chord length, inclination angle, and position relative to the airfoil leading edge are studied. These parameters are estimated in chord percentage. A chord-based Reynolds number 106 is calculated for the airfoil chord C = 0.5 m. This study primarily focuses on the influence of various camber slat profiles (including negative camber) by introducing five different slats summarized in Table 1. Figure 1 shows the main aerodynamic profiles used as slats, namely E297, E49, Goe440, Goe531, and E49(-). The negative camber profile E49(-) was obtained from the E49 by 180° rotation around the slat half-chord axis.
The precise choice of the studied slats for this study was motivated by exploring a range of camber values (−6% to 14.7%). The investigation of 77 slat cases to determine optimum parameters is carried out in this study for optimal aerodynamic setup of the slat at angles of attack AoAs ranging from 14° to 24°. Finally, the aeroacoustic contribution of the three-dimensional optimal configuration compared to the baseline configuration is undertaken by data extraction of unsteady acoustic pressure. To this end, the tip section of an S809 phase VI 12% wind turbine scale model was used for an aeroacoustic study. The (KARI) Korean Aerospace Research Institute wind tunnel experiment conditions are taken as a reference [28]. The full-scale wind turbine model details are given in [47].

2.2. Turbulence Model

2.2.1. Steady-State Study Model

RANS and k-ω SST simulation are chosen for parametric determination of the slat optimal configuration compared to the baseline configuration without slat. Lift, drag, and lift-over-drag ratio values are utilized for aerodynamic performance appraisal. The flow velocity streamlines and pressure contours are exploited for flow separation control visualization. The k-ω SST model developed by [48] incorporated a blending function to combine the k-ω and k-ε models’ advantages near the wall region and in the free shear layer, respectively. This model was chosen due to the physical nature of turbulent flow compatibility and considering the high importance of accurately predicting flow separation regions under adverse pressure gradients in the study of flow control devices. This model has been used by numerous researchers in fluid flow and boundary layer control numerical studies and has proved to be an efficient tool for predictive solutions involving boundary layer detachment [49,50,51,52]. The steady-state parametric study uses this model due to affordability considerations for the elevated number of tested configurations and simulation runs. A pressure-based approach is assumed for the full panel of the present simulations.

2.2.2. Model Validation

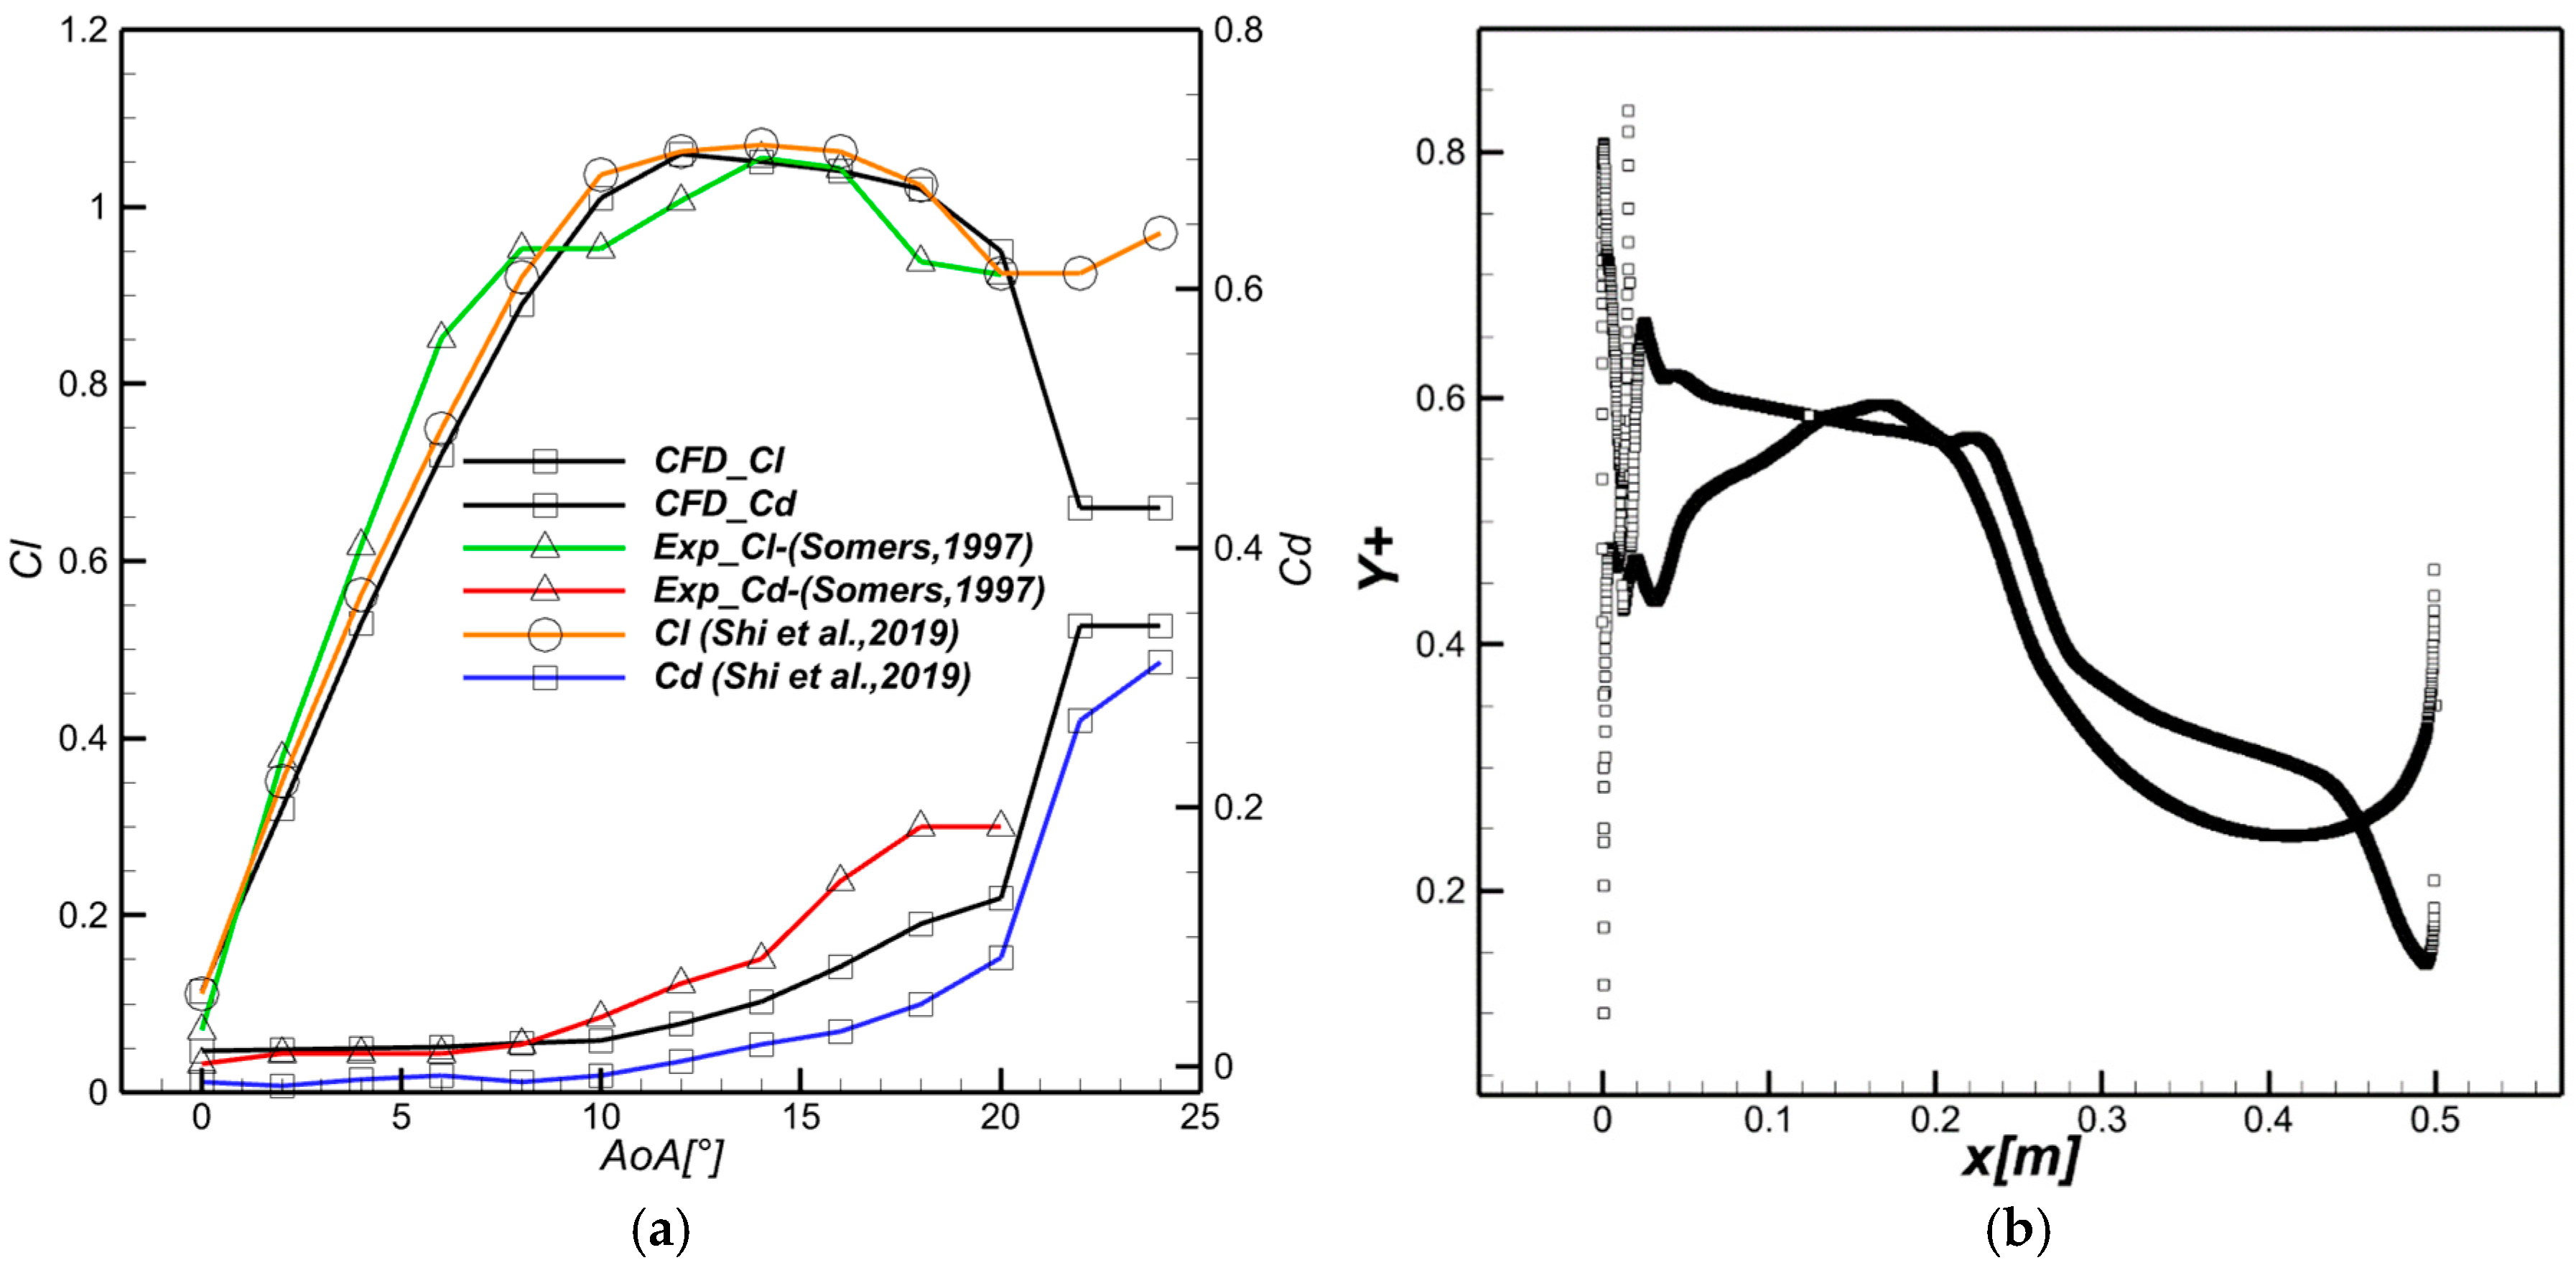
A computational data comparison for model validation using Ansys Fluent 16.0 software was performed according to experimental campaign results realized by [53] for Reynolds Re = 106. Lift and drag coefficients obtained from wind tunnel experiments as baseline airfoil are compared with simulation results for AoAs ranging from 0° to 22°. Figure 2a shows agreement with experimental data for most AoAs, and discrepancies are negligible with the simulation results. The highest lift coefficient discrepancy between the experimental and numerical results for AoAs ≥ 12° is 8.74%. Discrepancies in drag coefficient between numerical and experimental values for 16° ≤ AoAs ≤ 20° are noticeable, which highly influence the adopted baseline glide ratio values. This study’s baseline lift and drag coefficient curve have a compatible trend with the results from [50].

2.2.3. IDDES for Aeroacoustics

DES turbulence modeling capabilities rely on a combination of RANS and LES features distinctively activated at specific flow regions. Unsteady-RANS (URANS) is applied to the near-wall region, which is one of the main differences from the whole domain LES. The DES model stems from blending URANS-LES by differentiating between turbulent length scales using blending functions. It is supported by the premise of a turbulent energy cascade defined by a characteristic turbulent length scale of LRANS and LLES. The distance to the wall dw dictates the destruction of turbulent viscosity close to the wall in the Spalart–Allmaras (S-A) original formulation [54]. In the k-ω SST case, the identification of the ratio of energy contained in eddies divided by the amount of turbulent dissipation under turbulent viscosity is the main criterion, and the turbulent length scale is formulated as LK-ω SST = k/β* ε. In comparison, the LES length scale relies on a more grid-dependent formulation by setting the filter length Δ = max(hx; hy; hz), with hx, hy, and hz being the streamwise, wall normal, and spanwise cell sizes, respectively.
LDES = min (LRANS, LLES)LLES = CDESΔ
CDES is a calibrated constant dependent on the model and discretization method; CDES,k-ω = 0.78 and CDES,k-ε = 0.61 are used in this study [55].
In DES, the treatment of the transitional zone between wall-bounded boundary layer-attached flows modeled by RANS and separated or highly separated large eddy structures in the LES zone is ambiguous. Log layer mismatch (LLM) [41], grid-induced separation, and gray zone area for DES97 [56] are the main highlighted issues for this model. The first improvement in DES by [39] aimed to avoid spurious and grid-induced detachment of the flow due to cell size being inferior to boundary layer size, resulting in the activation of LES in regions of inadequate resolution near the wall [57]. The gray area represents an intermediate zone of RANS-modeled boundary layer convected eddy viscosity, which is at an essential unmatched scale that retards the development of LES [58]. The backward-facing step is a perfect illustrative case [38]. Consequently, the DDES-modified length scale is formulated as follows:
LDDES = LRANSfd max {0, (LRANSLLES)},
where fd is a hyperbolic blending function responsible for delaying LES activation as follows:
fd = 1 − tanh[(8rd)3], based on S-A modified parameter
r d = v ~ + ν U i , j U i , j κ 2 d 2
v   ~ and   ν   are the eddy and molecular viscosities, respectively, and κ is the Von Karman constant. Inside the log law region, rd reaches a peak value of 1 while tending to 0 in the free shear layer (moving further from the wall) [59]. fd then enables the transition to LES and rapidly reduces the extent of the problematic junction area. Nonetheless, the modeled log layer and the resolved log layer disparity persisted in DDES, and a solution was proposed by [41,42] as IDDES. Their modification of filter length formulation Δ accounts for the following factors: distance to the wall, grid isotropy in the LES region, and independency of the wall normal step in the very near vicinity of the wall. Additionally, Δ was assumed to be a linear function varying between two grid step extremes: hmin ≤ Δ ≤ hmax.
Considering the conditions above, it yields the following:
Δ = min{max[Cwdw, Cwhmax, hwn], hmax}
where hmax is the maximum grid spacing, hwn is the grid spacing in the wall’s normal direction, and Cw = 0.15 is an empirical constant. The primary objective relies on influencing the eddy viscosity to allow for a steep variation, which translates as a quick shift between RANS and LES compared to DES or DDES use of Δ = max (hx; hy; hz) [60].
L I D D E S = f ˜ ( 1 + f e ) L RANS + ( 1 f ˜ ) L L E S
f ˜ = max 1 f d ,   f B ,   f B = m i n 2 e x p 9 α 2 ,   1 ,   f e = m a x f e 1 1 ,   0 Ψ f e 2
fB is a blending function dependent on the dw/hmax ratio; fe is an empirical function named the elevating function or “boosting function” [60]. fe1 and fe2 are inherent grid- and solution-dependent functions of fe. They ensure RANS protection to mitigate LLM, and Ψ is an empirical function [42].
All the aforementioned efforts attempt to ensure the smoothest possible functioning of the hybrid model. IDDES tools for aeroacoustic predictions rely on their robustness in accurately resolving turbulence in detached zones with optimal performance at the RANS/LES junction. The turbulence prediction and separation noise are interrelated in the detached zones. Simultaneously, the efficient prediction of aerodynamic sound emanating from detached turbulent structures depends on the validity of the selected turbulence model. IDDES is used to predict three-dimensional boundary layer separation/trailing edge broadband noise as it is highly correlated to a harmonized RANS/LES junction. It alleviates the mesh refinement burden by activating LES in regions of interest. Thus, it was preferred in comparison to full-domain LES in this study due to cost considerations, while URANS’s accuracy is unsatisfactory. The unsteady data are injected into analytical equations to estimate the acoustic radiation to solve the (FWH) equation.

2.3. Ffowcs Williams and Hawkings Equation

The assumptions about the origin of aerodynamic-generated noise were formulated using the acoustic wave equation [24]. The inherent flow instabilities near a sound source surface in a bounded quiescent medium were considered the cause of the sound emission. No reflection, absorption, diffraction, or scattering of sound by solid surfaces are assumed. The aerodynamic features responsible for sound emission are embodied by the stress tensor Tij in Lighthill’s acoustic analogy equation:
1 c 0 2 2 p t 2 2 p = 2 T i j x i x j
The right-hand side of this equation describes the wave operator applied to pressure perturbation p  = c02 (ρ − ρ0), and Tij = ρuiuj + Pij − c02(ρ − ρ0ij, where ρuiuj are convection forces represented by the Reynolds stresses, Pij is the viscous stress tensor, and c0 is the speed of sound and represents the speed at which disturbance travel in the flow. The (FW-H) equation [31] accounted for the acoustic influence of moving solid-surface bodies to include sources of sound and is derived by manipulating the continuity and momentum equation into an inhomogeneous wave equation [61]. In the acoustic medium, the identification of the blade’s solid surface (non-penetrating condition) and its motion uses a function defined by f (x,t) = 0 at the surface, f < 0 inside the surface, and f > 0 outside. The blade surface is equivalent to the acoustic source surface (wall boundary condition). The differential FW-H equation valid both inside and outside of f is obtained using a generalized Heaviside function: H(f) = 1 0 if f > 0 f < 0 , and Dirac’s delta function defined by H ( f ) f = δ ( f ) =   f   if f = 0 f 0 to yield
1 c 0 2 2 p t 2 2 p = t ρ 0 v n δ f x i l i δ f + 2 x i x j T i j H f
This equation describes the propagation of sound by three discernable sources:
(1) The first term on the right represents a monopole source and is defined as a mass flow rate time derivative;   v n   is the surface velocity in the outward direction.
(2) The second term contains the local force vector l i = p i j ni and represents the sound source produced by viscous stresses and aerodynamic pressure exerted by the surface on the fluid [62], and ni is the outward surface normal unit vector. It is characterized as a dipole source term due to the surface-over-fluid effect.
(3) The last term contains H f , which is valid outside f. Therefore, it represents a volume source or quadrupoles and is mainly due to turbulence.
The integration of surface and volume sources in the above equation is carried out utilizing Green’s function
G ( x , t   ;   y , τ ) = 0 δ ( g ) / 4 π r       if   τ > t τ t ,       g = τ t + r / c 0 ,   r = | x y |
The resolution of the classical formulation of the FWH equation allows for the estimation of emitted source sound (coordinate y at time τ ) perceived by a receiver at coordinate x at time t. At a low Mach number, the contribution of the volume source (Lighthill’s tensor) is considered negligible compared to the terms of both surfaces [63]. Thus, the acoustic pressure has two components: p = p T ( x , t ) + p L ( x , t ) , where p T and p L are the thickness and loading noise, respectively.
4 π p T ( x , t ) = f = 0 ρ 0 v ˙ n + v n ˙ r 1 M r 2 r e t d S + f = 0 ρ 0 v n r M i r i + c 0 M r c 0 M 2 r 2 1 M r 3 r e t d S 4 π p L ( x , t ) = 1 c 0 f = 0 l ˙ i r i r 1 M r 2 r e t d S + f = 0 l r l i M i r 2 1 M r 2 r e t d S + 1 c 0 f = 0 l r r M i r i + c 0 M r c 0 M 2 r 2 1 M r 3 r e t d S
This study aims to study separation-induced turbulence noise influenced by slat presence. Thus, the formulated assumption to neglect volume sources becomes unsatisfactory as quadrupole noise sources originating from pressure fluctuations effects induced by flow separation increase under growing incidence angles [26]. Consequently, a modified formulation of the classical FWH equation named permeable FWH (FWHp) is used [33]. The non-penetrating condition is canceled, and the integration is performed over a porous surface inside the flow domain where all the acoustic sources (including the previously neglected volume sources in the classical formulation) of interest are embedded. Eventually, this allows for the avoidance of computational ambiguities and the cost of volume integrals. The FWHp equation is similar to the classical formulation:
1 c 0 2 2 p t 2 2 p = t ρ 0 v n + ρ u i v n δ f x i { l i + ρ u i u n v n δ f } + 2 x i x j T i j H f
1 c 0 2 2 p t 2 2 p = t ρ 0 U n δ f x i [ L i j n j δ f ] + 2 x i x j T i j H f
The modified velocity and stress tensor components are introduced as [33]: U i = ρ 0 v i + ρ u i v i and L i j = p i j n j + ρ u i u j v j , where u i is the fluid velocity perpendicular to the control surface. The modified terms account for the net flow between fluid and surface velocity across the porous surface. The solution for the permeable formulation is obtained using a procedure similar to the classical approach with Green’s function.
4 π p T ( x , t ) = f = 0 ρ 0 U ˙ n + U n ˙ r 1 M r 2 r e t d S + f = 0 ρ 0 U n r M i r i + c 0 M r c 0 M 2 r 2 1 M r 3 r e t d S 4 π p L ( x , t ) = + 1 c 0 f = 0 L ˙ r r 1 M r 2 r e t d S + f = 0 L r L i M i r 2 1 M r 2 r e t d S + 1 c 0 f = 0 L r r M i r i + c 0 M r c 0 M 2 r 2 1 M r 3 r e t d S
The integrals over the porous surface for thickness and loading terms are assumed to include the volume sources. This study utilizes both the permeable and classic approaches. The FWH equation is best exploited when surface over-fluid forces are known through calculation or measurements [62].

2.4. Computational Grid and Boundary Conditions

2.4.1. Steady Two-Dimensional Study

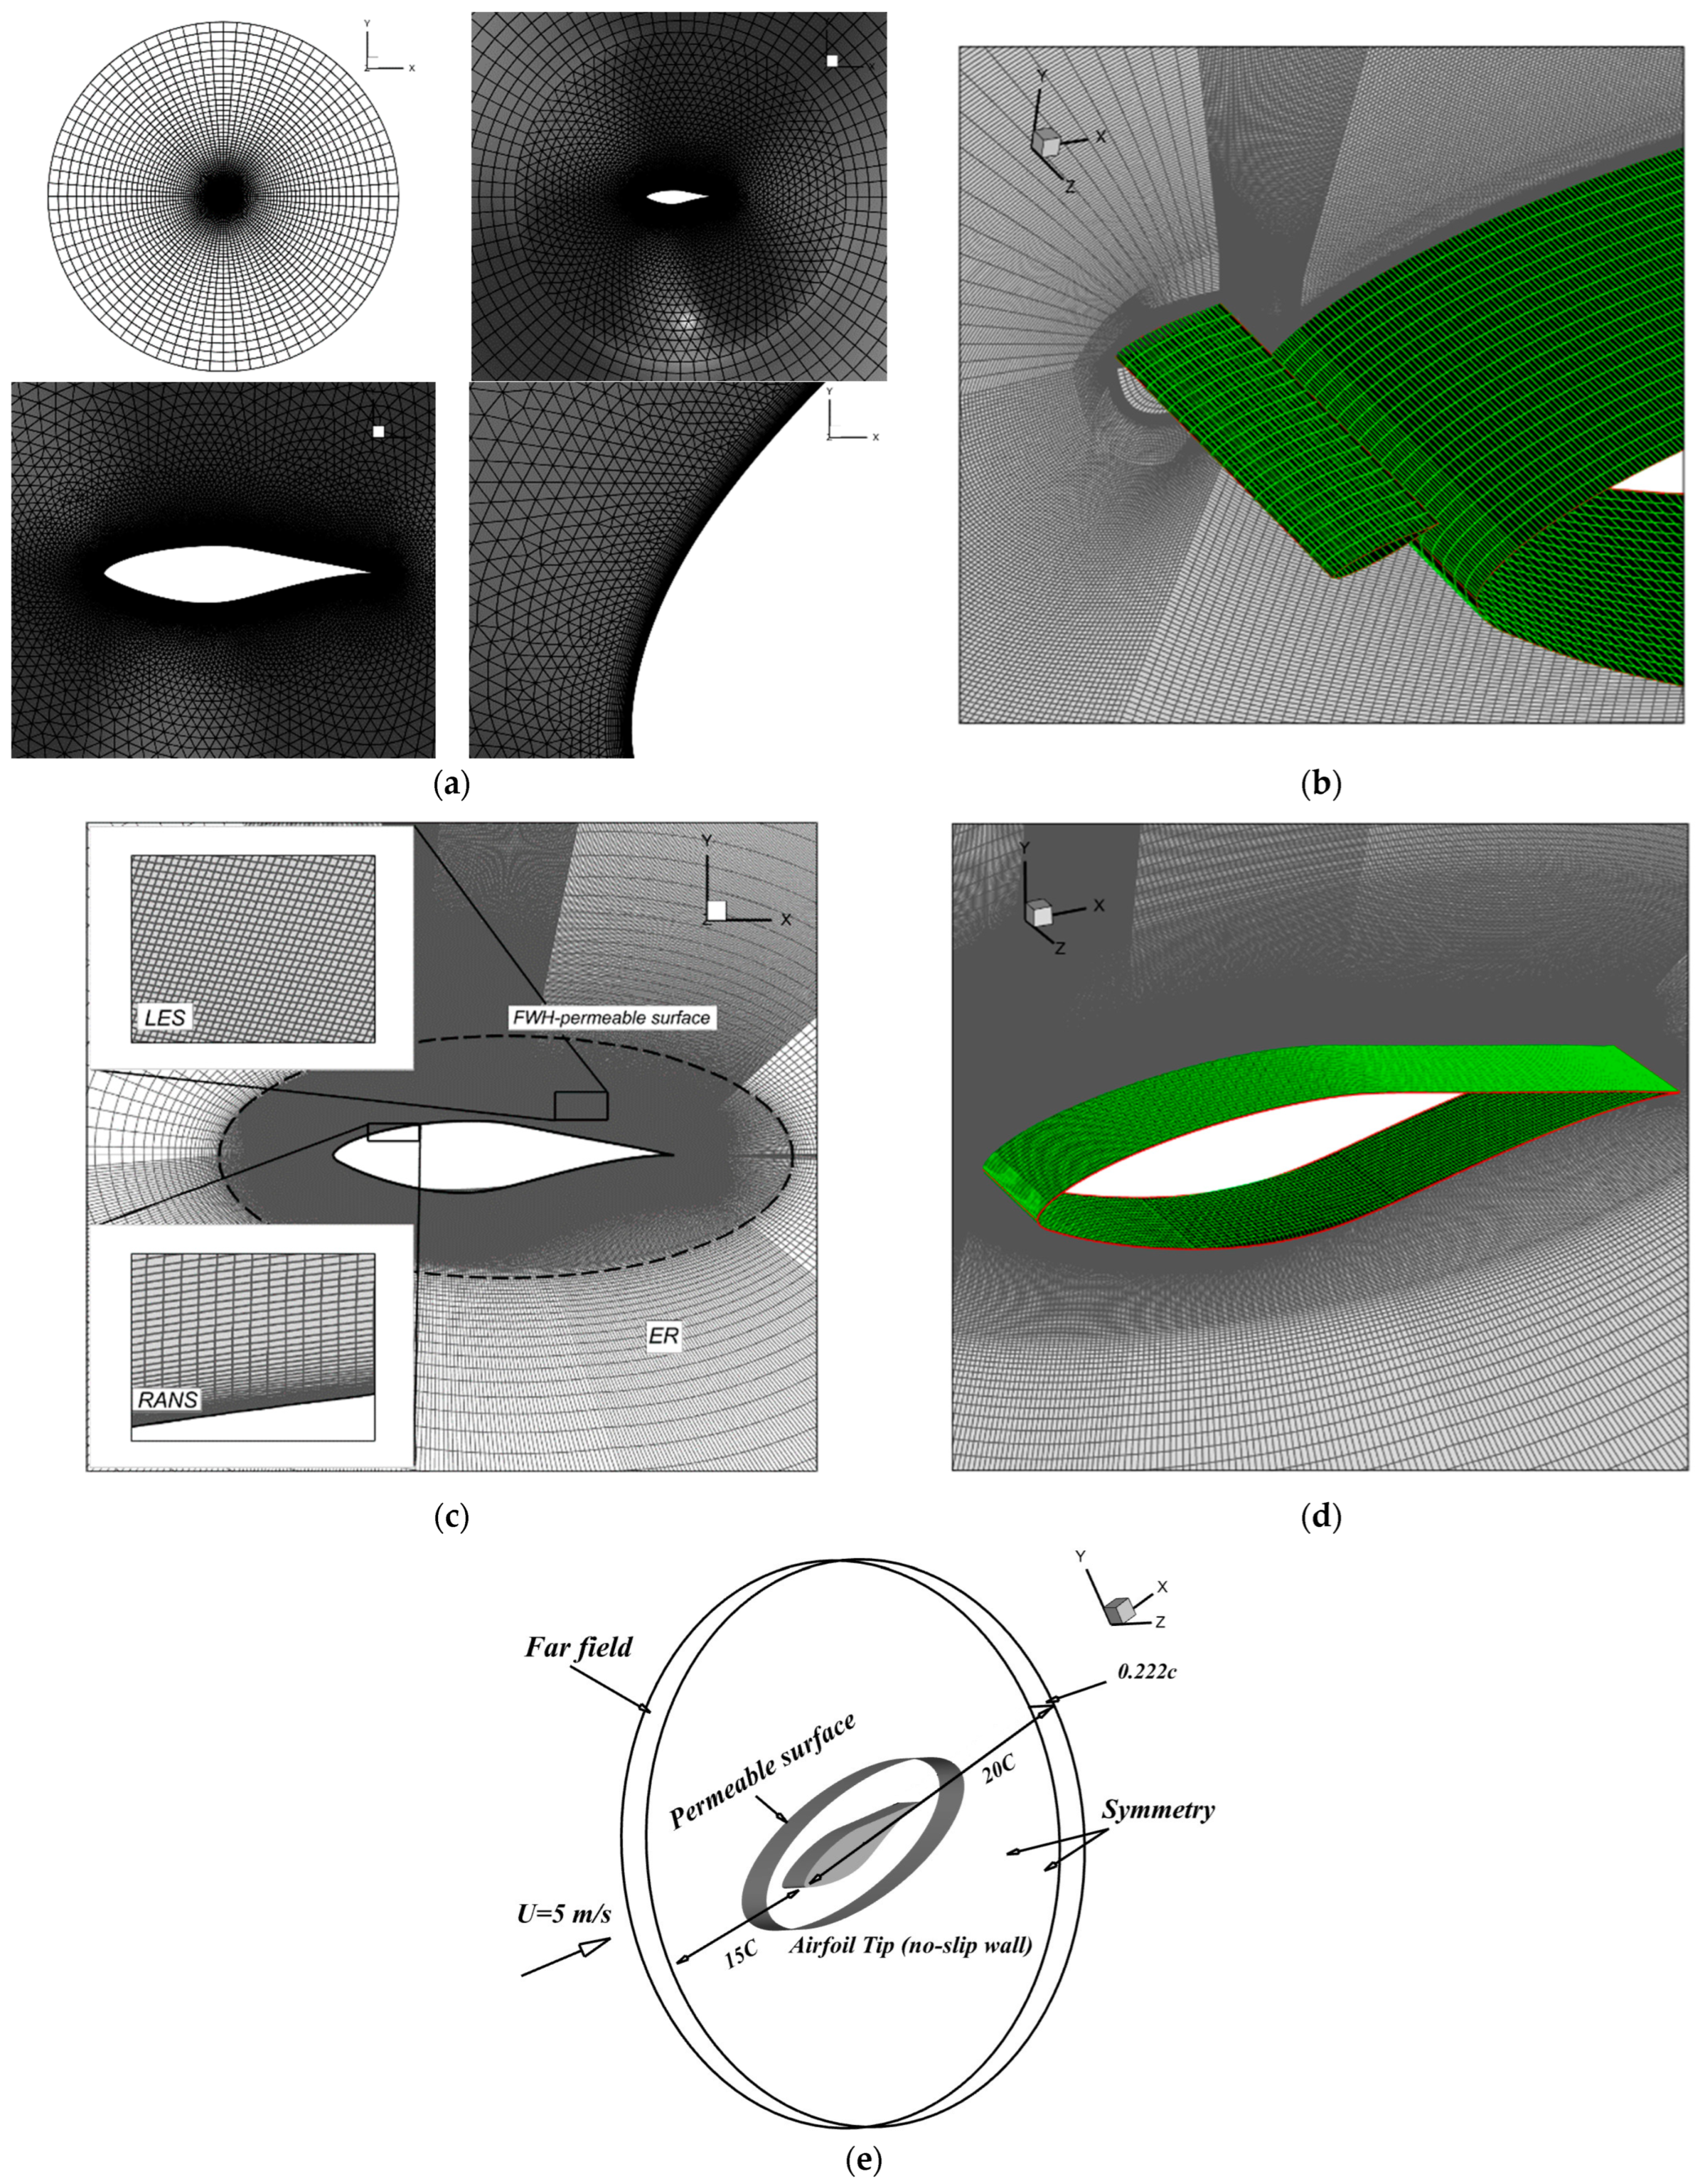
An O-type computational domain [50] with a structured grid zone of 40C radius (80 × 40) is set outside a 3C radius inner circular zone, as illustrated in Figure 3a. Both zones’ centers are at the airfoil mid-chord. Unstructured griding was used for airfoil and airfoil+slat adjacent zone to allow for adequate cell distribution. This configuration allows for flexibility in investigating important sets of two-dimensional slat configurations. Twenty-five rows of structured grids were applied on airfoil and cylinder surfaces for the boundary layers. Wall normal initial grid spacing equals 1 × 10⁻⁵ m. The growth factor to adjacent cell size smoothness is equal to 1.1, resulting in a boundary layer cell thickness of approximately 0.00098 m and an average y+ value of approximately 1 over the whole profile (Figure 2b). A high number of cell divisions are used on the airfoil surface (Δx = 0.0001 m) to avoid skewness of cells adjacent to boundary layer last quadrilateral cells row. A pressure far-field condition was applied at the external domain inlet. This is sine qua non to the use of ideal gas for fluid flow. The slat and airfoil surfaces are set as no-slip solid wall conditions to ensure effective viscous calculation. A turbulence k-ω SST two equations model was chosen based on RANS equations for incompressible steady-state flow. A coupled pressure–velocity formulation with a second-order method for pressure is used, and both momentum and turbulence spatial discretizations are second-order upwind. The convergence is reached when scaled residuals are equal to or below 10−5. The chord length of the S809 airfoil is 0.5 m, and inlet Mach number M = 0.084139 corresponds to a Reynolds number of Re = 106. The flow was considered incompressible.
The solution’s grid independence study uses ten mesh resolutions. The chosen angle of attack was 16° due to the separation onset, making it the right choice for estimating the validity of the lift and drag coefficient results. The various grid cell numbers represent only the unstructured mesh zone, as the outer zone remains unchanged. Table 2 shows the grid structure’s influence on the lift and drag coefficients. It is noted that the growth factor and size of the first cell adjacent to the boundary layer’s 25th cell influence the outcome of the results. G4 has a lower mesh density than G5. However, it appears to produce consistent lift and drag values. We note that mesh density should not be the only criterion in mesh design, as its growth does not necessarily produce better results. The skewness, growth ratio, and smoothness between the boundary layer’s last row of structured cells and the adjacent triangular unstructured cells are crucial. The G6 to G10 results are similar and unchanged, meaning that the solution is grid-independent. The G7 mesh was selected for further calculations. The supplement in cell number due to slat is negligible, and the number of cells in this parametric study remain in the acceptable range as the difference in cell numbers equals 0.49%.

2.4.2. Unsteady Three-Dimensional Study

Computational Gid

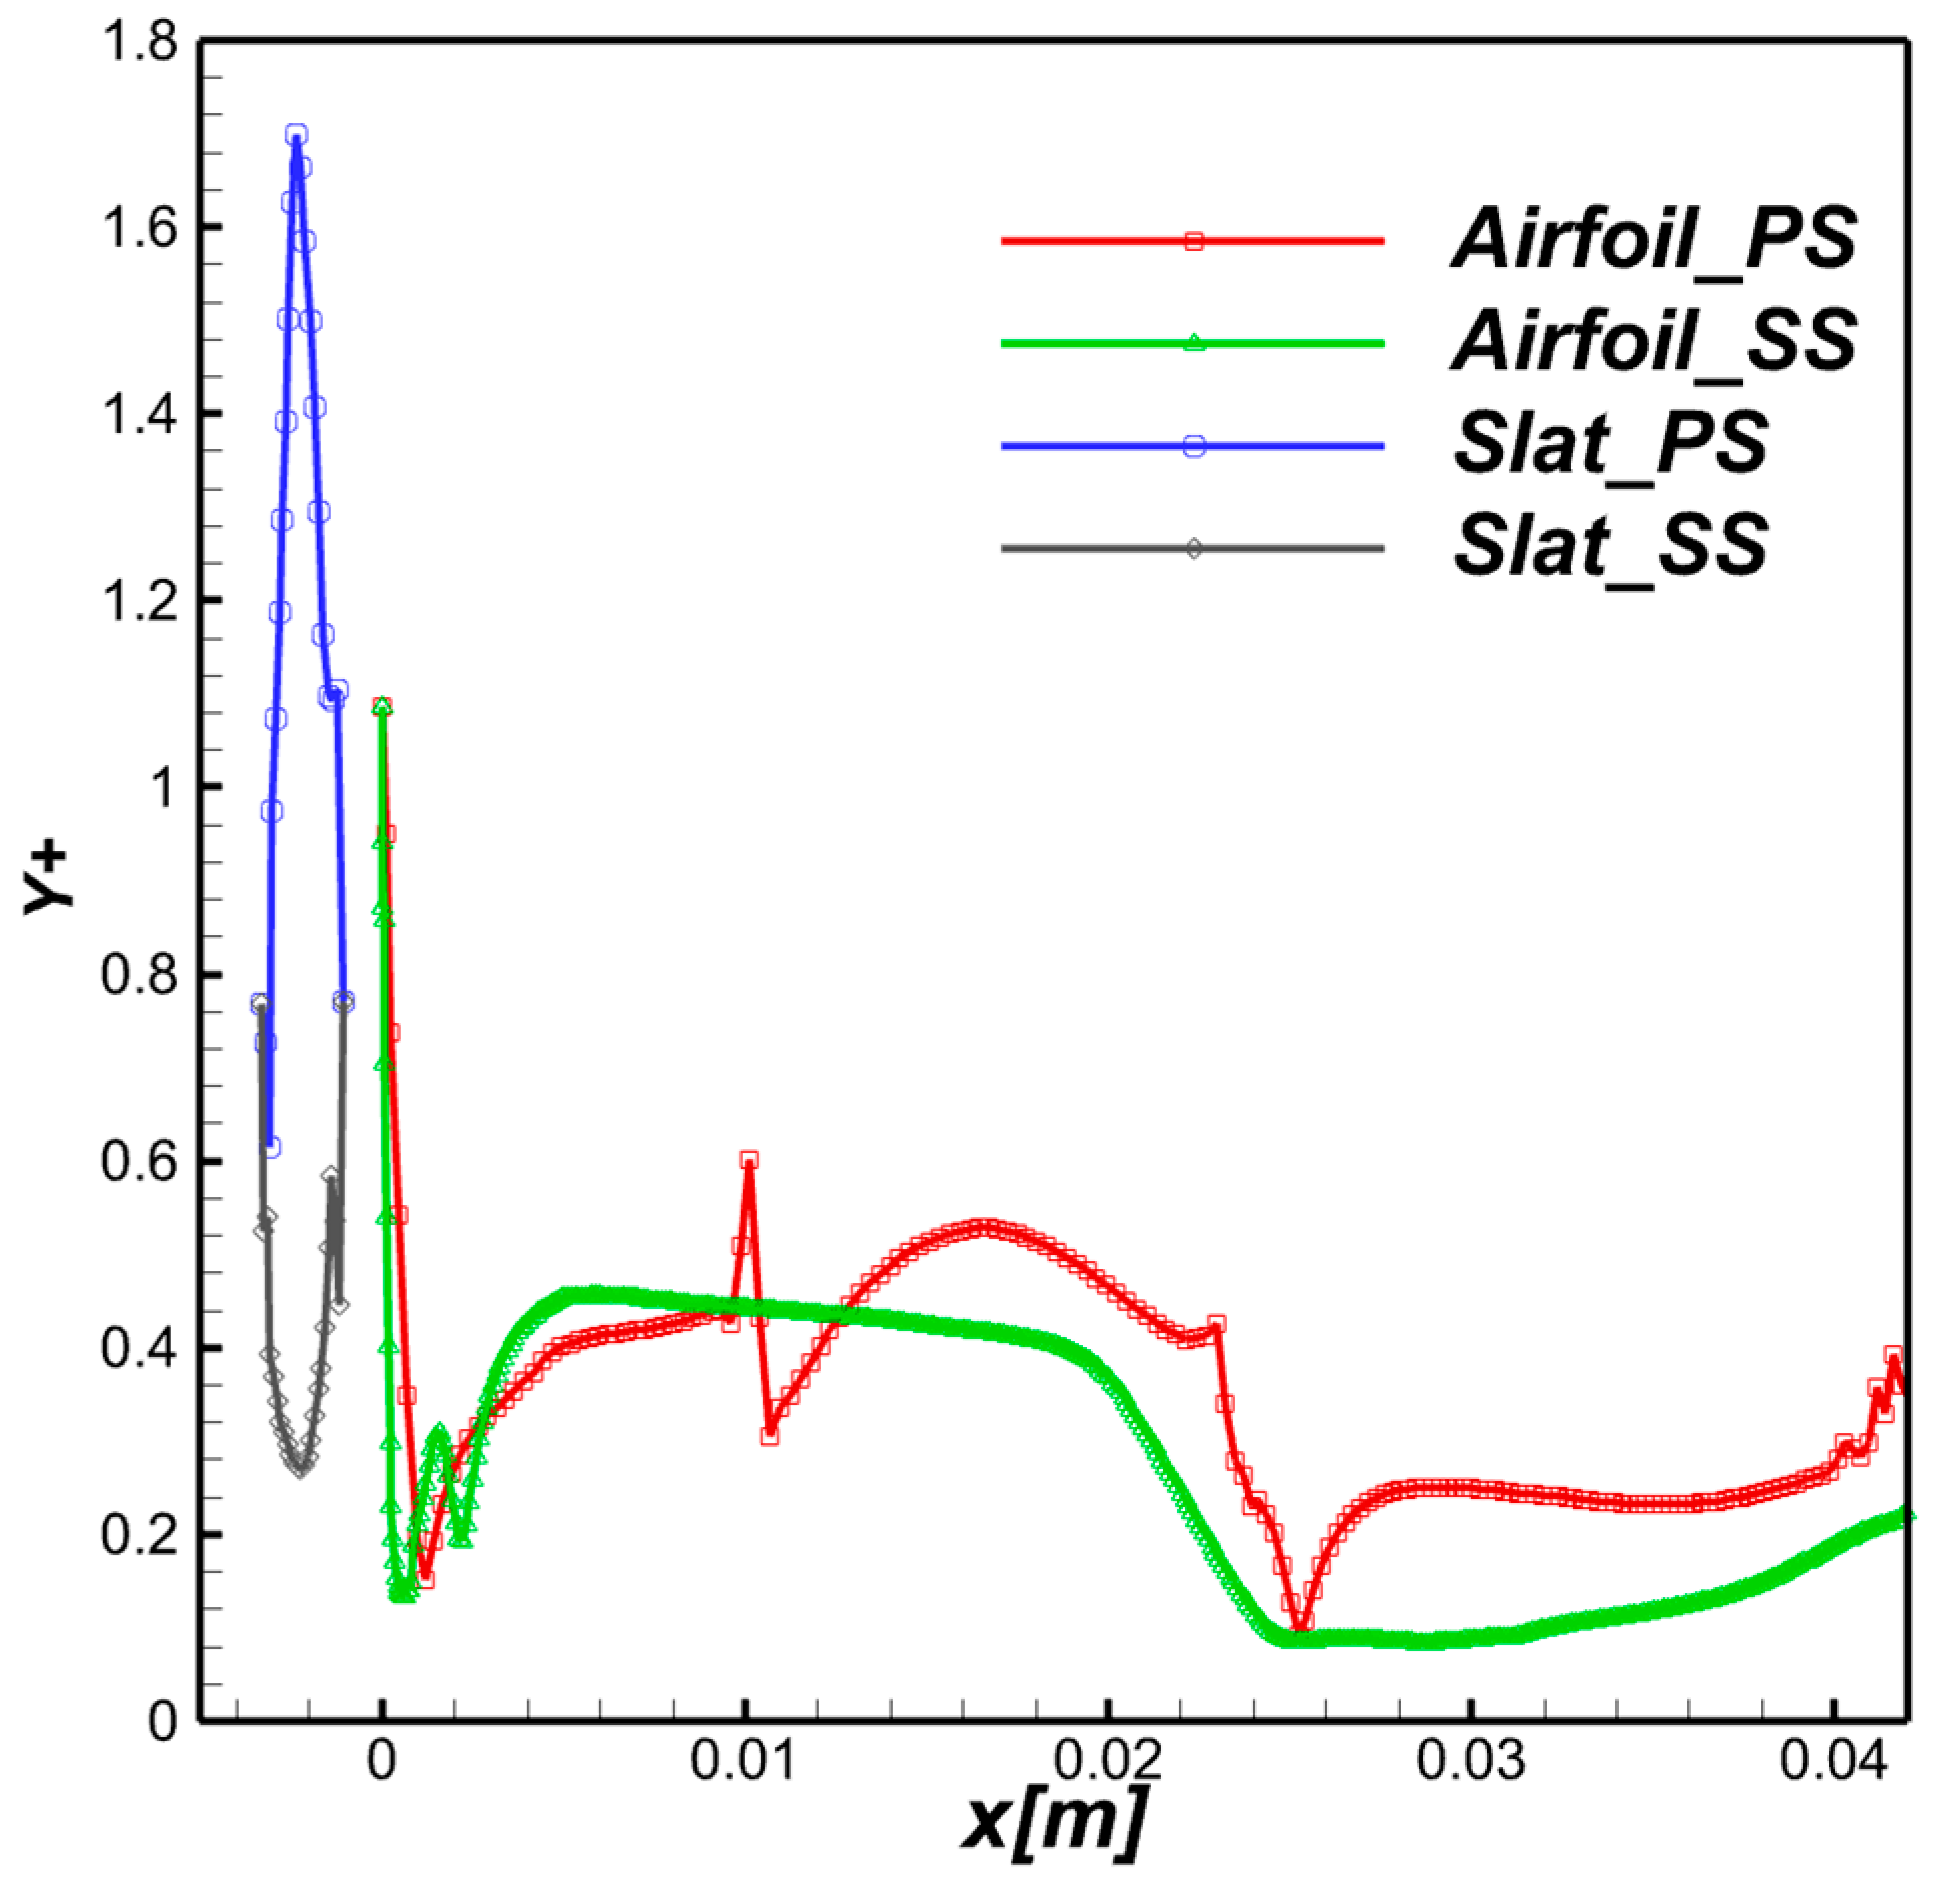
The mesh topology for the unsteady simulation was redesigned. A structured grid multi-block O-shape domain was the favorable approach to cope with the requirements of zones treated with LES in IDDES. Ref. [64] suggested guidelines for mesh design of DES-treated airfoil simulations by differentiating between regions of interest. We followed this approach, and areas such as Euler, RANS, and LES regions are differentiated in the mesh architecture around the airfoil, which are dependent upon flow features of interest under model assumptions. In this study, the near-wall RANS-treated region is designed using a first grid size of 5 × 10⁻⁶ with a growth ratio of 1.1 below the usually adopted ratio of 1.15 [38]. A transition to a much denser LES zone is ensured by maintaining a close but finer cell division order of magnitude while the growth ratio is reduced to 1.01. The airfoil suction side is divided into 453 streamwise divisions, while 195 divisions are used on the pressure side. The divisions are clustered near the leading edge and carefully maintained equal to the wall normal cell division size. At the suction side trailing edge area of the LES region, Δx = Δy = 0.0023C in order to produce isotropic cells in the separation zone, which are highly recommended for LES [30]. In total, 26 divisions are distributed spanwise, with 20 divisions on the blade and 6 remaining over the tip. Most y+ values are under the recommended value of 1.5 (Figure 4), which should resolve the viscous sublayer [38]. The total number of cells is 4.25 × 10⁶.

Computational Approach

The (KARI) low-speed wind tunnel experimental campaign flow conditions are reproduced in this study [28]. The aerodynamic and aeroacoustic effect of the optimum slat configuration over the tip portion of the 12% scale model NREL S809 phase VI wind turbine blade is simulated using IDDES-FWH. The 12% blade tip chord length is C = 0.04296 m, and a spanwise length of 0.2C was used for the simulation, which was the choice of [65,66], while [67] judged a 0.12C spanwise extent as a minimum limit for capturing three-dimensional vortical structures in the trailing edge separation region. The Mach number of 0.110346 was based on the relative fluid velocity at the scaled model tip corresponding to the experimental rotational speed of 600 RPM and the uniform free stream test case of U = 5 m/s. The fluid is an ideal gas with a dynamic viscosity of µ = 1.7894 × 10⁻⁵.
The turbulence intensity was 1% (low turbulence adequate for airfoil self-noise instead of inflow noise [68]). The inlet turbulent length scale calculation was based on the RANS boundary layer thickness by Λ = 0.4δBL, and all simulation runs were performed at an AoA = 16°. The no-slip condition was applied on all blade and slat surfaces, and symmetry was applied on both sides of the domain. The far-field condition was applied on the circumferential surface of the domain. Over the blade tip, the domain is extended by 11% of the span length, a value that was judged ample considering the scale of the blade chord. Acoustic compactness is assumed due to the scale disparity between the model extent and the resulting acoustic wavelength; thus, incompressibility can be adopted [69].
A SIMPLE algorithm was chosen for pressure–velocity coupling solving with second-order upwind discretization for both pressure and momentum equations. The second-order upwind is used for spatial discretization, and the transient calculation is performed with the second-order implicit formulation. The transient data exploited for aeroacoustic results rely on the CFL number. The latter ensures the description of flow field parameters at the smallest grid scales for the given velocity formulated as follows: CFL= U Δ t Δ x , where Δx is the average smallest streamwise cell size, Δt is the time step size, and U is the undisturbed velocity. The time step for this study is equal to 3 × 10⁻⁶ s. The total simulation run is T* = t c0/C = 97 non-dimensional time units, of which there are 50 for postprocessing acoustics.
The transient simulation procedure for IDDES-FWH (classical and permeable) used in this study is as follows:
k-ω SST model steady-state simulation is run until a statistically steady solution is reached (residuals under 10−5) and used as an initial step for the transient run.
The IDDES model (with k-ω SST as RANS) is undertaken until a periodicity pattern is observed and the solution is statistically steady.
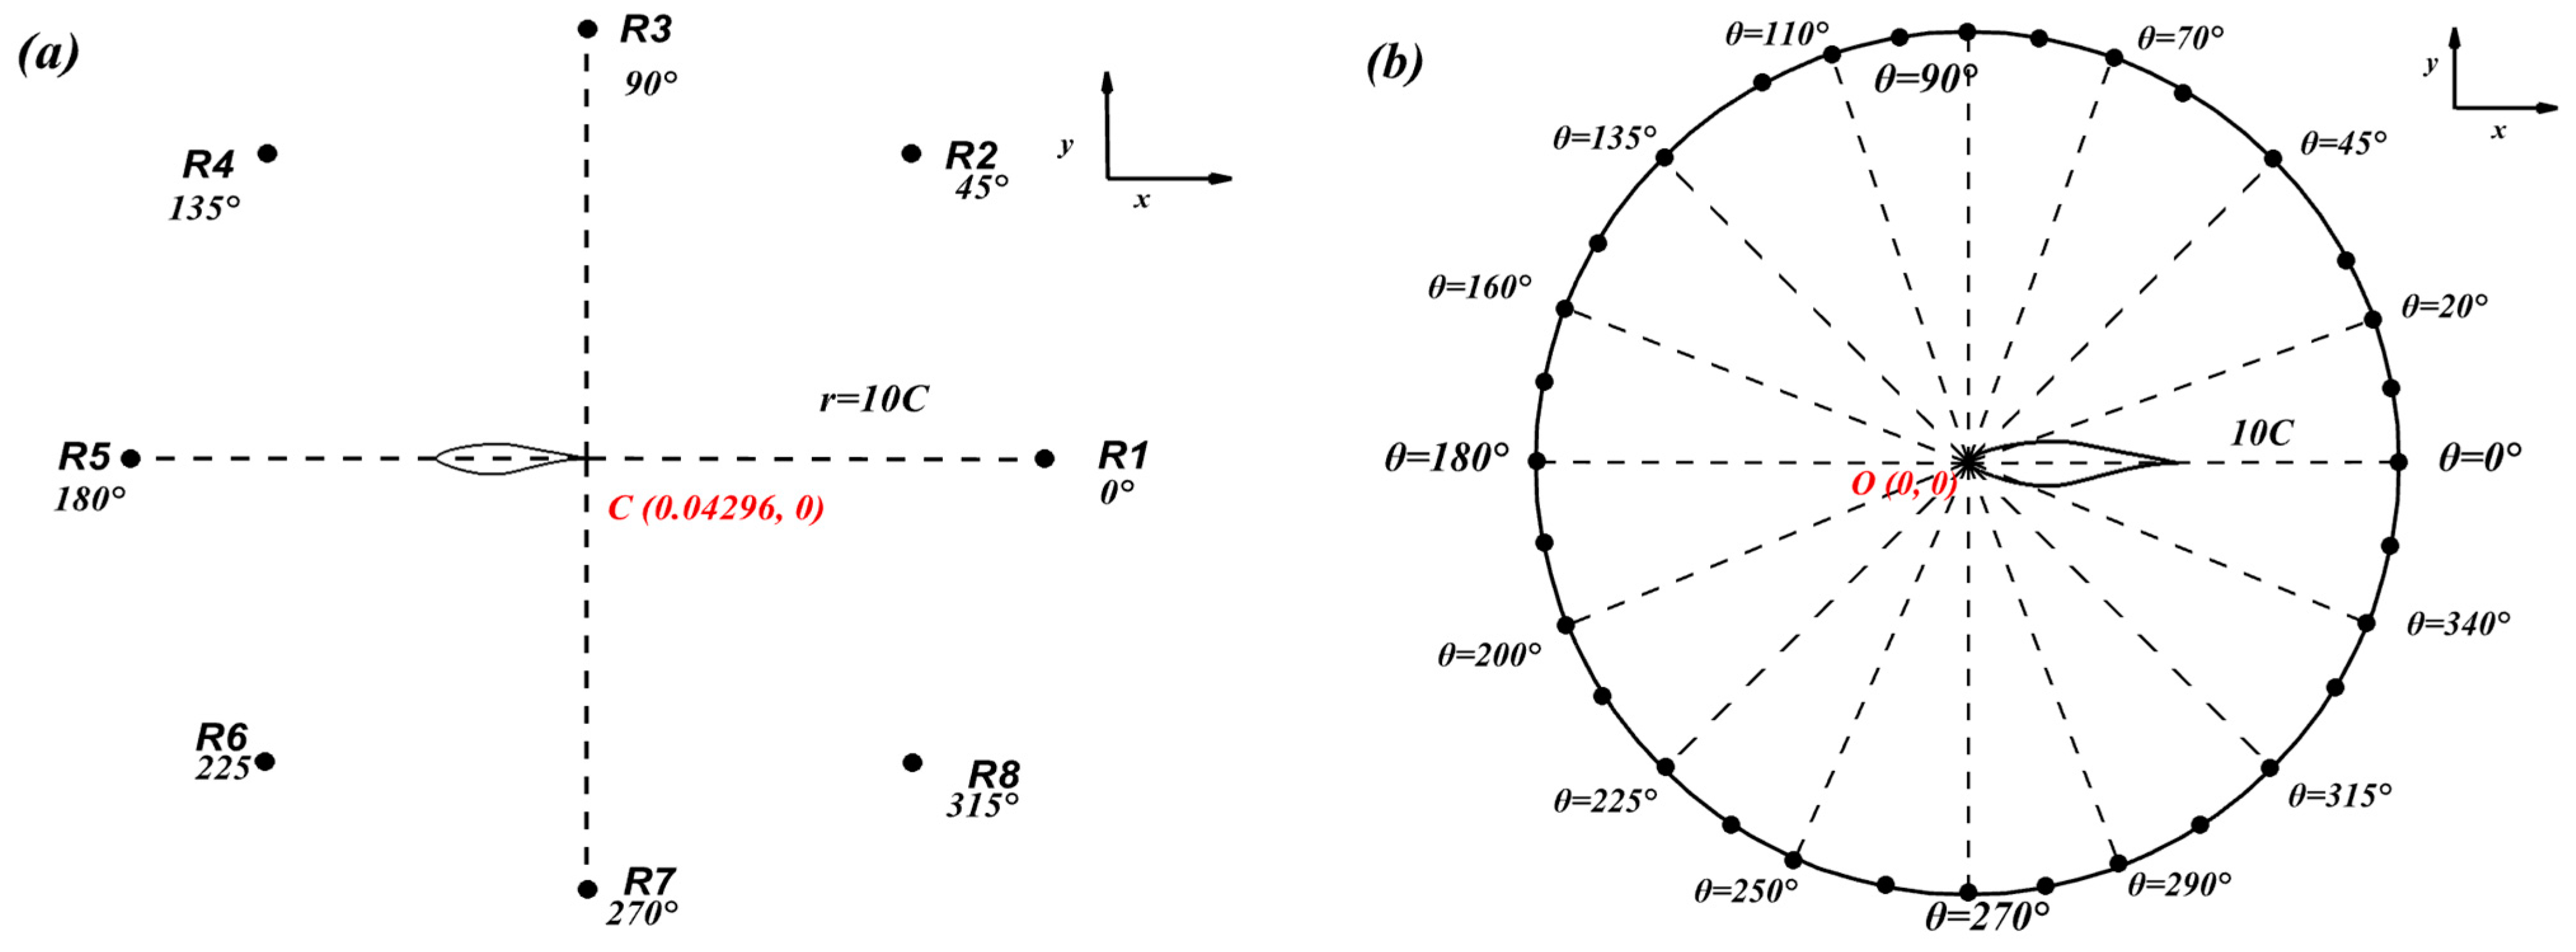
The near field quantities provided by the IDDES are used for the acoustic simulation of both classical and permeable FWHp approaches. For the classical approach, the blade and slat’s wall boundaries are taken as a source, and the sound level is estimated at receivers under convective effects assumption considering noise from only surface source terms under the premise of negligible quadrupolar noise [34]. In the permeable surface integration case, the surface boundary depicted in Figure 3c,e is taken as the source and extends to the whole domain width. The noise is estimated for surface and volume noises contained inside the permeable surface. The volume displacement effect due to blade rotation is absent. Thus, monopole sources are neglected while dipole and quadrupole source terms are considered. Capturing the broadband noise generated by the flow separation at the blade trailing edge upper side requires a good evaluation of the permeable surface extent and position. Issues related to the spurious noise captured due to the blade’s wake crossing the permeable surface have been reported [63]. Conventionally, the permeable surface should encapsulate all turbulent structures and be positioned in an adequate grid resolution, conditions generally judged as hard to achieve [26,70]. Thus, an oval-shaped permeable surface extends spatially to 1.5C downstream and half a chord upstream of the blade leading edge to encapsulate the near field separation turbulent fluctuation above the trailing edge to maintain reasonable numerical costs. Acoustic pressure is captured for integral surfaces, and FFT (Fast Fourier Transform) is performed to postprocess the receivers’ acoustic pressure in the frequency domain using 8 receivers located at a 10C circular distance from the trailing edge of the main element (Figure 5a). To identify the radiated noise directional emission of the studied configurations, 32 receivers are distributed around the airfoil on a circle centered at the leading edge with a 10C radius, as depicted in Figure 5b. The azimuthal z coordinate of all receivers is taken at the midspan, and their distribution is counterclockwise.

3. Results and Discussion

3.1. Two-Dimensional Aerodynamic Study

This section focuses on investigating an optimum slat configuration via parameter variation: slat profile, slat chord length, inclination angle, and position. The Reynolds number is 106. Lift and pressure drag coefficients, alongside pressure contours, are exploited. The plotted aerodynamic coefficient values are considered for the slat and the main element.

3.1.1. Aerodynamic Coefficients

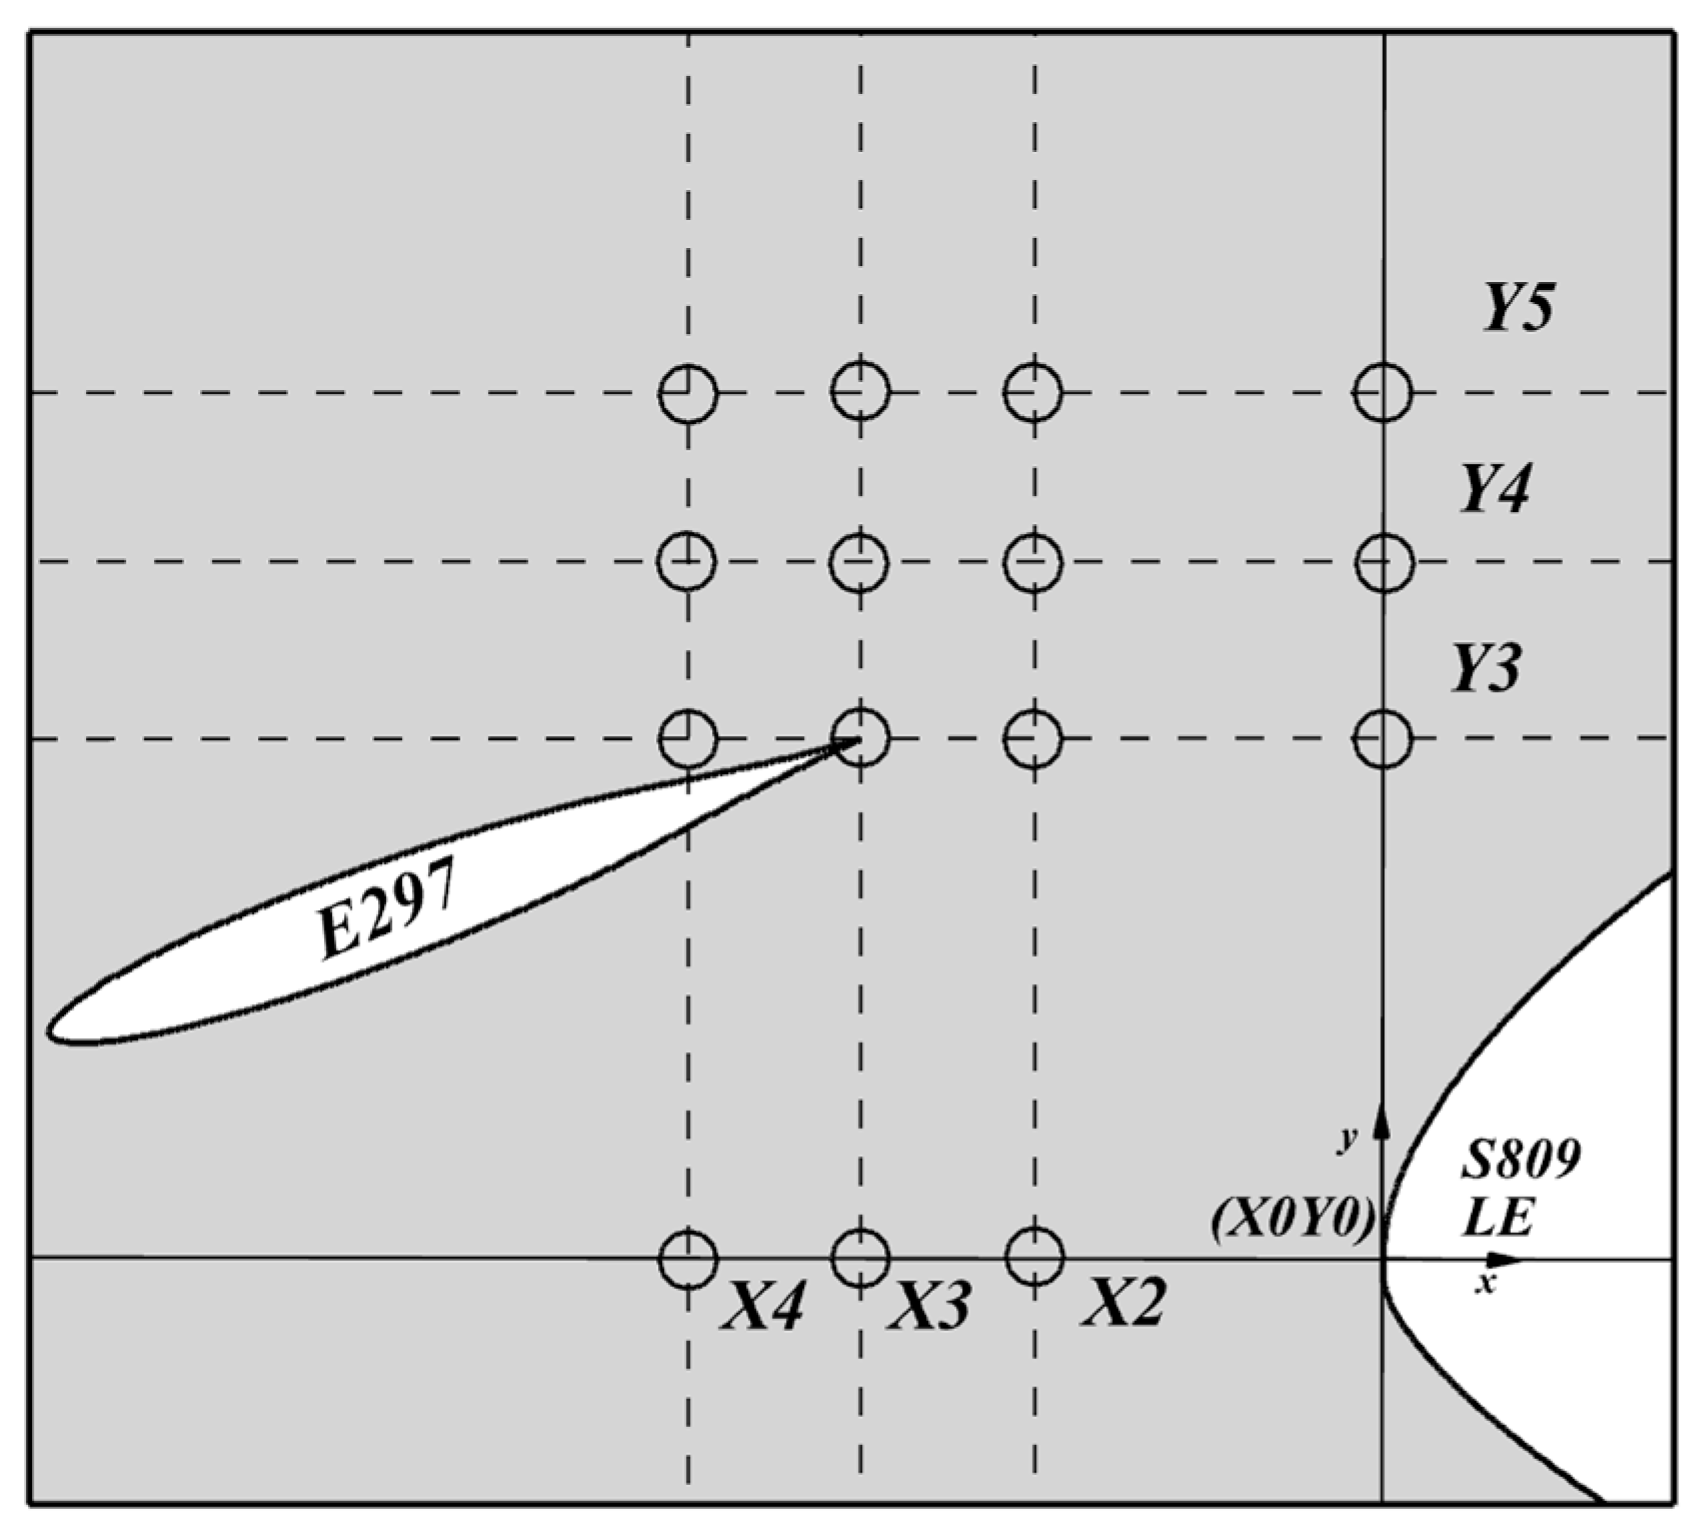
The primary objective of this approach is to proceed by elimination to evaluate the optimum combination of slat parameters for improving aerodynamic coefficients over the S809 airfoil profile. Firstly, the influence of the slat profile on aerodynamic performances is explored using E49, Goe440, Goe531, E49(-), and E297 slat profiles with different ranges of camber and thickness (Table 1). The two primary positions ((X = 3%C, Y = 3%C) or X3Y3 and (X = 0%C, Y = 3%C) or X0Y3) are used as a preliminary evaluation of slat position influence relative to the main element. The airfoil leading edge is taken as the origin. Vertical and horizontal relative positions of slats are estimated between the main element leading edge and the slat trailing edge, as seen in Figure 1. The slat chord is fixed at c = 5%C with an inclination angle relative to the horizontal axis ß = 0° and is simulated for AoAs AoA = 14, 16, 18, 20, 22, and 24°. In the study of off-surface separation control devices, the upper leading-edge region was the most efficient location [50,66]. The range of explored positions is accordingly restricted near the leading-edge area. Overall, five slat chord lengths are tested (c = 5%C, 7%C, 10%C, and 15%C), and six slat inclination angles of (ß = −6°, −12°, −20°, 6°, 12°, and 20°) are evaluated.
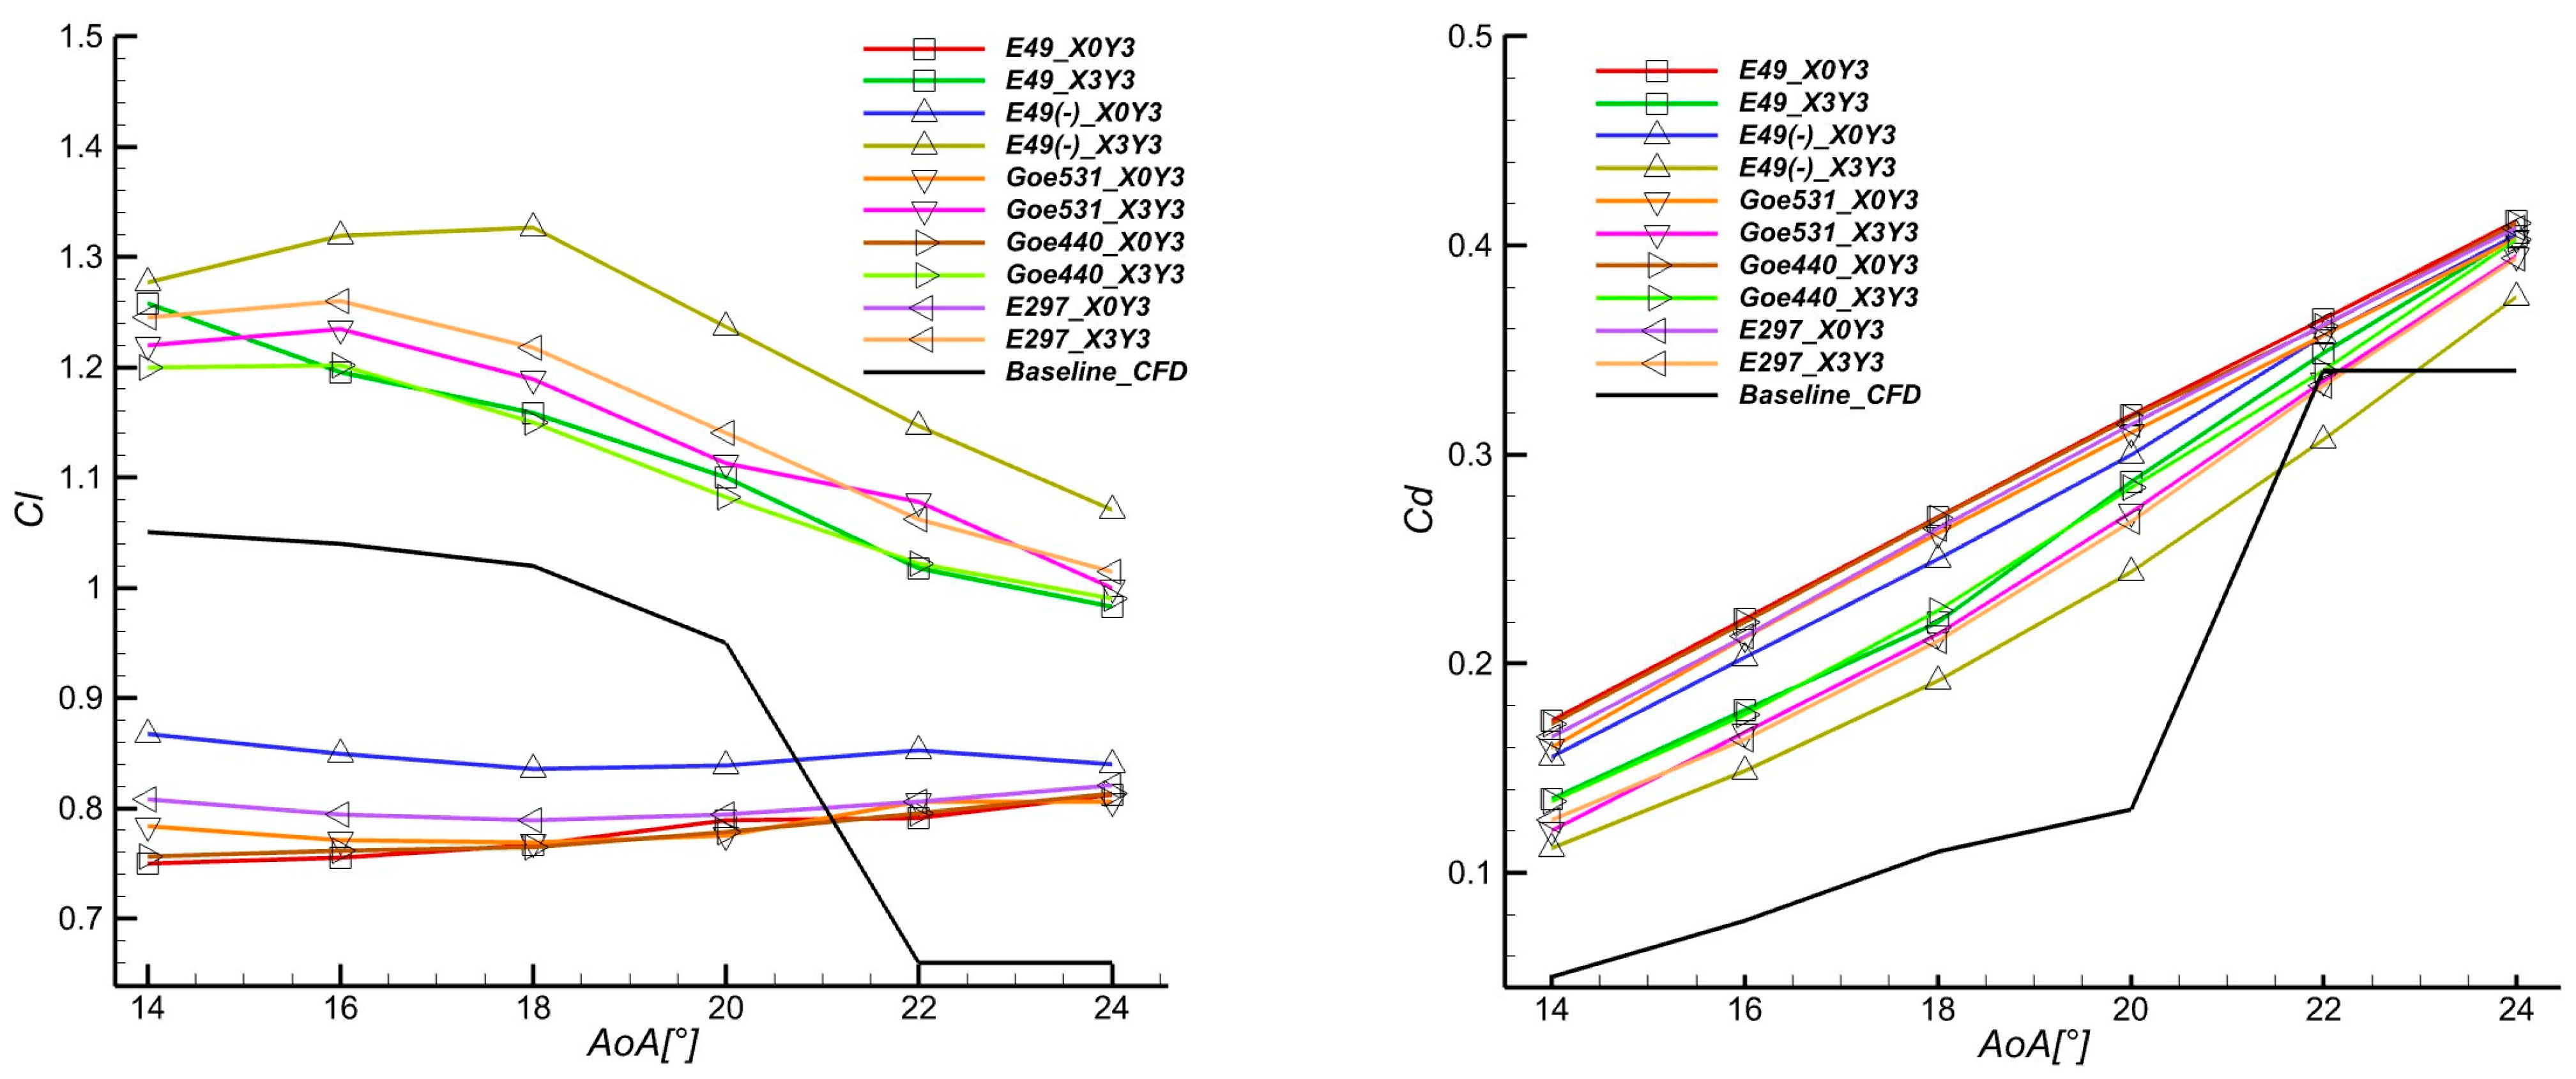
The lift and drag coefficients for positions X3Y3 and X0Y3 are studied for all AoAs and compared to the baseline in Figure 6. In terms of lift, the superiority of the X3Y3 position over X0Y3 is observable for all slat profiles. Compared to the baseline, only the X3Y3 position offers the amelioration of lift for all AoAs, while X0Y3 only succeeds in creating more lift for AoAs ≥ 22°. The highest lift for the X0Y3 and X3Y3 configurations is achieved with the negative camber slat profile E49(-), followed by the symmetric camber slat profile E297, respectively. Lift improvement maxima of 30% is reached at AoA = 18° for E49(-)_X3Y3, and 20% is reached for E297_X3Y3 at AoA = 16°. After AoA = 20°, the baseline lift coefficient falls abruptly, while the positive effect of the slat is clearly demonstrated.
In parallel, the drag coefficients present a similar lift trend regarding position superiority. The X0Y3 positions produce the highest drag values for all profiles at all AoAs, while E49(-)_X3Y3, again, shows the lowest drag values for all AoAs. The latter produces the highest value in terms of the lift-over-drag ratio. At AoA = 22°, drag drops lower than the baseline for E49(-)_X3Y3. Regardless of position and slat profile, all slat configurations produce higher drag than the baseline configuration. This observation was anticipated due to the slat body causing supplementary pressure drag. The aim was to produce the highest lift while reducing the inevitable slat pressure drag to the lowest as a compromise via parameters’ investigation.
The first observation can be made about the sensitivity of the airfoil performances to the slat camber, as negative and symmetric slat profiles are superior to others. The slat position relative to the main element leading edge significantly modifies the aerodynamics behavior. X3Y3 is conspicuously the best option for further investigation due to its superiority compared to X0Y3.
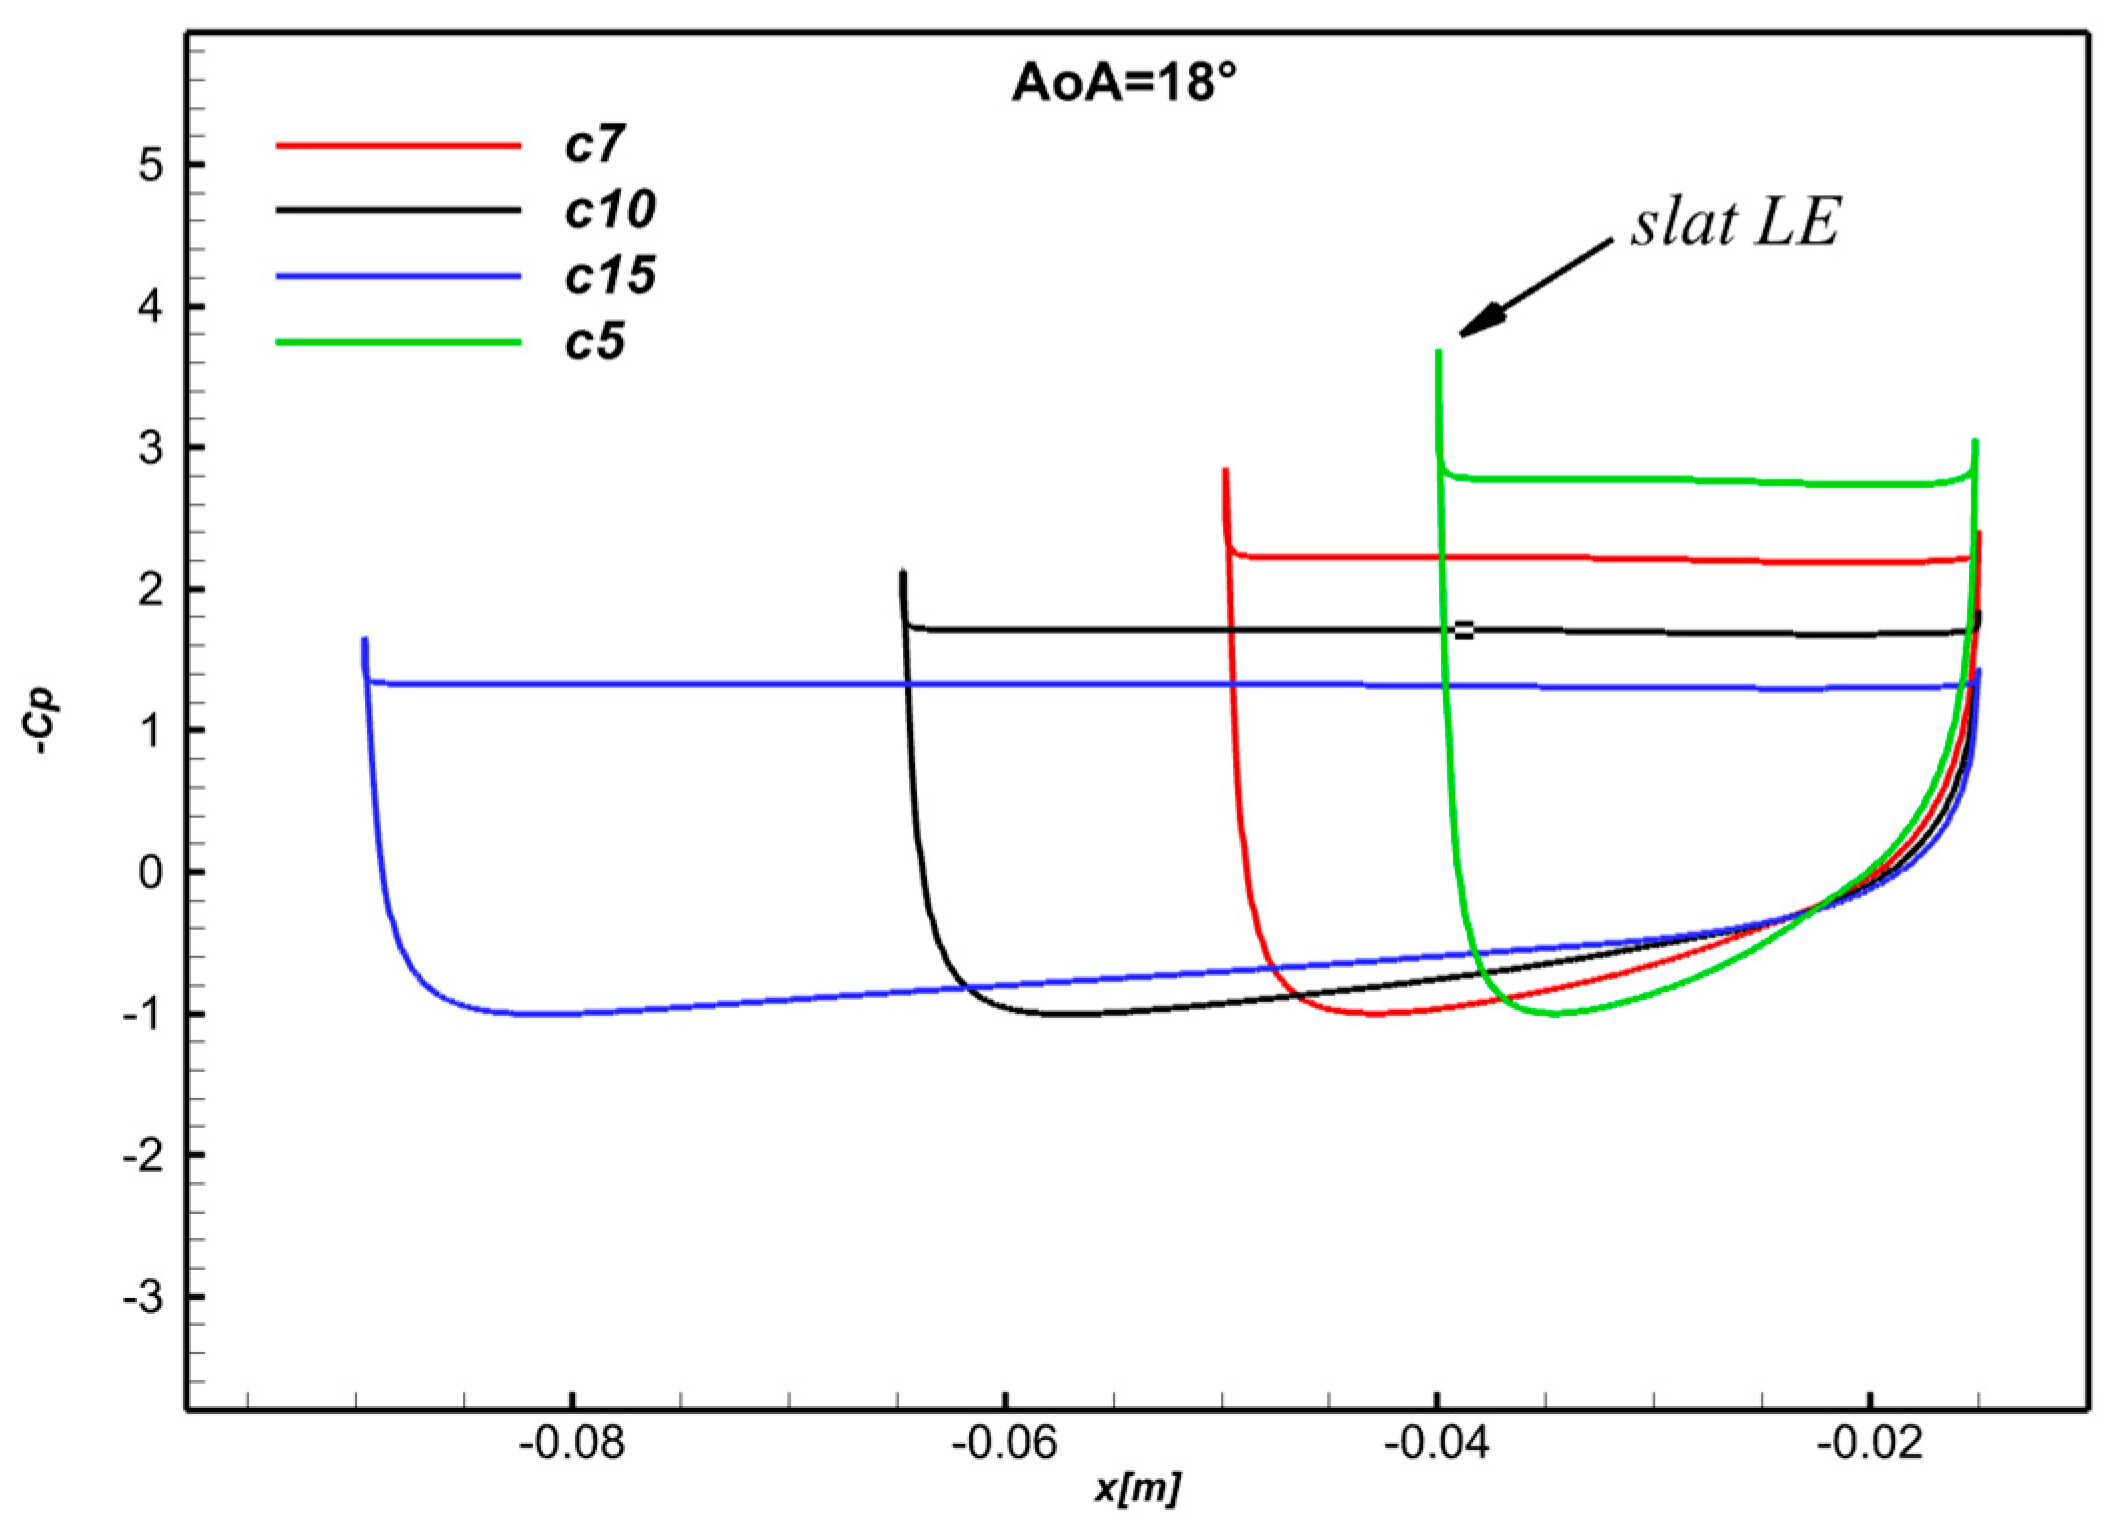
In the following, the position of the slat is fixed at X3Y3, and three additional slat chord lengths are explored (c7, c10, and c15) for all slat profiles. The slat chord length parameter is commonly linked to the slat-to-airfoil-gap ratio [71]. However, in this study, the effect of varying slat chord length is judged separately. The inclination angle is maintained at ß = 0°. No slat profile was chosen as optimal, as further parametric analysis is intended at that stage. Figure 7 depicts the lift and drag coefficient variation in all the slat profiles at 14° ≤ AoAs ≤ 24°. A repeatable observation is made for all the shown plots. The variation trend and the order of the slat’s aerodynamic influence are independent of the slat profile.
The pressure coefficient distribution over slats further explains the phenomenon as the negative pressure peaks on slats’ leading and trailing edges are inversely proportional to chord length. The highest depression and negative pressure distribution is recorded on E297_c5, translating a more energetic fluid flow over the slat suction side. The higher trailing edge pressure coefficient peak means that the flow is deflected towards the main element with higher energy. For higher chord lengths, the slat detached flow wake is deflected away, inducing a lower influence on the main element suction side, thus impacting aerodynamic coefficients Figure 8.
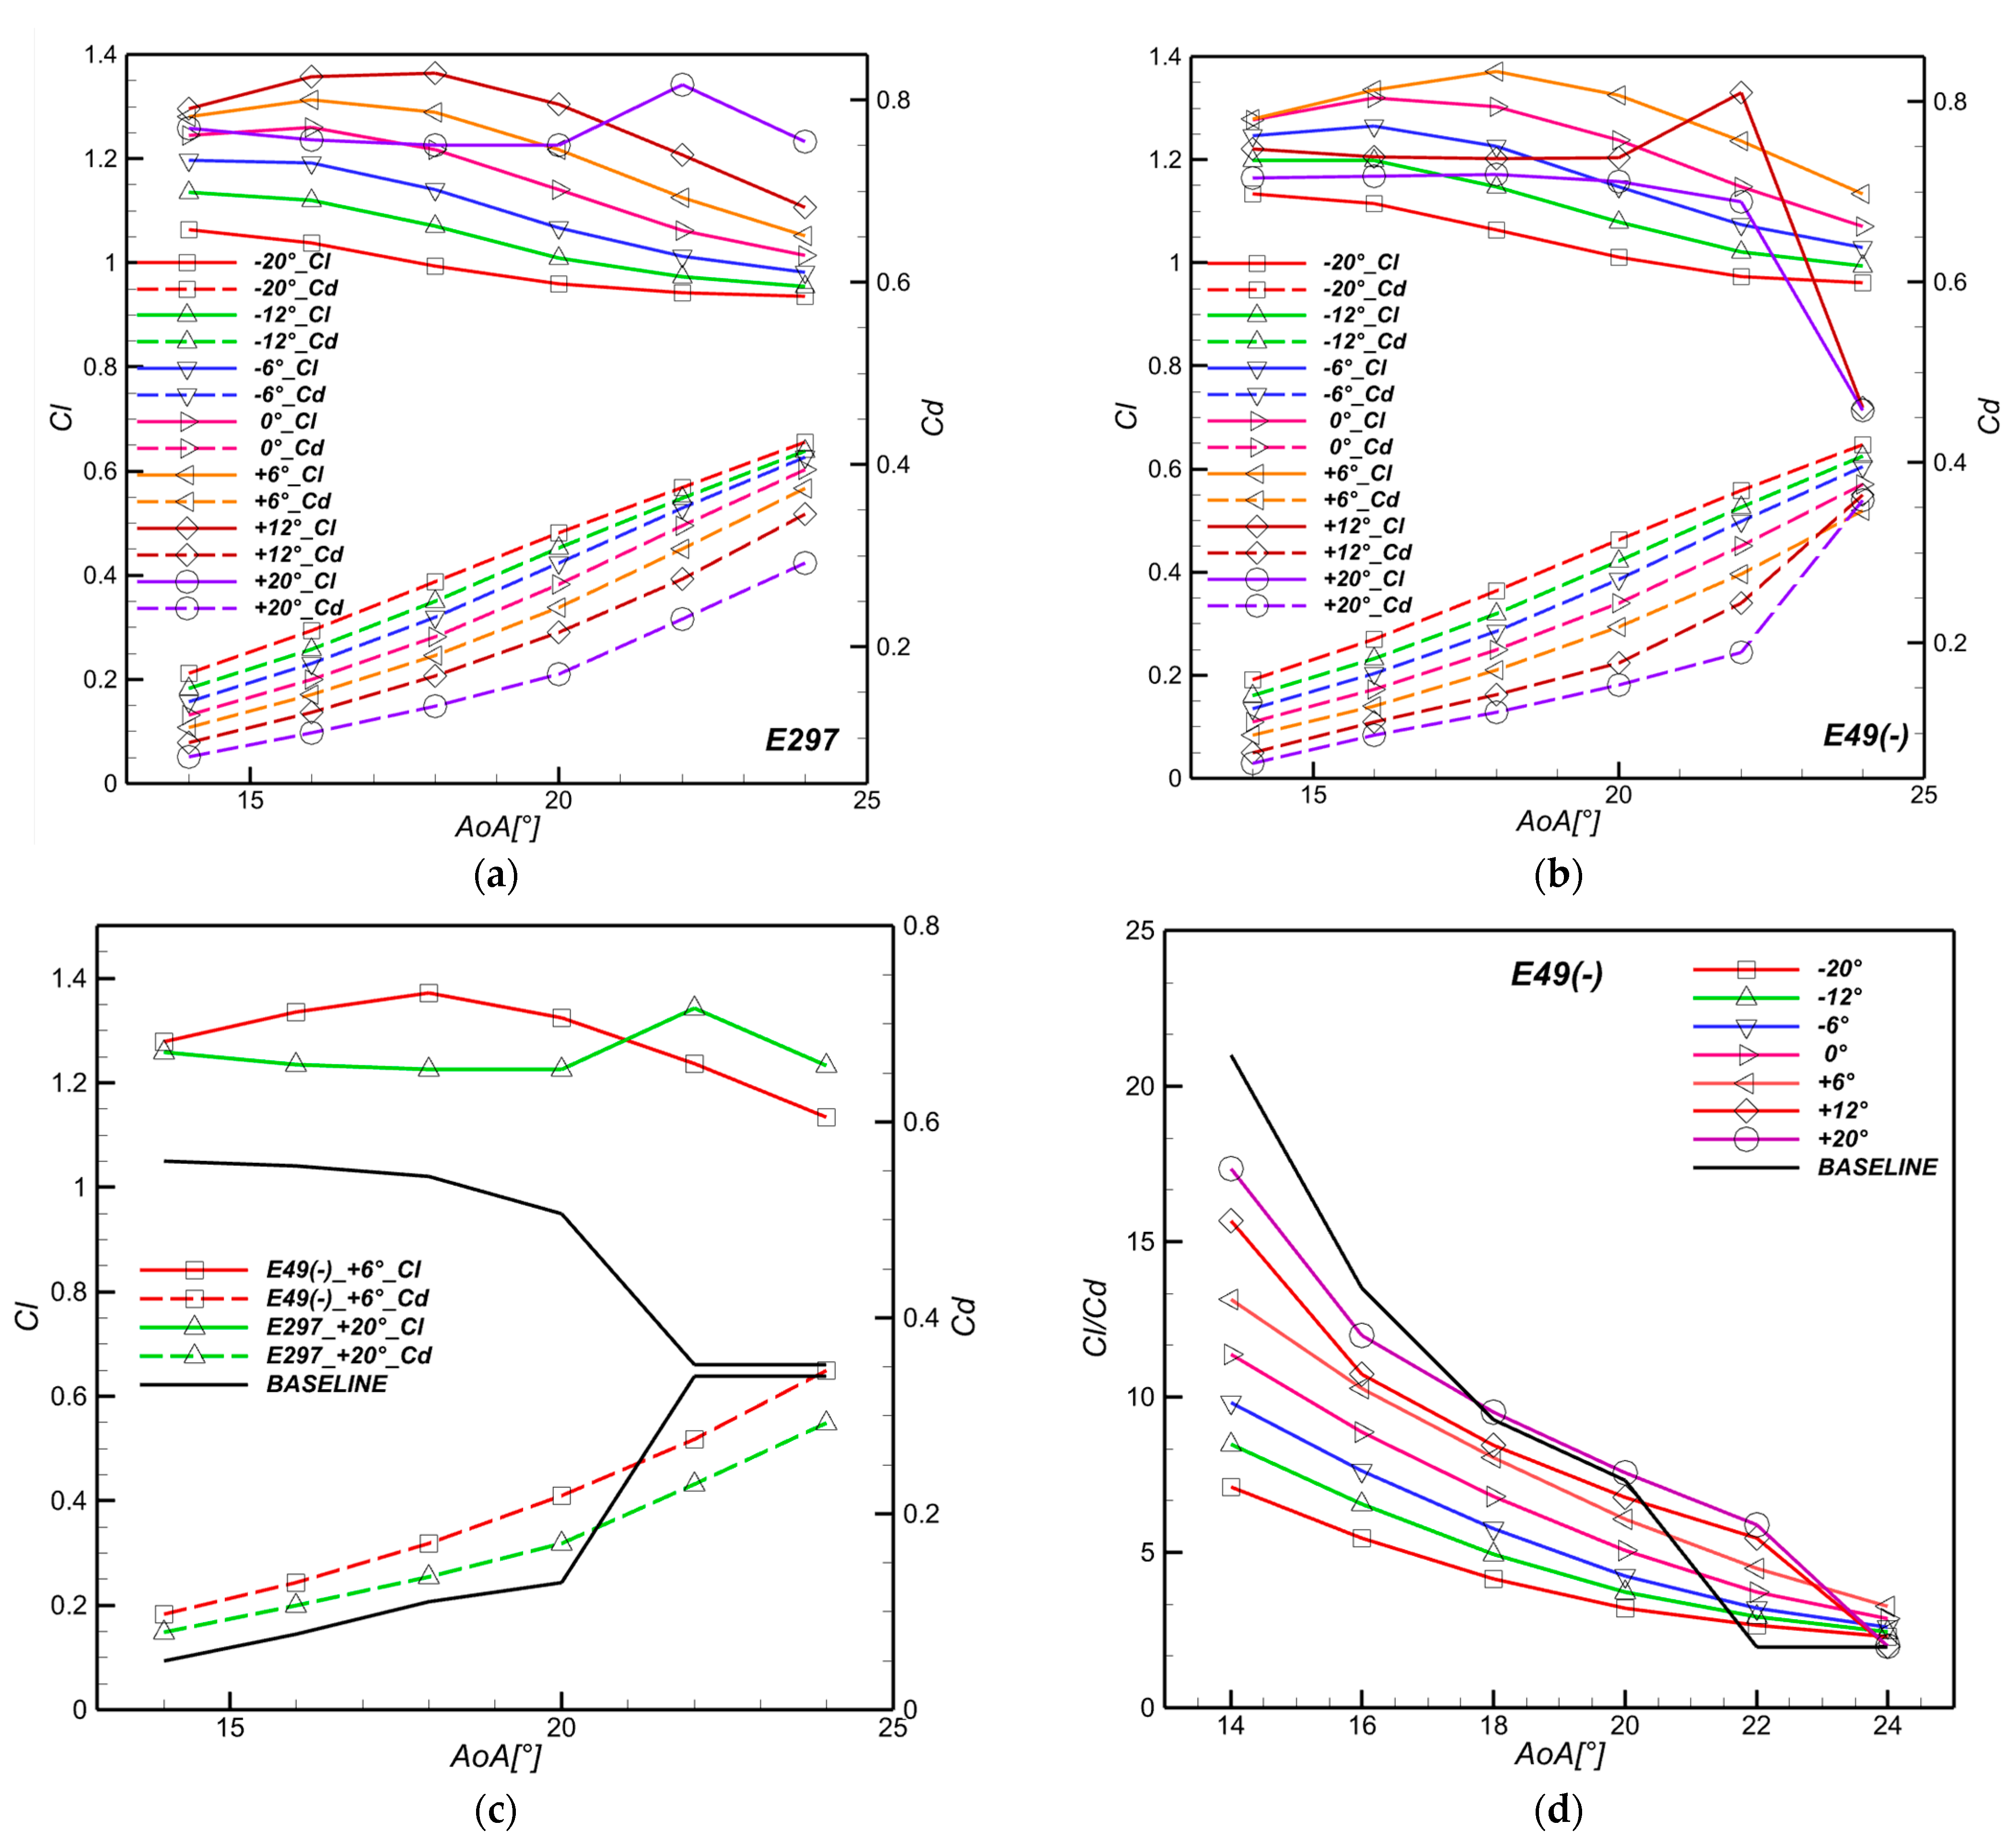
Based on the results above, the slat chord length c5 is used for the remainder of this study. The variation in the slat inclination angle is important as it dictates the topology of the detached flow behavior around the slat profile and convected toward the main element. The two most performant slat profiles, E49(-) and E297, are simulated with six additional inclination angles: ß = −6°, −12°, −20°, 6°, 12°, and 20°. Anti-clockwise orientation is adopted, and position is maintained at X3Y3.
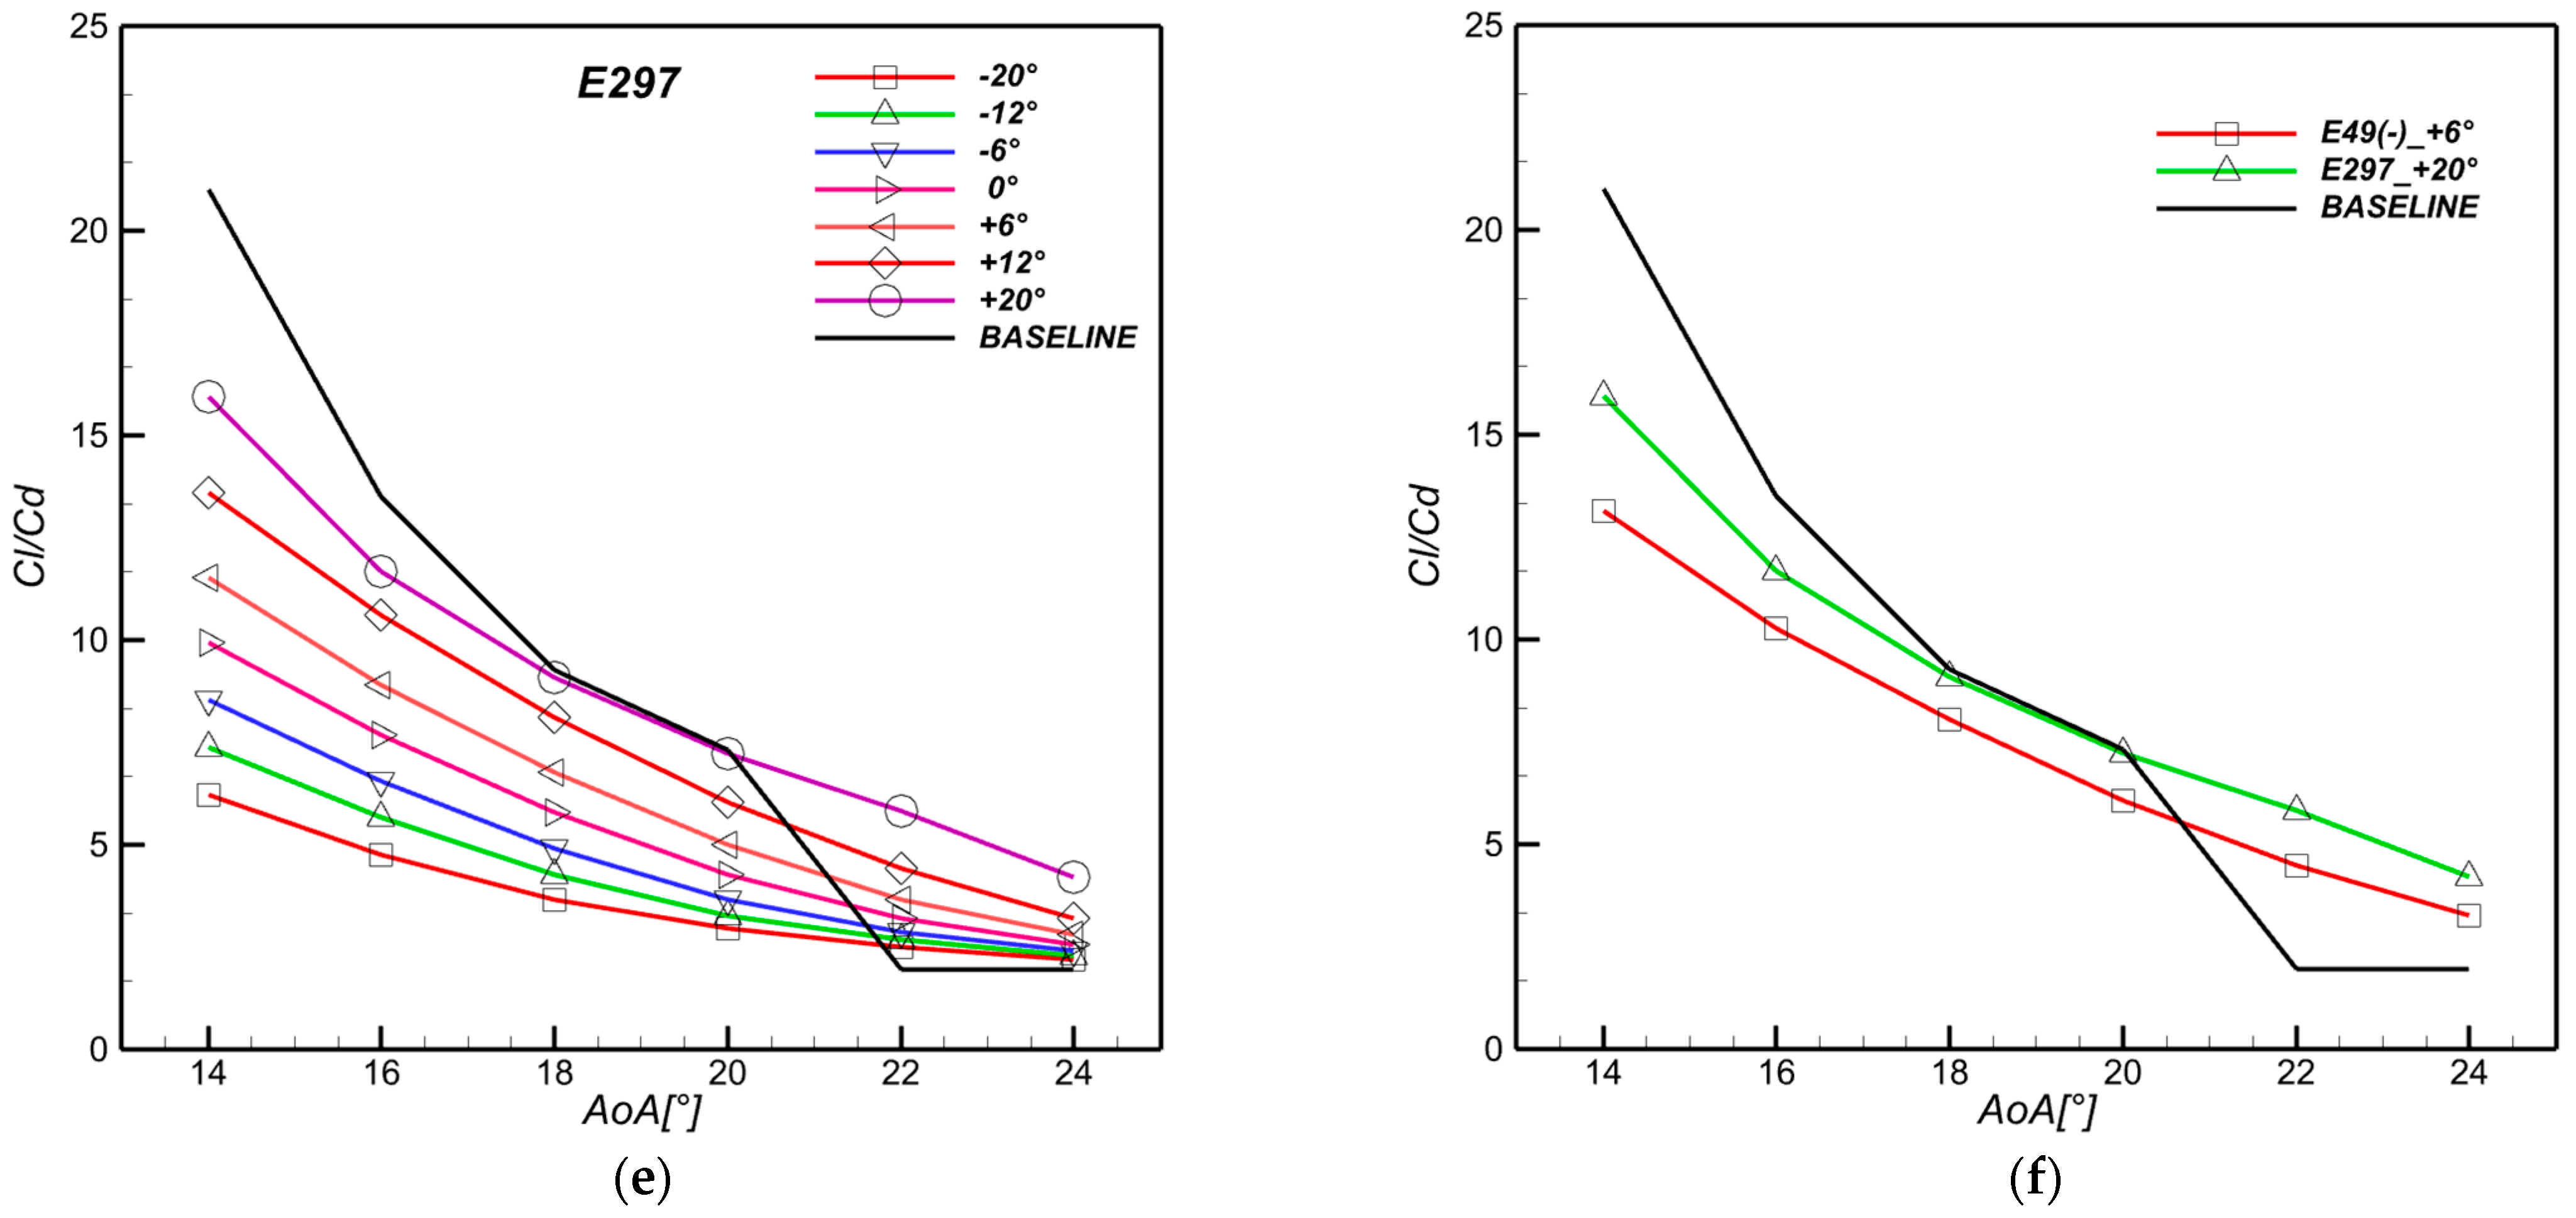
In Figure 9, the negative inclination angles are distinctively inferior to symmetric and positive inclination slat angles for E49(-). For all AoAs, the lowest lift and highest drag values are associated with the most inclined slat profile −20°. Values of lift and drag ameliorate as the inclination angles increase toward positive, reaching the overall highest lift values for E49(-)_+6° at all ranges of AoAs with an exception for E49(-)_+12° lift peak at AoA = 22°. Regarding the drag coefficient, the lowest values are attributed to E49(-)_+20°. This can be attributed to a smoother flow as AoAs increase considering the (nose down) position, while negative angles oppose higher resistance to fluid flow and induce a slat stall. Simultaneously, lift values drop dramatically for E49(-)_12° and 20° beyond AoA = 22°.
In the case of E297, the superiority of positive slat inclination angles is repeated. Although the highest lift values are recorded for E297_12° at AoAs ≤ 20°, E297_20° surpasses the latter for higher AoAs. Simultaneously, drag values for E297_20° are the lowest for all AoAs. Since flow separation is most severe at higher AoAs, the E297_20° is favored, and its lift-over-drag ratio values are far superior to the other inclination angles.
To sort out the optimal slat profile, the overall proficient configurations, E49(-)_+6° and E297_20° lift, drag and lift over drag, are compared. The E297 lift-over-drag ratio is superior for all AoAs compared to the E49(-)_+6°, while it only ameliorates performances for AoA ≥ 20° compared to the baseline. This is attributed to the pressure drag generated by the slat body, which is a performance penalty despite the lift improvement.
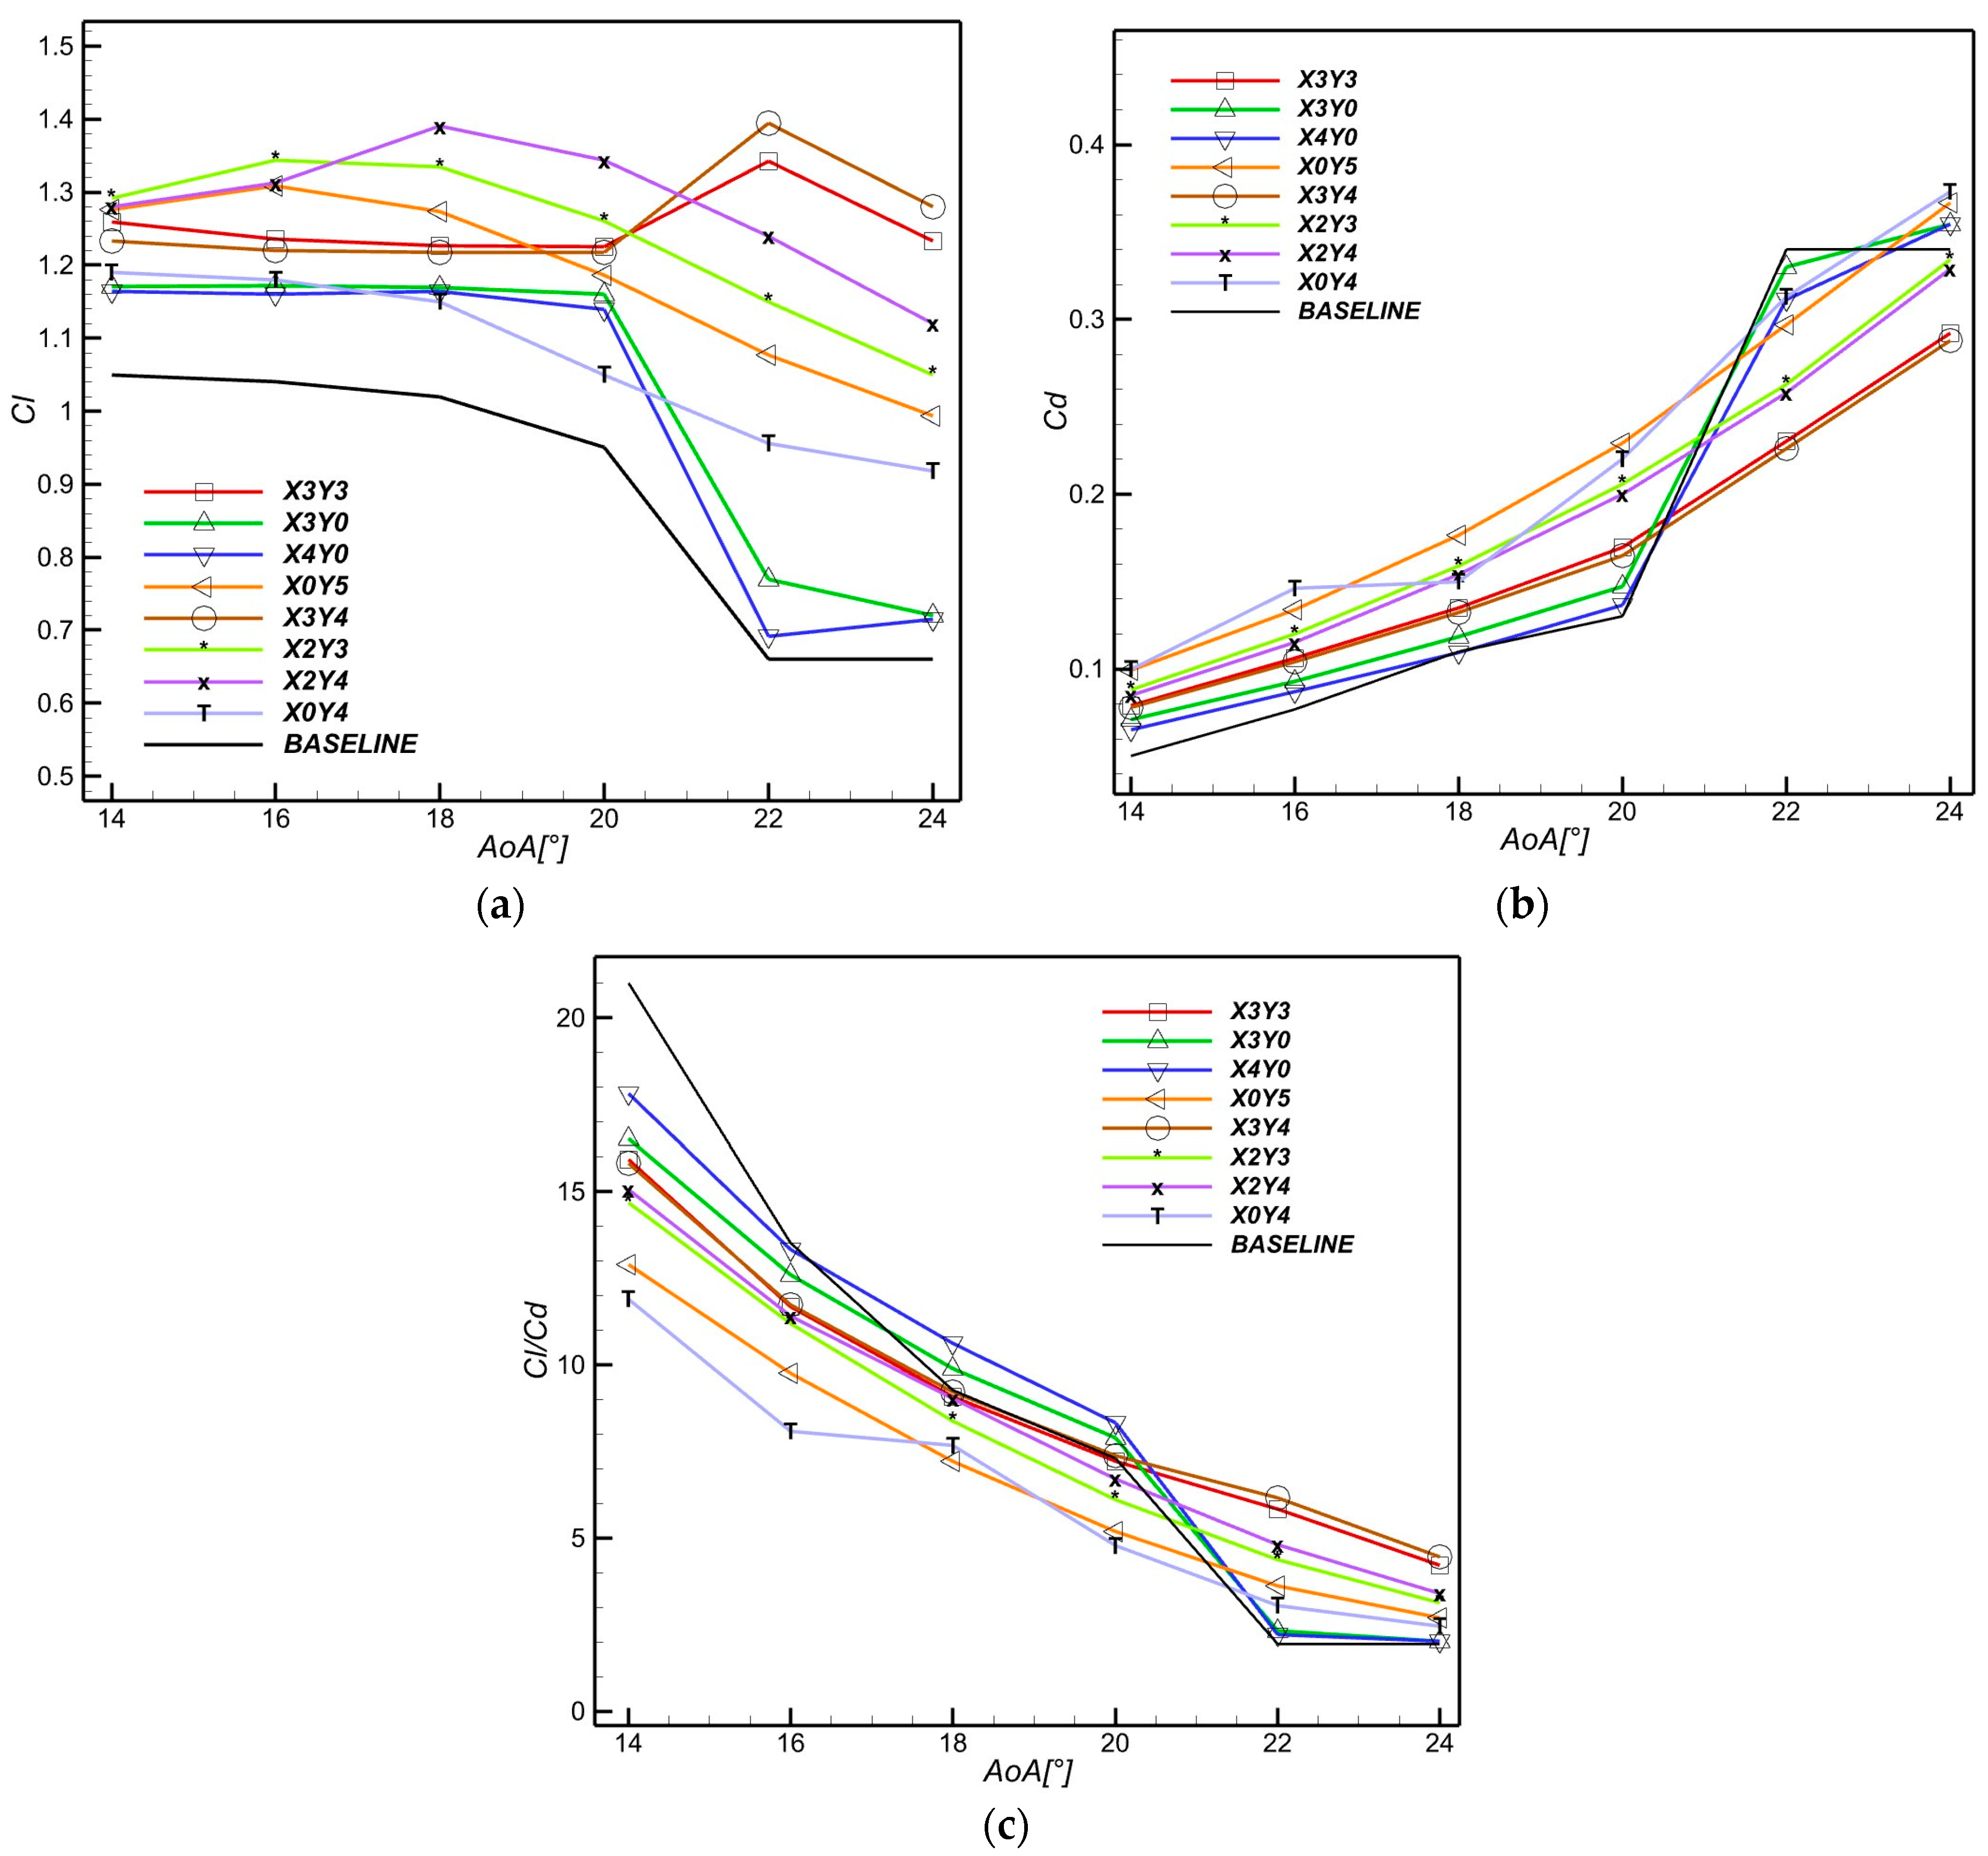
At this stage, the slat chord length, inclination angle, and profile are validated for the X3Y3 position. The variation in slat position relative to the airfoil leading edge is considered to assess its influence on overall performances and validate the optimal configuration. The distribution of explored slat positions follows a quadrilateral grid arrangement on the near leading-edge upper quarter area (vertical positions under airfoil chord line (y < 0) are neglected as judged less efficient in flow control [72]), as depicted in Figure 10. Eleven positions are simulated. Values of lift, drag, and lift over drag are compared with X3Y3 in Figure 11; however, a reduced number of positions are displayed. It is noteworthy that additional positions have been simulated but not represented in Figure 11. However, the results are close due to the range of variation and, thus, not included here for brevity and to avoid redundancy.
Keeping the slat inclination angle at 20°, the various positions behave differently as AoAs grow. Firstly, the lift coefficient values for all slat positions at all the studied AoAs are superior to the baseline configuration. This confirms the positive effect of slat introduction for lift improvement. Secondly, when all the studied positions are compared, we notice two groups of slat positions that can be differentiated by lift enhancement, which depends on AoAs. For AoAs ≤ 20°, almost all position lift curves sustain either a growing trend or a gradual decrease. For AoAs > 20, the distinction is more clear, and the least performant positions witness an abrupt decrease in lift, especially for (X4Y0, X3Y0, X4Y5, X4Y3), reaching the lowest values at AoA = 24°, whereas (X0Y4 and X0Y5) gradually decrease after attaining maximum lift at AoA = 16°. The most performant remaining positions reveal a more stable lift curve with maximum values reaching up to 111% at AoA = 22° for X3Y4. For AoAs = 22° and 24°, only the X3Y4 position surpasses X3Y3 with peak values. The impact over drag is directly observed in lift-over-drag curves, as high drag mitigates values of performant positions. Regarding lift over drag, X3Y4 and X3Y5 show the highest values at AoA = 22° and 24° with a slight superiority for X3Y4 at AoA = 22°.
Maintaining high lift values and delaying stall angle at such critical angles puts X3Y4 forward as the optimal position. Overall, the effectiveness observed for various positions could be attributed to the variation in the influential mechanisms and the slat/airfoil interaction that changes with the slat position. As such, changes in the slat trailing edge/airfoil leading-edge gap and further horizontal or vertical slat positions have less influence over the airfoil. When the slat and airfoil are colinear, performance is lowest. Finally, E297_5c_+20°_X3Y4 is chosen as the optimal configuration for the remainder of this study.

3.1.2. Pressure Contours and Velocity Streamlines

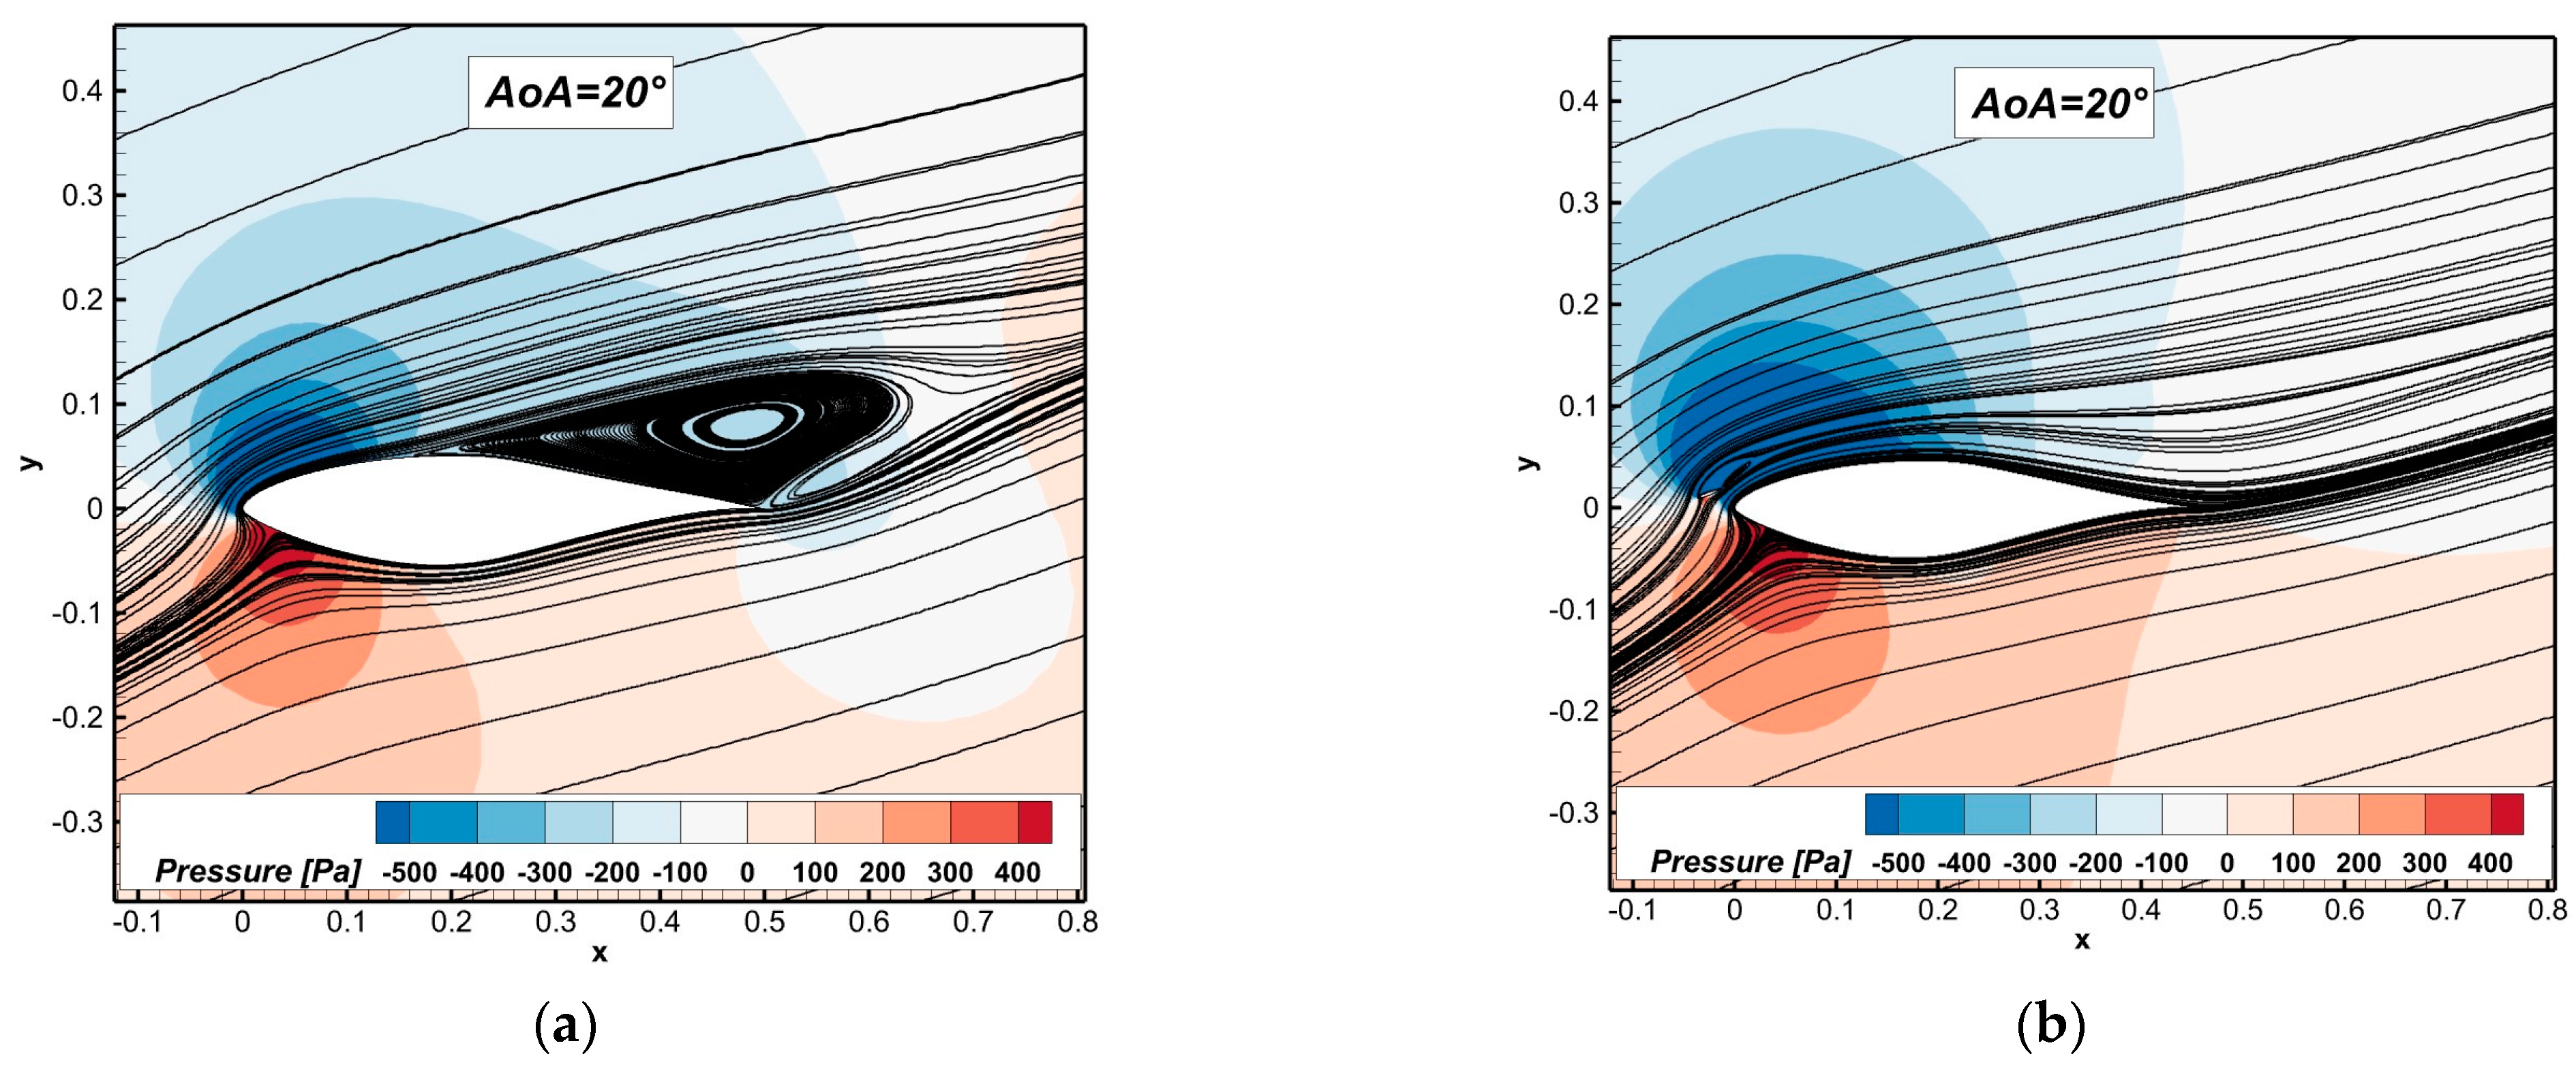
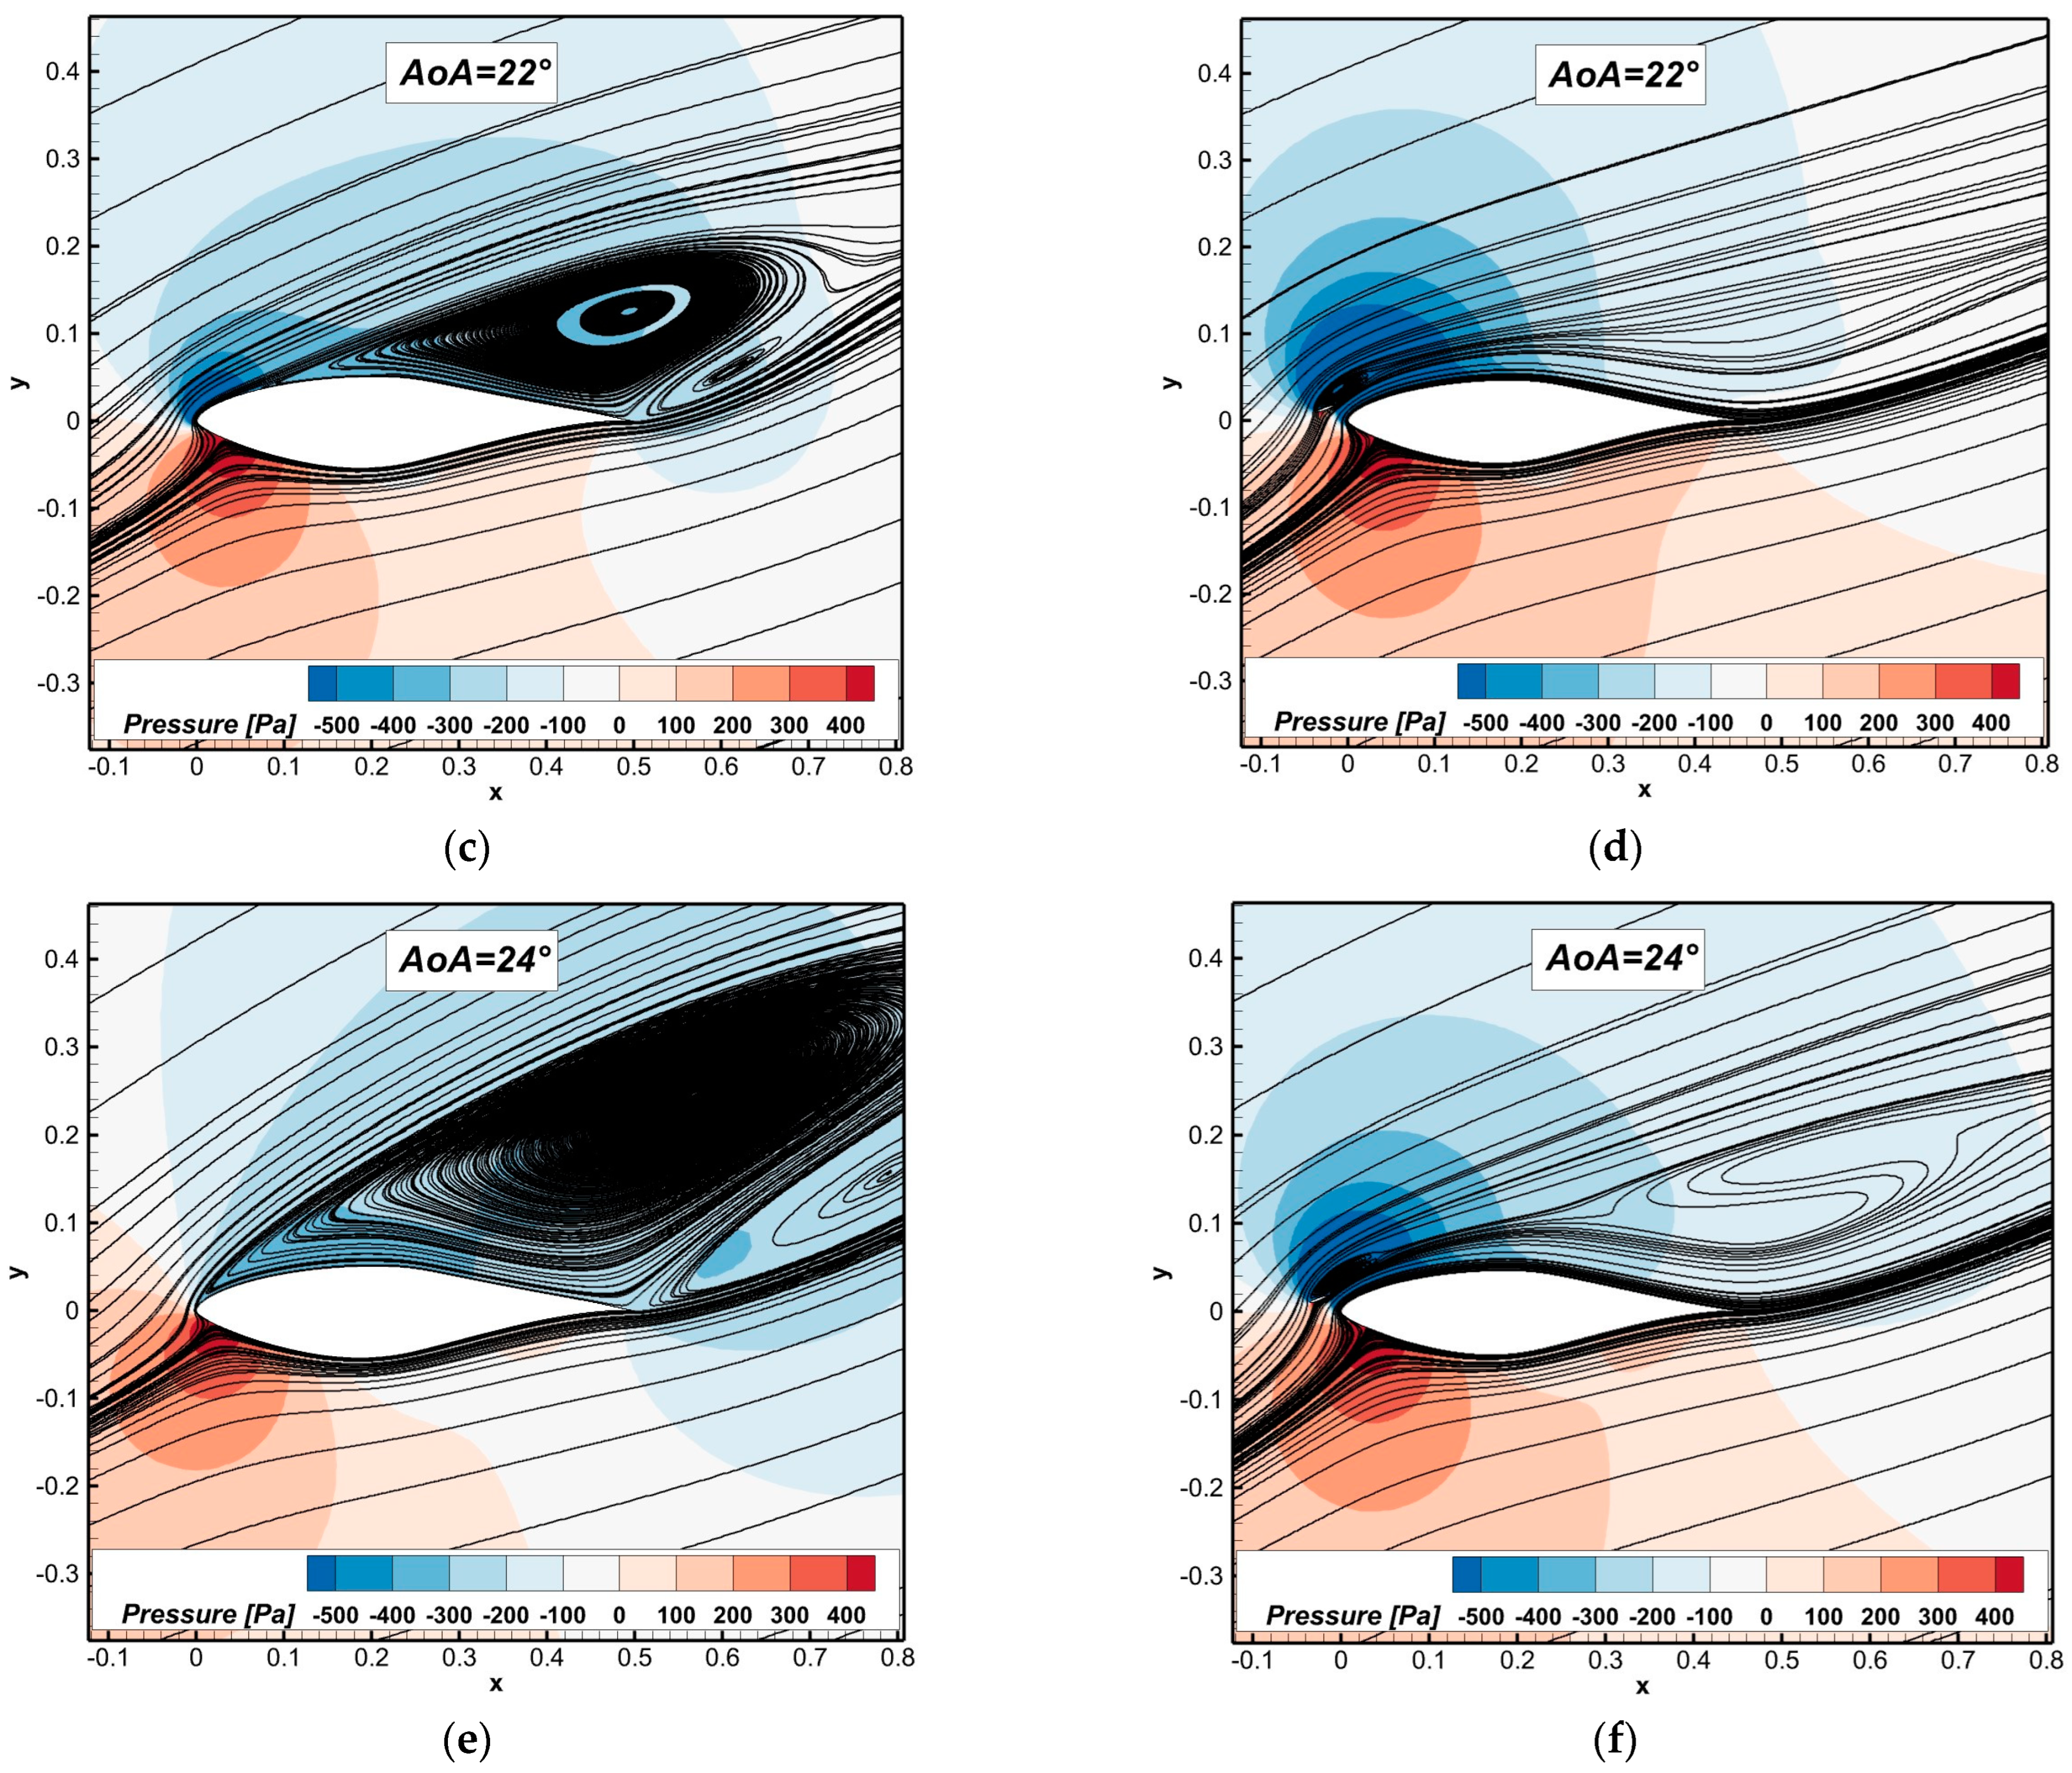
The impact of the optimal configuration on flow separation control is clearly illustrated in Figure 12. The focus was directed toward critical higher AoAs where the slat efficiency is evaluated, namely AoA = 20°, 22°, and 24°. Regarding velocity streamlines around the baseline main element, we notice that the recirculation region reached almost half a chord at AoA = 20° and grew until entirely detached from the airfoil surface suction side. In the slat case, the fluid streamlines appear fully attached to the airfoil suction side, as no flow detachment is observable for all high AoAs. This can be analyzed in parallel by the pressure distribution around the airfoil induced by the introduction of the slat. The slat optimal configuration has modified the topology of the pressure at the leading edge, creating a larger depression zone than the baseline. Moreover, the pressure behavior over the airfoil suction surface appears more stable in the slat case than the baseline, especially at AoA = 24°, where the sizeable separation bubble is synonymous with adjacent high- and low-pressure zones. The fluid velocity increment at the front assists the fluid in overcoming the airfoil curvature-induced adverse pressure gradient and surface shear.
The high depression peak in pressure corresponds to the blue zone at the leading edge in Figure 12, and the slat case fluid acceleration is clearly superior. Moreover, the pressure recovery curve after the leading-edge peak is smoother and higher for the slat case, which explains the stable pressure behavior and the successful separation control illustrated in velocity streamlines.

3.2. Three-Dimensional Aerodynamic and Aeroacoustic Study

This section exploits the previously chosen optimal slat configuration to analyze three-dimensional aerodynamic and aeroacoustic effects compared to the baseline. The turbulence around the slat and main body is discussed to elucidate the amelioration in performances and eddies topology via Q-criterion. In addition, sound amplitudes at receivers and directivity patterns are compared for frequency spectra.

3.2.1. Grid Requirements for LES

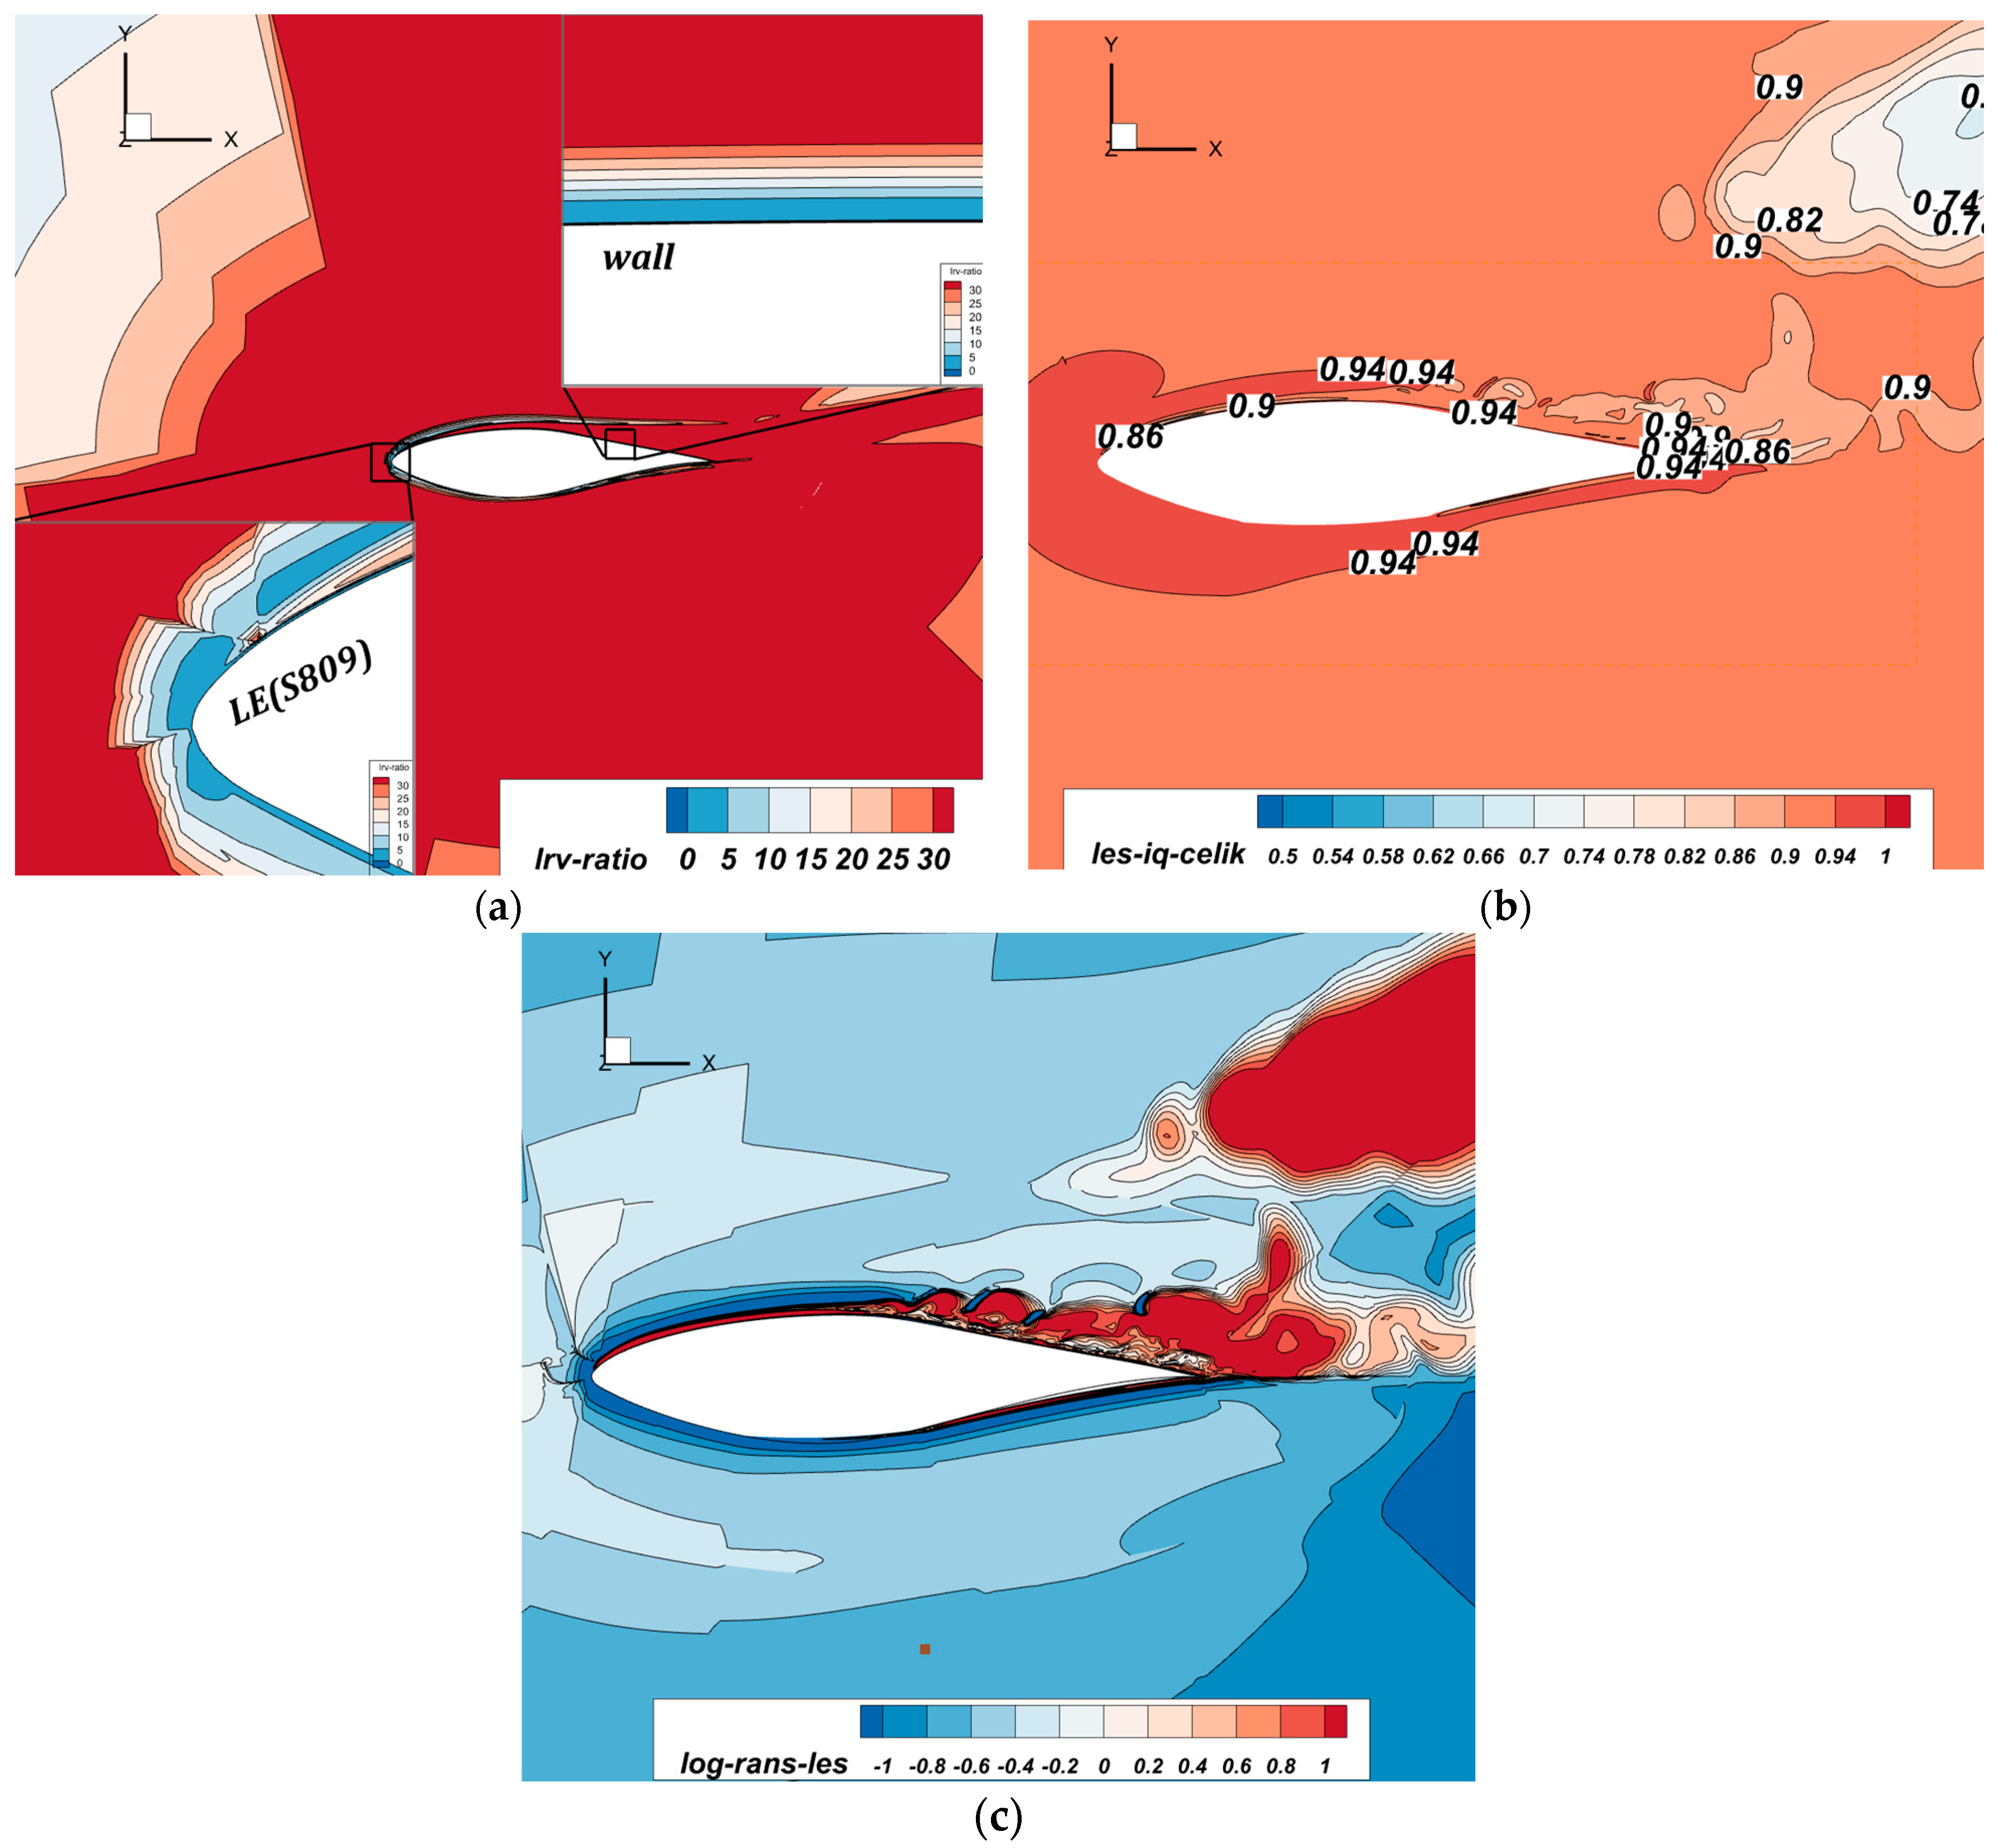
Although different in formulation, LES grid assessment criteria are based on estimating the amount of the resolved turbulence by the mesh resolution. The latter should be able to capture large turbulent structures containing most of the turbulent energy and Reynolds stresses responsible for broadband noise emission. Verifying grid resolution indices is undertaken to ensure the compatibility of the designed mesh with LES requirements. The Lrv ratio [23] and LES_IQ index [46] distribution contours are depicted in Figure 13a,b, respectively. Here, Lrv = LK-ω SST/Vcell1/3, where Vcell is the cell volume. Values of Lrv above 10 are considered satisfactory. This indicates a minimum of cells to resolve the RANS model-specific turbulent length scale. The detailed view of the near leading edge and suction surface trailing edge clearly shows the gradual distribution of the Lrv_ratio from the near-wall RANS-treated region until satisfactory values are reached away from the wall. The chosen LES_IQ index formulation is based on the effective viscosity ratio as follows υ t , e f f υ : IQLES,υ = 1 1 + α υ ( υ t , e f f υ ) n , where α υ = 0.05 and n = 0.53 ,   υ t , e f f   are the sums of the molecular and eddy viscosity. An acceptable IQLES,υ value range of 0.8 and above is needed to resolve LES structures.
In Figure 13b, we can observe that this condition is met for zones near the leading edge, while the lowest value of IQLES,υ near the detached trailing edge eddies is around 0.86. In Figure 13c, the ratio defined by A = Log(LK-ω SST/CDESΔ) shows the distribution of zones treated with RANS and LES. Positive values in red (detached eddies) represent LES-treated zones, and negative values represent RANS-treated zones. The aforementioned satisfactory criteria consolidate the validity of the adopted mesh in capturing the turbulent structures near the zone of separation.

3.2.2. Aerodynamic Analysis and Surface Flow Topology

In Figure 14, informative features on the eddies structure and development over the slat and main element are displayed by instantaneous Q criterion isosurfaces. The contours are colored by averaged velocity magnitude to identify energetic flow zones. AoA = 16° is used in the rest of this study. It is observed that the slat modifies the unsteady turbulence shedding. The leading-edge region accelerated fluid is visible in both controlled and uncontrolled cases. For the baseline, a low-speed region eddy is observable near the airfoil leading-edge wall, suggesting the formation of a small separation bubble, while flow appears attached at the slat/leading-edge gap. This observation was impossible in the two-dimensional studies due to the model precision and mesh density.
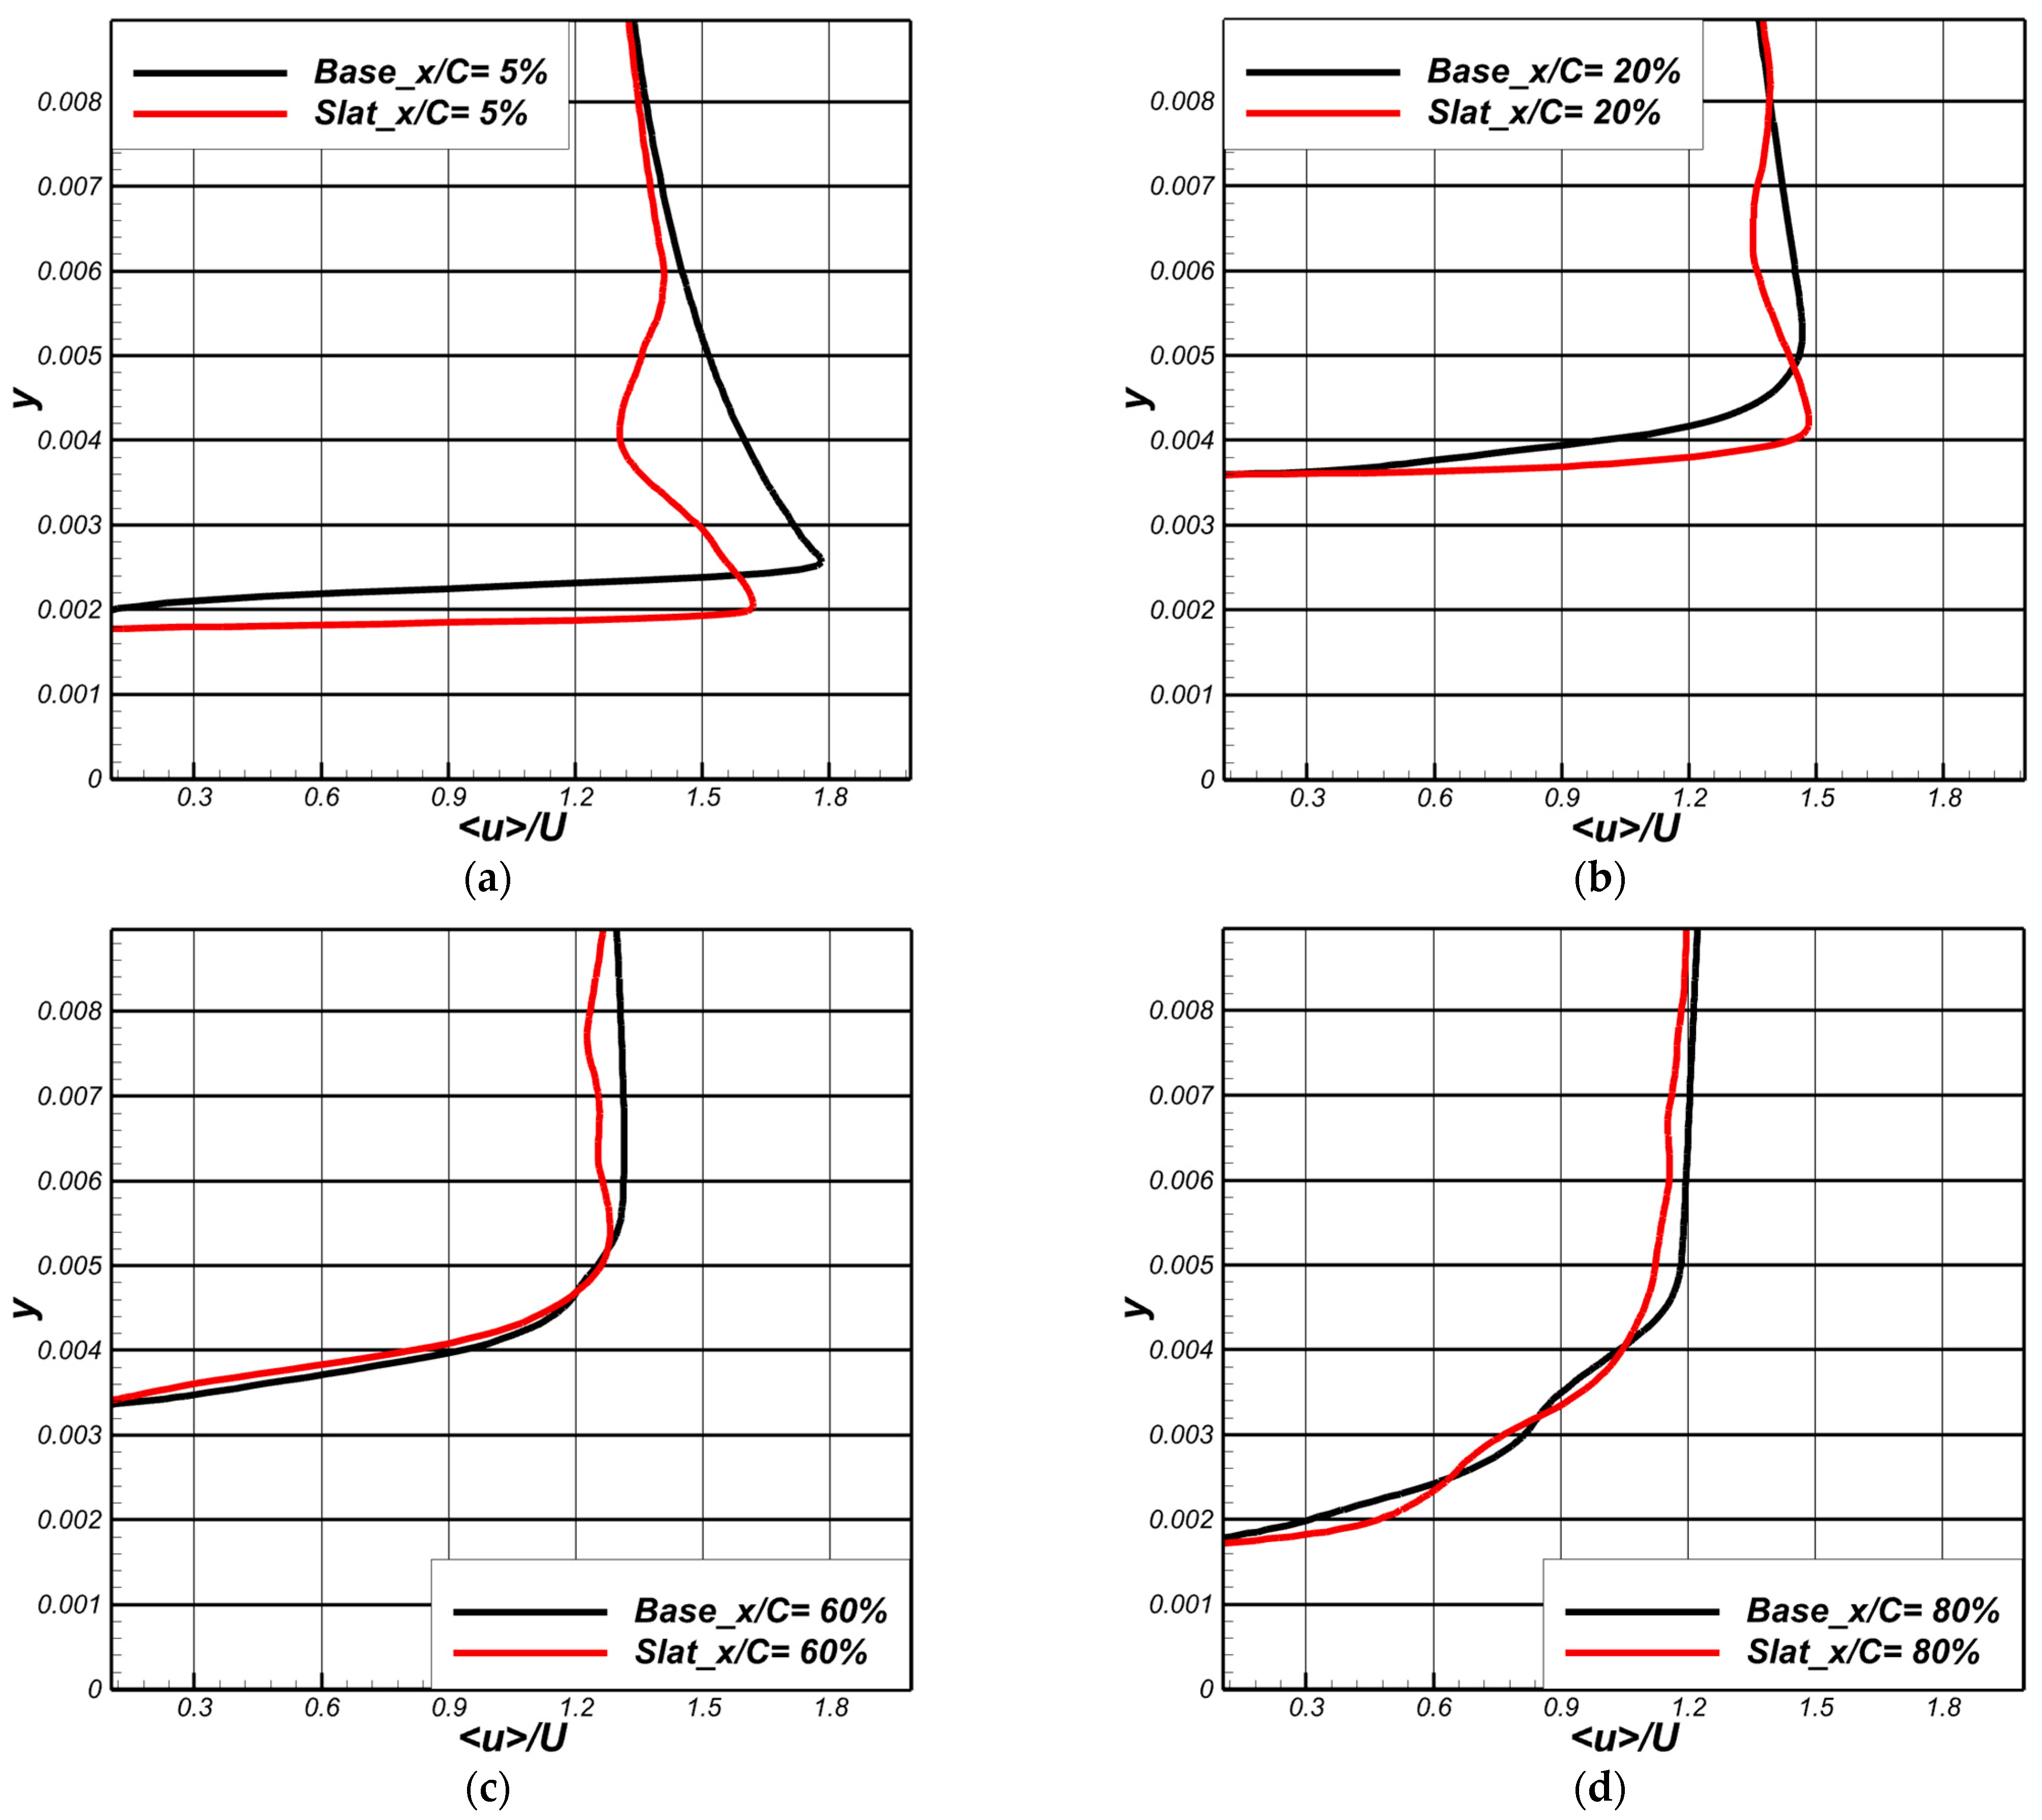
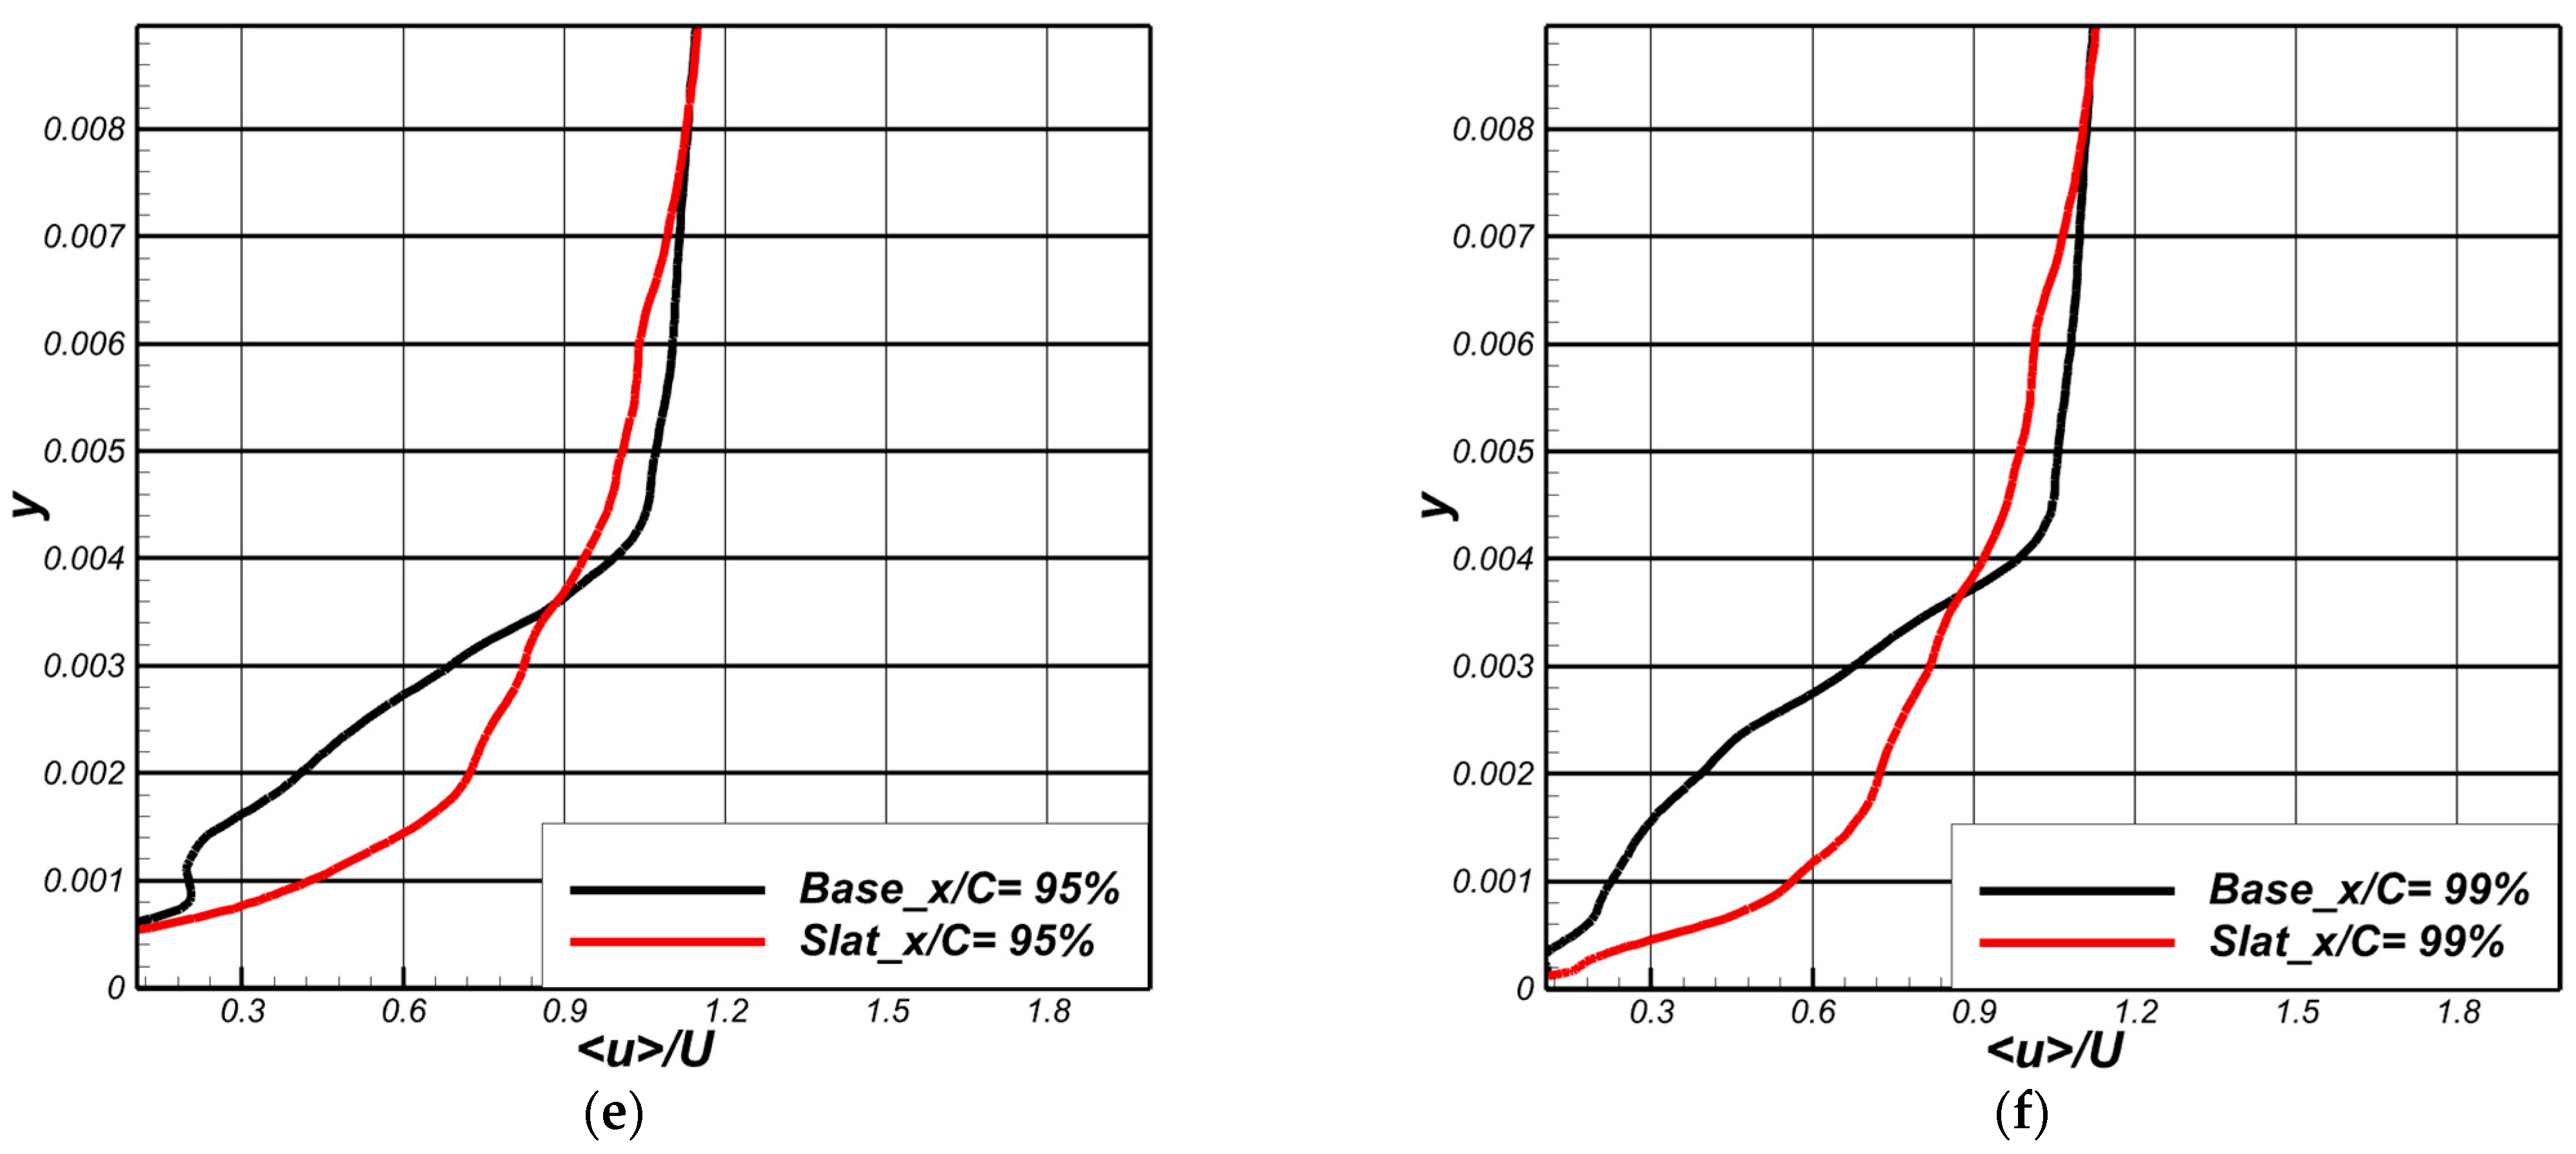
In parallel, both cases typically display deflected tip vortices, whereas near-wall fluid velocity is lower for the baseline over the suction surface, and the upper part of the eddies has a higher velocity. The slat modifies the shed trailing edge turbulence, and slat wake eddies are directly projected over the airfoil suction side and do not interact with the main element’s pressure side due to its position. Moreover, most of the turbulent structures over the airfoil suction side originate from the slat. The convection of the slat’s suction side eddies over the airfoil allows kinetic energy transfer over the main element’s low-energy eddies, partly overcoming the adverse pressure gradient and surface shear. The slat’s presence contributes to modifying the eddies structure over the airfoil suction side as they appear to be more energetic with less curl. The fluid velocity is higher in the close-wall region over almost the whole streamwise suction surface. These results agree with the near-wall velocity profiles of Figure 15.
The time-averaged velocity near the airfoil suction side wall is collected at six stations (x/C = 5, 20, 60, 80, 95, and 99%) to analyze the slat influence over the main element’s boundary layer velocity compared to the baseline. Between x/C = 20% and x/C = 80, we notice that the near-wall velocity of both cases is almost indistinguishable only for a slight superiority of the slat at x/C = 20%. At x/C = 5, 20% higher average velocity is observed close to the wall for the slat case due to the converging-shaped gap between the slat and airfoil leading edge, contributing to fluid acceleration. The trailing edge region is of utmost importance as fluid tends to decelerate, and the diminishing kinetic energy is attributed to the combined effect of shear and adverse pressure gradient. For 80% ≤ x/C ≤ 99%, the effect of the slat case displays higher average fluid velocity than the baseline near the trailing edge; thus, it is more efficient in controlling separation.
A higher level of skin friction characterizes the turbulent boundary layer due to the streamwise vortices’ interaction near the wall. Enhanced momentum transport in the wall normal direction by turbulent mixing is a salient feature of the turbulent boundary layer and produces more shear. Skin friction is important in boundary layer thickness, transition, and separation studies.
Under adverse pressure gradients, the kinetic energy of streamwise flow over airfoil suction surface curvature is diminished as fluid particles advance toward the trailing edge. This reduces skin friction in regions of very low adherence to the surface, approaching null values for fully separated flows.
Thus, skin friction magnitude contours over the blade suction side are exploited in Figure 16 to identify the extent of transitional and separated/reattachment regions and to understand turbulent boundary layer interaction with the suction surface wall. A gradual but dispersed pattern of anticipated streamwise diminishing skin friction is observed. High skin friction coefficient zones between mid-chord and leading edge are observed for baseline and slat case airfoil suction surfaces. This is following the developed eddies observed in Figure 14. An airfoil tip vortex impact is visible for the baseline case, while the distribution of the skin friction coefficient is somewhat balanced and extends further away to reach approximately mid-chord over the suction side of the main element in the slat case.
The slat convected streamwise vortices for the trailing edge region allow for a relatively higher skin friction coefficient than the baseline case. Velocity gradients can be utilized to identify low adherence and separated regions precisely as negative gradient values indicate flow reversal beyond a point of inflection under adverse pressure gradients where flow transitions to turbulence. In Figure 17, velocity gradients are plotted over the airfoil suction side for both baseline and slatted cases at the midspan location to locate separated regions. Firstly, notable peaks of negative and positive velocity gradients for the baseline case can be attributed to the development of leading-edge vortices, while the slat/airfoil leading-edge gap accelerated flow allows for the smooth out of the flow. For the slat case, the flow is stable and attached from the leading edge to over x/C = 0.6. Afterward, a separation peak occurs, and flow reattachment is observed for 0.7 ≤ x/C ≤ 0.9. The baseline case experiences irregular attachment/detachment peaks. Overall, this reveals the slat’s positive influence over boundary layer attachment under the sustainable energized flow transferred from the slat wake to the weakened boundary layer.

3.2.3. Aeroacoustic Analysis

Validation of Acoustic Results

The numerical estimation of long-span airfoil far-field acoustics is prohibitive due to its high cost. To validate the acoustic results of the simulated span length Ls used in this study with the results of [28], a correction method by [73] is used due to the span length difference. The intuitive conception of statistical averaging or summing of simulated span pressure fluctuation to match the targeted span can be erroneous, as discussed by [74]. Refs. [75,76] have successfully implemented the [73] correction method in their two-dimensional source correlation with 3D experimental results via the following formula:
S P L corr   =   Span   corr   +   Dist   corr   = 10 l o g 10 t a n 1 S 0 r e , 0 + s i n 2 t a n 1 s 0 / r e 0 2 t a n 1 S 1 r e , 0 + s i n 2 t a n 1 s 1 / r e 2 + 20 l o g 10 r e , 1 / r e , 0
This formula considers span and receiver position correction where S0 = simulated span length, S1 = experimental span length, re,0 = receiver position in simulation, and re,1 = targeted receiver position.
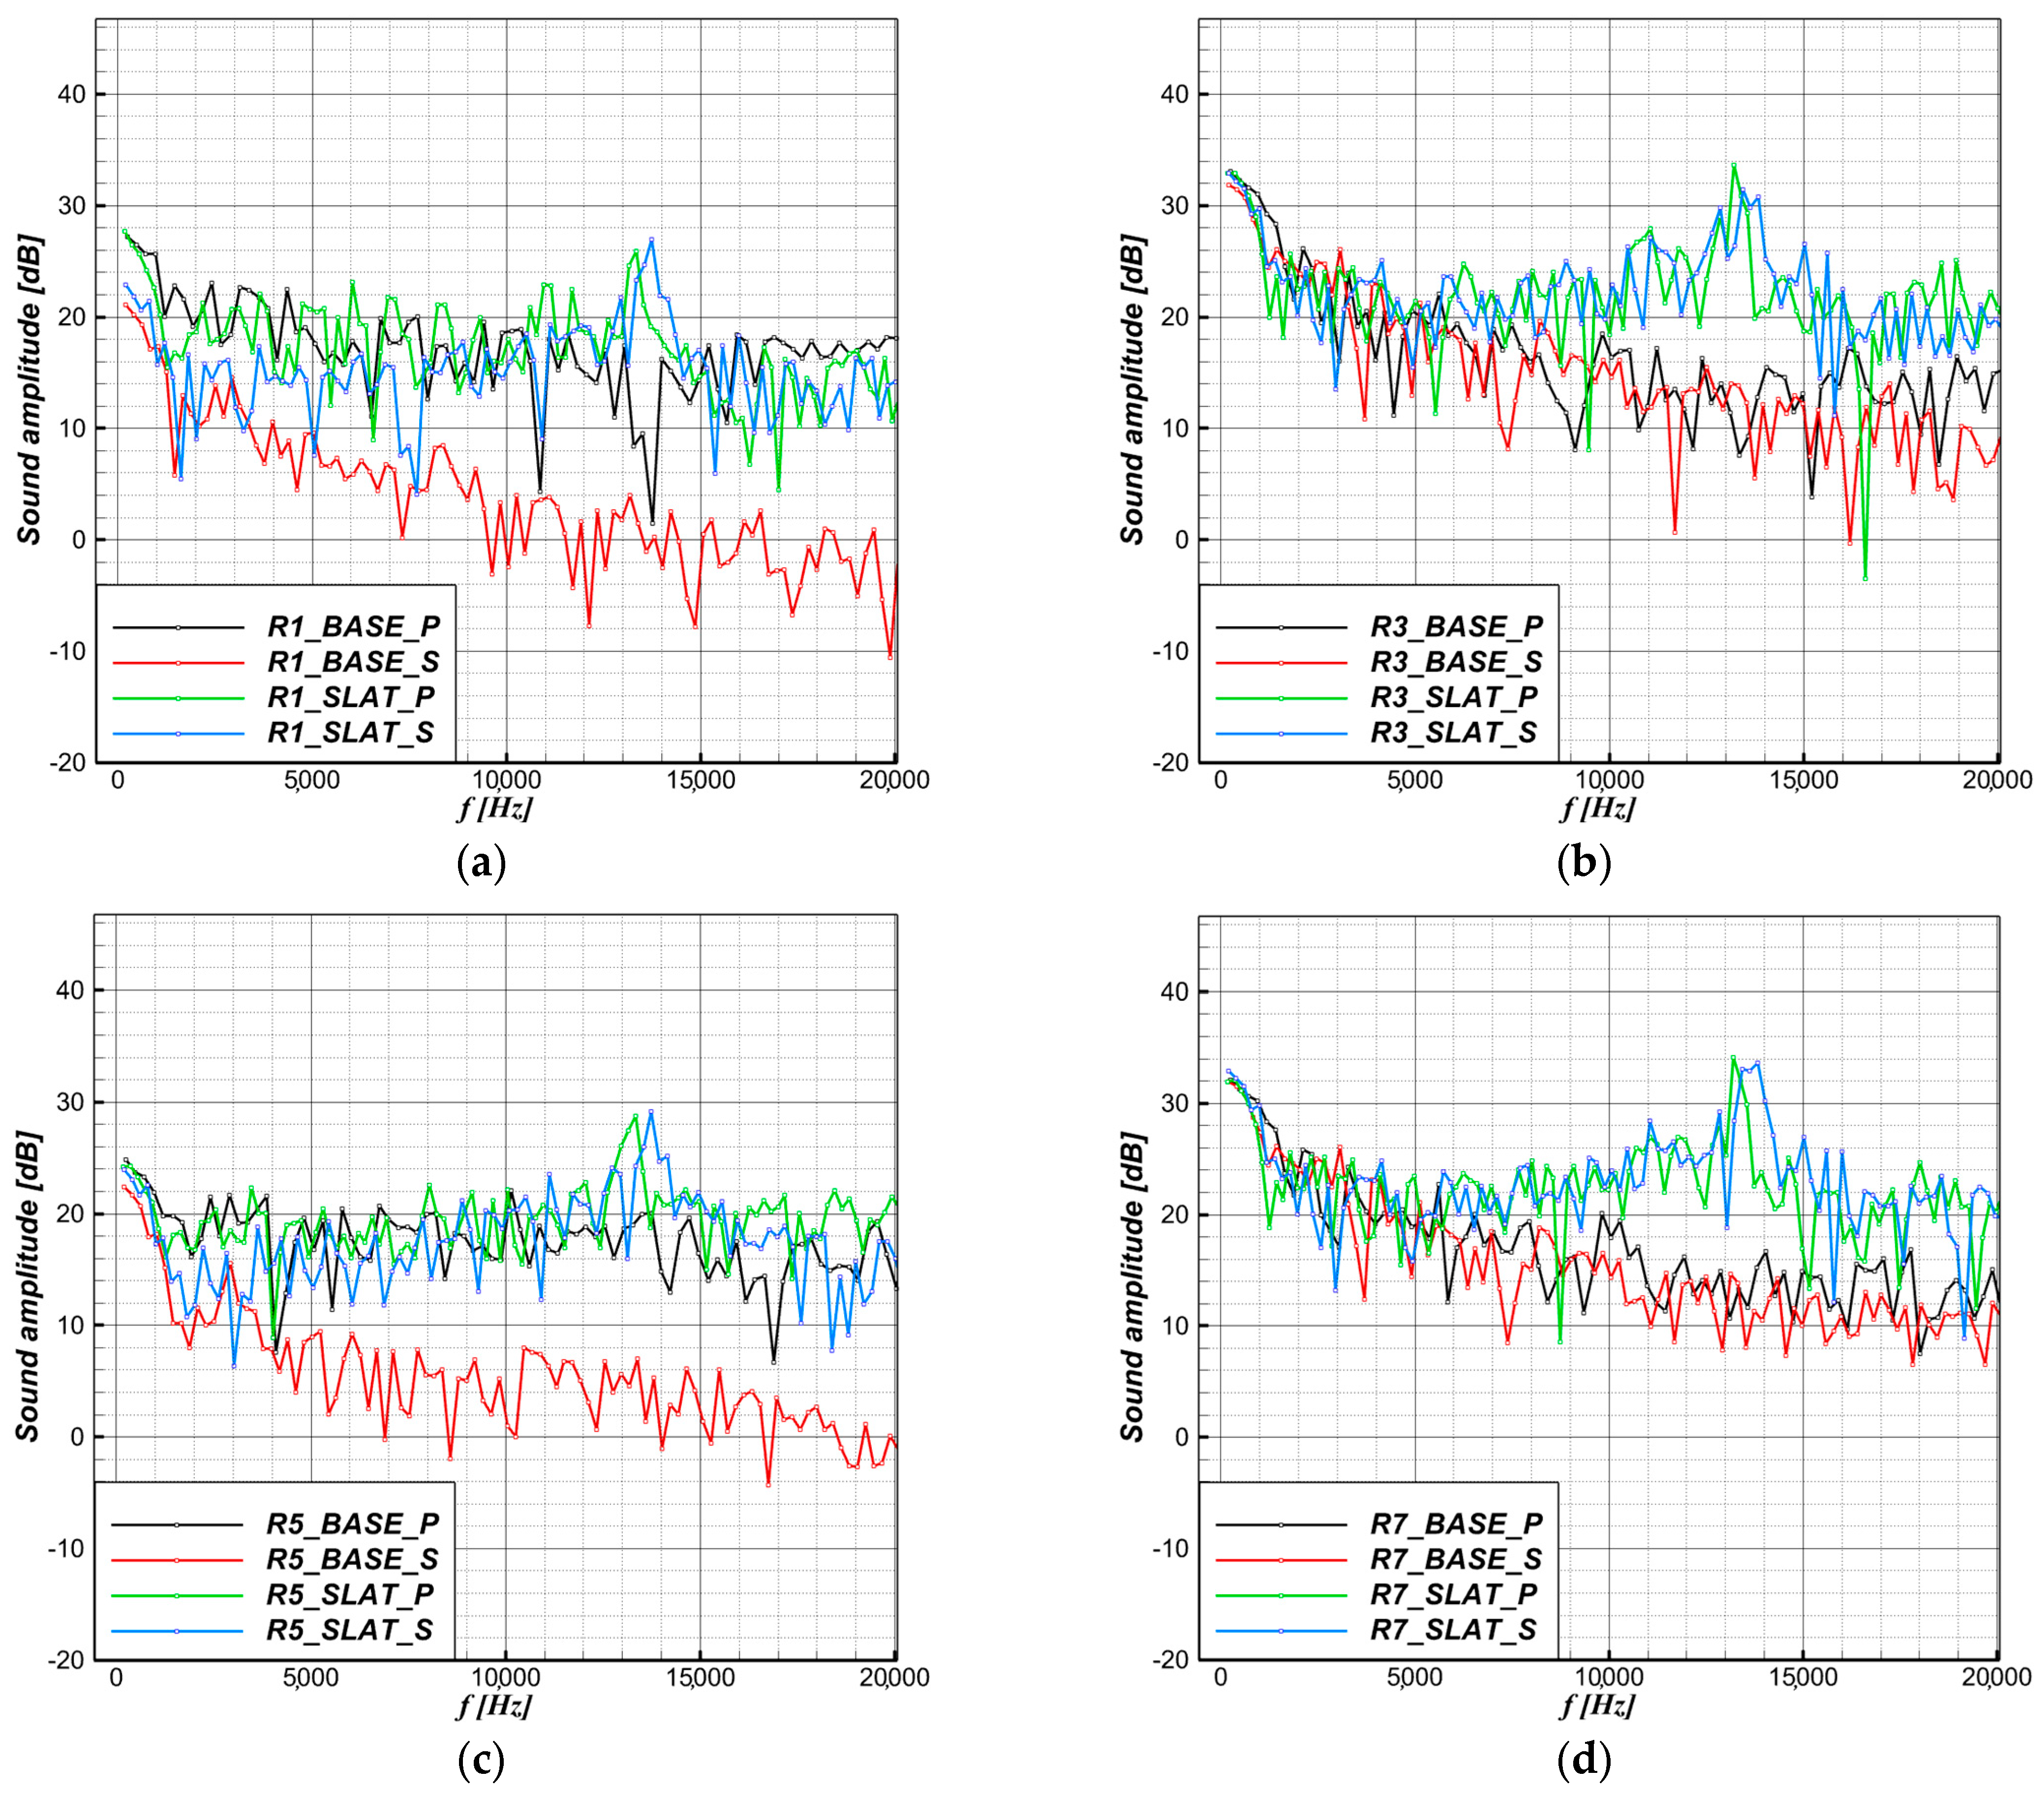
Ref. [28] estimated the average acoustic source power level of five equal blade span divisions of approximately L = 0.11 m. A circular microphone array of 1 m diameter was used, and its center was placed at 1.88 m from the turbine center in the wind direction and 1.49 m to the wind tunnel floor. The tip section (A1 in [28]) sound power level data were used to validate the corrected simulation results of this study, as shown in Figure 18. A low-frequency discrepancy is observed between the corrected results. The sound power level is overpredicted at both receiver R1 and R5 (solid-surface formulation). At the same time, peak disparities throughout the frequency range are also noticeable, which can be due to the wind blade twist and tapper that are not considered in the correction formula, as well as the rotation effects that greatly influence the turbulence structure near the blade wall. However, considering the latter effects, the correction results are overall accordingly scaled with the experimental results, and the predictive capability of the IDDES-FWH combination can be concluded.

Slat Acoustics Influence

To compare the turbulence and flow topology modification brought by the slat with the baseline for the tip segment radiated noise of the S809 12% scale model [28] at stall condition (AoA = 16°), the transient IDDES near-flow field is exploited in the FWH approaches to capture acoustic pressure perturbation at the receiver’s location.
The focus is directed towards evaluating the acoustic intensity with and without slat. Receivers’ far-field acoustic pressure for both permeable and solid surfaces is compared to evaluate the efficiency of the permeable method in capturing quadrupolar sources generated by the slat. Sound sources are characterized by sound power, a total emitted noise property [77]. As separation noise is mainly quadrupolar, noise is better identified with permeable formulation. The contribution of solid-surface sources is taken into account in the permeable formulation. The evaluation of sources’ sound is equivalent to the amplitude of acoustic transient pressure fluctuation either within the medium or located over solid surfaces. Then, FFT is applied to transform the signal from the time to the frequency domain processed using Hanning windowing with 2300 samples to a reference sound pressure level of Pref = 2 × 10⁻⁵ Pa.
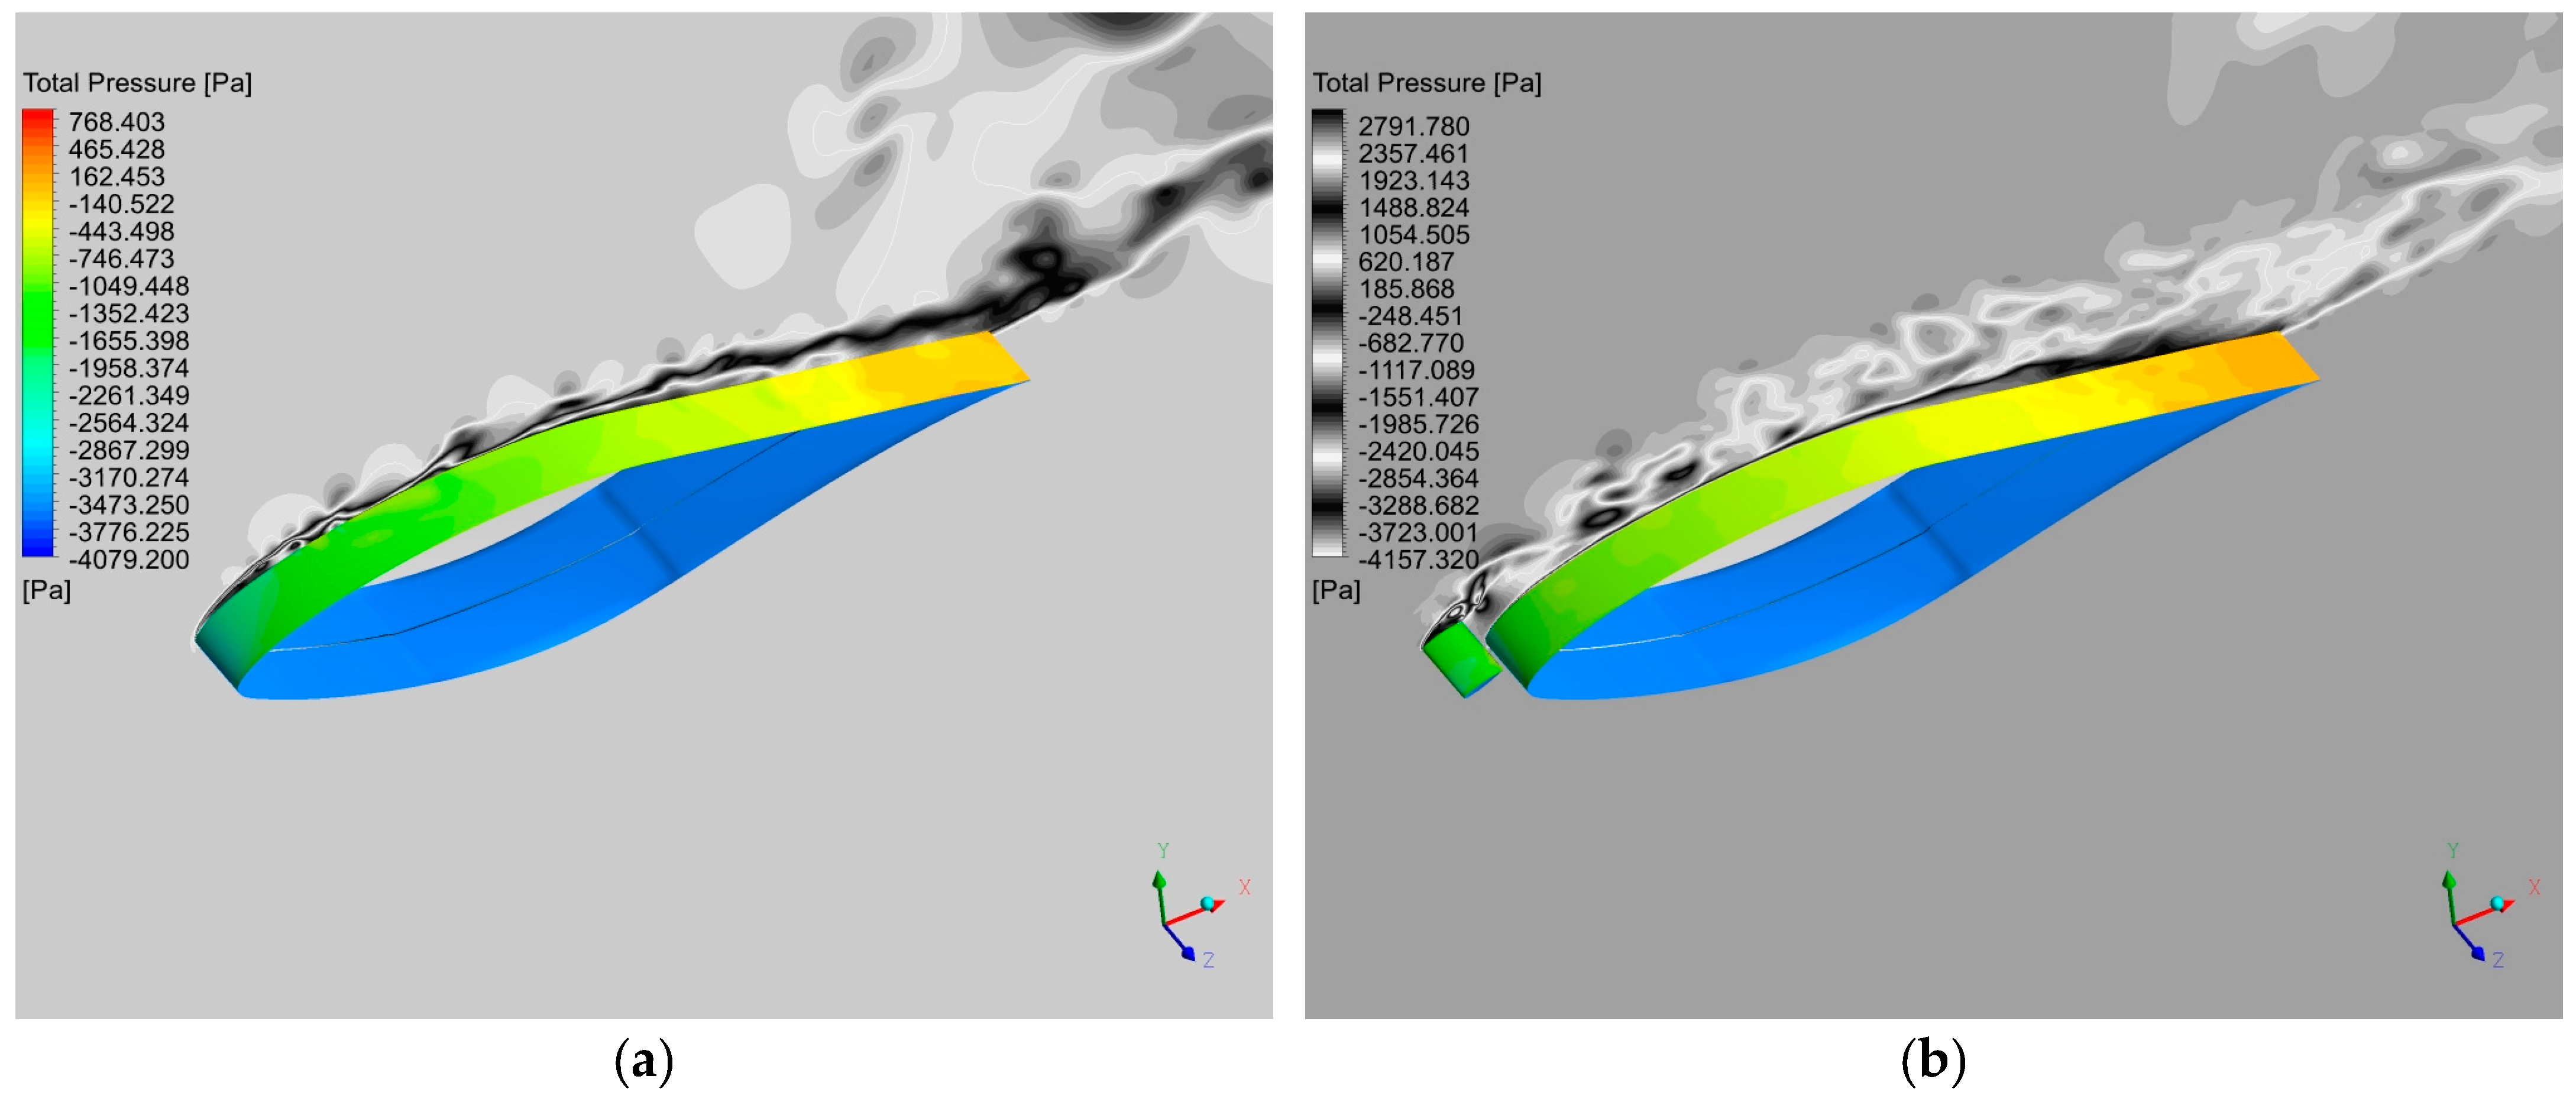
The correlation between turbulent structures identified in Figure 14 and pressure contours on the midspan plane for baseline and slat are utilized for noise sources’ interpretation in Figure 19. In both cases, the trailing edge shed vortices are distinguished. The eddies’ spatial and transient topology is modified by the slat on the leading edge of the main element due to the separated flow over the slat’s suction surface and the slat trailing edge vortices. At the same time, small recirculation zones are identified over the baseline main element suction side that convects to the mid-chord and the trailing edge. Trailing edge region near-wall separation bubbles are also observed for the baseline with an important deflected recirculation area away from the wall. The pressure/suction surface pressure difference induces important tip vortices, as seen in Figure 14. All the latter turbulence elements are expected as broadband sound sources.
In Figure 20, FWH and FWHp surface approaches are compared for fewer receivers (R1, R3, R5, and R7) to avoid redundancy due to similarity of the results. The analyzed data of sound amplitude calculated at each receiver are limited to a maximum band of 20 kHz (hearing threshold). In the remainder, the baseline and slat solid and permeable surface approaches are called Base_S, Base_P, and Slat_S, Slat_P, respectively. The difference in acoustic pressure data between the baseline and slat case is assumed due to the slat presence, and the primary intention is to unravel the slat aeroacoustic influence, including various airfoil self-noise mechanisms.
Firstly, Base_S and Slat_S yield distinctively different noise amplitudes, especially at high frequencies for all receivers, where a growing gap of approximately 10–15 dB is observed. The sound amplitude of Slat_S is inferior to Base_S at R3 and R7 for frequencies between 1.3 kHz and 3.2 kHz, while it is higher than Base_S for all other frequencies at all receivers. Additional wide-spectrum noise can be attributed to perturbation pressure input from slat solid surfaces to the radiated noise (slat tip, slat suction, and pressure surfaces), wherein quadrupolar minor contribution is scattered by aerodynamic bodies [26]. The slat noise results were highly anticipated as the off-surface device is a common noise source. Nevertheless, the solid-surface approach only considers pressure fluctuations captured over the slat and main element walls. Thus, seizing volume sources via a permeable surface approach surrounding most of the near-turbulent structure is optimal in capturing the slat aeroacoustic influence. This is the difference between solid and permeable acoustic values [26]. For Base_P and Base_S, we notice two different trends depending on the receivers. For R3 and R7, the sound level augmentation for Base_P is not entirely distinguishable. However, a slight discrepancy is captured for frequencies ≤ 1.5 kHz and discrete peaks observed over the whole spectra.
Meanwhile, for R1 and R5, a visible gap exists, reaching up to approximately 18 dB between Base_S and Base_P. The latter observation suggests a directivity pattern of baseline-radiated noise captured by the permeable surface and highlights the efficiency of the permeable approach in capturing additional noise. In parallel, the Slat_S and Slat_P values almost coincide for R3 and R7, while the same observation for baseline cases is repeated for R1 and R5 as Slat_P amplitudes are slightly superior for a wide range of frequencies. The amplitude difference between Slat_S and Slat_P is minor compared to the baseline, and distinctive tonal peaks are observed at frequencies between 1.3 kHz and 1.4 kHz for both cases. The gap between Base_S and Base_P is most visible at R1 and R5 for a broad-spectrum range while being not distinctively observable for Slat_S and Slat_P. One plausible explanation for the gap between Slat_P and Slat_S approaches could be attributed to the permeable surface extent, which does not include all the shed turbulence that yields a missing amount of broadband noise shed outside the permeable surface. It is noteworthy to mention the risk of amplitude peak alteration due to permeable surface and shed turbulence interaction that cannot be ignored.
Finally, the comparison between Base_P and Slat_P amplitudes is attributed to the slat effect, i.e., flow separation control and turbulence enhancement. At low frequencies, we observe slightly higher amplitudes for Base_P than Slat_P, and then values fluctuate for higher frequencies, especially for R1 and R5, while R3 and R7 show distinctively higher sound amplitudes for Slat_P.
The slat-generated vortices induce high-frequency noise, while the baseline larger eddies predominate as a source of low-frequency noise [78]. This premise can be partially accepted as a plausible interpretation of previous results because noise purely radiated from eddies is considered too low compared to turbulent boundary layer–trailing edge noise at low-Mach-number flows [79]. Thus, the turbulent boundary layer eddies interaction with the slat and main element trailing edge for both cases substantially contribute to the overall noise spectra.

Directivity

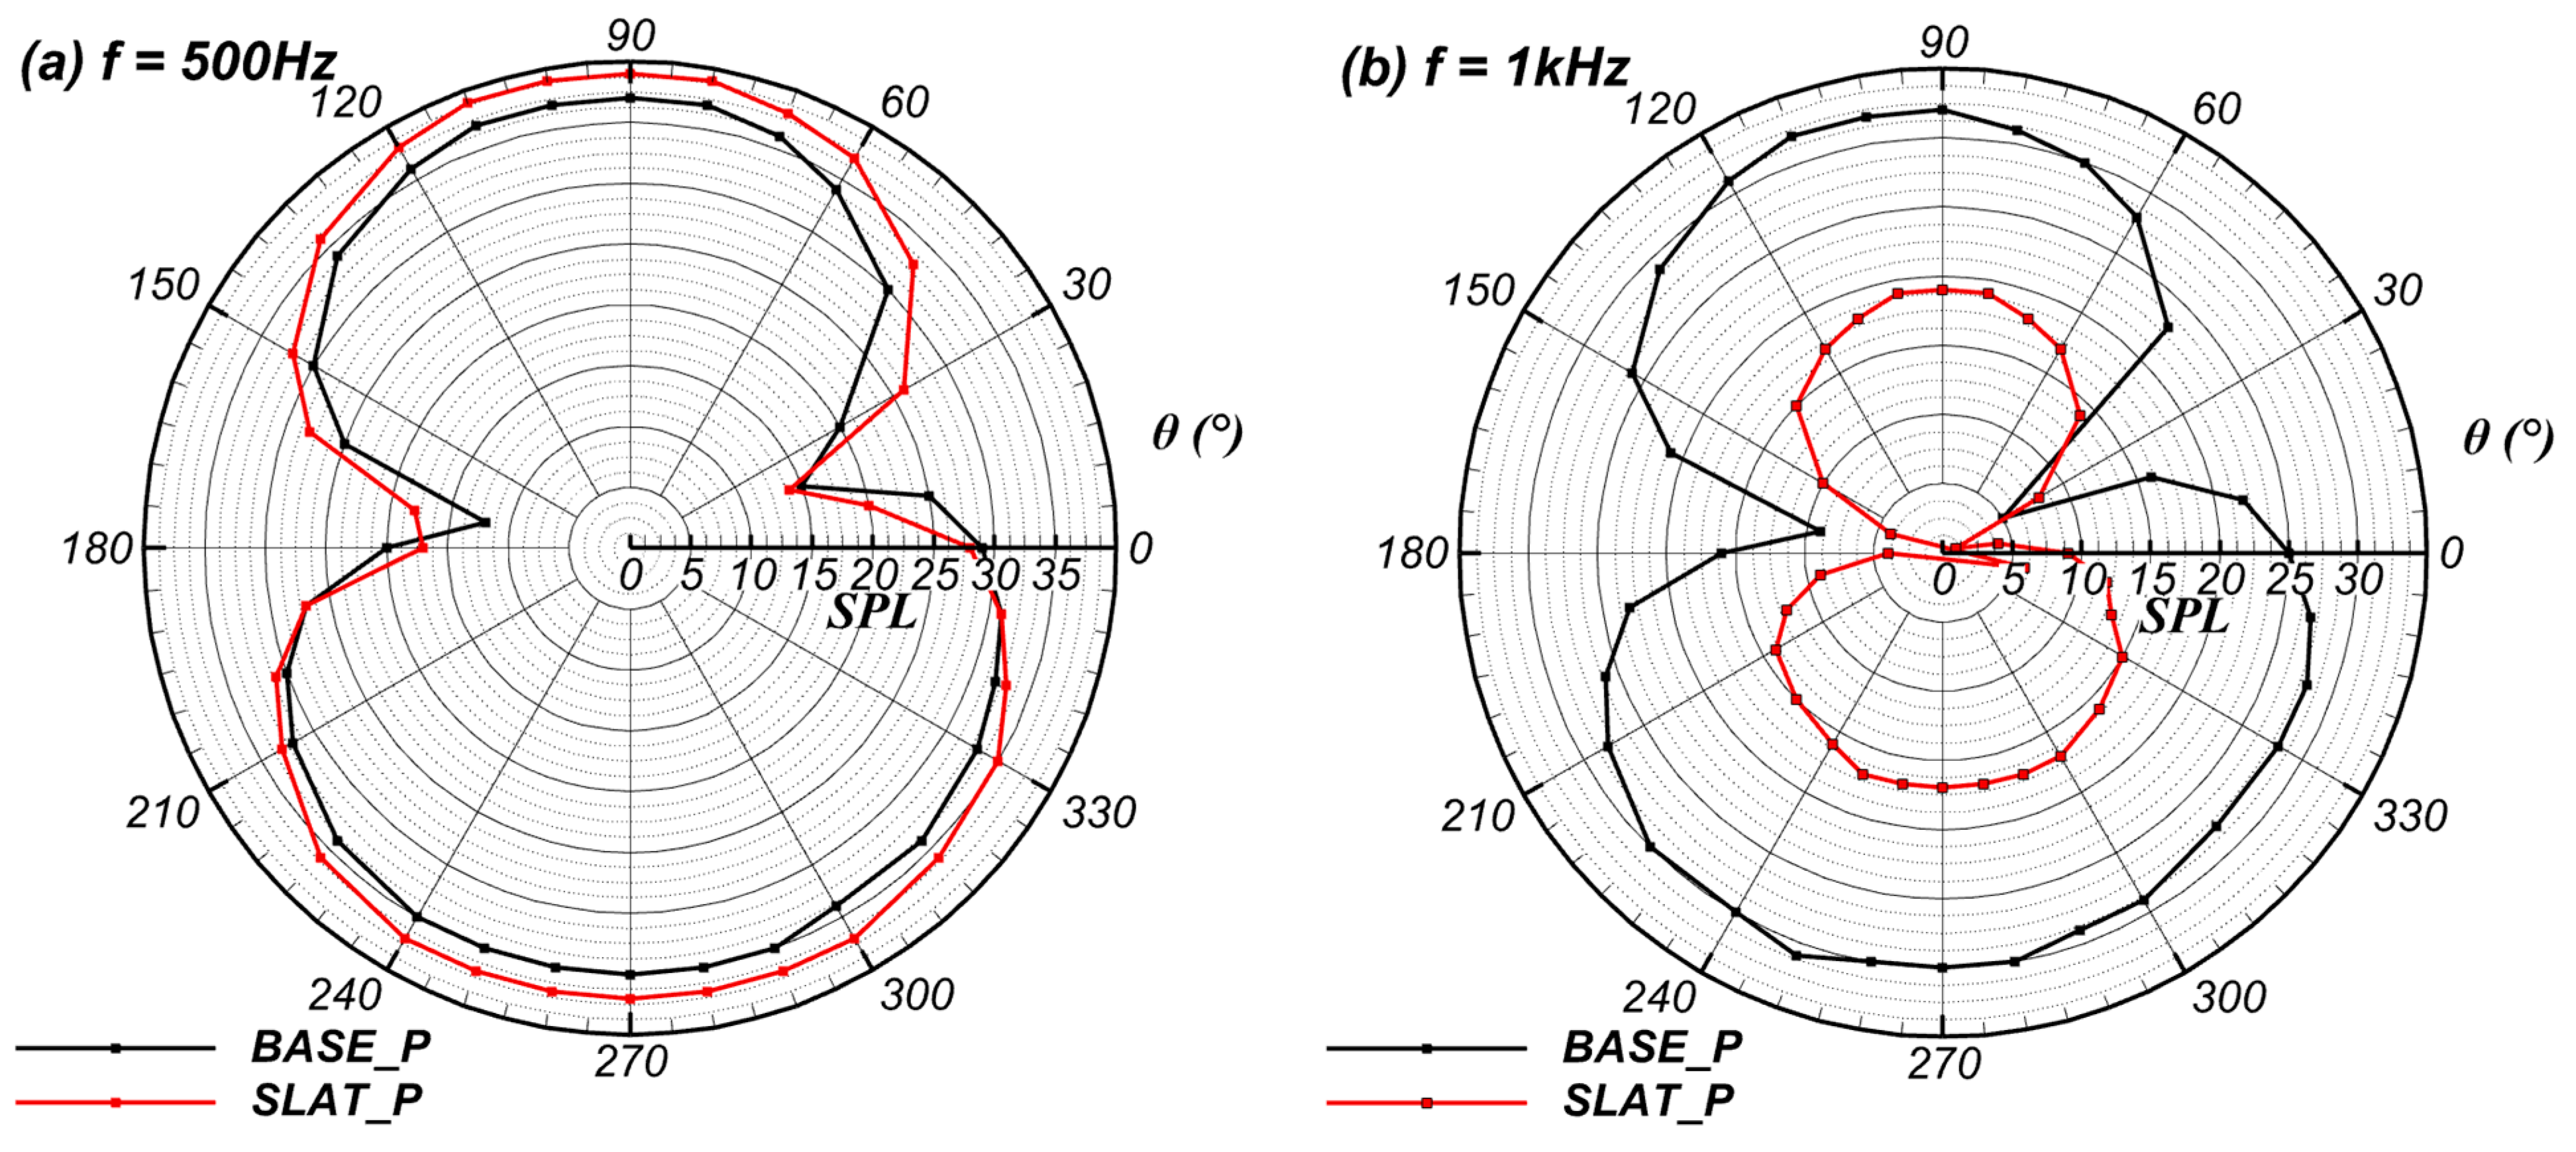
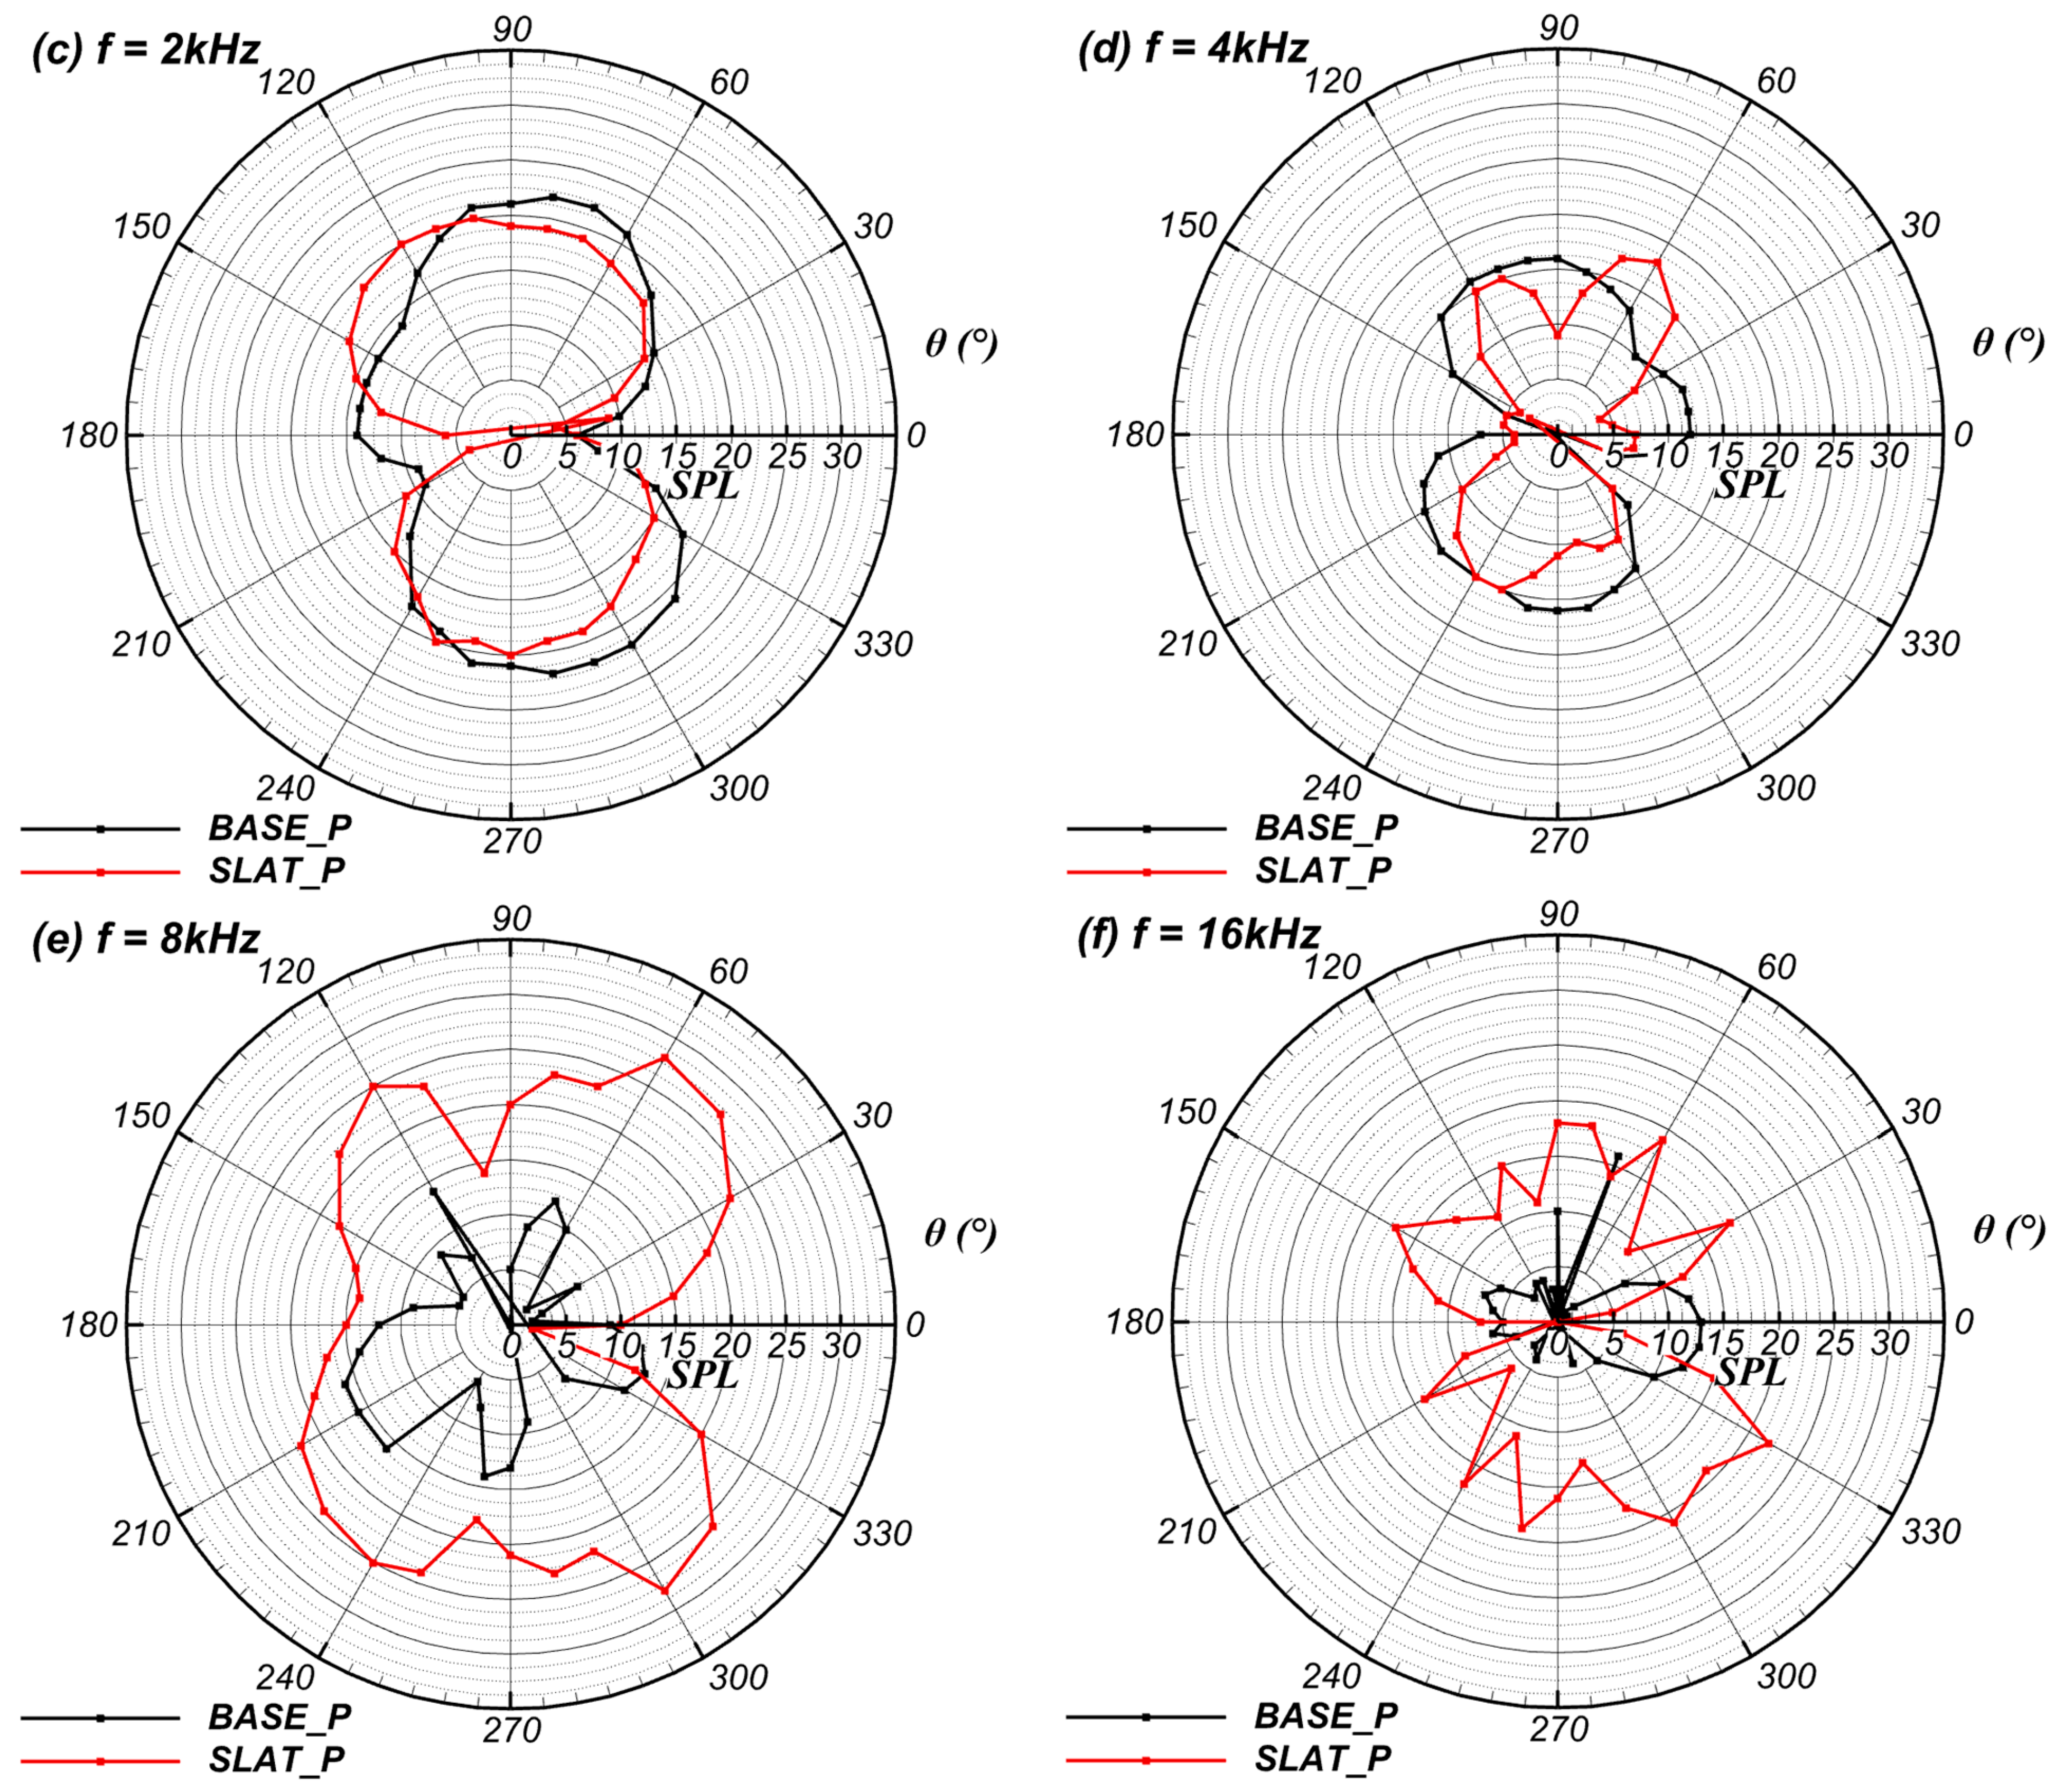
The acoustic directivity is assessed via third-octave bands sound pressure level magnitudes for a polar distribution of receivers on a 10C radius circle centered at the airfoil leading edge at an azimuthal angle (φ = 0 midspan). Only Slat_P and Base_P are plotted for a final comparison of total radiated noise directivity in Figure 21.
Base_P and Slat_P display similar directivity patterns, with the highest pressure level peaks in two directions: θ = 90° and θ = 270°. A characteristic distribution qualitatively similar to the well-known surface dipole source is observed at 500 Hz, 1 kHz. Sound pressure level magnitudes and directivity are frequency-dependent. Slat_P overcomes Base_P by 10–15 dB at θ = 0, 90, and 270° at 1 kHz. At 2 kHz, almost similar magnitudes and directivity lobes are observed. Asymmetric lobes are tilted towards the upper and lower side behind the airfoil for Base_P, with the lowest magnitude observed at 0°, and the previously observed eight shapes are distorted with a 15 dB magnitude in the 180° direction to yield a cardioid characteristic trailing edge noise directionality combined with dipole noise [80]. Slat_P displays a similar distribution, although symmetric in the 90° and 270° directions and lowest in upstream and downstream directions. At 4 kHz, the Slat_P previously observed symmetric dual lobes that modify to a multilobe shape with peak magnitudes radiating at θ = 60° and 240°. Slat_P only exceeds Base_P at the first quadrant peak lobe. Base_P maintains a two-lobe pattern and displays a higher amplitude downstream of the blade trailing edge than Slat_P for θ = 0°.
The significant difference in directivity lobes distribution between the two configurations suggests that the slat’s influence starts from 2 kHz and above, where noise directivity discrepancies are observed, suggesting a combination of dipole and quadrupole noise emerging due to the pressure fluctuations over the slat surface and its vortex shedding at high frequencies. Even though dipole sources are expected to dominate in comparison to quadrupoles for low-Mach-number flows, their influence cannot be neglected, as concluded by the study realized by [35]. At 8 kHz and 16 kHz, the directivity pattern changes with an almost constant multilobe intensity in all quadrants for Slat_P. The quadrupolar sound field emission pattern is defined as a combination of two dipole sources.
This is observable at 8 kHz, where the two aerodynamic bodies of slat and airfoil radiate as distinctive dipoles, resulting in a four-lobe noise radiation (similar to lateral quadrupole), while Base_P radiation can be assimilated to a longitudinal quadrupole radiation due to leading edge and trailing edge regions’ radiation. Finally, the slat presence modifies amplitude and directivity, and its influence is more substantial at very high frequencies.

4. Conclusions

A numerical study of slat profile camber, chord, inclination angle, and position relative to the leading edge of an S809 blade profile is performed to assess the blade’s aerodynamic performance improvement and separation suppression at Re = 106 for AoAs from 14° to 24° using the k-ω SST model. Five slat profiles with positive, symmetric, and negative cambers were initially tested. The two-dimensional steady study conclusions are as follows:
(a)
Negative and symmetric cambers are revealed to be the most influential slat profiles, with the superiority of symmetric slats at high AoAs up to 111% lift increment.
(b)
There is inverse proportionality between slat chord length and aerodynamic betterment.
(c)
The slat positive inclination angles (nose down position) are superior to negative angles.
(d)
Finally, the position of the slat is important as it influences the gap between the slat trailing edge and the main element leading edge; thus, the wake distributes and has an influence on separation over the main element. Pressure and flow streamlines allow us to understand the pressure distribution altered by the slat that leads to flow attachment to the blade suction surface.
The outcome of the simulation cases allows for the optimal slat configuration choice based on evaluating 77 configurations. The optimal slat profile is then used to evaluate the correlation between aerodynamics and aeroacoustics around the blade compared to the baseline for the tip portion of a 12% scale model NREL S809 phase VI blade. The transient flow field and aeroacoustic study of noise sources’ evaluation and propagation to the far-field receivers are achieved by a hybrid IDDES-FWH method. Grid resolution compatibility for LES-activated regions is verified via grid quality indices, and turbulence topology is analyzed. Solid and permeable surface formulations of the FWH equation are used to estimate noise at far-field receivers, and comparison is discussed.
Noise amplitudes and root mean square pressure fluctuations’ extraction give an informative baseline and slat acoustics indices. Acoustic directivity is also assessed. The main findings of the IDDES-FWH study are as follows:
(a)
The leading-edge slat modifies the eddies topology over the airfoil suction surface, and the fluid accelerates near the wall.
(b)
The slat convergent–divergent-shaped gap with the airfoil leading edge induces flow acceleration, adding flow resistance to the adverse pressure gradient. Eddies are shed from the slat trailing edge, suction surface, and tip.
(c)
The slat contributes to low- and high-frequency noise, understandably due to pressure fluctuations calculated over additional slat surfaces against the baseline case.
(d)
The FWH permeable approach successfully captured additional noise components compared to the solid-surface approach. However, the expected drawbacks related to turbulence crossing and surface extent influence the permeable surface approach. Turbulent boundary layer eddies interaction with the slat and main element trailing edge substantially contributes to the overall noise spectra.
Regarding directivity, strong dipole radiation is observed for both baseline and slat cases at low frequencies, while slat more dominatingly influences directivity lobes at high frequencies. Implementing slats over wind turbine blades induces higher noise levels at high frequencies. Thus, flow separation control studies should not neglect the design and geometric positioning of off-surface bodies. Although aerodynamically efficient, full-scale models could potentially worsen noise pollution. The lack of precise numerical tools for distinguishing and identifying separation noise over aerodynamic bodies among airfoil self-noise mechanisms is limiting. For future work, the influence of validated 2D control methods will be numerically investigated on full-scale wind turbines using an unsteady sliding mesh technique.

Author Contributions

S.B.: writing—review and editing, writing—original draft, validation, software, methodology, formal analysis, conceptualization. R.B.: writing—review and editing, software, methodology, formal analysis, project administration, supervision. A.D.: supervision, project administration. A.I.: writing—review and editing, supervision, project administration. All authors have read and agreed to the published version of the manuscript.

Funding

This research received no external funding.

Data Availability Statement

The original contributions presented in the study are included in the article, further inquiries can be directed to the corresponding author.

Conflicts of Interest

The authors declare no conflict of interest.

Nomenclature

p pressure perturbation
p L loading noise
p T thickness noise
v ~ eddy viscosity
AoAangle of attack
cslat chord
Cairfoil chord
c0sound velocity
CAAcomputational aeroacoustics
Cddrag coefficient
CDES,k-εDES model constant
CDES,k-ωDES model constant
CFLCourant–Friedrichs–Lewy
Cllift coefficient
DESdetached eddy simulation
dwdistance to the wall
fdhyperbolic blending function
FFTfast Fourier transform
FWHFfowcs Williams–Hawkings
FWHppermeable FWH
G(x,t; y,τ)Green’s function
H(f)Heaviside function
hx, hy, hzcell sizes
IDDESimproved detached delayed eddy simulation
KARIKorean Aerospace Research Institute
LESlarge eddy simulation
LES_IQIndex Of Resolution Quality
LK-ω SSTK-ω SST turbulent length scale
LLEScharacteristic turbulent length LES
LLMlog layer mismatch
LRANScharacteristic turbulent length RANS
MMach number
Pijviscous stress tensor
RANSReynolds Averaged Navier–Stokes
ReReynolds number
S-ASpalart–Allmaras
SPLsound pressure level
ßslat inclination angle
Tijstress tensor
Ufree stream velocity
URANSunsteady RANS
Vcellgrid cell volume
Xslat horizontal position
Yslat vertical position
y+dimensionless distance
Δfilter length
δ ( f ) Dirac’s delta function
δBLboundary layer thickness
δijKronecker Delta
Δttime step size
Δxchordwise cell size
Δywall normal cell size
κ Von Karman constant
Λturbulent length scale
ρfluid density
ν molecular viscosity

References

  1. Akhter, M.Z.; Omar, F.K. Review of Flow-Control Devices for Wind-Turbine Performance Enhancement. Energies 2021, 14, 1268. [Google Scholar] [CrossRef]
  2. Jenkins, N.; Burton, T.; Bossanyi, E.; Sharpe, D.; Graham, M. Introduction. In Wind Energy Handbook 3e; Jenkins, N., Burton, T., Bossanyi, E., Sharpe, D., Graham, M., Eds.; John Wiley & Sons, Ltd.: Hoboken, NJ, USA, 2021; pp. 1–10. [Google Scholar]
  3. Chang, P.K. CHAPTER I—Introduction to the Problems of Flow Separation. In Separation of Flow; Chang, P.K., Ed.; Elsevier Science & Technology: Pergamon, Turkey, 1970; pp. 1–54. [Google Scholar]
  4. Corten, G.P. Flow Separation on Wind Turbine Blades. Ph.D. Thesis, University of Utrecht, Utrecht, The Netherlands, 2001. [Google Scholar]
  5. Aramendia, I.; Fernandez-Gamiz, U.; Ramos-Hernanz, J.A.; Sancho, J.; Lopez-Guede, J.M.; Zulueta, E. Flow Control Devices for Wind Turbines. In Energy Harvesting and Energy Efficiency: Technology, Methods, and Applications; Bizon, N., Mahdavi Tabatabaei, N., Blaabjerg, F., Kurt, E., Eds.; Springer International Publishing: Cham, Switzerland, 2017; pp. 629–655. [Google Scholar]
  6. Kundu, P. Numerical simulation of the effects of passive flow control techniques on hydrodynamic performance improvement of the hydrofoil. Ocean Eng. 2020, 202, 107108. [Google Scholar] [CrossRef]
  7. Belamadi, R.; Settar, A.; Chetehouna, K.; Ilinca, A. Numerical Modeling of Horizontal Axis Wind Turbine: Aerodynamic Performances Improvement Using an Efficient Passive Flow Control System. Energies 2022, 15, 4872. [Google Scholar] [CrossRef]
  8. Mustafa Serdar, G.; Kemal, K.; Hacımurat, D.; Halil Hakan, A. Traditional and New Types of Passive Flow Control Techniques to Pave the Way for High Maneuverability and Low Structural Weight for UAVs and MAVs. In Autonomous Vehicles; George, D., Ed.; IntechOpen: Rijeka, Croatia, 2020; Chapter 7. [Google Scholar]
  9. Bourgois, S.A. Experimental Study of Separation over Airfoils: Analysis and Control. Etude Expérimentale du Décollement Sur profils D’aile: Analyse et Contrôle. Ph.D. Thesis, Université de Poitiers, Poitiers, France, 2006. [Google Scholar]
  10. Manso Jaume, A.; Wild, J. Aerodynamic Design and Optimization of a High-Lift Device for a Wind Turbine Airfoil. In Proceedings of the New Results in Numerical and Experimental Fluid Mechanics X, Braunschweig, Germany, 8–9 November 2016; pp. 859–869. [Google Scholar]
  11. Wang, H.; Jiang, X.; Chao, Y.; Li, Q.; Li, M.; Zheng, W.; Chen, T. Effects of leading edge slat on flow separation and aerodynamic performance of wind turbine. Energy 2019, 182, 988–998. [Google Scholar] [CrossRef]
  12. Genç, M.S.; Kaynak, Ü.; Lock, G.D. Flow over an aerofoil without and with a leading-edge slat at a transitional Reynolds number. Proc. Inst. Mech. Eng. Part G J. Aerosp. Eng. 2009, 223, 217–231. [Google Scholar] [CrossRef]
  13. Ullah, T.; Javed, A.; Abdullah, A.N.; Ali, M.; Uddin, E. Computational evaluation of an optimum leading-edge slat deflection angle for dynamic stall control in a novel urban-scale vertical axis wind turbine for low wind speed operation. Sustain. Energy Technol. Assess. 2020, 40, 100748. [Google Scholar] [CrossRef]
  14. Smith, A.M.O. High-Lift Aerodynamics. J. Aircr. 1975, 12, 501–530. [Google Scholar] [CrossRef]
  15. Hoerner, S.F.; Borst, H.V. Fluid-Dynamic Lift: Practical Information on Aerodynamic and Hydrodynamic Lift; L.A. Hoerner: Bakersfield, CA, USA, 1985. [Google Scholar]
  16. Maizi, M.; Mohamed, M.H.; Dizene, R.; Mihoubi, M.C. Noise reduction of a horizontal wind turbine using different blade shapes. Renew. Energy 2018, 117, 242–256. [Google Scholar] [CrossRef]
  17. Hansen, C.H.; Doolan, C.J.; Hansen, K.L. Noise Generation. In Wind Farm Noise: Measurement, Assessment; John Wiley & Sons Ltd.: Hoboken, NJ, USA, 2017; pp. 119–156. [Google Scholar]
  18. Singer, B.A.; Lockard, D.P.; Brentner, K.S. Computational Aeroacoustic Analysis of Slat Trailing-Edge Flow. AIAA J. 2000, 38, 1558–1564. [Google Scholar] [CrossRef]
  19. Housman, J.; Stich, G.-D.; Kocheemoolayil, J.; Kiris, C. Predictions of Slat Noise from the 30P30N at High Angles of Attack Using Zonal Hybrid RANS-LES. In Proceedings of the 25th AIAA/CEAS Aeroacoustics Conference, Delft, The Netherlands, 20–23 May 2019. [Google Scholar]
  20. Ashton, N.; West, A.; Mendonca, F. Slat Noise Prediction using Hybrid RANS-LES methods on Structured and Unstructured Grids. In Proceedings of the 21st AIAA/CEAS Aeroacoustics Conference, Dallas, TX, USA, 22–26 June 2015. [Google Scholar]
  21. Takeda, K.; Zhang, X.; Nelson, P.A. Computational aeroacoustic simulations of leading-edge slat flow. J. Sound Vib. 2004, 270, 559–572. [Google Scholar] [CrossRef]
  22. Akhter, M.Z.; Jawahar, H.K.; Omar, F.K.; Elnajjar, E. Performance characterization of a slotted wind turbine airfoil featuring passive blowing. Energy Rep. 2024, 11, 720–735. [Google Scholar] [CrossRef]
  23. Ye, X.; Hu, J.; Zheng, N.; Li, C. Numerical study on aerodynamic performance and noise of wind turbine airfoils with serrated gurney flap. Energy 2023, 262, 125574. [Google Scholar] [CrossRef]
  24. Lighthill, M.J. On Sound Generated Aerodynamically. I. General Theory. Proc. R. Soc. Lond. Ser. A 1952, 211, 564–587. [Google Scholar] [CrossRef]
  25. Azevedo, J.L.F.; Lele, S.K.; Wolf, W.R. Convective effects and the role of quadrupole sources for aerofoil aeroacoustics. J. Fluid Mech. 2012, 708, 502–538. [Google Scholar] [CrossRef]
  26. Kim, J.W.; Turner, J.M. Quadrupole noise generated from a low-speed aerofoil in near- and full-stall conditions. J. Fluid Mech. 2022, 936, A34. [Google Scholar] [CrossRef]
  27. Yu, C.; Wolf, W.; Lele, S. Quadrupole Noise in Turbulent Wake Interaction Problems. In Proceedings of the 18th AIAA/CEAS Aeroacoustics Conference (33rd AIAA Aeroacoustics Conference), Colorado Springs, CO, USA, 4–6 June 2012. [Google Scholar]
  28. Cho, T.; Kim, C.; Lee, D. Acoustic measurement for 12% scaled model of NREL Phase VI wind turbine by using beamforming. Curr. Appl. Phys. 2010, 10, S320–S325. [Google Scholar] [CrossRef]
  29. Turner, J.M.; Kim, J.W. Aerofoil dipole noise due to flow separation and stall at a low Reynolds number. Int. J. Heat Fluid Flow 2020, 86, 108715. [Google Scholar] [CrossRef]
  30. Wagner, C.; Hüttl, T.; Sagaut, P. Large-Eddy Simulation for Acoustics; Cambridge University Press: Cambridge, UK, 2007. [Google Scholar]
  31. Williams, J.E.F.; Hawkings, D.L. Sound Generation by Turbulence and Surfaces in Arbitrary Motion. Philos. Trans. R. Soc. London. Ser. A Math. Phys. Sci. 1969, 264, 321–342. [Google Scholar]
  32. Wasala, S.H.; Storey, R.C.; Norris, S.E.; Cater, J.E. Aeroacoustic noise prediction for wind turbines using Large Eddy Simulation. J. Wind Eng. Ind. Aerodyn. 2015, 145, 17–29. [Google Scholar] [CrossRef]
  33. Francescantonio, P.d. A new boundary integral formulation for the prediction of sound radiation. J. Sound Vib. 1997, 202, 491–509. [Google Scholar] [CrossRef]
  34. Hajczak, A.; Sanders, L.; Vuillot, F.; Druault, P. Investigation of the Ffowcs-Williams and Hawkings Analogy on an Isolated Landing Gear Wheel. In Proceedings of the 2018 AIAA/CEAS Aeroacoustics Conference, Atlanta, GA, USA, 25–29 June 2018. [Google Scholar]
  35. Yu, C.; Lele, S. Volume Noise Sources in Turbulent Wake Interaction Problems: True Quadrupole Noise? In Proceedings of the 20th AIAA/CEAS Aeroacoustics Conference, Atlanta, GA, USA, 16–20 June 2014.
  36. Testa, C.; Porcacchia, F.; Zaghi, S.; Gennaretti, M. Study of a FWH-based permeable-surface formulation for propeller hydroacoustics. Ocean Eng. 2021, 240, 109828. [Google Scholar] [CrossRef]
  37. Menter, F.R.; Kuntz, M.; Langtry, R. Ten Years of Industrial Experience with the SST Turbulence Model. In Proceedings of the 4th: Internal Symposium, Turbulence, Heat and Mass Transfer, Antalya, Turkey, 12–17 October 2003; pp. 625–632. [Google Scholar]
  38. Michel, U.; Eschricht, D.; Greschner, B.; Knacke, T.; Mockett, C.; Thiele, F. Advanced DES Methods and Their Application to Aeroacoustics; Springer: Berlin/Heidelberg, Germany, 2010; pp. 59–76. [Google Scholar]
  39. Shur, M.; Spalart, P.; Strelets, M.; Travin, A. Detached Eddy Simulation of an Airfoil at High Angle of Attack. In Engineering Turbulence Modelling and Experiments 4; Elsevier Science Ltd.: Oxford, UK, 1999; Volume 4. [Google Scholar]
  40. Strelets, M. Detached eddy simulation of massively separated flows. In Proceedings of the 39th Aerospace Sciences Meeting and Exhibit, Reno, NV, USA, 8–11 January 2001. [Google Scholar]
  41. Travin, A.; Shur, M.; Spalart, P.; Kh, M.; Strelets, M. Improvement of delayed detached-eddy simulation for LES with wall modelling. Comput. Fluids 2006, 265, 106014. [Google Scholar]
  42. Shur, M.; Spalart, P.; Strelets, M.; Travin, A. A hybrid RANS-LES approach with delayed-DES and wall-modelled LES capabilities. Int. J. Heat Fluid Flow 2008, 29, 1638–1649. [Google Scholar] [CrossRef]
  43. Pope, S.B. Turbulent Flows; Cambridge University Press: Cambridge, UK, 2000. [Google Scholar]
  44. Davidson, L. Large Eddy Simulations: How to evaluate resolution. Int. J. Heat Fluid Flow 2009, 30, 1016–1025. [Google Scholar] [CrossRef]
  45. Addad, Y.; Benhamadouche, S.; Laurence, D. The negatively buoyant wall-jet: LES results. Int. J. Heat Fluid Flow 2004, 25, 795–808. [Google Scholar] [CrossRef]
  46. Celik, I.B.; Cehreli, Z.N.; Yavuz, I. Index of Resolution Quality for Large Eddy Simulations. J. Fluids Eng. 2005, 127, 949–958. [Google Scholar] [CrossRef]
  47. Hand, M.; Simms, D.; Fingersh, L.; Jager, D.; Cotrell, J.; Schreck, S.; Larwood, S. Unsteady Aerodynamics Experiment Phase VI: Wind Tunnel Test Configurations and Available Data Campaigns; National Renewable Energy Lab.(NREL): Golden, CO, USA, 2001. [Google Scholar] [CrossRef]
  48. Menter, F.R. Two-equation eddy-viscosity turbulence models for engineering applications. AIAA J. 1994, 32, 1598–1605. [Google Scholar] [CrossRef]
  49. Wang, Y.; Li, G.; Shen, S.; Huang, D.; Zheng, Z. Investigation on aerodynamic performance of horizontal axis wind turbine by setting micro-cylinder in front of the blade leading edge. Energy 2018, 143, 1107–1124. [Google Scholar] [CrossRef]
  50. Shi, X.; Xu, S.; Ding, L.; Huang, D. Passive flow control of a stalled airfoil using an oscillating micro-cylinder. Comput. Fluids 2019, 178, 152–165. [Google Scholar] [CrossRef]
  51. Riyadh, B.; Djemili, A.; Ilinca, A.; Ramzi, M. Aerodynamic performance analysis of slotted airfoils for application to wind turbine blades. J. Wind Eng. Ind. Aerodyn. 2016, 151, 79–99. [Google Scholar] [CrossRef]
  52. Li, Y.; Wang, H.; Wu, Z. Aerodynamic characteristic of wind turbine with the leading edge slat and Microtab. Sustain. Energy Technol. Assess. 2022, 52, 101957. [Google Scholar] [CrossRef]
  53. Somers, D.M. Design and Experimental Results for the S809 Airfoil; National Renewable Energy Lab.: Golden, CO, USA, 1997. [Google Scholar]
  54. Spalart, P.; Jou, W.H.; Strelets, M.; Allmaras, S. Comments on the Feasibility of LES for Wings, and on a Hybrid RANS/LES Approach. In Advances in DNS/LES: Direct Numerical Simulation and Large Eddy Simulation; Springer: Berlin/Heidelberg, Germany, 1997. [Google Scholar]
  55. Gritskevich, M.S.; Garbaruk, A.V.; Schütze, J.; Menter, F.R. Development of DDES and IDDES Formulations for the k-ω Shear Stress Transport Model. Flow Turbul. Combust. 2012, 88, 431–449. [Google Scholar] [CrossRef]
  56. Menter, F.R.; Kuntz, M. Adaptation of Eddy-Viscosity Turbulence Models to Unsteady Separated Flow Behind Vehicles. In The Aerodynamics of Heavy Vehicles: Trucks, Buses, and Trains; Springer: Berlin/Heidelberg, Germany, 2004; pp. 339–352. [Google Scholar]
  57. Huck, V.; Morency, F.; Beaugendre, H. Grid study for Delayed Detached Eddy-Simulation’s grid of a pre-stalled wing. In Proceedings of the CASI Aero 2019-Canadian Aeronautics and Space Institute’s AERO 2019 Conference, Laval, QC, Canada, 14 May 2019. [Google Scholar]
  58. Xiao, M.; Zhang, Y. Assessment of the SST-IDDES with a shear-layer-adapted subgrid length scale for attached and separated flows. Int. J. Heat Fluid Flow 2020, 85, 108653. [Google Scholar] [CrossRef]
  59. Gritskevich, M.; Garbaruk, A.; Menter, F. Fine-tuning of DDES and IDDES formulations to the k-ω shear stress transport model. Prog. Flight Phys. 2013, 5, 23–42. [Google Scholar]
  60. Mockett, C. A Comprehensive Study of Detached-Eddy Simulation. Ph.D. Thesis, Technische Universität Berlin, Berlin, Germany, 2009. [Google Scholar]
  61. Farassat, F. Linear Acoustic Formulas for Calculation of Rotating Blade Noise. AIAA J. 1981, 19, 1122–1130. [Google Scholar] [CrossRef]
  62. Wagner, S.; Bareiß, R.; Guidati, G. Introduction to Aeroacoustics. In Wind Turbine Noise; Springer: Berlin/Heidelberg, Germany, 1996; pp. 27–65. [Google Scholar]
  63. Greschner, B.; Thiele, F.; Jacob, M.C.; Casalino, D. Prediction of sound generated by a rod–airfoil configuration using EASM DES and the generalised Lighthill/FW-H analogy. Comput. Fluids 2008, 37, 402–413. [Google Scholar] [CrossRef]
  64. Spalart, P.; Streett, C. Young-Person’s Guide to Detached-Eddy Simulation Grids. 2001. Available online: https://ntrs.nasa.gov/api/citations/20010080473/downloads/20010080473.pdf (accessed on 3 November 2024).
  65. Schmidt, S.; Thiele, F. Detached Eddy Simulation of Flow around A-Airfoil. Flow Turbul. Combust. 2003, 71, 261–278. [Google Scholar] [CrossRef]
  66. Luo, D.; Huang, D.; Sun, X. Passive flow control of a stalled airfoil using a microcylinder. J. Wind Eng. Ind. Aerodyn. 2017, 170, 256–273. [Google Scholar] [CrossRef]
  67. Mellen, C.; Fröhlich, J.; Rodi, W. Lessons from LESFOIL Project on Large-Eddy Simulation of Flow Around an Airfoil. AIAA J. 2003, 41, 573–581. [Google Scholar] [CrossRef]
  68. Kaviani, H.R.; Nejat, A. Aerodynamic noise prediction of a MW-class HAWT using shear wind profile. J. Wind Eng. Ind. Aerodyn. 2017, 168, 164–176. [Google Scholar] [CrossRef]
  69. Aihara, A.; Goude, A.; Bernhoff, H. Numerical prediction of noise generated from airfoil in stall using LES and acoustic analogy. Noise Vib. Worldw. 2021, 52, 295–305. [Google Scholar] [CrossRef]
  70. Spalart, P.R.; Belyaev, K.V.; Shur, M.L.; Kh Strelets, M.; Travin, A.K. On the differences in noise predictions based on solid and permeable surface Ffowcs Williams–Hawkings integral solutions. Int. J. Aeroacoustics 2019, 18, 621–646. [Google Scholar] [CrossRef]
  71. Yavuz, T.; Koç, E.; Kılkış, B.; Erol, Ö.; Balas, C.; Aydemir, T. Performance analysis of the airfoil-slat arrangements for hydro and wind turbine applications. Renew. Energy 2015, 74, 414–421. [Google Scholar] [CrossRef]
  72. Mostafa, W.; Abdelsamie, A.; Sedrak, M.; Thévenin, D.; Mohamed, M. Quantitative impact of a micro-cylinder as a passive flow control on a horizontal axis wind turbine performance. Energy 2021, 244, 122654. [Google Scholar] [CrossRef]
  73. Bies, D.; Hansen, C.; Kelsall, T. Engineering Noise Control, Fourth Edition. Noise Control Eng. J. 2010, 58, 465. [Google Scholar] [CrossRef]
  74. Kato, C.; Iida, A.; Takano, Y.; Fujita, H.; Ikegawa, M. Numerical prediction of aerodynamic noise radiated from low Mach number turbulent wake. In Proceedings of the 31st Aerospace Sciences Meeting, Reno, NV, USA, 11–14 January 1993. [Google Scholar]
  75. Abdessemed, C.; Bouferrouk, A.; Yao, Y. Aerodynamic and Aeroacoustic Analysis of a Harmonically Morphing Airfoil Using Dynamic Meshing. Acoustics 2021, 3, 177–199. [Google Scholar] [CrossRef]
  76. De Gennaro, M.; Kuehnelt, H.; Zanon, A. Numerical Prediction of the Tonal Airborne Noise for a NACA 0012 Aerofoil at Moderate Reynolds Number Using a Transitional URANS Approach. Arch. Acoust. 2017, 42, 653–675. [Google Scholar] [CrossRef]
  77. Wagner, S.; Bareiß, R.; Guidati, G. Noise and its Effects. In Wind Turbine Noise; Springer: Berlin/Heidelberg, Germany, 1996; pp. 13–25. [Google Scholar]
  78. Chen, G.; Yang, X.; Tang, X.; Ding, J.; Weng, P. Effects of slat track on the flow and acoustic field of high-lift devices. Aerosp. Sci. Technol. 2022, 126, 107626. [Google Scholar] [CrossRef]
  79. Wagner, S.; Bareiß, R.; Guidati, G. Noise Mechanisms of Wind Turbines. In Wind Turbine Noise; Wagner, S., Bareiß, R., Guidati, G., Eds.; Springer: Berlin/Heidelberg, Germany, 1996; pp. 67–92. [Google Scholar]
  80. Glegg, S.; Devenport, W. Chapter 15-Trailing edge and roughness noise. In Aeroacoustics of Low Mach Number Flows; Glegg, S., Devenport, W., Eds.; Academic Press: New York, NY, USA, 2017; pp. 365–395. [Google Scholar]
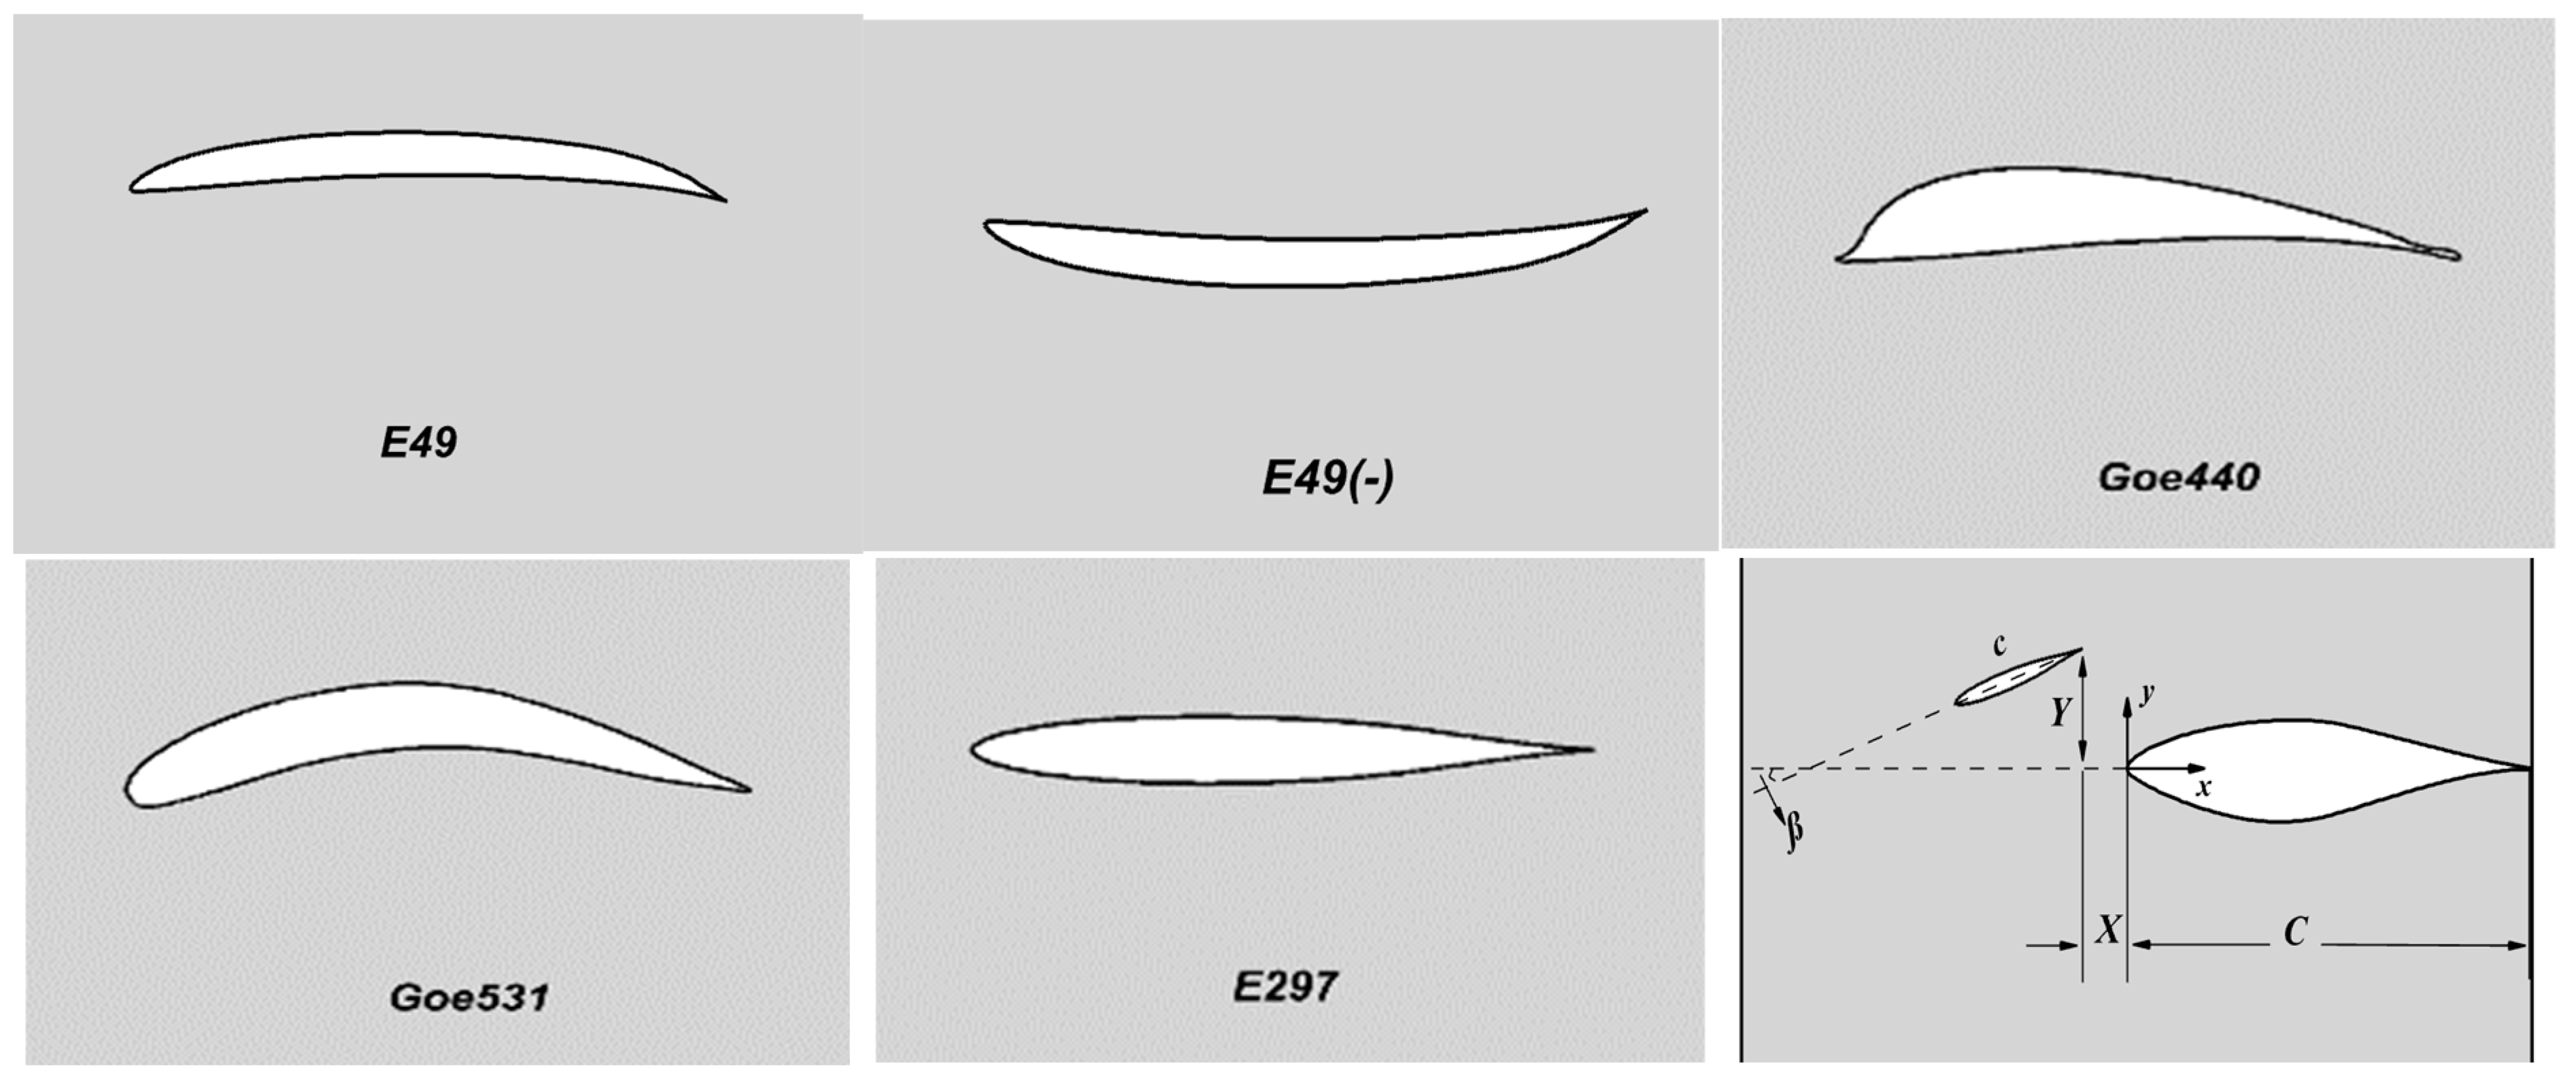
Figure 1. Slat aerodynamic profiles and geometric parameters (c: slat chord, C: airfoil chord, (X, Y): slat TE position, ß: inclination angle).
Energies 17 05597 g001
Figure 2. (a) Aerodynamic coefficients comparison with experimental [53] and numerical results for baseline S809 airfoil of this study and [50] (b) Y plus distribution over airfoil surface.
Energies 17 05597 g002
Figure 3. Computational domain mesh details: (a) steady-state mesh, (b) close-up view of slat/airfoil blocks, (c) mesh zones for IDDES and extent of permeable surface, (d) airfoil spanwise divisions, (e) boundary conditions for IDDES-FWH.
Energies 17 05597 g003
Figure 4. y+ distribution over airfoil and slat surfaces.
Energies 17 05597 g004
Figure 5. Acoustic receivers’ layout around the airfoil (a) Sound pressure level (b) Directivity.
Energies 17 05597 g005
Figure 6. Aerodynamic coefficient values for slat profiles at X0Y3 and X3Y3.
Energies 17 05597 g006
Figure 7. Influence of slat chord length at X3Y3 ß = 0° for all slat profiles lift and drag coefficients (ae): E49(-), E49, E297 Goe440, Goe531, respectively.
Energies 17 05597 g007
Figure 8. Pressure coefficient distribution around E297_c5, c7, c10, and c15 at AoA = 18°.
Energies 17 05597 g008
Figure 9. Influence of the slat inclination angle (a,b): lift and drag variation for E297 & E49(-) at all angles, respectively, (c) lift and drag variation for optimum angles (d,e) glide ratio comparison for all angles (f) glide ratio for optimum angles.
Energies 17 05597 g009aEnergies 17 05597 g009b
Figure 10. Positional arrangement of E297.
Energies 17 05597 g010
Figure 11. Influence of slat position over (a) lift (b) drag (c) glide ratio.
Energies 17 05597 g011
Figure 12. Streamlines and pressure contours around the airfoil for slat optimal configuration (right) and baseline (left) at (a,b):AoA = 20°, (c,d): AoA = 22°, (e,f): AoA = 24°.
Energies 17 05597 g012aEnergies 17 05597 g012b
Figure 13. Grid quality contours: (a) Lrv_ratio, (b) LES_IQ_Celik at T = 0.05 s, (c) Log10_RANS-LES.
Energies 17 05597 g013
Figure 14. Instantaneous isosurface of Q-criterion colored by instantaneous velocity magnitude for baseline (a,c) and slat (b,d).
Energies 17 05597 g014
Figure 15. Streamwise near-wall normalized time-averaged velocity for baseline and slat (midspan) at (af): x/C = 5, 20, 60, 80, 95, and 99%, respectively.
Energies 17 05597 g015aEnergies 17 05597 g015b
Figure 16. Contours of instantaneous skin friction coefficient for (a) baseline and (b) slat.
Energies 17 05597 g016
Figure 17. Velocity gradients (dU/dy) distribution at midspan for baseline and slat.
Energies 17 05597 g017
Figure 18. Comparison of corrected sound power level from R1&R5 to experimental tip section acoustic results from [28,73].
Energies 17 05597 g018
Figure 19. Mid span plane and suction surfaces total pressure contours for baseline (a) airfoil + slat (b).
Energies 17 05597 g019
Figure 20. Baseline and Slat Sound amplitudes for solid and permeable formulations at (ad): R1, R3, R5, and R7, respectively.
Energies 17 05597 g020
Figure 21. Sound pressure level directivities for Base_P and Slat_P.
Energies 17 05597 g021aEnergies 17 05597 g021b
Table 1. Slat profiles’ aerodynamic details.
Slat ProfileMax Thickness (%c)Max Camber (%c)
E497.2 at 38.4%c6.5 at 62.2%c
Goe44015.3 at 30%c9.7 at 40%c
Goe53113.8 at19.5%c14.7 at 49.3%c
E29711.4 at 37.7%c0 at 0%c
Table 2. Grid independence study for K-ω SST model at AoA = 16°.
GridNumber of CellsClCdSize of Wall Adjacent Cell (m)Growth FactorCell Max Size (m)
G1195,2871.060.1160.000151.30.5
G2218,8511.10180.11540.000151.20.5
G3240,5151.180.1160.000161.20.5
G4244,2171.21930.11740.000151.150.5
G5283,8891.13950.11020.000171.10.5
G6291,1871.2270.1180.000161.10.5
G7298,7831.22310.11740.000151.10.5
G8316,6111.22560.11790.000131.10.5
G9407,0871.22360.11770.00021.050.6
G10482,4771.22240.11740.000151.050.5
Disclaimer/Publisher’s Note: The statements, opinions and data contained in all publications are solely those of the individual author(s) and contributor(s) and not of MDPI and/or the editor(s). MDPI and/or the editor(s) disclaim responsibility for any injury to people or property resulting from any ideas, methods, instructions or products referred to in the content.