Article

Synergistic Effects of Energy Storage Systems and Demand-Side Management in Optimizing Zero-Carbon Smart Grid Systems

by
Zeyad A. Almutairi
1,2 and
Ali M. Eltamaly
1,3,*
1
Sustainable Energy Technologies Center, King Saud University, Riyadh 11421, Saudi Arabia
2
Mechanical Engineering Department, King Saud University, Riyadh 11421, Saudi Arabia
3
Department of Electrical Engineering, Mansoura University, Mansoura 35516, Egypt
*
Author to whom correspondence should be addressed.
Energies 2024, 17(22), 5637; https://doi.org/10.3390/en17225637
Submission received: 30 September 2024 / Revised: 1 November 2024 / Accepted: 7 November 2024 / Published: 11 November 2024

Abstract

:
The urgent need to mitigate climate change and reduce reliance on fossil fuels has driven the global shift towards renewable energy sources (RESs). However, the intermittent nature of RESs poses significant challenges to the widespread adoption of Zero-Carbon Smart Grids (ZCSGs). This study proposes a synergistic framework to address this hurdle. It utilizes energy storage systems (ESSs) by comparing Vanadium redox flow batteries (VRFBs) and Lithium ion batteries (LIBs) to identify the most suitable option for ZCSGs, with precise models enabling robust performance evaluation. Moreover, an accurate demand-side management (DSM) strategy considering power elasticity to manage discrepancies between electricity load, RES generation, and ESS availability is introduced for estimating fair, dynamic tariffs. An advanced load and weather-forecasting strategy is introduced for improving grid planning and management. An advanced optimization algorithm enhances grid stability and efficiency. Simulations demonstrate significant reductions in carbon footprint, peak power demand, and reliance on fossil fuels. The study finds that VRFBs outperform LIBs in cost and security, and dynamic tariffs based on accurate DSM significantly reduce energy costs. This work explores the challenges and opportunities of this integrated approach, offering policy recommendations and future research directions for truly optimized ZCSG implementation.

1. Introduction

Conventional power systems rely on centralized power plants that generate electricity from fossil fuels and transmit it unidirectionally to loads via transmission lines. Due to the serious environmental effects and the scarcity of abundant fossil fuels, the world started to switch its reliance from fossil fuels to renewable energy sources (RESs). Conventional power systems can regulate generation to match load demand. However, RESs are inherently variable, making it challenging to control their output to satisfy the load demand. This variability and the discrepancy between generation and load can negatively impact power system stability and reliability if not properly managed. Three different strategies can be used to avoid this problem which are the use of energy storage systems (ESSs), demand-side management (DSM), and load/weather forecasting (LWF) strategies. Each one of these strategies enhances the stability of the RESs. For this reason, these strategies will be synergistically used in this study to ensure the stability and reliability of the Zero-Carbon Smart Grids (ZCSGs). The use of ESSs should be able to fill the discrepancy between the generation from RESs and the loads with reasonable cost. The DSM tools such as time of use (ToU) and real-time pricing (RTP), among others, are also used for the same purpose, and can be used to control the loads to be correlated with the available generation from RESs [1]. By accurately forecasting both load demand and weather conditions, system operators can gain valuable insights into the future state of the power system. This knowledge enables them to take proactive measures, such as adjusting generation schedules or activating reserve capacity, to mitigate potential stability and reliability risks.

1.1. Literature Survey

Several studies have been introduced in the literature to connect RESs with fossil fuel power plants in on/off-grid connections [2,3,4]. These systems aim to supply the load primarily with available renewable energy generation from sources like solar and wind. However, when RESs or ESSs are unable to fully meet energy needs, fossil fuel generators are seamlessly activated to address the power deficit. This integrated approach both ensures reliability and support for the hybrid renewable energy system (HRES), guaranteeing consistent power regardless of fluctuations in renewable energy availability [4]. While these systems significantly reduce carbon and greenhouse gas (GHG) emissions, they do not eliminate them entirely. ZCSGs aim to achieve zero GHG emissions by completely eliminating the need for fossil fuel generators. Several studies have been introduced in the literature to study the optimal structure of the ZCSG in many sites in the world [2] and in Saudi Arabia as well [1,4]. Most of these studies used the ESS, DSM, and LWF strategies to support the ZCSG and to avoid any stability and reliability issues.
ZCSGs are very sensitive to any abnormal change in the load and the weather conditions, due to the absence of high inertial generators such as the synchronous generator. For this reason, a fast-response ESS should be available to support these systems during any abnormal operating conditions. Moreover, the ESS should also be able to store the surplus generated energy during high generation from RESs and discharge this energy back to the load during a deficit in generated energy, which is called energy arbitrage. The frequency regulation needs a very fast response, which makes the battery ESS (BESS) suitable for this need. Meanwhile, pumped hydro-energy storage (PHES) systems are suitable for energy arbitrage, due to their slow response compared to the BESS [1]. Several BESSs have been used for frequency regulation of the HRES, such as sealed lead–acid (SLA) [3,4], Lithium ion batteries (LIBs) [1], Vanadium redox flow batteries (VRFBs), and Sodium–sulfur (NaS) batteries [1,5,6]. NaS batteries have gained space in electric grid storage since the early 2000s, and dominated the grid electricity-storage market up to 2014, thanks to their high energy density, high efficiency, lifetime, and fast response time. NaS batteries suffer from high initial costs and safety concerns, as sodium is a reactive metal that can ignite in air and moisture. Additionally, short circuits and exothermic reactions can lead to extremely high temperatures, posing significant safety risks [5]. Moreover, NaS batteries are still under development and they need further improvement to become mature technology, due to their long response and their need for high temperatures (300 °C to 400 °C) for normal operation [6]. The LIBs and VRFBs are showing promising results and have been used widely for frequency regulation of the HRES, and, based on this reason, they will be considered to be used in this study [7,8]. One of these studies [8] concluded that VRFBs can be a great competitor for LIBs if further improvements for VRFBs are made in the future [8]. Other studies introduced VRFBs in the ESS of RESs, and most of these studies recommend the replacement of the LIBs with the promising VRFBs [7,8,9,10,11,12,13,14,15,16,17,18,19,20,21]. A detailed comparative study has been carried out in [22] between LIBs and VRFBs for the simulated household model.
VRFBs have emerged as a highly viable and efficient ESS, especially for smart grid applications [7,8,9,10,11,12,13,14,15,16,17,18,19,20]. They offer several advantages, including high capacity, durability, and scalability for grid management and backup energy. The unique ability of VRFBs to effectively stabilize fluctuating power generation from RESs makes them a promising platform for electrical ESSs. Utilizing Vanadium as the redox-active material in aqueous solution, VRFBs generate electricity based on the potential differences of the VO2+/VO+2 and V2+/V3+ redox couples separated by a membrane. This design not only provides long service life and high output, but also ensures safety and high energy efficiency. In addition to their suitability for large-scale renewable ESSs, VRFBs have also been recognized for their low environmental impact compared to traditional secondary batteries such as LIBs. With their long cycle life, fast response, and flexible design, VRFBs are increasingly garnering attention for various RES applications, including electric vehicles (EVs). Due to their low environmental polluting potential, they are becoming an attractive option for sustainable ESSs. One key advantage of VRFBs is their simplified structure, which allows for quick charging and discharging, with the capability to withstand fluctuating RESs. Moreover, while ion-exchange membranes in VRFBs are not completely impermeable to vanadium ions, advancements in membrane technology have significantly reduced cross-contamination [23]. This has led to a growing pursuit of next-generation VRFBs with high electrochemical performance, further solidifying their place as a well-established and promising ESS technology.
Compared to other ESS technologies like PHES and compressed-air energy storage (CAES) systems, batteries shine in their responsiveness. While PHES and CAES systems can take minutes to react to demand fluctuations, batteries deliver power almost instantaneously, with response times measured in milliseconds. This lightning-fast speed makes them ideal for applications requiring immediate power availability, such as grid stabilization and backup systems for critical infrastructure. Additionally, batteries boast higher energy density, meaning they can store more energy per unit volume or weight than their counterparts, offering valuable space and weight savings in certain applications [5].
PHES systems have been widely used for energy arbitrage for HRESs, due to their low energy storage cost and high energy and power contribution [24]. Meanwhile, the only shortcoming of these ESSs is the site dependence, where there should be available altitude differences within the same site. The literature showed that for the feasible use of PHESs in certain sites, the altitude difference between the upper and lower reservoirs and the horizontal distance between them should be higher than 0.1 [25].
One study introduced the use of PHES systems with LIBs to support ESSs without deeply studying the degradation model of LIBs [1]. This study did not consider any other battery system; moreover, the battery model introduced in this study does not consider the hourly degradation of the battery, but it only considers the average degradation which will be considered in this study. Other studies introduced thermal energy storage with battery storage systems as a combined ESS to assure the stability of RESs [26,27].
Beyond ESSs, DSM with dynamic pricing like RTP or ToU tariffs plays a pivotal role in enhancing smart grid reliability and resource utilization. ToU tariffs offer predictable electricity costs by dividing the day into 2–4 pre-defined periods like peak, off-peak, and shoulder hours [28,29,30]. Prices are set in advance, allowing consumers to plan their energy usage for minimal cost. However, this simplicity comes at the cost of limited flexibility for grid operators. Conversely, RTP informs customers of hourly (or even minute-by-minute) electricity prices, providing network operators with greater control over electricity demand and ensuring optimal grid stability. While this approach maximizes resource utilization and promotes RES integration, it requires sophisticated communication systems and consumer adaptation to its dynamic-pricing structure. Understanding the trade-offs between these two pricing models is crucial for designing efficient and reliable smart grids. This study introduces a groundbreaking one-hour-ahead RTP strategy that optimizes cost, reliability, and customer satisfaction, addressing the limitations of existing methods. This approach utilizes advanced forecasting algorithms and optimization models to set dynamic prices reflecting real-time supply and demand conditions. This empowers consumers to make informed choices, like shifting laundry to off-peak hours or participating in DSM programs, potentially leading to cost savings. For grid operators, the proposed RTP strategy is utilized to enhance stability by reducing peak demand and smoothing out renewable energy fluctuations. This translates to increased reliance on RESs, potentially reducing carbon emissions. This cutting-edge approach positions RTP as a key driver for a sustainable and efficient smart grid, paving the way for a cleaner and more resilient energy future.
Table 1 provides a comparative analysis of the proposed ZCSG and existing hybrid energy systems from the literature [1,2,13,28,29,30] in terms of RES integration, ESS technologies, DSM strategies, battery-aging models, LWF implementation, and system greenness. Key findings from the comparative analysis in Table 1 can be summarized as follows:
  • The first three studies [28,29,30] are not entirely green systems, as they incorporate diesel units. In contrast, the remaining studies present fully green systems.
  • All studies, except [13], can be categorized as smart grid systems due to the implementation of DSM strategies. Study [13] is included in the comparison to analyze the performance of different battery technologies, such as SLA, LIB, and VRFB, in conjunction with flywheel systems.
  • All studies, except [1] and the proposed system, neglected hourly battery-degradation models.
  • All studies, except [13], integrated both solar and wind energy sources. Study [13] focused solely on solar PV systems.
  • The only studies which considered the LWF are [28] and the proposed ZCSG.
In conclusion, the proposed ZCSG is the only study among those reviewed that incorporates DSM, accurate battery-aging models, LWF, and a fully green system design.
Table 1. Comparison between the existing hybrid energy systems in the literature review and the proposed ZCSG introduced in this study.
StudyRESsESSDSMBattery-Aging ModelLWFEntire Green
[29] 2021PV and WindSLARTPNoNoDiesel
[30] 2016PV and WindSLAToUNoNoDiesel
[28] 2022PV and WindLIB and PHESRTPNoYesDiesel
[2] 2021PV and WindLIB and PHESRTPNoNoYes
[13] 2019PVLIB and SLA and VRFB flywheelNoNoNoYes
[1] 2023PV and WindLIB and PHESRTPYesNoYes
ProposedPV and WindLIB and PHESRTPYesYesYes

1.2. Motivation and Objectives

This study tackles the dilemma between integrating intermittent renewables and ensuring grid stability. It meticulously evaluates large-scale storage solutions like PHES for energy arbitrage and grid-scale LIBs or VRFBs for crucial frequency regulation. The research delves into comparing the use of the VRFBs compared to the LIBs due to their long lifetime and other outstanding operating performances. Moreover, DSM is used to align demand with RES availability and potentially reduce dependence on storage while enhancing grid reliability. This two-pronged approach is reflected in the study’s detailed modeling of the HRES, encompassing both ESSs and DSM. This meticulous analysis culminates in the selection of the optimal battery technology and tariff strategies that benefit both grid stability and consumer electricity bills.

1.3. Innovation and Contribution

This study focuses on the optimal operation of ZCSGs with PHES and BESS systems, prioritizing both performance and affordability. Two promising battery technologies (VRFB and LIB) were analyzed to identify the most effective for frequency regulation. The study investigates tariff structures based on real-time pricing (RTP) to optimize ZCSG performance and maximize customer satisfaction. The proposed model stands out by introducing a novel dynamic-tariff-estimation mechanism that controls loads based on real-time and future system operation, informed by accurate load and weather forecasting. This approach not only ensures a stable and efficient ZCSG, but also empowers consumers to make informed energy choices. This study’s findings could prove instrumental in replicating sustainable ZCSG design in other regions, paving the way for a more ZCSG future. The following points show the innovation introduced in this paper:
  • Building an accurate model for different components of the ZCSG.
  • Novel hourly models that predict degradation, efficiency, state of charge (SoC), and state of health (SoH) for both LIBs and VRFBs are introduced. These models are based on real-world operating data, providing a more accurate representation of battery performance.
  • An optimal tariff-estimation model to enhance the stability and reliability of the ZCSG with the highest benefits for the customers is introduced.
  • An accurate load and weather forecast methodology is introduced to estimate the current and future situation of the ESS to make the ZCSG system ready for any abnormal operating conditions.
  • A recent Musical Chair Algorithm (MCA) strategy is used for hourly optimal power dispatch for fast and accurate convergence compared to several metaheuristic algorithms.

1.4. Study Outlines

The proposed system integrates PHES, VRFBs, and LIBs as ESSs to ensure reliable and sustainable operation. DSM strategies are further incorporated to enhance system stability. The study outlines the proposed system in detail, starting with an introduction and a comprehensive literature review in Section 1. Section 2 delves into the configuration of the ZCSG with novel models for the LIBs and VRFBs, followed by an introduction of the modified MCA approach in Section 3. Section 4 provides a detailed description of the developed computer program for system analysis. Section 5 details the simulation work, including the simulation program and its input data. The study concludes with key findings and recommendations for future work in Section 6.

2. Zero-Carbon Smart Grid Configuration

This study proposes a ZCSG to reliably power load with renewable energy from wind and PV systems. The ZCSG ensures uninterrupted electricity supply (zero loss-of-load probability) at the lowest possible cost and without any emissions. Various ESSs bridge the gap between the RES generation and fluctuating demand. The PHES system acts as a large-scale ESS, while BESS provides rapid frequency regulation. Given the hot Saudi Arabian climate, the study analyzes LIB and VRFB batteries to identify the most suitable option. The proposed dispatch strategy prioritizes charging batteries whenever excess RES generation is available. If the PHES system is unavailable or its discharge capacity is limited, the BESS kicks in to meet immediate demand [31]. This ZCSG design not only guarantees a clean and reliable power supply for the loads, but also sets a model for sustainable energy infrastructure. The schematic diagram shows the proposed ZCSG in Figure 1.

2.1. Energy Storage Systems

The ZCSG harnesses the power generated from RESs using the benefits of the DSM and the ESSs such as the PHES system, VRFBs, and the LIBs. The PHES system acts as a gravitational battery, using surplus renewable energy to pump water uphill to the high-elevation reservoir. This stored potential energy can be unleashed later, driving turbines to generate electricity when demand peaks. The BESS, on the other hand, delivers lightning-fast responses, drawing upon electrochemical reactions to stabilize the grid frequency by compensating for rapid fluctuations in wind power output. During sunny and windy days, excess energy preferentially charges the BESSs, ensuring their readiness for any sudden dips in generation. This dynamic interplay ensures a continuous power supply. For lack of generation from RES periods, the BESS swiftly bridges the gap, drawing upon its charged reserves until the PHES system takes over, seamlessly releasing its stored energy later in case the BESS cannot afford the required energy by the load. This robust interplay between PHES system and BESS not only guarantees reliable electricity but also paves the way for a sustainable future, slashing carbon emissions and paving the path for greater renewable energy integration.

2.1.1. PHES Model

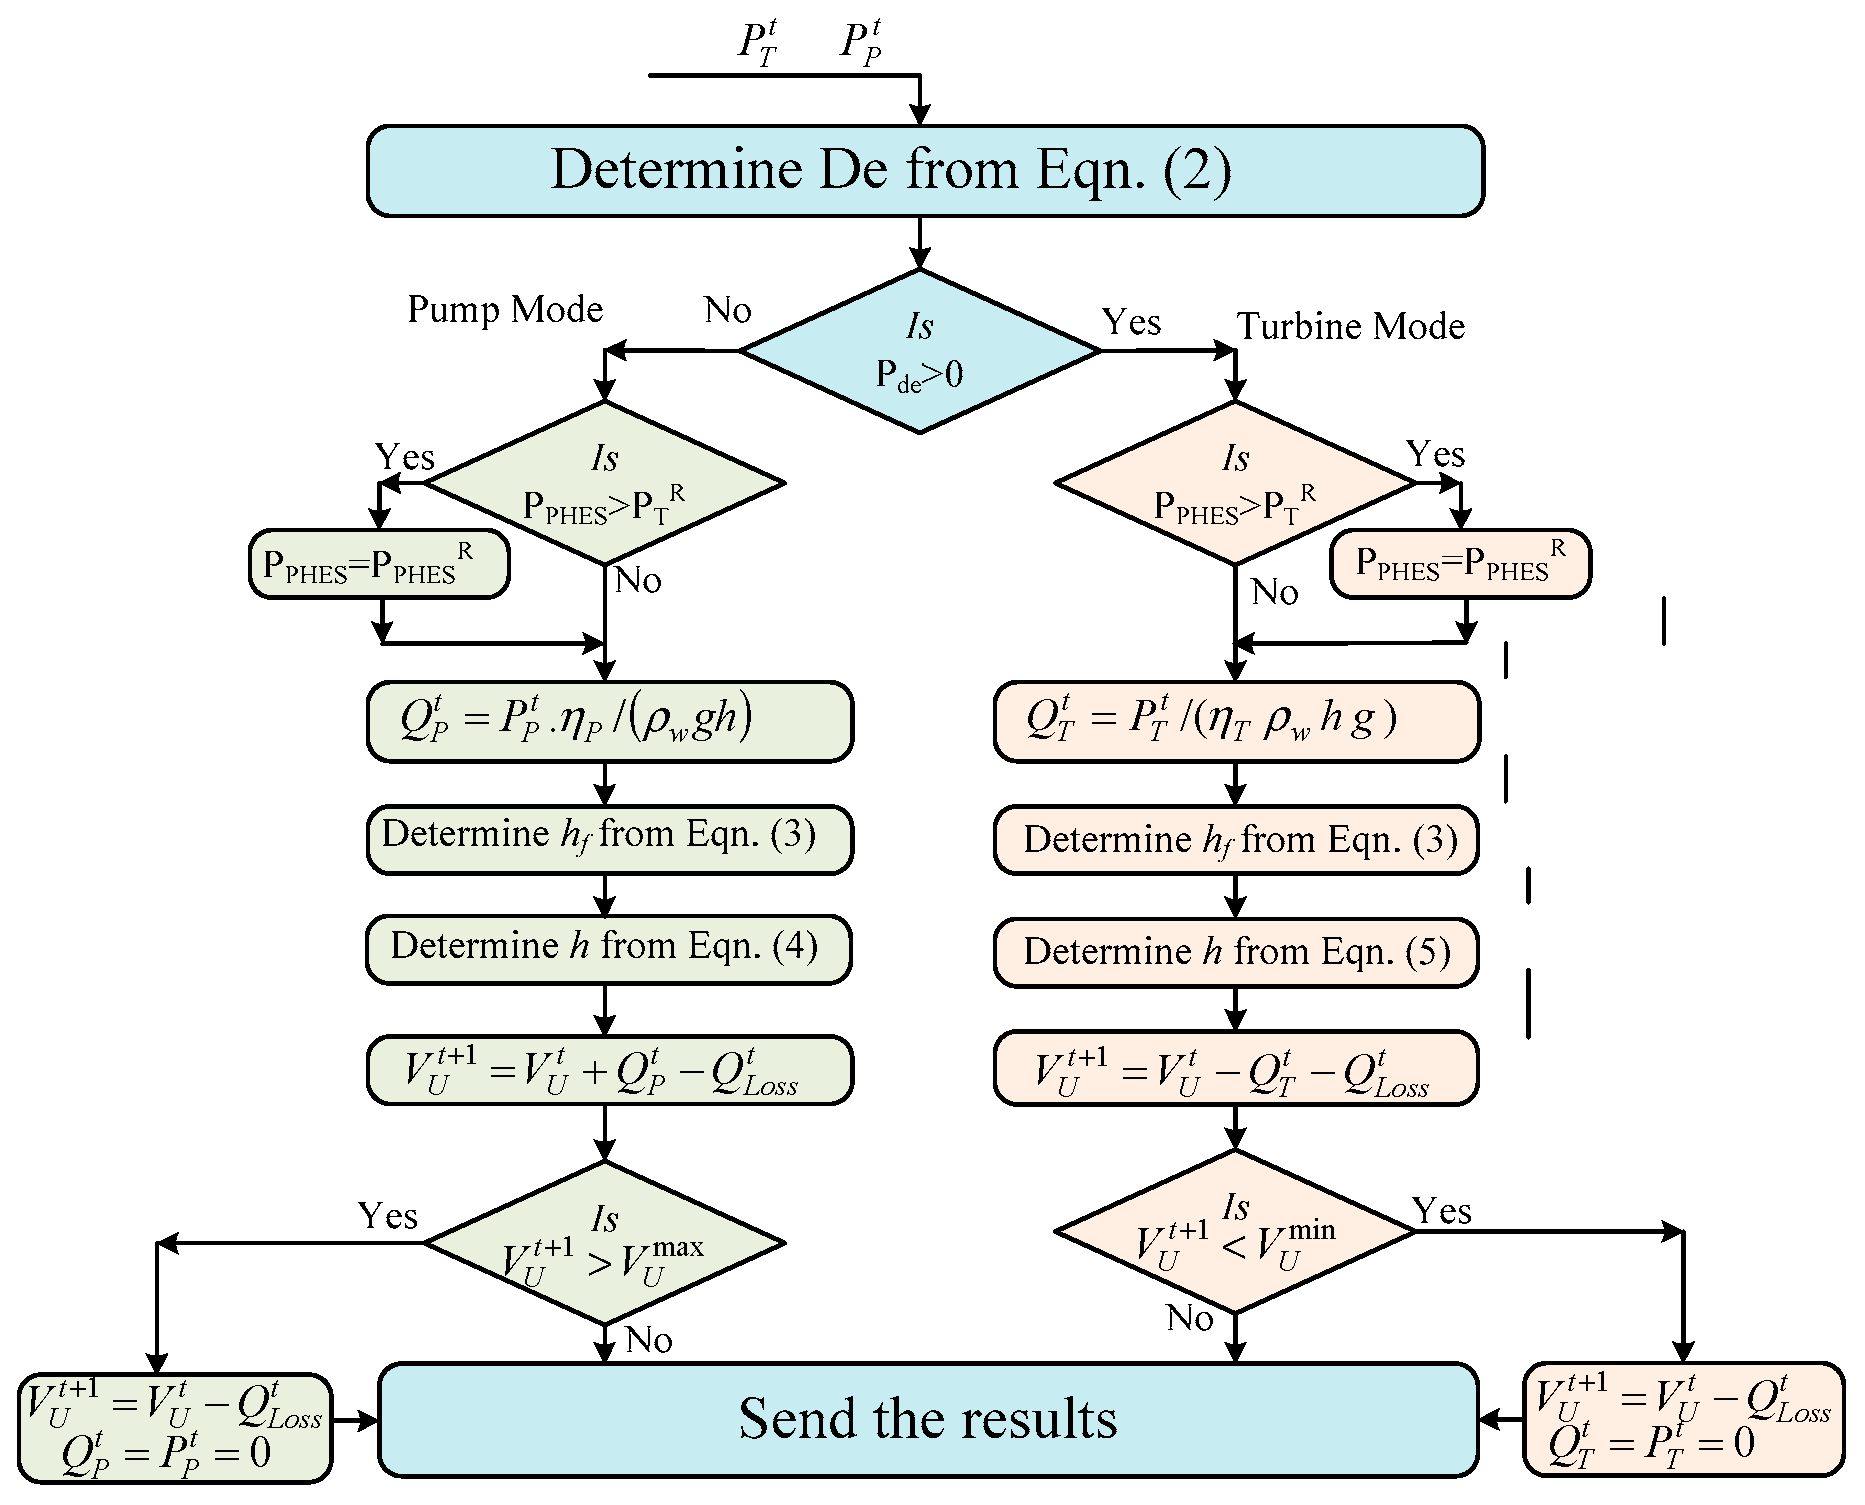
PHES is an optimal option to be used in energy arbitrage in the ZCSG. The PHES system pumps the surplus energy from the lower reservoir to the upper one to store this energy as potential energy to be used during the low-generation periods by using hydraulic turbines. The following equations govern the operation of the PHES system during pump and turbine modes of operation.
PHES pump-turbine units can be equipped with binary (pump turbine linked to an electrical machine) or ternary units (a turbine and a pump coupled to an electrical machine). Because of their narrow stable functioning range, binary units are less versatile and slower than ternary units, although they are nonetheless more often utilized, because of their compactness and affordability. Variable-speed motor-generators (variable-speed pump turbines) have been used with binary pump turbines in recent years to enhance their flexibility and reaction time. This has allowed the turbines to function in a broader variety of operating circumstances.
The main shortcoming of the PHES system is its slow ramp-up from a standstill or during its normal operation. The PHES system needs at least 5 min to successfully operate from a standstill to its full capacity. Moreover, it needs at least 15 s to ramp up from half to full capacity [32]. For this reason, the batteries are required to swiftly regulate abnormal operating conditions; meanwhile, the PHES system is a perfect and cost-effective option for energy arbitrage [32].
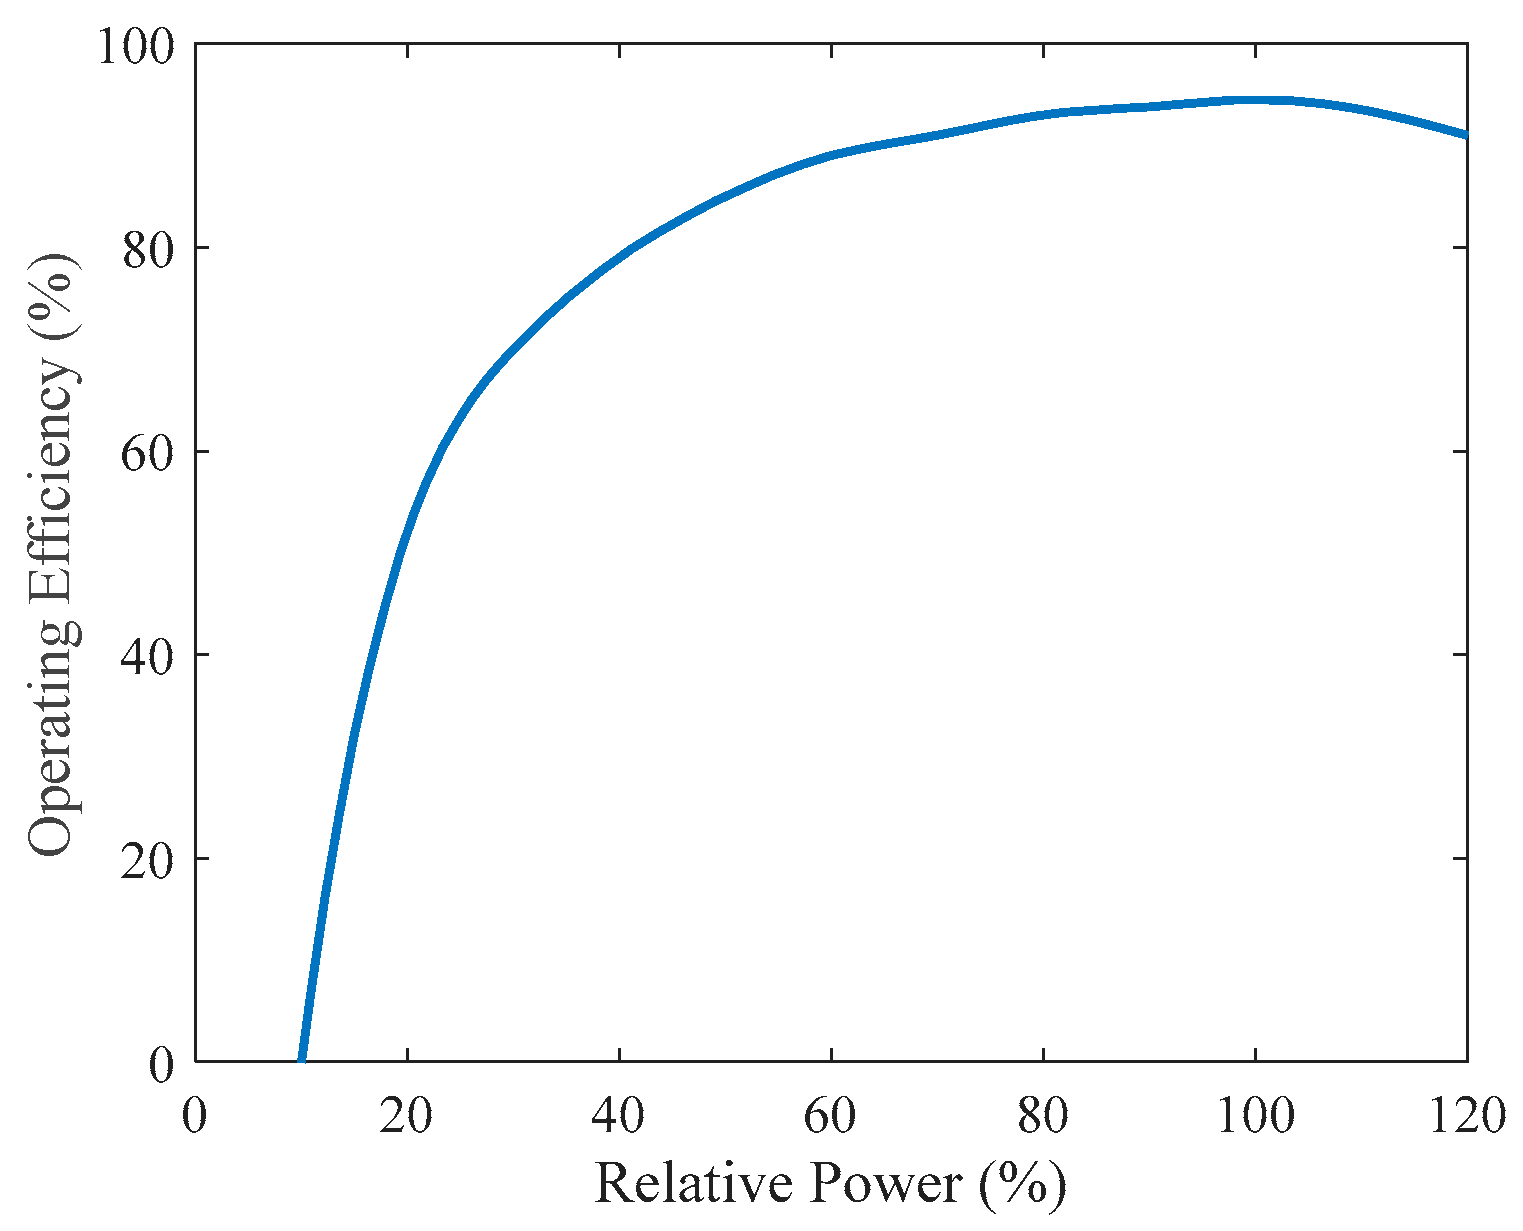
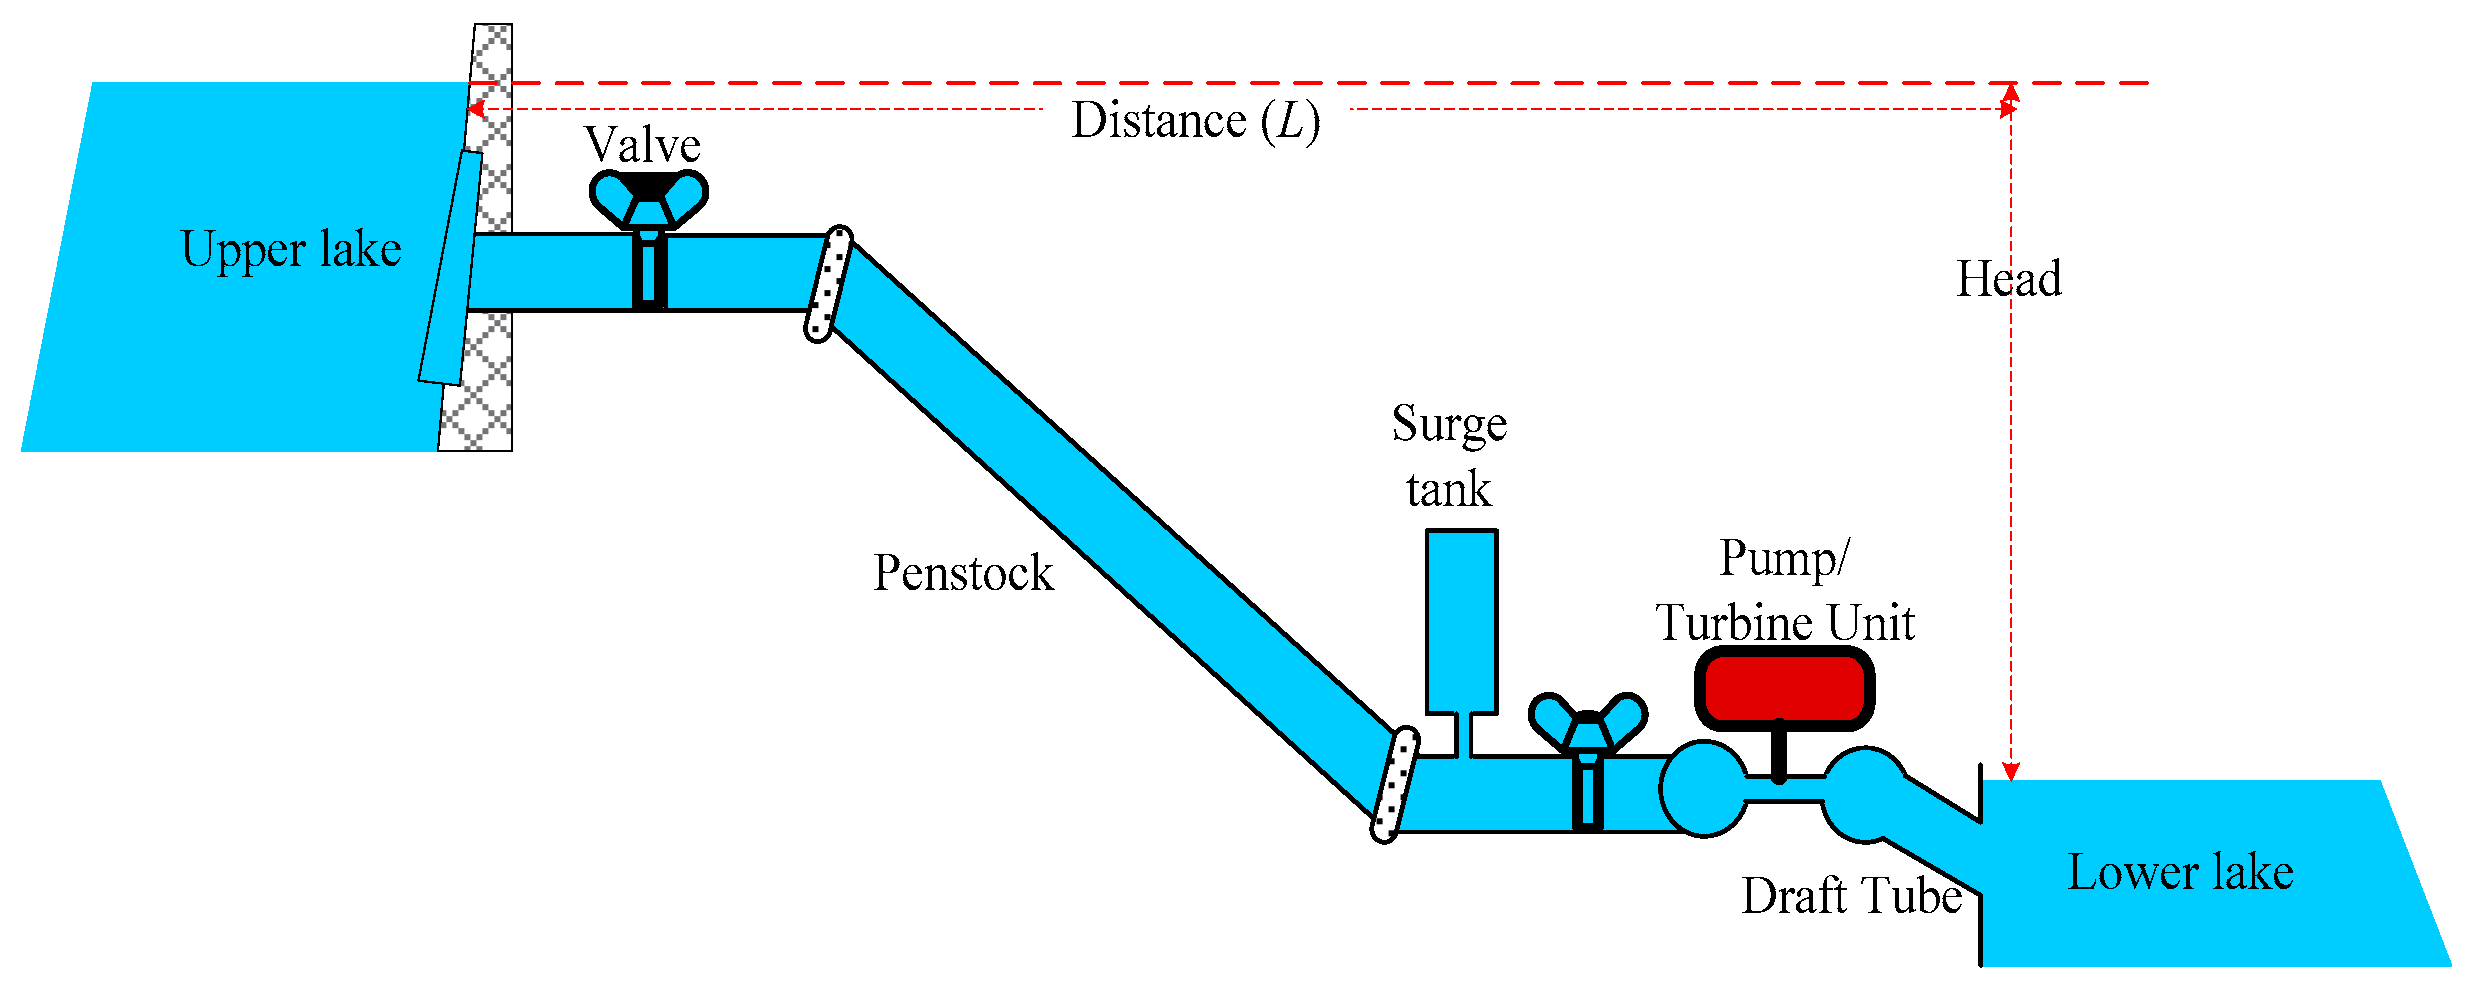
Several types of pump-turbine units can be used in PHES applications such as Francis turbines, reversible Kaplan turbines, Pelton turbines, etc. The selection of the appropriate turbine for a PHES facility depends on various factors, including the head, the flow rate, and the required ramp-up time. By carefully considering these factors, engineers can choose the optimal turbine type to maximize the performance and efficiency of the PHES plant. However, Francis and reversible-Kaplan turbines remain the dominant choices due to their versatility, efficiency, and suitability for the typical operating conditions of the PHES system [32]. Owing to the higher efficiency and lower initial cost, and the lower complexity of the Francis turbine compared to the reversible-Kaplan turbine, it will be used in this study. The main shortcoming of the Francis turbine is its slow ramp rate, which is not important in the presence of the BESS, as in the case of this study. The variation in the efficiency of the Francis turbine with the relative power is shown in Figure 2 [32,33]. The schematic diagram of the PHES system is shown in Figure 3.
Several studies have been proposed to determine the optimal diameter of the penstock [34,35,36]. Warnick, C. et al. [34] proposed the optimal diameter based on the rated flow rate (Q) using the following empirical formula (1) [34]. The same study proposed the optimal diameter in terms of the rated power of the unit ( P P H E S R ) and the head difference between the upper and lower reservoirs (h) as shown in Equation (2) [34]. This formula (2) has been used in the simulation of this study.
D e = 0.72   Q 0.5
D e = 0.72   P PHES 0.43 / h 0.63
The head friction loss in the penstock has been modeled in many studies and has been summarized in [35]. The head friction loss can be obtained from Equation (3) [35].
h f = 0.0826   f   Q 2   L D e 5
where f is the friction factor with a value varying between 0.32 and 0.36 [35], and L is the length of the penstock (1200 m, based on the topological characteristics of the PHES site used in this study).
The effective head of the pump operation is the actual head plus the head due to friction, which can be obtained from Equation (4). Meanwhile, the effective head of the turbine operation is equal to the actual head minus the head losses due to friction, as shown in Equation (5).
h = h t + h f   in   pump   mode
h = h t h f   in   turbine   mode
The generated power from the turbine-generator unit is shown in Equation (6) [37].
P T t = η T   ρ w   h   g   Q T t
where ηT is the turbine-generator unit efficiency, ρw is the water density (1000 kg/m3), g is the acceleration due to gravity, and Q T t is the discharge flow rate (m3/s).
The pump-motor unit power can be obtained from Equation (7) [37].
P t P = Q t P × ρ w g h / η T
where QP is the flow rate through the pump.
The gravitational potential energy stored in the upper reservoir (EU) is obtained from Equation (8) [37],
E U = η T   ρ w   ( V U t V m i n )   g   h
where VU is the volume of water in the upper reservoir; meanwhile, Vmin is the minimum volume of the upper reservoir. The minimum volume of the upper reservoir is chosen as 5% of the rated value, as recommended by [38].
The hourly volume of water in the upper reservoir is equal to the previous hour’s volume minus the flow rate through the turbine plus the flow rate through the pump minus the water loss, which can be obtained from Equation (9).
V U t + 1 = V U t Q T t + Q P t Q L o s s t

2.1.2. LIB Degradation Model

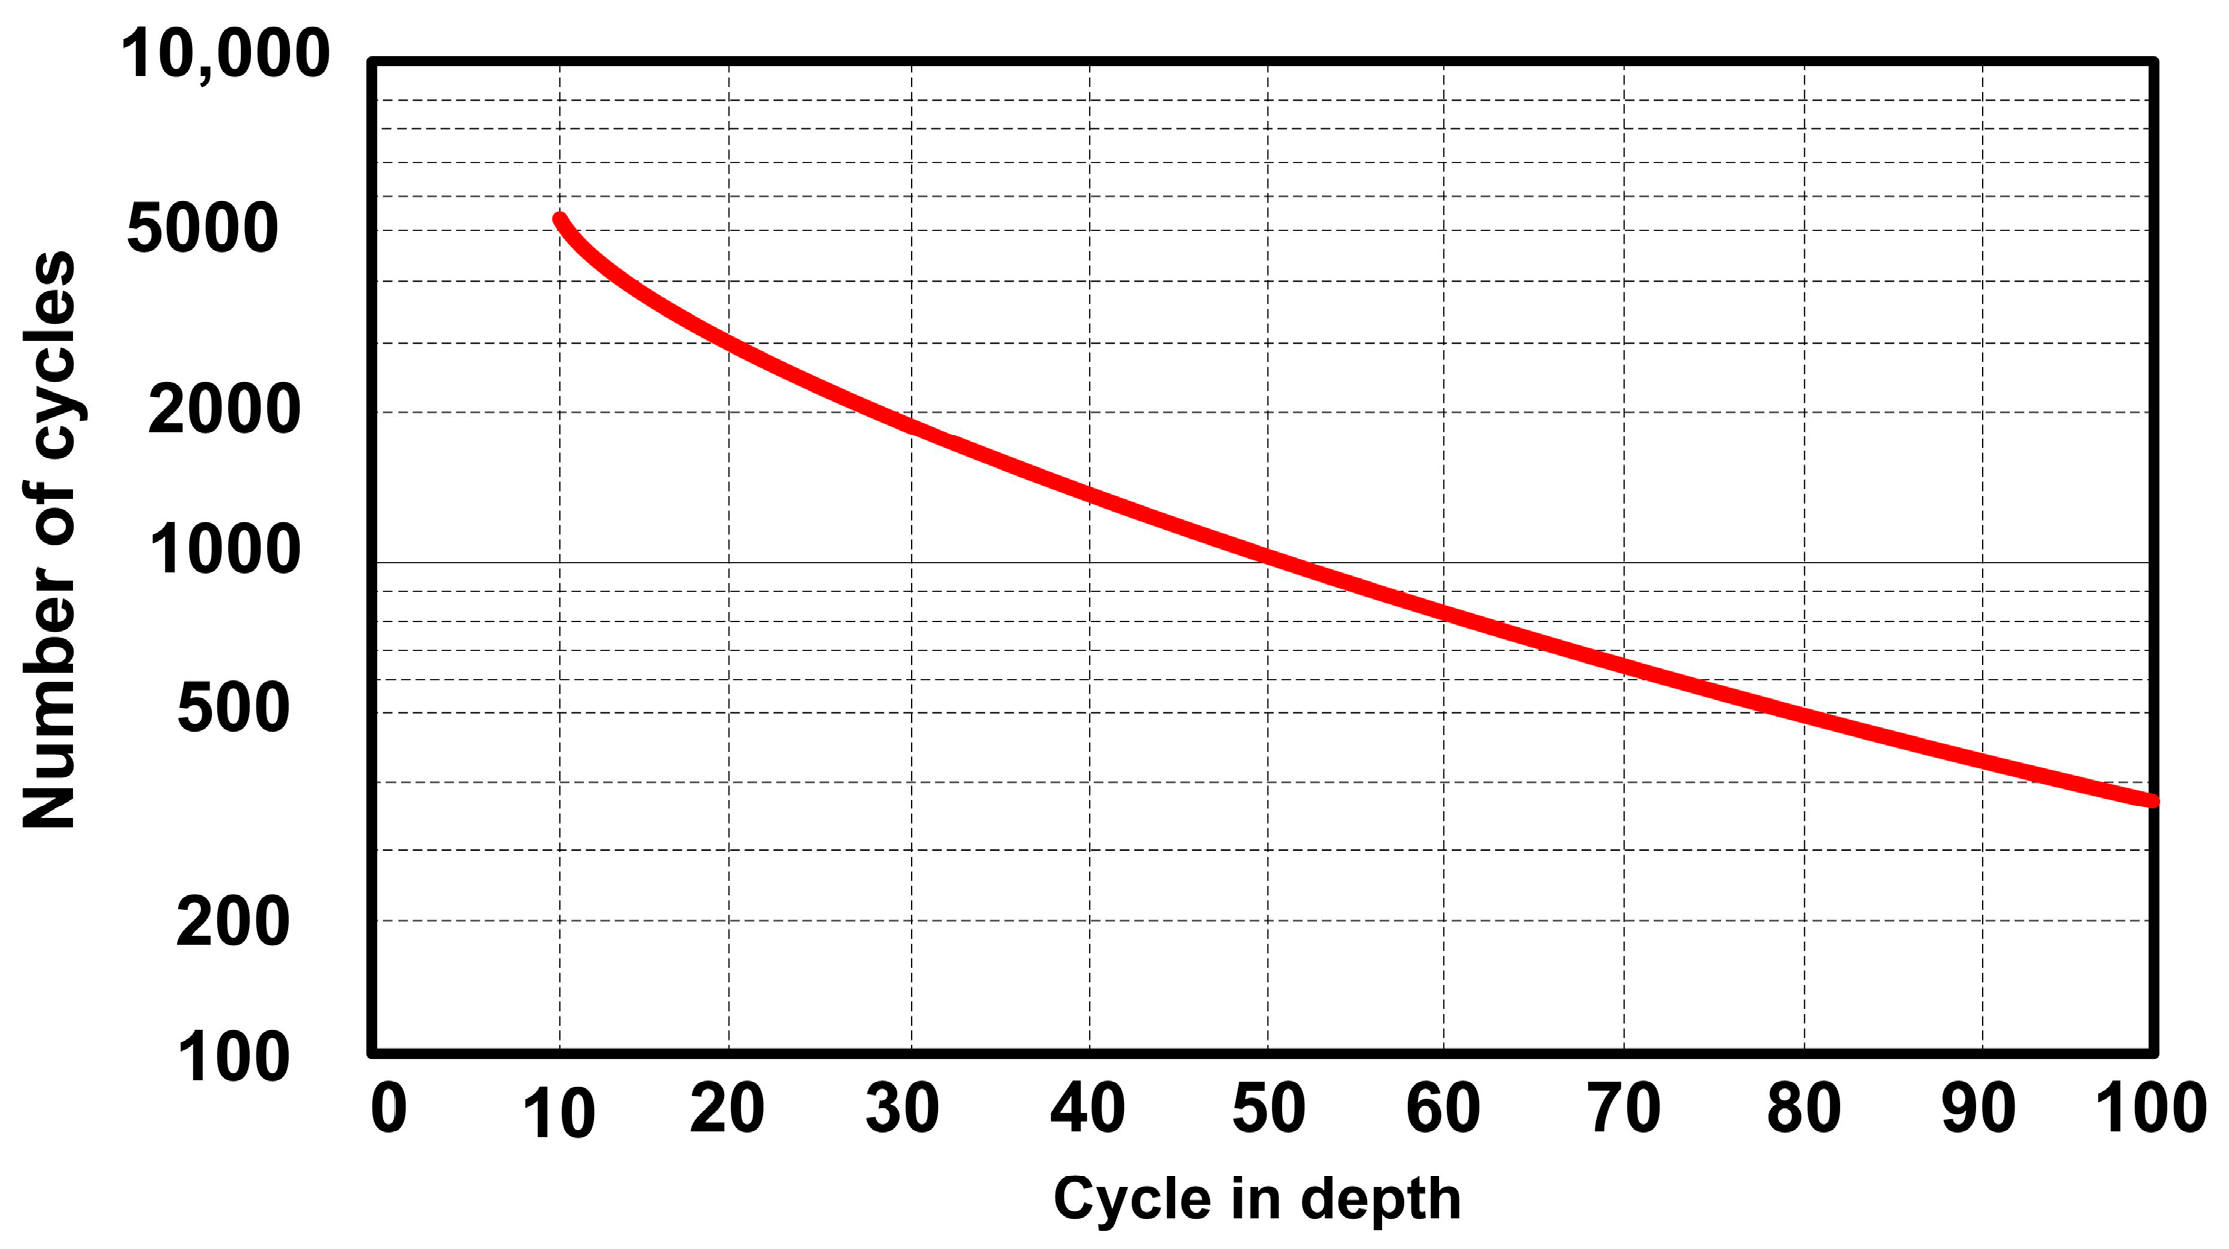
Several technologies are used to manufacture the LIBs, and most of them are differ in the cathode materials. The most suitable technology is the Lithium Iron Phosphate (LiFePO4) due to its high safety, long lifespan, high power density, wide operating temperature, high round-trip efficiency, and reasonable cost [39]. Two different degradations occur inside the LIBs, which are the degradation due to calendar and cycling. The degradation due to the calendar is directly proportional to the operating temperature and the battery state of charge (SoC). The cycling degradation is directly proportional to the operating temperature and the charging/discharging power, and inversely proportional to the SoC. The degradation of the LIBs has been introduced in the literature in many studies [9,10,40,41]. Some studies introduced accurate models that depend on the actual calendar and cycling tests [28,42,43,44], and will be considered in the novel model introduced in this study. In these studies, the LIBs degradation is measured in the lab, and the experimental results are used to determine the model parameters by minimizing the root mean square error (RMSE) between the calculated degradation from the model and the one obtained from the tests. This model is very accurate, but most manufacturers do not provide this data and the calculation should be performed before using the LIBs. Most of the manufacturers provide the relation between the achievable cycle count (ACC) and the depth of discharge (DoD) as shown in Figure 4 [42]. For this reason, the novel degradation model of the LIBs is driven from this curve.
The relation between the number of lifetime cycles and the DoD of the LIBs shown in Figure 4 can be mathematically modeled, as shown in Equation (10) [42].
A C C = a   ·   D o D b
where a and b are fitting parameters that can be obtained from the curve shown in Figure 4.
The DoD is equal to the difference between the maximum and minimum SoCs as shown in Equation (11).
D o D L I B t = 1 E L I B t E L I B R = 1 S o C L I B t
where E L I B R and E L I B t are the rated capacity and the current stored energy of the LIB.
The SoH of the LIB is the ratio between its maximum stored energy ( E L I B max ) to its rated capacity ( E L I B R ), which can be obtained from Equation (12).
S o H = E L I B max E L I B R
The throughput energy that the LIB can process through its lifespan is shown in Equation (13), which considers the charging/discharging efficiency and the degradation capacity through the lifetime of the battery.
E T = 2   ·   η L I B 2   ·   A C C   ·   D o D   ·   E L I B R   .   1 + θ 2
where θ is the percentage of the capacity that the LIB should replace when it reaches this value. This value is 80% in the EV applications [42]; meanwhile, in stationary applications such as the BESSm this value can reach 40% [1].
The degradation density function (DDF) which represents the LIB degradation per unit energy (kWh) can be obtained using Equation (14)
D D F = 1 E T = 1 η L I B 2   ·   A C C   ·   D o D   ·   E L I B R   ·   1 + θ  
From Equation (10) and Equation (14), the DDF can be represented in terms of DoD and SoC as shown in Equation (15) and Equation (16), respectively.
D D F = 1 η L I B 2   ·   a     ·   E L I B R   ·   1 + θ   ·   D o D b 1 = 1 η L I B 2   ·   a     ·   E L I B R   ·   1 + θ   ·   1 S o C b 1
D D F = K D   ·   D o D b 1 = K W   ·   1 S o C b 1
where K D = 1 η L I B 2   ·   a     ·   E L I B R   ·   1 + θ .
The simulation used in this study assumes that the charging/discharging power is constant during each hour (Δt), and for this reason the charging/discharging ramp is modeled for a one-hour period. The total wear-per-hour can be obtained from Equation (17) [45].
D L I B t = t 1 t 1 + Δ t E L I B R   ·   D D F t ( S o C ) d S o C ( t ) d t   d t
The time variation of the SoC ( d S o C ( t ) d t ) can be calculated from Equation (18).
d S o C ( t ) d t = P L I B E L I B R
The following equation is used to determine the degradation occuring inside the LIB per time Δt (one hour in this study).
D L I B t = K D   ·   P L I B 2 b   ·   E L I B R 1 S o C int + P L I B   ·   Δ t E L I B R b 1 S o C int b
where SoCint is the initial SoC of the charging/discharging ramp.

2.1.3. VRFB Model

Vanadium redox flow batteries have emerged as a highly viable and efficient ESS, especially for RESs. They offer several advantages, including high capacity, durability, unparalleled service life, high safety, environmentally friendliness, high energy efficiency, low cross-contamination, and scalability for grid management and backup energy. In comparison to LIBs, VRFBs offer several advantages in RES applications. These include long cycle life, high stability, fast response, and no cross-contamination of the active species. Furthermore, VRFBs can be scaled up for high capacities, making them suitable for large-scale ESSs. When it comes to cost-effectiveness, VRFBs initially have a higher installation cost compared to LIBs [22]. In terms of specific energy-storage requirements, VRFBs have the advantage of being able to scale their capacity by adjusting the size of the electrolyte tanks and the number of active cell stacks. This flexibility makes VRFBs suitable for applications that require large-scale energy storage. Additionally, the abundance and wide distribution of Vanadium resources make VRFBs a more sustainable and environmentally friendly option compared to LIBs, which rely on limited resources such as lithium. VRFBs do not have the risk of thermal runaway or fire, making them a safer choice for large-scale ESSs. Moreover, the desired DoD also plays a critical role in sizing VRFBs for RESs [46].
Utilizing Vanadium as the redox-active material in aqueous solution, VRFBs generate electricity based on the potential differences of the VO2+/VO+2 and V2+/V3+ redox couples separated by a membrane and couples in concentrated sulfuric acid solutions as positive and negative electrolytes, as shown in Figure 5. This study considers the impact of carbon electrodes, in addition to the electrolyte and membrane, on VRFB degradation, as discussed in [47]. Carbon/graphite fiber electrodes play a crucial role in VRFB performance, as the redox reactions of vanadium ions occur on their surface.
Several modeling strategies for the VRFBs have been introduced in the literature, and most of these studies used one factor as a target to be considered, such as thermal modeling [48], loss modeling [49], degradation modeling [50], etc. In this study, all these important parameters have been considered in modeling the VRFBs to determine the accurate cost of charging for a fair comparison with the LIBs.
The relation between the VRFB voltage and the SoC and operating temperature can be obtained from the modified Nernst equation, as shown in Equation (20) [8].
V s t a c k = V e q + 2 R T F S o C 1 S o C ,         V e q = n V c e l l
where Vcell is the standard electrode voltage of the VRFB cell and set as 1.39 V [48], F is the Faraday constant (96,485.33 C/mol), T is the operating temperature, and R is the gas constant [8.3144598 J K−1 mol−1] [48].
The SoC of the VRFB depends on the dispatch power, the current efficiency, and the previous value of the SoC, and it can be shown in Equation (21) and Equation (22) for charging and discharging, respectively [51].
S o C F B t = S o C F B t 1 + P F B t   ·   Δ t   ·   η F B c E F B R   for   discharging
S o C F B t = S o C F B t 1 + P F B t   ·   Δ t η F B d   ·   E F B R for   discharging
where SoCFB is the SoC of the VRFB, PFB is the charging/discharging power of the VRFB, Δt is the window or increment time, η F B c and η F B d are the VRFB charging and discharging efficiencies, and E F B R is the rated capacity of the VRFB in kWh.
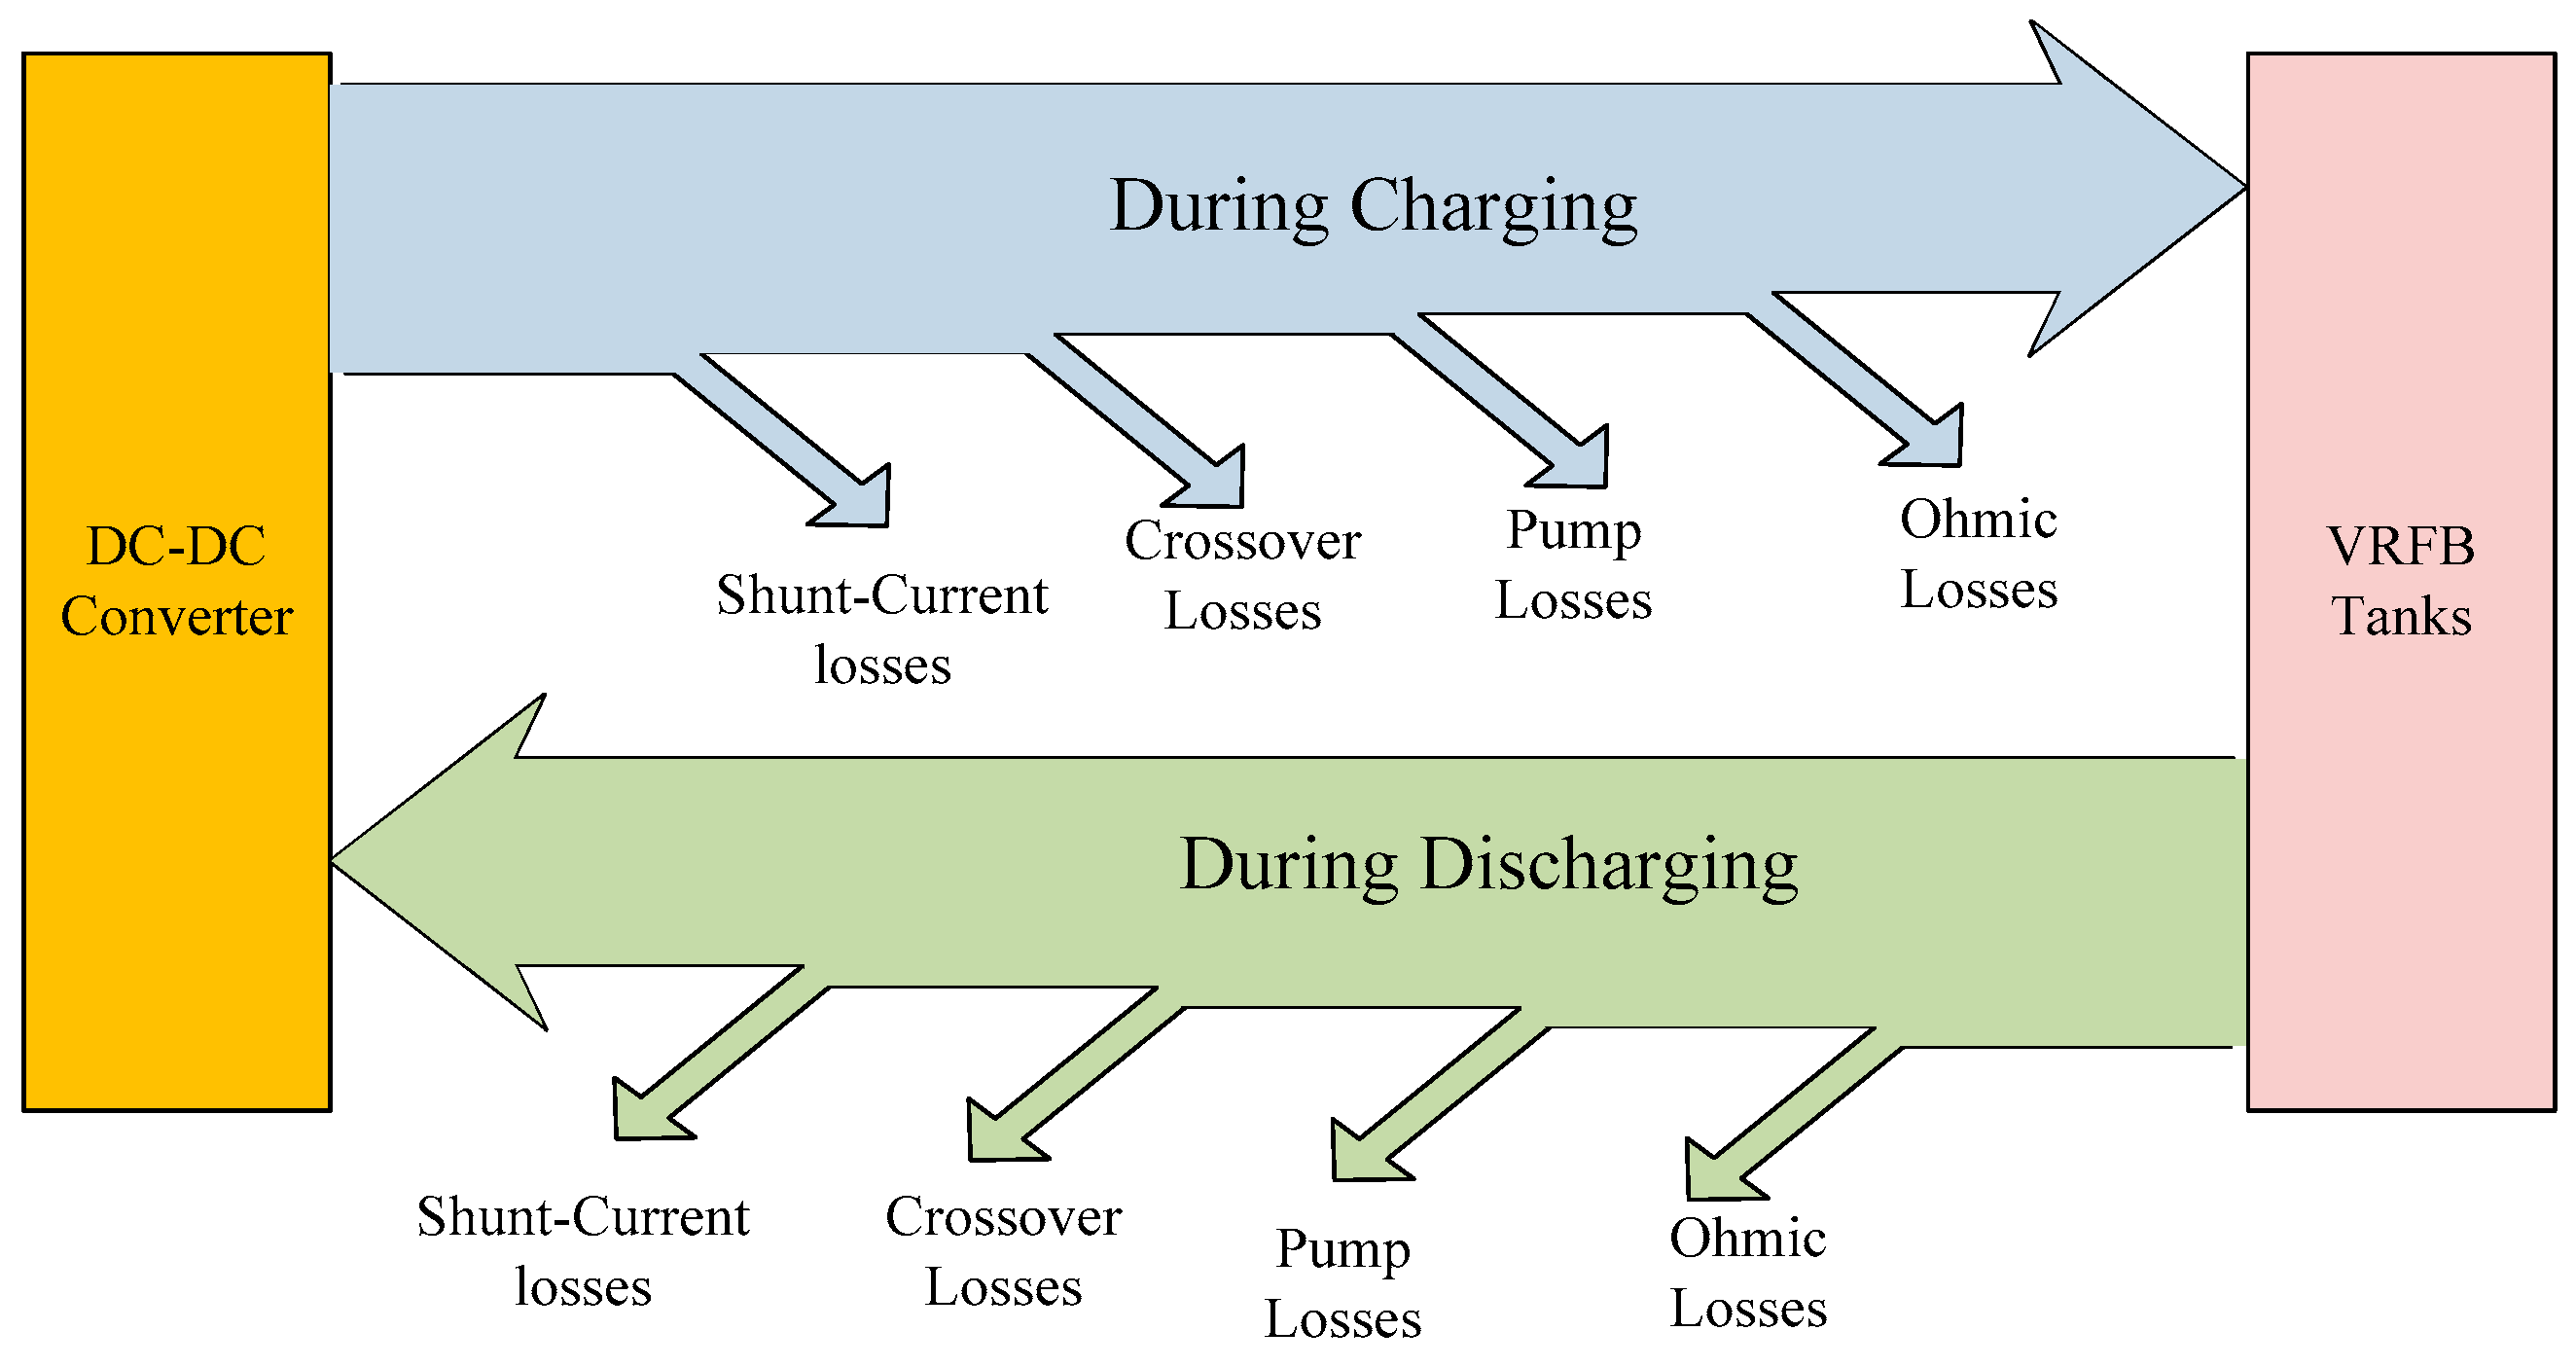
Several losses occur inside the VRFB in ideal, charging, and discharging states. Most of these losses are due to the diffusion of active anodes through the membrane between the two electrolyte tanks. Moreover, there is a hydraulic migration from the positive electrolyte to the negative one during charging. Furthermore, the consumed energy by the two pumps also consumes a significant amount of power which reduces the operating efficiency of the VRFBs [52]. The power-flow diagram through the VRFB in charging and discharging is shown in Figure 6. VRFBs experience energy losses that reduce their overall efficiency. One of the losses is called Ohmic loss, which is generated as heat due to the internal resistance. This resistance comes from the battery’s parts (electrodes, electrolytes, separators) and increases with higher current or colder electrolytes. The other losses are called the pump losses, which represent the energy dissipated across the pumps of the two tanks. The crossover losses are losses due to the Vanadium ion migration through the VRFB’s membrane, moving from one side to the other. This migration zaps the battery’s power and shrinks its potential. Finally, the shunt-current losses occur due to the energy escaping the VRFB active anodes through the membrane, which can significantly reduce the efficiency of the VRFB.
The overall efficiency during the charging and discharging depends on the voltage and stack efficiencies of the VRFB, as shown in Equation (23) and Equation (24), respectively.
η F B c = η v c   ·   η s c   for   charging
η F B d = η v d   ·   η s d   for   discharging
where η v c and η s c are the voltage and stack efficiencies during charging, which can be determined from Equation (25) and Equation (26), respectively [51]. Meanwhile, η v d and η s d are the voltage and stack efficiencies during charging, which can be determined from Equation (27) and Equation (28), respectively [51].
η v c = a v o T e   S o C + b v o T e + c v o a v c   S o C + b v c P F B c E F B R + c v c   S o C + d v c
η s c = a s c   S o C + b s c P F B c E F B R + c s c   S o C + d s c P F B c E F B R
η v d = a v d   P F B d E F B R   + b v d   S o C + c v d a v o T e   S o C + b v o T e + c v o
η s d = P F B d E F B R a s d   P F B d E F B R + b s d S o C S o C 1 + c s d  
where a v o , b v o , and c v o are constants depending on the idle state of the VRFB; meanwhile, a v c   , b v c , c v c , d v c are the charging parameters of the VRFB, which can be determined from [51] and are shown in Table 2, P F B c is the charging power of the VRFB, E F B R is the rated capacity of the VRFB in kWh, a v d   , b v c , c v d , d v d are the discharging parameters of the VRFB which can be determined from [51] and are shown in Table 2, and P F B d is the discharging power of the VRFB.
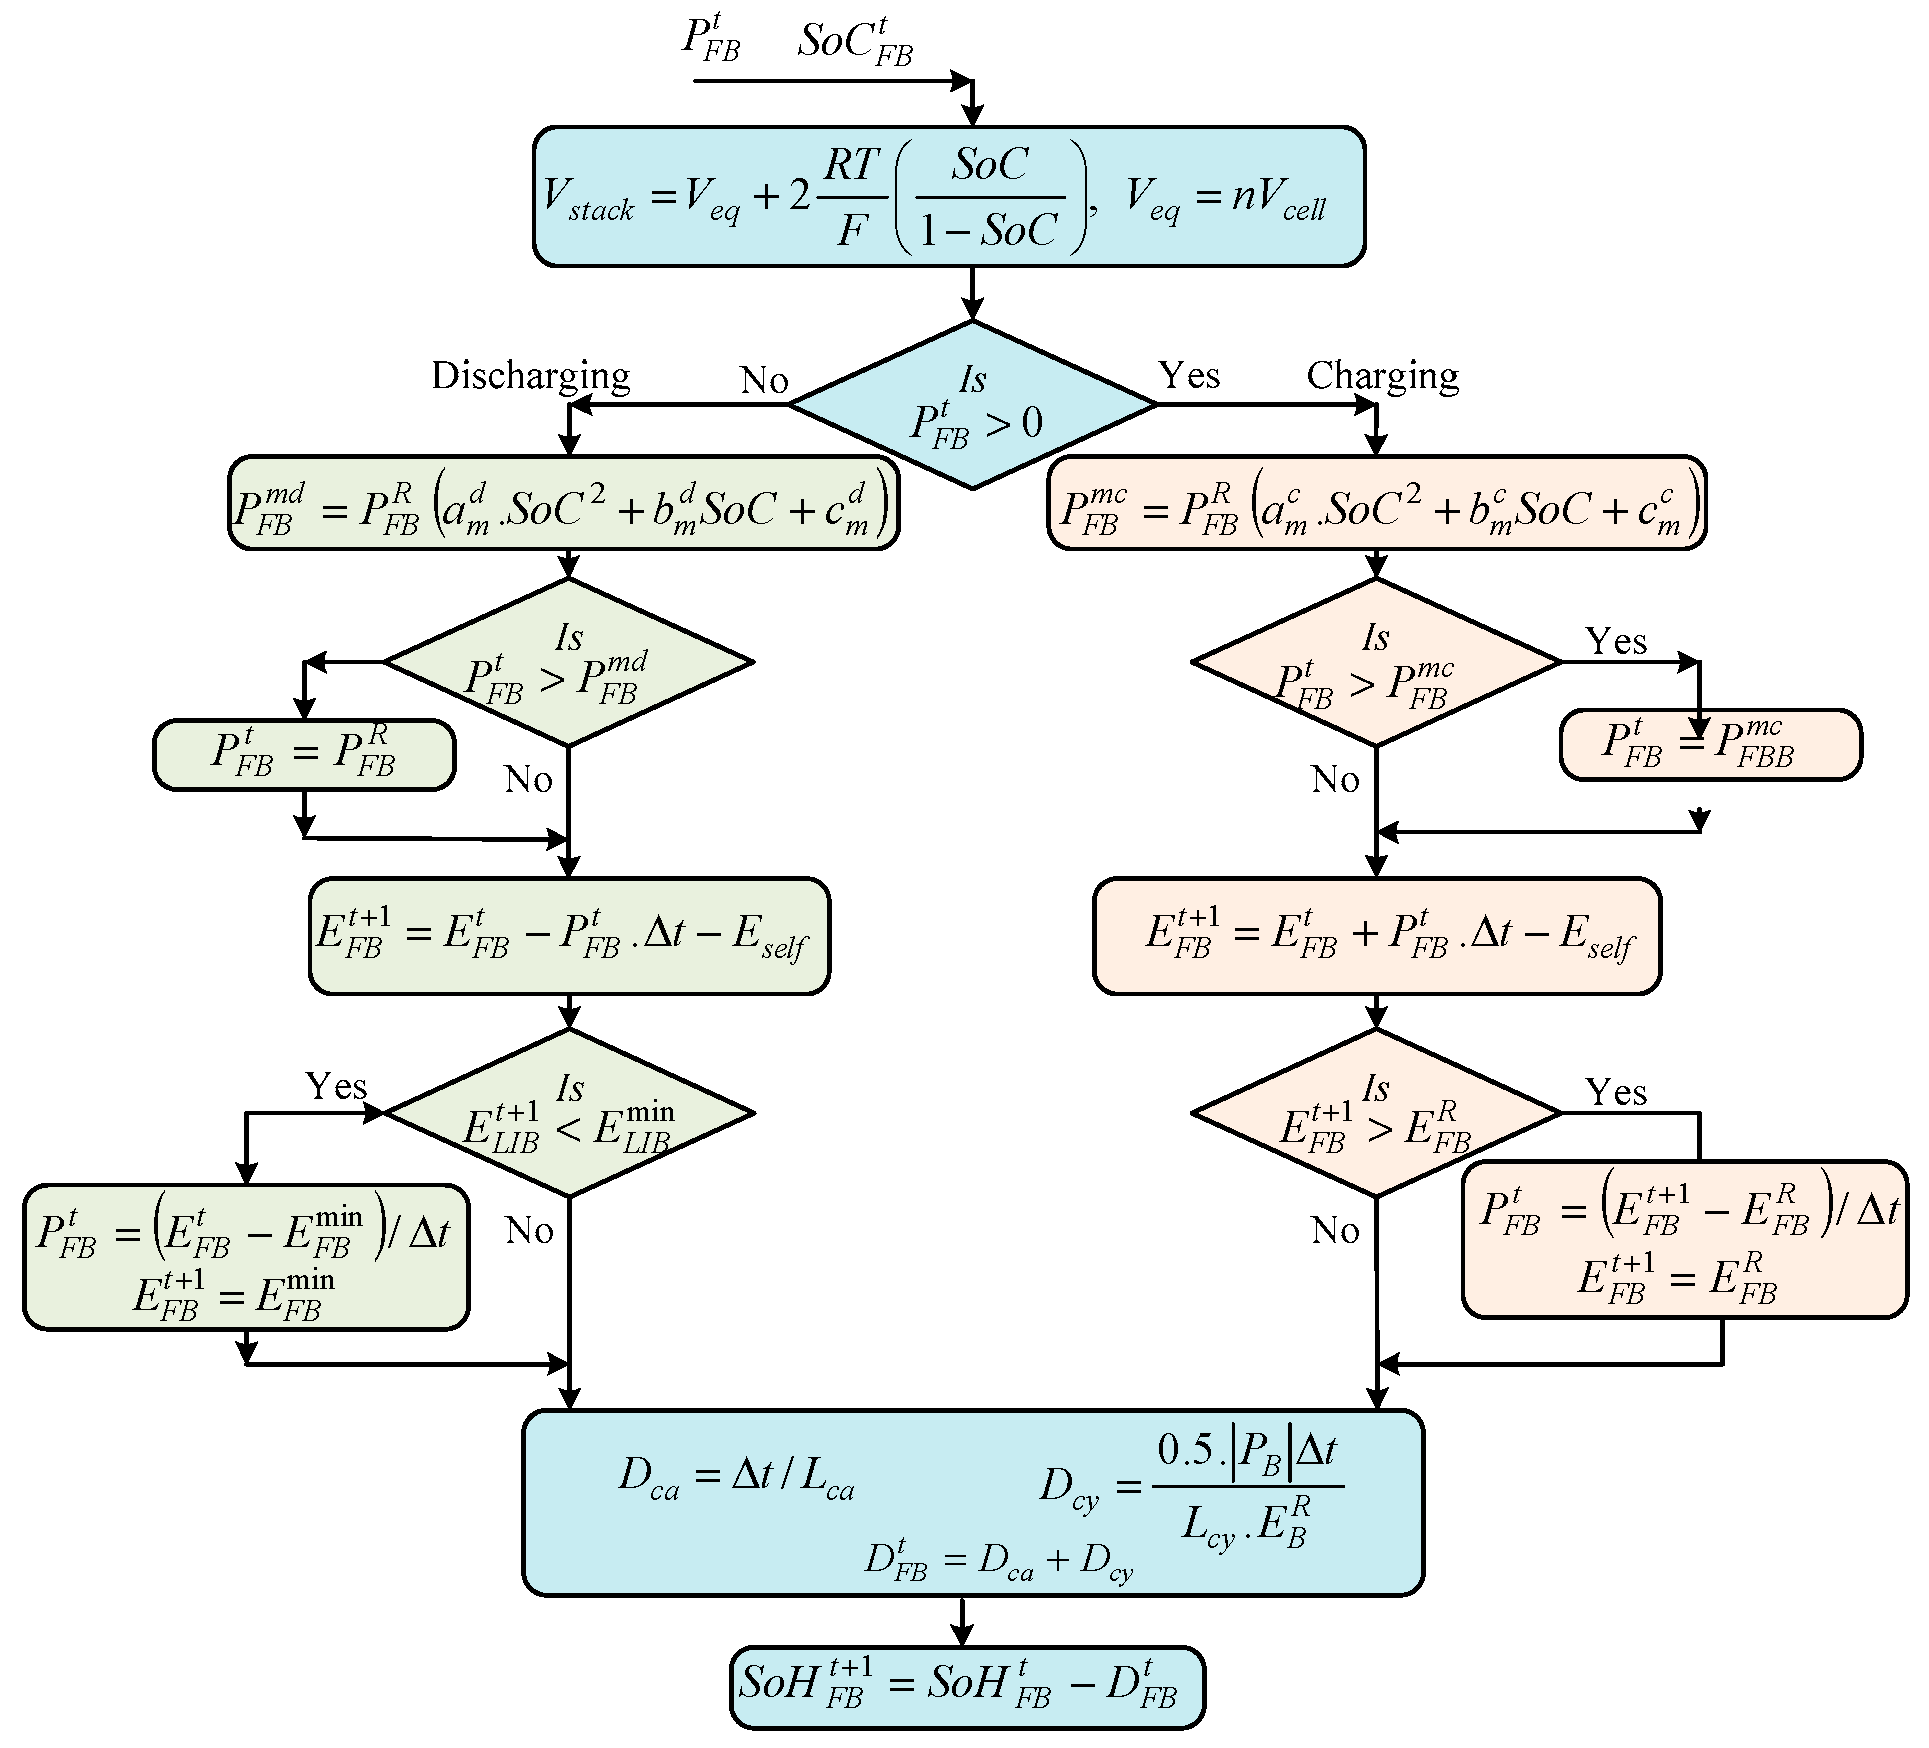
The maximum charging/discharging power that the VRFB can process is a function of its SoC, as shown in Equation (29) and Equation (30), respectively [7]. The simulation should take these values of charging/discharging powers as constraints during the operation of the VRFB, as will be shown in the flowchart showing the VRFB model in Section 4.
P F B m c = P F B R   a m c   . S o C 2 + b m c S o C + c m c  
P F B m d = P F B R   a m d   . S o C 2 + b m d S o C + c m d  
where P F B m c , P F B m d are the maximum power dispatch of the VRFB during charging and discharging, respectively.
The lifespan of the VRFBs is substantially longer than LIBs, and it can reach more than 25 years [48,49,50]. Moreover, the capacity degradation is negligible in many studies [7,51]. Meanwhile, few studies considered the degradation that occurs inside the VRFB as a consideration [10,18,50]. For this reason, the aging model for the VRFB shown in [50] is used to determine the degradation cost. Two different degradation mechanisms occur inside the VRFBs, the calendar and cycling degradations. The overall degradation is the summation of these two degradations, as shown in Equation (31). The calendar degradation during a certain period is shown in Equation (32), where Lca is the total time to reduce the SoH from 100% to 80% of the battery due to storing in the VRFB. The cycling degradation is due to the normal operation (charging/discharging) of the VRFB, as shown in Equation (33), where Lcy is the total time to reduce the SoH from 100% to 40% of the battery due to cycling [50].
D t = D c a + D c y
D c a = Δ t / L c a
D c y = 0.5   ·   P B Δ t L c y   ·   E B R
Understanding degradation modeling in the VRFB is crucial for predicting and managing the performance and lifespan of the battery. This involves studying the degradation mechanisms and factors that contribute to the deterioration of the VRFB’s performance over time. By analyzing and modeling degradation in VRFBs, researchers can optimize VRFB design, operation strategies, and maintenance protocols to enhance the longevity and efficiency of the VRFB. Additionally, degradation modeling in the VRFB allows for the identification of potential issues such as electrode fouling, membrane degradation, and side reactions, which can affect the overall performance of the VRFB. This information can be used to develop strategies for mitigating degradation and improving the overall durability of VRFBs in RESs.
By thoroughly evaluating these factors, including energy capacity, power output, DoD, lifetime, and cost-effectiveness, a properly sized VRFB can be designed and integrated into the ZCSG, allowing for efficient energy storage and utilization.

2.2. Demand-Side Management

Despite its advantages in flexibility and grid stability, RTP presents implementation challenges. It demands sophisticated communication infrastructure and relies on a delicate balance between fair pricing and the ZCSG stability. To address these hurdles, a novel one-hour-ahead pricing strategy that guarantees optimal performance is introduced on three key fronts: maximizing grid reliability, minimizing customer costs, and maintaining user satisfaction. This novel strategy leverages a multi-objective function that carefully balances these competing objectives, a core focus of this study which is shown in the following subsections.

2.3. Zero-Carbon Smart Grid Reliability

The reliability of the ZCSG can be measured using many reliability indices, such as the loss of load probability (LOLP), the loss of energy expected (LOEE), etc., as shown in Equation (34) and Equation (35), respectively [1]. Different evaluation indices should be considered in the design of the HRES. These indices are shown in the following equations:
L O L P = i = 1 8760 t o u t a g e ( i ) / 8760
where toutage is the time that the system cannot fully feed the loads with each need, where this value equals 1 in the case where the HRES cannot feed the electric loads with its needs, and equals 0 otherwise.
L O E E = t = 1 8760 P d e ( t ) / t = 1 8760 P L ( t )
where Pde(t) is the energy that the HRES cannot afford at time t.
The hourly discrepancy between the generated energy from the RESs and the demand power, considering the current difference and the forecasted difference, can be modeled by using the forecasted factor (FF), as shown in Equation (36).
F F t = 1 N F   ·   P L A i = 1 N F P G t + i P L t + i P L A   ·     i
where NF is the number of forecasted hours, P G t + i is the generated power from RESs at i-hours ahead, i is a variable between 1 and NF, and P L o t + i is the demand power at i-hour ahead.
The situation of the ESS at any hour can be measured by the energy stored in the upper reservoir of the PHES plus the energy stored in the battery, in addition to the forecasted difference between the generation and the loads in the coming hours, which can be obtained from the value of FF, as shown in Equation (37).
C S E ( t ) = R V U t + E B R E U R ·   S o C B t + F F
where the R V U t is the ratio of the present upper-reservoir volumes to their maximum value, which can be obtained from Equation (38), E B R is the rated capacity of the battery, E U R is the rated capacity stored in the upper reservoir of the PHES, and S o C B t is the current SoC of the battery used.
R V U t = V U t V U min / V U R V U min

2.4. The Revenue of the ZCSG

The hourly revenue is the difference between the total hourly income and the cost. The income is equal to the load power multiplied by the tariff. Meanwhile, the cost is divided into two categories, constant and variable costs. The constant cost represents the cost of assets per hour. Meanwhile, the variable cost represents the variable costs depending on the operation of the devices during the current hour, such as degradation of the batteries and the loss costs of the ESS devices such as batteries and PHES, as shown in Equation (39). The constant cost represents the LCOE due to the constant cost, which can be obtained from Equation (40) multiplied by the load power PL(t). The variable cost is the cost associated with the degradation cost of the batteries and the maintenance cost of the PHES, as shown in Equation (40).
Re v t = p t   ·   P L t C c t C v t
Re v t = p t L C c t   ·   P L t P H E S O & M t   ·   P P H E S t D C B E S S t
where pt is the hourly tariff, LCc is the hourly levelized cost due to constant costs, PL is the modified load power, PHESO&M is the hourly maintenance and operation costs of the PHES per kW, PPHES is the power processed by the PHES, and DCBESS is the hourly degradation cost, which can be obtained from Equation (19) and Equation (33) for LIBs and VRFBs, respectively.
The hourly constant cost of the ZCSG system represents the net present cost of assets divided by the total hours of the project, as shown in Equation (41).
L C c t = N P C C   ·   C R F T P   ·   8760
where CRF is the capital recovery factor which can be determined from Equation (42), TP is the project lifetime (years), and NPCC is the net present cost of assets (constant cost), which can be determined from Equation (43).
C R F = r 1 + r T P 1 + r T P 1
where r is the interest rate.
N P C C = I C + R C + O M C c S A L
where IC is the initial cost, RC is the replacement cost, OMCc is the constant operating and maintenance cost (OMC), which depends on the cost per time, not on the normal operating of the device, and SAL is the salvage price of the retired components.
The initial cost (IC) of the ZCSG system includes the cost of all components, including the cost of the feasibility study and any consulting fees, the cost of installation, etc., as shown in Equation (44).
IC = WTIC + PVIC + BAIC + PHESIC
where WTIC, PVIC, BAIC, and PHESIC are the IC of the costs of wind energy systems, PV energy systems, BESS, and PHES, respectively.
The WTIC is equal to the number of wind turbines (WTs) multiplied by the cost of each unit. PVIC is equal to the area of the required PV system multiplied by the cost per m2. The BAIC is the cost of the battery system, which is different in the case of LIBs and the VRFB, where the BAIC for LIBs is obtained by multiplying the capacity of the LIBs by the cost per kWh. Meanwhile, the cost of the VRFBs depends on the cost per energy capacity plus the cost of power capacity, which can be determined from Equation (45).
B A I C F B = C E   ·   E F B R + C P   ·   P F B R
where CE is the cost per kWh capacity of the VRFB, CP is the cost per kW power capacity of the VRFB, E F B R is the energy capacity of the VRFB, and P F B R is the power capacity of the VRFB.
The initial cost of the PHES is equal to the cost of installing the upper reservoir dam plus the cost of the pump-turbine unit, as shown in Equation (46).
P H I C I C = V U R v u C   +   P P H E S R   ·   p P H E S C
where V U R is the rated volume of the upper reservoir, v u C is the cost of the upper dam per m2 of the volume of the upper reservoir, P P H E S R is the rated power of the pump-turbine unit of the PHES, and p P H E S C is the price of the pump-turbine unit per kW of its capacity.
The net present replacement cost of any device d can be obtained from Equation (47).
R C d = i = 1 N R d I C d 1 + r T P   ·   i N R d + 1
where NRd is the number of replacements of component d, which can be obtained from Equation (48), and ICd is the initial cost of the component d,
N R d = R o u n d u p     T P L T d 1
where LTd is the lifetime of the component d.
The OMC is divided into two parts: the first part depends on the schedule maintenance, which is called the constant OMC, and the other part depends on the real use of the components, which is called the variable OMC. The constant OMKC depends on the size of each component and it is counted as a percentage of the initial cost of this component, and it can be obtained from Equation (49).
O M C c = i = 1 T P Y e a r l y O M C r + 1 i
The salvage price can be determined based on selling the retired devices once they reach their end of life, and it can be obtained from Equation (50),
S A L d = i = 1 N R d + 1 S A L Price r + 1 T P   ·   i N R d + 1
The variable cost of the BESS depends on the degradation that occurs in the battery which can be obtained from Equation (19) and Equation (33) for the LIBs and VRFBs, respectively.
The hourly variable operating and maintenance cost of PHES V P H E S O & M t is is equal to the start-up cost and wear cost of the turbine-pump unit, which is obtained from Equation (51).
V P H E S O & M t = μ S + P P H E S t   ·   p P H E S
where μ is the flag for the previous operation of the PHES, where it equals zero if the PHES was working during the previous hour ( P P H E S t   > 0 ); otherwise, it equals one, and p P H E S is the variable OMC of the PHES per kW.

2.5. The Customer Satisfaction Factor

The customer satisfaction factor is used to measure the satisfaction of the customers. This factor measures the difference between the original load power and the modified power due to the RTP, used as a ratio of the original power, as shown in Equation (52). When electricity tariffs rise, the adjusted power consumption will decrease automatically, considering the flexibility of different loads. This adjustment might lead to customer dissatisfaction (reflected in a negative satisfaction factor). Conversely, tariff reductions incentivize increased power consumption beyond the original level, potentially improving customer satisfaction. Therefore, maximizing the satisfaction factor becomes crucial to ensure a positive customer perception of the system.
S F t = P L t P L o t P L o t
The price elasticity of demand (PED) is the relation between the change in power due to the change in tariff, which can be obtained as shown in Equation (53) [24,29].
P E D = Δ P L t / P L A Δ p t / p 0
where the Δ P L t is a change in power due to the change in tariff, and p0 is the base tariff.

2.6. Multi-Objective Function

In the proposed study, there is multi-objective function used for an optimal operation which should be performed hourly to optimally determine the flow of power, based on the objective functions shown in Equations (37), (39) and (52), which can be collected in one objective function, as shown in Equation (54). All these terms should be maximized to obtain the optimal techno-economical operation of the ZCSG system.
F O t = m 1   ·   C S E t + m 2   ·   Re v t + m 3   ·   S F t
where m1 to m3 are weight values for each single objective function which should satisfy the condition shown in Equation (55).
m 1 + m 2 + m 3 = 1
A detailed description of the optimization algorithm is shown in Section 4, and a detailed description of the logic used in the simulation program is shown in Section 5.

2.7. Energy-Balance Modeling

Due to the discrepancy between the generated power from RESs and the load, there is a need for ESSs, which may add a significant increase in the cost of energy utilized due to their high cost. For this reason, the DSM strategy is used with the ESS synergistically to maintain the highest reliability with a reasonable cost of energy. The dispatch between the generated power and the loads in the presence of the DSM is introduced in this section. During the positive difference between the generated power from RESs (PG = PW + PPV) and the load requirements, the surplus power (PD) will move to charge the ESS. If PD > 0, then PD will go to the ESS. The optimization algorithm will manage the share between the ESS devices and the loads using maximization of the multi-objective function shown in Equation (54). Meanwhile, if the PD < 0, then the deficit power should be compensated from the ESS, and the DSM should control the loads using the RTP tariff, using the multi-objective function shown in Equation (54). The following constraints are used to manage the flow of power among the ZCSG components.
The power of the pump-turbine unit ( P P T t ) should be less than or equal to the rated power of the turbine-pump unit ( P T P R ) as shown in Equation (56).
P P T t P P T R
The upper-reservoir volume should be between the upper and lower limits of the volume, as shown in Equation (57). The lower reservoir is big enough, and its limit will not be considered in this analysis.
V U min V U t V U max
where VU(t) is the volume of the upper reservoir, and V U min and, V U max are the highest and lowest volumes allowed for the upper reservoir, respectively.
The SoC of the battery should not exceed the boundary limits by the manufacturer as shown in Equation (58).
S o C max S o C t S o C min
where S o C min and S o C max are the minimum and maximum SoC of the BESS.
The charging- and discharging-power limits of the VRFB should not exceed the allowable values obtained from Equations (29) and Equation (30), respectively, and are summarized in Equations (59) and (60).
0 < P F B c P F B m c   for   charging
0 < P F B d P F B m d   for   discharging
The maximum charging/discharging power of the LIB is as recommended by the manufacturer, where the maximum power is equal to the rated energy [1].

3. Musical Chairs Algorithm

The optimal operation needs an optimization algorithm to run hourly to determine the optimal power dispatch between ZCSG components and the optimal tariff, based on the optimal function shown in Equation (54). The optimization algorithms are time-consuming, and to obtain an accurate result, a large number of search agents should be used to avoid premature convergence. Unfortunately, the increase in search agents will increase the convergence time, where there is a trade-off between the accuracy of the results and the convergence time. For this reason, a recent optimization algorithm called the musical chairs algorithm (MCA) is used, in which this optimization algorithm started the optimization algorithm with a high number of search agents to enhance the exploration and gradually removed the worst search agents with the progress of optimization steps to reduce the convergence time, while maintaining the highest accuracy of the results.
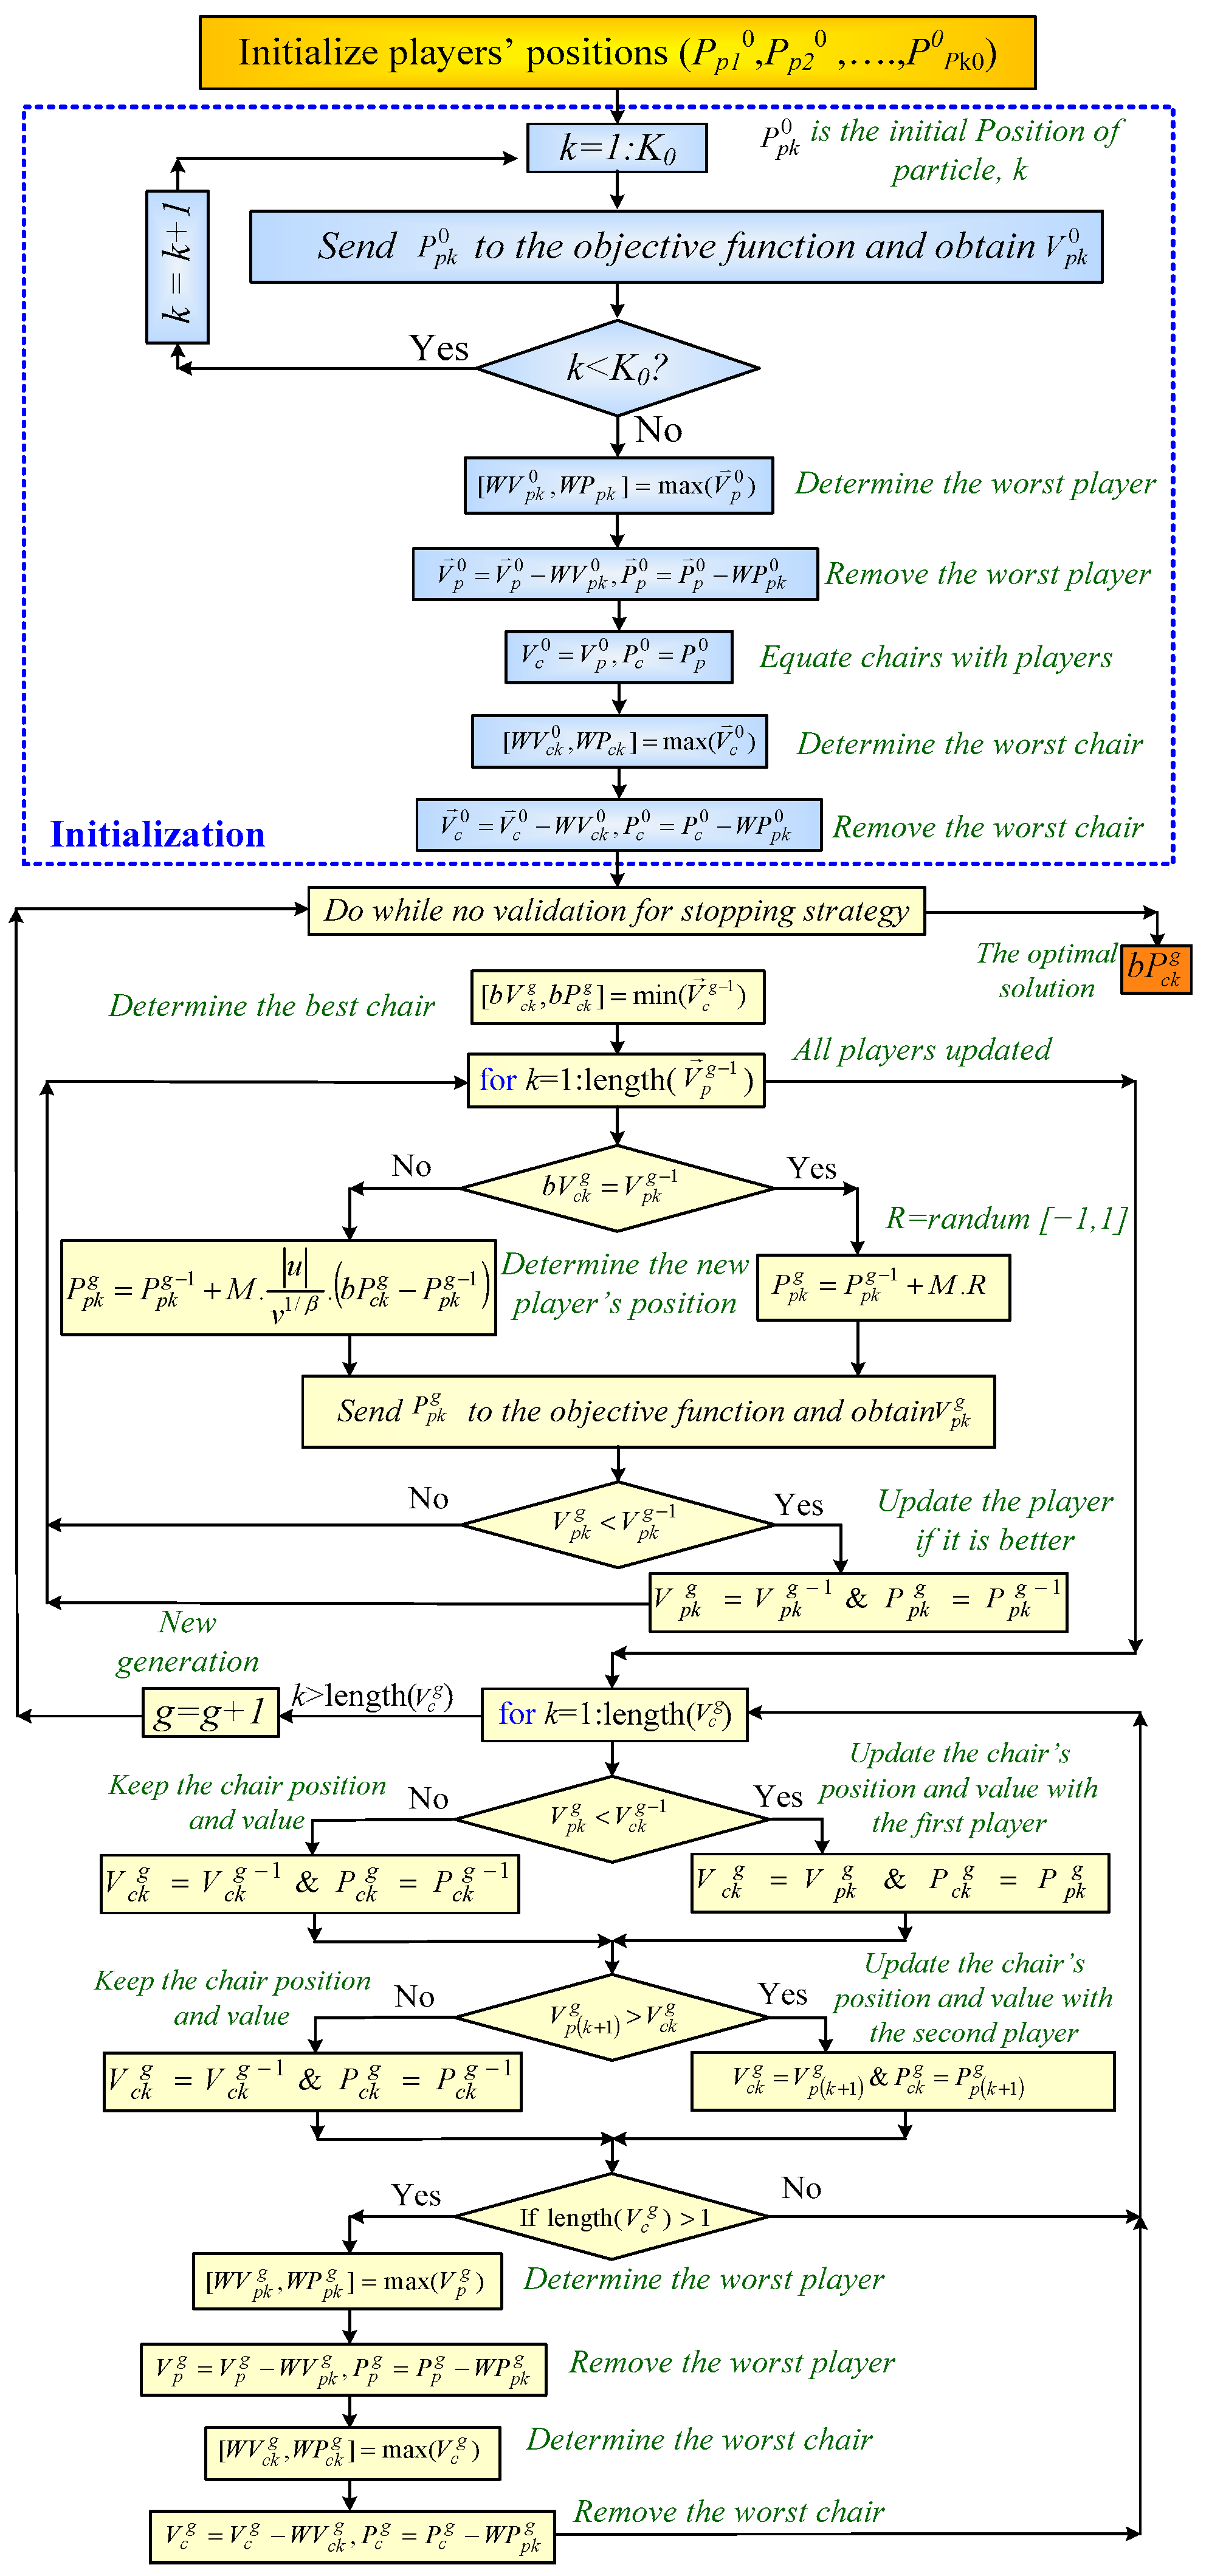
The MCA is a metaheuristic optimization algorithm inspired by the musical chair game in which n players rotate around n − 1 chairs while the music is playing. Once the music stops, each player takes the nearest chair, and one of the players who cannot capture the chair is called a “loser”, as shown in Figure 7 [42,53]. This loser and one chair should be removed and the game started again. In the last round, there will be one chair and two players, and the one who takes this chair is called “the winner”. The same logic is used to implement the MCA, where n of search agents (players) will start searching for the optimal solution once the worst player, who has the lowest fitness function, is removed from the swarm. The player’s position and value will be transmitted to the next chair as initial values for chairs. The new position of players can be obtained from Equation (61) [53]. The flowchart showing the logic of the MCA is shown in Figure 8.
d p k i = d p k i 1 + M · u v 1 / β · d b e s t d p k i
where i is the iteration number (i = 1, 2, …… it), where it is the total number of iterations, k is the searching agent order within the swarm (k = 1, 2, … n), n is the number of players in each iteration, Μ is a constant used to determine the step of transition of the MCA, b is the step size of the L’évy flight [53], and u and v are the uniform distributions matrices which can be obtained from (62) [54].
u N 0 , σ u 2       a n d     v N 0 , σ v 2
where σ u and   σ v are the variance of u and v matrices, and they can be determined from Equation (63) [54].
σ u = Γ ( 1 + β ) · sin π · β / 2 Γ 1 + β 2 · β   ·   2 β 1 2           a n d     σ v = 1

3.1. Validating Player Positions and Evaluating Fitness

The algorithm first verifies that the new positions assigned to each player comply with the predefined constraints specific to their technology. Subsequently, these positions are communicated to the ZCSG model, which calculates their corresponding fitness values.
The next step involves comparing the latest fitness value of each player to their value from the previous iteration. If the new value is an improvement, it replaces the older one, along with the associated player position. Conversely, if the older value is superior, it remains unchanged.

3.2. Competition Between Players and Chairs

Each chair’s fitness is then compared to the fitness of its two closest players. If a chair outperforms both players, its position and fitness remain unchanged. However, if either player demonstrates better fitness, the chair’s position and fitness are overwritten with the superior player’s information.

3.3. Optimization and Stopping Criteria

The algorithm checks if the number of chairs exceeds one. If so, the player and chair with the lowest fitness values are eliminated from their respective groups. This step aims to eliminate the less-performant options and to encourage the exploration of new possibilities.
Finally, the stopping criteria are evaluated. If met, the position and fitness of the best chair represents the optimal solution, and the algorithm terminates. Otherwise, the process loops back to the beginning, recalculating player positions based on Equation (61) for the next iteration.

4. The Simulation Program

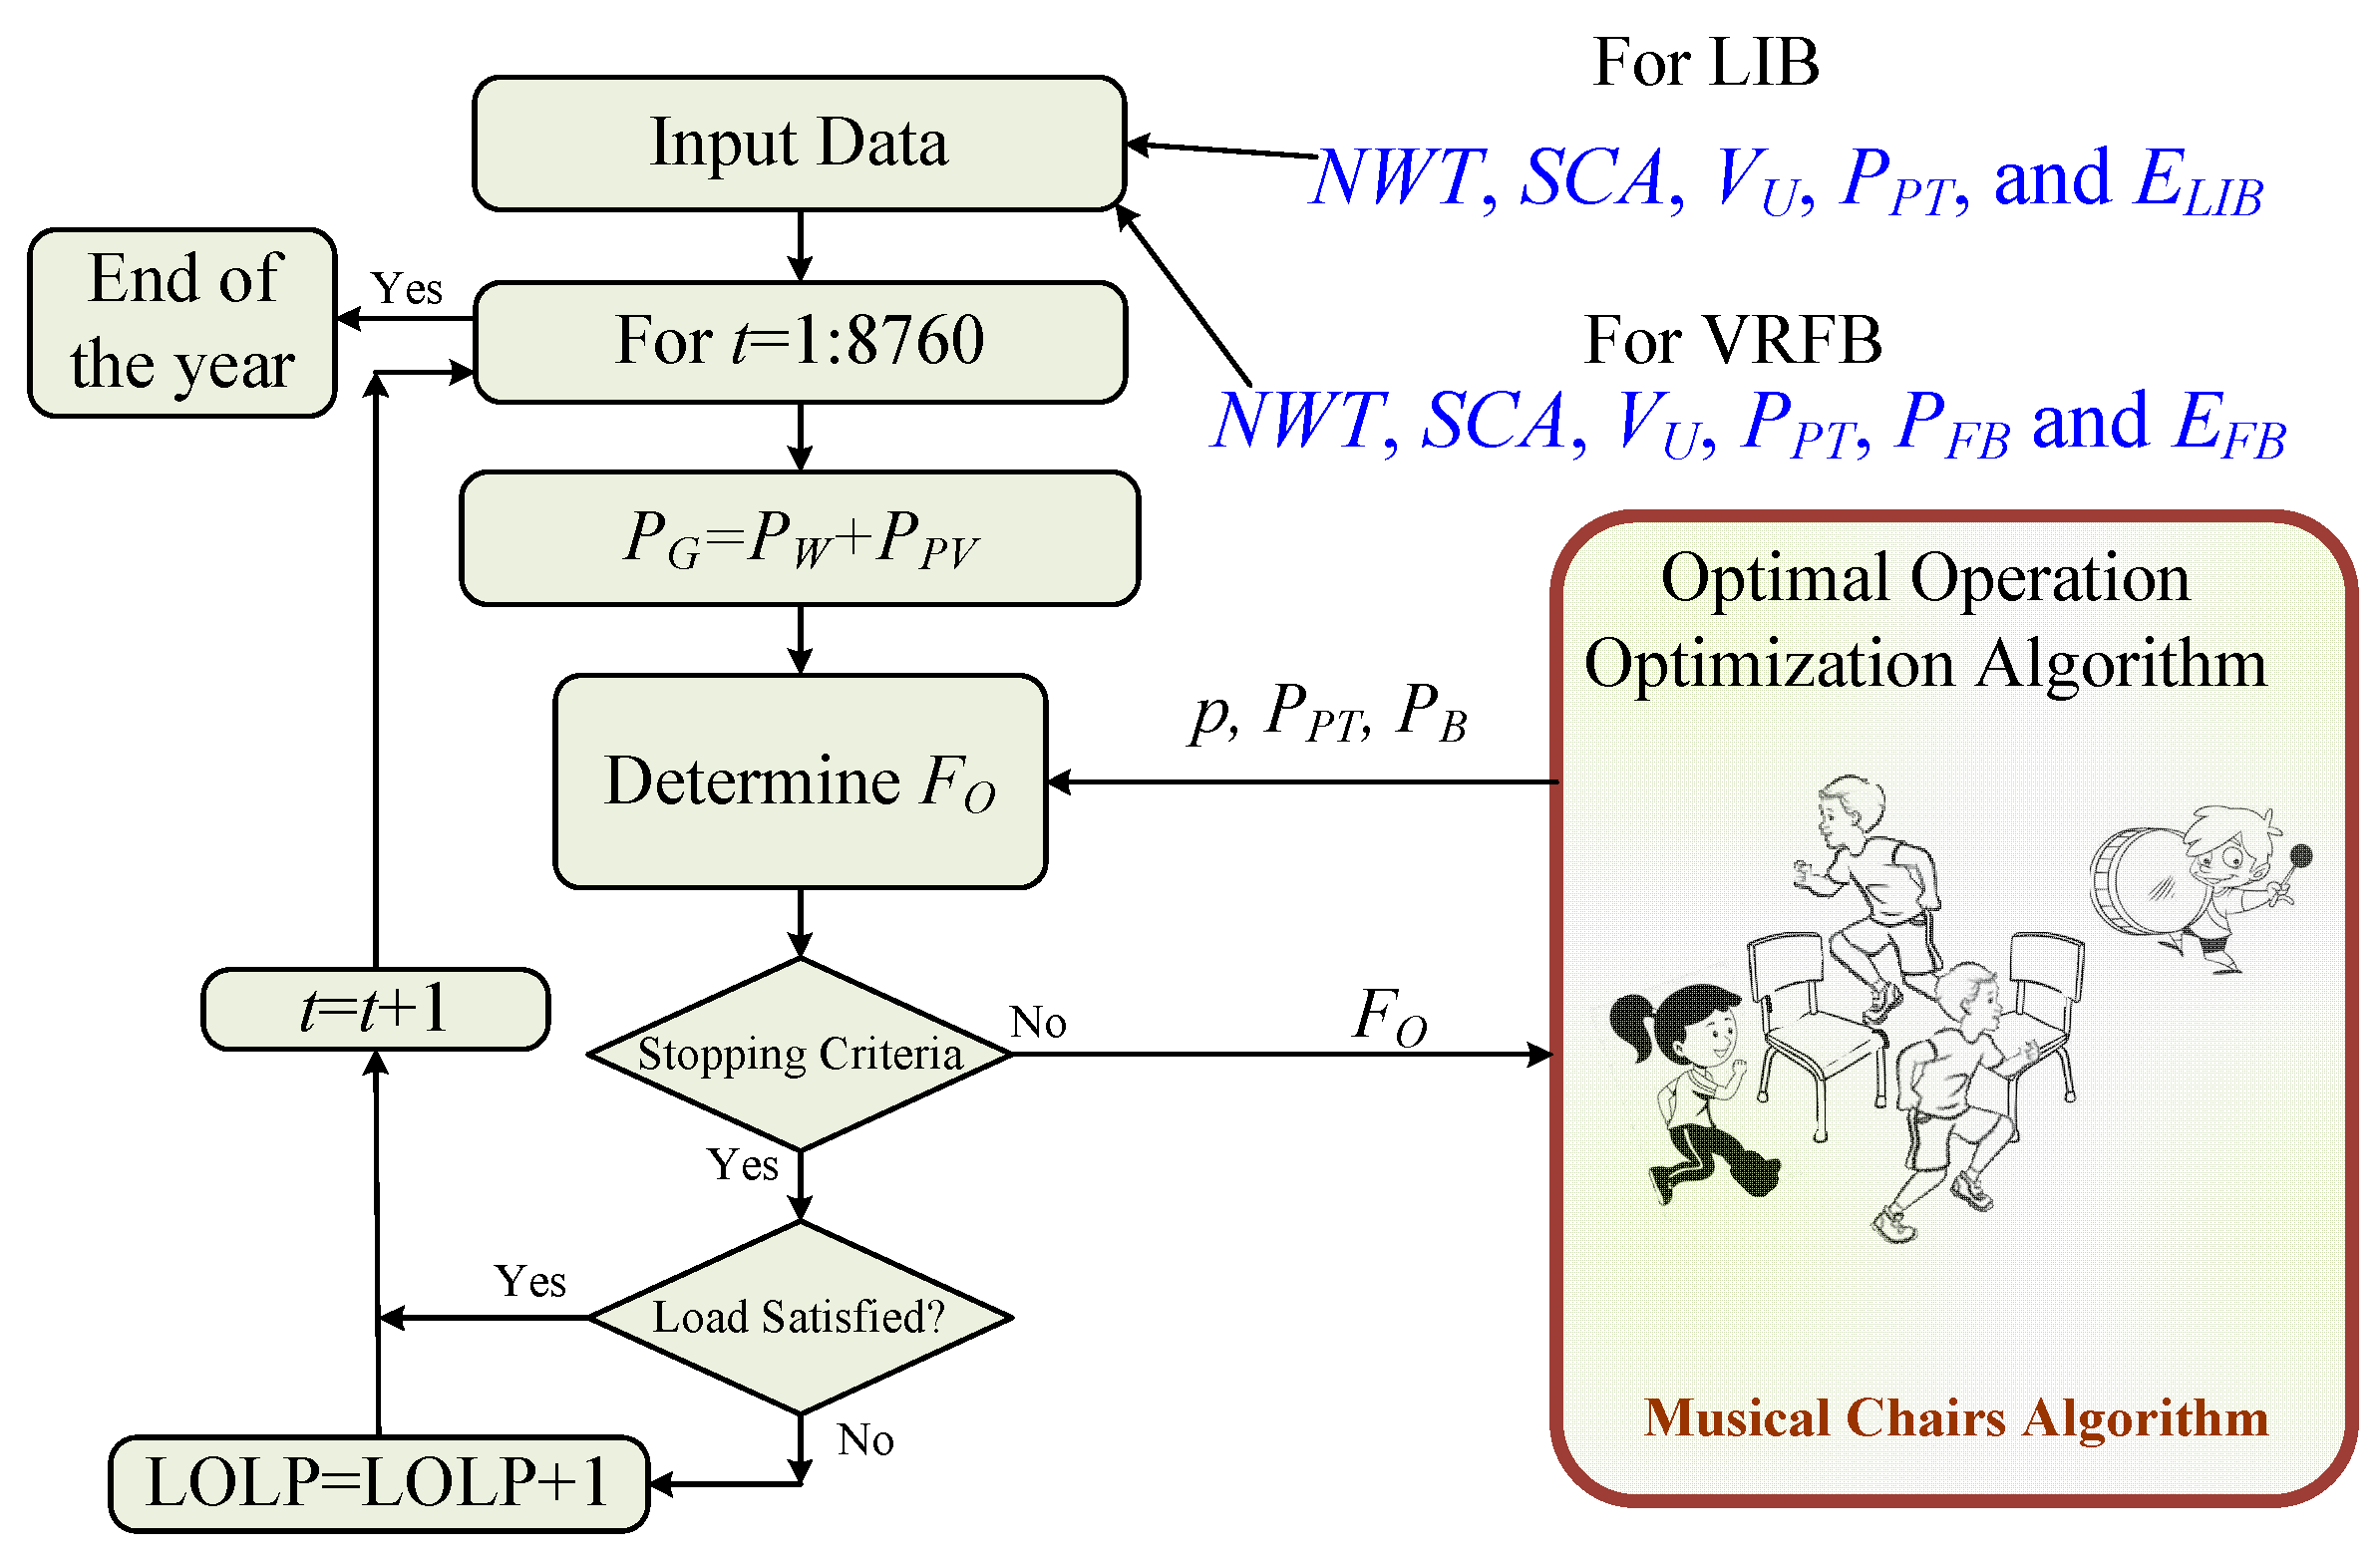
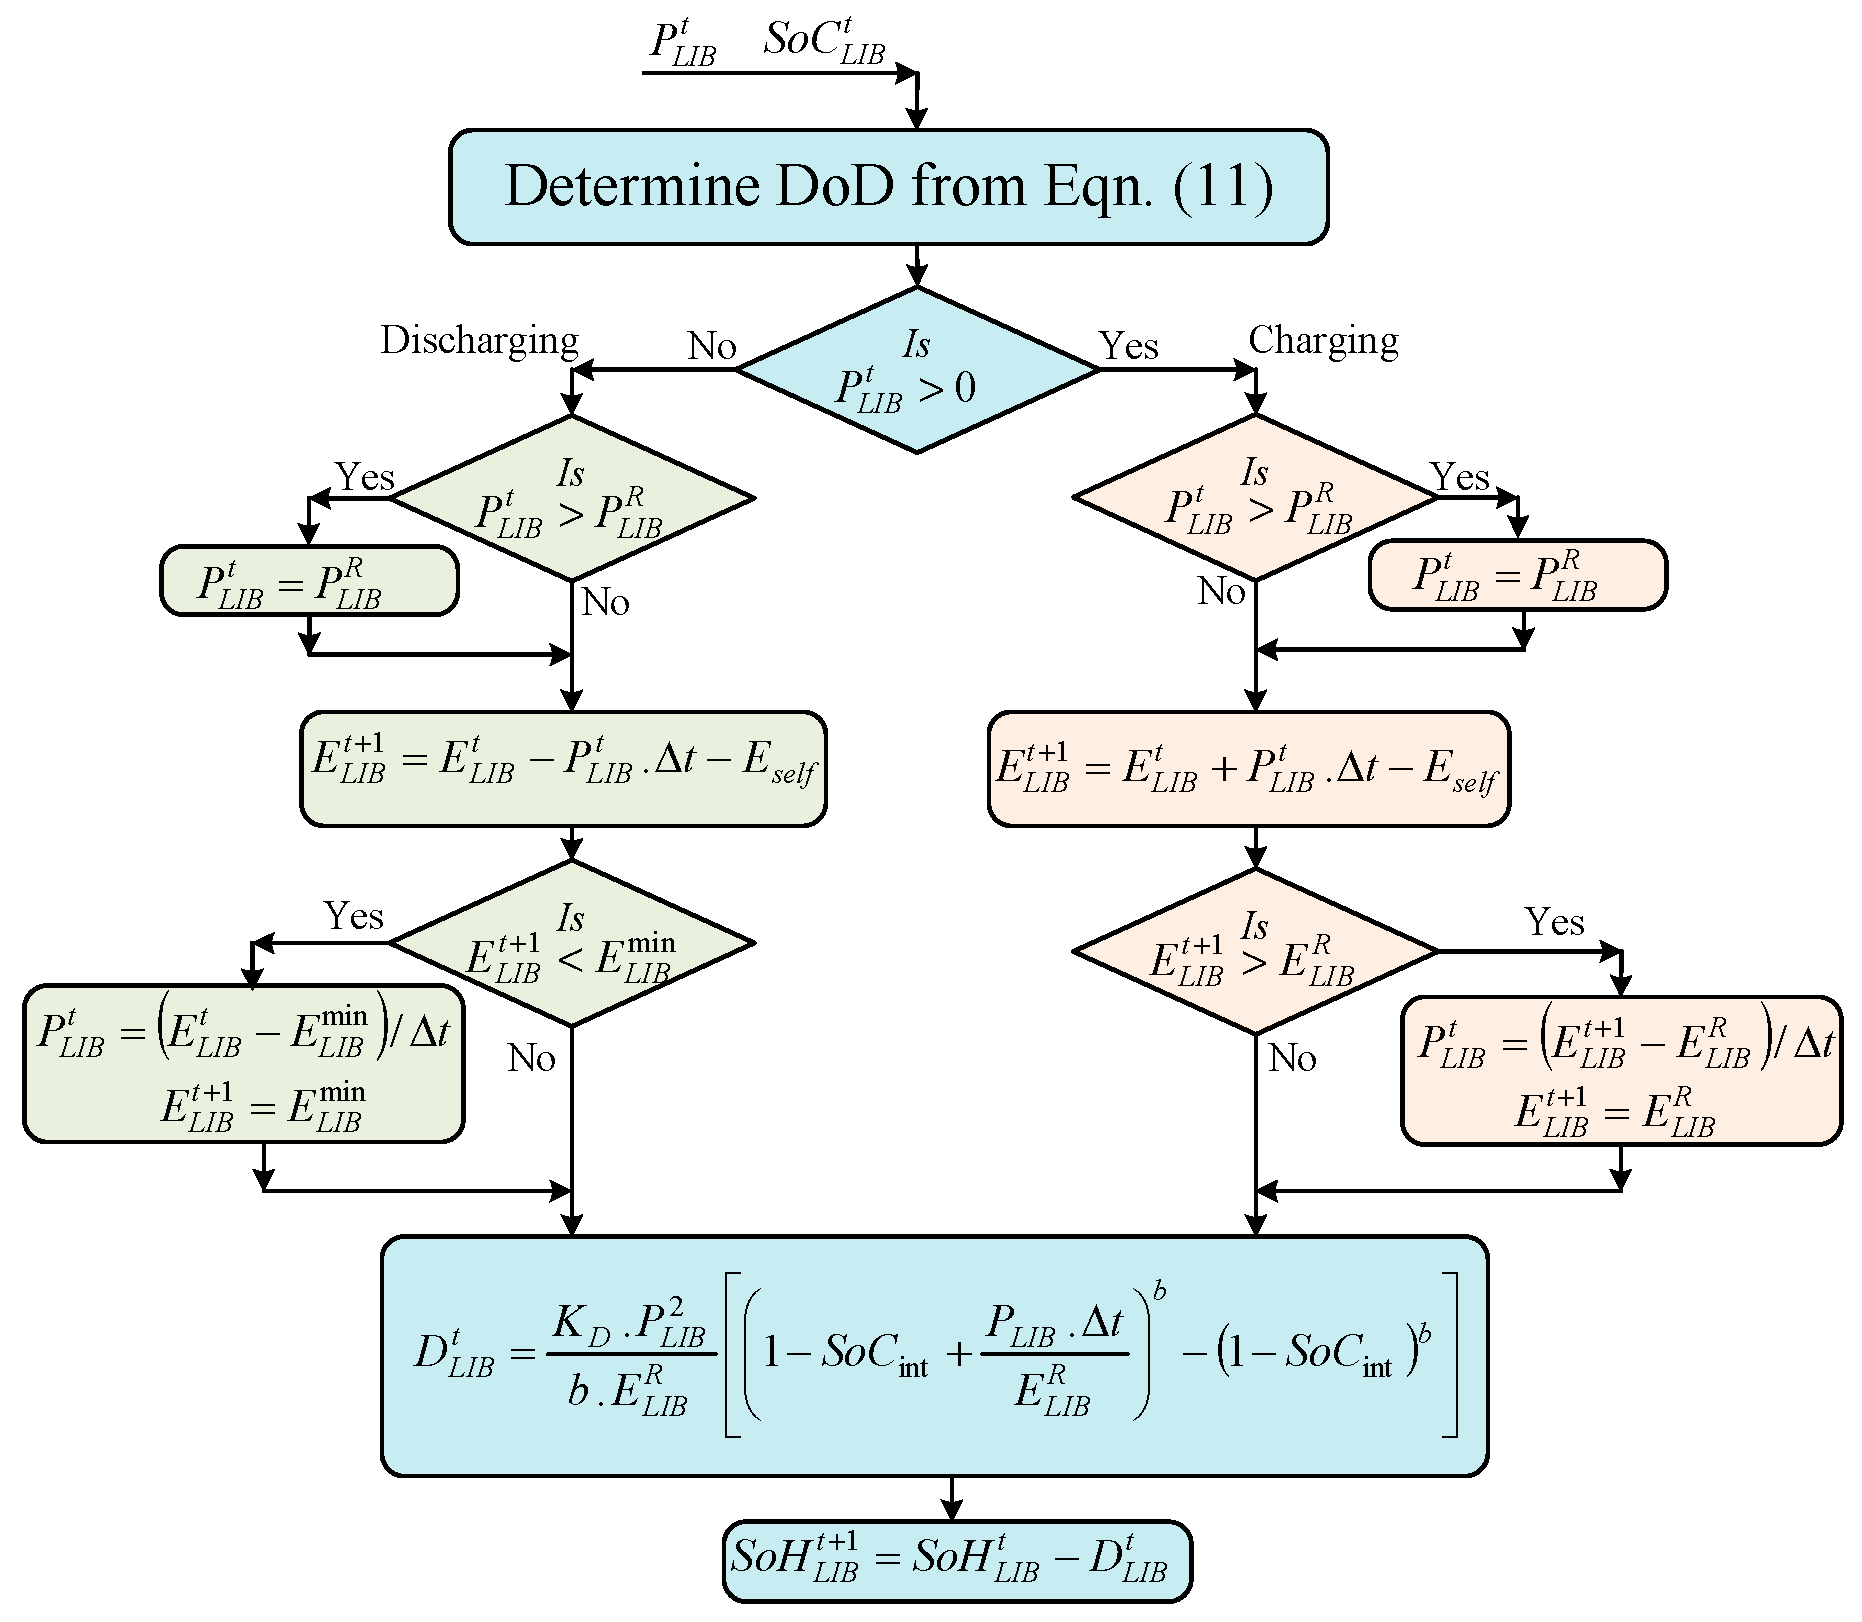
The simulation program has been used for hourly optimal operation of the ZCSG to optimally supply the loads for the highest reliability, revenue, and customer satisfaction. This can be performed using the MCA optimization algorithm for maximization of the objective function shown in Equation (54). The simulation should be performed for all the years of the project lifetime. The variables of the optimization algorithm are the tariff, the battery charging/discharging power, and the pump/turbine power of the PHES. The flowchart showing the proposed simulation program is shown in Figure 9. During this operation, the generated power is calculated hourly, and compared with the load; based on this difference and the situation of the energy storage in the EES systems, the new electricity tariff is suggested, and the contribution from the PHES and the BESS is fed in to determine the operation objective function FO, as shown in Equation (54). The flowchart showing the models of the PHES, LIB, and VRFB are shown in Figure 10, Figure 11 and Figure 12, respectively. Based on this value of the operation objective function, an update for the tariff and the contribution for the PHES and BESS will be suggested. Once the stopping criteria are validated, the system will ensure whether the load is satisfied or not. In the case of the load not being satisfied, this means that loss of load occurs and the LOLP should be increased by one; otherwise, do nothing and go to the next hour. The stopping criterion for the optimal operation-optimization algorithm is checked, and if it is not validated, the value of FO will go again to a new suggested value of variables until the stopping criterion is validated and the optimization algorithm will stop; it will send the optimal tariff, BESS, and PHES contribution and revenue, and the LCOE and LOLP to the output results.

5. Simulation Work

The simulation of the proposed system is used to show the comparison between the use of the LIB and VRFB as an ESS for ZCSG. Two different simulation studies are performed: the first one is the use of the LIB with the PHES system as ESS and the second one is the same as the first one, replacing the LIB with the VRFB. The simulation model of the proposed strategy is implemented using m-files under a Matlab environment.

5.1. Input Data

The hourly wind speed, solar irradiance, and the temperature of the NEOM site are used as input data for the simulation program, which can be obtained from [1]. The monthly average load power is obtained from the same reference [1].
The wind turbine specifications used in the simulation and the specification of the Panasonic VBHN325SA16 module used in the simulation are obtained from [29]. The specifications of the PHES are shown in Table 3. The specifications of the LIB and VRFB are shown in Table 4.

5.2. Simulation Results

The simulation of the proposed system has been performed using Matlab code version 2023a using an Intel i7-7500U, 2.70 GHz, dual-core CPU with 32 GB RAM, 405 operating on Windows 11. Several simulation studies have been introduced in this paper.
The first study is used to compare the use of the MCA optimization algorithm with other optimization algorithms such as grey wolf optimization (GWO) [56], particle swarm optimization (PSO) [57], bat algorithm (BA) [58], cuckoo search (CS) [59], and crow search algorithm (CSA) [60]. The performance of these optimization algorithms is shown in Figure 13 and Table 5. The convergence time of these optimization algorithms are 3.4 s, 6.6 s, 9.2 s, 9.4 s, 7.6 s, and 11.6 s, respectively. As depicted in Figure 13 and Table 5, MCA significantly outperforms other optimization algorithms in terms of convergence speed. Notably, GWO requires nearly double the convergence time of MCA. Moreover, CSA exhibits the slowest convergence, taking a staggering 341% longer than MCA. In terms of maximum fitness value, MCA consistently surpasses other algorithms, further solidifying its superiority.
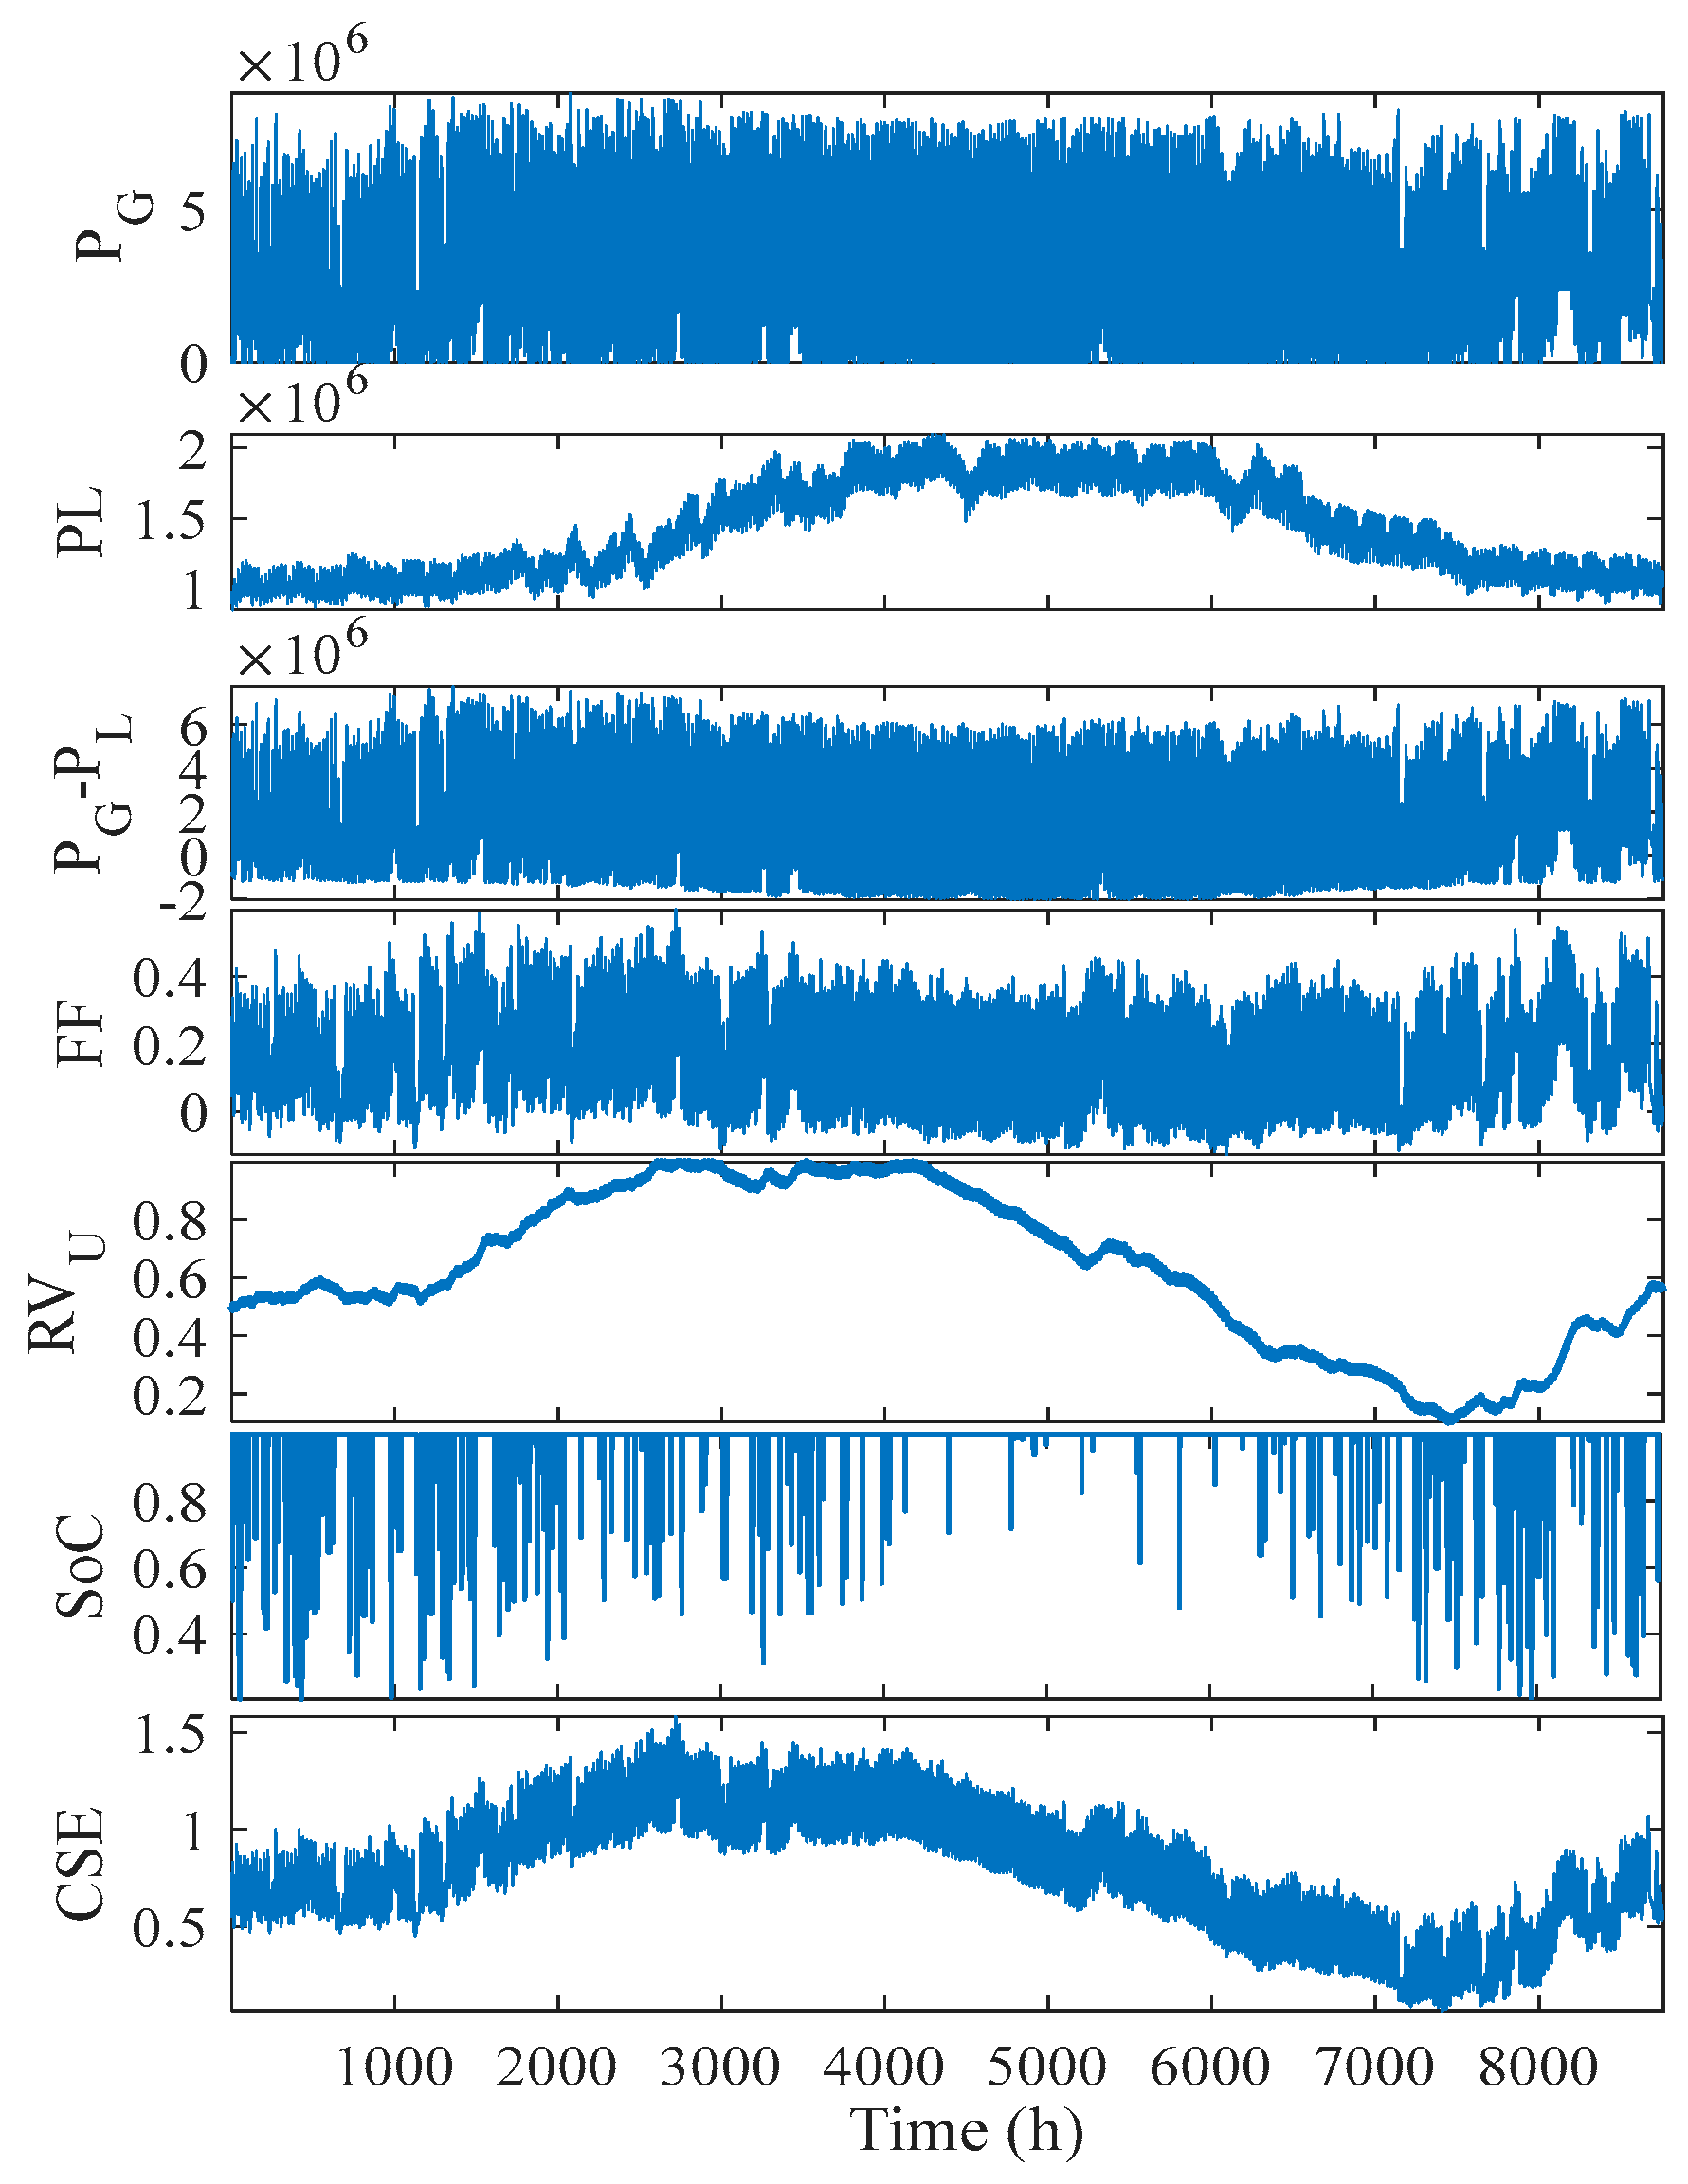
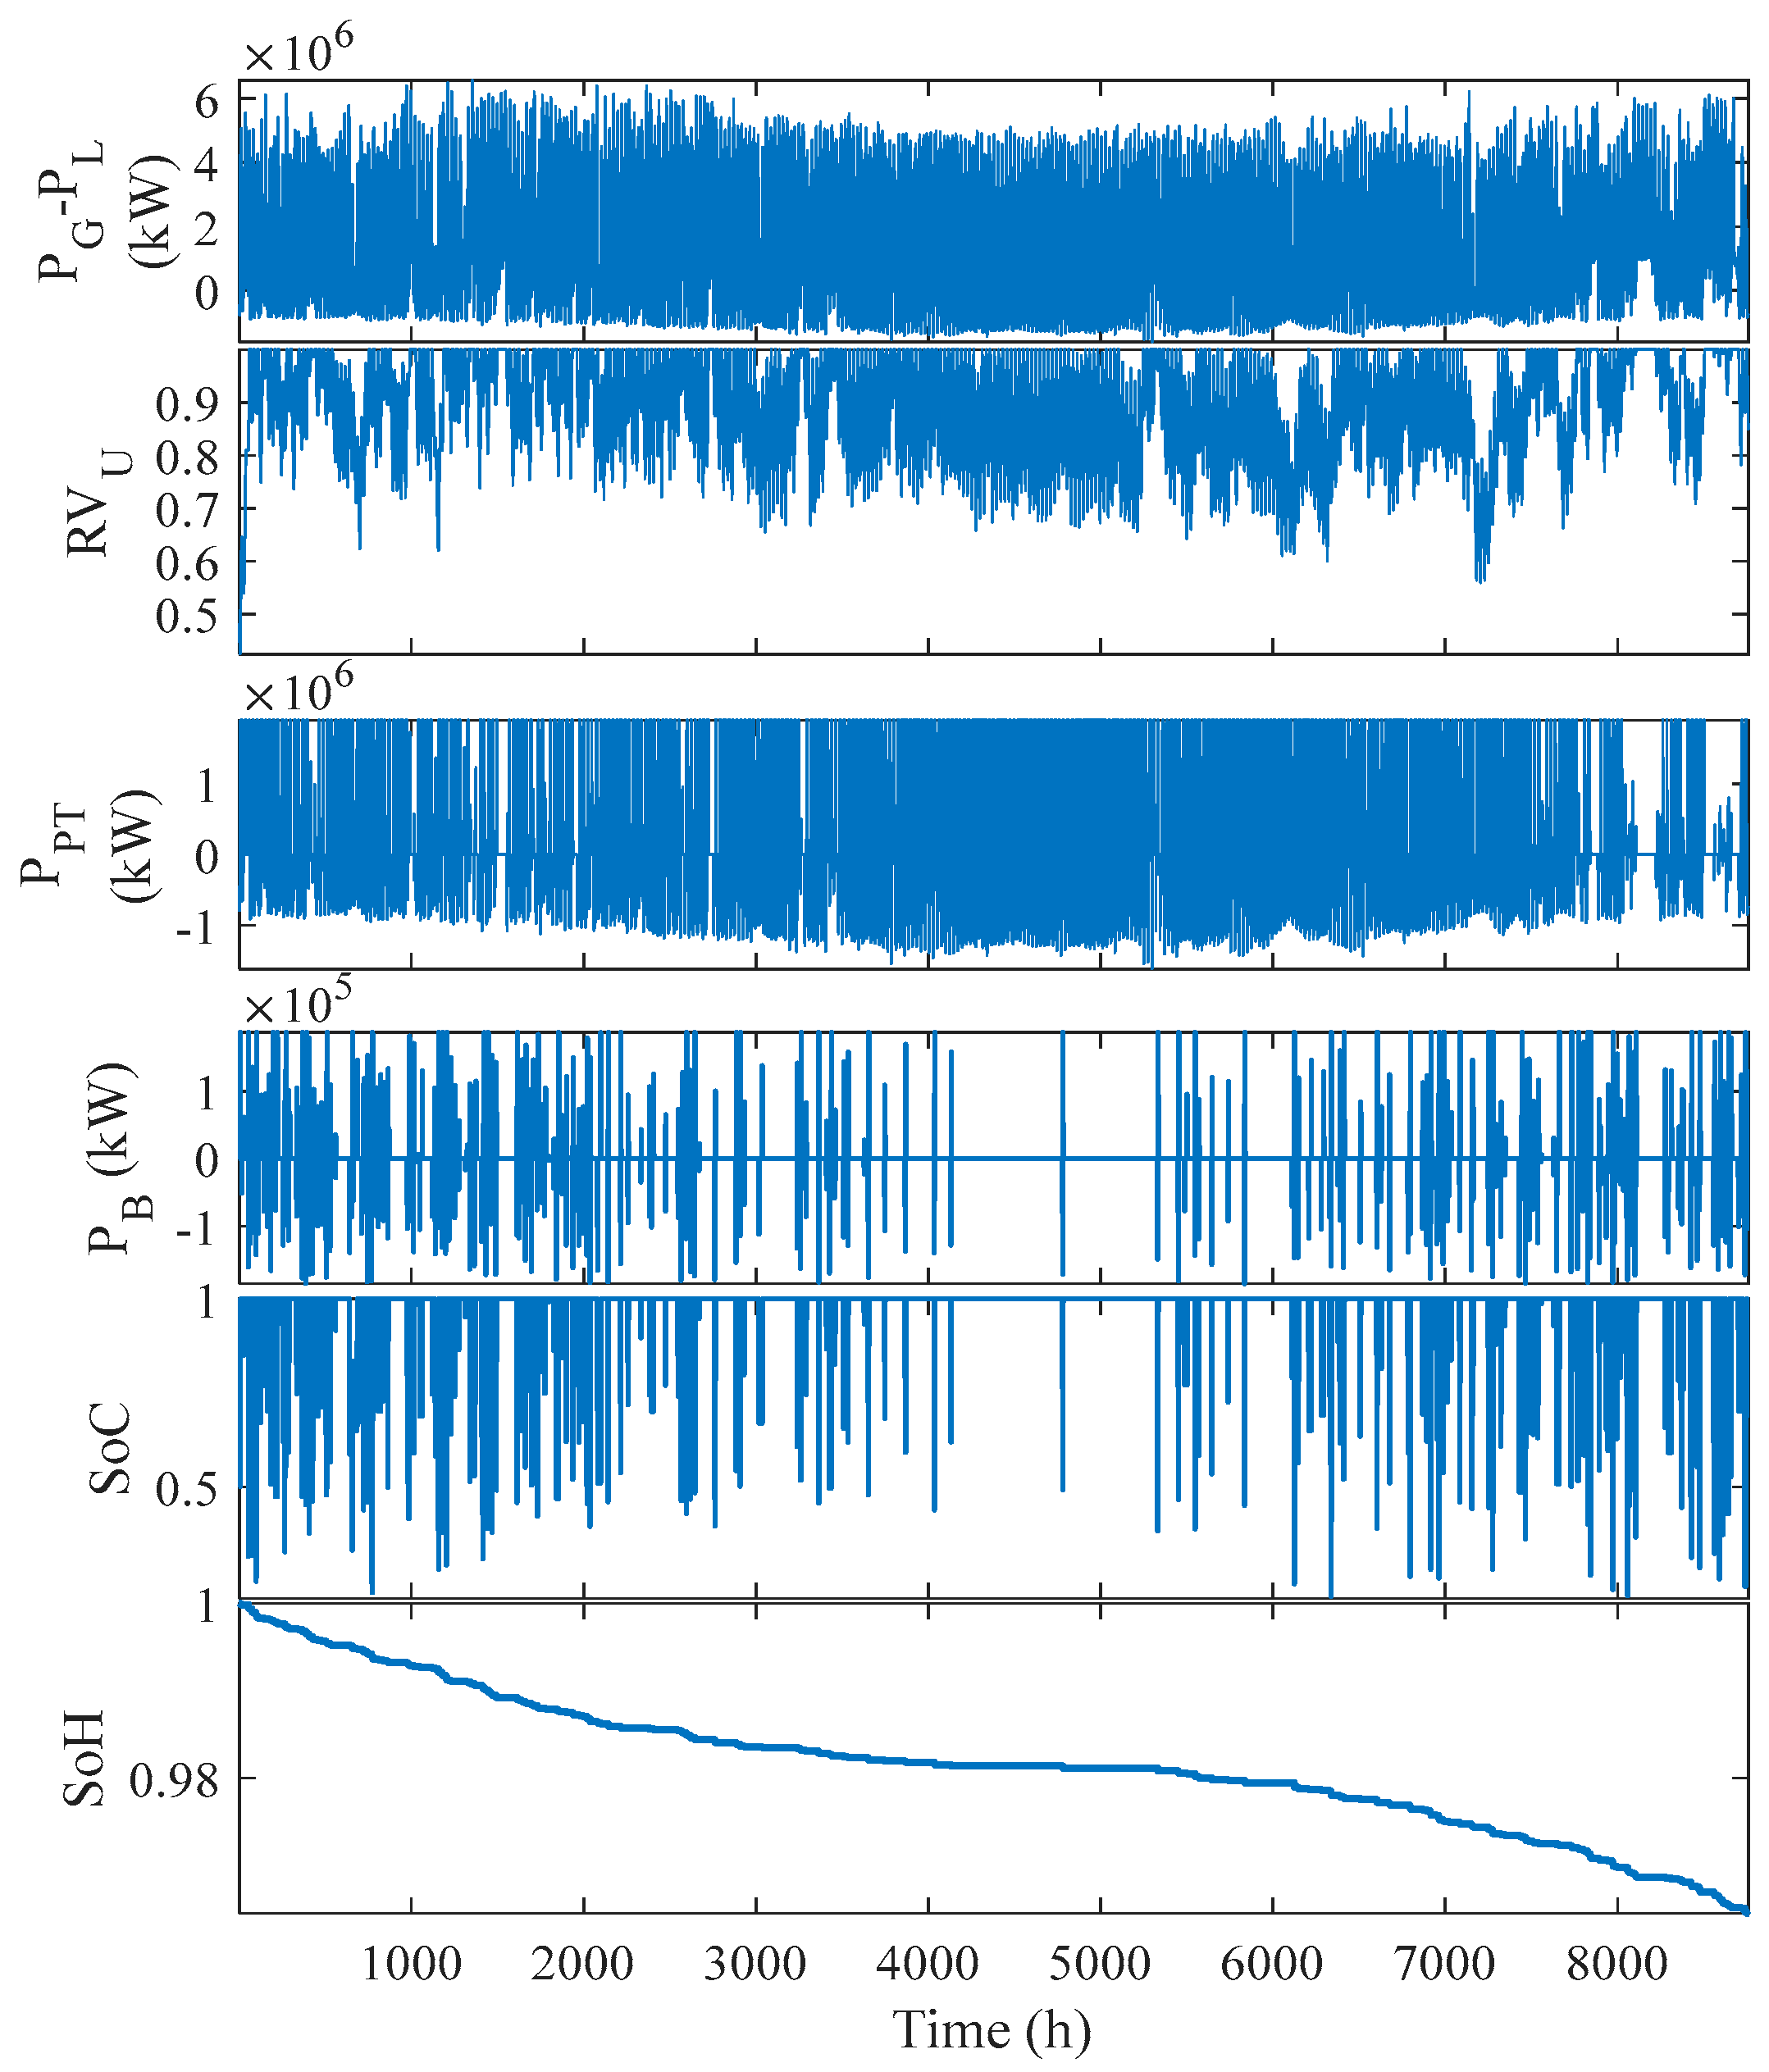
The second study is used to evaluate the effect of the use of DSM compared to the case of not using the DSM in controlling the load. In this study, the LIB is used with the PHES as ESSs. The proposed computer program runs with PED = 0 (NO DSM), as shown in Figure 14 and Figure 15. The generated power from wind and PV, the load power, and the difference between generated power and the load, FF, the ratio of the volume of water in the upper reservoir to its rated volume, the SoC of the LIB, and the situation of the ESSs (CSE) are shown in Figure 14. Figure 15 shows the variation in the difference between the generated power and the load power, the variation in the water in the upper reservoir, the power from PHES, the charging/discharging power from the LIB, the SoC of the LIB, and the SoH of the LIB. The main results of this case (PED = 0) are summarized in Table 5. The simulation results showed that the LCOE is USD 0.0931/kWh with USD 19.258 net present cost. The net present value of this project is USD 6.357.
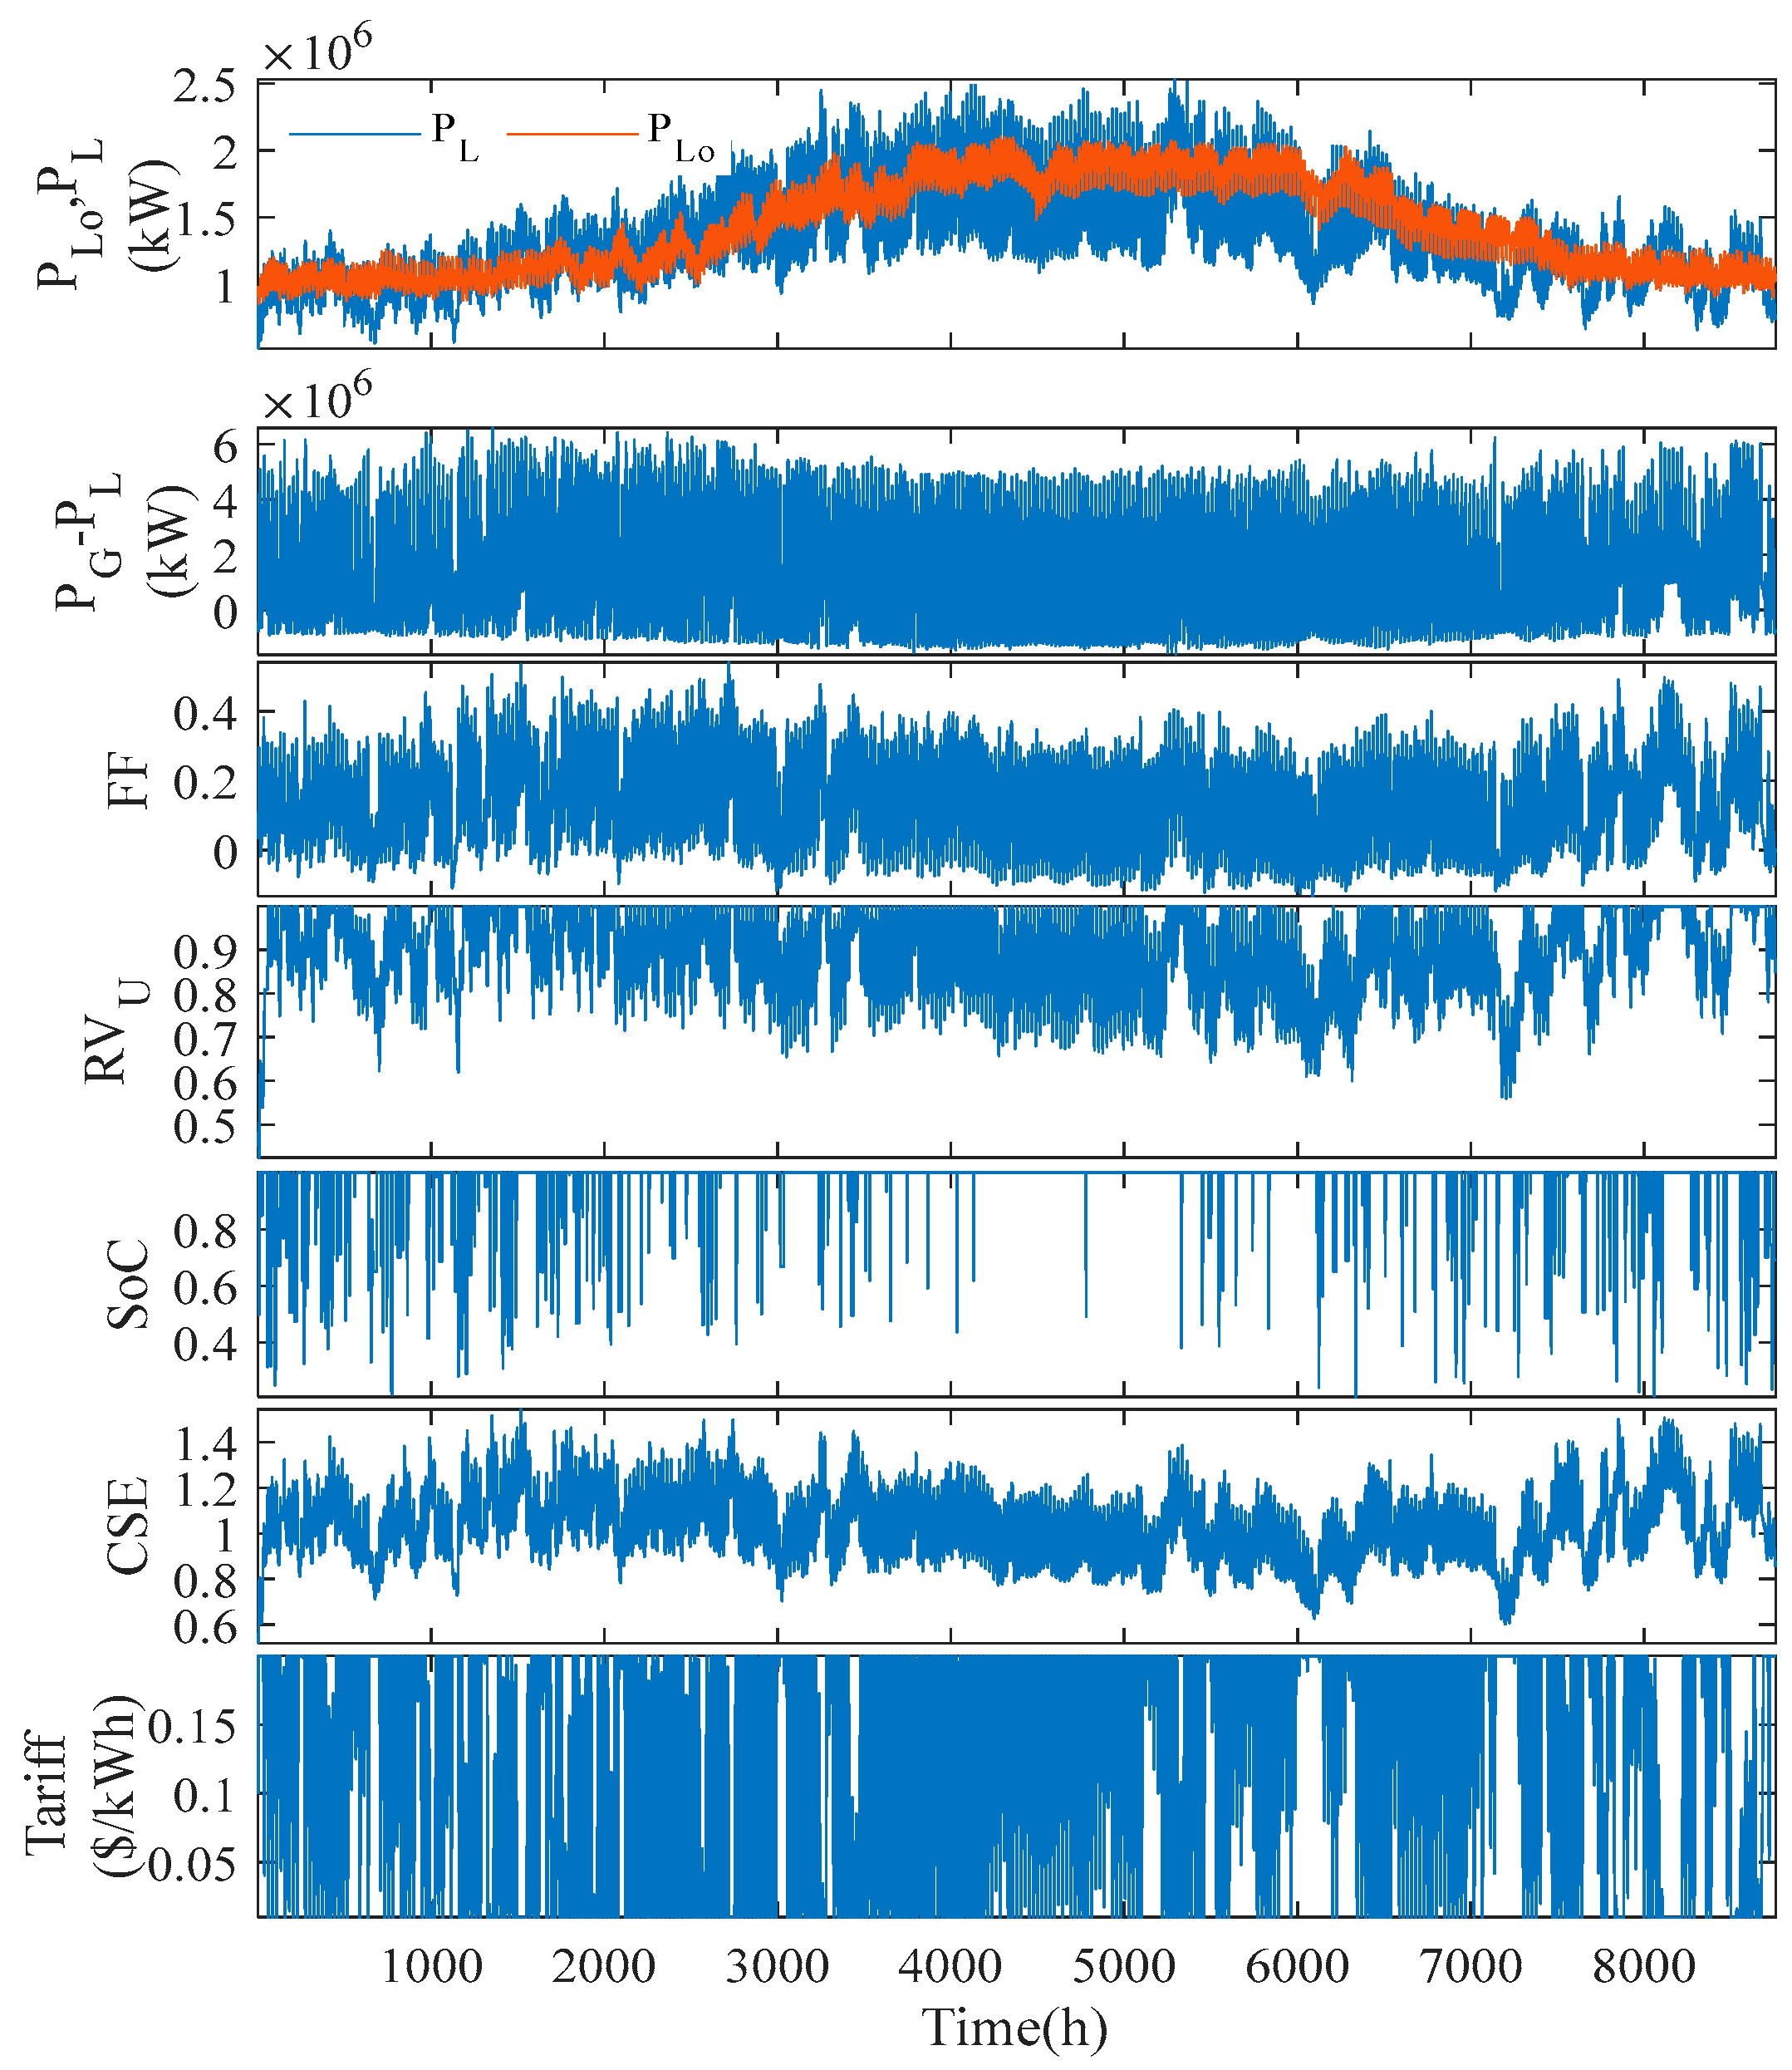
The other case used with DSM with PED = −0.5 is shown in Figure 16 and Figure 17. The difference between the original load power and the modified one is shown in the upper trace of Figure 16. The difference between the generated power and the load power is shown in the second trace of Figure 16. The forecast factor, the ratio of the water volume of the upper reservoir to its rated value, the SoC of the LIB, CSE, and the tariff are shown in Figure 16. Figure 17 shows the difference between the generated power and the load power against the situation of the ESSs and the form factor. The main results of the ZCSG system without DSM (PED = 0) and when the DSM is used (PED = −0.5) are shown in Table 6. It is clear from this table that the use of the DSM (PED = −0.5) reduced the LCOE from USD 0.0931/kWh to USD 0.0625/kWh, which means that the LCOE is reduced by 32.87% with the use of DSM (PED = −0.5) compared to the unused DSM (PED = 0). Moreover, the revenue from the ZCSG system with DSM (PED = −0.05) is USD 12.778 × 10⁹ compared to USD 6.357 × 10⁹ when the DSM is not used (PED = 0), which means that the revenue with the use of DSM is increased by more than 100% compared to the case of not using the DSM. Moreover, the size of components when using the DSM is significantly reduced compared to not using the DSM (PED = 0). These important results show the superiority of the use of DSM when designing the ZCSG system.
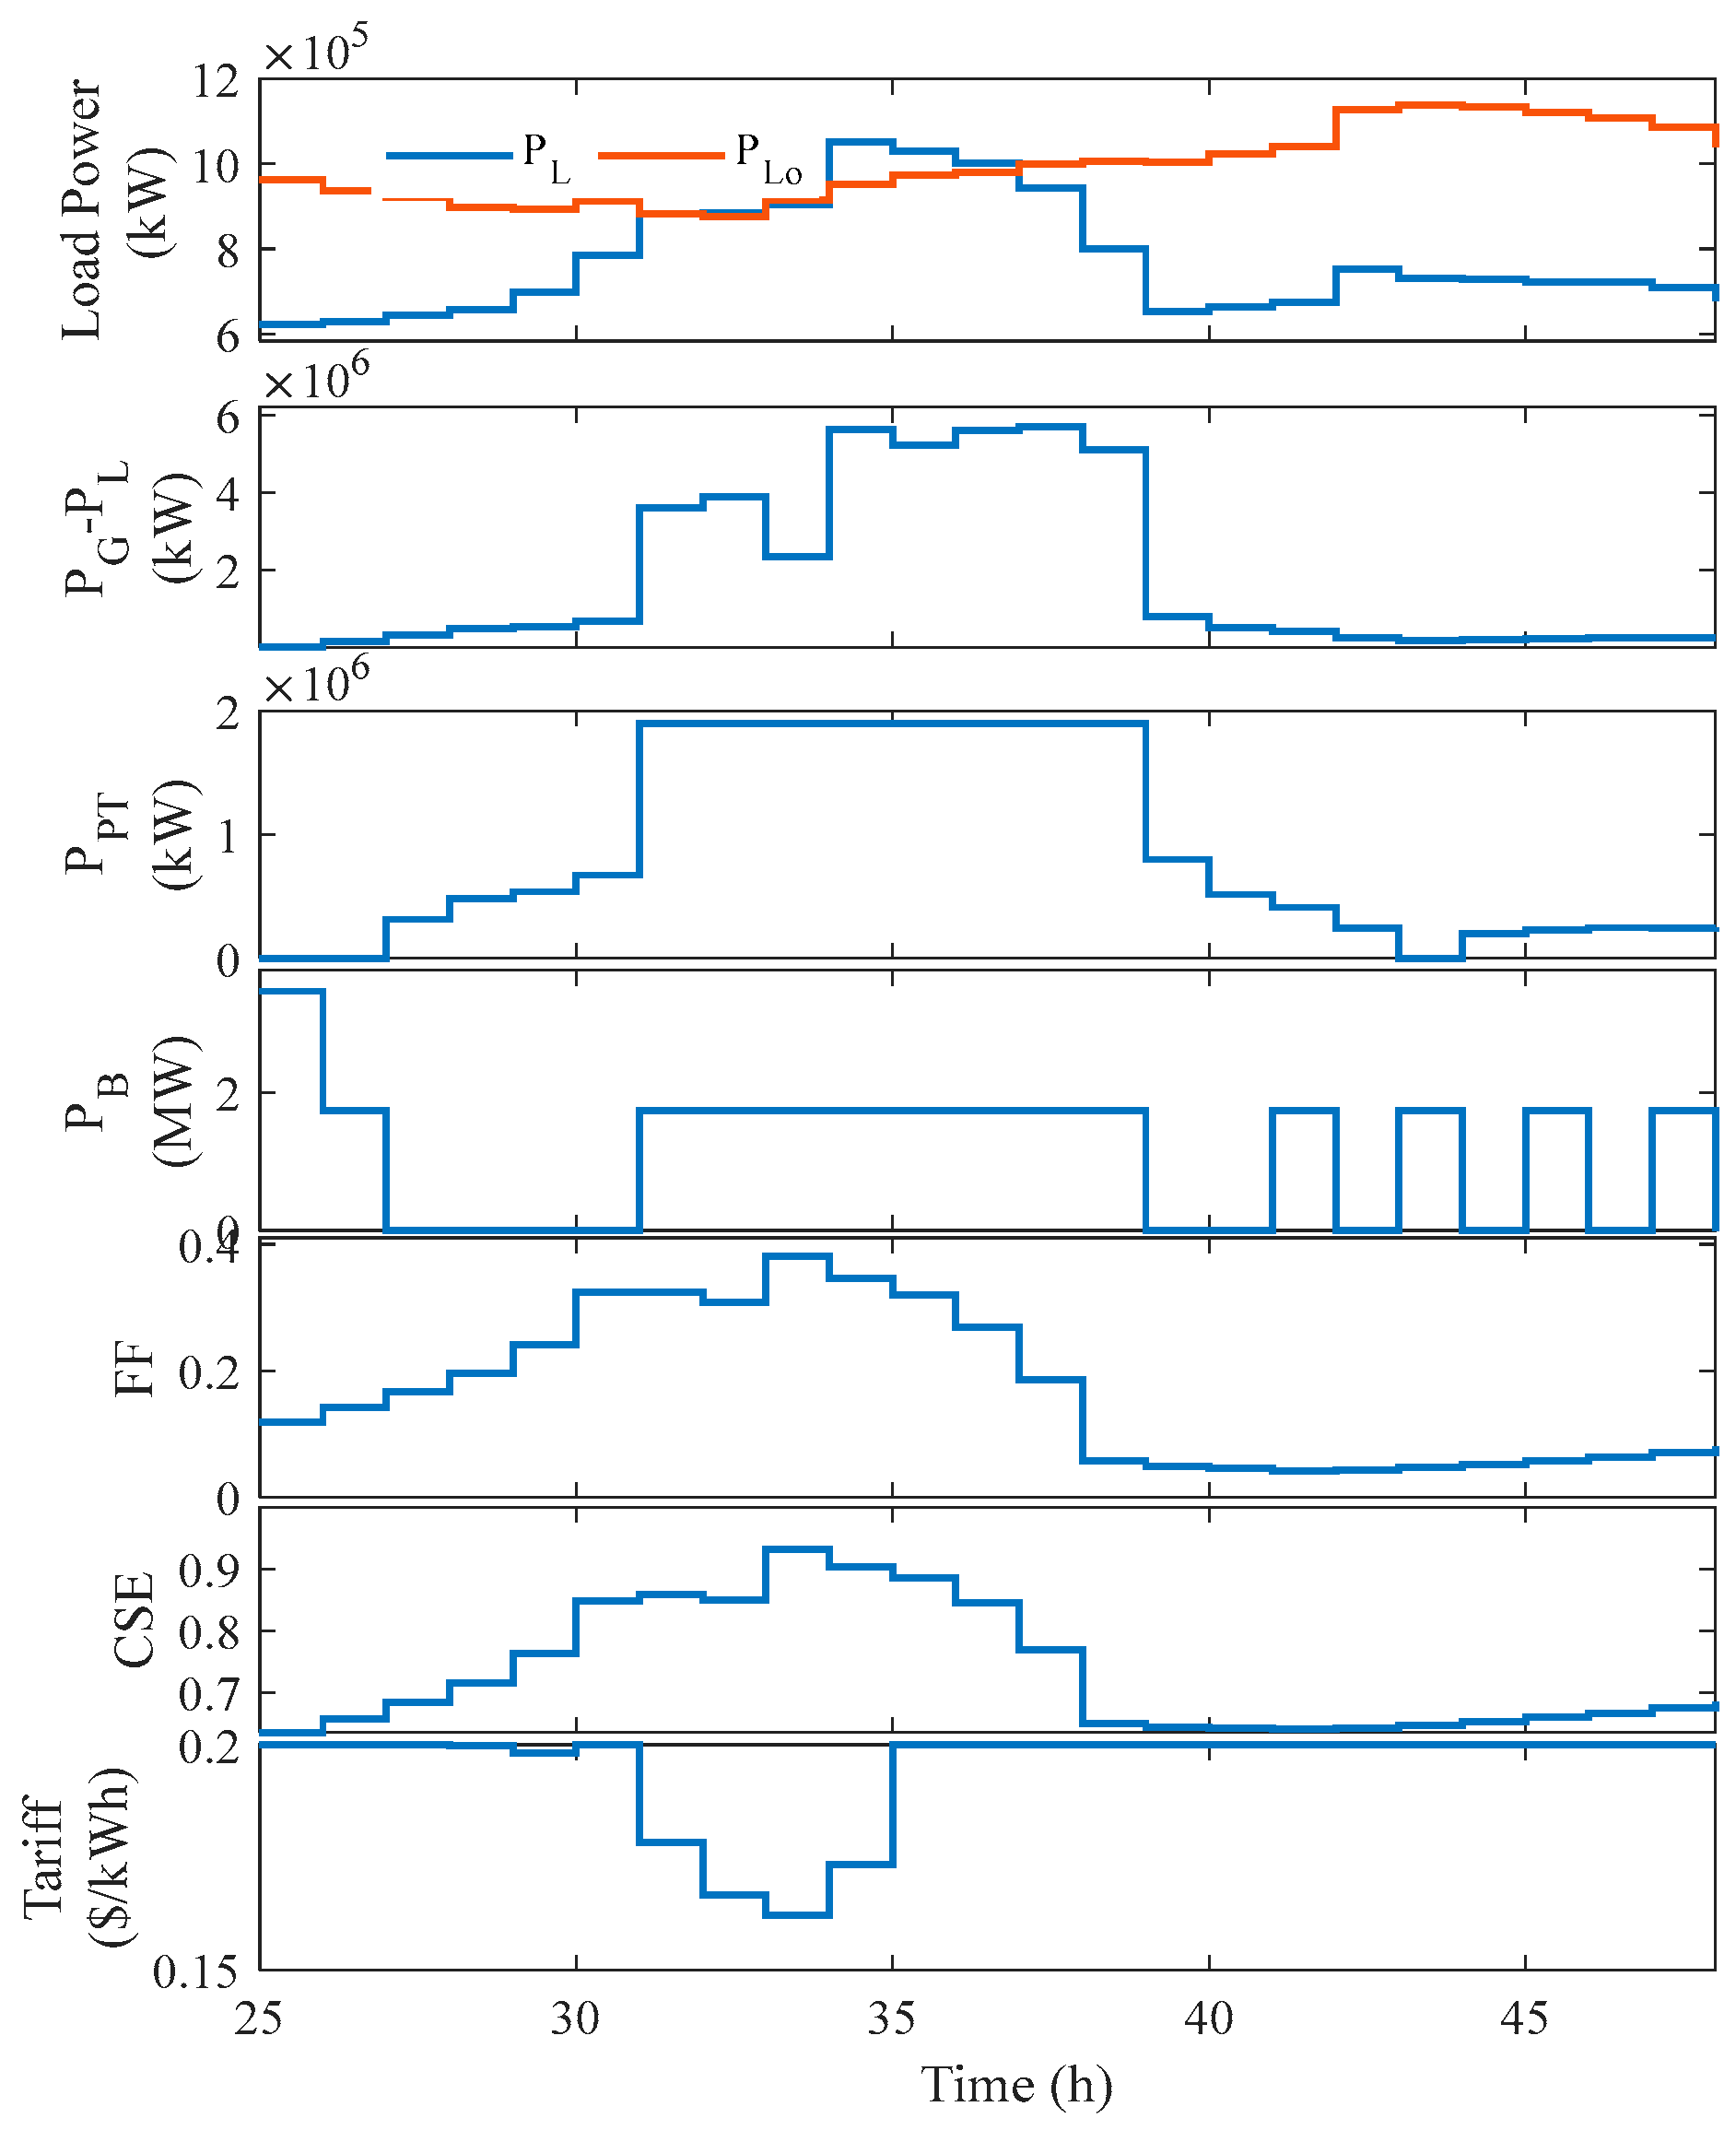
To examine the logic used in the optimal dispatch of the system, the second day of the simulation is used to zoom in on the variation of different parameters of the ZCSG system, as shown in Figure 18. This figure shows the simulation from t = 25 to 48 h. The upper trace shows the variation in the original demand power (PLo) and the modified one (PL). The second trace of Figure 18 shows the difference between the generated power from the RESs and the load power. The other traces in Figure 18 show the power of the PHES (PPT), the LIB power, the FF, the CSE, and the tariff. It is clear from this figure that at t = 25:30 h, there is a small positive difference between the generated power and the load power, which means that the extra power should go to the ESSs, and, due to this surplus value being small, it used the LIB to store this power and did not start the PHES to save this low surplus power. It is worth noting that, during this period (t = 25:30 h) the FF and CSE are very low, which means that the situation of the future of the ZCSG and the ESSs is not high, which can be translated to high tariffs to encourage the customers to reduce their loads. It is also clear from t = 21:38 h of Figure 18 that there is a high surplus power that uses the PHES to store these energies. During this time, the FF and the CSE were very high, which means that the system is in a better situation and, for this reason, the optimal operating system reduced the tariff during this period to stimulate the customers to increase their loads. However, during the period of t = 38:48 h, the surplus power is reduced and the FF and CSE are becoming very low, which means that the ESSs are not in good condition; for this reason, the optimal operation system increased the tariff again to its highest value to stimulate the customers to reduce their loads for a better situation of the ESSs.
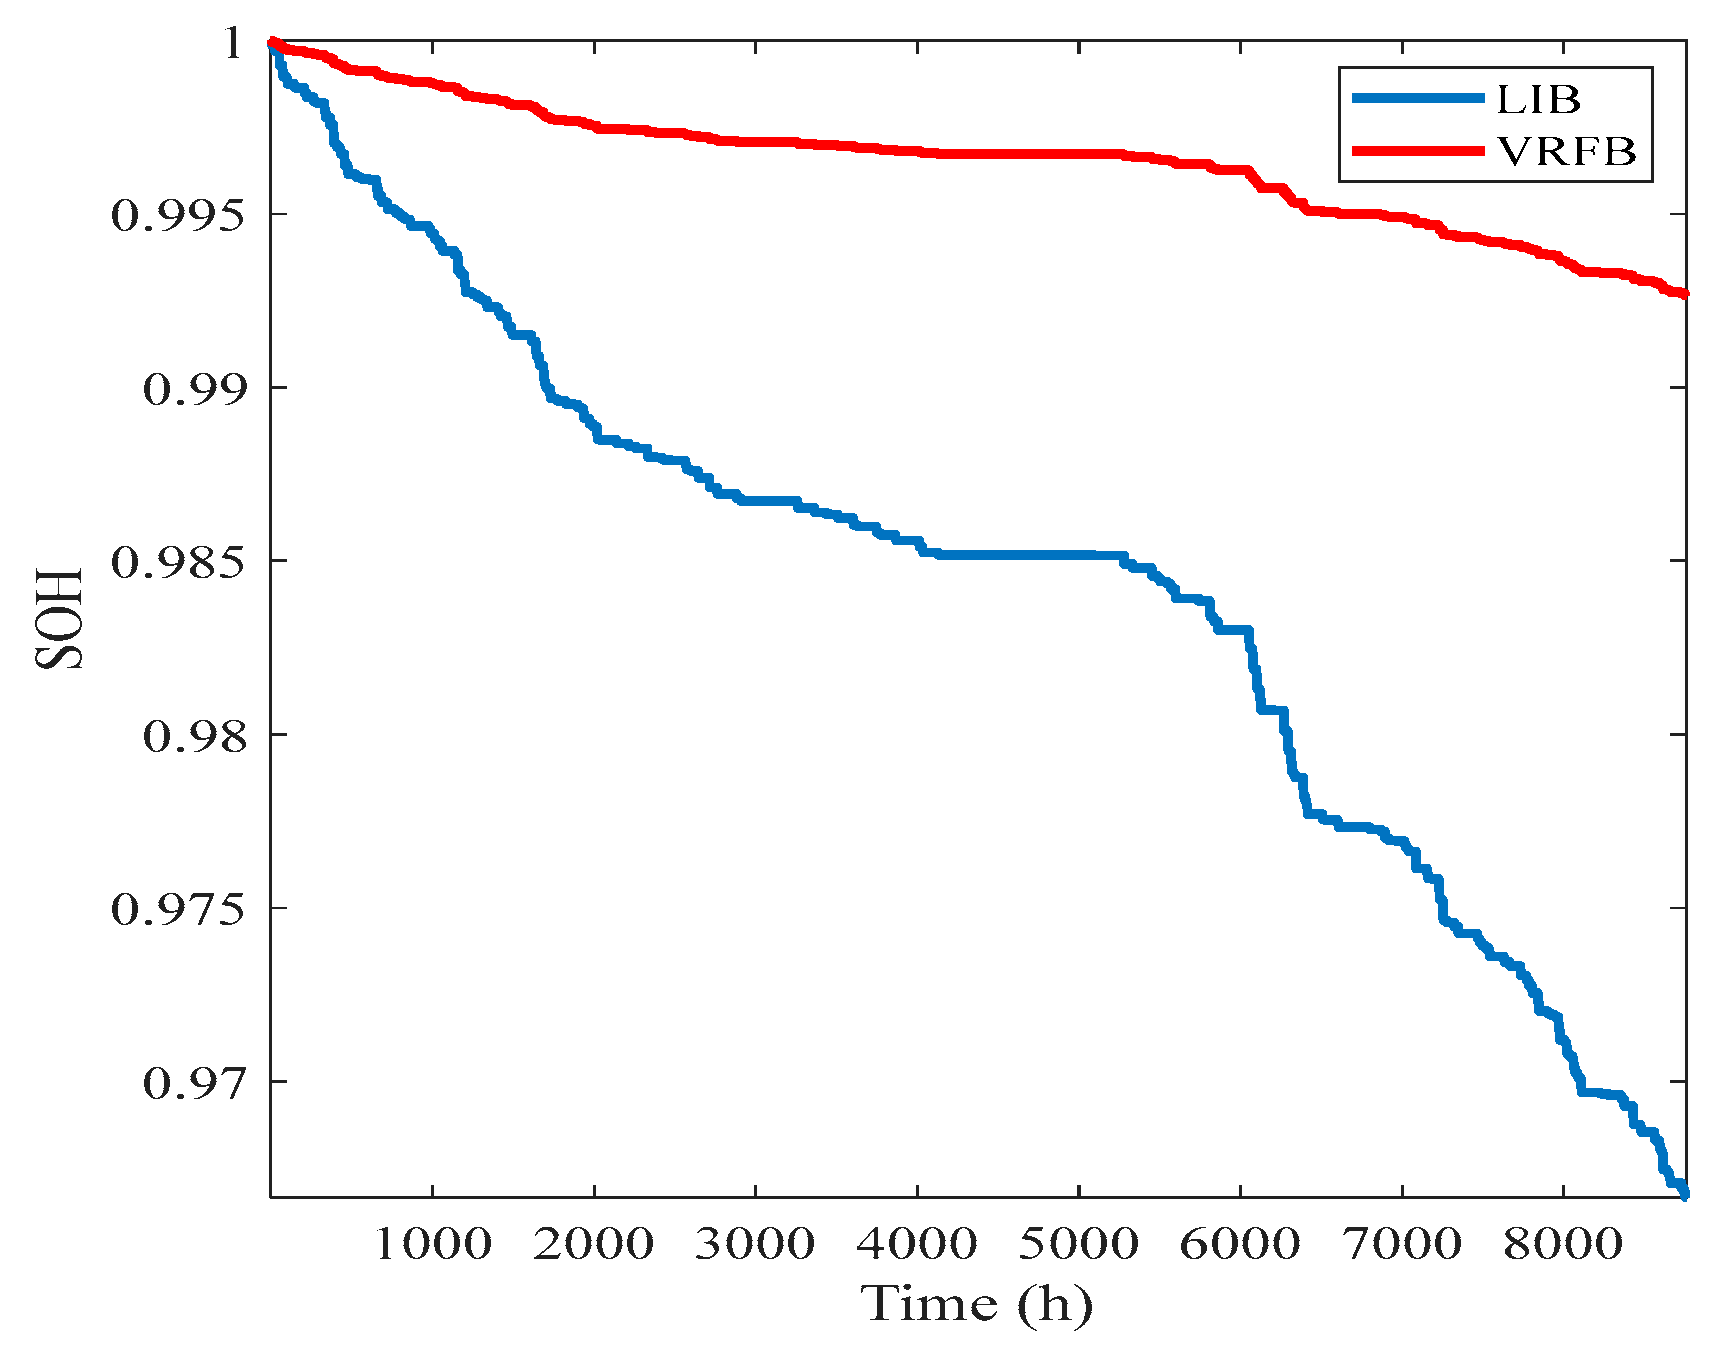
The use of the VRFB is studied to show its performance compared to the LIB, as shown in Table 6, for the use of DSM and without the use of DSM. These results showed the superiority of the use of DSM with the VRFB, as demonstrated above, when used with the LIB. The results shown in Table 6 showed that the LCOE with the VRFB is reduced from USD 0.0872/kWh to USD 0.0594, due to the use of DSM, which means the LCOE is reduced by 31.88%, due to the use of the DSM with PED = −0.5. It is also worth noting that with the DSM, the LCOE with the VRFB is USD 0.0594/kWh compared to USD 0.0625/kWh when the LIB is used. This means that replacing the LIB with the VRFB will reduce the LCOE by 4.96%. Moreover, the NPV of the ZCSG with the VRFB is USD 13.602 × 10⁹ compared to USD 12.778 × 10⁹ when the LIB is used, which means that the NPV of the use of VRFB is higher than the use of LIB by 6.45%, which proves the superiority of the use of VRFB instead of the LIB in the ZCSG systems. Figure 19 shows the variation in the SoH of the VRFB and LIB when used with the ZCSG systems. It is clear from this figure that the LIB is losing about 3.6% of its life yearly, which means that its lifetime (battery life time (BLT)) is almost 5.5 years before it reaches its end of life (SoH = 80%). Meanwhile, the VRFB is losing 1.4% of its life yearly, which means that its lifetime (BLT) is almost 14 years before it reaches its end of life (SoH = 80%).

6. Conclusions

Driven by environmental and economic concerns, modern studies advocate for a shift from fossil fuels to renewable energy sources like wind and solar. However, these renewables introduce a new challenge: the mismatch between their variable generation and fluctuating demand. To address this, a three-pronged approach is crucial: (1) Energy Storage Systems bridge the gap between generation and demand, (2) Smart Grid Concepts like demand-side management (DSM) empower consumers to adjust usage patterns and reduce peak demand, and (3) accurate forecasting allows for better planning and grid management. Zero-carbon systems face these challenges even more acutely. This study proposes a zero-carbon smart grid (ZCSG) that leverages wind and solar power alongside energy storage solutions: Pumped Hydroelectric Storage (PHES) for long-term storage and Battery Energy Storage Systems (BESSs) for frequency regulation. The study also proposes an hourly optimization strategy for dispatching power within the smart grid system. This strategy aims to achieve both maximum reliability and revenue by ensuring the system operates efficiently. This study leverages the Musical Chairs Algorithm (MCA) to optimize real-time pricing (RTP) tariffs for demand-side management (DSM) strategies. MCA significantly outperforms other optimization algorithms, notably doubling the convergence speed of the Grey Wolf Optimizer (GWO) and achieving a convergence speed of more than three times faster than other comparison algorithms. These results underscore the superior performance of MCA in this application. Moreover, this study focuses on replacing Lithium ion batteries (LIBs) in BESS with Vanadium redox flow batteries (VRFBs) due to their numerous advantages. Replacing LIBs with VRFBs reduced costs by 5% and increased the net present value (NPV) by another 6.5%. Furthermore, the LIB is losing about 3.6% of its life yearly, which means that its lifetime is almost 5.5 years before it reaches its end of life (SoH = 80%). Meanwhile, the VRFB is losing 1.4% of its life yearly, which means that its lifetime is almost 14 years before it reaches its end of life (SoH = 80%). These impressive results showcase the effectiveness of VRFBs compared to LIBs, demonstrating the superiority of DSM and VRFB technology in smart grid applications. Moreover, this study highlights the significant impact of DSM on smart grids. Implementing DSM not only reduced energy costs by over 30% compared to no DSM use, but also doubled the NPV.
A promising avenue for future research involves exploring the integration of fuel cells to further enhance the stability and performance of ZCSG systems. By incorporating fuel cells, these systems can achieve greater reliability and efficiency. Additionally, incorporating uncertainty in renewable generation, load demand, and energy prices into optimization models can significantly improve the robustness of ZCSG systems. Finally, assessing the resilience of ZCSG systems to various disturbances, such as extreme weather events and cyberattacks, is crucial. Developing strategies to enhance this resilience should be a primary focus of future research.

Author Contributions

Conceptualization, Z.A.A. and A.M.E.; Methodology, Z.A.A. and A.M.E.; Software, Z.A.A. and A.M.E.; Validation, Z.A.A. and A.M.E.; Formal analysis, Z.A.A. and A.M.E.; Investigation, Z.A.A. and A.M.E.; Resources, Z.A.A. and A.M.E.; Data curation, A.M.E.; Writing—original draft, Z.A.A. and A.M.E.; Writing—review & editing, A.M.E.; Visualization, A.M.E.; Supervision, A.M.E.; Project administration, Z.A.A.; Funding acquisition, Z.A.A. All authors have read and agreed to the published version of the manuscript.

Funding

The authors extend their appreciation to the King Saud University for funding this work through the Researchers Supporting Project number (RSPD2024R596), King Saud University, Riyadh, Saudi Arabia.

Data Availability Statement

Data is contained within the article.

Conflicts of Interest

The authors declare no conflict of interest.

References

  1. Eltamaly, A.M. A novel energy storage and demand side management for entire green smart grid system for NEOM city in Saudi Arabia. Energy Storage 2023, 6, e515. [Google Scholar] [CrossRef]
  2. Lu, B.; Blakers, A.; Stocks, M.; Cheng, C.; Nadolny, A. A zero-carbon, reliable and affordable energy future in Australia. Energy 2021, 220, 119678. [Google Scholar] [CrossRef]
  3. Eltamaly, A.M.; Addoweesh, K.E.; Bawa, U.; Mohamed, M.A. Economic modeling of hybrid renewable energy system: A case study in Saudi Arabia. Arab. J. Sci. Eng. 2014, 39, 3827–3839. [Google Scholar] [CrossRef]
  4. Eltamaly, A.M.; Al-Shammaa, A.A. Optimal configuration for isolated hybrid renewable energy systems. J. Renew. Sustain. Energy 2016, 8, 045502. [Google Scholar] [CrossRef]
  5. da Silva Lima, L.; Quartier, M.; Buchmayr, A.; Sanjuan-Delmás, D.; Laget, H.; Corbisier, D.; Mertens, J.; Dewulf, J. Life cycle assessment of lithium-ion batteries and vanadium redox flow batteries-based renewable energy storage systems. Sustain. Energy Technol. Assess. 2021, 46, 101286. [Google Scholar] [CrossRef]
  6. Vudata, S.P. Dynamic Modelling and Control of Grid-Level Energy Storage Systems. Ph.D. Thesis, Statler College of Engineering and Mineral Resources, Morgantown, WV, USA, 2021. [Google Scholar]
  7. Lei, J.Z.; Gong, Q.; Liu, J.; Qiao, H.; Wang, B. Optimal allocation of a VRB energy storage system for wind power applications considering the dynamic efficiency and life of VRB in active distribution networks. IET Renew. Power Gener. 2019, 13, 563–571. [Google Scholar] [CrossRef]
  8. Fathima, A.H.; Palanisamy, K. Integration and energy management of a hybrid Li-VRB battery for renewable applications. Renew. Energy Focus 2019, 30, 13–20. [Google Scholar] [CrossRef]
  9. Berrueta, A.; Heck, M.; Jantsch, M.; Ursúa, A.; Sanchis, P. Combined dynamic programming and region-elimination technique algorithm for optimal sizing and management of lithium-ion batteries for photovoltaic plants. Appl. Energy 2018, 228, 1–11. [Google Scholar] [CrossRef]
  10. Martins, R.; Hesse, H.C.; Jungbauer, J.; Vorbuchner, T.; Musilek, P. Optimal Component Sizing for Peak Shaving in Battery Energy Storage System for Industrial Applications. Energies 2018, 11, 2048. [Google Scholar] [CrossRef]
  11. Fathima, A.H.; Palanismay, K. Modeling and operation of a vanadium redox flow battery for PV applications. Energy Procedia 2017, 117, 607–614, 1876–6102. [Google Scholar] [CrossRef]
  12. Bhattacharjee, A.; Saha, H. Design and experimental validation of a generalised electrical equivalent model of Vanadium Redox Flow Battery for interfacing with renewable energy sources. J. Energy Storage 2017, 13, 220–232. [Google Scholar] [CrossRef]
  13. Barelli, L.; Bidini, G.; Cherubini, P.; Micangeli, A.; Pelosi, D.; Tacconelli, C. How Hybridization of Energy Storage Technologies Can Provide Additional Flexibility and Competitiveness to Microgrids in the Context of Developing Countries. Energies 2019, 12, 3138. [Google Scholar] [CrossRef]
  14. Zhang, X.; Li, Y.; Skyllas-Kazacos, M.; Bao, J. Optimal Sizing of Vanadium Redox Flow Battery Systems for Residential Applications Based on Battery Electrochemical Characteristics. Energies 2016, 9, 857. [Google Scholar] [CrossRef]
  15. Tazvinga, H.; Zhu, B.; Xia, X.H. Optimal power flow management for distributed energy resources with batteries. Energy Convers. Manag. 2015, 102, 104–110. [Google Scholar] [CrossRef]
  16. Noack, J.; Wietschel, L.; Roznyatovskaya, N.; Pinkwart, K.; Tübke, J. Techno-Economic Modeling and Analysis of Redox Flow Battery Systems. Energies 2016, 9, 627. [Google Scholar] [CrossRef]
  17. Minke, C.; Kunz, U.; Turek, T. Techno-economic assessment of novel vanadium redox flow batteries with large-area cells. J. Power Sources 2017, 361, 105–114. [Google Scholar] [CrossRef]
  18. Boonluk, P.; Siritaratiwat, A.; Fuangfoo, P.; Khunkitti, S. Optimal Siting and Sizing of Battery Energy Storage Systems for Distribution Network of Distribution System Operators. Batteries 2020, 6, 56. [Google Scholar] [CrossRef]
  19. Bingying, W.; Buhan, Z.; Biao, M.; Jiajun, Z. Optimal capacity of flow battery and economic dispatch used in peak load shifting. In Proceedings of the 2011 4th International Conference on Electric Utility Deregulation and Restructuring and Power Technologies (DRPT), Weihai, China, 6–9 July 2011; IEEE: Piscateville, NJ, USA, 2011; pp. 1395–1400. [Google Scholar]
  20. Barelli, L.; Bidini, G.; Ottaviano, P.; Pelosi, D. Vanadium redox flow batteries application to electric buses propulsion: Performance analysis of hybrid energy storage system. J. Energy Storage 2019, 24, 100770. [Google Scholar] [CrossRef]
  21. Skyllas-Kazacos, M. The History of the UNSW All-Vanadium Flow Battery Development. Flow Batter. Fundam. Appl. 2023, 2, 507–538. [Google Scholar]
  22. Uhrig, M.; Koenig, S.; Suriyah, M.R.; Leibfried, T. Lithium-based vs. Vanadium Redox Flow Batteries—A Comparison for Home Storage Systems. Energy Procedia 2016, 99, 35–43. [Google Scholar] [CrossRef]
  23. Sun, C.; Negro, E.; Nale, A.; Pagot, G.; Vezzù, K.; Zawodzinski, T.A.; Meda, L.; Gambaro, C.; Di Noto, V. An efficient barrier toward vanadium crossover in redox flow batteries: The bilayer [Nafion/(WO3)x] hybrid inorganic-organic membrane. Electrochim. Acta 2021, 378, 138133. [Google Scholar] [CrossRef]
  24. Alotaibi, M.A.; Eltamaly, A.M. A Smart Strategy for Sizing of Hybrid Renewable Energy System to Supply Remote Loads in Saudi Arabia. Energies 2021, 14, 7069. [Google Scholar] [CrossRef]
  25. Hayes, S.J.; Donalek, P.; Hartel, P.; Trouille, B.; King, K.; Bhattarai, M.; Krohn, R.; Gilbert, K.; Lee, H.; Haapala, J. Technical Analysis of Pumped Storage and Integration with Wind Power in the Pacific Northwest; MWH Americas, Inc.: Blomfield, CO, USA, 2009. [Google Scholar]
  26. Yu, M.G.; Ma, X.; Wu, D. A hierarchical framework for aggregating grid-interactive buildings with thermal and battery energy storage. J. Energy Storage 2024, 101, 113984. [Google Scholar] [CrossRef]
  27. Toffoletti, G.; Cortella, G.; D’Agaro, P. Thermodynamic and economic seasonal analysis of a transcritical CO2 supermarket with HVAC supply through ice thermal energy storage (ITES). J. Clean. Prod. 2024, 434, 139832. [Google Scholar] [CrossRef]
  28. Eltamaly, A.M.; Alotaibi, M.A.; Elsheikh, W.A.; Alolah, A.I.; Ahmed, M.A. Novel Demand Side-Management Strategy for Smart Grid Concepts Applications in Hybrid Renewable Energy Systems. In Proceedings of the 2022 4th International Youth Conference on Radio Electronics, Electrical and Power Engineering (REEPE), Moscow, Russia, 17–19 March 2022; IEEE: Piscateville, NJ, USA, 2022; pp. 1–7. [Google Scholar]
  29. Eltamaly, A.M.; Alotaibi, M.A.; Alolah, A.I.; Ahmed, M.A. A Novel Demand Response Strategy for Sizing of Hybrid Energy System with Smart Grid Concepts. IEEE Access 2021, 9, 20277–20294. [Google Scholar] [CrossRef]
  30. Eltamaly, A.M.; Mohamed, M.A.; Alolah, A.I. A novel smart grid theory for optimal sizing of hybrid renewable energy systems. Sol. Energy 2016, 124, 26–38. [Google Scholar] [CrossRef]
  31. Javed, M.S.; Zhong, D.; Ma, T.; Song, A.; Ahmed, S. Hybrid pumped hydro and battery storage for renewable energy based power supply system. Appl. Energy 2020, 257, 114026. [Google Scholar] [CrossRef]
  32. Kaunda, C.S.; Kimambo, C.Z.; Nielsen, T.K. Potential of small-scale hydropower for electricity generation in Sub-Saharan Africa. ISRN Renew. Energy 2012, 2012, 132606. [Google Scholar] [CrossRef]
  33. Botterud, A.; Levin, T.; Koritarov, V. Pumped Storage Hydropower: Benefits for Grid Reliability and Integration of Variable Renewable Energy; Argonne National Lab (ANL): Argonne, IL, USA, 2014. [Google Scholar]
  34. Warnick, C.C.; Mayo, H.A., Jr. Hydropower Engineering; Prentice-Hall: Upper Saddle River, NJ, USA, 1984; Available online: https://openlibrary.org/works/OL5603227W/Hydropower_engineering?edition=key%3A/books/OL3178549M (accessed on 9 August 2024)ISBN 978-0134484983.
  35. Singhal, M.K.; Kumar, A. Optimum design of penstock for hydro projects. Int. J. Energy Power Eng. 2015, 4, 216. [Google Scholar]
  36. Emmanouil, S.; Nikolopoulos, E.I.; François, B.; Brown, C.; Anagnostou, E.N. Evaluating existing water supply reservoirs as small-scale pumped hydroelectric storage options–A case study in Connecticut. Energy 2021, 226, 120354. [Google Scholar] [CrossRef]
  37. Bhattacharjee, S.; Nayak, P.K. PV-pumped energy storage option for convalescing performance of hydroelectric station under declining precipitation trend. Renew. Energy 2019, 135, 288–302. [Google Scholar] [CrossRef]
  38. Kusakana, K. Feasibility analysis of river off-grid hydrokinetic systems with pumped hydro storage in rural applications. Energy Convers. Manag. 2015, 96, 352–362. [Google Scholar] [CrossRef]
  39. Almutairi, Z.A.; Eltamaly, A.M.; El Khereiji, A.; Al Nassar, A.; Al Rished, A.; Al Saheel, N.; Al Marqabi, A.; Al Hamad, S.; Al Harbi, M.; Sherif, R.; et al. Modeling and experimental determination of lithium-ion battery degradation in hot environment. In Proceedings of the 2022 23rd International Middle East Power Systems Conference (MEPCON), Cairo, Egypt, 13–15 December 2022; IEEE: Piscateville, NJ, USA, 2022; pp. 1–8. [Google Scholar]
  40. Yao, L.W.; Aziz, J.A.; Kong, P.Y.; Idris, N.R.N. Modeling of lithium-ion battery using MATLAB/simulink. In Proceedings of the IECON 2013-39th Annual Conference of the IEEE Industrial Electronics Society, Vienna, Austria, 10–13 November 2013; IEEE: Piscateville, NJ, USA, 2013; pp. 1729–1734. [Google Scholar]
  41. Mongird, K.; Viswanathan, V.; Balducci, P.; Alam, J.; Fotedar, V.; Koritarov, V.; Hadjerioua, B. An Evaluation of Energy Storage Cost and Performance Characteristics. Energies 2020, 13, 3307. [Google Scholar] [CrossRef]
  42. Eltamaly, A.M. Smart Decentralized Electric Vehicle Aggregators for Optimal Dispatch Technologies. Energies 2023, 16, 8112. [Google Scholar] [CrossRef]
  43. Eltamaly, A.M. Optimal Dispatch Strategy for Electric Vehicles in V2G Applications. Smart Cities 2023, 6, 3161–3191. [Google Scholar] [CrossRef]
  44. Eltamaly, A.M. An Accurate Piecewise Aging Model for Li-ion Batteries in Hybrid Renewable Energy System Applications. Arab. J. Sci. Eng. 2023, 49, 6551–6575. [Google Scholar] [CrossRef]
  45. Farzin, H.; Fotuhi-Firuzabad, M.; Moeini-Aghtaie, M. A practical scheme to involve degradation cost of lithium-ion batteries in vehicle-to-grid applications. IEEE Trans. Sustain. Energy 2016, 7, 1730–1738. [Google Scholar] [CrossRef]
  46. Viswanathan, V.V.; Crawford, A.J.; Thomsen, E.C.; Shamim, N.; Li, G.; Huang, Q.; Reed, D.M. An Overview of the Design and Optimized Operation of Vanadium Redox Flow Batteries for Durations in the Range of 4–24 Hours. Batteries 2023, 9, 221. [Google Scholar] [CrossRef]
  47. Chen, S.; Sun, C.; Zhang, H.; Yu, H.; Wang, W. Electrochemical Deposition of Bismuth on Graphite Felt Electrodes: Influence on Negative Half-Cell Reactions in Vanadium Redox Flow Batteries. Appl. Sci. 2024, 14, 3316. [Google Scholar] [CrossRef]
  48. Woodfield, R.; Sun, C.; Zhang, H.; Yu, H.; Wang, W. Electro-thermal modelling of redox flow-batteries with electrolyte swapping for an electric ferry. J. Energy Storage 2022, 54, 105306. [Google Scholar] [CrossRef]
  49. Tang, A.; Bao, J.; Skyllas-Kazacos, M. Studies on pressure losses and flow rate optimization in vanadium redox flow battery. J. Power Sources 2014, 248, 154–162. [Google Scholar] [CrossRef]
  50. Hesse, H.C.; Martins, R.; Musilek, P.; Naumann, M.; Truong, C.N.; Jossen, A. Economic Optimization of Component Sizing for Residential Battery Storage Systems. Energies 2017, 10, 835. [Google Scholar] [CrossRef]
  51. Nguyen, T.A.; Crow, M.L.; Elmore, A.C. Optimal Sizing of a Vanadium Redox Battery System for Microgrid Systems. IEEE Trans. Sustain. Energy 2015, 6, 729–737. [Google Scholar] [CrossRef]
  52. Turker, B.; Klein, S.A.; Hammer, E.-M.; Lenz, B.; Komsiyska, L. Modeling a vanadium redox flow battery system for large scale applications. Energy Convers. Manag. 2013, 66, 26–32. [Google Scholar] [CrossRef]
  53. Eltamaly, A.M. A novel musical chairs algorithm applied for MPPT of PV systems. Renew. Sustain. Energy Rev. 2021, 146, 111135. [Google Scholar] [CrossRef]
  54. Yang, X.S.; Deb, S. Cuckoo search via lévy flights. In Proceedings of the World Congress on Nature & Biologically Inspired Computing (NaBIC), Coimbatore, India, 9–11 December 2009; pp. 210–214. [Google Scholar]
  55. Hannan, M.A.; Wali, S.; Ker, P.; Rahman, M.A.; Mansor, M.; Ramachandaramurthy, V.; Muttaqi, K.; Mahlia, T.; Dong, Z. Battery energy-storage system: A review of technologies, optimization objectives, constraints, approaches, and outstanding issues. J. Energy Storage 2021, 42, 103023. [Google Scholar] [CrossRef]
  56. Rabie, A.H.; Eltamaly, A.M. A new NEST-IGWO strategy for determining optimal IGWO control parameters. Neural Comput. Appl. 2023, 35, 15143–15165. [Google Scholar] [CrossRef]
  57. Mohamed, M.A.; Eltamaly, A.M.; Alolah, A.I. Swarm intelligence-based optimization of grid-dependent hybrid renewable energy systems. Renew. Sustain. Energy Rev. 2017, 77, 515–524. [Google Scholar] [CrossRef]
  58. Eltamaly, A.M. Optimal control parameters for bat algorithm in maximum power point tracker of photovoltaic energy systems. Int. Trans. Electr. Energy Syst. 2021, 31, e12839. [Google Scholar] [CrossRef]
  59. Eltamaly, A.M. An Improved Cuckoo Search Algorithm for Maximum Power Point Tracking of Photovoltaic Systems under Partial Shading Conditions. Energies 2021, 14, 953. [Google Scholar] [CrossRef]
  60. Farh, H.M.H.; Eltamaly, A.M.; Al-Shaalan, A.M.; Al-Shamma’A, A.A. A novel sizing inherits allocation strategy of renewable distributed generations using crow search combined with particle swarm optimization algorithm. IET Renew. Power Gener. 2021, 15, 1436–1450. [Google Scholar] [CrossRef]
  61. Eltamaly, A.M.; Rabie, A.H. A Novel Musical Chairs Optimization Algorithm. Arab. J. Sci. Eng. 2023, 48, 10371–10403. [Google Scholar] [CrossRef]
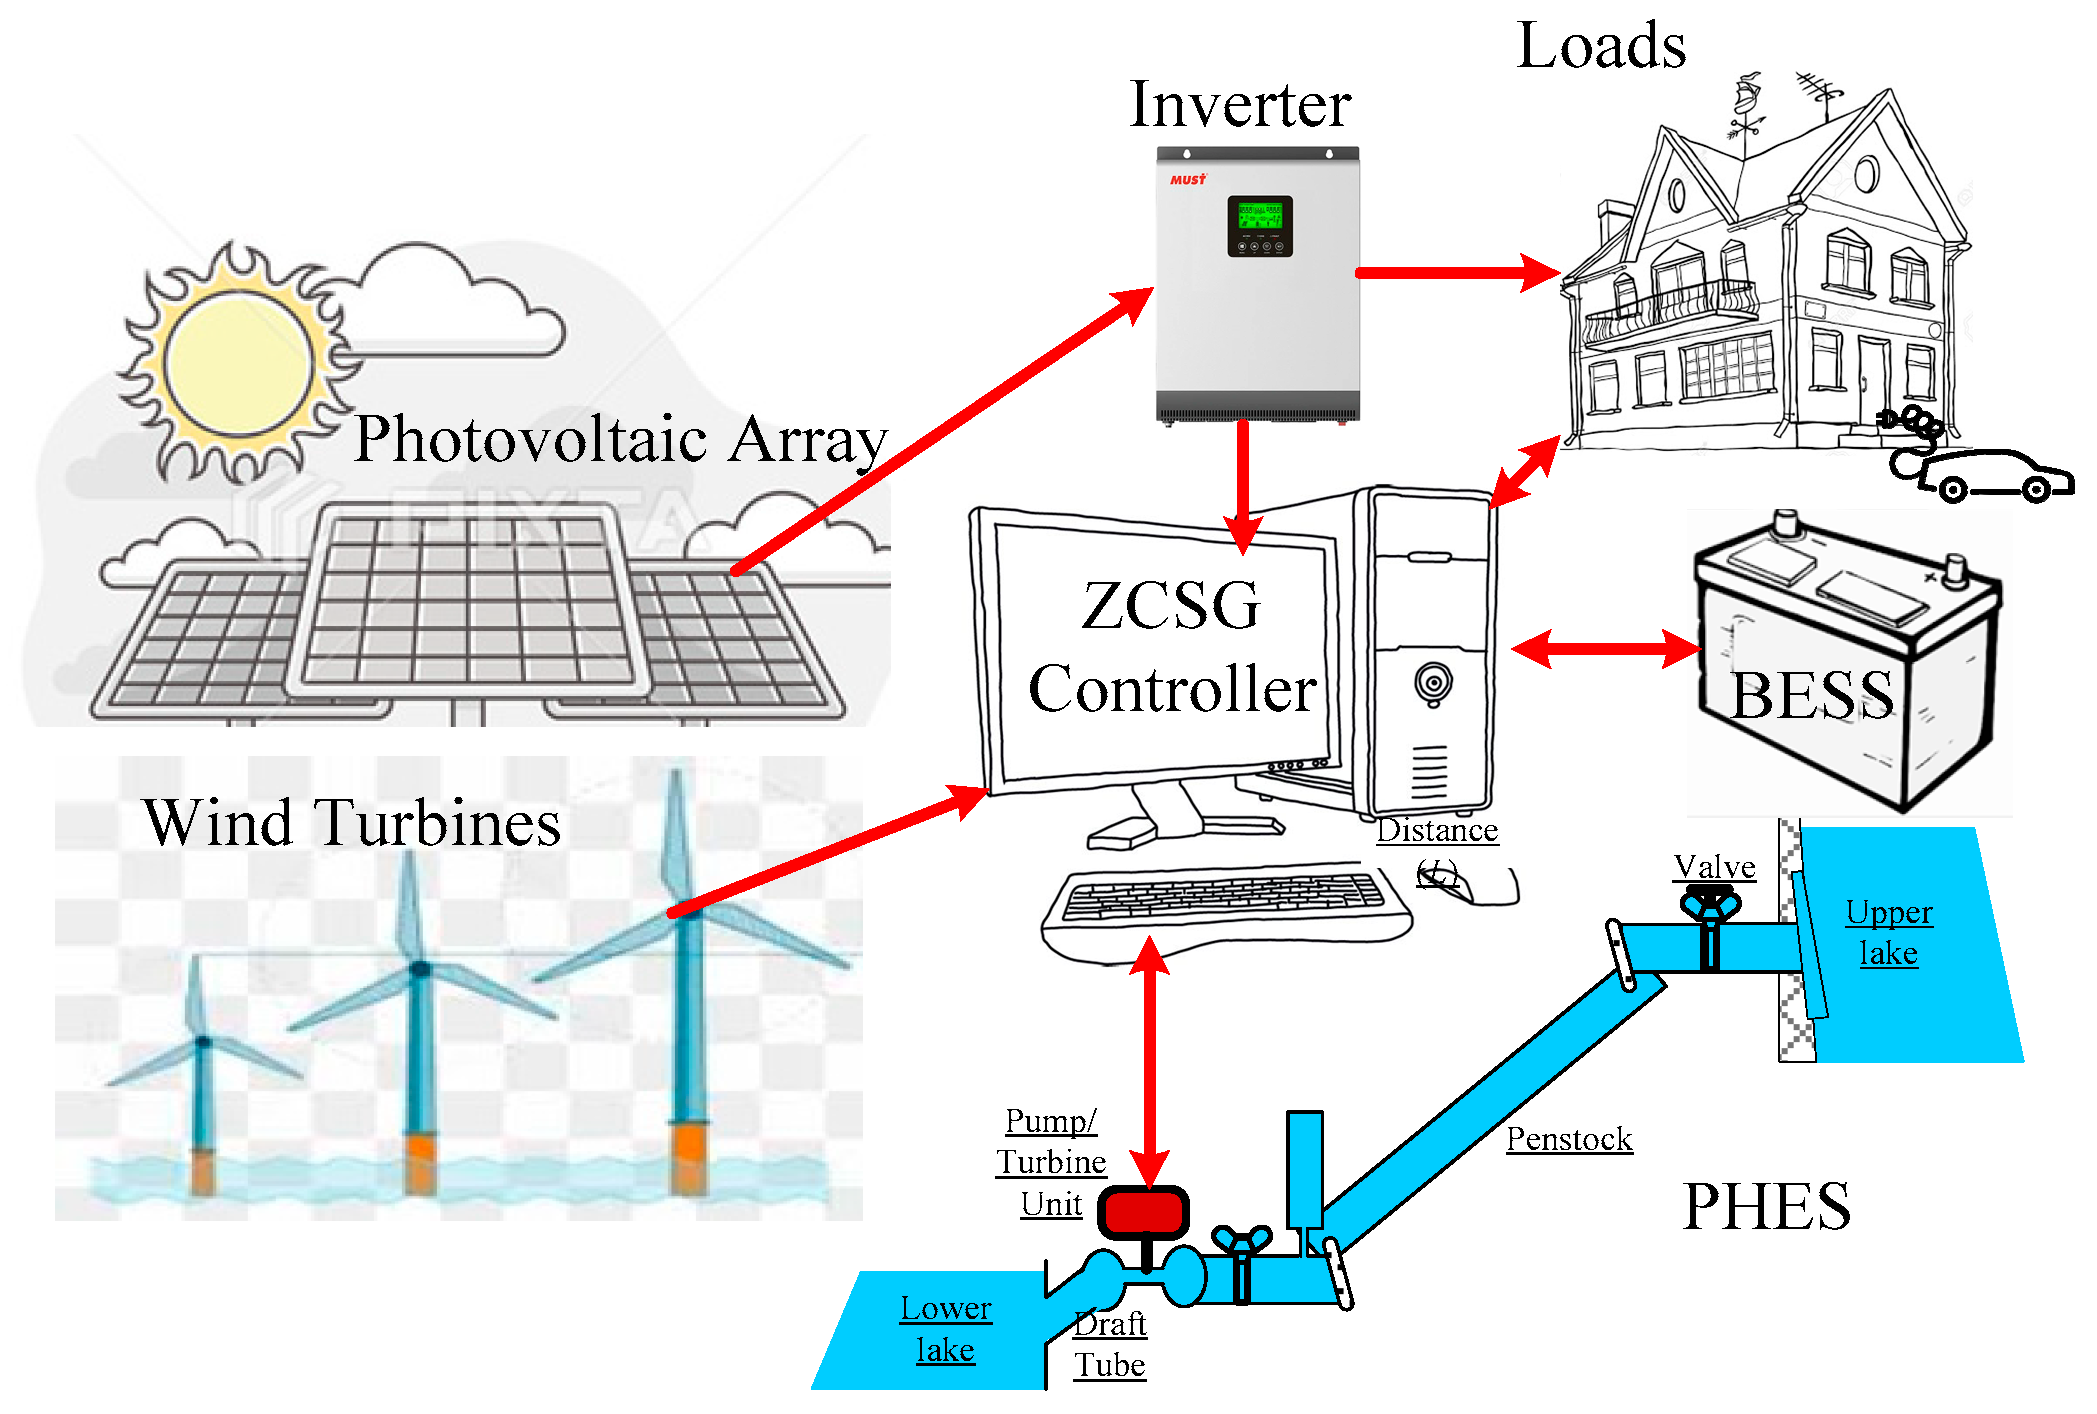
Figure 1. The proposed ZCSG schematic diagram.
Energies 17 05637 g001
Figure 2. The efficiency curve for the Francis turbine, along with the relative power.
Energies 17 05637 g002
Figure 3. The PHES schematic diagram.
Energies 17 05637 g003
Figure 4. The ACC, along with DoD, for LIBs used in this study.
Energies 17 05637 g004
Figure 5. The flow of electrolytes in a VRFB (red for discharging, blue for charging).
Energies 17 05637 g005
Figure 6. The power flow diagram through the VRFB in charging and discharging.
Energies 17 05637 g006
Figure 7. The logic of the musical chairs game.
Energies 17 05637 g007
Figure 8. The flowchart of the MCA optimization algorithm.
Energies 17 05637 g008
Figure 9. The overall simulation program used for optimal operation of the proposed smart grid.
Energies 17 05637 g009
Figure 10. The PHES flowchart.
Energies 17 05637 g010
Figure 11. The Lithium ion degradation-model flowchart.
Energies 17 05637 g011
Figure 12. The VRFB degradation-model flowchart.
Energies 17 05637 g012
Figure 13. The convergence performance of MCA compared to other optimization algorithms.
Energies 17 05637 g013
Figure 14. The main results of the ZCSG system without DSM (PED = 0).
Energies 17 05637 g014
Figure 15. The ESS situation of the ZCSG system without DSM (PED = 0).
Energies 17 05637 g015
Figure 16. The main results of the ZCSG system with DSM (PED = −0.5).
Energies 17 05637 g016
Figure 17. The ESS situation of the ZCSG system with DSM (PED = −0.5).
Energies 17 05637 g017
Figure 18. One-day zoom-in of the ZCSG system with DSM (PED = −0.5).
Energies 17 05637 g018
Figure 19. The variation in the SoH of the VRFB and LIB when used with the ZCSG systems.
Energies 17 05637 g019
Table 2. The VRFP model parameters [51].
(i, k) a k i b k i c k i d k i
(o, v)0.079170−0.0024401.276400-
(d, v)−0.2833300.132510.986140-
(d, p)1.0334000.3454000.119200-
(c, v)0.1973900.1616700.1420800.974790
(c, p)−0.1280001.0500000.0380000.118000
(a, b)−8.3904008.6634007.363200−7.504000
Table 3. The specifications of PHES.
ParameterValueParameterValue
Pump/Turbine CostUSD 225/kW [24]Rated Head1162 m [24]
Civil WorkUSD 7.884 [24]Friction factor, f0.34 [35]
ηP and ηT92% [24]Pipe Diameter D e = 0.72   P 0.43 / H 0.63 [35]
Lifetime40 [24]Pipe Length1200 m [35]
OMC1% of initial cost [24]
Table 4. The battery specification parameters.
ItemsLIBVRFB
Battery costUSD 156/kWh [55]USD 426/kW and USD 100/kWh
BA_OMCUSD 0.02/kWh/yearUSD 0.1/kWh/year
BA_SL20% BA_cost30% BA_cost
EOL Capacity40%40%
Efficiency0.95Equations (27) and (28)
σ0.02%0.035%
DOD70%100%
Table 5. The comparison of MCA and other optimization algorithms.
AlgorithmConvergence Time (s)% Convergence Time Compared to MCAObjective Function
MCA [61]3.41002.180107
GWO [56]6.6194.11762.178874
PSO [57]9.2270.58822.178537
BA [58]9.4276.47062.178875
CS [59]7.6223.52942.179815
CSA [60]11.6341.17652.179496
Table 6. The summary of simulation results of the ZCSG system with and without DSM with LIB and VRFB options.
CasesLIBVRFB
ITEMS Without DSM (PED = 0)With DSM (PED = −0.5)% ChangeWithout DSM
(PED = 0)
With DSM (PED = −0.5)% Change
LCOE0.09310.0625−32.870.08720.0594−31.88
NPC (109$)19.25812.845−33.3018.35612.019−34.52
NPP (109$)25.61525.6230.0325.62725.621−0.02
NPV (109$)6.35712.778101.017.27113.60287.07
NWT41,00032,800−20.0039,52331,815−19.50
SCA35,000,00027,200,000−22.2935,815,17628,754,381−19.71
V U R 450,000,00032,000,000−92.89360,000,00024,000,000−93.33
PPT2,000,0001,888,000−5.601,953,0001,574,000−19.41
PB250,000186,500−25.40438,500253,400−42.21
EB500,000373,000−25.40743,000419,000−43.61
BLT (years)5.55.5014140
Disclaimer/Publisher’s Note: The statements, opinions and data contained in all publications are solely those of the individual author(s) and contributor(s) and not of MDPI and/or the editor(s). MDPI and/or the editor(s) disclaim responsibility for any injury to people or property resulting from any ideas, methods, instructions or products referred to in the content.