Article

Energy-Oriented Modeling of Hot Stamping Production Line: Analysis and Perspectives for Reduction

1
School of Mechanical Engineering, Anhui University of Science and Technology, Huainan 232001, China
2
Hefei Metal Forming Intelligent Manufacturing Co., Ltd., Hefei 230601, China
3
School of Mechanical Engineering, Hefei University of Technology, Hefei 230009, China
*
Author to whom correspondence should be addressed.
Energies 2024, 17(22), 5798; https://doi.org/10.3390/en17225798
Submission received: 9 October 2024 / Revised: 13 November 2024 / Accepted: 18 November 2024 / Published: 20 November 2024
(This article belongs to the Section K: State-of-the-Art Energy Related Technologies)

Abstract

:
This research aims to develop a comprehensive mathematical model to analyze the energy usage of essential equipment in the hot stamping production line (HSPL) and identify opportunities for improving energy efficiency. This involves refining existing models and parameters related to energy consumption in hot stamping to ensure precise energy usage monitoring throughout the HSPL. The main focus is on accurately calculating and validating the energy consumption efficiency of equipment within a product’s production cycle on the roller hearth furnace’s HSPL. The model has proven to be highly accurate in predicting energy consumption for various equipment. The average energy consumption of the HSPL in the case study is calculated as 0.597 kwh/kg, and the actual measurement is 0.625 kwh/kg. However, it revealed significant deviation in the cooling system, primarily due to the incorrect water pump head parameters utilization. As per the model’s calculations, most energy consumption is attributed to the furnace (77.51%), followed by the press (10.92%), chillers (6.86%), cooling systems (2.76%), and robots (1.95%). Actual measurements and model calculations highlight mismatches between equipment power ratings and actual demand, resulting in average operating power significantly lower than the rated power. In line with efforts to promote low-carbon manufacturing, practical approaches are being explored to conserve energy and enhance overall process efficiency by refining process parameters, reducing quenching duration, improving SPM on the production line, and adjusting load matching.

1. Introduction

To meet global environmental protection goals, including carbon peak and carbon neutrality, countries have significantly increased their investment in the automotive industry’s green and sustainable development [1]. Within this scope, lightweight technology emerges as a critical area of focus. Using ultra-high-strength steels, specifically hot-stamped Steel (HSS) in body-in-white components, has become a pivotal technical metric for leading automobile manufacturers [2]. This advancement has resulted in the development of the hot stamping industry chain, where elements like A-pillars, B-pillars, side impact reinforcement beams, and bumpers are increasingly manufactured using Ultra-High Strength Steel through hot stamping. According to a 2017 study by Roland Berger, the percentage of hot-stamped parts in the BIW market is forecasted to increase from 8% in 2015 to 17% by 2025 [3]. These procedures necessitate specialized equipment, including heating furnaces, rapid transport robots, press machines, cooling systems, and laser trimming. The energy expenditure of these devices contributes to the overall lifecycle of hot stamping products. This study aims to enhance energy consumption’s modeling and calculation capabilities in hot stamping production by developing a practical model that accurately represents energy usage. Establishing such a model will improve the accuracy of predicting energy consumption in hot stamping, thereby assisting equipment manufacturers and production line managers in aligning their efforts to address discrepancies between equipment energy consumption and production planning.

2. Literature Review

Nevertheless, a comprehensive analysis and modeling of these production lines’ design and energy consumption still needs improvement. Existing models predominantly focus on modeling and optimizing press [4] and heating furnace equipment [5], neglecting the hot stamping production line’s overall energy consumption, encompassing the production cycle, beat planning, material selection, and product requirements. This oversight necessitates manufacturers to consider safety design factors extensively, inadvertently increasing energy losses in the hot stamping process. According to a recent review report, the number of papers related to hot stamping technology has recently stabilized or slightly declined. This shift indicates a transition from basic research to application and optimization, focusing on refining processes, enhancing materials, and developing more advanced equipment [6]. This section provides a comprehensive overview of the progression of hot stamping processes, tracing their journey from scientific exploration to widespread commercial implementation. This encompasses the technological advancements in materials, equipment, and production planning specific to thermal forming processes. A particular emphasis is placed on the existing accomplishments and limitations in energy consumption modeling, which is the focal point of this study.

2.1. Regulation of the Hot Stamping Process

In the past decade, 22MnB5 Steel has been the most prevalent type. It achieves a fully martensitic microstructure with a cooling rate of at least 27 °C/s, yielding an Ultimate Tensile Strength (UTS) of up to 1500 MPa [7]. In the process of heating and transfer, HSS are inevitably exposed to the air, which results in surface oxidation and decarburization. The production of PHS entails a series of energy-consuming processes, including ore mining, smelting, rolling, hot stamping, assembly, and recycling [8]. The primary goal of lightweight design is to minimize carbon emissions during component assembly or use. However, the energy consumption associated with PHS materials and their forming processes, which should be considered during the design stage, is often neglected.
The quenching time directly impacts the production speed and the energy consumption of various equipment, making it a critical research area. Numerous experiments and analyses have been undertaken in this context. One study presented an experimental apparatus to estimate the thermal resistance at the interface between parts and tools [9]. This apparatus was mainly utilized to improve the cooling efficiency of Usibor1500P during the hot stamping process. The evaluation of contact thermal resistance employed a nonlinear one-dimensional inverse technique. A separate experiment and analysis also investigated the interfacial heat transfer coefficient (IHTC) between boron steel 22MnB5 and the tool [10]. The thermal conductivity of the tool material influences the temperature difference at the contact surface, which can decrease IHTC due to heat accumulation after multiple stamping cycles. Another study proposed a model for predicting the hot stamping process’s cycle time based on the material’s temperature changes after removal from the furnace. The model calculated the process window time considering temperature limitations at crucial points [11]. Building on this foundation, a cycle time calculation method based on the Design of Experiments (DOE) was established to optimize cycle times during the hot forming process. Furthermore, researchers studied the cooling water channels within hot stamping tools [12,13]. They developed a mathematical model of structural parameters based on the analysis and simplification of heat transfer models, mainly optimizing the cooling channel diameter, the distance between cooling channels, and the distance from the tool surface to the center of the cooling channel. However, improving quenching efficiency implies increasing the cooling water flow rate in the cooling system. The rapid increase in cooling water temperature over a short period further intensifies the instantaneous power load on the chiller unit.
The stamping process places high energy requirements on large stamping machines, and the demand for hot stamping processes has made servo-hydraulic presses the mainstream choice due to the need for pressure-holding and quenching processes. Research on the energy consumption of hydraulic presses mainly focuses on quantitative analysis of energy consumption and optimization for energy use and conservation. In a series of representative studies [14], the energy transfer and conversion within the entire hydraulic system were analyzed from the perspective of energy flow, and an energy flow quantification model was constructed. Based on this model, various energy-saving methods for hydraulic presses were proposed. For example, Gao et al. [15] proposed a new energy-saving system with dual actuators. Li et al. [16] proposed an energy-saving method by balancing the load of operations for hydraulic presses. Additionally, Gao et al. [17] demonstrated that servo-driven systems can effectively reduce energy consumption in the stamping industry. This method was simplified to represent the model with the fewest unknown parameters, enhancing computational convenience [18]. It identified the primary reason for inefficiency was the mismatch between load characteristics and driving methods. A novel mathematical model for predicting carbon emissions was developed. This model decomposes the carbon emission process and explores a new approach for energy-efficient hydraulic unit matching [19].
Optimizing the hot stamping process is invariably geared towards enhancing product quality. The literature above has focused on refining various specific process parameters, such as heating temperature, holding time, transfer time, pre-stamping temperature, stamping speed, quenching pressure, quenching time, thermal conductivity, the dimensions and positioning of cooling channels, cooling water flow rate, intermittent timing, and overall cycle time, through meticulous regulation and adjustment. These adjustments aim to prevent macroscopic defects such as excessive thinning, cracking, and wrinkling, as well as microscopic issues like hydrogen embrittlement and martensitic transformation. However, there has been a notable scarcity of studies examining these optimization parameters from the vantage point of production line energy consumption. It is essential to recognize that the impact of these process parameters on energy consumption is not merely a matter of simple linear correlation; instead, they exhibit complex interdependencies and require a balanced approach. For instance, increasing the stamping speed can shorten the process cycle time and increase the press’s energy consumption. Similarly, augmenting the quenching pressure may reduce the quenching time and impose a higher load on both the media and the cooling system. Consequently, a more profound analysis and refinement of these process optimization parameters are essential to understanding and mitigating their influence on the energy consumption of the production line. A holistic approach considering product quality and energy efficiency is imperative for sustainable and cost-effective manufacturing processes.

2.2. Related Works on Energy Consumption Modeling of Hot Stamping

The energy consumption analysis in the hot forming process mainly focuses on large-scale equipment, starting with the heating furnace. Heng et al. [5] established a concentrated heat transfer model for roller hearth furnaces to predict the furnace temperature distribution and part exit characteristics, finding the most optimal (energy-efficient) furnace operating method, especially for flameless combustion furnaces. Cheng et al. [20] studied energy-saving production planning for a forging cycle heating furnace. This model provides valuable insights for optimizing production and achieving energy-saving goals. Verma et al. [21] established models for sheet heating and austenitization thermomechanics and optimized using nonlinear methods, selecting different constraints based on the precision of heat transfer and austenite dynamic models. This underscores the importance of accurate model establishment and parameter identification [22]. For thin sheet austenitization, a comparison analysis of various temperature control models and material transport models for roller hearth furnaces was conducted [23]. This provided the foundation for calculating heating furnace energy consumption and productivity. It is worth noting that the energy consumption modeling methods and precision vary significantly due to the differences in heating methods and fuels used in different types of heating furnaces.
Subsequently, there have been advancements in research on production efficiency and cycle time optimization in hot stamping production lines. Hot stamping is a high-energy consumption process, and research has aimed to optimize the process parameters considering multiple objectives related to energy consumption and product forming quality [24]. A notable reference for this paper is developing a quantified energy model for the blank stamping process in hot stamping. Wang et al. [25] used a modeling approach based on finite-state machines for the hot stamping process. Researchers have tackled issues of coordinated scheduling in various manufacturing units within a newly developed multi-layer box-type heating furnace production line. This approach has allowed for an in-depth analysis and adjustment of production sequences, energy consumption, and delivery periods.
A reference model known as the Real-time Intelligent Iterative Manufacturing System (RIIMS) has also been developed for this production line [26]. It is employed for iterative analysis and optimization of production processes. Two potential bottlenecks in the transportation process were identified by analyzing the correlation between equipment and production processes. Moreover, the increased workload of handling robotic arms has introduced complexities in paths and temperature control for the sheet metal before forming. An analysis conducted in reference [27] indicates that the energy consumption of robotic arms is closely related to factors such as motion paths, loads, and speeds. Frequent equipment start-stop cycles and extended idle times increase energy consumption. However, the above models focus on inspecting equipment in laboratory settings while ignoring most of the actual production process problems, especially without considering the vast energy consumption difference between roller-bottom heating and multi-layer box-type furnaces. Furthermore, most production lines today are integrated with more suitable automated handling equipment for hot stamping production lines, such as four-fold speed robot arms and shuttle manipulators.
As mentioned above, energy consumption in the hot forming process varies significantly among devices, involving various forms of energy transfer like electrical, mechanical, thermal, and hydraulic energy. These energies continuously convert and balance among different components in the process chain. Therefore, it is crucial to establish a reliable, fast, and highly accurate energy consumption model for the production line. Both theoretical principles and data analysis can be used to develop energy consumption models. This paper will use various methods to tailor energy consumption modeling for specific equipment in the hot forming process. The adaptation will consider multiple dimensions, including production line cycle times, thermal balance, motor loads, etc. Through this multidimensional approach, the study aims to analyze the sensitivity of parameters and energy-saving potential. This will provide valuable guidance for reducing energy consumption and emissions

3. Energy Consumption Modeling of Sequential Process Stages

3.1. Hot Stamping Production Line and System Boundary

The blank is disassembled and transported to the hearth furnace for heating, then rapidly transported to the hydraulic press for forming and quenching, and finally removed from the tool for the next production stage. Figure 1 shows the typical HSPL. It should be noted that the temperature for forming the blank exceeds 700~800 °C, and the temperature before quenching must surpass the martensite start point. Moreover, the temperature after quenching is beneath the martensite finish point [28]. Given these process cycles, the energy consumption analysis is further refined by delineating the process boundaries. This study meticulously analyzes the energy consumption at each stage of the process, categorizing them into the following points:
(1)
Handling: each step must be transferred from the mechanical arm to the next step, and these operations must consume energy.
(2)
Heating: heating the blank to the optimal temperature and maintaining it until complete austenitization is achieved constitutes a critical aspect in the energy consumption analysis of HSPL.
(3)
Forming: operating the hydraulic press to form and quench the blank results in significant energy consumption.
(4)
Cooling: the quenching process requires continuous operation of cooling pump motors and heat exchangers, resulting in substantial energy consumption.
The energy consumption of HSPL can be decomposed into the energy demands of its constituent equipment and components. Accordingly, the total energy consumption Etotal can be approximated as the cumulative energy expenditure of each piece of equipment, expressed as follows:
E t o t a l = E h a n d i n g + E h e a d i n g + E f o r m i n g + E c o o l i n g
where Ehandling, Eheating, Eforming, and Ecooling are the energy consumption of the handling, heating, forming, and cooling. Subsequently, physical modeling and energy consumption analysis were conducted for the four stages of process equipment.

3.2. Energy Consumption Analysis of Automatic Transfer Device for Loading and Unloading

Before entering the heating furnace, robots extract the blanks from the storage area. These blanks then sequentially proceed through a labeling machine and a thickness gauge to ascertain fundamental parameters. Given the thermal constraints preceding the hot stamping process, operations outside the furnace are subject to strict time limitations. Upon completion of the stamping process, the robot conveys the blanks, which retain a residual temperature ranging from 100 to 200 °C, to a conveyor equipped with cooling fans. Various handling robots are employed throughout this procedure, encompassing industrial robotic arms, gantry systems, and rapid shuttle machines.
Figure 2 demonstrates that the motor requires a significant torque during the startup and braking phases, which is essential for overcoming inertia and bringing the system to a halt. In contrast, the motor maintains a steady torque level primarily to counteract minimal frictional forces during uniform motion. Consequently, the calculation of energy expenditure can be deduced from the trapezoidal speed profile and the corresponding torque curve, which reflects the varying energy demands at different operational stages.
Regardless of the specific type of robot, its energy consumption fundamentally stems from converting electrical energy into mechanical energy [27]. Based on previous research, their power varies with time, and the energy consumption during the transfer process is defined as Ph(t). The expression for this is as follows:
P h t = P w a i t i n g t + P a c t i v e t
where fixed Power Pwaiting(t) denotes the power required to maintain its system, and Pactive(t) represents the power consumption during standby and load movements, including return movements. Robotic arms typically employ servo motors, ideally suited for operations involving frequent start-stop cycles.
By incorporating these factors and considering the mechanical efficiency η ¯ m e c , i along with referencing the motor efficiency η ¯ e l , i from the MAP chart, the formula for calculating active power can be derived as Equation (3):
P a c t i v e , i = i = 1 n P m , i / η ¯ m e c , i η ¯ e l , i = i = 1 m j = 1 n T i , j t i , j ω i , j t i , j / 9550 × η ¯ m e c , i η ¯ e l , i
where Pactive,i and Pm,i represent the operating and computational power of the ith motor, respectively. The torque-time and velocity curves for the jth action of the ith motor are denoted by Ti,j(ti,j) and ωij(ti,j), respectively. ti,j is used to convey the time (an independent variable) for the jth action of the ith motor.
Therefore, the formula for the energy consumption model during the handling stage can be calculated as Equation (4):
E h a n d i n g = i = 1 n t i P a c t i v e , i t i d t + i = 1 n P w a i t i n g , i × 1 t i
where Pactive,i(ti) is the real-time input power for each motor, ti is the operating time of each motor, Pwaiting,i(ti) is the average power of each motor in waiting time, and n is the number of motors.

3.3. Energy Consumption Analysis of Hearth Furnace

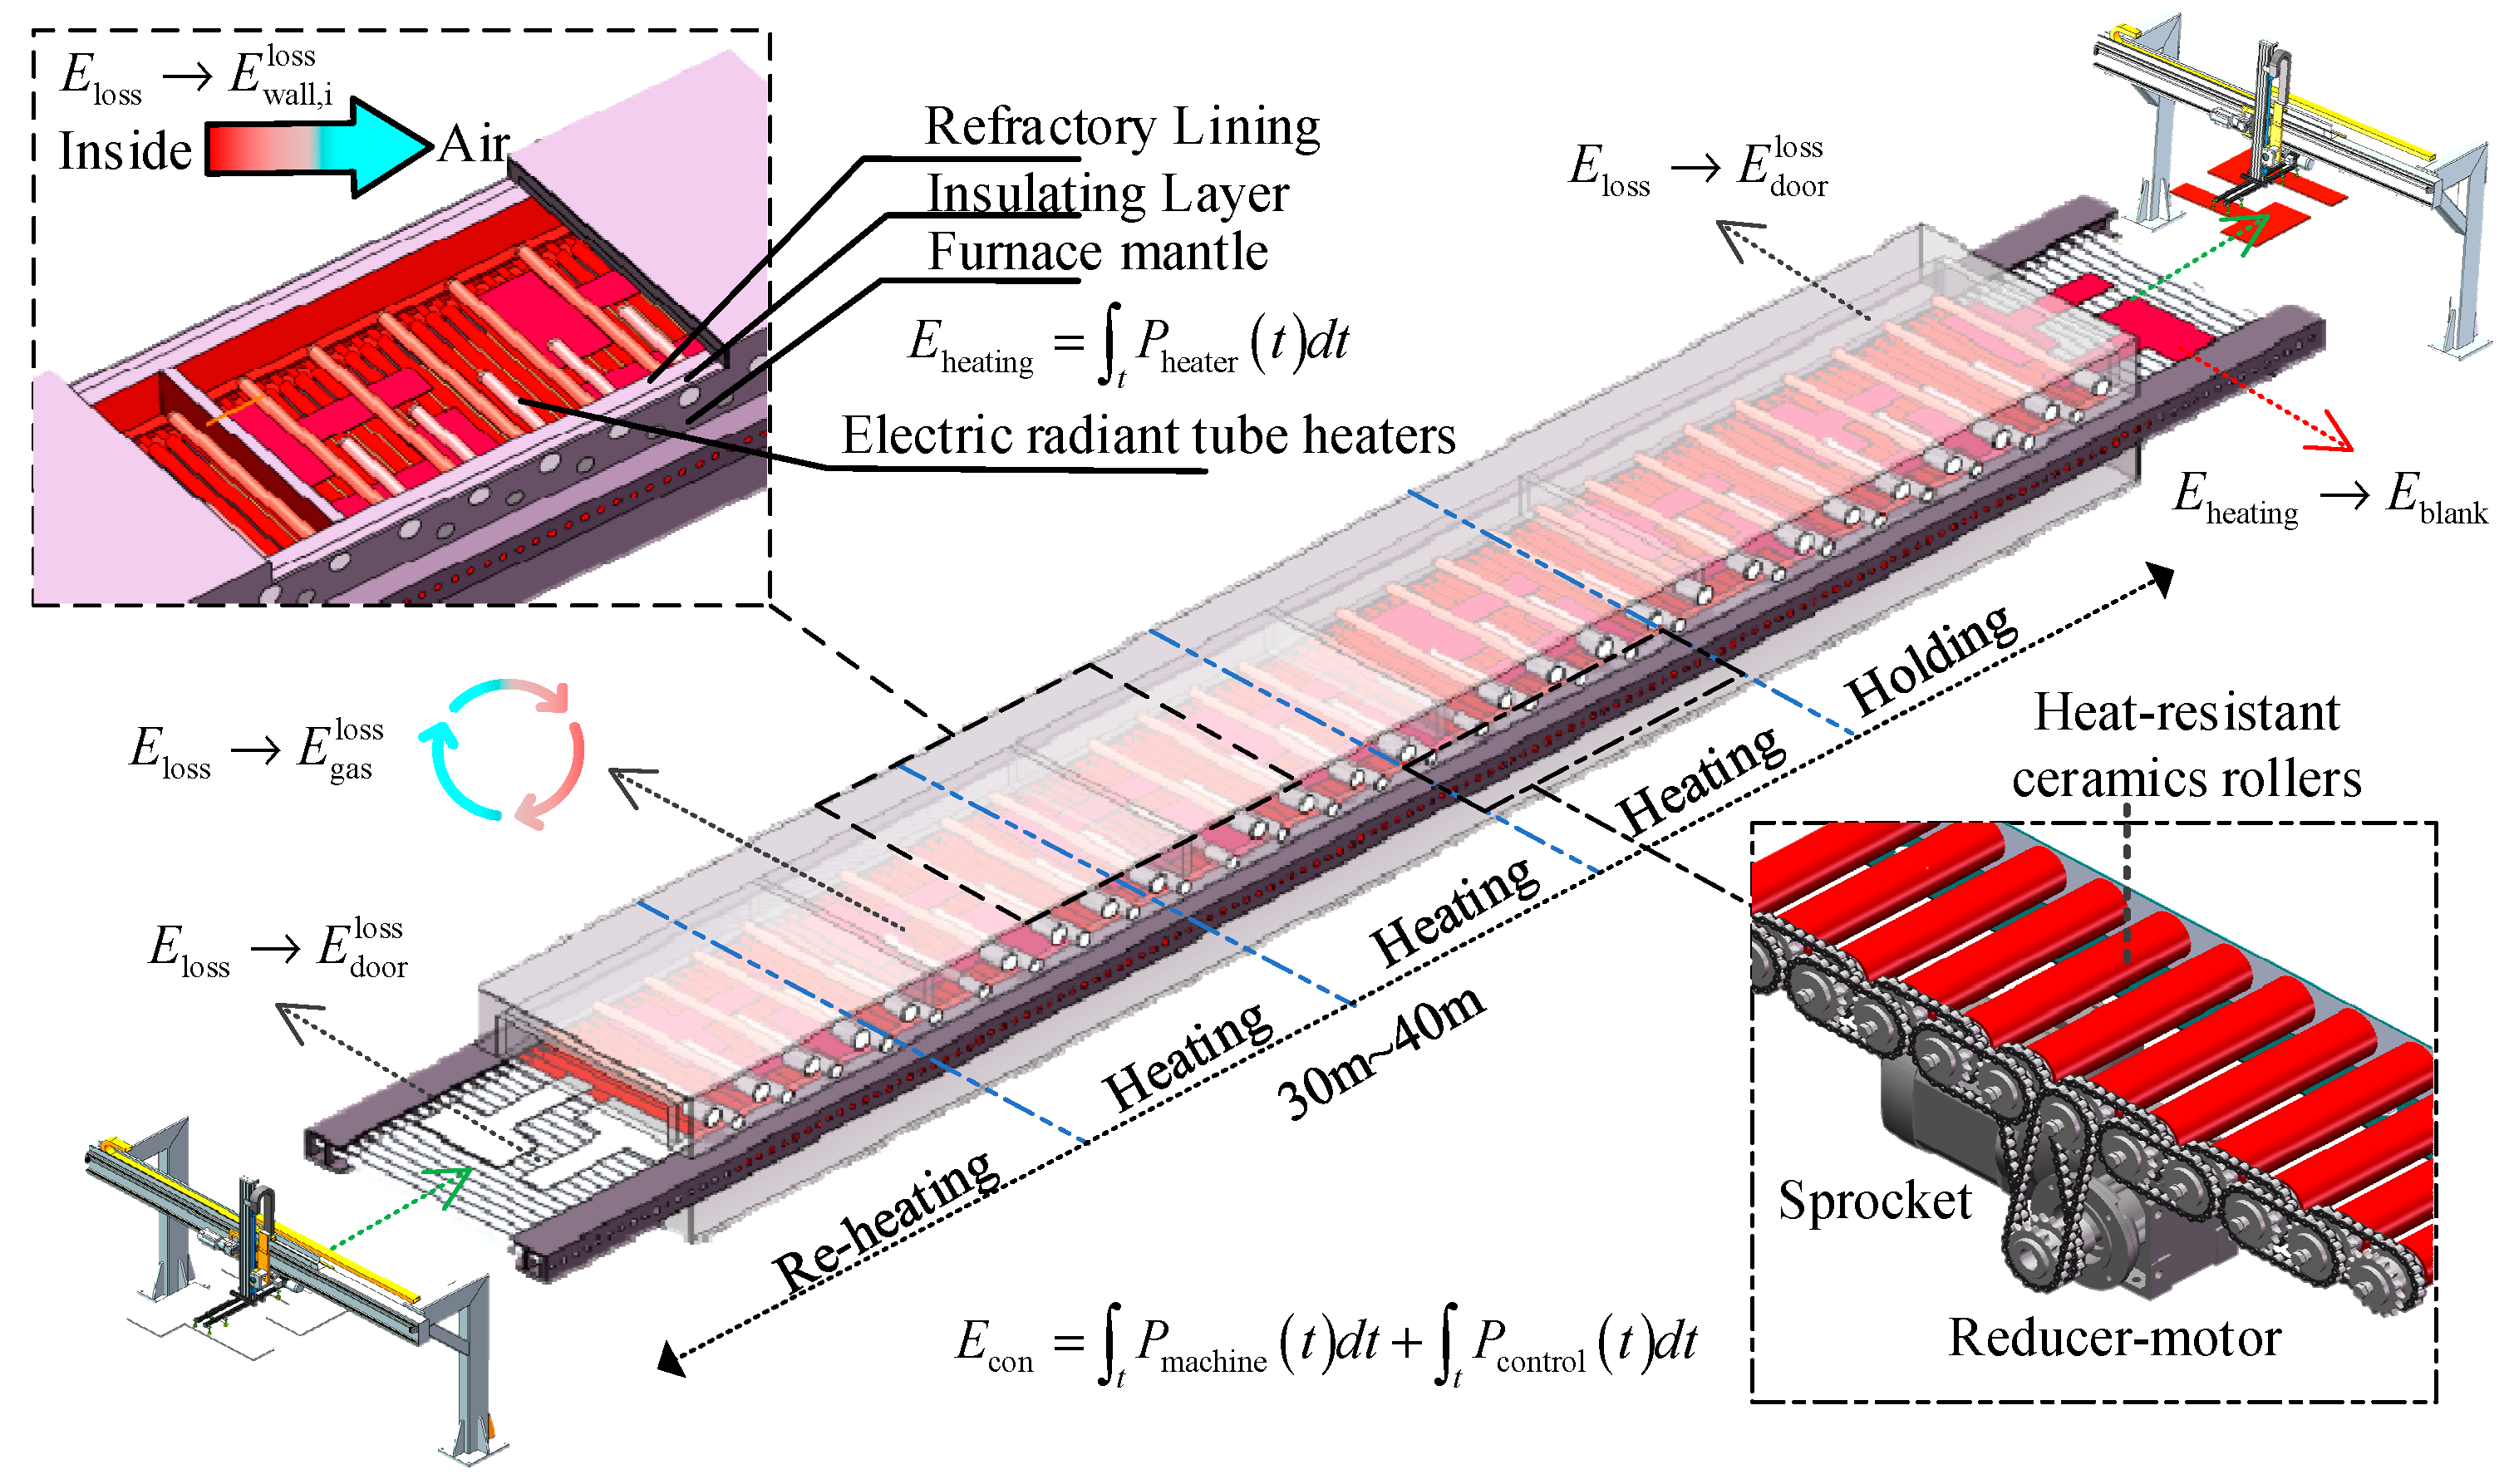
The roller hearth furnace (furnace), integral to the HSPL, utilizes diverse heating methods, including resistance, gas, or a hybrid approach. The primary mechanisms of heat transfer within this furnace are radiation and convection. This discussion is centered on the energy consumption model, particularly emphasizing the electric radiation tube heating method. In practical practical production, as illustrated in Figure 3, the furnace extends approximately 30 to 40 m long and is segmented into several distinct heating zones. The conveyor rollers of each heating zone advance forward the blank.
Different areas of the furnace are powered by independent reduction motors that drive chain and sprocket mechanisms, allowing for zoned speed control. Each zone has multiple high-power resistance thermal radiation tubes and independent temperature monitoring and control units. The temperature is regulated through ON-OFF control, where each thermal radiation heating tube provides a fixed power output. The temperature control subsystem in each zone manages these tubes’ opening and closing times to ensure a uniform temperature within each section. The power input to the heating furnace is directed towards three principal objectives: (1) Supplying heat to the heaters. (2) Providing mechanical power for roller rotation, centering devices, and atmosphere circulation fans. (3) Powering control systems and other electronic devices.
According to the energy flow direction, the power input to the furnace can be divided into two types. The first type, Econ, encompasses the energy directed into the equipment through rotating machinery and control circuits. This includes the atmosphere-circulating fan, the roller-driven conveyor motor, and various control systems that incorporate sensors for monitoring and regulation. The second type, Eheater, represents the energy transformed by the heater into thermal energy. This heat is transmitted through three principal mechanisms: heat conduction, convection, and radiation. These mechanisms are fundamental to the heat transfer process within the furnace and can be summarized as follows:
E h e a t i n g = E c o n + E h e a t e r
E c o n = t P m a c h i n e t d t + t P c o n t r o l t d t
E h e a t e r = t P h e a t e r t d t
where Pmachine(t) is the power function of machines, and Pcontrol(t) is the power function of the control system. Pheater(t) is the power function of heaters. Further, the heat energy Eheater released by the heater can be broken down into two parts: the heat loss of the heating furnace Qloss and the heat energy used to heat the blank Qblank. It is important to note that the model does not account for the heat storage within the furnace structure itself. This simplification assumes that the heat exchange between the furnace and its surrounding environment has reached a steady state. In other words, the rate of heat loss to the environment is balanced by the heat input from the furnace’s heating elements, leading to a stable thermal condition within the furnace’s operational parameters. The expression is as follows in Equation (8):
E h e a t e r = Q l o s s + Q b l a n k
While Formulas (5)–(8) have delineated the energy consumption model for the heating furnace, they incorporate parameters that are highly sensitive to temporal fluctuations. Since the energy efficiency assessment is fundamentally based on the mean value calculated over a predetermined time frame, the complexity introduced by these temporal considerations can impede the comparative analysis. To address this, Section 3.3.1, Section 3.3.2, Section 3.3.3 of the document aim to refine the integral form of the model. This refinement simplifies the computational process, making it more accessible for analyzing and comparing energy efficiency within fixed time intervals.

3.3.1. Fixed Energy Consumption Model of the Roller Hearth Furnace

A portion of the energy consumption within the furnace can be simplified as fixed consumption. For example, energy consumption related to system controllers, displays, communication equipment, and similar components can be considered constant values. When processing parameters, such as plate size, production cycle, heating time, and atmosphere circulation, remain unchanged, and the furnace reaches a relatively stable operating state, the electric motor loads and equipment speeds like rollers and fans also stabilize. Consequently, this portion of energy consumption can be treated as fixed. Therefore, the fixed energy consumption model of the furnace can be simplified from Equation (6) to Equation (9) [20]:
E c o n = i = 1 m P c o n t r o l , i ¯ × t c , i + j = 1 n P m a c h i n e , j ¯ × t m , j
where P c o n t r o l , i ¯ is the average input power characteristics of the control system, the average output power characteristics of the mechanical power system, including the roller rotation machines and other transmission devices, t c , i , t m , j , the operating time of the control system and the mechanical power system.

3.3.2. Heat Loss Model of the Roller Hearth Furnace

The energy consumption due to the heat loss in the furnace can be primarily attributed to three principal areas:
(1)
Heat exchange with the surrounding environment. Heat is transferred through the furnace’s outer walls due to temperature gradients with the environment. To minimize this heat loss, modern furnaces are equipped with a multi-layered design that includes a refractory lining, an insulating layer, and an outer wall enclosure.
(2)
Extended opening of furnace doors: Continuous loading of the roller-bottom heating furnace for prolonged periods with open doors can lead to heat loss.
(3)
Atmosphere circulation: Circulation of the furnace atmosphere is crucial for the heating process. However, releasing exhaust gases during this circulation can lead to heat loss.
The model for these energy losses can be established as follows in Equation (10):
Q l o s s = i = 1 n Q w a l l , i l o s s + Q d o o r l o s s + Q g a s l o s s
where Qloss represents the overall heat loss of the heating furnace. Q w a l l , i l o s s represents the heat loss in different sections of the furnace. Depending on the process, different regions of the furnace may have different temperatures, leading to varying heat losses. Q d o o r l o s s represents the heat loss through the furnace doors. Q g a s l o s s represents the heat loss due to exhaust gases. Furthermore, the heat loss at the furnace door can be expressed as follows: Equations (11)–(13) [29]:
Q d o o r = Q r a d + Q c o n v
Q r a d = ε σ A r a d T 4 T 0 4
Q c o n v = h A c o n v T s T
where Qrad represents the heat loss due to radiation by the doors. Qconv represents the heat loss due to convection (both air intake and exhaust) by the doors.
Calculation methods for radiative and convective heat transfer are well-established, as shown in Equations (12) and (13). However, plates’ sequential entry and exit in a roller hearth furnace introduce a constant disturbance at the entrance and exit. This situation complicates the measurement of parameters related to heat transfer. Estimates are typically based on a fixed percentage derived from post-production test data provided by manufacturers, and these are combined with production conditions.
Q g a s l o s s = 1 δ V g a s ρ g a s C g a s T g a s 2 T g a s 1
where δ represents the heat recovery efficiency of exhaust gas, Vgas represents the volume of the protective atmosphere, ρgas: gas density, Cgas represents the value of the specific heat capacity of the protective atmosphere changing with temperature, T g a s 2 T g a s 1 gas represents the temperature corresponding to different specific heat capacity of the protective atmosphere.

3.3.3. Heating Energy Consumption Model of Blank

The heat energy from the heater mainly provides the energy used to heat the blank. This energy is transferred into the furnace through thermal convection, thermal radiation, and thermal conduction between the atmosphere in the furnace and the wall boundary. The energy model can be determined using an immobile volume constant specific heat method:
Q b l a n k = 60 N V ρ T a i r T b C p T d T
where Qblank represents the heat energy required to heat the blank, Cp(T) represents the function of the specific heat capacity of the blank changing with temperature, Tb is the target temperature for heating the blank, Tair is the temperature of the blank before entering the heating.

3.4. Energy Consumption Analysis of the Press During Forming

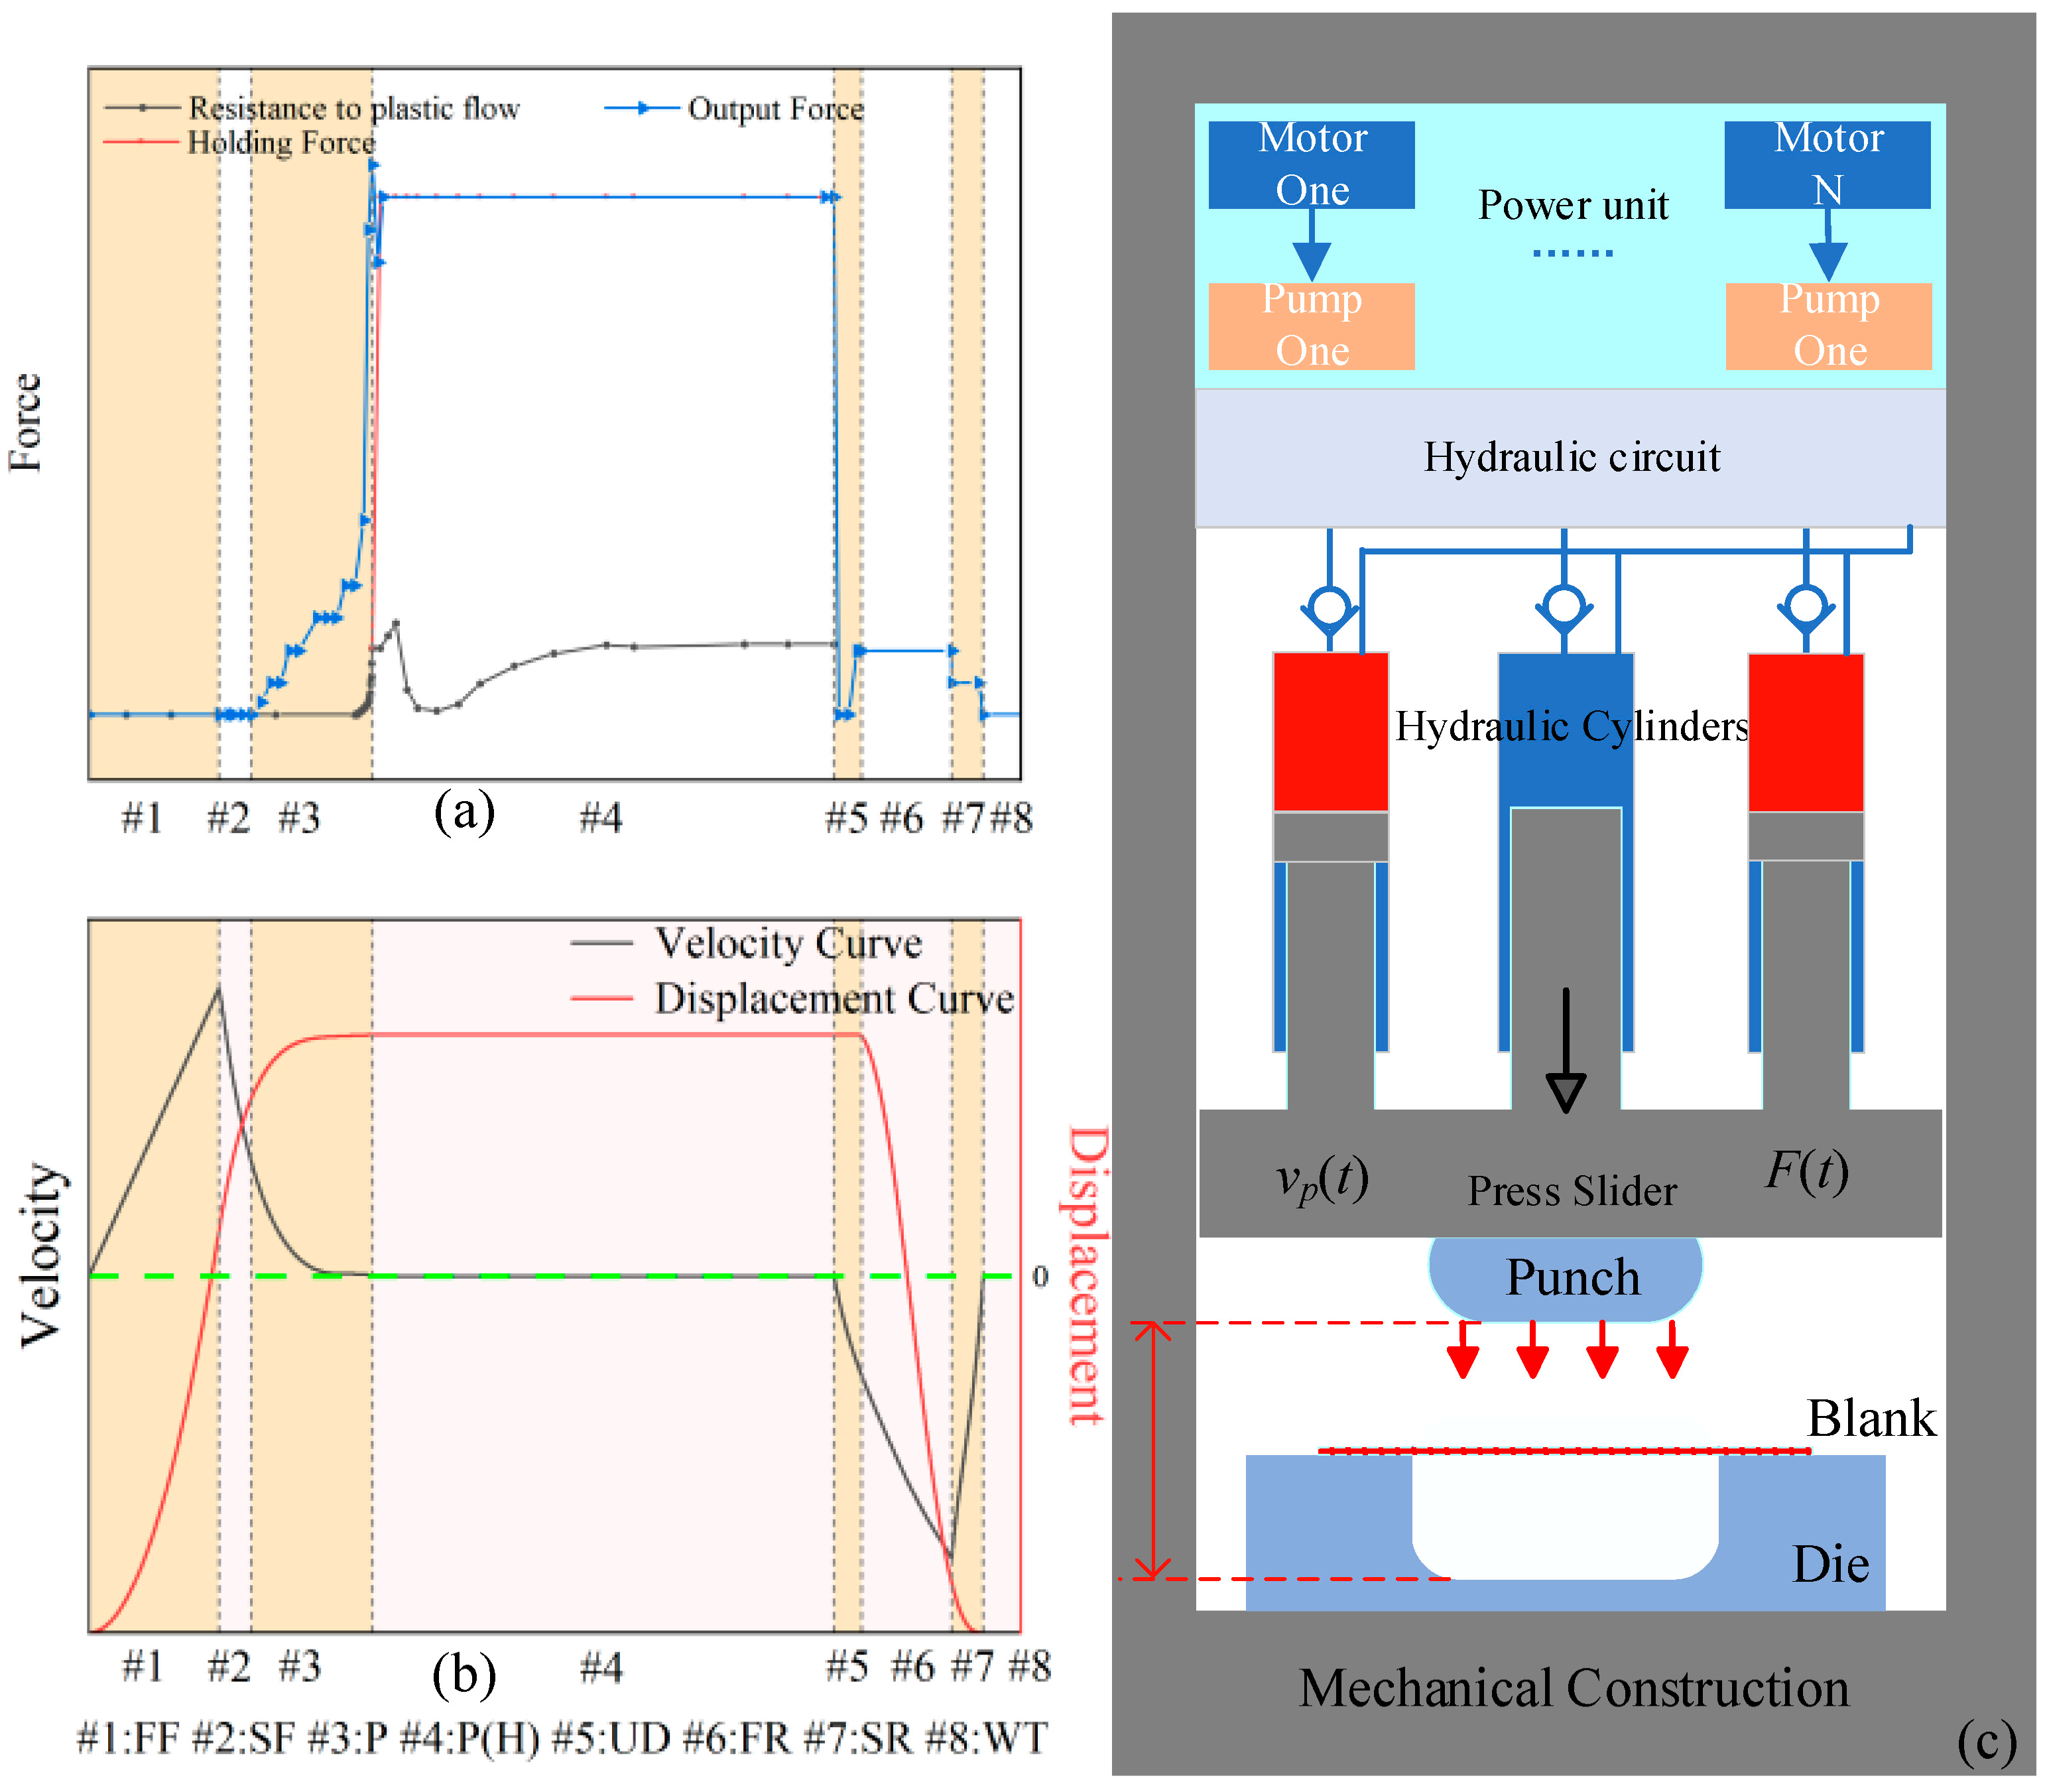
After transformation into an austenitic state, the blank is transported to the hydraulic press via a transmission robot. Here, it undergoes two crucial process steps: forming and hardening. The energy flow within the hydraulic press is illustrated in Figure 4c. The motor pump units in the drive system, the pipe-valve assemblies, and the hydraulic cylinders sequentially convert electrical energy into mechanical energy, hydraulic energy, and mechanical force applied to the workpiece. The hot stamping process comprises a series of continuous actions. Hence, creating an energy consumption model for hydraulic presses requires a detailed analysis of the transformation and energy loss across different components. Since estimating energy consumption under varying operating conditions is challenging, integration with a data-driven model is essential. We follow periodic energy consumption calculations at each stage based on the data.
The deformation energy that shapes the blank is supplied by the load-forming force driven by the hydraulic cylinder. The power for driving the hydraulic cylinder originates from the power system of the servo-hydraulic press. It can ultimately be detected as the electrical energy acting upon the servo motor. Due to these losses being counteracted through various forms of conversion and transmission, they react back to the input end of the motor. As a result, the total energy consumption of the forming equipment can be gauged by measuring the overall electrical energy consumption input into the motor. The operational power of the electric motor exhibits distinct characteristics in different stages. Specifically, it can be divided into energy consumption during the stamping process Epress. Its main components are the energy consumption of the hydraulic press during stamping Eworking, the overflow energy consumption during pressure holding quenching Equench, and the energy consumption of the equipment waiting for no load time Eidle. It is expressed as follows in Equation (16):
E p r e s s = E w o r k i n g + E q u e n c h + E i d l e
Work is performed by pushing objects to move, and energy consumption can be calculated as the integration of power over time. Power is the product of force and velocity. By understanding hydraulic machines’ energy or power transmission characteristics, energy or power balance equations can be established. Among these, the hydraulic press movement is divided into distinct zones: fast forming (FF), slow forming (SF), pressing (P), holding pressure (P(H)), unloading (UD), fast return (FR) and slow return (SR) phases as shown in Figure 4a,b. The servo-hydraulic press controls the hydraulic cylinder’s movement of the slider along the intended displacement curve by manipulating the servo motor, axial piston pump, and a series of hydraulic control valves. Different zones exhibit varying slider velocities and applied forces, leading to differing energy efficiency [19]. Consequently, the energy consumption expression for each phase is given by Equation (17):
E e x s t a g e m = x s t a g e m 1 x s t a g e m F ( x ) d x = t s t a g e m 1 t s t a g e m F t ν p t d t
where stage(m) represents the different speed stages of equipment operation, m = 1, 2, 3, 4, 5, 6 represents FF, SF, P, P(H), UD, FR, and SR, F(t) is the function of the output force of the hydraulic cylinder of the stamping machine with time, vp(t) is the function of the moving speed of the press slider with time, t s t a g e m represents the time spent in each action stage, The expression of each action stage is merged to calculate Eworking, as defined by Equation (18):
E w o r k i n g = t w o r k i n g P w o r k i n g t d t = m = 1 s t a g e m t s t a g e m 1 t s t a g e m F t ν p t d t / η t = m = 1 s t a g e m x s t a g e m 1 x s t a g e m F x d x / η s t a g e m ¯
where η s t a g e m ¯ is the energy consumption efficiency of each action stage, for energy losses occurring within the internal transmission and conversion of the equipment, such as motor magnetic losses, hydraulic circuit efficiency losses, hydraulic cylinder friction loss, etc., it is essential to determine fitting parameters and approximate representations based on experimental data obtained under varying equipment operating conditions.
During the quenching process, the actual output power of the hydraulic press is relatively low. It relies on the overflow mode of the hydraulic circuit to maintain holding pressure. Therefore, the power during the quenching and holding period can be represented by Equation (19):
E q u e n c h = t q u e n c h P q u e n c h t d t P q u e n c h ¯ × t q u e n c h
where Equench is the energy consumption of quenching. Pquench(t) represents the power consumption curve of the hydraulic press in the overflow mode, which is affected by the pressure demand. tquench is the time of the quenching stage.
In addition, the idle waiting time between each production cycle is referred to as the idle time of the stamping press. Its energy consumption can be determined by integrating the idle power of the servo-hydraulic press over the idle time. The specific expression is as follows in Equation (20):
E i d l e = t i d l e P L n t d t P Ln ¯ × t i d l e
where Eidle is the energy consumption of waiting in each process cycle, PLn(t) is the power consumption curve of the hydraulic press in the waiting time, P L n ¯ is the average value; tidle is the waiting time in each process cycle. The power during the hardening period can be expressed as a constant value in the steady working state.

3.5. Energy Consumption Analysis of the Cooling System

In actual production processes, to enhance SPM efficiency, the hardening time is compressed to 5–10 s. The cooling rate is increased to over 100 °C/s. This increased cooling rate places higher energy demand on the cooling system. Hence, a detailed calculation of the cooling system’s energy consumption is crucial.
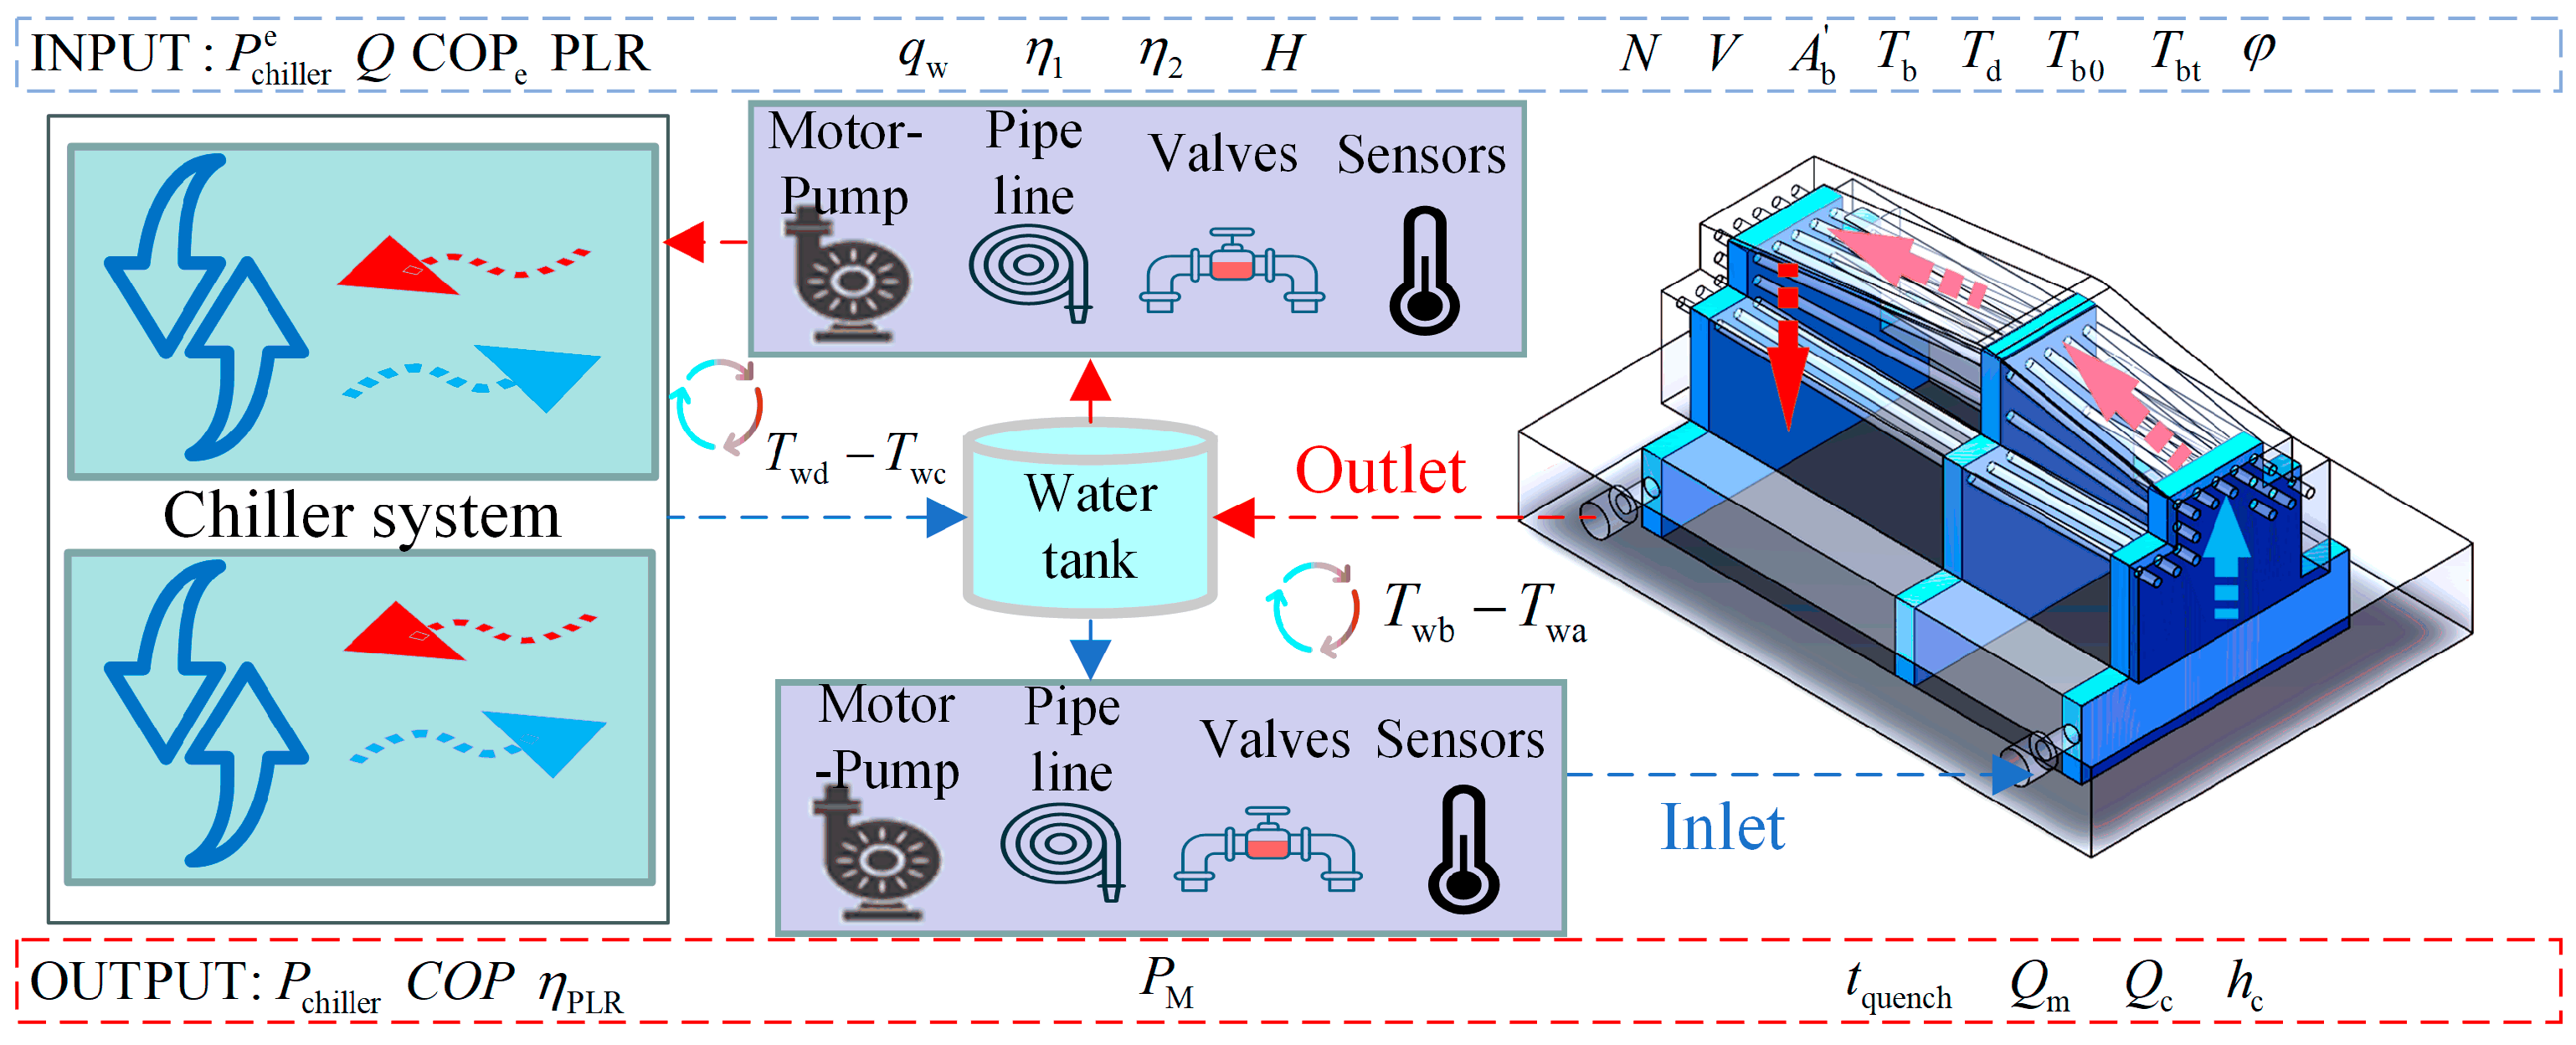
In the hardening process, the heat exchange between the blank and the tool follows the pattern shown in Figure 5. By the energy conservation law, the heat transferred from the blank to the tool, denoted as Qm, is subsequently carried away by convective heat exchange between the tool and the cooling water Qc. Furthermore, convective and radiative heat exchange between the tool and the surrounding air and heat conduction within the tool itself results in storing a certain amount of thermal energy Qe. These processes reach a dynamic Equation (21) [30]:
Q m + Q c + Q e = 0
The blank is considered in a closed environment during quenching, thus eliminating heat convection and radiation. As a result, Equation (22) displays the heat balance equation from the blank to the tool:
Q m = 60 N h c A b T b T d = 60 N V ρ C p Δ T Δ t
where the contact heat transfer coefficient (HTC) is a nonlinear function related to temperature and pressure can be determined using the inverse heat transfer method based on experimental results. In practical applications, an average value is used to represent it [31]. Solving differential Equation (22):
t q u e n c h = ρ C p V h c A b l n T b 0 T d T b t T d
where Tb0 is the initial temperature of the blank in the cooling stage, Tbt is the initial temperature of the blank in the transfer stage, A i s b is the cross-sectional area of the tool in contact with the blank, and Td is the temperature of the tool. During continuous operation, the tool temperature fluctuates periodically and is usually set to the average value according to the concentrated heat capacity method to calculate the theoretical time required for hardening.
As the values of other heat components are relatively small and do not involve cooling power consumption issues, only the heat transferred from the tool to the cooling water is considered.
Q e = 60 N V ρ φ T b 0 T b t C p T d T
where Tbt and Tb0 represent the temperature of the blank at the beginning and end of the hardening process, respectively, φ signifies the cooling efficiency influenced by parameters related to the cooling water and tool material, Qc transfer results in the cooling water temperature rising from Twa at the inlet to Twb at the outlet. Therefore, the required water flow rate qw is given by Equation (25):
q w = Q c / ρ w t w C w T w b T w a
where ρw is cooling medium density, Cw is the specific heat capacity of water, tw indicates the actual cooling cycle time, and the cooling system in the non-hardening stage maintains the water flow operation to cool the tool.
Equation (25) determines the required flow of cooling water, from which the power model of the pump motor can be obtained as follows in Equation (26):
P M = ρ w g H q w / η 1 η 2
where PM indicates the input power of the motor, η1 and η2 represent the efficiency of the pump and the efficiency of the motor, and H is the pump head. To compensate for losses along the pipeline and local losses while ensuring stable operation during short-term overloads, the H will exceed the demand value.
In addition to the external circulation for cooling the tool’s cooling water channels, the cooling system requires an internal circulation setup provided by the water chiller unit. This internal circulation facility is responsible for removing the heat from the cooling water, which has been heated due to the hardening process, and maintaining a supply of low-temperature water in the reservoir. In scaled-up production lines, it is common to establish centralized cooling water stations outside the entire facility. These water stations feature large water circulation cooling pipelines containing multiple sets of chiller unit equipment operating in parallel. Frequently encountered models include screw-type water-cooled chiller units or air-cooled units. The operation of a screw-type water-cooled chiller unit involves the following stages: (1) Evaporative Cooling Cycle, (2) Compression Process, (3) Condensation Process, and (4) Expansion Process.
The entire sequence forms a continuous cycle, with the refrigerant consistently moving through the evaporator, compressor, condenser, and expansion valve. This cyclic process enables the cooling water to continuously draw heat from the evaporator. As a result, the cooling water’s temperature is maintained at a lower level, ensuring a consistent supply of cooled air to the air conditioning system or other equipment requiring cooling.
However, the power consumption of the refrigeration units is indeed intricate. In response to changing production plans, factories generate varying load demands, controlling the utilization of different quantities of chiller units. The operational process of chiller units involves transferring and converting various forms of energy across multiple devices. This encompasses but is not limited to conversions from electrical energy to mechanical energy and the transfer of thermal energy under different mediums. It is necessary to consider the efficiency of equipment and energy transformations.
The standard for evaluating the energy efficiency level of refrigeration units is the Coefficient of Performance (COP) of the chiller [29]:
C O P = Q / P c h i l l e r = q t ρ w C w T w d T w c / P c h i l l e r
where Q is the chiller cooling output, q is the chilled water flow rate, TwdTwc is the difference in chilled water temperature, and Pchiller is the power input to the chiller. The chiller plant control (CPC) and condensing temperature control (CTC) technology are used to control and consider that it is a linear value affected by part load ratio (PLR) under stable operation.
Part load ratio (PLR) of the chiller:
P L R = Q / Q t o t a l
where Qtotal is the nominal cooling capacity, The power of the chiller Pchiller under stable operation is as follows Equation (29):
P c h i l l e r = P L R P c h i l l e r e / η P L R = Q P c h i l l e r e / η c h i l l e r Q t o t a l
where P c h i l l e r e is the rated power of the chiller, so the energy consumption model of the chillers is as follows Equation (30):
E c h i l l e r = j = 1 n P c h i l l e r , j t d t
Summaries Equations (26) and (30), the energy consumption of the cooling system can be expressed as Equation (31):
E c o o l i n g = i = 1 n P M , i t d t + j = 1 n P c h i l l e r , j t d t
where PM,i (t) is the power curve of motors and Pchiller,j (t) is the power curve of chillers.

4. Case Study

4.1. Calculation Results of Energy Consumption of Production Line

To validate the feasibility of the model, it should be implemented in a specific hot stamping production line to analyze its potential for energy savings and propose effective energy-saving solutions. Identifying critical parameters from the actual production line equipment is necessary to meet the energy consumption calculation requirements.
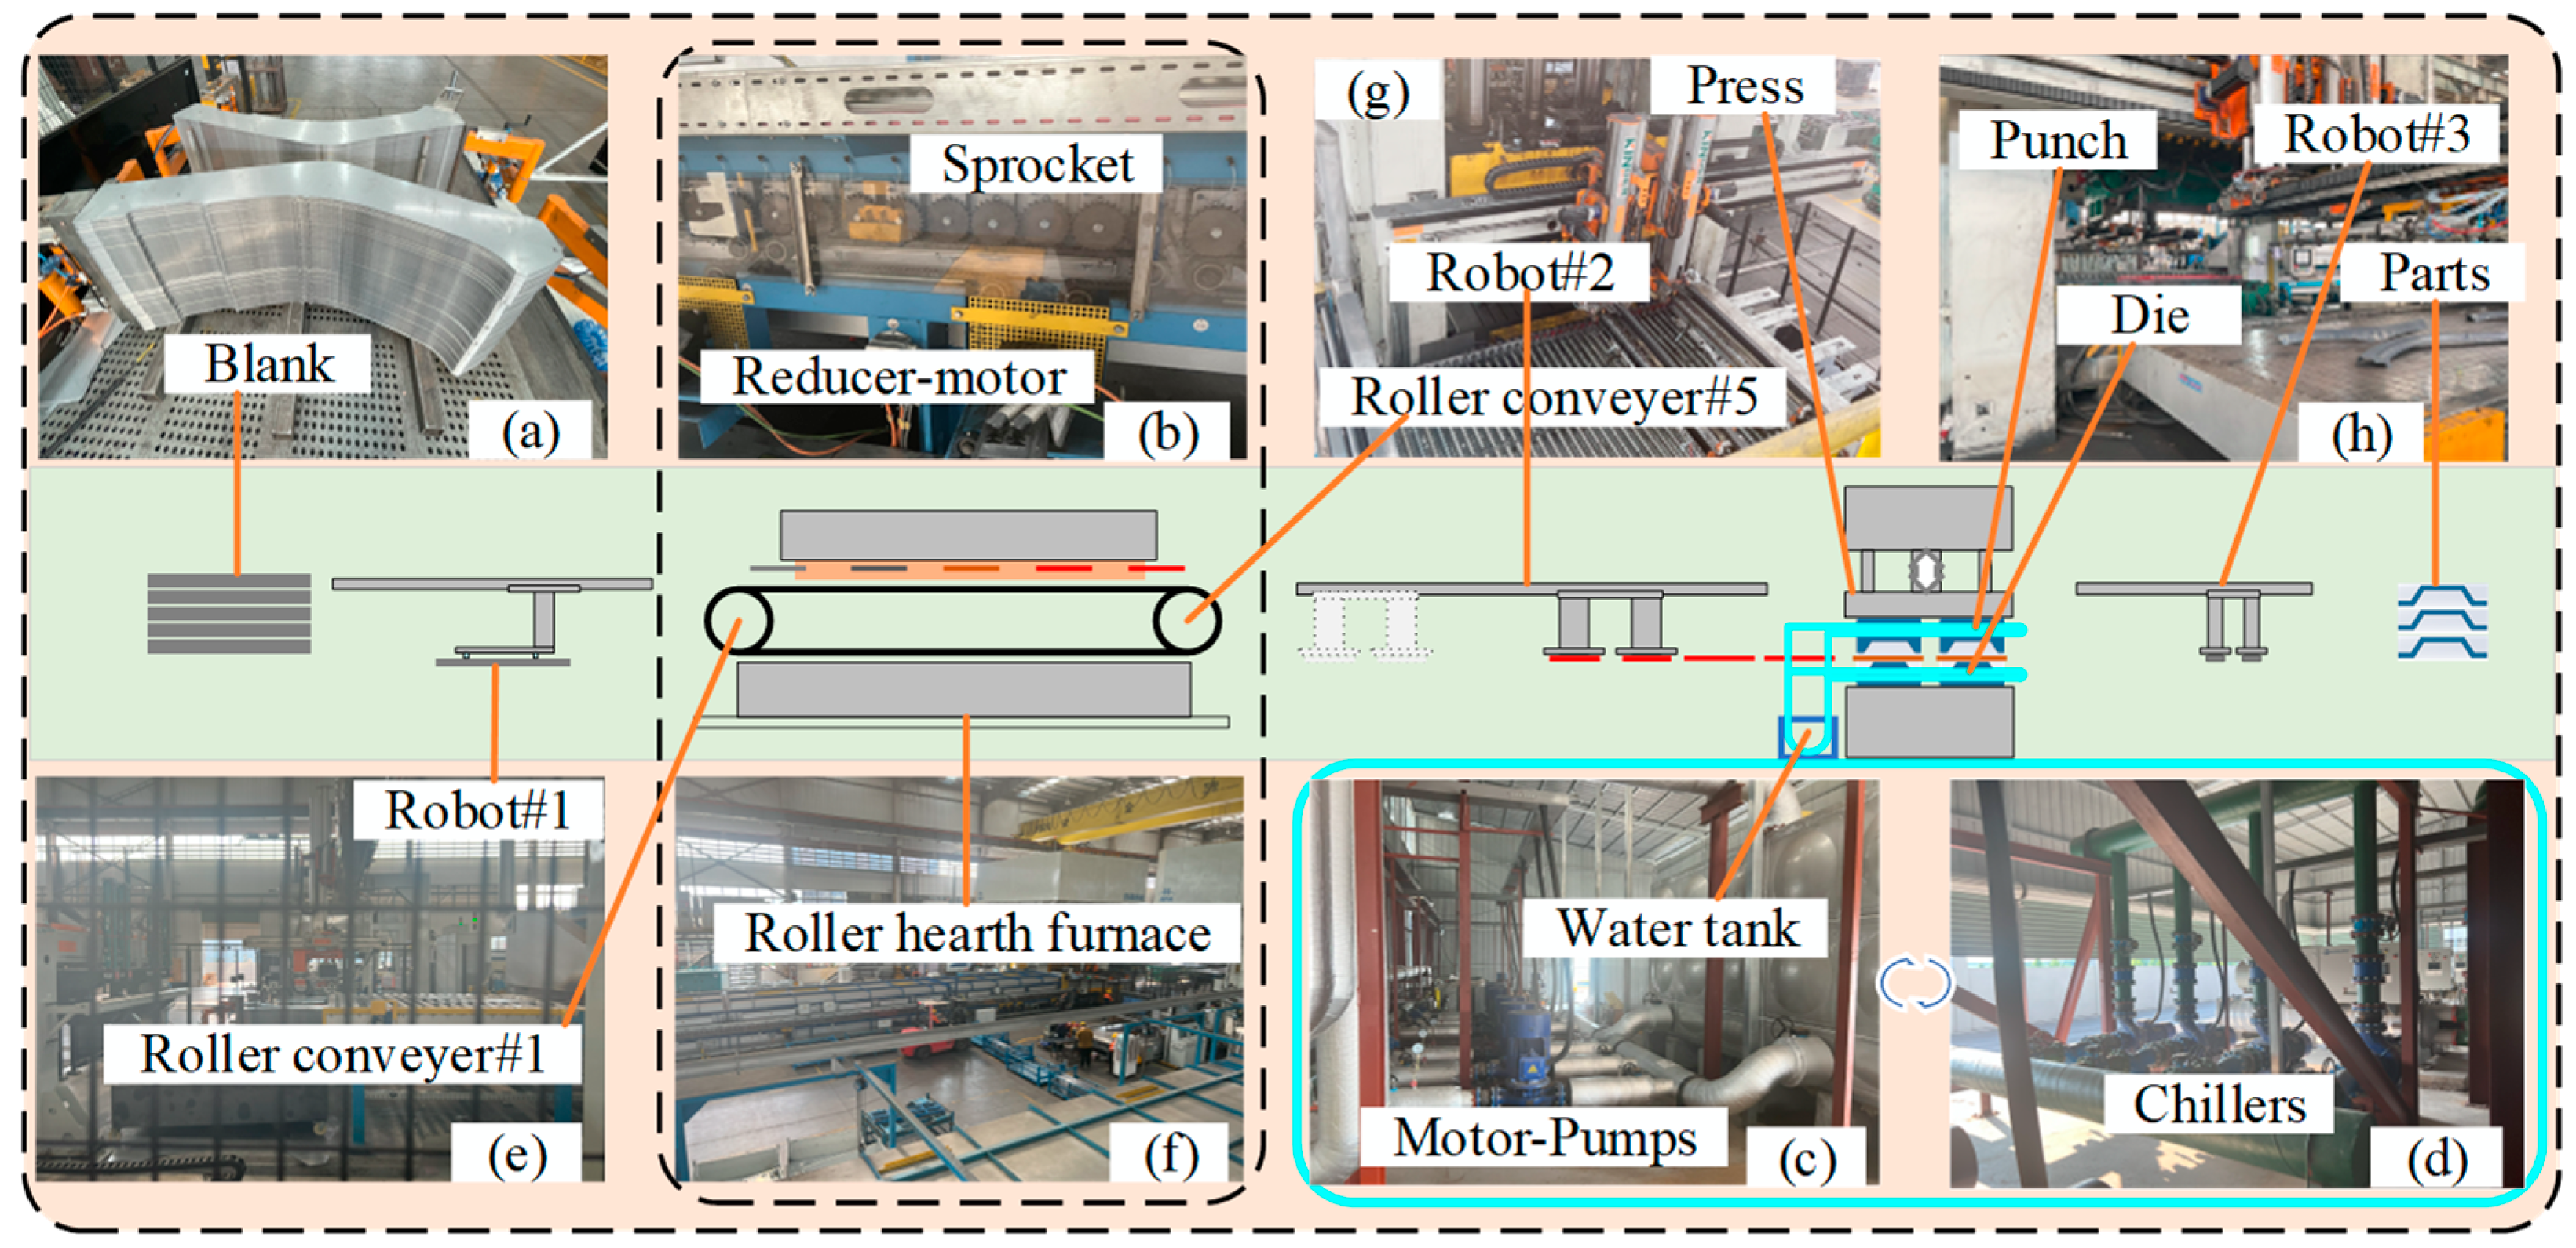
The overview of the validated production line is shown in Figure 6. The processing material is a specific model of automobile A-pillar reinforcement, with two symmetrical pieces stamped at once. The blank’s material, dimensions, and thermal properties are detailed in Table 1. The model’s calculation parameters are listed in Table 2.
The roller hearth furnace consists of five sets of roller conveyors. Conveyor #1 serves as the entrance conveyor, as shown in Figure 6e. Roller conveyor #5 is designed to rapidly remove the sheet (including centering clamps). The heating furnace includes Section 2, Section 3 and Section 4 for transporting the blank to designated heating zones using heat-resistant ceramic rollers. Eight motors control conveyors, and power is transmitted to each roller via a chain sprocket structure, as depicted in Figure 6b. The heating furnace is divided into 15 heating zones, the values of which are typically based on manufacturer-provided technical specifications, as shown in Table 3. The specific operational cycle times for all the mentioned equipment in HSPL can be found in Table 4.
Indeed, the roller heating furnace has a rated power of 1794 kW. This rating includes not only the rated power of the heaters but also the power consumption of other equipment, such as controllers, sensors, roller conveyor motors, and other associated devices. The aforementioned heat loss is predicated on the standard conditions within the laboratory setting. However, in practical production processes, it is influenced by seasonal variations and regional factors, with the convective heat transfer coefficient being significantly impacted by both ambient temperature and wind velocity.
The detailed production line parameters reported above are from the built-in and external sensor data of the production line equipment. There are certain errors in the coordination of various sensors, such as the temperature drift of the temperature sensor, the time deviation of the speed sensor and the torque sensor. These errors are partly from the sensor itself and partly from the sensor’s setting position. Therefore, it is inevitable that a certain cumulative error will be produced in the actual calculation.

4.2. Measurement Method and Results of Energy Consumption of Production Line

Simultaneously, power measurements will be obtained using a Three-Phase Multifunction Power Meter, an energy quality analysis instrument, to generate apparent power curve charts for each equipment on the production line during a specific timeframe. The power values will be calculated using the three-phase AC electrical parameters outlined below in Equation (32):
P t = c o s ϕ ( t ) i = 1 3 U i ( t ) I i ( t )
where the phase voltage is set at a constant value Ui=1,2,3 ≈ 230 V, the phase current is I(t), and the apparent power factor is cosϕ(t). Energy consumption calculation will be performed by integrating the collected data over time, as shown in the following Equation (33):
E = P t d t = i = 1 N P i Δ t
where the calculation of energy consumption involves integrating the collected numerical values over time, Δt represents the sampling interval time, and Pi (N = 1, 2, 3, …) represents the average power for different equipment within the time interval.
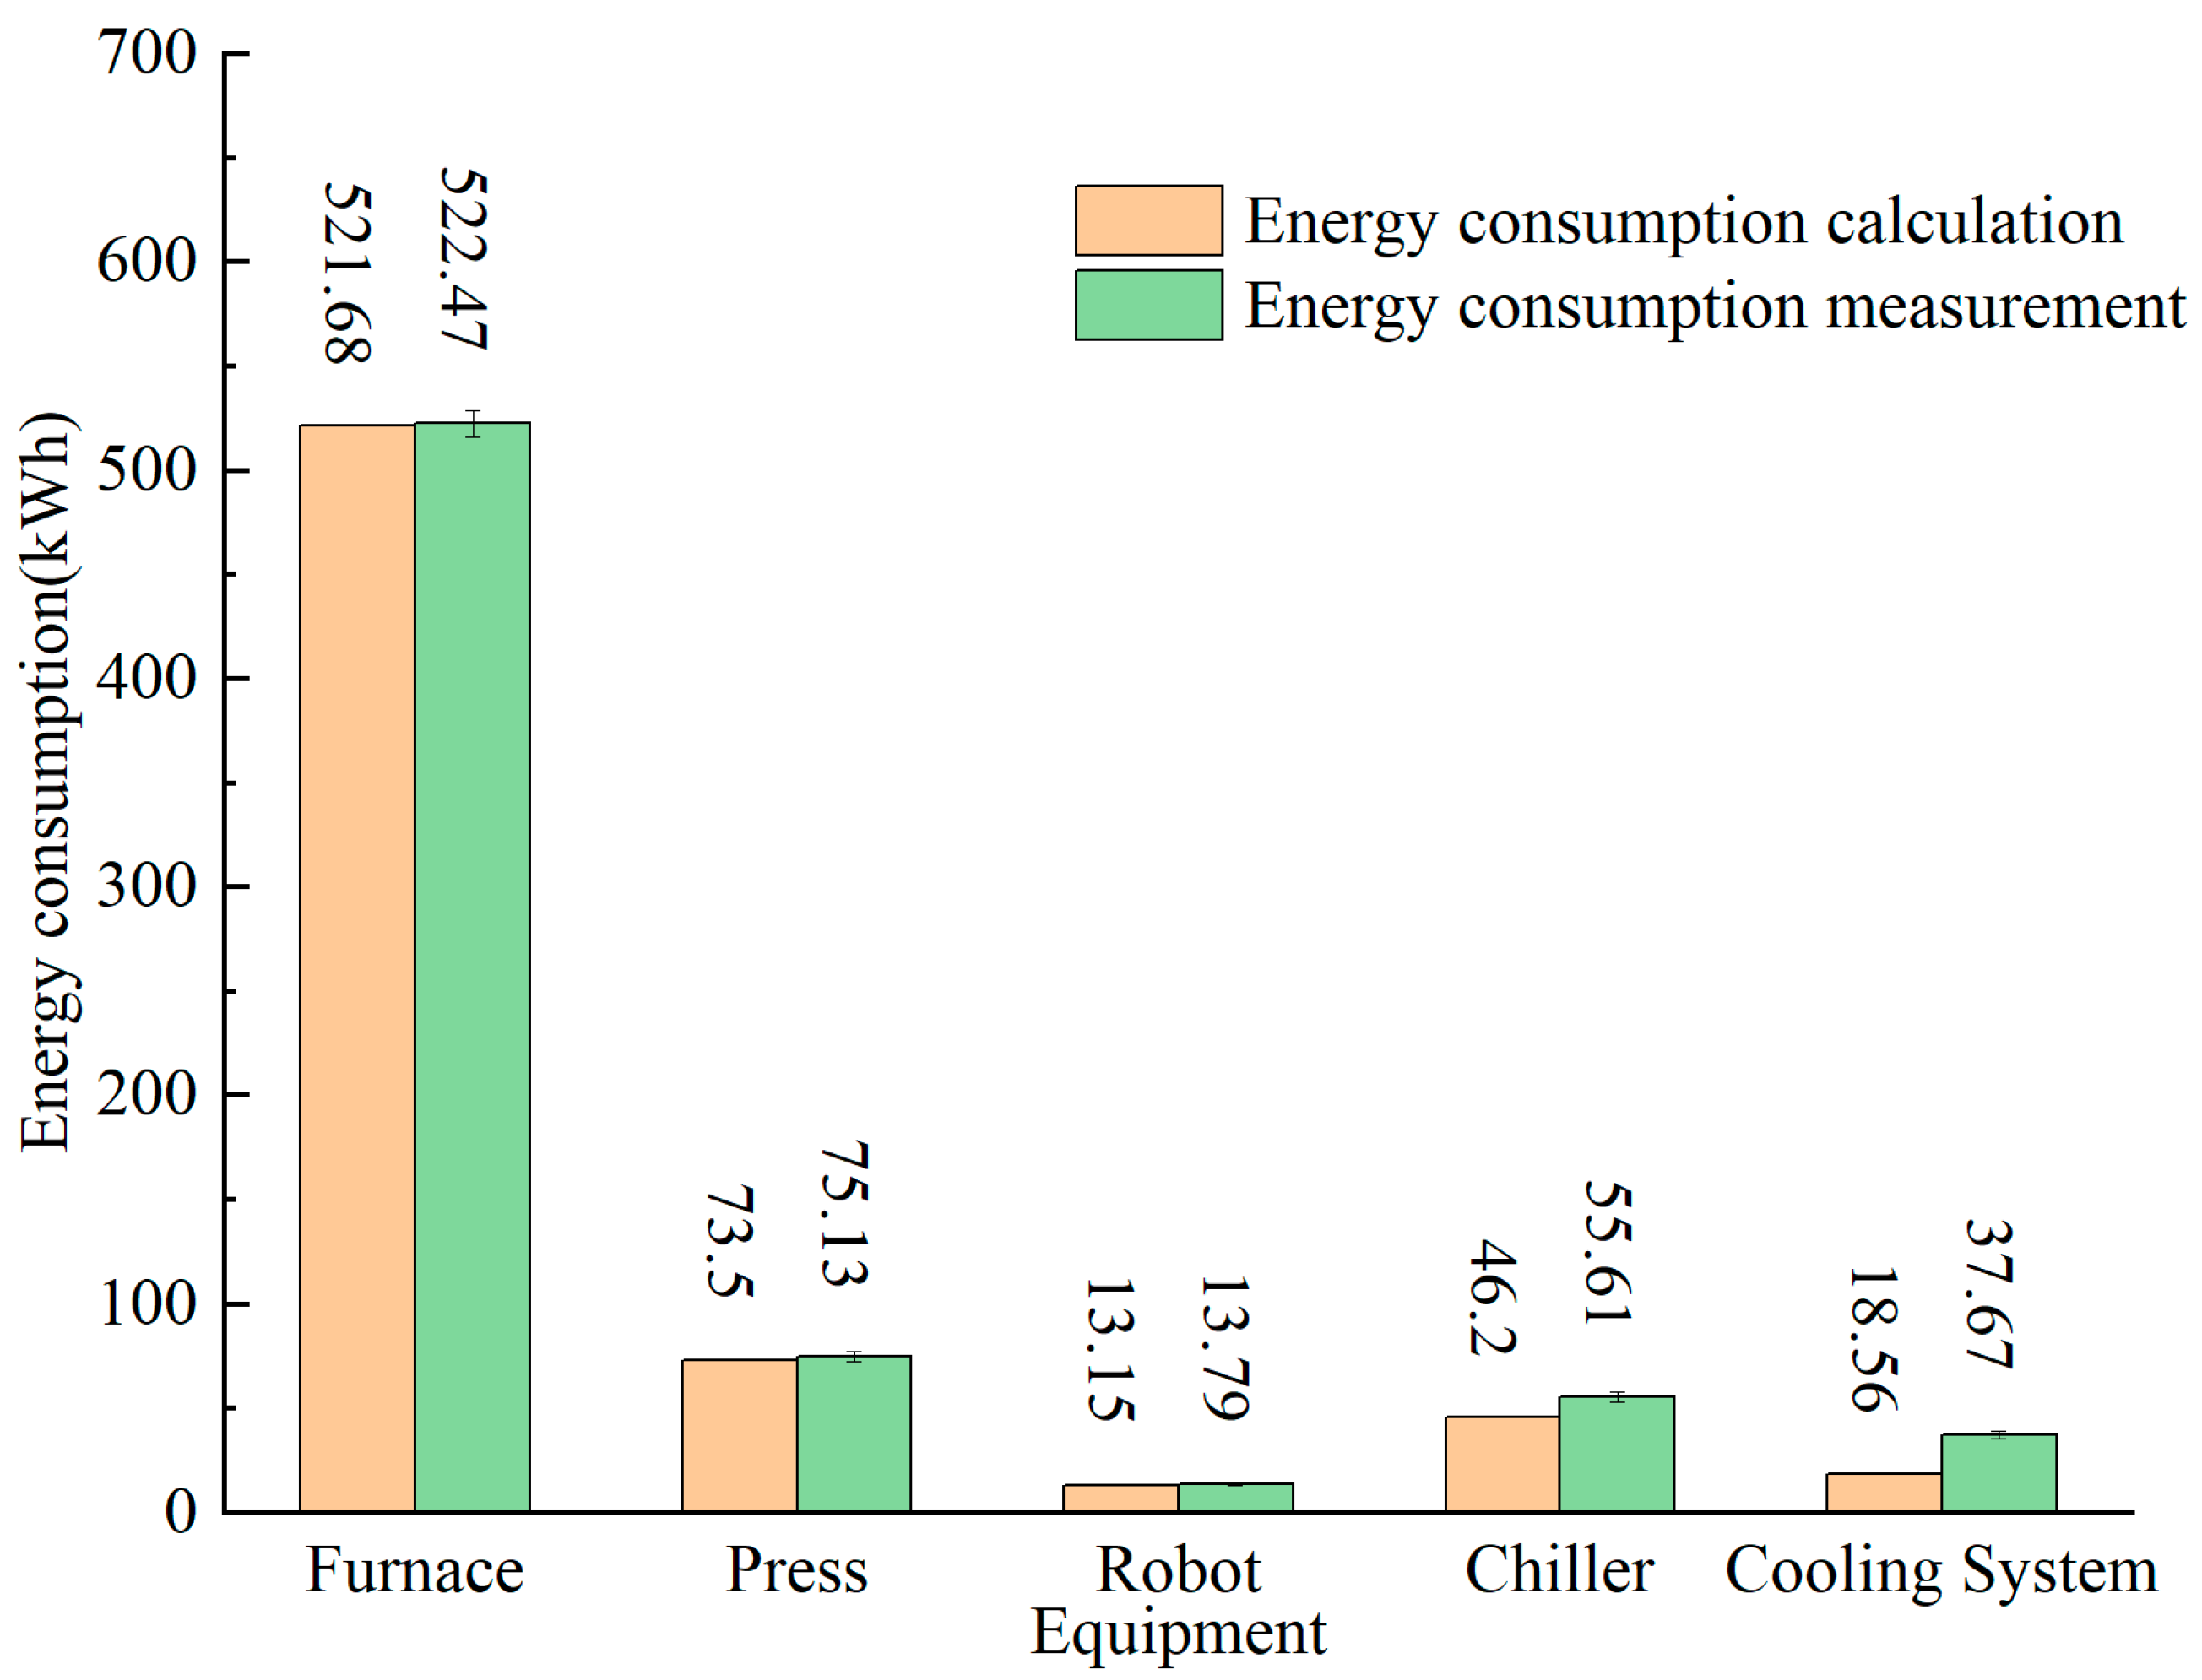
The average hourly energy consumption was calculated by utilizing the data obtained from the abovementioned device and incorporating specific production line design data. Subsequently, this result was compared with the energy consumption predicted by the model, as shown in Figure 7.
Based on the results presented in Figure 7, the left side represents the calculated values, and the right side represents the actual measured values. Substantial deviations, amounting to 16.9% and 50.7%, have been observed between the theoretical predictions and the empirical data in the cooling system and water chiller unit, respectively. Upon detailed examination, several factors contributed to these discrepancies: the factory houses four separate production lines that operate concurrently, each manufacturing different products. The roller hearth furnace necessitates these production lines to function in parallel, with the water cooling system located in a distinct external area of the factory. This arrangement results in an intricate pipeline configuration for the cooling system, incorporating multiple parallel and series pipelines that operate simultaneously. The pressure, flow rate, and other parameters of each branch pipeline are regulated by parallel and series pumps and valves. The water pump’s head exceeds 120 m, more than tripling the theoretical parameters. It is powered by a 37 kW motor, leading to considerable extension loss, local loss, and ineffective water circulation due to valve control. Four screw-type water chiller units operate in parallel, each cycling every 15 s. The variability in the materials and quality of products across the four production lines necessitates a heat calculation that is 4.5 times the average, resulting in certain inaccuracies. Other minor discrepancies in the heating furnace data can be attributed to heat losses and controller errors. The heat loss of the furnace body is affected by the fluctuation of the temperature in the furnace and the life of the insulation material. The temperature in the stove fluctuates within the set temperature range, and the theoretical calculation is based on the mean value. Due to the complexity of the energy transfer form of the hydraulic press, there is a delay between the speed sensor and the pressure sensor, and there is still a cumulative error in the calculation with the corrected data. The calculation error of the energy consumption of the robot equipment comes from the underestimation of the heat dissipation of the motors. To analyze each equipment’s energy consumption characteristics and parameter sensitivity, continue to dig deep into the production line data, which will be detailed in the next section.

4.3. Power Profiles and Analysis of Each Piece of HSPL

4.3.1. Power Analysis of the Roller Hearth Furnace

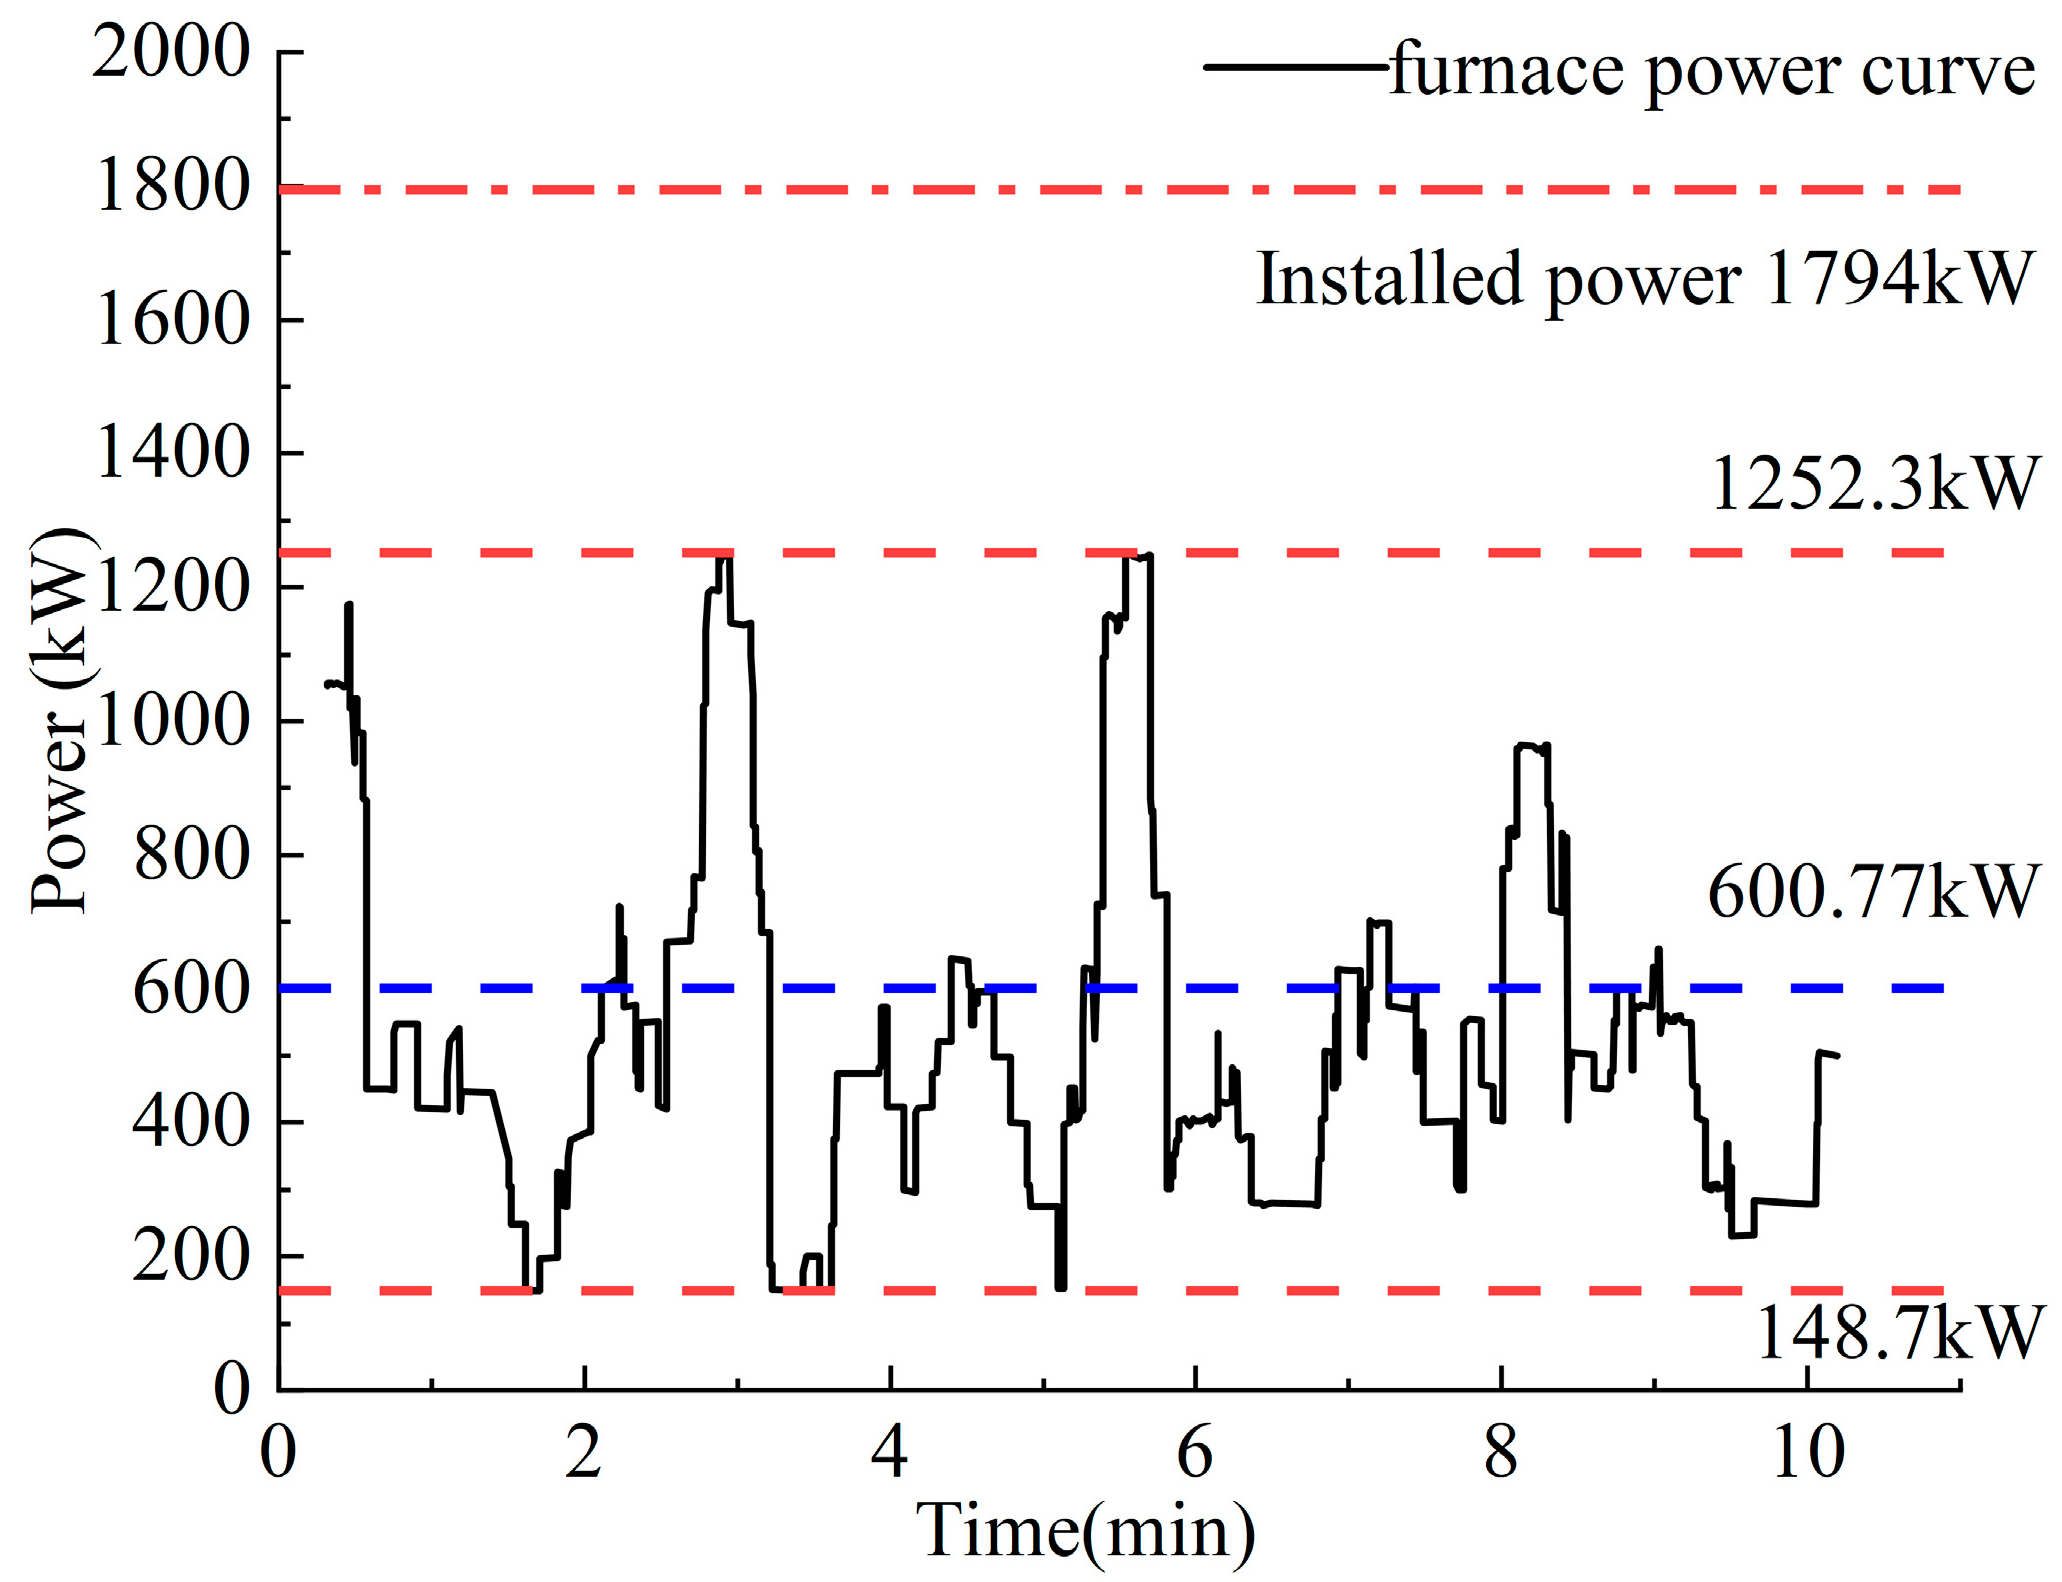
The power curve for the heating furnace is shown in Figure 8, with a peak power of approximately 1252.3 kW. The blank passes through each heating zone, absorbing heat and reaching the setpoint temperature for that zone. As a result, when the furnace’s internal temperature drops below the lower temperature limit, the heating elements are activated. The blank is periodically introduced into the furnace, causing the power curve to exhibit periodic fluctuations. The pronounced magnitude of these fluctuations can be attributed to the varying activation of heating elements throughout each cycle. The power fluctuation is intricately linked to the quality and thickness of the sheet material; the greater the mass, the higher the heat energy required for heating. Similarly, an increase in thickness necessitates extended periods for heating and insulation. However, examining the heating furnace’s rated power, 1794 kW, reveals a low utilization rate. A significant number of heat pipes remain inactive, a consequence of the spatial underutilization due to the lightweight nature of the produced parts and the processing time intervals. Consequently, optimizing the process in this regard is pivotal for enhancing the energy efficiency of the heating furnace and, by extension, the overall hot-forming production line. The potential for improvement lies in optimizing the heating elements’ activation strategy and synchronizing with the production cycle to minimize idle periods and maximize the use of available power.

4.3.2. Power Analysis of the Automatic Handling Equipment

Figure 9 compares several parameters derived from the z-axis rotating servo motor within Robot#1 under varying operational conditions. Precisely, Figure 9a–d corresponds to the comparative diagrams for speed, acceleration, input current, and torque, respectively. The operational conditions encapsulated in these comparisons include:
(1)
Rotation of 180° on the z-axis at 30 rpm under a 30 kg load.
(2)
Rotation of 180° on the Z-axis at 30 rpm under a 50 kg load.
(3)
Rotation of 180° on the Z-axis at 50 rpm under a 30 kg load.
(4)
Rotation of 180° on the Z-axis at 30 rpm under a 30 kg load, with simultaneous operations on the X and Y axes.
The fourth scenario is particularly representative of real-world operations due to the continuous nature of the robotic arm’s movements, where all motor rotation angles are computed concurrently post-path planning. By comparing conditions one and two, it can be analyzed that the load rate has a negligible impact on the robotic arm motor’s speed and acceleration (stability). The starting and braking torque are more significant under high load conditions, but the uniform speed segment is unaffected. Comparing conditions one and three, it can be analyzed that high speed significantly impacts motor energy consumption. The acceleration during acceleration is the same as the constant value at low speed, so it takes longer to accelerate to higher speeds, which further shortens the uniform speed time and total running time. The torque is high during acceleration and deceleration, which can also be seen from the current feedback (Figure 9b). The motor’s torque can be calculated from the current curve and the motor’s torque constant (Nm/A). In addition, by comparing conditions one, two, and four, it can be seen that in the actual operation process, motors in multiple directions of the robotic arm run simultaneously, causing the center of gravity of the load to change and changing the moment of inertia, thus changing the motor’s torque. It is more evident that the uniform speed stage is no longer a constant value, so the calculation part of motor energy consumption needs to correct this point further. Summarizing the above comparison results, the conclusion can be drawn: the energy consumption of the robotic arm is related to the operating conditions, among which the sensitivity of the load rate is low. This is because the production line’s design initially set 2–3 times redundancy for the load of the robotic arm, which undoubtedly increased unnecessary motor energy consumption. Secondly, the operating speed has a more direct impact on energy consumption. The motor limits the starting torque, acceleration limit, etc., while ensuring process demand time and stable operation. High-speed operation naturally brings high energy consumption but can also improve the efficiency of the production line, so the key is how to balance efficiency and stability. At the same time, from an overall perspective, the energy consumption of the entire robotic arm system accounts for a lower level in the production line, and the weight of stable operation is higher than that of energy-saving optimization.

4.3.3. Power Analysis of the Servo-Hydraulic Press

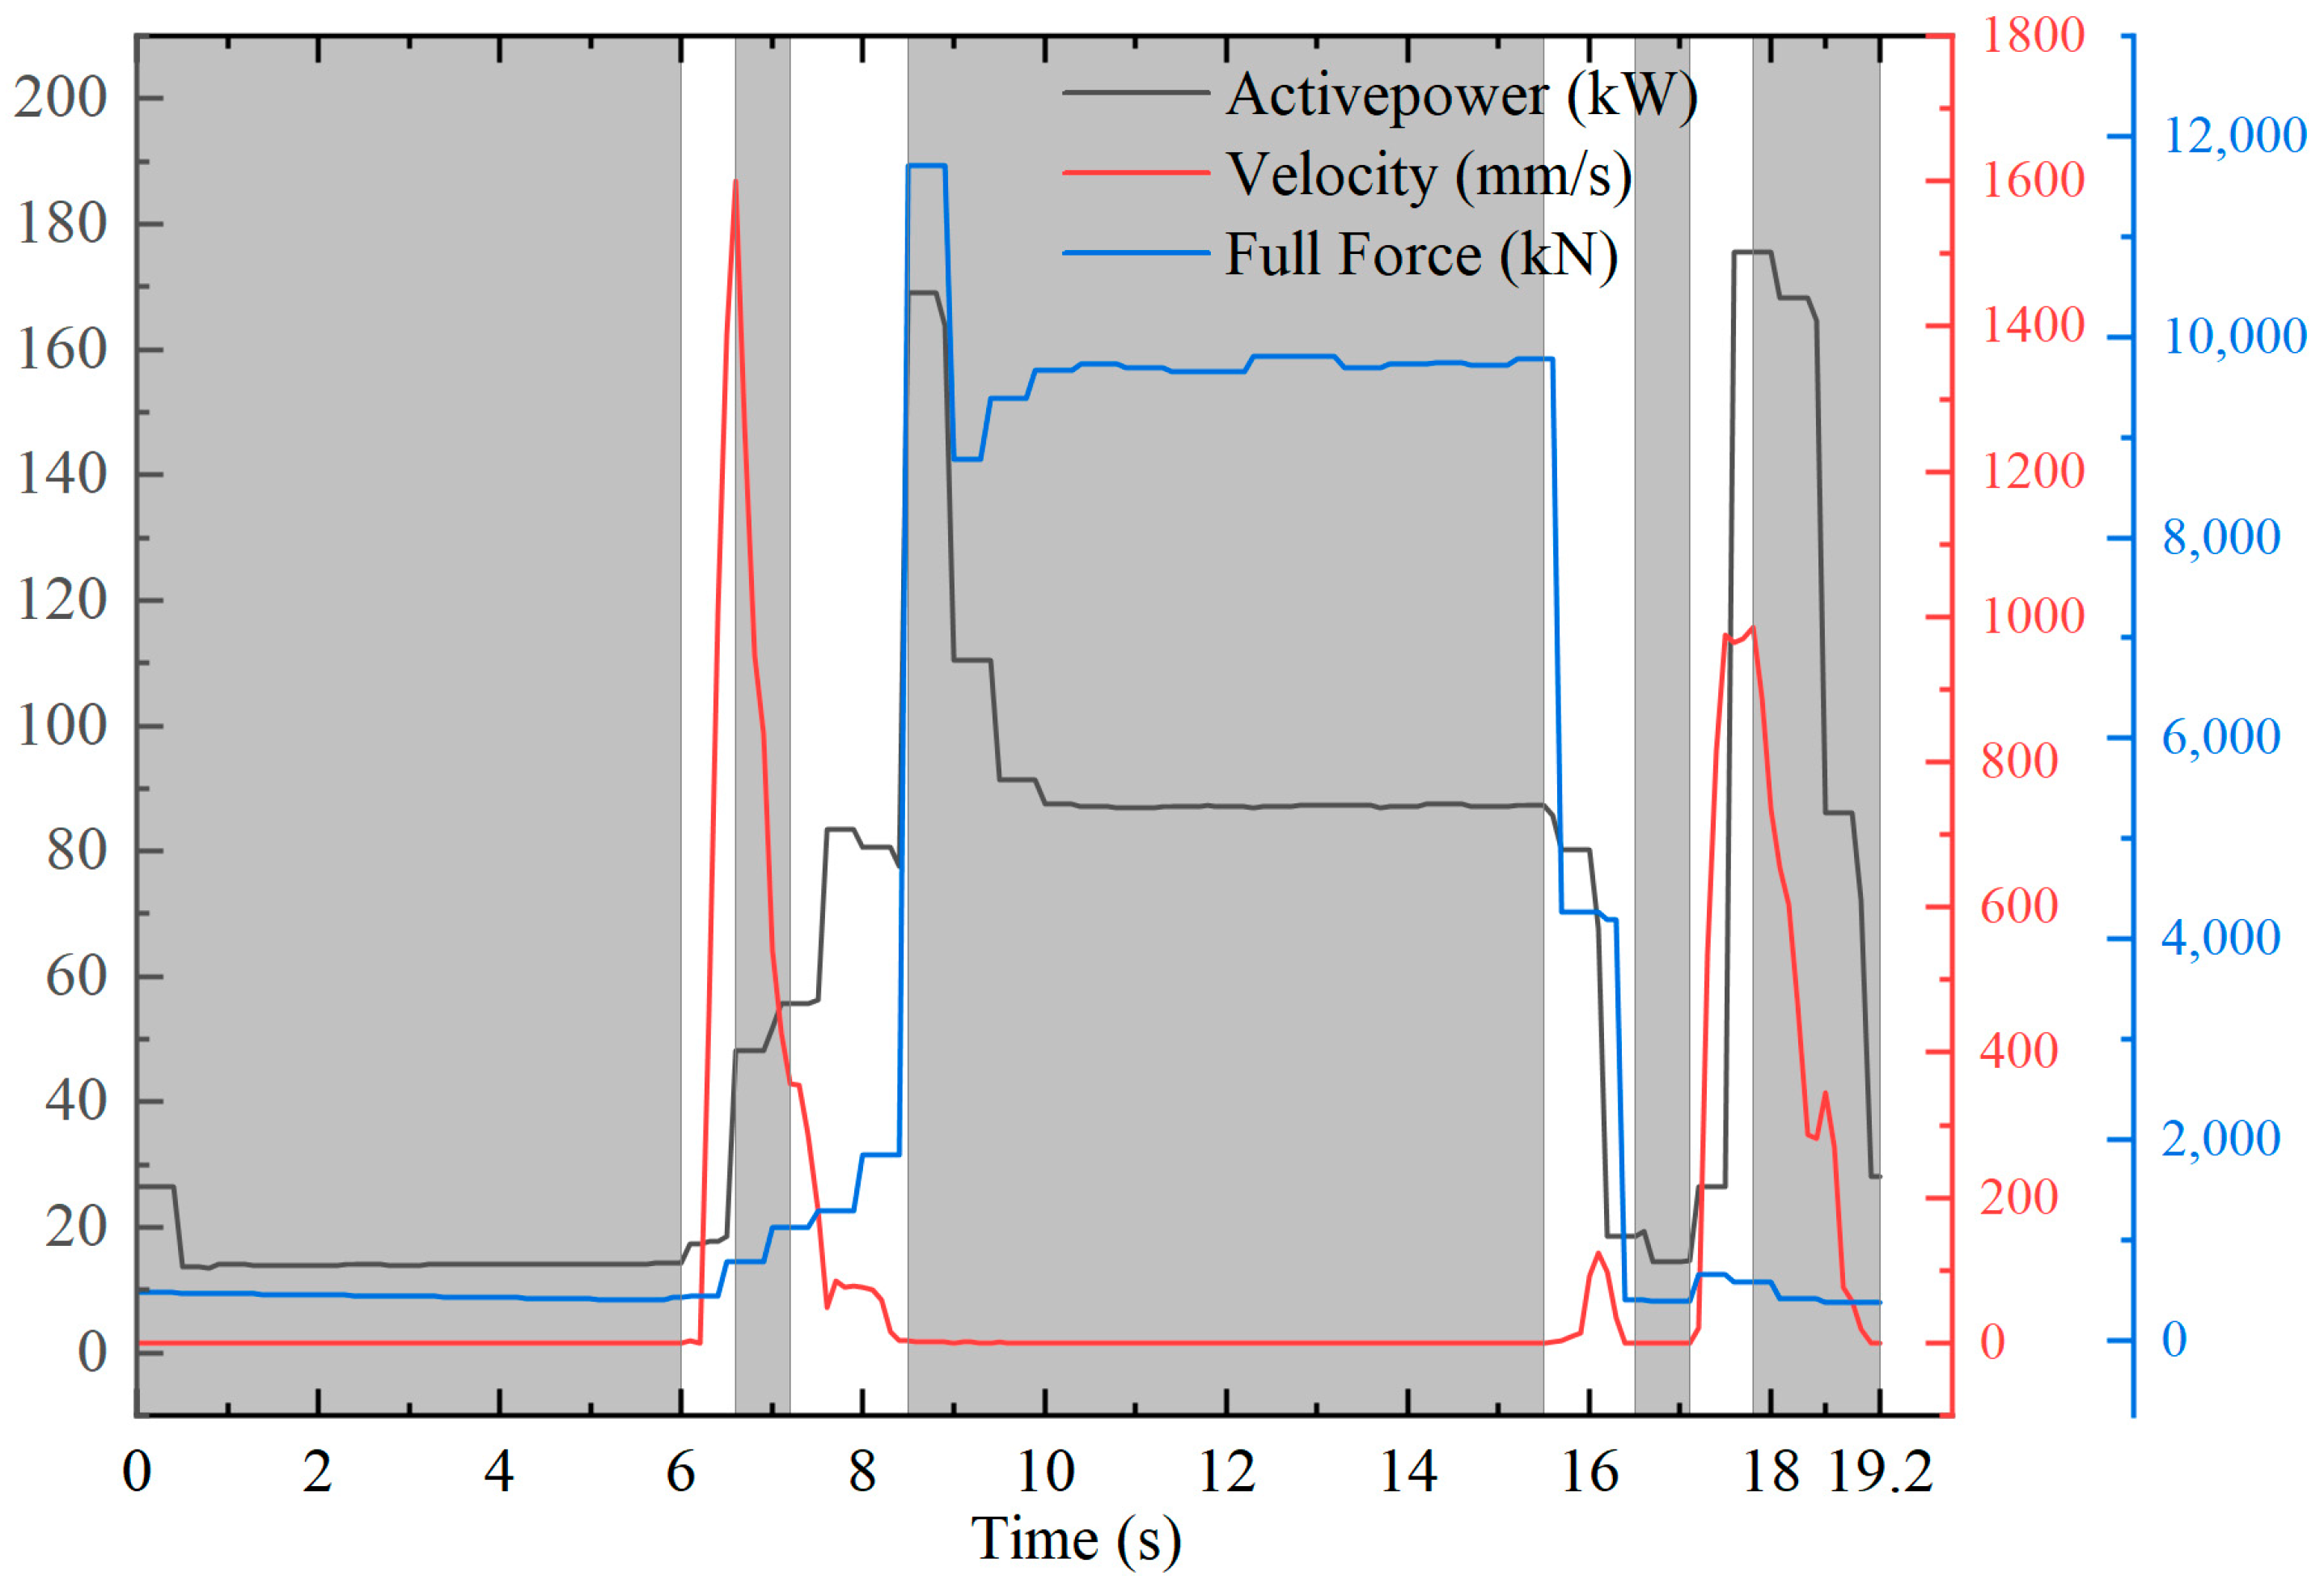
Figure 10 illustrates the actual velocity (red), output force (blue), and power curves (black) within a single cycle of hot stamping in the servo-hydraulic press. The alternating grey and white segments indicate different operating stages. Data analysis concludes that the average power usage in the WT and P(h) stages is reasonable. Despite the peak phenomenon caused by the instantaneous rise of pressure at the beginning of the P(h) stage, its short duration means its influence on the average value can be disregarded. Throughout the working time of the hydraulic press (including the return time), the conversion of potential energy, kinetic energy, and internal energy occurs frequently. Therefore, accurately determining the energy consumption of the hydraulic press requires an analysis based on expert experience and actual data, presenting challenges for accurate calculation.

4.3.4. Power Analysis of the Cooling System

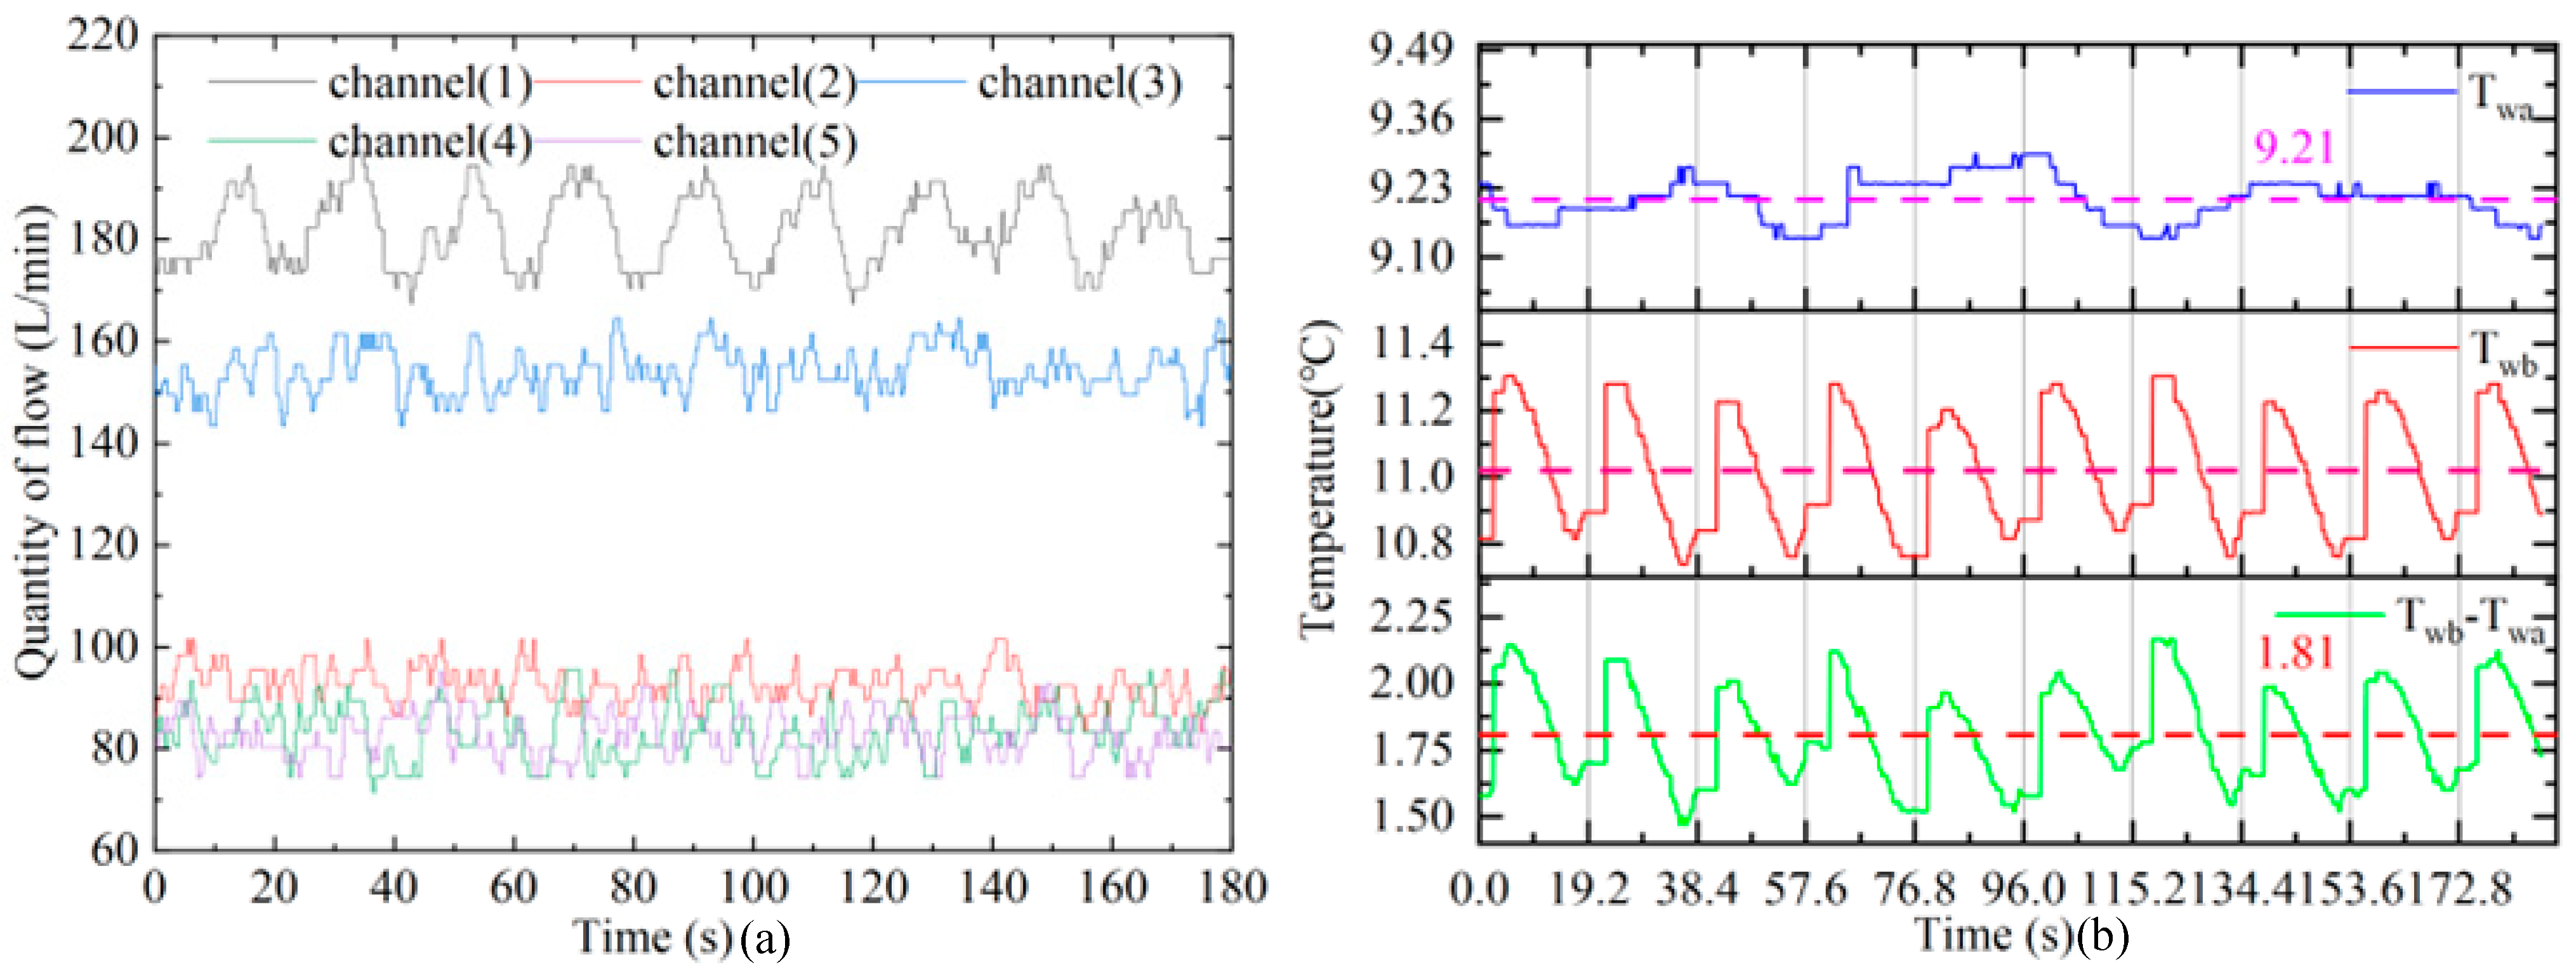
The number of flow curves of the channels within the mold in the cooling system is shown in Figure 11a, where it can be seen that the flow rates of each channel are maintained near a constant value and do not exhibit periodic fluctuations, so the tw = 1 h. The Twa parameter in Figure 11b shows that the inlet temperature of the mold channel is constant, proving that the chiller system is operating normally. The Twb parameter shows that the outlet temperature is affected by periodic fluctuations, with a marked increase in temperature during quenching. Therefore, the cooling system energy consumption can be calculated, and specific parameters are listed in Table 5.

4.4. Perspectives for the Reduction of Energy Consumption

With the parameters extracted from the information provided and additional details from the equipment manuals for the production line, we calculated the energy consumption components and created the Sankey diagram as follows in Figure 12. The model calculates that the HSPL consumes a total of 673.09 kWh of electric energy per hour. The average energy consumption of the HSPL in the case study is calculated as 0.597 kWh/kg, and the actual measurement is 0.625 kWh/kg. To power the furnace, 77.51% is used, and 73.93% is used to heat the blank at an average electric energy quality ratio of 0.342 kWh/kg. Additionally, 24.29% of the electric energy is dissipated as heat loss. The second largest consumer is the stamping machine, accounting for 10.92%, with stamping and holding each representing approximately half (47.17% and 46.39% respectively), while standby consumption makes up the remainder. Subsequently, chiller unit electricity consumption accounts for 6.86%. Analyzing specific equipment’s energy consumption within this unit proves challenging due to complex energy conversion and intermediate parameters involved; however, based on historical data and proportions, fixed percentages have been assigned—with compressors constituting over 75% of total consumption as shown in the figure—while other components and auxiliary equipment account for the rest. Thanks to advanced servo motors and control technology development, automation equipment exhibits the lowest energy consumption ratio. While it is evident from the above figures how energy distribution occurs across different processes, further research and analysis are required to understand the interrelationships between various forms of energy usage.
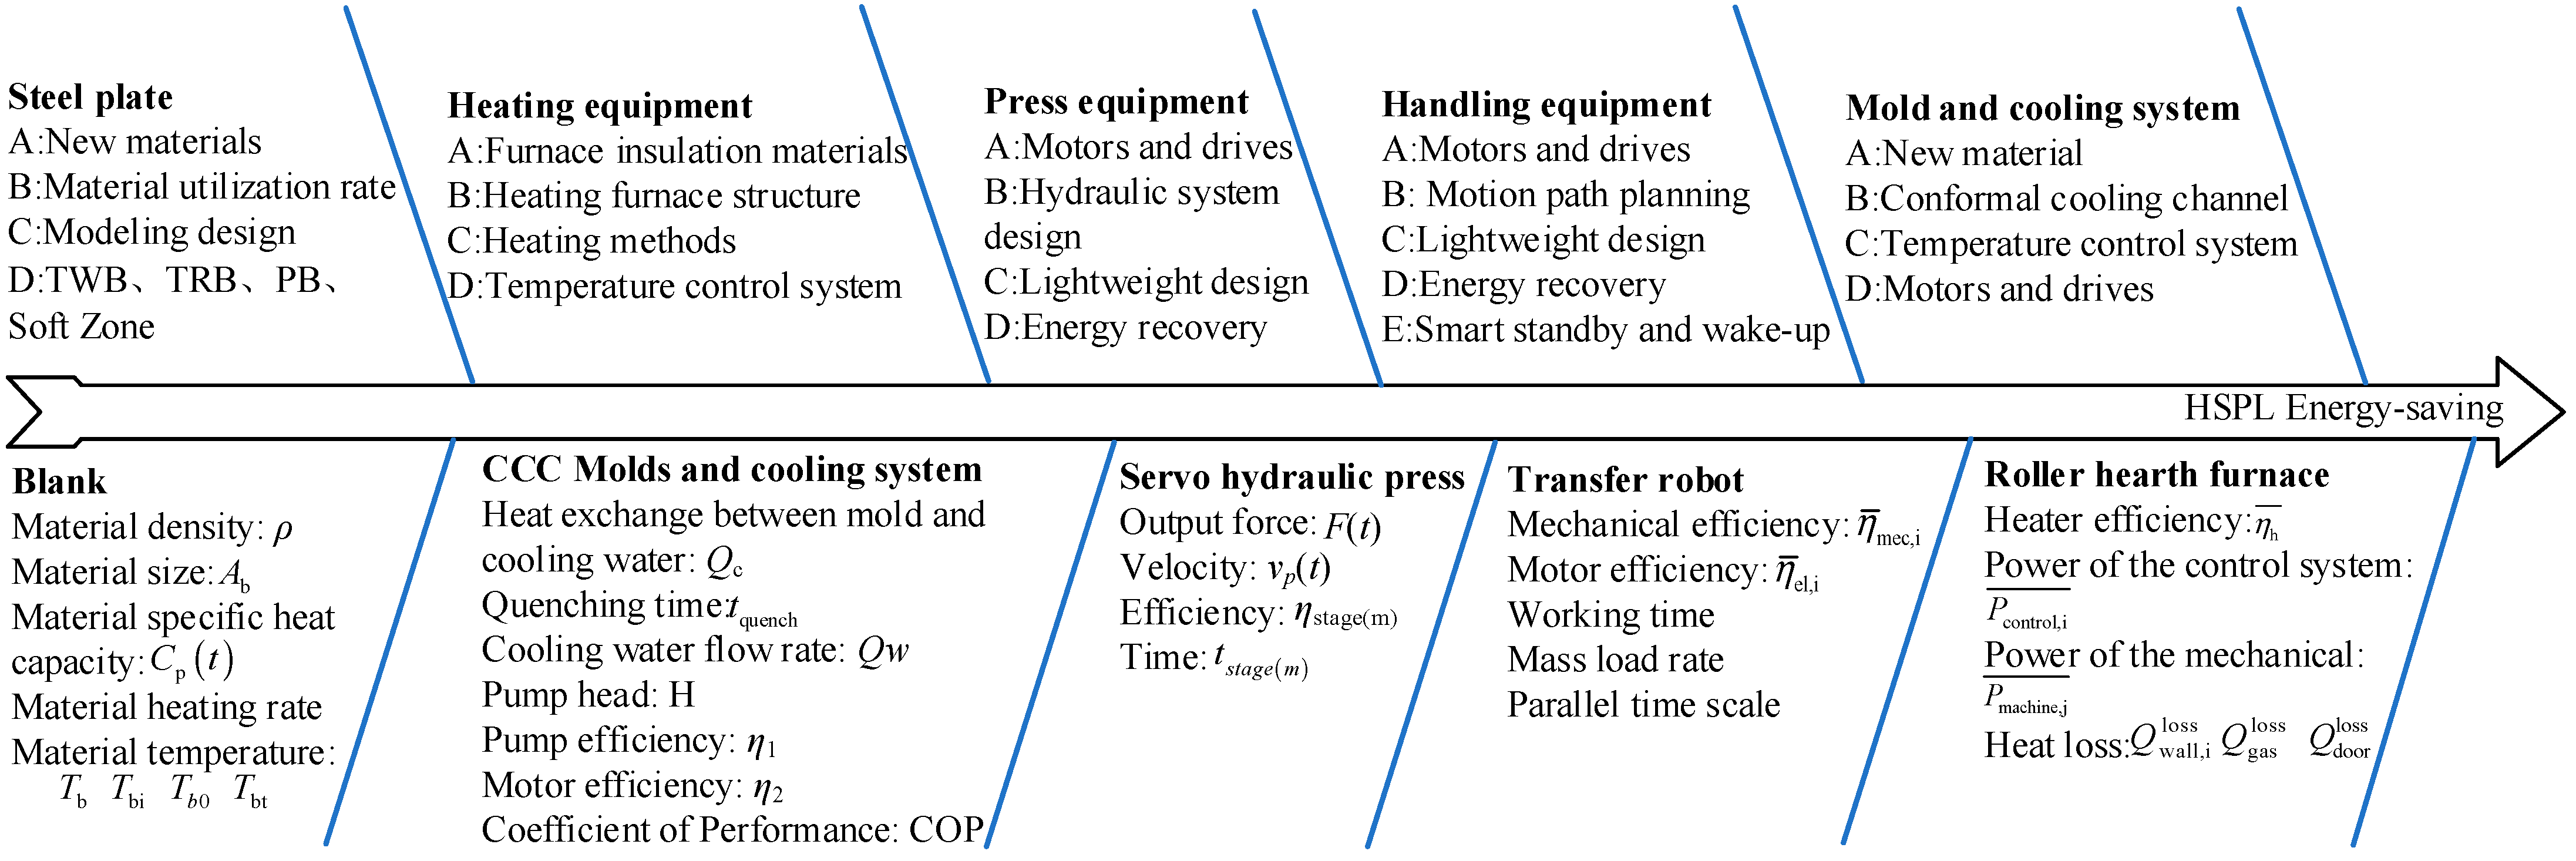
According to the preceding discussion, the figure illustrates the specific technical route for optimizing energy efficiency in HSPL. The overarching energy-saving approach should focus on enhancing the SPM of the press, which essentially means boosting the production line’s efficiency, reducing each machine’s idle time to enhance productivity and curtail unnecessary energy expenditure. This methodology primarily involves the following strategies, as shown in Figure 13.
The top part of the fishbone diagram shows different energy-saving concepts related to equipment arranged based on their importance and feasibility. The main focus is on choosing materials, emphasizing developing new materials that are stronger, tougher, and have a lower critical temperature for certain processes. The design optimization aims to improve stamped materials’ quality by reducing cracking and wrinkling issues. Advancements in various processes, including using plates with varying thicknesses, welding plates, and applying patch plates, are increasing the demands on the equipment’s capabilities. Heating equipment is especially critical, and heating furnaces are moving towards customized heating to meet the requirements of different processes, requiring precise temperature control systems and exploring new heating methods. Despite the benefits of roller hearth furnaces, ongoing research and development are necessary to improve insulation and rotating roller materials that are resistant to heat fatigue. In addition, the renewal of heating methods is also gradually carried out, such as using biofuels and ammonia fuel to reduce carbon emissions [32].
The stamping equipment and mold cooling system are crucial aspects of the hot stamping process. Upgrading the stamping equipment involves using high-power servo motors and controllers, optimizing hydraulic systems for energy efficiency, designing lightweight sliders, and implementing energy recovery technologies. The mold’s precision directly influences the final product’s quality, while factors such as oxide scale dislodgement and heat accumulation significantly impact the mold’s lifespan. Future mold development will focus on materials with improved thermal conductivity and heat fatigue resistance, as well as precise mold temperature control and conformal cooling channels. Additionally, energy optimization of handling equipment, which has the lowest energy consumption among all hot forming equipment, relies on small servo motors and advanced motion control. The future development direction in this area will involve trajectory planning, energy recovery, and lightweight design.
The lower section of the fishbone diagram illustrates the energy-saving strategies employed in the hot stamping process. The production line planning begins once the material grade and dimensions are determined. Material parameters such as density, surface area, specific heat capacity, maximum allowable heating rate, phase transition temperature, etc., are crucial in determining the overall process time. Energy-saving strategies for process parameters consistently revolve around line efficiency (SPM) and energy utilization efficiency. Ultimately, all parameters converge on time, efficiency, and power. Thus, based on the models for competition time of the last process and total energy consumption in a working cycle, the multi-objective optimization problem for the minimum makespan and energy consumption can be expressed as:
m i n E t o t a l m i n t c y c l e   E t o t a l = E h a n d i n g + E h e a d i n g + E p r e s s + E f o r m i n g + E c o o l i n g E h a n d i n g η ¯ m e c , i , η ¯ e l , i E h e a d i n g η h ¯ , P c o n t r o l , i ¯ , P m a c h i n e , j ¯ , Q l o s s E f o r m i n g F x , ν p t , η s t a g e m ¯ E c o o l i n g Q m , φ , q w , H , P M , η 1 , η 2 , C O P , η P L R , η c h i l l e r , P c h i l l e r
The optimization problem is not a simple convex function problem but a complex multi-parameter local optimal solution problem. Despite prior analysis and calculations, achieving a comprehensive quantitative analysis between energy consumption data and process parameters remains challenging. The primary reason is the limited digitization level of the production line, which results in inadequate matching and connection between the data monitored by sensors, thereby impeding sensitive closed-loop analysis. Furthermore, a shortage of effective analysis methods for handling large volumes of data, such as Design of Experiments (DOE), exists.

5. Conclusions and Future Works

This paper uses energy consumption modeling and quantitative analysis of HSPL, including actual production energy consumption tests and calculations for a group of automobile A-pillar production lines. The established energy consumption model and the exact measurement results confirm each other; the error is within the acceptable range, except the chiller system needs additional improvement measures. Summarize the above chapters and draw the following conclusions:
(1)
The analysis reveals that the roller hearth furnace is the primary contributor to the total energy consumption. The energy loss is concentrated in the heat loss, especially the large area of the furnace wall and the usually open furnace door. In actual production, the space utilization rate of the furnace is meager, but the heat loss is only positively related to the temperature setting of the region.
(2)
The deformation energy of the blank is supplied by the servo hydraulic press, consuming an average of 0.033 kWh/kg. However, significant energy wastage occurs during the hardening time. Compared with the locking pressure holding of the mechanical press, the overflow pressure holding of the hydraulic press is not economical.
(3)
Energy efficiency for automation equipment relies on modern servo control systems, superior path control methods, lightweight structural design, and optimized cycle scheduling.
(4)
The energy consumption calculation error of the cooling system is significant, mainly due to the wrong estimation and use of the head parameters of the pump. The extensive use of modern intelligent water pump equipment makes it effective in energy saving, and the monitoring and management of energy consumption is also in urgent need of improvement.
The model has some limitations that need to be addressed. The hot-forming process does not currently take into account the trimming process, which is essential. The equipment cost for the trimming process is high, and energy consumption needs further refinement. However, there have been recent advancements in the trimming integrated die, which incorporates the trimming process into the hot stamping process. This has the potential to change the overall energy consumption calculation of the hot forming process, leading to improved efficiency of the overall production line. Additionally, efficiency values for various stages of the servo-hydraulic press and heat loss values for the heating furnace are based on fixed values derived from manufacturer-provided data or measured power curve data without considering the impact of equipment lifespan on losses, leading to reduced model accuracy. Future research should focus on investigating these issues and utilize equipment measurements, pattern recognition, and data processing to enhance modeling precision. The emergence of digital twin technology will make energy consumption monitoring an essential area of research.

Author Contributions

Methodology, Q.L.; Validation, Q.Z.; Investigation, L.L.; Resources, L.L.; Writing—original draft, Q.Z.; Writing—review & editing, C.Y.; Supervision, Q.L. and Y.X.; Project administration, Q.L.; Funding acquisition, J.Y. All authors have read and agreed to the published version of the manuscript.

Funding

The work is financially supported by the Funds for the Anhui Science and Technology Project, grant number [202423i08050024].

Data Availability Statement

The original contributions presented in the study are included in the article, further inquiries can be directed to the corresponding author.

Conflicts of Interest

Q.L., Q.Z., C.Y. and J.W. were employed by Hefei Metal Forming Intelligent Manufacturing Co., Ltd. The remaining authors declare that the research was conducted in the absence of any commercial or financial relationships that could be construed as a potential conflict of interest.

Nomenclature

SPMStatistical parametric mappingEconThe fixed energy consumption of the furnace (kWh)
VVolume of blank (m3)ElossThe furnace heat energy loss (kWh)
AbThe surface area of blank, single side (m2) E g a s l o s s Heat loss of protective atmosphere in furnace (kWh)
A b The surface area of blank after forming, single side (m2) E w a l l , i l o s s Wall surface energy loss (kWh)
ρDensity ( k g · m 3 )tstage(m)The time consumed by each operation (s)
εEmissivityνp(t)Motion speed curve of servo-hydraulic press (m·s−1)
σStefan Boltzmann constant (W·m−2·K−4)F(t)Punching pressure curve of the hydraulic press (kN)
Cp(t)Specific heat capacity (J·kg−1·K−1)ηstage(m)The energy efficiency of each operation (%)
TbTapping temperature of blank (K)PLnNo-load power consumption of hydraulic press (kW)
TairAmbient temperature (K)tidleThe idle time of the process (s)
TfTemperature of floor and surrounding facilities (K)PquenchQuench power consumption of press (kW)
TbiEnd temperature of blank in the transfer stage (K)QcThe heat transfer between blank and die (kJ)
Tb0Initial temperature of blank in the cooling stage (K)QeConvection heat transfer between cooling and die (kJ)
TbtTemperature after quench (K)QmThe heat stored in the die (kJ)
TdTemperature of tool (K)qwTheoretical cooling flow rate (m3·h−1)
tcycleInterval time (s)twTotal cooling time (s)
tFFFast forming time (s)ρwCooling medium density (kg·m−3)
tSFSlow forming time (s)CwThe specific heat capacity of the water (J·kg−1·K−1)
tFormForming time (s)Twb-TwaTemperature difference of cooling medium (%)
tquenchQuenching time (s)φCooling efficiency (%)
tUDUnloading time (s)η1Pump efficiency (%)
tFRFast returning time (s)η2Motor efficiency (%)
tSRSlow returning time (s)PMMotor power (kW)
EtotalAverage total energy consumption (kWh)gGravity (kg·N−1)
EcoolingAverage energy consumption of cooling (kWh)HPump head (m)
EformingAverage energy consumption of forming (kWh)PM,i(t)The power curve of the motor (kW)
EhandlingAverage energy consumption of handling (kWh)COPCoefficient of Performance
EheatingAverage energy consumption of heating (kWh)PLRPart load Ratio
PheaterThe power of heaters (kW)QtotalThe nominal cooling capacity (KJ)
E d o o r l o s s Heat loss of furnace door opening (kWh) P c h i l l e r e Rated power of chillers (kW)
EradRadiation heat loss energy when opening the furnace door (kWh)Twd-TwcTemperature difference between inlet and outlet of water tank (K)
EconvConvection heat loss energy when opening the furnace door (kWh)ηPLRThe efficiency of the chiller on PLR
EblankEnergy consumption of heating blanks (kWh)Pchiller,j(t)The power curve of the chiller (kW)

References

  1. Yang, X.; Ran, R.; Chen, Y.; Zhang, J. Does Digital Government Transformation Drive Regional Green Innovation? Evidence from Cities in China. Energy Policy 2024, 187, 114017. [Google Scholar] [CrossRef]
  2. Khan, M.S.; Razmpoosh, M.H.; Biro, E.; Zhou, Y. A Review on the Laser Welding of Coated 22MnB5 Press-Hardened Steel and Its Impact on the Production of Tailor-Welded Blanks. Sci. Technol. Weld. Join. 2020, 25, 447–467. [Google Scholar] [CrossRef]
  3. Berger, R. Automotive Metal Components for Car Bodies and Chassis Global Market Study. Roland Berger. 2017. Available online: https://www.rolandberger.com/publications/publication_pdf/roland_berger_global_automotive_stamping_study_e_20170210.pdf (accessed on 10 February 2017).
  4. Li, L.; Huang, H.; Zhao, F.; Liu, Z. Operation Scheduling of Multi-Hydraulic Press System for Energy Consumption Reduction. J. Clean. Prod. 2017, 165, 1407–1419. [Google Scholar] [CrossRef]
  5. Heng, V.R.; Ganesh, H.S.; Dulaney, A.R.; Kurzawski, A.; Baldea, M.; Ezekoye, O.A.; Edgar, T.F. Energy-Oriented Modeling and Optimization of a Heat Treating Furnace. J. Dyn. Syst. Meas. Control 2017, 139, 061014. [Google Scholar] [CrossRef]
  6. Li, J.; Tong, C.; Zhang, R.; Shi, Z.; Lin, J. A Data-Informed Review of Scientific and Technological Developments and Future Trends in Hot Stamping. Int. J. Lightweight Mater. Manuf. 2024, 7, 327–343. [Google Scholar] [CrossRef]
  7. Min, J.; Lin, J.; Li, J.; Bao, W. Investigation on Hot Forming Limits of High Strength Steel 22MnB5. Comput. Mater. Sci. 2010, 49, 326–332. [Google Scholar] [CrossRef]
  8. Raugei, M.; El Fakir, O.; Wang, L.; Lin, J.; Morrey, D. Life Cycle Assessment of the Potential Environmental Benefits of a Novel Hot Forming Process in Automotive Manufacturing. J. Clean. Prod. 2014, 83, 80–86. [Google Scholar] [CrossRef]
  9. Abdulhay, B.; Bourouga, B.; Dessain, C.; Brun, G.; Wilsius, J. Development of Estimation Procedure of Contact Heat Transfer Coefficient at the Part–Tool Interface in Hot Stamping Process. Heat Transf. Eng. 2011, 32, 497–505. [Google Scholar] [CrossRef]
  10. Chang, Y.; Tang, X.; Zhao, K.; Hu, P.; Wu, Y. Investigation of the Factors Influencing the Interfacial Heat Transfer Coefficient in Hot Stamping. J. Mater. Process. Technol. 2016, 228, 25–33. [Google Scholar] [CrossRef]
  11. Fernández, B.; González, B.; Artola, G.; López De Lacalle, N.; Angulo, C. A Quick Cycle Time Sensitivity Analysis of Boron Steel Hot Stamping. Metals 2019, 9, 235. [Google Scholar] [CrossRef]
  12. Palmieri, M.E.; Tricarico, L. Influence of Conformal Cooling Channel Parameters on Hot Stamping Tool and Press-Hardening Process. Key Eng. Mater. 2022, 926, 645–654. [Google Scholar] [CrossRef]
  13. Ying, X.; Zhong-de, S. Design Parameter Investigation of Cooling Systems for UHSS Hot Stamping Dies. Int. J. Adv. Manuf. Technol. 2014, 70, 257–262. [Google Scholar] [CrossRef]
  14. Zhao, K.; Liu, Z.; Yu, S.; Li, X.; Huang, H.; Li, B. Analytical Energy Dissipation in Large and Medium-Sized Hydraulic Press. J. Clean. Prod. 2015, 103, 908–915. [Google Scholar] [CrossRef]
  15. Gao, M.; Li, L.; Wang, Q.; Liu, C. Energy Efficiency and Dynamic Analysis of a Novel Hydraulic System with Double Actuator. Int. J. Precis. Eng. Manuf.-Green Technol. 2020, 7, 643–655. [Google Scholar] [CrossRef]
  16. Li, L.; Huang, H.; Liu, Z.; Li, X.; Triebe, M.J.; Zhao, F. An Energy-Saving Method to Solve the Mismatch between Installed and Demanded Power in Hydraulic Press. J. Clean. Prod. 2016, 139, 636–645. [Google Scholar] [CrossRef]
  17. Gao, J.; Li, Q.; Lyv, Y.; Xing, J. A Quantitative Study on Energy Saving in Stamping Industry Using Servo Drive of Electric Machine. In Proceedings of the 2020 IEEE 9th International Power Electronics and Motion Control Conference, Nanjing, China, 29 November–2 December 2020; pp. 79–84. [Google Scholar]
  18. Li, L.; Huang, H.; Zhao, F.; Zou, X.; Mendis, G.P.; Luan, X.; Liu, Z.; Sutherland, J.W. Modeling and Analysis of the Process Energy for Cylindrical Drawing. J. Manuf. Sci. Eng. 2019, 141, 021001. [Google Scholar] [CrossRef]
  19. Gao, M.; Huang, H.; Li, X.; Liu, Z. Carbon Emission Analysis and Reduction for Stamping Process Chain. Int. J. Adv. Manuf. Technol. 2017, 91, 667–678. [Google Scholar] [CrossRef]
  20. Cheng, Q.; Gong, J.; Xiao, G.; Yang, C.; Liu, Z.; Qi, B. Research on Energy-Saving Production Planning of Periodic Forging Resistance Furnace. J. Clean. Prod. 2020, 275, 122897. [Google Scholar] [CrossRef]
  21. Verma, M.; Ciano, M.D.; Culham, J.R.; Yau, C.; Daun, K.J. Minimizing the Cycle Time of a Roller Hearth Furnace for Hot-Forming Die-Quenching. IOP Conf. Ser. Mater. Sci. Eng. 2018, 418, 012016. [Google Scholar] [CrossRef]
  22. Di Ciano, M.; Field, N.; Wells, M.A.; Daun, K.J. Development of an Austenitization Kinetics Model for 22MnB5 Steel. J. Mater. Eng. Perform. 2018, 27, 1792–1802. [Google Scholar] [CrossRef]
  23. Chang, J.H.; Oh, J.; Lee, H. Development of a Roller Hearth Furnace Simulation Model and Performance Investigation. Int. J. Heat. Mass. Transf. 2020, 160, 120222. [Google Scholar] [CrossRef]
  24. Gao, M.; Wang, Q.; Li, L.; Ma, Z. Energy-Economizing Optimization of Magnesium Alloy Hot Stamping Process. Processes 2020, 8, 186. [Google Scholar] [CrossRef]
  25. Wang, L.; Zhu, B.; Wang, Q.; Zhang, Y. Modeling of Hot Stamping Process Procedure Based on Finite State Machine (FSM). Int. J. Adv. Manuf. Technol. 2017, 89, 857–868. [Google Scholar] [CrossRef]
  26. Wang, L.; Zhu, B.; Zhang, Y.S. A Runtime Intelligent Iterative Manufacturing System (RIIMS) for Hot Stamping. In Proceedings of the Advanced High Strength Steel and Press Hardening: Proceedings of the 2nd International Conference, Changsha, China, 15–18 October 2015; pp. 647–654.
  27. Paryanto; Brossog, M.; Bornschlegl, M.; Franke, J. Reducing the Energy Consumption of Industrial Robots in Manufacturing Systems. Int. J. Adv. Manuf. Technol. 2015, 78, 1315–1328. [Google Scholar] [CrossRef]
  28. Tong, C.; Rong, Q.; Yardley, V.A.; Li, X.; Luo, J.; Zhu, G.; Shi, Z. New Developments and Future Trends in Low-Temperature Hot Stamping Technologies: A Review. Metals 2020, 10, 1652. [Google Scholar] [CrossRef]
  29. Abdulhay, B.; Bourouga, B.; Dessain, C. Experimental and Theoretical Study of Thermal Aspects of the Hot Stamping Process. Appl. Therm. Eng. 2011, 31, 674–685. [Google Scholar] [CrossRef]
  30. Optimal Design for Cooling System of Hot Stamping Dies. Available online: https://www.jstage.jst.go.jp/article/isijinternational/56/12/56_ISIJINT-2016-191/_article (accessed on 27 February 2024).
  31. Shapiro, A.B. Using LS-Dyna for Hot Stamping. In Proceedings of the7th European LS-DYNA Conference, Salzburg, Austria, 14–56 May 2009. [Google Scholar]
  32. Pashchenko, D. Ammonia Fired Gas Turbines: Recent Advances and Future Perspectives. Energy 2024, 290, 130275. [Google Scholar] [CrossRef]
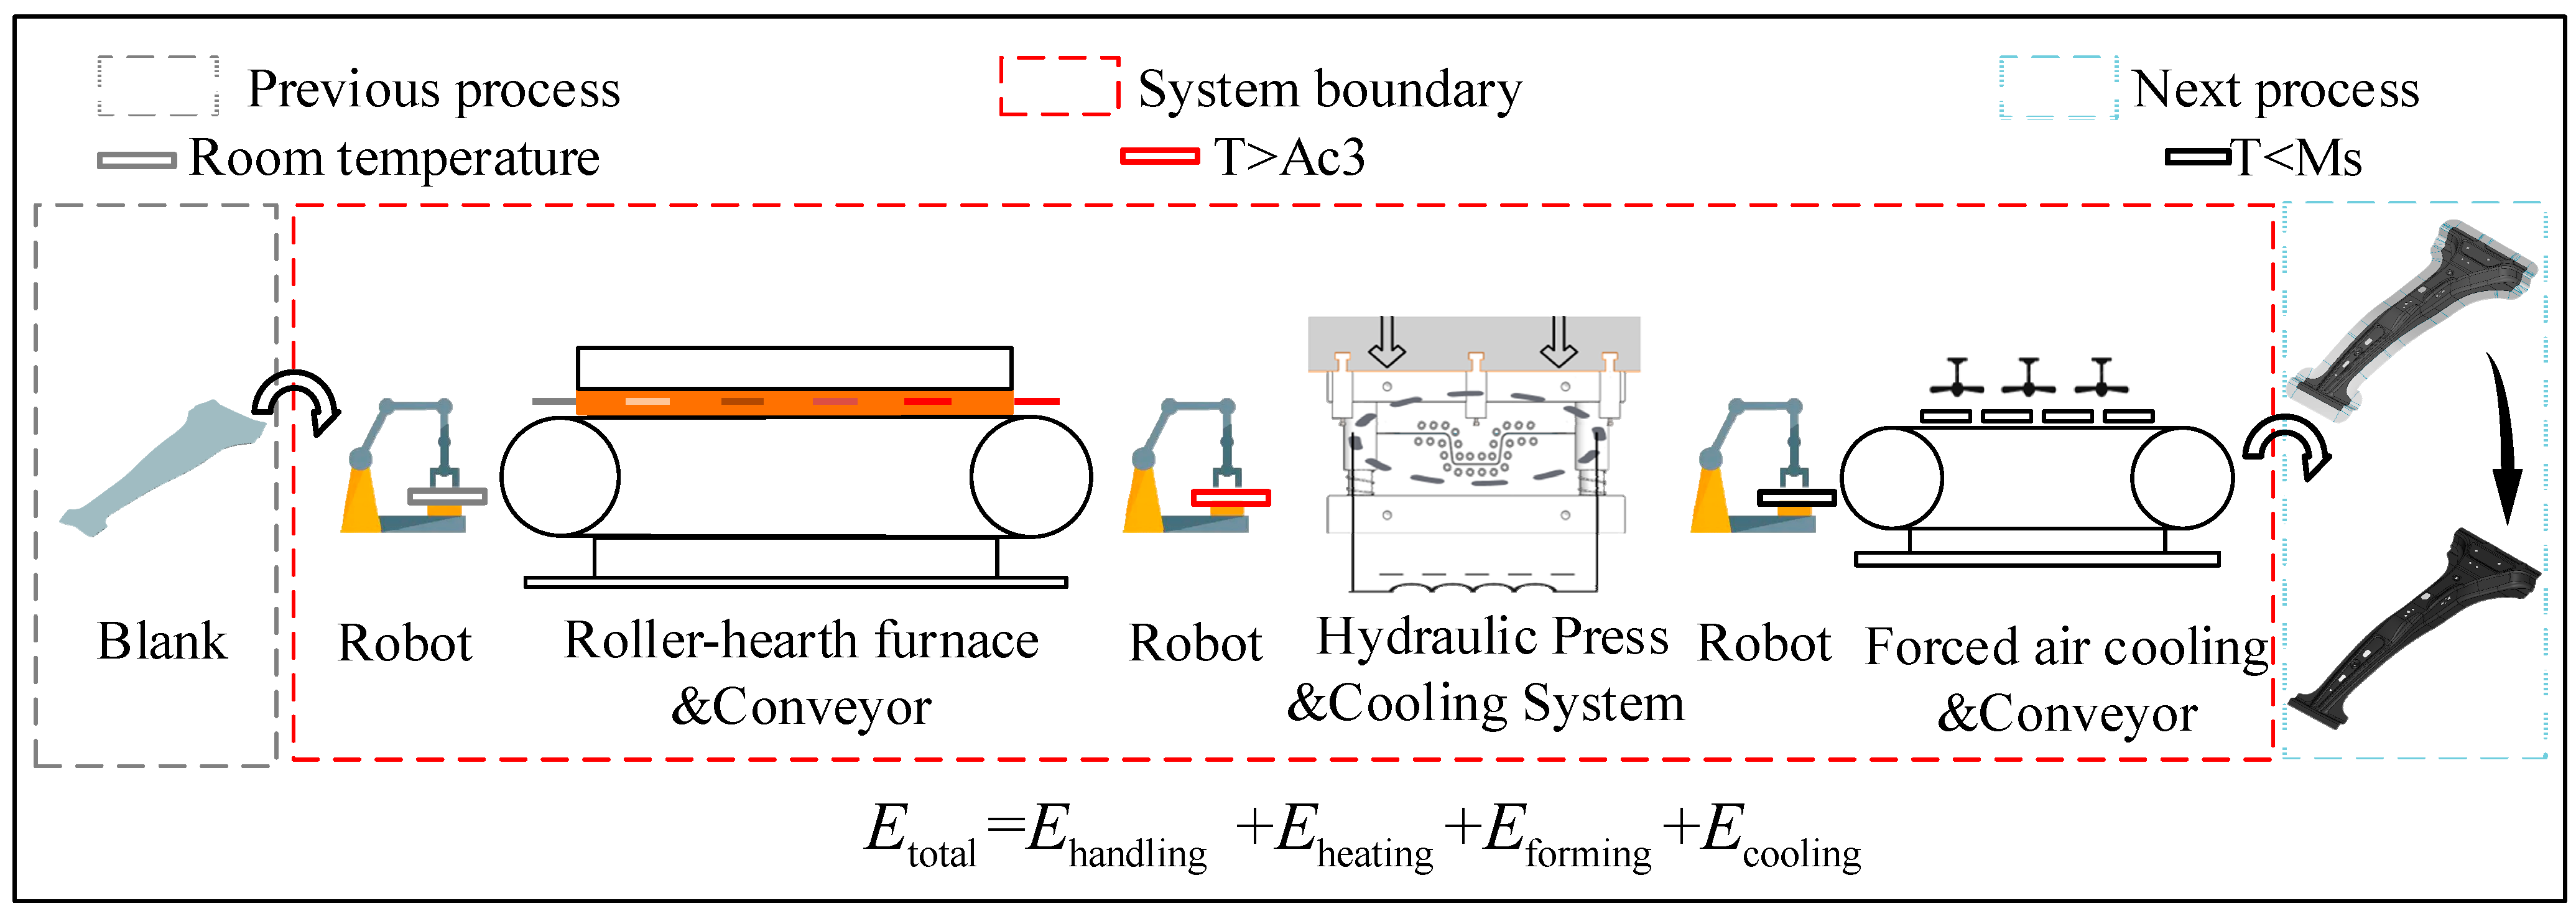
Figure 1. General production line process of hot stamping.
Energies 17 05798 g001
Figure 2. The composition and power consumption calculation of the handling robots.
Energies 17 05798 g002
Figure 3. Structure of the roller hearth heating furnace in the hot stamping production line.
Energies 17 05798 g003
Figure 4. Structure of servo-hydraulic press in the hot forming production line and core parameters history diagram in stamping stroke. (a) Force; (b) Displancement and Velocity; (c) Energy flow.
Energies 17 05798 g004
Figure 5. Schematic of working principle of die cooling and chiller systems in the hot stamping production line.
Energies 17 05798 g005
Figure 6. Field conditions of hot stamping production line of roller hearth heating furnace. (a) Blank; (b) Furnace construction; (c) Cooling syestem; (d) Chillers; (e) Robot and Roller conveyer; (f) Roller hearth furnace; (g) Press; (h) Mold.
Energies 17 05798 g006
Figure 7. Energy consumption calculation vs. actual measurement comparison chart.
Energies 17 05798 g007
Figure 8. Roller hearth heating furnace power curve.
Energies 17 05798 g008
Figure 9. The monitoring data of the manipulator under different operating conditions (taking one of the servo motors as an example), (a) motor speed comparison diagram, (b) motor acceleration contrast diagram, (c) motor current comparison diagram, and (d) motor torque comparison diagram.
Energies 17 05798 g009
Figure 10. Servo hydraulic press active power curve (blank), velocity curve (red), and output force (blue).
Energies 17 05798 g010
Figure 11. Cooling system cooling channels flow curve (a) and inlet temperature difference curve (b).
Energies 17 05798 g011
Figure 12. Sankey diagram for energy consumption analysis in HSPL.
Energies 17 05798 g012
Figure 13. Strategies and perspectives for HSPL’s energy saving.
Energies 17 05798 g013
Table 1. A-pillar production material parameters.
TypeUnitValue
Material——22MnB5 (Al-Si)
Thicknessmm1.7
Blank Qualitykg6
V: Volume of blank (m3)m37.66 × 10−4
Ab: cross-sectional area of blankm20.451
A b : cross-sectional area of the tool in contact with the blankm20.485
ρ: Densitykg/m37830
ε: Emissivity——0.7
σ: Stefan Boltzmann constantWm−2K−45.670373 × 10⁻⁸
Table 2. Calculation parameters of energy consumption model of HSPL.
Processing ParameterUnitValue
Tair: Ambient temperatureK303
Tf: Temperature of floor and surrounding facilitiesK313
Tb0: Initial temperature of blank in the cooling stageK1024
Tbt: Temperature after hardeningK454
Td: Temperature of toolK349
SPM(N): Statistical parametric mapping——3.125
GSPH: Gross stamping per hour——188
Table 3. The roller hearth furnace parameters.
AreasTemperature (K)Heater Power (kW) E loss (kWh)
1102320018
2102315020
31033150
41023150
51023150
6105315027.7
71083150
81133150
91173150
1012136045
11121360
12121360
13121360
14121360
1512139016
Total——1790126.7
Table 4. Production equipment cycle schedule.
EquipmentWorking Time (s)Holding Time (s)Returning Time (s)Waiting Time (s)
Robot#19.663.80.1
Roller conveyor#56.40013
Robot #22.303.713.4
Press2.573.76
Robot#35.30.21.212.7
Table 5. Cooling system detailed calculation parameters.
UnitParametersPowerEnergy
Cooling systemPump-Motor h c = 2137.03   W / m 2 K ; t quench = 7 s , φ = 0.9 ; Q c = 7.71 × 10 5   kJ ;   t w = 1   h ;   q w = 101.92   m 3 / h ; H = 40 m ; η 1 = 0.92 ; η 2 = 0.65 ; g = 9.8   m / s 2 ; P M = 18.56   kW E M = 18.56   kWh
Chiller × 4
(EKSC390B3MST)
Q = 4.5 × 7.71 × 10 5   kJ ; η PLR = 0.78 Q total = 1367.1   kW ; P chiller e = 230   kW C O P e = 5.94 ; C O P = 4.64 P chiller = 207.88   kW E chiller = 1 4.5 × P chiller × 1 h = 46.2   kWh
Disclaimer/Publisher’s Note: The statements, opinions and data contained in all publications are solely those of the individual author(s) and contributor(s) and not of MDPI and/or the editor(s). MDPI and/or the editor(s) disclaim responsibility for any injury to people or property resulting from any ideas, methods, instructions or products referred to in the content.