Abstract
Growing demands for energy and global environmental concerns, along with continued advancements in sustainable energy technologies, are leading to prospects for using renewable energy resources. Solar is ubiquitous, and Photovoltaic (PV) is a promising innovation to harness the electric power from the sunlight. This paper aims to provide insight into the lifetime journey of a solar PV system. The article started with the history of solar PV systems, their expansion, and current research and development worldwide. The work is concluded with the degradation analysis and recycling methodologies. Also, this review especially concentrates on diverse standards and codes of photovoltaic system installation/integration. Various software was available to design small to large-scale PV systems. A comprehensive comparative study was made on the available software for the design of PV systems. Further, for the case study, a few rooftop PV systems of university buildings in India are considered for performance ratio analysis and life cycle cost assessment. The performance ratio of the 100 kW photovoltaic system exhibits an efficiency of 57% with a basic payback period of 5.6 years. The yearly lifespan cost of the photovoltaic system is $2947. Finally, the study’s findings and the barriers to the implementation of vast photovoltaic systems are highlighted to provide appropriate guidance to researchers working on large-scale PV system installations.
1. Introduction
To meet the rapidly rising energy demand and reduce blackouts, several nations must urgently increase their electricity generation [1]. According to the IEA report, global electricity demand is anticipated to expand at a 3% yearly rate from 2023 to 2025, significantly outpacing the growth rate observed in 2023 [2]. The utilization of fossil fuels as the primary source of climate change accounts for more than 75% of global releases of greenhouse gases and almost 90% of carbon dioxide emissions. In order to prevent the worst effects of global warming, emissions must be cut by almost half by 2030 and achieve net zero by 2050. The International Renewable Energy Agency (IRENA) projects that by 2050, renewable energy sources should supply 90% of the world’s electricity. Although renewable energy is gaining traction, fossil fuels still generate more than 80% of global energy, with renewables currently providing about 29% of electricity. Solar photovoltaic (PV) technology is particularly popular in the market due to its clean and renewable characteristics [3]. Solar is the most commonly and widely used renewable energy technology. PV technology has been evolving and has a large scope in many developing countries like India. This motivates us to find the obstacles and challenges in expanding the PV system technology.
Before the 19th century, solar thermal energy was used for various applications. The first milestone in the development of solar energy into electricity was the invention of the photovoltaic effect by Edmond Becquerel. Figure 1 shows the timeline for the history of PV cells and their growth till the 23rd century. Every year, researchers report a drastic increase in the efficiency of solar cells by working on the material and its properties. The efficiency rise in solar cells from 1883 to 2022 is presented in Figure 2a. The efficiency has increased from 1% to 47.6%. In Figure 2a, the efficiency of various solar cells in the research and development stage is presented. In fact, these types of solar cells are not commercially available. Figure 2b exhibits the exponential rise of global PV installed capacity, demonstrating that the growth rate of production and installation capacity is 26% per year between 2016 and 2022. The global installed PV capacity was 1.2 GW in the year 2000 and increased to 1200 GW by 2022.
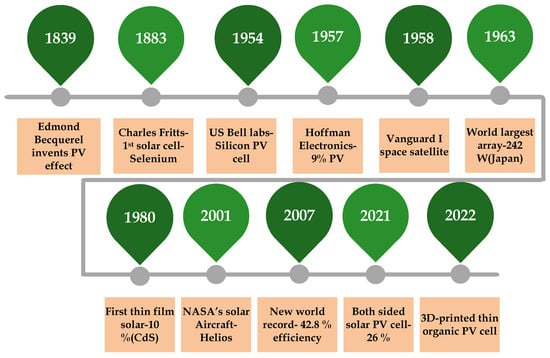
Figure 1.
History of solar PV cells.
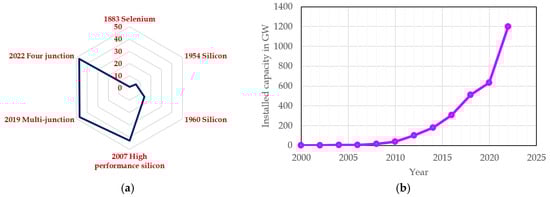
Figure 2.
(a) Efficiency enhancement in PV cells (b) Exponential growth of worldwide installed PV capacity.
Table 1 and Table 2 present the largest solar park commissioned in the world. As per [4], in China’s Qinghai Province, the Golmud Solar Park has a capacity of 2.8 GW installed, which houses 80 solar power plants and can power one million homes. Bhadla Solar Park, located in India’s Thar Desert, consists of 14,000 acres of solar power plants with a consistent generation of 2.25 GW. Figure 3a presents the installed capacity in MW for the past five years in the states of India, where there is a prominent augmentation of solar power plants. The installed capacity in MW for five countries and its growth are presented in Figure 3b.

Table 1.
World largest solar park.
Table 2.
Largest solar park in India.
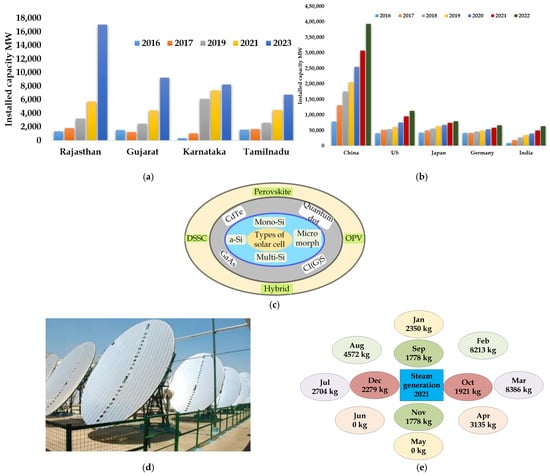
Figure 3.
(a) Growth of solar power installed in states of India (b) Growth of solar power installed in five countries (c) Types of solar cells (d) Solar thermal power plant in SRMIST (e) Steam generation in kg from concentrated solar plants.
Figure 3c illustrates the various types of solar cells used for electricity generation. Monocrystalline solar cells (mono-Si), polycrystalline solar cells (multi-Si), and amorphous silicon solar cells (a-Si) are commercially available and dominate the solar market as part of the first generation of solar technology. Micro morph solar cells, which are tandem cells made from a combination of amorphous and monocrystalline materials, represent a multijunction thin-film approach. In the second generation of solar cells, technologies like cadmium telluride (CdTe), gallium arsenide germanium (GaAs), and copper indium gallium selenide (CI(G)S) are developed by integrating various elements from the periodic table. Additionally, many other solar cell technologies are currently in the research and development phase.
A solar cell configuration referred to as a quantum dot Solar cells utilize quantum dots as an intriguing photovoltaic material. It aims to take the place of bulk materials like CdTe, silicon, and CIGS. Perovskite solar cells make use of a combination of organic and inorganic light-harvesting active layers like tin or lead halide-based material with a perovskite-structured compound. Another thin-film technology-based solar cell is a dye-sensitized solar cell formed with a photo-sensitized anode. It is a low-cost solar cell. An organic photovoltaic cell (OPV) is a polymer solar cell that utilizes organic electronics for capturing light and facilitating electron transport. Hybrid solar cells combine the benefits of both organic and inorganic semiconductors. Organic materials used in hybrid photovoltaics are combined into polymers, which act as donors and transport holes to absorb light.
The solar thermal system represented in Figure 3d consists of parallel modules with Elliptically shaped parabolic solar concentrators arranged in pairs of reclining and upright dishes, meticulously positioned in an east-west orientation. In the center of each pair of dishes are receivers, which are simply black-painted heat exchangers. The Scheffler-based system was put into place by SRMIST to use it for campus cooking. There are 37 concentrators in total. Commissioning of the system took place in February 2012. The university used LPG for cooking before the CST system was put into place. Now, LPG and CST are integrated into the system.
The project has been put up at a cost of Rs. 1.15 crore Rupees, with a subsidy of around Rs. 29.99 lakh Rupees obtained from MNRE. Light from the sun is reflected off the dishes and focused onto the receivers. The receiver’s water turns into steam because of the elevated temperatures reached. Steam generated from the parabolic concentrated solar plant for the year 2021 is presented month-wise in Figure 3e. From this, it is observed that the plant is inactive during the vacation period of the university because the thermal power from this plant is used for cooking in the hostel, and the students vacate the hostel for their summer break.
Solar thermal collectors harness solar radiation, convert it to thermal energy, transfer the energy through working fluids, and store it in a storage tank. Thermal energy from solar thermal collectors is a clean and sustainable energy source that reduces the use of fossil fuels, lowers carbon dioxide emissions, and lowers the electricity bills of users. With proper maintenance, the life span can be better. Solar thermal collectors offer an excellent solution for cost-effective residential and industrial heating challenges [5,6,7,8,9]. Nano-fluids with higher thermal conductivity, improved heat transfer coefficient, heat absorption capability, and reduced conduction and convection losses optimize the performance of the thermal collectors. Even though there are challenges in nano-fluids like cost, corrosion, maintenance, and stability by selecting an appropriate nano-fluid, the solar thermal collector performance is enhanced, which is demonstrated in Table 3.
Table 3.
List of solar thermal collector plants with their efficiency.
In [10] the use of nanofluid for increasing thermal and electrical efficiency with the production of electrolysis is discussed and analyzed experimentally. The experimental study with Zinc oxide nano-fluid reveals that the reported thermal efficiency was 33.4% with 17.4 mL/min as the hydrogen production rate. On-grid, off-grid, and hybrid solar systems are the three different kinds of solar PV systems. In most cases, the most economical option will be a grid-tied system. Grid-tied systems, with their low initial cost and simple system design, typically offer the best return on investment. A hybrid system, however, can be the best option in some circumstances, particularly when there are frequent power outages. A solar with storage system might be the best option. For average homeowners, off-grid systems are most likely the least practical. However, they work well in remote regions, so they can be a good fit for regions with difficult terrain. From this, it is observed that PV is the most promising technology for developing countries with high populations. However, the non-linear nature of the current-voltage characteristic curve complicates the evaluation of parameters for solar cells and PV modules [11]. Hence, it is required to perform preliminary analysis and a case study of the PV system before and after commissioning the system.
In [12], a comprehensive review is performed on the building blocks of solar panels with the forecasting models. A methodology is proposed in [13] to design a large-scale PV plant, and it will act as a guide to technicians and investors. This PV∗SOL is used as a simulation tool for the study. A review of various simulation software for PV with validation is presented in [14]. By comparing this study with the articles [12,13,14], it is noted that this study covers all three, and in addition, few real-time studies are performed concerning performance ratio and life cycle costing. Furthermore, simulation for a particular plant is studied with all the software considered for this study, and results are presented for analysis. Finally, the degradation and recycling of PV with Prognostics and Heath Management (PHM) is also presented in this study. This article will be a guide to renewable researchers who are interested in the study of utility PV systems.
From this comparative study, we have decided to present a comprehensive overview of the embracement of utility Scale PV Systems and a road map, with the main objectives of the proposed study presented as follows:
- (i).
- An overview of the history of solar PV cells with their types, efficiency, and growth;
- (ii).
- Forecasting and design of PV system.
- (iii).
- Various software tools are used for the design of PV systems;
- (iv).
- Reliability analysis of the system.
- (v).
- Fault diagnosis of the system.
- (vi).
- Codes and standards used for the design and commissioning of the PV system;
- (vii).
- Degradation of the PV system.
- (viii).
- Recycling of PV panels.
- (ix).
- Prognostics and Heath Management.
- (x).
- Inferences from the study and the challenges faced in the installation of utility PV systems.
This article presents a step-by-step analysis and assessment of PV systems from forecasting to recycling. Forecasting is the primary method used for feasibility assessment. Simulation software is then used to construct the system at the selected location. Subsequently, to conduct a study, multiple factors such as lifetime, cost, reliability, fault tolerance ability, and finally the degradation rate and methods for recycling are analyzed. Discussion of the PV system’s full life cycle, together with its analysis and methods, will aid research in gaining a comprehensive understanding of the PV system.
2. Forecasting and Design of PV System
The Materials and Methods should be described with sufficient details to allow others to replicate and build on the published results. Solar radiation is intermittent, and it is adversely affected by climatic conditions. Hence, it is mandatory to perform a preliminary study before designing and commissioning the system. This section is devoted to the forecasting and design of PV systems. Regarding the design of the utility PV system, both theoretical and simulation designs are discussed. The need for a forecasting method with predictive maintenance model formulation is elaborated. Four categories of forecasting methods and the inference from the study are in the last section of the article. Several simulation software are briefed with the results captured from those platforms.
2.1. Forecasting Models
In the last two decades, several forecasting techniques have been researched and tested for forecasting solar irradiance. Since solar radiation is highly fluctuating and adversely affects the output of PV systems, it is essential to keep our step in forecasting the solar input before proceeding to the design of the PV system. Figure 4a presents the various solar irradiance forecasting methods reported in the literature. Especially, researchers concentrate much on statistical and machine learning (ML) techniques for forecasting, which are briefed in Figure 4b.
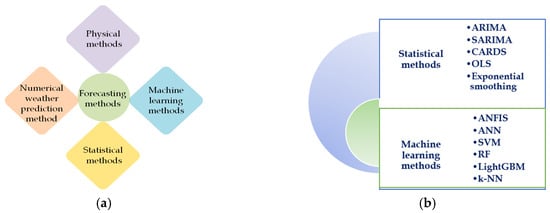
Figure 4.
(a) Solar irradiance forecasting methods (b) Forecasting using statistical and machine learning methods.
In the numerical weather prediction method, various physical changes in the atmosphere are modeled as an equation. According to [15], the National Weather Service is computing 14 global meteorological models. The physical technique uses satellite images for forecasting. Cloud detection and solar irradiance prediction are two important processes in sky-image-based techniques. All sky images undergo various processes to predict the future level of sun rays with the cloud covering [16]. The most used statistical methods are the autoregressive model (ARIMA), the Seasonal Autoregressive Integrated Moving Average (SARIMA), and CARDS. Coupled Autoregressive and Dynamical System (CARDS), Ordinary Least Squares (OLS). Machine learning methods used in PV power forecasting are k-Nearest Neighbors (k-NN), Artificial Neural Networks (ANN), Support Vector Machines (SVM), Random Forests (RF), Adaptive Neuro-Fuzzy Inference Systems (ANFIS), and Light Gradient Boost Machines (Light GBM). In [17], a comprehensive review of the above-mentioned methods is given. A linear statistical model is combined with ANN to assess the prediction of sunrays and sunsets [18]. All these forecasting methods are used to provide a preventive maintenance model that gives the complete picture of the abnormalities in the PV system. In [19], a genetic algorithm is used for optimizing the weather analysis and prediction model and solar irradiance, which will guide the energy researchers to work on the forecasting models. To forecast global horizontal irradiance (GHI), the gradient boosting method in [20] is used, and it is bench-marked with Long Short-Term Memory (LSTM), ARIMA, and a 2-layer feed-forward neural network.
2.2. Design of PV System
Figure 5a gives the steps involved in designing a standalone rooftop PV system. The initial step in creating a solar PV system is to evaluate the overall electrical power and energy consumption of all the loads the system will accommodate. The inverter for standalone systems must be adequately sized to accommodate the total power requirements. It should be 25–30% larger than the combined wattage of the appliances. For motors or compressors, the inverter must have a capacity of at least three times that of those devices. Furthermore, the inverter capacity should be increased to handle the surge current during startup. In battery sizing, the total watt-hour per day is calculated. The number of batteries required is acquired by considering days of autonomy, inverter efficiency, and the rating of the battery. PV module sizing is carried out by considering the charge controller and battery efficiency [21]. The amp-hour required is obtained by considering the system voltage. Finally, the solar charge controller rating takes the short-circuit current of the PV module. The current rating of the controller circuit is determined by growing the short-circuit current by 1.3 times. The complete schematic circuit after the design of the PV system is presented in Figure 5b.
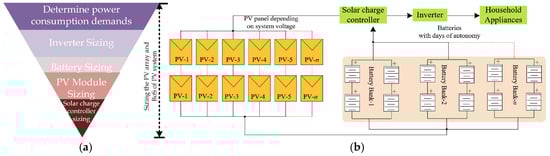
Figure 5.
(a) Steps involved in the design of PV system (b) General block diagram of standalone roof-top PV system.
2.3. Simulation Software for the Design of PV System
Solar Grid has many components and parameters to be set before installation. Such as Irradiance and ambient power for PV panels, Inverter parameters, panel tilt angle to receive maximum radiation, and so on. Thus, various research and studies have been conducted to determine the optimum energy generation and transmission by using solar grid systems. These analyses will differ depending on the installation type and place. Thus, before installation, critical analysis of the solar plant is necessary, such as wind, humidity, ambient temperature, etc.
In this regard, the feasibility and modeling of the PV system have been studied in this paper by using different Simulation Software, and they are used to analyze the 52 kW PV grid located in the SRM Institute of Science and Technology in Chennai, India. Figure 6a presents various simulation tools used by many researchers, suppliers, and customers for the installation of PV systems. Grid-connected PV systems are a good alternative source of electricity for developing countries. The capacity of a PV grid for a particular location can be evaluated by using different Simulation Software. This study mainly concentrates on the comparison of various PV tools. Thus, in this study, a few simulation software is used, such as TEDA, MNRE PV GIS, SISIFO PV*SOL, and PVSyst, to analyze the 52 kW grid-connected PV system of the SRM Institute of Science and Technology Mechanical “C” block (Kattankulathur, Tamil Nadu). A comprehensive analysis and the inferences from the study are obtained and presented. This article will help the researchers to use suitable software for the analysis and study. This review will also help in improving the PV system’s precision. Simulation software is categorized based on sizing, one-dimensional, and multi-dimensional simulation tools, and these three groupings are depicted in Figure 6b.
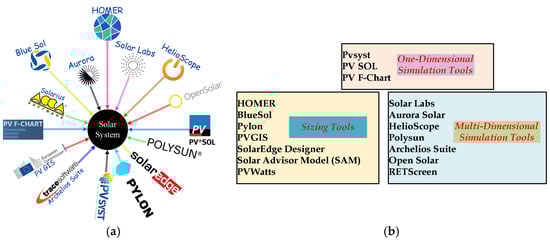
Figure 6.
(a) Various software tools used for PV design (b).
Table 4 presents software designed and implemented for the design of PV systems and the comprehensive analysis of the PV system performance. This table depicts the main features of the software tool along with the intended user. The references provide the web link of the software where the open-source software or trial version can be downloaded for the study. In [22], PV∗SOL is used to simulate the installation of rooftop solar panels on academic buildings. PVGIS, PVWatts, and RETScreen are utilized for rapid calculations and estimations related to the production of power from PV systems [23]. To compare 19.8 kWp of grid-connected solar installation with actual electrical energy production, Archelios, Polysun, PVSyst, PV*SOL, and PVGIS are used [24]. In [25], RETScreen, Solar Advisor Model (SAM), PVGIS, PVSyst, and PV*SOL are utilized to predict photovoltaic energy production. The selected site for this study is SRM Institute of Science and Technology, Tamil Nadu, at a latitude of 12.4 degree North and a longitude of 80 degree East. The Chennai city obtains energy from the Tamil Nadu Electricity Board (TNEB) Public Grid that supplies electricity to other houses. The study has been carried out in this educational institute, which is located in Chennai and is one of the cities that annually acquires solar energy. The yearly ambient temperature is temperate between 28 degree to 30 degree Celsius. Figure 7a presents the location and Satellite view of SRM Institute of Science and Technology Chennai.
Table 4.
Simulation software for PV design.
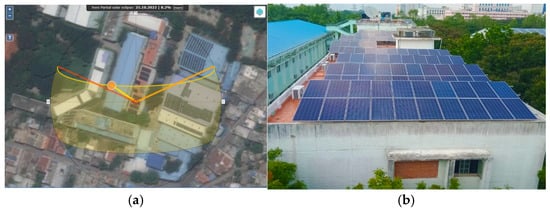
Figure 7.
(a) Location and Satellite view of SRM Institute of Science and Technology Chennai (b) 52 kW PV plant implemented at SRMIST (Mechanical Block).
A 52 kWp Solar rooftop system is chosen; the photograph of a 52 kW PV plant implemented at SRMIST (Mechanical Block) is presented in Figure 7b. The PV material is multi-crystalline with 160 Modules each of 325 W, and it has an inclination of about 13o with a module efficiency of 16.72 percent. The system is a stationary platform arrangement that can power an institutional block.
The primary element of a grid-tied photovoltaic system comprises:
- Solar photovoltaic modules are coupled in series and parallel configurations according to the power requirements.
- Maximum Power Point Tracker to receive maximum solar radiation to generate sufficient DC power during maximum sunlight hours.
- The grid-connected DC/AC inverter supplies the generated electricity to the grid.
- Grid-connected equipment such as DC/AC circuit breakers, fuses, and related components.
PV*SOL is the software used to assess the efficacy of the solar grid, and it is used to determine the site-specific for the grid. The inputs needed are location, PV module information, energy consumption, inclination angle, and inverter type. It is developed by Valentin software online access. PVGIS is software that helps us to determine the irradiance for the PV panel. The data needed are PV technology, installed capacity, power consumption, system loss, and Inclination angle. It is developed by the European Commission and the National Renewable Energy Laboratory. SISIFO is software that determines the overall simulation of the PV module, and the input needed is the location and technical data of the overall system. It is developed by IES-UPM in the European project PVCROPS. MNRE is a website that determines the overall cost and life cycle cost analysis of PV systems. The data needed are Energy consumed, Type of PV system, and electricity cost. The Central Government of India develops it.
2.3.1. PV*SOL
PV*SOL is an efficient tool that is used to decide the type and capacity of PV to be installed. The location and PV data are entered as the input in the online PV*SOL software to obtain the results, such as annual PV energy, irradiance data, and energy consumption. The detailed flow chart of steps is shown in Figure 8a. From this flow diagram, it is observed that this tool provides PV yield and performance ratio as the result. The PVSOL gives the annual global irradiance and average temperature of the location, and the result is presented in Figure 9a,b. The annual global irradiance is about 1941.9 kWh/meter square and an average temperature of about 28.2 degrees Celsius. The data are taken and absorbed, and the maximum power consumed is about 46,409 kWh; thus, we obtain the corresponding Energy curve in PV*SOL. From the given input, the PV consumption and generation are obtained and illustrated in Figure 9c,d.
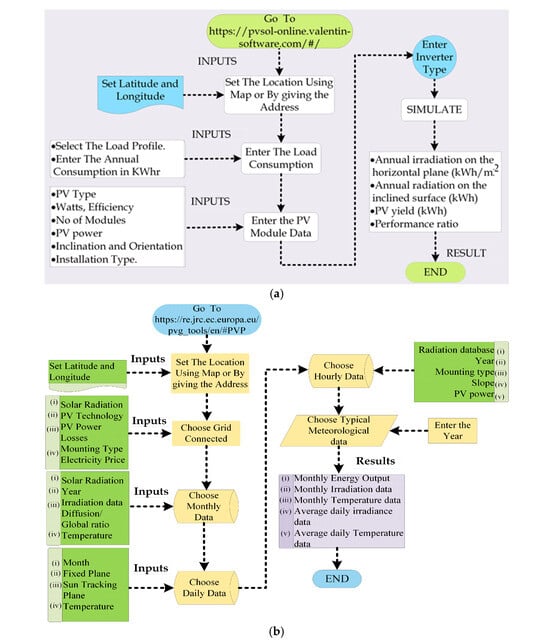
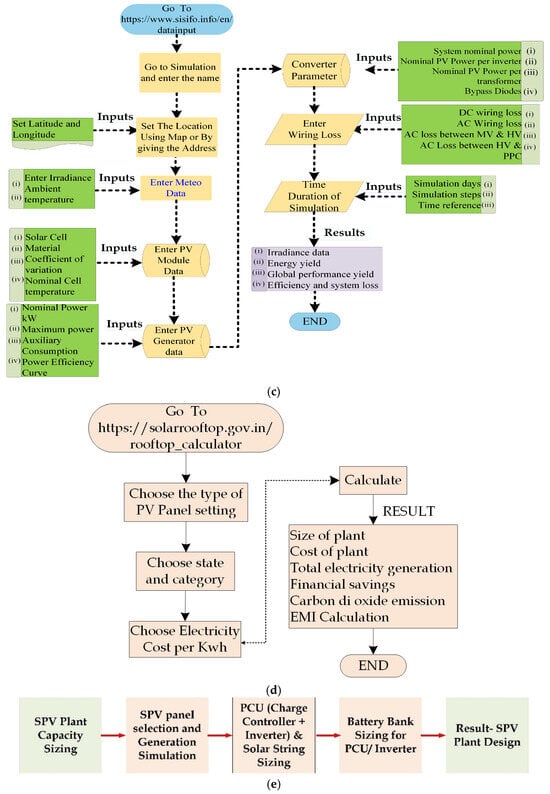
Figure 8.
Steps involved in the design of PV System using (a) PV*SOL (b) PVGIS (c) SISIFO (d) MNRE solar rooftop calculator (e) Tool released by TEDA.
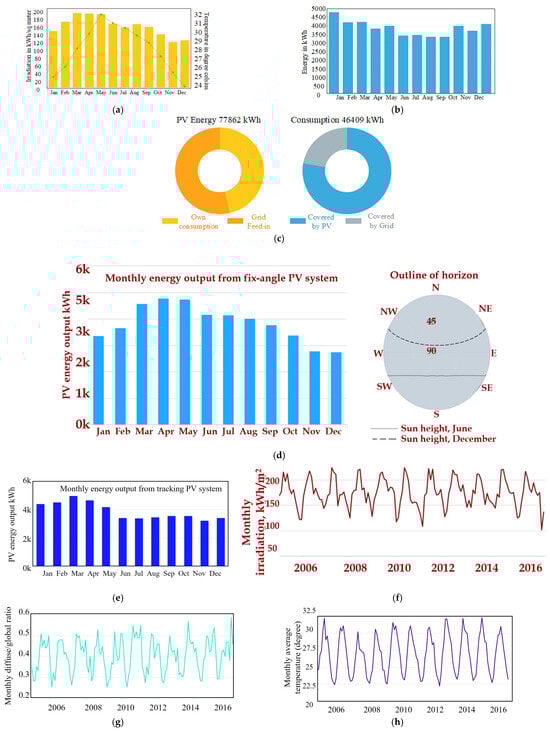
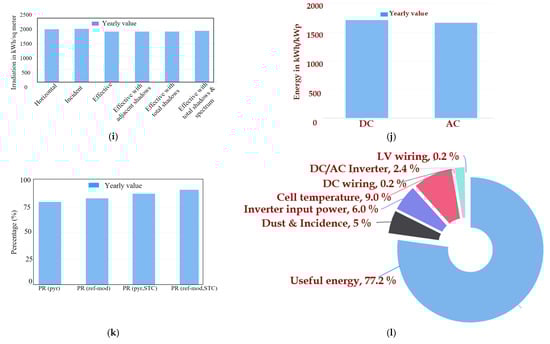
Figure 9.
Results from software (a) Annual global irradiance and average temperature from PV*SOL (b) Energy yield from PV*SOL (c) PV consumption and generation from PV*SOL (d) Monthly energy output for fixed PV system (e) Monthly energy output for tracking the PV System. (f,g) Radiation obtained from PVGIS (h) Average temperature for various years (i) Irradiance for a year from SISIFO (j) for AC and DC power obtained (k) Performance ratio (l) loss model.
2.3.2. PVGIS
PVGIS is an online simulation software that determines the temperature and irradiance of the location at which the PV Panel is inserted. It helps to determine the energy production, annual yield, and system loss. The flowchart of the systematic procedure is presented in Figure 8b. It is noted that this tool provides monthly average irradiation and temperature data along with the monthly energy output. The PVGIS provides monthly energy output for fixed PV systems by using the system input loss, Slope angle, and temperature, which are illustrated in Figure 9e. The monthly radiation acquired via PVGIS is presented in Figure 9f. The ratio of diffuse to global radiation is obtained and presented in Figure 9g. Finally, the monthly average temperature for various years is presented in Figure 9h. This figure represents the average temperature for 12.8259° N, 80.0395° E latitude and longitude.
2.3.3. SISIFO
SISIFO is an online-based simulation used for the overall simulation of a PV system. The systematic procedure is shown in the form of a flowchart, which is depicted in Figure 8c. IES-UPM created SISIFO, a free online simulator for photovoltaic systems, as part of the PVCROPS European project. The simulation of various grid-connected photovoltaic systems, including large grid-connected plants and building-integrated installations, is possible with this version of SISIFO. Compared to PVSOL and PVGIS, this tool provides efficiency and system loss along with the global performance yield. SISIFO is used to obtain many parameters of the PV Grid, and the obtained irradiance for a year is shown in Figure 9i. The energy yield for AC and DC power is obtained in the year as shown in Figure 9j. The performance ratio in percentage is presented in Figure 9k. Finally, the useful energy with various losses is presented in Figure 9l.
2.3.4. MNRE Tool
MNRE is an online web-based tool designed by the central Government of India that helps to estimate the cost of solar grids with the life cost and available EMI cost. The step-by-step procedure is shown in Figure 8d as a flowchart. It is designed by the central government of India, where the supplier and customers can design the size and cost of the PV plant. The special feature of this tool is the provision for EMI calculation for the designed PV system. Carbon dioxide emission is also given as an additional component in this design tool.
2.3.5. TEDA Tool
This tool is designed by one of the state Governments (Tamil Nādu) in India. The step-by-step procedure for the design of on and off-grid-connected PV systems using the TEDA tool is offered in Figure 8e.
2.4. Performance Analysis of Commissioned Plant
The operation of the plant and its performance involve acquiring data from an online monitoring system owned by SRMIST [50]. Figure 10a–d presents the results obtained from that online monitoring system.
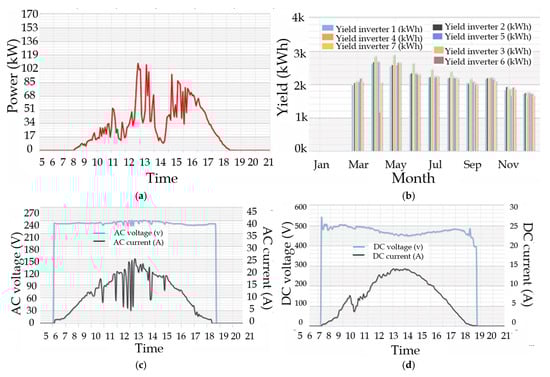
Figure 10.
Results obtained from online monitoring system (a) AC power output (b) Energy yield (c) AC voltage and current (d) DC voltage and current.
2.4.1. Digital Surveillance System
2.4.2. Performance Ratio Calculation
In this section, the performance ratio (PR) of three plants commissioned by SRM Institute of Science and Technology is calculated and presented in Table 5. Figure 11a,b presents the photographs of solar panels installed in three different locations and their inverters. Figure 11a presents the photo of rooftop solar panels placed in Aerospace hangar with its string inverters. Similarly, the rooftop panels with string inverters placed in Mechanical hangar is depicted in Figure 11b. For the calculation of the performance ratio, we tabulated the energy yield obtained from those two PV plants, and PR is acquired using the following expressions.
Table 5.
Energy yield from the PV system installed in two buildings.
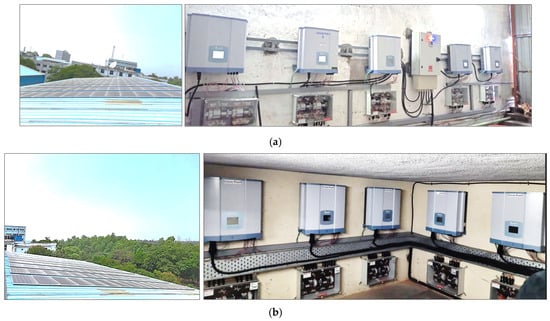
Figure 11.
(a) Solar PV module and string inverter in Aerospace hangar (b) Solar PV module and String inverter in Mechanical hangar.
The final yield is obtained by dividing global horizontal irradiance (GHI) by reference irradiance at standard test conditions (STC).
Performance ratio is determined by dividing (1) by (2)
2.5. Life Cycle Costing Analysis of Commissioned Plant
The payback period is estimated as discussed in this section, considering two different techniques: (i) simple payback period and (ii) Life cycle costing (LCC). The significance of this analysis is discussed in [53,54,55,56,57] For the 100 kWp PV plant, the above-mentioned techniques are implemented, and the payback period calculation procedure is given.
2.5.1. Simple Payback Period
The simple payback period method makes use of the amount of time needed to recover the investment in solar energy generation. The rate of inflation, the depreciation O&M expense, and other PV system lifespan costs are not included in this method. The ratio of the 100 kWp PV system’s capital cost to the yearly cost savings from solar energy is known as the simple payback period. The entire energy yield per year. According to Tamil Nadu tariff regulation, academic institutions are required to pay Rs. 7.50 for each unit consumed. Years are needed for the 100 kWp PV system’s simple payback period. This illustrates the PV system’s initial investment cost’s time recovery.
2.5.2. Life Cycle Costing (LCC)
The alternative method to a simple payback period is to determine the cost involved in the PV system during its life span, which is discussed in this section. It involves the cost of owning and running a PV system and its components over its life span, as given in (5). Table 6 presents the major investment costs involved in the 100 kWp PV system considered for the case study.
Table 6.
Major invested cost incurred in 100 kWp PV system.
To calculate LCC apart from the capital cost of the component at the time of installation, operation and maintenance costs and the replacement cost that occurs in the future are also required. Therefore, the time value for money and the present value of future investments must be calculated. The present worth factor (PWF) of the invested capital is computed based on a minimum lifespan of 25 years for the PV system, an inflation rate of 6.7%, and a discount rate of 10%. The estimated life cycle cost (LCC) is detailed in Table 7. Consequently, the long-term advantages of utilizing solar photovoltaic energy are examined by this method. The annualized lifecycle cost of a 100-kW photovoltaic system is determined from the lifecycle cost (LCC). and it is obtained as $2947.
Table 7.
Life cycle cost of 100 kWp PV system with 25 years life span.
3. Solar Reliability and Fault Analysis
3.1. Reliability Analysis of Solar PV System
This section discusses the reliability analysis of solar PV systems and the study’s inference. Table 8 presents the method used to perform the reliability evaluation and the conclusion drawn from the study. This table gives an insight into the significance of the reliability assessment and the factors that create an impact on the reliability of PV systems.
Table 8.
Reliability study of solar PV system.
The authors suggest a simple and affordable way by adding a hardener to standard see-through tandem modules to increase the reliability of tandem modules [72]. For value assessment and planning purposes, [73] provides an overview of a technique for assessing the reliability implications of solar electric technology on electric utilities. In [74], the shaded cell module’s thermographic images were acquired by varying both its shaded area and shading pattern. These thermographic images are used to identify the intensity of the temperature impact on the solar module, and the reliability of the PV system can be studied. Thermal images are also used for efficiency measurement. Furthermore, the predominant loss location in the system can be visualized with the maximum temperature [75].
The evaluation of reliability and modeling of solar radiation is difficult due to its stochastic and intermittent nature. A solar model is proposed for simulating solar radiation, and it is compared with a few techniques like auto-regressive moving average and clearness index to highlight its superiority [58]. The authors in [58] have given the scope for future work, i.e., to explore and simulate other meteorological factors like temperature and wind in the proposed model.
3.2. Fault Diagnosis of Solar PV System
Solar photovoltaic (PV) array fault analysis is a critical task for protecting PV modules from damage and eliminating safety risks. Faults lower photovoltaic (PV) plants’ overall power generation capacity. A PV system’s power output can be decreased by several variables, including hotspots, partial shade, diode malfunction, PV cell failure, and others. Early fault detection during PV module monitoring and examination is crucial to boosting PV system efficiency, reliability, and safety. Figure 12a presents the various faults that prevail in the photovoltaic array. Faults in the PV array are categorized in terms of degree of severity. Acute PV faults are the most severe, while chronic faults are not very severe. Acute faults are short- and open-circuit faults that can cause the PV system to cease functioning and there is no power output. Because of their lower severity, shading faults, hot spot faults, degradation faults, and bypass diode faults are classified as chronic defects. Faults can also be categorized as temporal and permanent faults. The permanent fault needs replacement of the PV module due to cracks, hotspots, bubbles, degradation, burns, scratches, and lamination. In the case of temporal faults like soiling and shading, the faults can be easily solved without any replacement.
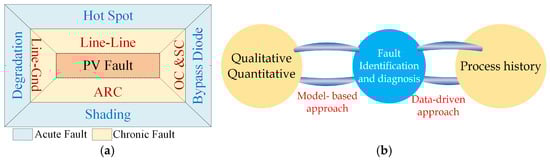
Figure 12.
(a) Types of faults in PV (b) Fault detection strategies.
Figure 12b illustrates the various fault detection and diagnosis categories in the PV array system. In a model-based approach, both qualitative and quantitative detail of the PV plant is required, whereas, in the case of a data-driven approach, an extensive amount of data are required for processing [76]. Fault diagnosis is observed to be more complicated in solar PV arrays due to their non-linear characteristics. An IoT-based sensorless circuit is built with a Zener diode and transistors for fault diagnosis of solar PV arrays [77]. The main advantage of this methodology is that it is cheaper and easier to integrate because it does not use many sensors and voluminous data. The proposed methodology is also maintenance-free and more accurate in detecting and classifying the faults. The electrical transient time-domain analysis is noted to be most effective in fault diagnosis. The problem behind this method is the usage of wide-ranging datasets. To overcome this issue, Fisher Discrimination Dictionary Learning (FDDL) for limited representation is utilized for diagnosing faults in photovoltaic (PV) arrays [78].
The protection challenges faced at the time of fault are discussed in [79]. Overcurrent protection devices (OCPD) for line-line faults are analyzed under situations during minimal irradiance. Solar panel thermal images are used for the detection of faults with a preprocessing technique. Faults such as PID hotspots, dust, shadow, diode, single cell, and multicellular are detected with filters and histogram equalization [80]. Due to the presence of a protection diode in a PV array, fault detection becomes more complex. This issue is addressed in [81] by using Thevenin equivalent resistance for fault detection and identification. Even online fault detection is also proposed by comparing model predictive results with the measured results for keeping track of PVs performance ratio [82]. The main issue identified in fault detection is misidentification of faults. Identification of short circuits is more challenging. Many algorithms are proposed for line-line and line-to-ground faults. Still, the research is open for diagnosing short circuit issues [83]. There is scope for improvement and research in the area of fault identification, detection, and rectification, especially in the area of deep and machine learning using large data sets.
4. Codes and Standards for Solar PV Systems
It is essential to develop the fundamental codes and standards governing solar deployment in a timely manner to guarantee the safety and reliability of the installation of photovoltaic solar energy systems and their integration with the grid of the country. For the implementation of a roof-top grid-connected solar photovoltaic (PV) system, all the components must conform to the standards and quality certification. Furthermore, an efficient online monitoring system needs to be added to rigorously monitor the system and adherence to these standards. These standards are applied to PV plants’ design, procurement, and construction phases, but they are primarily related to PV plant operation and maintenance. The protection, design, setup, and monitoring of photovoltaic (PV) system components are covered by numerous organizations’ established standards. In those standards, the Institute of Electrical and Electronics Engineers (IEEE) and International Electrotechnical Commission (IEC) standards are predominately followed and adhered to for the solar PV design, installation, safety, and monitoring. The International Organization for Standardization (ISO) provides vocabulary for solar energy.
4.1. IEC Standards
The International Electrotechnical Commission (IEC) offers beneficial guidance and oversight to builders and manufacturers of solar power units. Twenty thousand international experts from business, government, and top testing facilities come together to create IECs international standards. IEC standards are available from the testing of photovoltaic cells to the efficiency testing of power conditioning units in PV systems. Procedures for measuring the current-voltage characteristics of photovoltaic (PV) devices in real or artificial sunlight are outlined in IEC 60904-1:2020. For example, in research labs, in large-scale solar farms, etc., testing the ratings of the PV module and its compliance with the given data sheet specifications are ensured by adhering to this standard. IEC 60904-1. The basic requirements for constructing photovoltaic (PV) modules ensuring secure electrical and mechanical functioning are outlined in IEC 61730-1:2023. IEC 61683:1999 offers guidelines for estimating the power conditioner efficiency in standalone and utility-interactive photovoltaic systems. The power conditioner’s output can be either a stable DC voltage or a stable AC voltage with a constant frequency. IEC TC82 encompasses PV system standards, and its objective is to establish global standards for photovoltaic panels and other components that comprise the entire PV energy system [84,85]. The new solar PV module is subjected to a pass-fail qualification test. IEC 61215 and 61646 are a series of tests for monocrystalline and thin film solar cells, respectively. Figure 13a presents various IEC standards in terms of safety. This picture will give an insight into the standards for the design and commissioning of PV systems. IEC 61730 is meant for PV module safety qualification. For the PV module’s performance testing, the IEC 61853 standard is used.
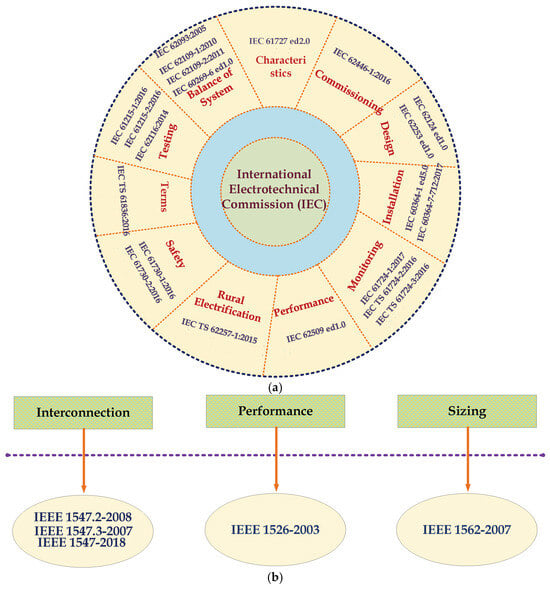
Figure 13.
Solar standards (a) IEC standards (b) IEEE standards [86].
4.2. IEEE Standards
The standards of the Institute of Electrical and Electronics Engineers comprise hundreds of common standards driven by the industry, encompassing an extensive variety of technologies and applications, such as utility grid integration and photovoltaic systems. Many IEEE standards are used for the design of PV and other components in BoS. IEEE 1526 offers a suggested method for evaluating the Performance of standalone Photovoltaic Systems. Exclusively, standards are meant for battery sizing, optimizing, and maintenance. For standalone PV systems, IEEE 1562 provides guidelines for battery and array sizing [86]. Mainly for critical applications in remote villages without grid connectivity, the system’s compliance with the IEEE 1562 standard ensures uninterruptible supply with reduced loss and increased efficiency. IEEE 1361 guides Lead-Acid Battery Selection, Charging, Testing, and Assessment for Stand-Alone Photovoltaic (PV) Systems. A set of technical guidelines known as IEEE 1547 describes the capabilities and performance of distributed energy resources linked to the distribution grid, which will aid solar integration [86]. Figure 13b presents the IEEE standards framed exclusively for performance and sizing.
4.3. ISO Solar Energy
The ISO committee deals with standardization in the areas of solar radiation measurement and solar energy use for air conditioning, heating, cooling, and space and water heating. As a result, the terminology used in this document primarily focuses on definitions that pertain to the technologies, measurement, and utilization of solar power. ISO 9488:2022 documents the terms related to solar energy [87].
4.4. Standards for Protection in PV
NEC (National Electrical Code) Article 690 is a significant article for the installation of a PV system. Many articles in the literature follow the standards given in NEC 690. Furthermore, concerning line-line and line-ground faults, standards like UL 2579, UL 1741, IEC 62109-1, IEC 602696, and IEC 62109-2 are followed. In [88], the efficacy of the standards is tested and analyzed for various operating scenarios for photovoltaic systems. Finally, the gaps and recommendations of various standards for PV installation are presented in To promote renewable energy power generation, various policies are framed. The list of various policies and the year of implementation are presented in Figure 14.
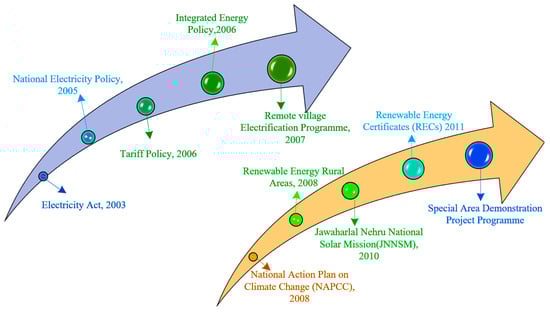
Figure 14.
Policies and the year of Commission.
The degradation rate of OV modules depends on climatic conditions, manufacturing techniques, and technology incorporated. The climatic condition mainly includes thermal cycling and UV exposure. To extract the degradation rate, historical data are fitted in all the methods as mentioned in Figure 15 [89].
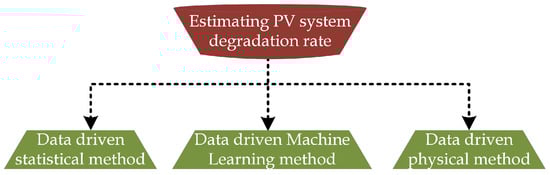
Figure 15.
Methods used to extract the degradation rate of PV panels.
In the data-driven statistical method, statistical analysis is used to figure out the overall pattern of the PV performance time series and convert its slope into an annual loss rate. This statistical analysis is most used for the degradation assessment [90]. Many supervised and unsupervised machine learning algorithms are proposed to evaluate the deterioration rate of PV technologies [91]. Based on input stress factors, the degradation rates are determined from the data-driven physical model [92]. Table 9 presents the case study carried out in various locations concerning degradation analysis. A research investigation is conducted in Algeria (Biskra) to evaluate the degradation of PV panels in an arid climate [93]. Using curve-fitting methods, five parameters in the PV model are determined, and the degradation of those parameters is obtained for all the panels to identify the damaged panels. Power degradation is directly related to the discolored EVA panel [94]. In [94], the peak power (Pm) and short-circuit current (Isc) of the PV module are determined with a discolored EVA panel, and the results show that the Isc and Pm degrade at the rate of 21% and 22%, respectively. Photodegradation of polymer with UV dose and the effect of trapped water in EVA storage are discussed in [95] concerning the degradation of PV modules.
Table 9.
Case study carried out in various location with respect to degradation analysis.
In [81], the results inferred present that EVA discoloration, back sheet burnt, and snail trails are the most prominent defects observed in PV modules with high severity. In addition, similar plants in nearby locations are analyzed to understand the defects and failures. However, the other plants in the same hot, semi-arid climate are not much affected. Finally, the conclusion of the study with the corrective measures is recommended to mitigate further failure. The lifetime expectancy of the PV system is obtained by combining the degradation rate analysis and accelerated stress test results [110].
The key findings emphasize that degradation rates vary notably depending on module type, environmental conditions, and operational factors. Crystalline silicon modules generally perform better than thin-film technologies, with monocrystalline modules exhibiting lower degradation rates than polycrystalline ones. Despite this, polycrystalline silicon technology is deemed the most appropriate choice for temperate climates. These findings highlight the importance of tailored monitoring and maintenance strategies to minimize degradation and optimize PV system efficiency. In [60], the authors listed open-ended questions for the researchers to work on the reliability of solar cells. The research questions are: Which degradation model is most appropriate? Is the degradation reversible or permanent? Can the damage be mitigated at higher temperatures? How does the degradation rate vary with the cell’s operating conditions? By considering several factors like PV system architecture, weather conditions, and quality of materials, a failure rate model for PV systems is proposed for reliability study. From this study, it is observed that there is a lot of scope in this field for researchers to explore and propose novel models for reliability studies.
5. Recycling of PV Panel
PV modules have both hazardous and priceless components that, if improperly disposed of, could endanger the safety of humans and the environment. Even though most of the PV panels will continue to generate power even after 25 years, their efficiency will be very low. It is projected that by 2050, there will be around 78 million metric tons of PV panel waste globally. Reusing PV panels after their lifespan could reduce the possibility of environmental contamination from landfills, as discussed in [111,112,113,114]. In Figure 16a, the non-functional solar panels are situated on the rooftop of the building and require disposal in an environmentally safe manner. A few currently laboratory-practiced solar panel recycling methodologies are presented in Figure 16b. Additionally, the procedures involved in various recycling technologies are presented in Figure 16c.
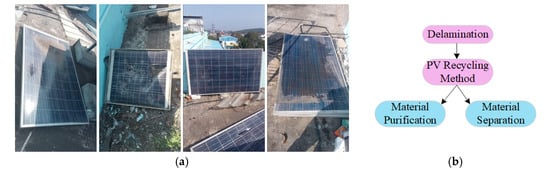
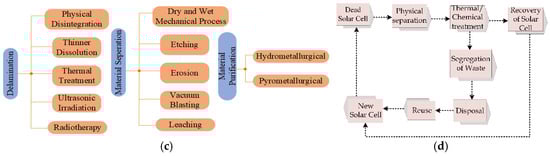
Figure 16.
(a) Dead solar cells placed in the rooftop (b) PV panel recycling methodologies (c) Steps involved in recycling methodologies (d) Steps involved in the disposal of solar panels.
These methods are, as of now, not commercially available due to various reasons, like the fact that not all countries have the infrastructure for the process; very few countries have only limited facilities. The process is complex and generates a lot of dust. It is also a source of noise pollution, and the chances of harmful gases being released during the process are hazardous to human health. Figure 16d illustrates the plan for separating and disposing of dead solar panels [115]. In the absence of effective and safe recycling mechanisms, solar PV equipment that is broken, malfunctioning, or obsolete may be disposed of in landfills. To make the disposal eco-friendly, first, the glass, aluminum, and other components are separated. After chemical and thermal treatment, the solar cell is recovered and used for the manufacturing of new solar cells.
6. Prognostics and Heath Management (PHM)
This section outlines methods for projecting a system’s behavior in the future and calculating its remaining usable life to create a solar PV system maintenance schedule. PHMs goal is to determine the system’s overall health. The diagnosis enables the damaged component to be located and identified when a failure is discovered. The prognosis attempts to forecast the system’s condition heading ahead. The PHM cycle consists of the following seven layers: data processing, data acquisition, condition identification, diagnosis, prognosis, decision-making, and human-machine interaction. In [116], two systems at NRELs Outdoor Test Facility with a power output of around 1.1 kWP were observed. Systems 1 and 2 were observed for 6 and 1.5 years, respectively. The disparity pertaining to the performance of the artificial neural network model and the practical PV system was used to track each photovoltaic system’s health.
7. Inference from the Study
Intensity of radiation, efficiency, land requirement, transmission of power, and levelized cost are the major challenges of large-scale solar PV systems. The main challenge faced in the production of solar panels is limited availability and supply chain disruption of silver and aluminum for making frames and the main raw material, i.e., silicon, for the manufacturing of solar PV panels. In the following section, the inference from the study carried out with respect to challenges faced in the installation of utility PV plants and research opportunities in those areas is made.
- (i)
- Solar cell: Solar cell companies are growing with remarkable innovations such as thin-film solar cells, dye-sensitized solar cells, multi-junction solar cells, and perovskite solar cells. However, the challenges in material science involved finding scope for ongoing research in this field.
When compared to typical silicon PV cells, a tandem cell may produce a maximum power of approximately three times higher [117]. Solar energy has grown quickly in the last few years due to the rising need for sustainable energy. However, because it is so dependent on the environment, research and development are still being conducted to increase solar cell efficiency [118]. Another major problem with third- to fifth-generation solar cells is the cost of the single-crystal substrate [119]. Manufacturer faults at the cell edges or in the PN junction can result in voltage drops and losses in energy generation [120].
- (ii)
- Forecasting technique: A predictive maintenance model can be obtained from forecasting and real-time sensor analysis. Researchers can work on machine learning and forecasting techniques to derive a model for predictive maintenance and the futuristic behavior of the PV system.
In [117], it is observed that for the model for predictive maintenance formulation, the solar radiance, cell, and ambient temperature are significant, especially in linear statistical analysis and machine learning forecasting techniques. The main challenge faced in predictive maintenance model formulation is the practice of costly onsite sensors. This can be overcome by taking the data from the distant site and utilizing that data as input to create a predictive maintenance model.
- (iii)
- Software tools used for the design: During the design and analysis phase of PV system installation, software tools play a crucial role in meeting various requirements, such as optimizing performance and design, ensuring high accuracy, and addressing customer needs. Proficiency in these tools enables researchers and designers to develop efficient and cost-effective system solutions. The unique features of various software given below will help to select suitable software for specific applications. Helioscope could be the better choice if 3D modeling and shade analysis are the most significant factors. PVSyst is the best option if a more comprehensive and extensive investigation is needed for that study. Concerning the estimation comparison, PVGIS seems to be precise with slight deviations from actual data. When the software’s location is distant from reality and there are significant climatic differences, PV Watts generally seems to be less accurate than PVGIS [35]. PVGIS, RETScreen, and PV watts are permitted for free operation. Particularly when the study spans several months or short durations, the software-reliant on the PVGIS irradiation database may exhibit significant inaccuracies [24]. The SAM and RET Screen results have the best overall performance. Both program variances from the real data were less than 10% [25]. The MNRE tool is designed by the ministry in the central Government of India, which facilitates the design of the solar photovoltaic system for installation in the roof. Similarly, the TEDA tool is released by the ministry in Tamil Nadu state for the design of both off-grid and on-grid PV systems.
Table 10 presents the plots generated from simulation software and its practical application. Advanced research-oriented software like MATLAB/Simulink, TRNSYS, and Plexos is used for study and research purposes. Several online tools, like Sunny Design, Aurora Solar, and SolarEdge Designer, are used for the design and selection of components.
Table 10.
Plots generated from simulation software and its analysis.
- (iv)
- Fault analysis: Fault analysis is essential to ensuring continuous and effective performance for the long term. The following challenges need to be addressed in order to reduce the failures, increase reliability, and reduce the maintenance cost.
The identification of defect types and their locations in a photovoltaic system poses a significant challenge to the prompt maintenance of the system’s performance and economy without affecting its regular operation. Activating an appropriate fault detection system can reduce damage from defective PV modules and other losses [121]. Soiling and shading are temporary failures due to external causes. Diode failure, open/closed circuits, hot spots, and delamination are permanent failures due to internal causes. Regarding fault detection and diagnosis, there is a lot of scope for research study in proposing modified and novel algorithms with deep and machine learning. Future studies can employ cutting-edge technology and the Internet of Things (IoT) to remotely monitor and diagnose PV systems. Future research might concentrate on using big datasets to predict PV failures.
- (v)
- Reliability analysis: Reliability is one of the critical factors for ensuring the persistence and effective performance of the PV system. Various factors affect the reliability of solar PV panels, like climatic conditions, cyclic thermal stress, and degradation caused by light. It is essential to create a comprehensive failure management strategy that includes determining the initial level of reliability and creating effective plans and assessments for the likely risks of failure to increase the reliability of the PV system. The system’s reliability can be improved by determining the reason for failure under experimental settings to separate potential PV system failures as discussed below.
- By considering the field data and combining it with expert opinions, the reliability model’s performance can be enhanced [122].
- To address critical faults and enhance reliability, an automatic fault monitoring and detection system needs to be developed.
- The study shows that the reliability of PV panels is affected by broken cells, solder bond failure, delamination, partial shading, discoloration, rack structure, etc., [122].
- (vi)
- Standards/codes for PV system: During installation, it is mandatory to follow the standards and codes to ensure safety and effective performance. Most of the stakeholders are unfamiliar with the standards and codes that are accessible for photovoltaic systems. Therefore, the stakeholders should be aware of the following:
- To arrange frequent meetings with stakeholders and respond to modifications made related to storage technologies for the NEC [84].
- In grid-connected standards, standards for arc faults need to be added.
- For distributed Array Electronics, qualification standards need to be implemented.
- In qualification standards for large installations, operation and maintenance standards need to be added.
- Firefighters must receive training to manage fire risks around photovoltaic installations [84].
- (vii)
- Degradation of solar PV panel: To increase the durability and reliability, the following techniques can be employed: The outcomes in [93] demonstrate the predominance of the Ethylene vinyl acetate (EVA) degradation mode, which significantly influences the rates of degradation. The short-circuit current and peak power have linear degradation with EVA discoloration. Determination of degradation of the PV module aids in assessing the reliability of the PV system [110]. The degradation rate gives a clear insight into the deterioration in the efficiency of the PV module per year. Several methods can be used to assess a PV module’s deterioration, such as infrared imaging, electrical performance testing, and visual inspection.
The total installed capacity for solar PV was roughly 50% of the estimated capacity by 2023, as per the study. Figure 17 presents the research reported, discussing the various challenges in solar PV systems. There are several barriers, including land availability, a lack of local manufacturing capacity, grid integration, protection, security challenges, and environmental factors such as dust, soiling, cooling, and cleaning, which are crucial for enhancing the effectiveness of solar photovoltaic systems. Shading and designing suitable MPPT techniques, advances in PV systems necessitating standards and policies, and requirements for suitable materials are impeding the growth of utility-scale solar PV systems investigated in [123,124,125,126,127,128,129,130,131,132,133,134,135,136,137,138,139,140,141,142,143,144,145,146,147,148,149,150,151,152].
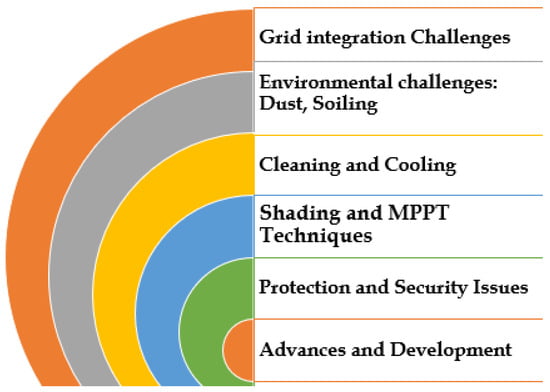
Figure 17.
Annals of articles reported in the literature regarding barriers to large PV installation.
This review paper aims to provide a brief history, available materials, and the efficacy of solar cells for PV systems with current technologies. Also, this study provides a comprehensive look at the different modeling tools employed to simulate and enhance the performance of renewable energy projects. This paper discusses several types of software tools for analyzing PV solar plants. These tools can investigate the technical, financial, and meteorological data to install solar plants that meet specific needs. Researchers are motivated to use these tools for studying the performance of renewable energy systems. This article will act as a guideline for the performance analysis of the commissioned PV plant.
A 100 kW and 140 kW PV plant in a university is considered for executing the performance ratio analysis. The expected performance ratio is 70–80%, whereas the 100 kW PV plant gives a performance ratio of 57% for the location 12.8259° N, 80.0395° E in India. A simple back period and lifecycle costing of a 100 kW PV plant is carried out. Furthermore, the barriers to installing utility PV plants are discussed by conducting a study in the areas of fault diagnosis, reliability issues, degradation, and recycling of PV panels. This work also provides insight into the PV system design and performance ratio analysis. This study will benefit solar PV system manufacturers, academics, research scholars, and decision-makers.
Author Contributions
D.N.J., B.K., L.A. and J.S.: Conceptualization, Methodology, Visualization, Investigation, Writing—Original draft preparation, C.N.S.K., P.V. and A.O.H.: Project administration, Supervision, Resources, Writing—Review and Editing. All authors have read and agreed to the published version of the manuscript.
Funding
This work was supported by the Science and Engineering Research Board, a statutory body of the Department of Science and Technology (DST), Government of India, under Grant TAR/2022/000028.
Data Availability Statement
No data are associated with this work.
Conflicts of Interest
The authors declare no conflicts of interest.
References
- Agarwal, U.; Rathore, N.S.; Jain, N.; Sharma, P.; Bansal, R.C.; Chouhan, M.; Kumawat, M. Adaptable pathway to net zero carbon: A case study for Techno-Economic & Environmental assessment of Rooftop Solar PV System. Energy Rep. 2023, 9, 3482–3492. [Google Scholar]
- IEA Report. Available online: https://www.iea.org/reports/electricity-market-report-2023/executive-summary (accessed on 13 August 2024).
- Wang, X.; Gao, X.; Wu, Y. Comprehensive analysis of tropical rooftop PV project: A case study in nanning. Heliyon 2023, 9, e14131. [Google Scholar] [CrossRef] [PubMed]
- PV Magazine. Available online: https://www.pv-magazine.com/ (accessed on 13 August 2024).
- Rehan, M.A.; Ali, M.; Sheikh, N.A.; Khalil, M.S.; Chaudhary, G.Q.; Rashid, T.U.; Shehryar, M. Experimental performance analysis of low concentration ratio solar parabolic trough collectors with nanofluids in winter conditions. Renew. Energy 2018, 118, 742–751. [Google Scholar] [CrossRef]
- Allouhi, A.; Amine, M.B.; Saidur, R.; Kousksou, T.; Jamil, A. Energy and exergy analyses of a parabolic trough collector operated with nanofluids for medium and high temperature applications. Energy Convers. Manag. 2018, 155, 201–217. [Google Scholar] [CrossRef]
- Dena, J.A.; Díaz-Ponce, A.; Delgado-Flores, J.C.; Olvera-González, E.; Escalante-García, N.; Velasco-Gallardo, V.M. Design and Construction of a Solar Electric Plastic Extruder Machine Based on a Parabolic Trough Collector. IEEE Access 2023, 11, 124570–124583. [Google Scholar] [CrossRef]
- Abid, M.; Ratlamwala, T.A.H.; Atikol, U. Performance assessment of parabolic dish and parabolic trough solar thermal power plant using nanofluids and molten salts. Int. J. Energy Res. 2015, 40, 550–563. [Google Scholar] [CrossRef]
- He, Q.; Zeng, S.; Wang, S. Experimental investigation on the efficiency of flat-plate solar collectors with nanofluids. Appl. Therm. Eng. 2015, 88, 165–171. [Google Scholar] [CrossRef]
- Shen, T.; Xie, H.; Gavurová, B.; Sangeetha, M.; Karthikeyan, C.; Praveenkumar, P.T.; Xia, C.; Manigandan, S. Experimental analysis of photovoltaic thermal system assisted with nanofluids for efficient electrical performance and hydrogen production through electrolysis. Int. J. Hydrogen Energy 2022, 48, 21029–21037. [Google Scholar] [CrossRef]
- Abdel-Basset, M.; Mohamed, R.; Sharawi, M.; Abdel-Fatah, L.; Abouhawwash, M.; Sallam, K. A comparative study of optimization algorithms for parameter estimation of PV solar cells and modules: Analysis and case studies. Energy Rep. 2022, 8, 13047–13065. [Google Scholar] [CrossRef]
- Lai, C.S.; Jia, Y.; Lai, L.L.; Xu, Z.; McCulloch, M.D.; Wong, K.P. A comprehensive review on large-scale photovoltaic system with applications of electrical energy storage. Renew. Sustain. Energy Rev. 2017, 78, 439–451. [Google Scholar] [CrossRef]
- Şenol, M.; Abbasoğlu, S.; Kükrer, O.; Babatunde, A. A guide in installing large-scale PV power plant for self consumption mechanism. Sol. Energy 2016, 132, 518–537. [Google Scholar] [CrossRef]
- Milosavljević, D.D.; Kevkić, T.S.; Jovanović, S.J. Review and validation of photovoltaic solar simulation tools/software based on case study. Open Phys. 2022, 20, 431–451. [Google Scholar] [CrossRef]
- Traunmüller, W.; Steinmaurer, G. Solar irradiance forecasting, benchmarking of different techniques and applications of energy meteorology. In Proceedings of the EuroSun 2010, Graz, Austria, 28 September–1 October 2010; pp. 1–8. [Google Scholar]
- Magnone, L.; Sossan, F.; Scolari, E.; Paolone, M. Cloud motion identification algorithms based on all-sky images to support solar irradiance forecast. In Proceedings of the 2017 IEEE 44th Photovoltaic Specialists Conference (PVSC), Washington, DC, USA, 25–30 June 2017; pp. 1415–1420. [Google Scholar] [CrossRef]
- Ramirez-Vergara, J.; Bosman, L.B.; Wollega, E.; Leon-Salas, W.D. Review of forecasting methods to support photovoltaic predictive maintenance. Clean. Eng. Technol. 2022, 8, 100460. [Google Scholar] [CrossRef]
- Benmouiza, K.; Cheknane, A. Small-scale solar radiation forecasting using ARMA and nonlinear autoregressive neural network models. Theor. Appl. Clim. 2015, 124, 945–958. [Google Scholar] [CrossRef]
- Sward, J.; Ault, T.; Zhang, K. Genetic algorithm selection of the weather research and forecasting model physics to support wind and solar energy integration. Energy 2022, 254, 124367. [Google Scholar] [CrossRef]
- Krishnan, N.; Kumar, K.R.; Anirudh, R.S. Solar radiation forecasting using gradient boosting based ensemble learning model for various climatic zones. Sustain. Energy Grids Netw. 2024, 38, 101312. [Google Scholar] [CrossRef]
- Solanki, C.S. Solar Photovoltaics: Fundamentals, Technologies and Applications; PHI Learning: Delhi, India, 2011. [Google Scholar]
- Ahmed, A.; Bin Nadeem, T.; Naqvi, A.A.; Siddiqui, M.A.; Khan, M.H.; Bin Zahid, M.S.; Ammar, S.M. Investigation of PV utilizability on university buildings: A case study of Karachi, Pakistan. Renew. Energy 2022, 195, 238–251. [Google Scholar] [CrossRef]
- Psomopoulos, C.S.; Ioannidis, G.C.; Kaminaris, S.D.; Mardikis, K.D.; Katsikas, N.G. A Comparative Evaluation of Photovoltaic Electricity Production Assessment Software (PVGIS, PVWatts and RETScreen). Environ. Process. 2015, 2, 175–189. [Google Scholar] [CrossRef]
- Axaopoulos, P.J.; Fylladitakis, E.D.; Gkarakis, K. Accuracy analysis of software for the estimation and planning of photovoltaic installations. Int. J. Energy Environ. 2014, 5, 1. [Google Scholar] [CrossRef]
- González-Peña, D.; García-Ruiz, I.; Díez-Mediavilla, M.; Dieste-Velasco, M.I.; Alonso-Tristán, C. Photovoltaic Prediction Software: Evaluation with Real Data from Northern Spain. Appl. Sci. 2021, 11, 5025. [Google Scholar] [CrossRef]
- The Solar Labs. Available online: https://arka360.com/ (accessed on 13 August 2024).
- Aurora. Available online: https://aurorasolar.com/ (accessed on 13 August 2024).
- Helioscope Aurora. Available online: https://helioscope.aurorasolar.com/ (accessed on 13 August 2024).
- PVsyst 7.4. Available online: https://www.pvsyst.com/ (accessed on 13 August 2024).
- Bluesol. Available online: http://www.bluesolpv.com/dnnsite/default.aspx/ (accessed on 13 August 2024).
- Pylon. Available online: https://getpylon.com/en/ (accessed on 13 August 2024).
- HOMER. Available online: https://www.homerenergy.com/ (accessed on 13 August 2024).
- PV SOL. Available online: https://pvsol.software/en/ (accessed on 13 August 2024).
- PVGIS. Available online: https://joint-research-centre.ec.europa.eu/pvgis-online-tool_en (accessed on 13 August 2024).
- PV F-Chart. Available online: https://fchartsoftware.com/pvfchart/ (accessed on 13 August 2024).
- SolarEdge. Available online: https://designer.solaredge.com/ (accessed on 13 August 2024).
- Solarius. Available online: https://www.accasoftware.com/en/solar-design-software (accessed on 13 August 2024).
- Open Solar. Available online: https://www.opensolar.com/ (accessed on 13 August 2024).
- Polysun. Available online: https://www.velasolaris.com/?lang=en (accessed on 13 August 2024).
- Archelios-Suite. Available online: https://www.trace-software.com/archelios-suite/photovoltaic-pv-design-software/ (accessed on 13 August 2024).
- Solar Advisor Model. Available online: https://sam.nrel.gov/ (accessed on 13 August 2024).
- PVWatts. Available online: https://pvwatts.nrel.gov/ (accessed on 13 August 2024).
- RETScreen. Available online: https://natural-resources.canada.ca/maps-tools-and-publications/tools/modelling-tools/retscreen/7465 (accessed on 13 August 2024).
- CREST. Available online: https://www.nrel.gov/analysis/crest.html (accessed on 13 August 2024).
- Ecotect 2010. Available online: https://www.autodesk.com/ (accessed on 27 November 2023).
- SolarPro. Available online: http://spt.solar/?lang=en (accessed on 13 August 2024).
- TEDA. Available online: http://218.248.44.10:8080/AboutUs.aspx (accessed on 27 November 2023).
- MNRE. Available online: https://www.pmsuryaghar.gov.in/rooftop_calculator (accessed on 13 August 2024).
- SISIFO. Available online: https://www.sisifo.info/en/default (accessed on 13 August 2024).
- Divya Navamani, J.; Padhi, T.; Kumari, A.; Lavanya, A. Performance of 100-kW Rooftop PV Plant in Library Building—A Case Study in SRMIST. In Proceedings of the International Conference on Power Electronics and Renewable Energy Systems; Subramani, C., Vijayakumar, K., Dakyo, B., Dash, S.S., Eds.; Lecture Notes in Electrical Engineering; Springer: Singapore, 2022; Volume 795. [Google Scholar]
- Anbazhagan, G.; Navamani, D.; Anbazhagan, L.; Muthusamy, S.; Pandiyan, S.; Panchal, H.; Ramachandran, M.; Sundararajan, S.C.M.; Sadasivuni, K.K. Performance investigation of 140 kW grid connected solar PV system installed in southern region of India—A detailed case study and analysis. Energy Sources Part A Recover. Util. Environ. Eff. 2021, 45, 10472–10486. [Google Scholar] [CrossRef]
- Lavanya, A.; Navamani, D.; Geetha, A.; Ganesh, V.; Sathik, M.J.; Vijayakumar, K.; Ravichandran, D. Smart energy monitoring and power quality performance based evaluation of 100-kW grid tied PV system. Heliyon 2023, 9, e17274. [Google Scholar]
- Roy, A.; Kabir, A. Relative life cycle economic analysis of stand-alone solar PV and fossil fuel powered systems in Bangladesh with regard to load demand and market controlling factors. Renew. Sustain. Energy Rev. 2012, 16, 4629–4637. [Google Scholar] [CrossRef]
- Mulligan, C.J.; Bilen, C.; Zhou, X.; Belcher, W.J.; Dastoor, P.C. Levelised cost of electricity for organic photovoltaics. Sol. Energy Mater. Sol. Cells 2015, 133, 26–31. [Google Scholar] [CrossRef]
- Branker, K.; Pathak, M.J.M.; Pearce, J.M. A review of solar photovoltaic levelized cost of electricity. Renew. Sustain. Energy Rev. 2011, 15, 4470–4482. [Google Scholar] [CrossRef]
- Darling, S.B.; You, F.; Veselka, T.; Velosa, A. Assumptions and the levelized cost of energy for photovoltaics. Energy Environ. Sci. 2011, 4, 3133–3139. [Google Scholar] [CrossRef]
- Navamani, D.; Lavanya, A.; Geetha, A.; Ganesh, V. Pathway to investigate and assess the performance of solar ON-Grid plant. Int. J. Ambient. Energy 2022, 44, 186–200. [Google Scholar] [CrossRef]
- Abunima, H.; Teh, J.; Jabir, H.J. A New Solar Radiation Model for a Power System Reliability Study. IEEE Access 2019, 7, 64758–64766. [Google Scholar] [CrossRef]
- Sun, B.; Li, Y.; Wang, Z.; Ren, Y.; Feng, Q.; Yang, D.; Jiang, H. General Stress-Strength Interference and Gamma Process Combined Method for Space Solar Cell Components Reliability Analysis. IEEE Access 2019, 7, 80840–80848. [Google Scholar] [CrossRef]
- Bari, D.; Cester, A.; Wrachien, N.; Ciammaruchi, L.; Brown, T.M.; Reale, A.; Di Carlo, A.; Meneghesso, G. Reliability Study of Ruthenium-Based Dye-Sensitized Solar Cells (DSCs). IEEE J. Photovolt. 2012, 2, 27–34. [Google Scholar] [CrossRef]
- Abunima, H.; Teh, J. Reliability Modeling of PV Systems Based on Time-Varying Failure Rates. IEEE Access 2020, 8, 14367–14376. [Google Scholar] [CrossRef]
- Manohar, P.; Atla, C.R. Development of Predictive Reliability Model of Solar Photovoltaic System Using Stochastic Diffusion Process for Distribution System. IEEE J. Emerg. Sel. Top. Circuits Syst. 2022, 12, 279–289. [Google Scholar] [CrossRef]
- Ross, R.G. PV Reliability Development Lessons From JPL’s Flat Plate Solar Array Project. IEEE J. Photovolt. 2013, 4, 291–298. [Google Scholar] [CrossRef]
- Kashyap, S.; Pandey, R.; Madan, J.; Mohammed, M.K.A. Reliability Test of 21% Efficient Flexible Perovskite Solar Cell Under Concave, Convex and Sinusoidal Bending. IEEE Trans. Device Mater. Reliab. 2023, 23, 380–385. [Google Scholar] [CrossRef]
- Petrone, G.; Spagnuolo, G.; Teodorescu, R.; Veerachary, M.; Vitelli, M. Reliability Issues in Photovoltaic Power Processing Systems. IEEE Trans. Ind. Electron. 2008, 55, 2569–2580. [Google Scholar] [CrossRef]
- Ghosekar, I.C.; Patil, G.C. Performance Analysis and Thermal Reliability Study of Multilayer Organic Solar Cells. IEEE Trans. Device Mater. Reliab. 2019, 19, 572–580. [Google Scholar] [CrossRef]
- Nuñez, N.; Vazquez, M.; Martín, P.; Bautista, J.; Hinojosa, M.; Algora, C. Estimation of the reliability figures of space GaInP/Ga(In)As/Ge triple junction solar cells from very high temperature accelerated life tests with forward and reverse biasing. Sol. Energy Mater. Sol. Cells 2023, 259, 112454. [Google Scholar] [CrossRef]
- Yang, H.; He, W.; Wang, H.; Huang, J.; Zhang, J. Assessing power degradation and reliability of crystalline silicon solar modules with snail trails. Sol. Energy Mater. Sol. Cells 2018, 187, 61–68. [Google Scholar] [CrossRef]
- Wu, J.; Yan, S.; Xie, L. Reliability analysis method of a solar array by using fault tree analysis and fuzzy reasoning etrinet. Acta Astronaut. 2011, 69, 960–968. [Google Scholar] [CrossRef]
- Bertoncello, M.; Barbato, M.; Meneghini, M.; Artegiani, E.; Romeo, A.; Meneghesso, G. Reliability investigation on CdTe solar cells submitted to short-term thermal stress. Microelectron. Reliab. 2019, 100–101, 113490. [Google Scholar] [CrossRef]
- Moharil, R.M.; Kulkarni, P.S. Reliability analysis of solar photovoltaic system using hourly mean solar radiation data. Sol. Energy 2010, 84, 691–702. [Google Scholar] [CrossRef]
- Chang, S.-J.; Wu, C.-I.; Chang, S.-P. See-Through Si Thin-Film Tandem Solar Cell Module With Hardener. IEEE J. Photovolt. 2014, 4, 1013–1017. [Google Scholar] [CrossRef]
- Day, J.T.; Hobbs, W.J. Reliability Impact of Solar Electric Generation upon Electric Utility Systems. IEEE Trans. Reliab. 1982, R-31, 304–307. [Google Scholar] [CrossRef]
- Baranwal, K.; Prakash, P.; Yadav, V.K. A Modified Bypass Circuit for Improved Reliability of PV Module Validated With Real-Time Data. IEEE Trans. Device Mater. Reliab. 2023, 23, 187–197. [Google Scholar] [CrossRef]
- Torres, C.; Blanes, J.M.; Garrigós, A.; Marroquí, D.; Carrasco, J.A. High-Reliability Solar Array Regulator for Deep Space Exploration Micro-Satellites. IEEE Access 2023, 11, 94138–94147. [Google Scholar] [CrossRef]
- El-Banby, G.M.; Moawad, N.M.; Abouzalm, B.A.; Abouzaid, W.F.; Ramadan, E.A. Photovoltaic system fault detection techniques: A review. Neural Comput. Appl. 2023, 35, 24829–24842. [Google Scholar] [CrossRef]
- Kumar, U.; Mishra, S.; Dash, K. An IoT and Semi-Supervised Learning-Based Sensorless Technique for Panel Level Solar Photovoltaic Array Fault Diagnosis. IEEE Trans. Instrum. Meas. 2023, 72, 3521412. [Google Scholar] [CrossRef]
- Cai, G.; Zheng, X.; Gao, W.; Guo, J. Self-extinction characteristics of fire extinguishing induced by nitrogen injection rescue in an enclosed urban utility tunnel. Case Stud. Therm. Eng. 2024, 59, 104478. [Google Scholar] [CrossRef]
- Zhao, Y.; de Palma, J.-F.; Mosesian, J.; Lyons, R.; Lehman, B. Line–Line Fault Analysis and Protection Challenges in Solar Photovoltaic Arrays. IEEE Trans. Ind. Electron. 2013, 60, 3784–3795. [Google Scholar] [CrossRef]
- Pathak, S.P.; Patil, S.A. Evaluation of Effect of Pre-Processing Techniques in Solar Panel Fault Detection. IEEE Access 2023, 11, 72848–72860. [Google Scholar] [CrossRef]
- Karmakar, B.K.; Pradhan, A.K. Detection and Classification of Faults in Solar PV Array Using Thevenin Equivalent Resistance. IEEE J. Photovolt. 2020, 10, 644–654. [Google Scholar] [CrossRef]
- Platon, R.; Martel, J.; Woodruff, N.; Chau, T.Y. Online Fault Detection in PV Systems. IEEE Trans. Sustain. Energy 2015, 6, 1200–1207. [Google Scholar] [CrossRef]
- Sun, K.; Ji, X.; Shan, C.; Cheng, D.; Liang, H. Extending the flight endurance of stratospheric airships using regenerative fuel cells-assisted pressure maintenance. Renew. Energy 2024, 227, 120470. [Google Scholar] [CrossRef]
- Sarkar, S.; Bhaskar, M.S.; Rao, K.U.; Prema, V.; Almakhles, D.; Subramaniam, U. Solar PV network installation standards and cost estimation guidelines for smart cities. Alex. Eng. J. 2022, 61, 1277–1287. [Google Scholar] [CrossRef]
- International Electrotechnical Commission. Electrical Installations of Buildings-Part 7-712: Requirements for Special Installations or Locations-Solar Photovoltaic (PV) Power Supply Systems; Technical Report IEC 60364-7-712; International Electrotechnical Commission: London, UK, 2002. [Google Scholar]
- IEEE Recommended Practice for Sizing Stand-Alone Photovoltaic (PV) Systems. Available online: https://ieeexplore.ieee.org/document/9528316 (accessed on 5 December 2024).
- ISO Standards. Available online: https://www.iso.org/obp/ui/#search (accessed on 5 December 2024).
- Pillai, D.S.; Natarajan, R. A Compatibility Analysis on NEC, IEC, and UL Standards for Protection Against Line–Line and Line–Ground Faults in PV Arrays. IEEE J. Photovolt. 2019, 9, 864–871. [Google Scholar] [CrossRef]
- Kaaya, I.; Ascencio-Vásquez, J.; Weiss, K.-A.; Topič, M. Assessment of uncertainties and variations in PV modules degradation rates and lifetime predictions using physical models. Sol. Energy 2021, 218, 354–367. [Google Scholar] [CrossRef]
- Lindig, S.; Kaaya, I.; Weiss, K.-A.; Moser, D.; Topic, M. Review of Statistical and Analytical Degradation Models for Photovoltaic Modules and Systems as Well as Related Improvements. IEEE J. Photovolt. 2018, 8, 1773–1786. [Google Scholar] [CrossRef]
- Bhola, P.; Bhardwaj, S. Clustering-based computation of degradation rate for photovoltaic systems. J. Renew. Sustain. Energy 2019, 11, 014701. [Google Scholar] [CrossRef]
- Kaaya, I.; Koehl, M.; Mehilli, A.P.; de Cardona Mariano, S.; Weiss, K.A. Modeling Outdoor Service Lifetime Prediction of PV Modules: Effects of Combined Climatic Stressors on PV Module Power Degradation. IEEE J. Photovolt. 2019, 9, 1105–1112. [Google Scholar] [CrossRef]
- Ihaddadene, R.; Tabet, S.; Guerira, B.; Ihaddadene, N.; Bekhouche, K. Evaluation of the degradation of a PV panel in an arid zone; case study Biskra (Algeria). Sol. Energy 2023, 263, 111809. [Google Scholar] [CrossRef]
- Jeong, J.-S. Effect of EVA discoloration in 25-year-old single crystalline silicon photovoltaic modules operated under moderate climate. Microelectron. Reliab. 2022, 138, 114721. [Google Scholar] [CrossRef]
- Gnocchi, L.; Virtuani, A.; Ballif, C. EVA for Glass/Glass Solar PV Modules: Effect of encasulant storage conditions and process parameters. In Proceedings of the 2021 IEEE 48th Photovoltaic Specialists Conference (PVSC), Fort Lauderdale, FL, USA, 20–25 June 2021; pp. 2037–2042. [Google Scholar]
- Meng, Q.; Tong, X.; Hussain, S.; Luo, F.; Zhou, F.; He, Y.; Liu, L.; Sun, B.; Li, B. Enhancing distribution system stability and efficiency through multi-power supply startup optimization for new energy integration. IET Gener. Transm. Distrib. 2024, 18, 3487–3500. [Google Scholar] [CrossRef]
- Aboagye, B.; Gyamfi, S.; Ofosu, E.A.; Djordjevic, S. Characterisation of degradation of photovoltaic (PV) module technologies in different climatic zones in Ghana. Sustain. Energy Technol. Assess. 2022, 52, 102034. [Google Scholar] [CrossRef]
- Bansal, N.; Jaiswal, S.P.; Singh, G. Prolonged degradation and reliability assessment of installed modules operational for 10 years in 5 MW PV plant in hot semi-arid climate. Energy Sustain. Dev. 2022, 68, 373–389. [Google Scholar] [CrossRef]
- Daher, D.H.; Gaillard, L.; Ménézo, C. Experimental assessment of long-term performance degradation for a PV power plant operating in a desert maritime climate. Renew. Energy 2022, 187, 44–55. [Google Scholar] [CrossRef]
- Ameur, A.; Berrada, A.; Bouaichi, A.; Loudiyi, K. Long-term performance and degradation analysis of different PV modules under temperate climate. Renew. Energy 2022, 188, 37–51. [Google Scholar] [CrossRef]
- Aboagye, B.; Gyamfi, S.; Ofosu, E.A.; Djordjevic, S. Characterisation of visual defects on installed solar photovoltaic (PV) modules in different climatic zones in Ghana. Sci. Afr. 2023, 20, e01682. [Google Scholar] [CrossRef]
- Bouaichi, A.; Merrouni, A.A.; Hajjaj, C.; Zitouni, H.; Ghennioui, A.; El Amrani, A.; Messaoudi, C. In-situ inspection and measurement of degradation mechanisms for crystalline and thin film PV systems under harsh climatic conditions. Energy Procedia 2019, 157, 1210–1219. [Google Scholar] [CrossRef]
- Islam, I.; Bin Jadin, M.S.; Al Mansur, A.; Alharbi, T. Electrical Performance and Degradation Analysis of Field-Aged PV Modules in Tropical Climates: A Comparative Experimental Study. Energy Convers. Manag. X 2024, 24, 100719. [Google Scholar] [CrossRef]
- Islam, M.A.; Hasanuzzaman, M.; Abd Rahim, N. Investigation of the potential induced degradation of on-site aged polycrystalline PV modules operating in Malaysia. Measurement 2018, 119, 283–294. [Google Scholar] [CrossRef]
- Aboagye, B.; Gyamfi, S.; Ofosu, E.A.; Djordjevic, S. Degradation analysis of installed solar photovoltaic (PV) modules under outdoor conditions in Ghana. Energy Rep. 2021, 7, 6921–6931. [Google Scholar] [CrossRef]
- Mishra, P.R.; Rathore, S.; Varma, K.V.; Yadav, S.K. Long-term performance and degradation analysis of a 5 MW solar PV plant in the Andaman & Nicobar Islands. Energy Sustain. Dev. 2024, 79, 101413. [Google Scholar]
- Pramanick, D.; Kumar, J. Performance and degradation assessment of two different solar PV cell technologies in the remote region of eastern India. e-Prime 2024, 7, 100432. [Google Scholar] [CrossRef]
- Bansal, N.; Jaiswal, S.P.; Singh, G. Long term operational performance and experimental on-field degradation measurement of 10 MW PV plant in remote location in India. Energy Sustain. Dev. 2022, 67, 135–150. [Google Scholar] [CrossRef]
- Kumar, A.; Ganesan, H.; Saini, V.; Almujibah, H.R.; Petrounias, P.; Jeyan, J.M.L.; Sharma, S.; Agrawal, A. An assessment of photovoltaic module degradation for life expectancy: A comprehensive review. Eng. Fail. Anal. 2023, 156, 107863. [Google Scholar] [CrossRef]
- Uppal, B.; Tamboli, A.; Wubhayavedantapuram, N. Sustainable recycling technologies for Solar PV off-grid system. In E3S Web of Conferences; EDP Sciences: Les Ulis, France, 2017; Volume 23. [Google Scholar]
- Huang, W.-H.; Shin, W.J.; Wang, L.; Sun, W.-C.; Tao, M. Strategy and technology to recycle wafer-silicon solar modules. Sol. Energy 2017, 144, 22–31. [Google Scholar] [CrossRef]
- Deng, R.; Chang, N.L.; Ouyang, Z.; Chong, C.M. A techno-economic review of silicon photovoltaic module recycling. Renew. Sustain. Energy Rev. 2019, 109, 532–550. [Google Scholar] [CrossRef]
- Norgren, A.; Carpenter, A.; Heath, G. Design for Recycling Principles Applicable to Selected Clean Energy Technologies: Crystalline-Silicon Photovoltaic Modules, Electric Vehicle Batteries, and Wind Turbine Blades. J. Sustain. Met. 2020, 6, 761–774. [Google Scholar] [CrossRef]
- Jayapradha, P.; Barik, D. A Review of Solar Photovoltaic Power Utilizations in India and Impacts of Segregation and Safe Disposal of Toxic Components from Retired Solar Panels. Int. J. Energy Res. 2023, 2023, 1–11. [Google Scholar] [CrossRef]
- Riley, D.; Johnson, J. Photovoltaic prognostics and heath management using learning algorithms. In Proceedings of the 38th IEEE Photovoltaic Specialists Conference, Austin, TX, USA, 3–8 June 2012; pp. 1535–1539. [Google Scholar] [CrossRef]
- Al-Ezzi, A.S.; Ansari, M.N.M. Photovoltaic Solar Cells: A Review. Appl. Syst. Innov. 2022, 5, 67. [Google Scholar] [CrossRef]
- Kawamoto, H. Improved detachable electrodynamic cleaning system for dust removal from soiled photovoltaic panels. J. Electrost. 2020, 107, 103481. [Google Scholar] [CrossRef]
- Metaferia, W.; Schulte, K.L.; Simon, J.; Johnston, S.; Ptak, A.J. Gallium arsenide solar cells grown at rates exceeding 300 µm h−1 by hydride vapor phase epitaxy. Nat. Commun. 2019, 10, 3361. [Google Scholar] [CrossRef] [PubMed]
- Sun, C.; Xu, L.; Lai, X.; Li, Z.; He, M. Advanced Strategies of Passivating Perovskite Defects for High-Performance Solar Cells. Energy Environ. Mater. 2020, 4, 293–301. [Google Scholar] [CrossRef]
- . Shah, N.; Shah, A.A.; Leung, P.K.; Khan, S.; Sun, K.; Zhu, X.; Liao, Q. A Review of Third Generation Solar Cells. Processes 2023, 11, 1852. [Google Scholar] [CrossRef]
- Sonawane, P.R.; Bhandari, S.; Patil, R.B.; Al-Dahidi, S. Reliability and Criticality Analysis of a Large-Scale Solar Photovoltaic System Using Fault Tree Analysis Approach. Sustainability 2023, 15, 4609. [Google Scholar] [CrossRef]
- Shah, R.; Mithulananthan, N.; Bansal, R.; Ramachandaramurthy, V. A review of key power system stability challenges for large-scale PV integration. Renew. Sustain. Energy Rev. 2015, 41, 1423–1436. [Google Scholar] [CrossRef]
- Al-Shetwi, A.Q.; Sujod, M.Z. Grid-connected photovoltaic power plants: A review of the recent integration requirements in modern grid codes. Int. J. Energy Res. 2018, 42, 1849–1865. [Google Scholar] [CrossRef]
- Eltigani, D.; Masri, S. Challenges of integrating renewable energy sources to smart grids: A review. Renew. Sustain. Energy Rev. 2015, 52, 770–780. [Google Scholar] [CrossRef]
- Núñez-Reyes, A.; Rodríguez, D.M.; Alba, C.B.; Carlini, M.R. Optimal scheduling of grid-connected PV plants with energy storage for integration in the electricity market. Sol. Energy 2017, 144, 502–516. [Google Scholar] [CrossRef]
- Hernández-Callejo, L.; Gallardo-Saavedra, S.; Alonso-Gómez, V. A review of photovoltaic systems: Design, operation and maintenance. Sol. Energy 2019, 188, 426–440. [Google Scholar] [CrossRef]
- Costa, S.C.; Diniz, A.S.A.; Kazmerski, L.L. Dust and Soiling Issues and Impacts Relating to Solar Energy Systems: Literature Review Update for 2012–2015. Renew. Sustain. Energy Rev. 2016, 63, 33–61. [Google Scholar] [CrossRef]
- Pavan, A.M.; Mellit, A.; De Pieri, D. The Effect of Soiling on Energy Production for Large-Scale Photovoltaic Plants. Sol. Energy 2011, 85, 1128–1136. [Google Scholar] [CrossRef]
- Darwish, Z.A.; Kazem, H.A.; Sopian, K.; Alghoul, M.A.; Alawadhi, H. Experimental Investigation of Dust Pollutants and the Impact of Environmental Parameters on PV Performance: An Experimental Study. Environ. Dev. Sustain. 2016, 20, 155–174. [Google Scholar] [CrossRef]
- Gupta, V.; Sharma, M.; Pachauri, R.K.; Babu, K.D. Comprehensive Review on Effect of Dust on Solar Photovoltaic System and Mitigation Techniques. Sol. Energy 2019, 191, 596–622. [Google Scholar] [CrossRef]
- Jaiganesh, K.; Bharath Simha Reddy, K.; Shobhitha, B.K.D.; Dhanush Goud, B. Enhancing the efficiency of rooftop solar photovoltaic panel with simple cleaning mechanism. Mater. Today Proc. 2021, 51, 411–415. [Google Scholar] [CrossRef]
- Magdum, V.; Patil, V.; Koli, Y.; Ghatage, G.; Mahadik, S.R.; Magdum, J.J. Solar Panel Cleaning Robot. Int. Res. J. Mod. Eng. Technol. Sci. 2022, 4, 485–488. [Google Scholar]
- Nattharith, P.; Kosum, T. Development of Mobile Robot System for Monitoring and Cleaning of Solar Panels. Int. J. 2022, 16, 302–306. [Google Scholar]
- Fathi, M.; Abderrezek, M.; Grana, P. Technical and economic assessment of cleaning protocol for photovoltaic power plants: Case of Algerian Sahara sites. Sol. Energy 2017, 147, 358–367. [Google Scholar] [CrossRef]
- Jiang, Y.; Lu, L.; Ferro, A.R.; Ahmadi, G. Analysing Wind Cleaning Process on the Accumulated Dust on Solar Photovoltaic (PV) Modules on Flat Surfaces. Sol. Energy 2018, 159, 1031–1036. [Google Scholar] [CrossRef]
- Dwivedi, P.; Sudhakar, K.; Soni, A.; Solomin, E.; Kirpichnikova, I. Advanced cooling techniques of P.V. modules: A state of art. Case Stud. Therm. Eng. 2020, 21, 100674. [Google Scholar] [CrossRef]
- Siecker, J.; Kusakana, K.; Numbi, B. A review of solar photovoltaic systems cooling technologies. Renew. Sustain. Energy Rev. 2017, 79, 192–203. [Google Scholar] [CrossRef]
- Idoko, L.; Anaya-Lara, O.; McDonald, A. Enhancing PV modules efficiency and power output using multi-concept cooling technique. Energy Rep. 2018, 4, 357–369. [Google Scholar] [CrossRef]
- Mishra, N.; Yadav, A.S.; Pachauri, R.; Chauhan, Y.K.; Yadav, V.K. Performance Enhancement of PV System Using Proposed Array Topologies Under Various Shadow Patterns. Sol. Energy 2017, 157, 641–656. [Google Scholar] [CrossRef]
- Patel, H.; Agarwal, V. MATLAB-based modeling to study the effects of partial shading on PV array characteristics. IEEE Trans. Energy Convers. 2008, 23, 302–310. [Google Scholar] [CrossRef]
- Dolara, A.; Lazaroiu, G.C.; Leva, S.; Manzolini, G.; Votta, L. Snail trails and cell microcrack impact on PV module maximum power and energy production. IEEE J. Photovolt. 2016, 6, 1269–1277. [Google Scholar] [CrossRef]
- Khanaki, R.; Radzi, M.A.M.; Marhaban, M.H. Artificial neural network based maximum power point tracking controller for photovoltaic standalone system. Int. J. Green Energy 2014, 13, 283–291. [Google Scholar] [CrossRef]
- Ali, K.; Khan, L.; Khan, Q.; Ullah, S.; Ahmad, S.; Mumtaz, S.; Karam, F. Naghmash robust integral backstepping based nonlinear mppt control for a PV system. Energies 2019, 12, 3180. [Google Scholar] [CrossRef]
- Teymouri, A.; Mehrizi-Sani, A.; Liu, C.-C. Cyber security risk assessment of solar PV units with reactive power capability. In Proceedings of the IECON 2018—44th Annual Conference of the IEEE Industrial Electronics Society, Washington, DC, USA, 21–23 October 2018; pp. 2872–2877. [Google Scholar]
- Gholami, S.; Saha, S.; Aldeen, M. A cyber attack resilient control for distributed energy resources. In Proceedings of the 2017 IEEE PES Innovative Smart Grid Technologies Conference Europe (ISGT-Europe), Torino, Italy, 26–29 September 2017; pp. 1–6. [Google Scholar]
- Lore, K.G.; Shila, D.M.; Ren, L. Detecting data integrity attacks on correlated solar farms using multi-layer data driven algorithm. In Proceedings of the 2018 IEEE Conference on Communications and Network Security (CNS), Beijing, China, 30 May–1 June 2018; pp. 1–9. [Google Scholar]
- Isozaki, Y.; Yoshizawa, S.; Fujimoto, Y.; Ishii, H.; Ono, I.; Onoda, T.; Hayashi, Y. Detection of cyber attacks against voltage control in distribution power grids with PVs. IEEE Trans. Smart Grid 2015, 7, 1824–1835. [Google Scholar] [CrossRef]
- Liu, B.; Duan, S.; Cai, T. Photovoltaic DC-Building-Module-Based BIPV System—Concept and Design Considerations. IEEE Trans. Power Electron. 2010, 26, 1418–1429. [Google Scholar] [CrossRef]
- Shukla, A.K.; Sudhakar, K.; Baredar, P. A comprehensive review on design of building integrated photovoltaic system. Energy Build. 2016, 128, 99–110. [Google Scholar] [CrossRef]
- Sahu, A.; Yadav, N.; Sudhakar, K. Floating photovoltaic power plant: A review. Renew. Sustain. Energy Rev. 2016, 66, 815–824. [Google Scholar] [CrossRef]
- Uddin, M.N.; Biswas, M.; Nuruddin, S. Techno-economic impacts of floating PV power generation for remote coastal regions. Sustain. Energy Technol. Assess. 2022, 51, 101930. [Google Scholar] [CrossRef]
- Ravichandran, N.; Panneerselvam, B. Floating photovoltaic system for Indian artificial reservoirs—An effective approach to reduce evaporation and carbon emission. Int. J. Environ. Sci. Technol. 2021, 19, 7951–7968. [Google Scholar] [CrossRef]
Disclaimer/Publisher’s Note: The statements, opinions and data contained in all publications are solely those of the individual author(s) and contributor(s) and not of MDPI and/or the editor(s). MDPI and/or the editor(s) disclaim responsibility for any injury to people or property resulting from any ideas, methods, instructions or products referred to in the content. |
© 2024 by the authors. Licensee MDPI, Basel, Switzerland. This article is an open access article distributed under the terms and conditions of the Creative Commons Attribution (CC BY) license (https://creativecommons.org/licenses/by/4.0/).