Abstract
Electric power material warehouses are critical to optimizing power grid supply chains and reducing carbon emissions, aiding the power sector’s decarbonization and climate goals. Nevertheless, to our knowledge, there are no comprehensive assessments of the life cycle carbon emissions associated with storage warehouses, so the emission reduction potential of the ever-increasing number of automated technologies is still unknown. This study presents an extensive life cycle carbon footprint assessment model tailored for electric power material warehouses, and it encompasses both traditional and automated frameworks. Utilizing a process-based life cycle assessment (LCA) methodology, carbon emissions across five distinct stages are examined: storage buildings and facilities, loading and unloading, transportation, packaging, and information management systems. For this purpose, warehouses in Jiangsu Province, China, are employed as a case study. The results show that automating warehouses can achieve a reduction in total carbon emissions of 42.85% compared with traditional warehouses, with total life cycle emissions of 39,531.26 tCO2, and the transportation stage is identified as the predominant contributor. This research not only offers actionable recommendations for strategies, including renewable energy integration, intelligent control systems, and standardized packaging protocols, but also establishes a framework for future investigations of refining carbon accounting methodologies—particularly in underexplored domains such as packaging.
1. Introduction
The use of fossil fuels has greatly increased CO2 levels, making global warming a challenge confronting all humankind [1]. As a major consumer of fossil fuels, the power sector is responsible for roughly 40% of the world’s energy-related carbon emissions [2]. Unlike many other industries, the power sector has shown the potential for decarbonization at a relatively promising pace [3]. Therefore, the low-carbon transition of the power sector is expected to play a crucial role in mitigating climate change [4,5].
As an integral part of the power sector, electric power material warehouses, which store and manage grid materials and substation equipment, play a vital role in ensuring the efficient operation of electric power systems [6]. In traditional settings, warehouses are primarily designed to meet basic storage needs and optimize costs in storage, procurement, and transportation. However, the emergence of intelligent supply chains and automation technologies has redefined warehouse operations [7,8,9]. Automated warehouses, driven by advanced technologies and intelligent systems, are expected to lead to an enhanced operational efficiency and potentially lower carbon emissions.
Studies on other types of warehousing operations [10,11,12], such as oil storage units, commercial warehouse buildings, and containerization systems, have shown that specialized storage facilities significantly impact supply chain emissions, which highlights that electric power material warehouses can also contribute greatly to the decarbonization of the power sector. Despite the growing emphasis on carbon reductions, the carbon footprint assessment of electric power material warehouses from the perspective of their life cycle remains limited. Zhou et al. [13] qualitatively stress building construction as an integral part of the realization path of zero-carbon electric power material warehouses, emphasizing that independent carbon reductions should be realized through building energy savings and increased automation. Based on the carbon emission factor accounting method, Hong et al. [14] compiled a carbon accounting inventory of five links of electricity warehouses, namely, receipts, tallies, delivery, storage, and operation. These relevant studies do not clearly divide the stages of the whole life cycle, nor do they consider indirect carbon emissions from the upstream and downstream parts of the supply chain, such as equipment transportation and material disposal. On the other hand, the integration of automation technologies has been highlighted as a promising avenue for carbon reductions, as demonstrated by recent LCA studies [15,16,17], but the carbon reduction efficacy of their implementation in electric power material warehouses has not yet been quantified. Therefore, an all-inclusive carbon footprint model from the perspective of the life cycle for electric power material warehouses is needed, particularly regarding the effectiveness of automation technologies in reducing carbon emissions.
This study aimed to adopt a process-based whole life cycle method to develop a comprehensive carbon footprint accounting model for electric power material warehouses. It includes typical grid materials in electric power material warehouses, such as conductors, cables, and insulators, and it explores their significant role in power grid operations and potential variations in carbon reduction contributions due to differences in their manufacturing, transportation, and usage processes. Taking a typical electric power material warehouse located in Jiangsu, China, as a case study, this study identifies high-emission stages, evaluates the emission differences between traditional and automated warehouses, and proposes a low-carbon development pathway.
The rest of this article is organized in the following way. Section 2 introduces the life cycle carbon emission accounting model for electric power material warehouses, and it provides formulas and life cycle inventories for calculating the carbon emissions of each stage of a warehouse, including construction, operation and maintenance, dismantling, and recycling. It also provides methods of calculating carbon emission reductions from automated technologies. Section 3 depicts the carbon footprint results of each stage and identifies the high-emission stages. For each high-emission stage, the emission difference between traditional and automated storage warehouses is revealed. Section 4 discusses the advantages and limitations of the whole life cycle carbon footprint accounting model and provides an outlook on the future low-carbon development pathway of electric power material warehouses.
2. Materials and Methods
2.1. Life Cycle Assessment of Electric Power Material Warehouses
2.1.1. Goal and Scope Definition
The four interrelated stages of LCAs are specified by the ISO 14040 series: (1) goal and scope definition; (2) life cycle inventory analysis; (3) life cycle impact assessment; and (4) interpretation of the results [18]. The goal of this life cycle assessment is to quantify, evaluate, and compare the carbon footprints of traditional and low-carbon automated electric power material warehouses in Jiangsu, China. Considering the architecture of the electric power material warehouse and the material supply mode, the storage system is divided into five stages, namely, storage buildings and facilities, loading and unloading, transportation, packaging, and intelligent management and operation platforms. The carbon emissions of the storage system are closely related to its cargo throughput. Furthermore, the carbon emissions generated by each ton of goods passing through the storage system are chosen as the functional unit, i.e., kgCO2/t. The scope of this study focuses on grid materials and goods, which are widely used in transmission and distribution networks. These materials were chosen due to their prevalence in electric power warehouses and their substantial impact on the carbon emissions of the power grid supply chain.
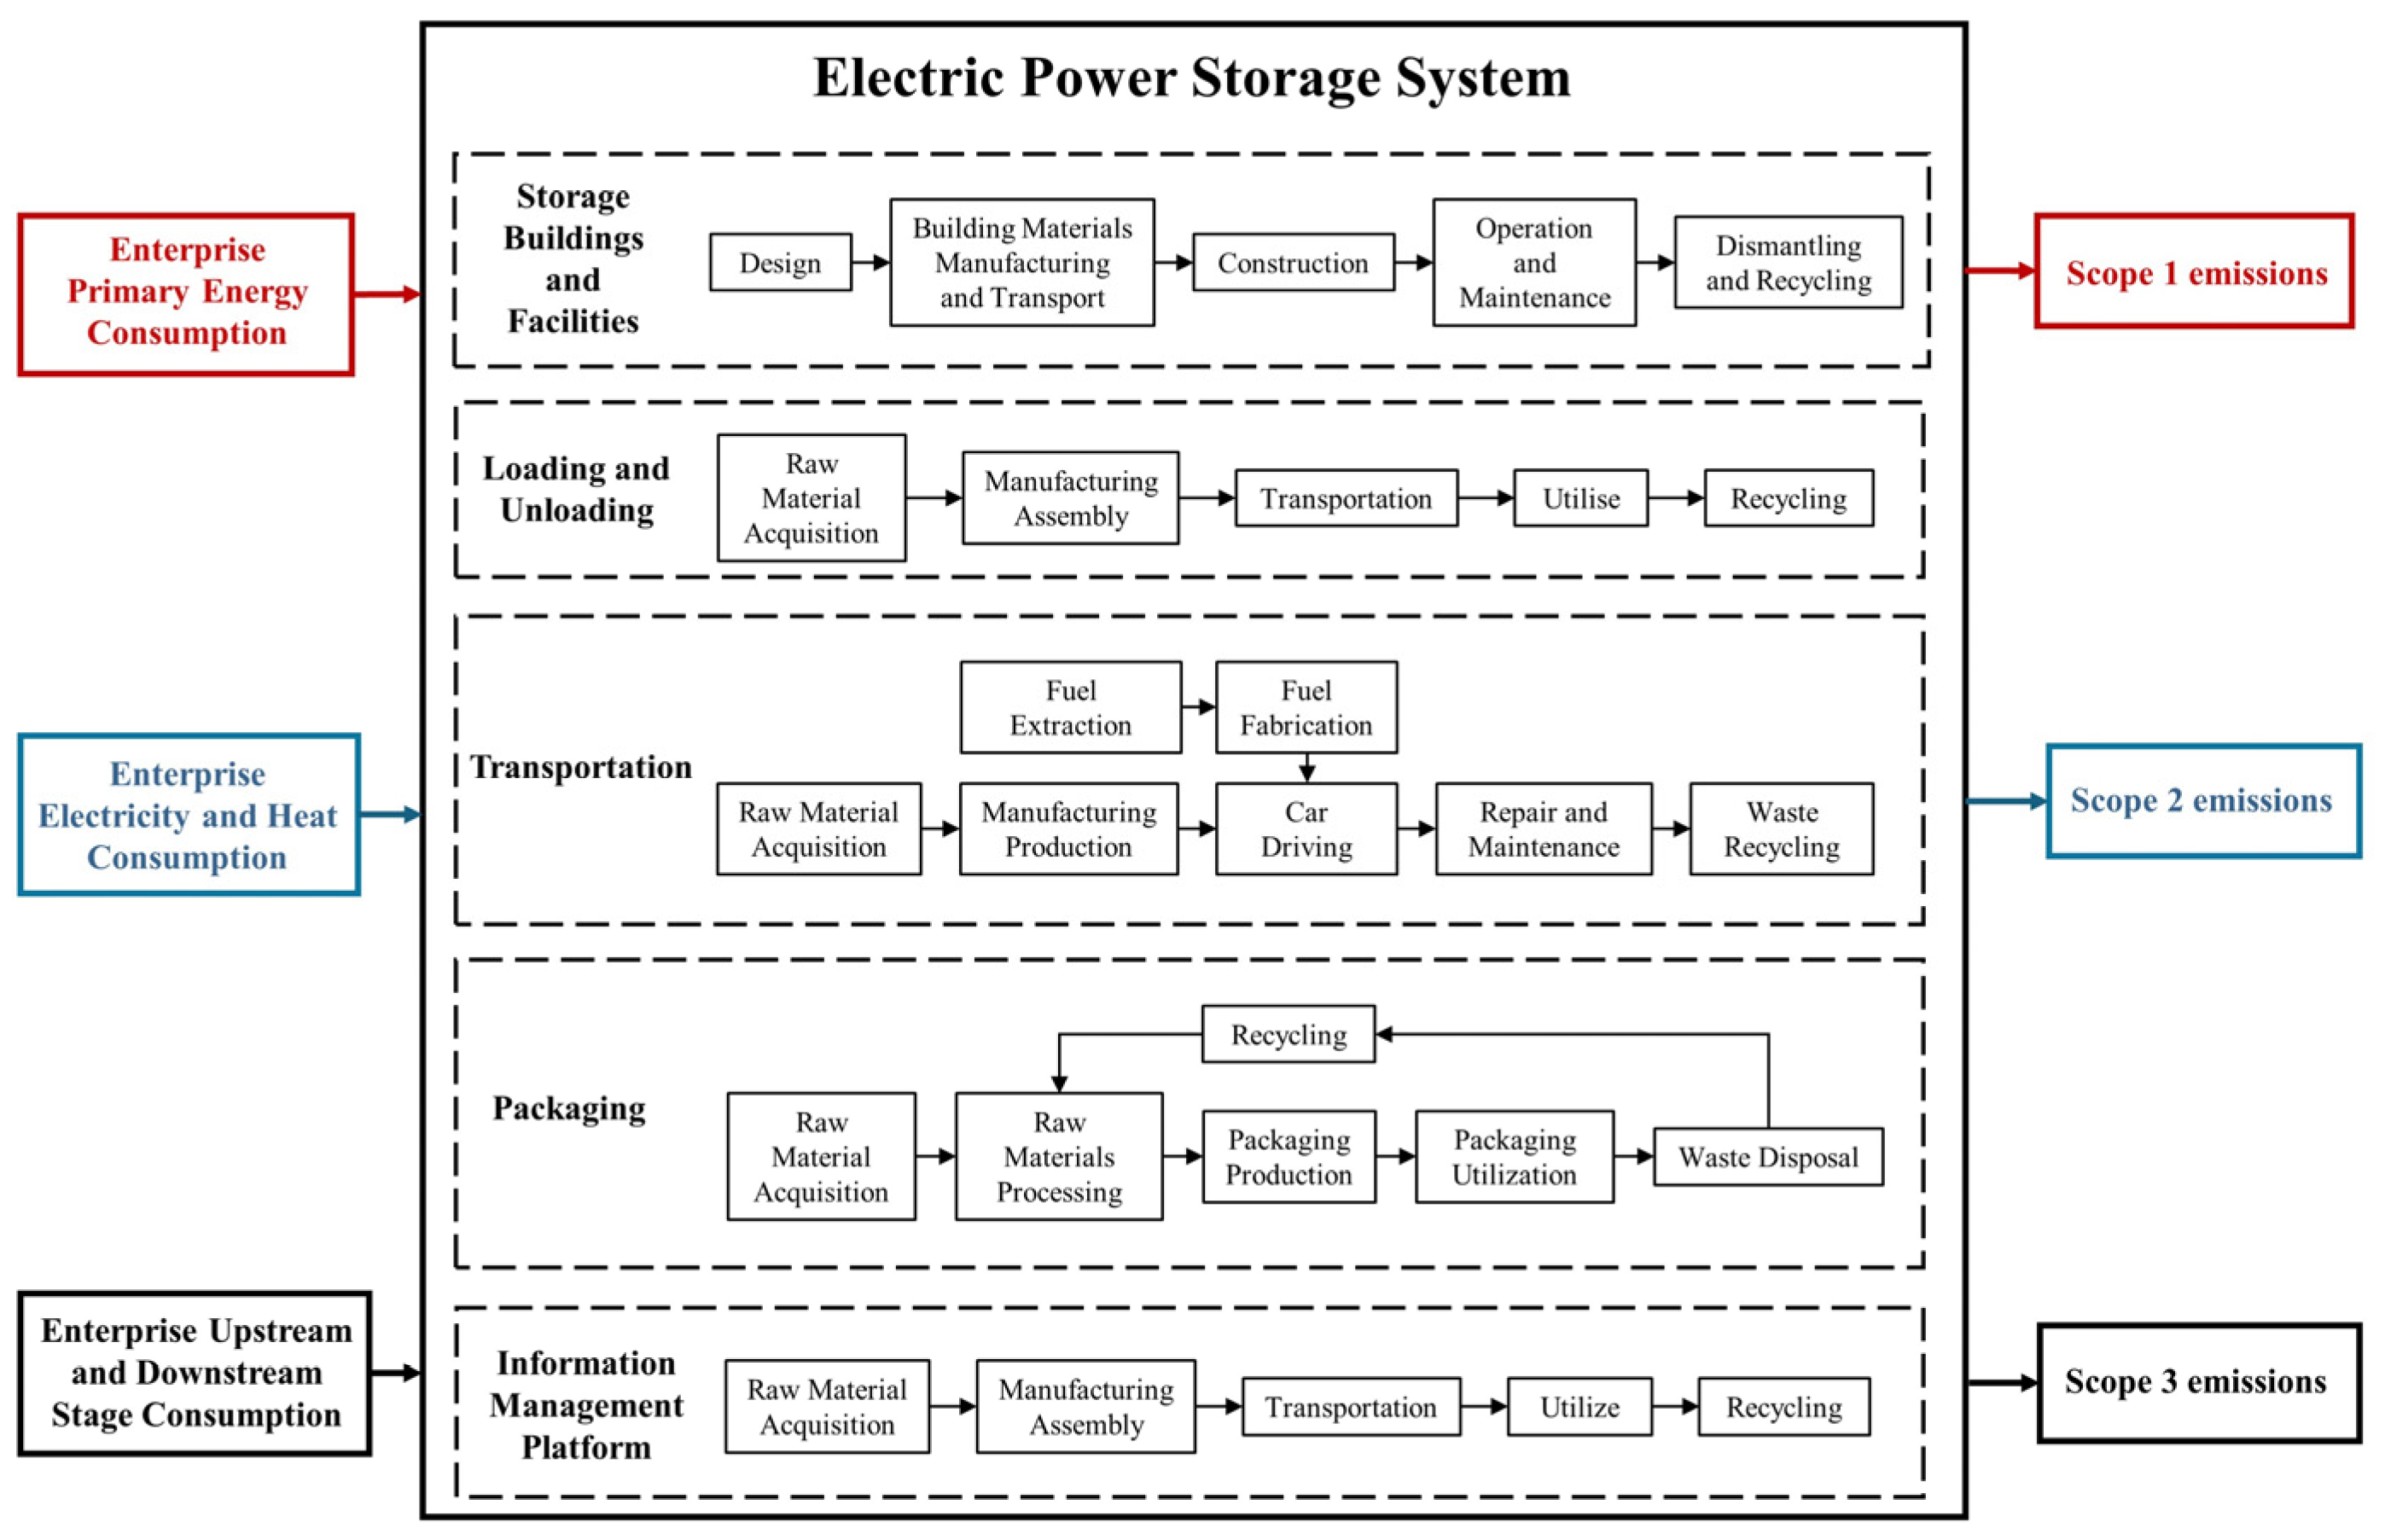
According to the GHG protocol, carbon emissions can be further divided into three scopes [19]. Scope 1 involves the direct carbon emissions generated by the burning of fossil fuels, such as diesel and gasoline, in transportation vehicles and forklifts owned by power storage enterprises; Scope 2 refers to the greenhouse gas emissions generated by the power and heat purchased during the operation of the electric power warehouse, such as lighting, air conditioning, automation equipment, and line transmission; emissions in Scope 3 are all indirect emissions occurring in the value chain of electric power storage enterprises, such as the indirect emissions caused by upstream and downstream raw material mining and manufacturing, equipment processing, material transportation and maintenance, and waste treatment and disposal.
In this study, an automated warehouse and a traditional warehouse located at the Taizhou Sudian No. 1 integrated storage–inspection–distribution base are selected as the research objects to calculate life cycle carbon emissions. The relevant basic information of the warehouses is listed in Table A1. The overall system scope and corresponding emission scope of this study are illustrated in Figure 1.
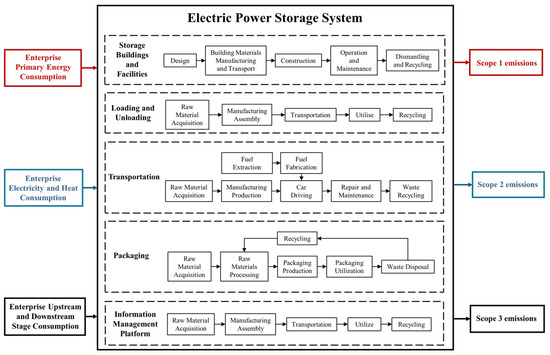
Figure 1.
Definition of the scope of an electric power material warehouse.
2.1.2. Life Cycle Inventory Analysis
Some assumptions are made to simplify the calculation process. According to the provisions of Article 12 of the Provisional Regulations of the People’s Republic of China on the Assignment and Transfer of the Use Right of State-Owned Land in Urban Areas, the use life of industrial land is 50 years, so the lifespan of the warehouse is set to 50 years. Referring to the data of the National Bureau of Statistics, the road transport distance of goods distributed in cities is usually between 10 and 200 km; in order to obtain a conservative calculation of carbon emissions, the distance of both material transport and goods transport is set to 100 km. The vehicle load rate is 86%. Based on experience with goods in the logistics industry, light goods (e.g., tissue, foam plastic) can be set as low as 20–50 kg/m3, while heavy goods (e.g., metal devices) may exceed 500 kg/m3. The average density of mixed goods is usually 100–200 kg/m3 [20], so the average density of goods is set to a median value of 150 kg/m3. The office time of warehouse personnel is set to the standard 240 h per month [21]. According to the latest adjustment issued by the Ministry of Ecology and the Environment, the electricity emission factor is set to 0.5810 tCO2/MWh, which is denoted by . The complete inventory list for each stage is listed in the Supplementary Materials (Table S1).
2.1.3. Life Cycle Carbon Footprint Accounting Model
The life cycle carbon footprint accounting model in this study is developed to quantify the greenhouse gas (GHG) emissions associated with each stage of electric power material warehouses, including storage buildings and facilities, loading and unloading, transportation, packaging, and intelligent management platforms. The calculation process is based on activity data and emission factors, with the general formula being Formula (1). The specific list of activity data and their emission factors used as input can be found in the Supplementary Materials (Table S1, the life cycle inventory list).
where represents greenhouse gas emissions from storage activities in CO2 equivalent, represents activity data, is the emission factor, and is the global warming potential of greenhouse gases.
The total life cycle GHG emissions include the GHG carbon emissions from the carbon footprints of Scopes 1, 2, and 3. The total GHG emissions are calculated using Formula (2):
where is the carbon footprint of storage buildings and facilities, is the carbon footprint of loading and unloading equipment, is the carbon footprint of goods transportation, is the carbon footprint of the packaging chain, and is the carbon footprint of management and information platforms.
- Storage buildings and facilities
- 2.
- Loading and unloading
- 3.
- Packaging
The packaging stage mainly considers the carbon emissions from the manufacturing and processing stages of the packaging materials, as there are almost no carbon emissions from the operation stage, and the recycling stage of the packaging is very complex, with different recycling strategies for different packaging materials.
where represents the carbon emissions from manufacturing and processing raw materials, represents the carbon emissions from transporting materials, represents the carbon emissions at the operation and maintenance stage, and represents the carbon emissions at the recycling stage.
- 4.
- Transportation
Carbon emissions from the transportation stage are related to the mode of transport, transport distance, transport volume, etc. Considering that the carried weight of vehicles is zero when they return from a construction site, the empty vehicle correction factor is introduced.
Intelligent management and operation platform:
where represents the carbon emissions from processing raw materials, represents the carbon emissions from server manufacturing and transportation, represents the carbon emissions from platform operation and maintenance, and represents the carbon emissions from the dismantling and recycling of the platform.
2.2. Carbon Reductions from Automated Technologies
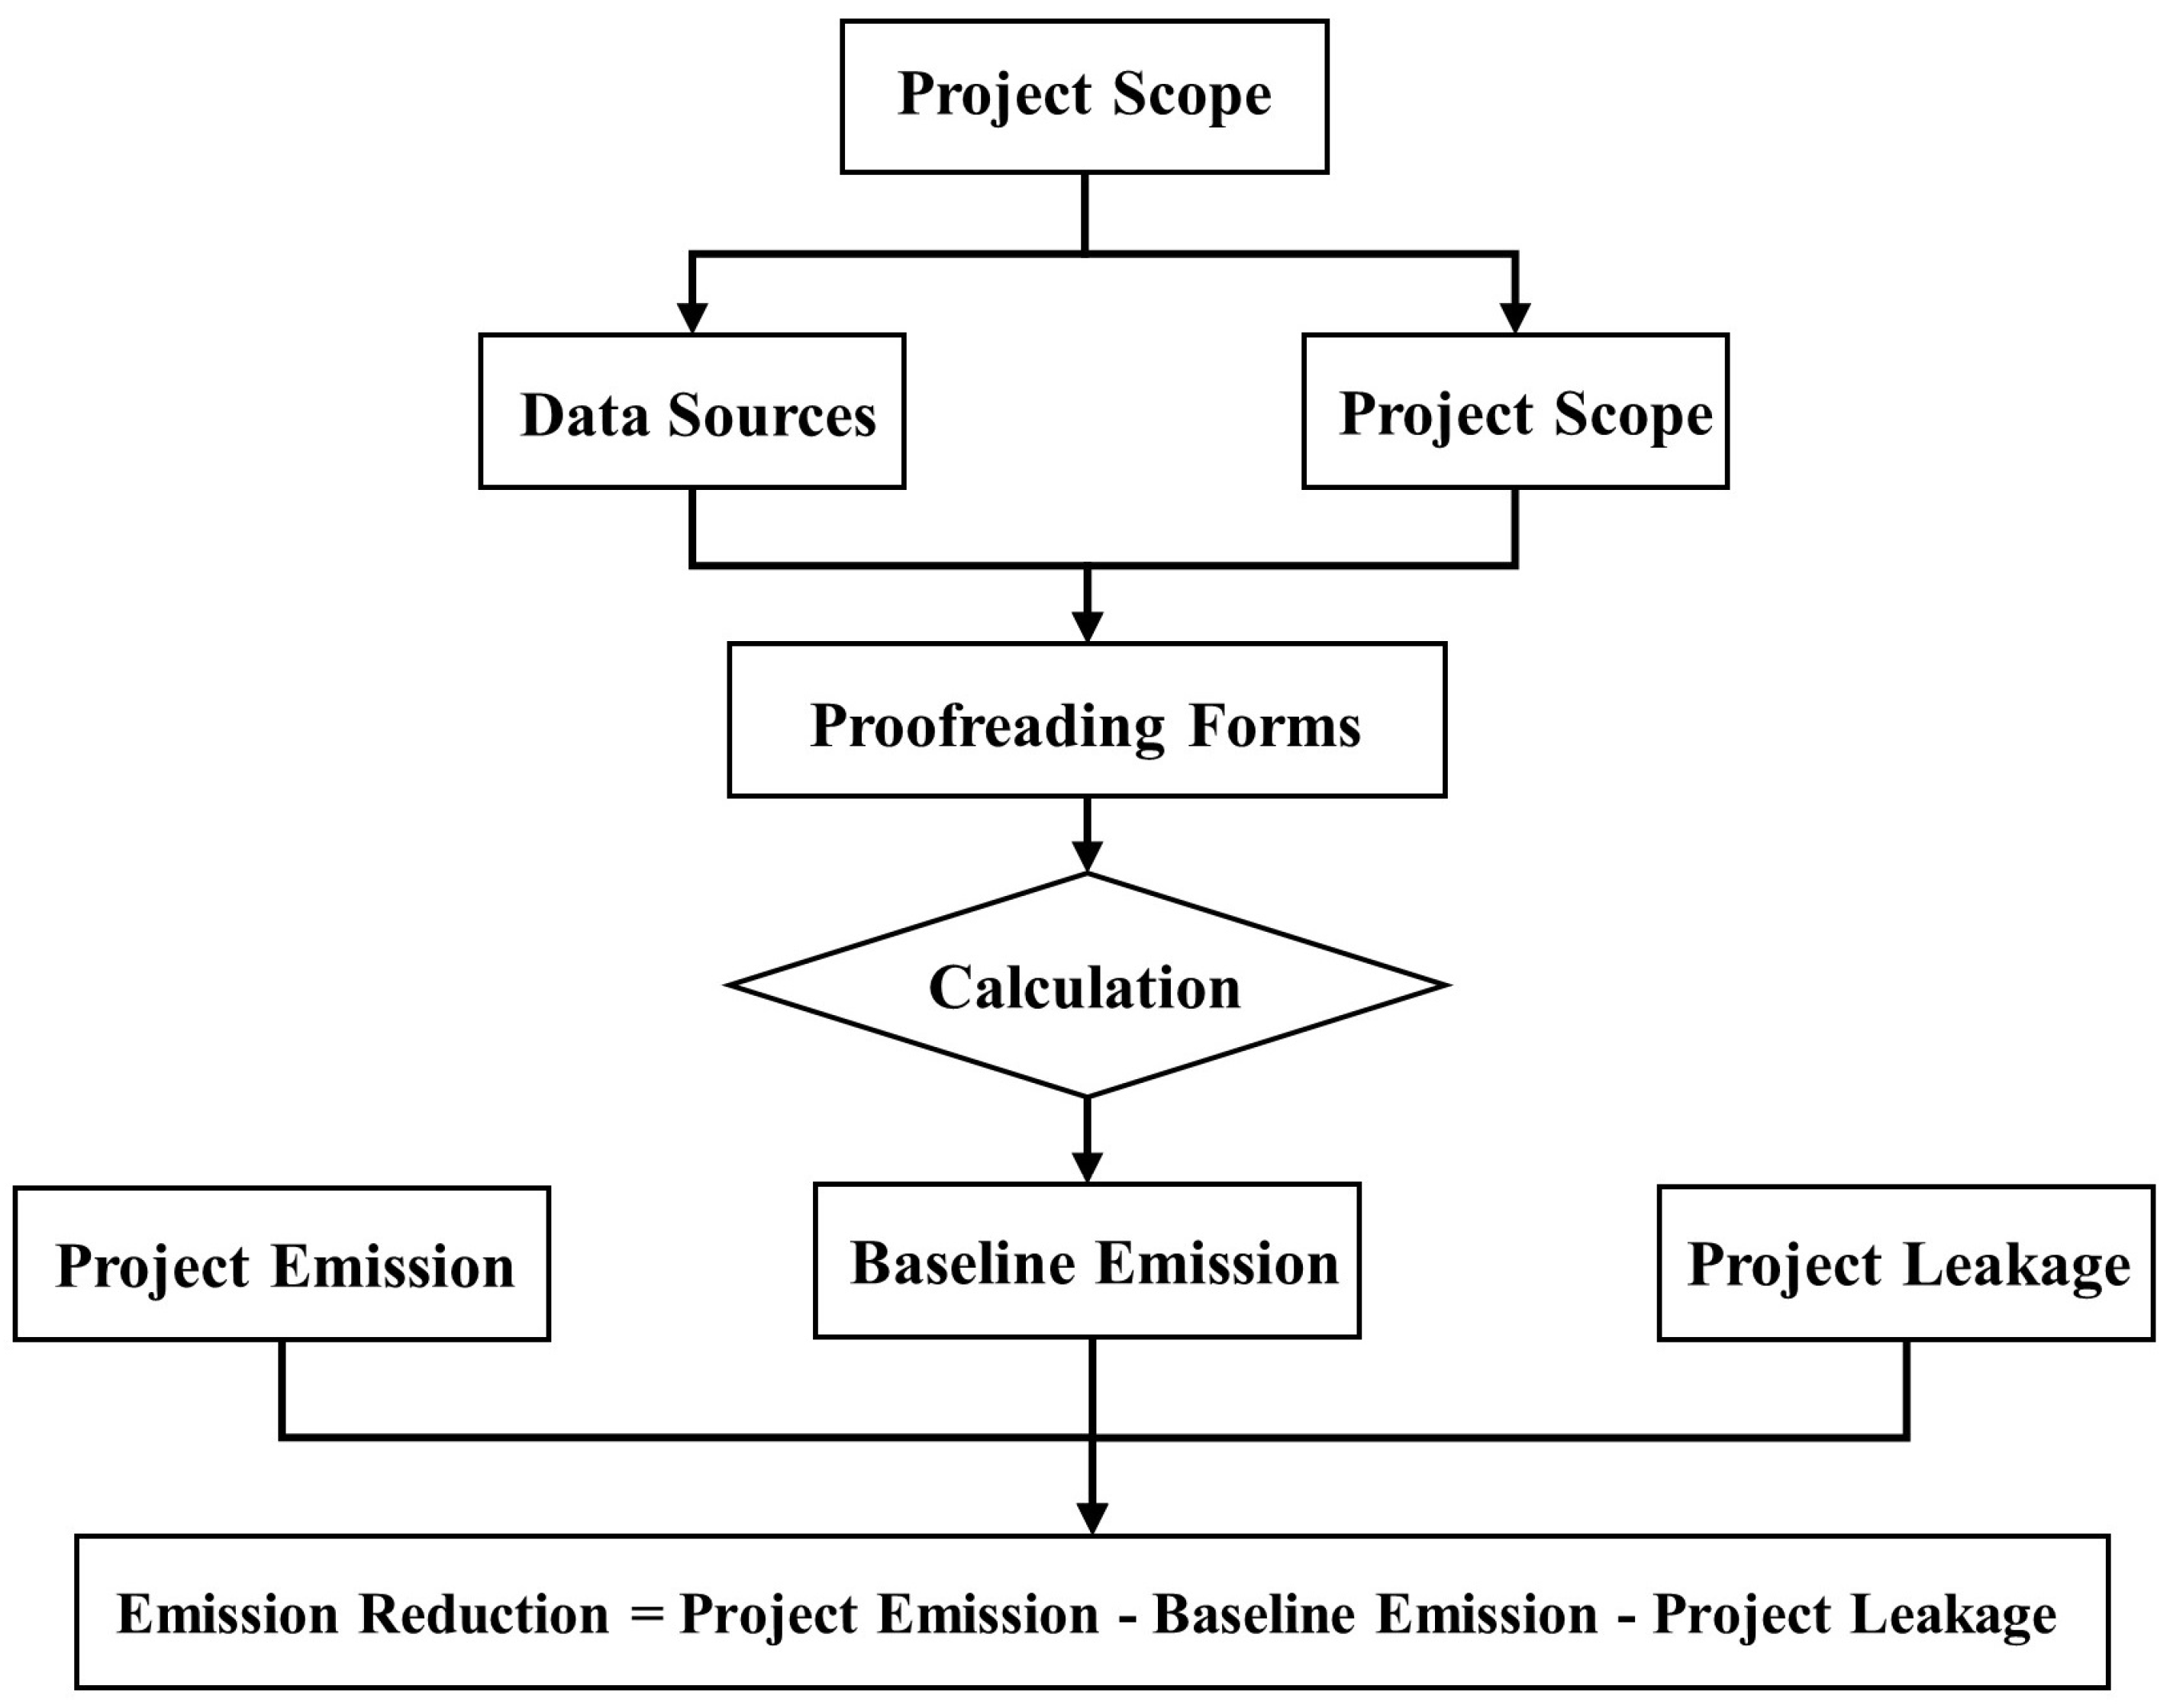
It is necessary to establish a carbon reduction accounting method to calculate the emission reduction introduced by automated technologies; thus, the difference in carbon emissions in each stage between a low-carbon automated warehouse and a traditional warehouse can be intuitively obtained. In the material manufacturing and transportation stage, an automated warehouse uses high-strength and high-durability building materials. In the construction phase, an automated warehouse uses prefabricated components produced in the factory mode, and the energy consumption in the construction phase is reasonably controlled. In the operation and maintenance phase, the automated warehouse uses rooftop photovoltaics, low-carbon lighting equipment, and intelligent management platforms [23], and it has a larger vegetation area. In the dismantling and recycling phase, automated warehouses also have greater carbon reduction potential due to the increased use of recyclable materials [24]. See Section S2 of the Supplementary Material for a detailed illustration of each operational method. The general workflow of the carbon reduction calculation is shown in Figure 2.
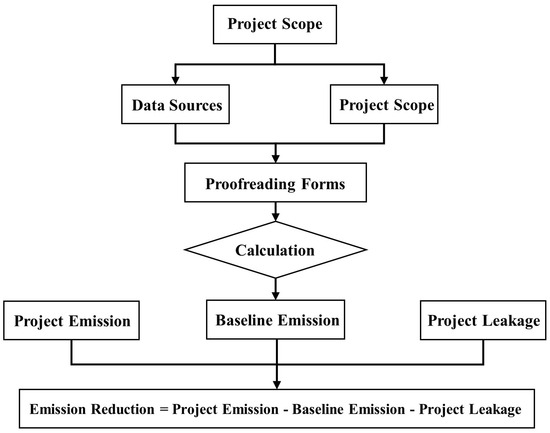
Figure 2.
Workflow of the carbon emission reduction calculation.
3. Results and Discussion
3.1. Life Cycle Carbon Footprint Comparison
The results of the life cycle carbon emission factor comparison in different warehouse operation stages are shown in Figure 3; the obtained carbon emission results are listed in Table A2. It is found that the carbon footprint of automated low-carbon warehouses is lower than that of traditional warehouses in terms of warehouse facilities, operating equipment, transportation, and intelligent management platforms and that a series of measures taken by automated warehouses could reduce total carbon emissions by about 42.85%. The automated warehouse has lower emissions in the storage facilities and the transportation stage due to the availability of energy-efficient equipment, reduced empty load rates, and better space utilization. The transportation stage has the highest carbon emissions because it involves direct carbon emissions that fall under Scopes 1 and 2.
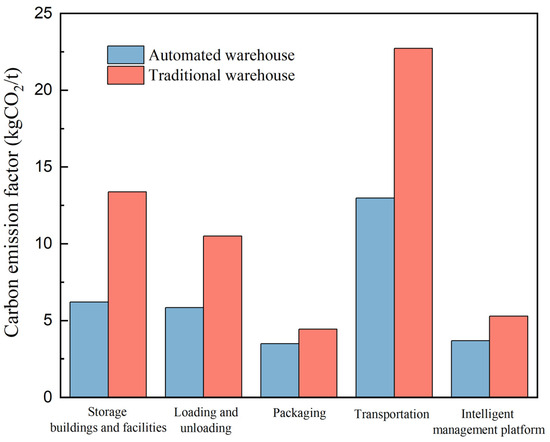
Figure 3.
Carbon emission composition of automated and traditional warehouses.
The five stages of the storage system are analyzed in more detail in Section 3.2. Since the current packaging method in power supply warehouses is not standardized, packaging data are difficult to obtain, and only the percentages of different packaging methods in the warehouses were collected.
3.2. Carbon Reduction Pathways
3.2.1. Storage Buildings and Facilities
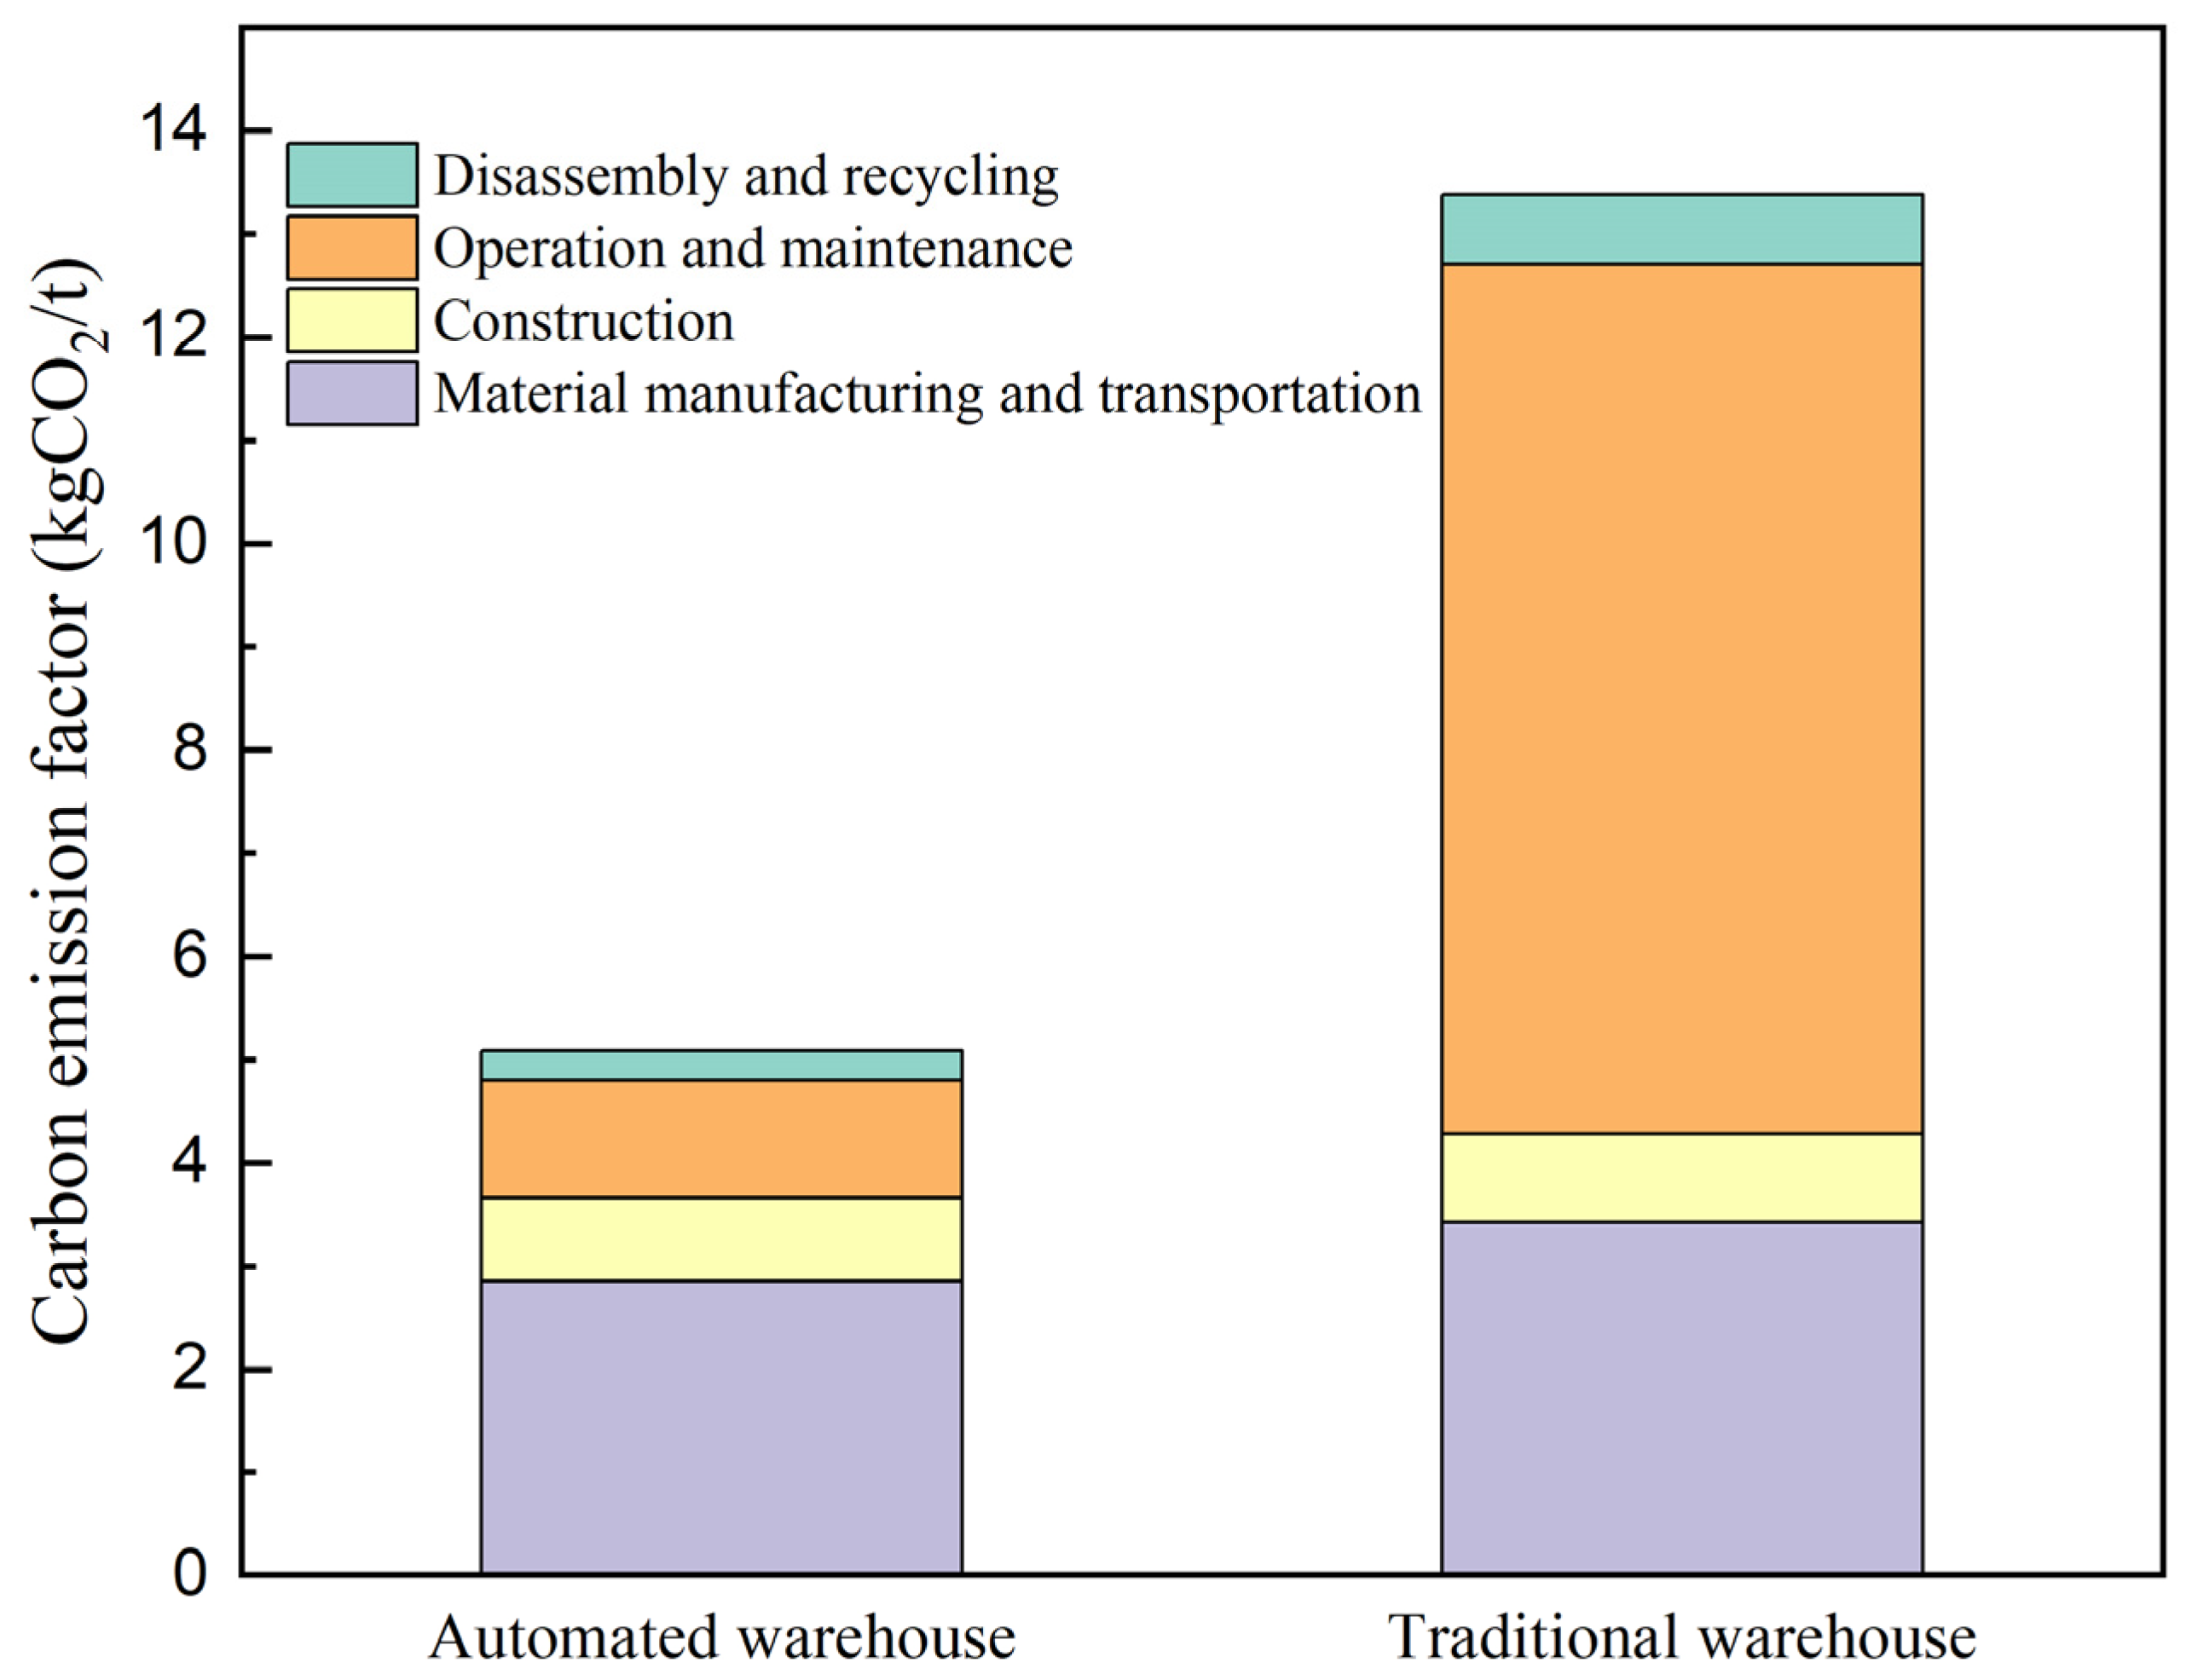
According to Figure 4, the carbon emissions of material manufacturing and transportation and the operation and maintenance of building facilities account for the largest parts of carbon emissions, which are 26% and 63% for traditional warehouses and 39% and 43% for automated warehouses, respectively, and there is little difference in carbon emissions in the design and disassembly stages.

Figure 4.
Carbon emission factors for storage buildings and facilities.
Automated warehouses demonstrate a more sustainable profile by using high-strength, durable materials and prefabricated components, which lower emissions during construction and operation. Intelligent control systems for lighting and air conditioning contribute to operational efficiency, resulting in substantial reductions in emissions under Scope 2.
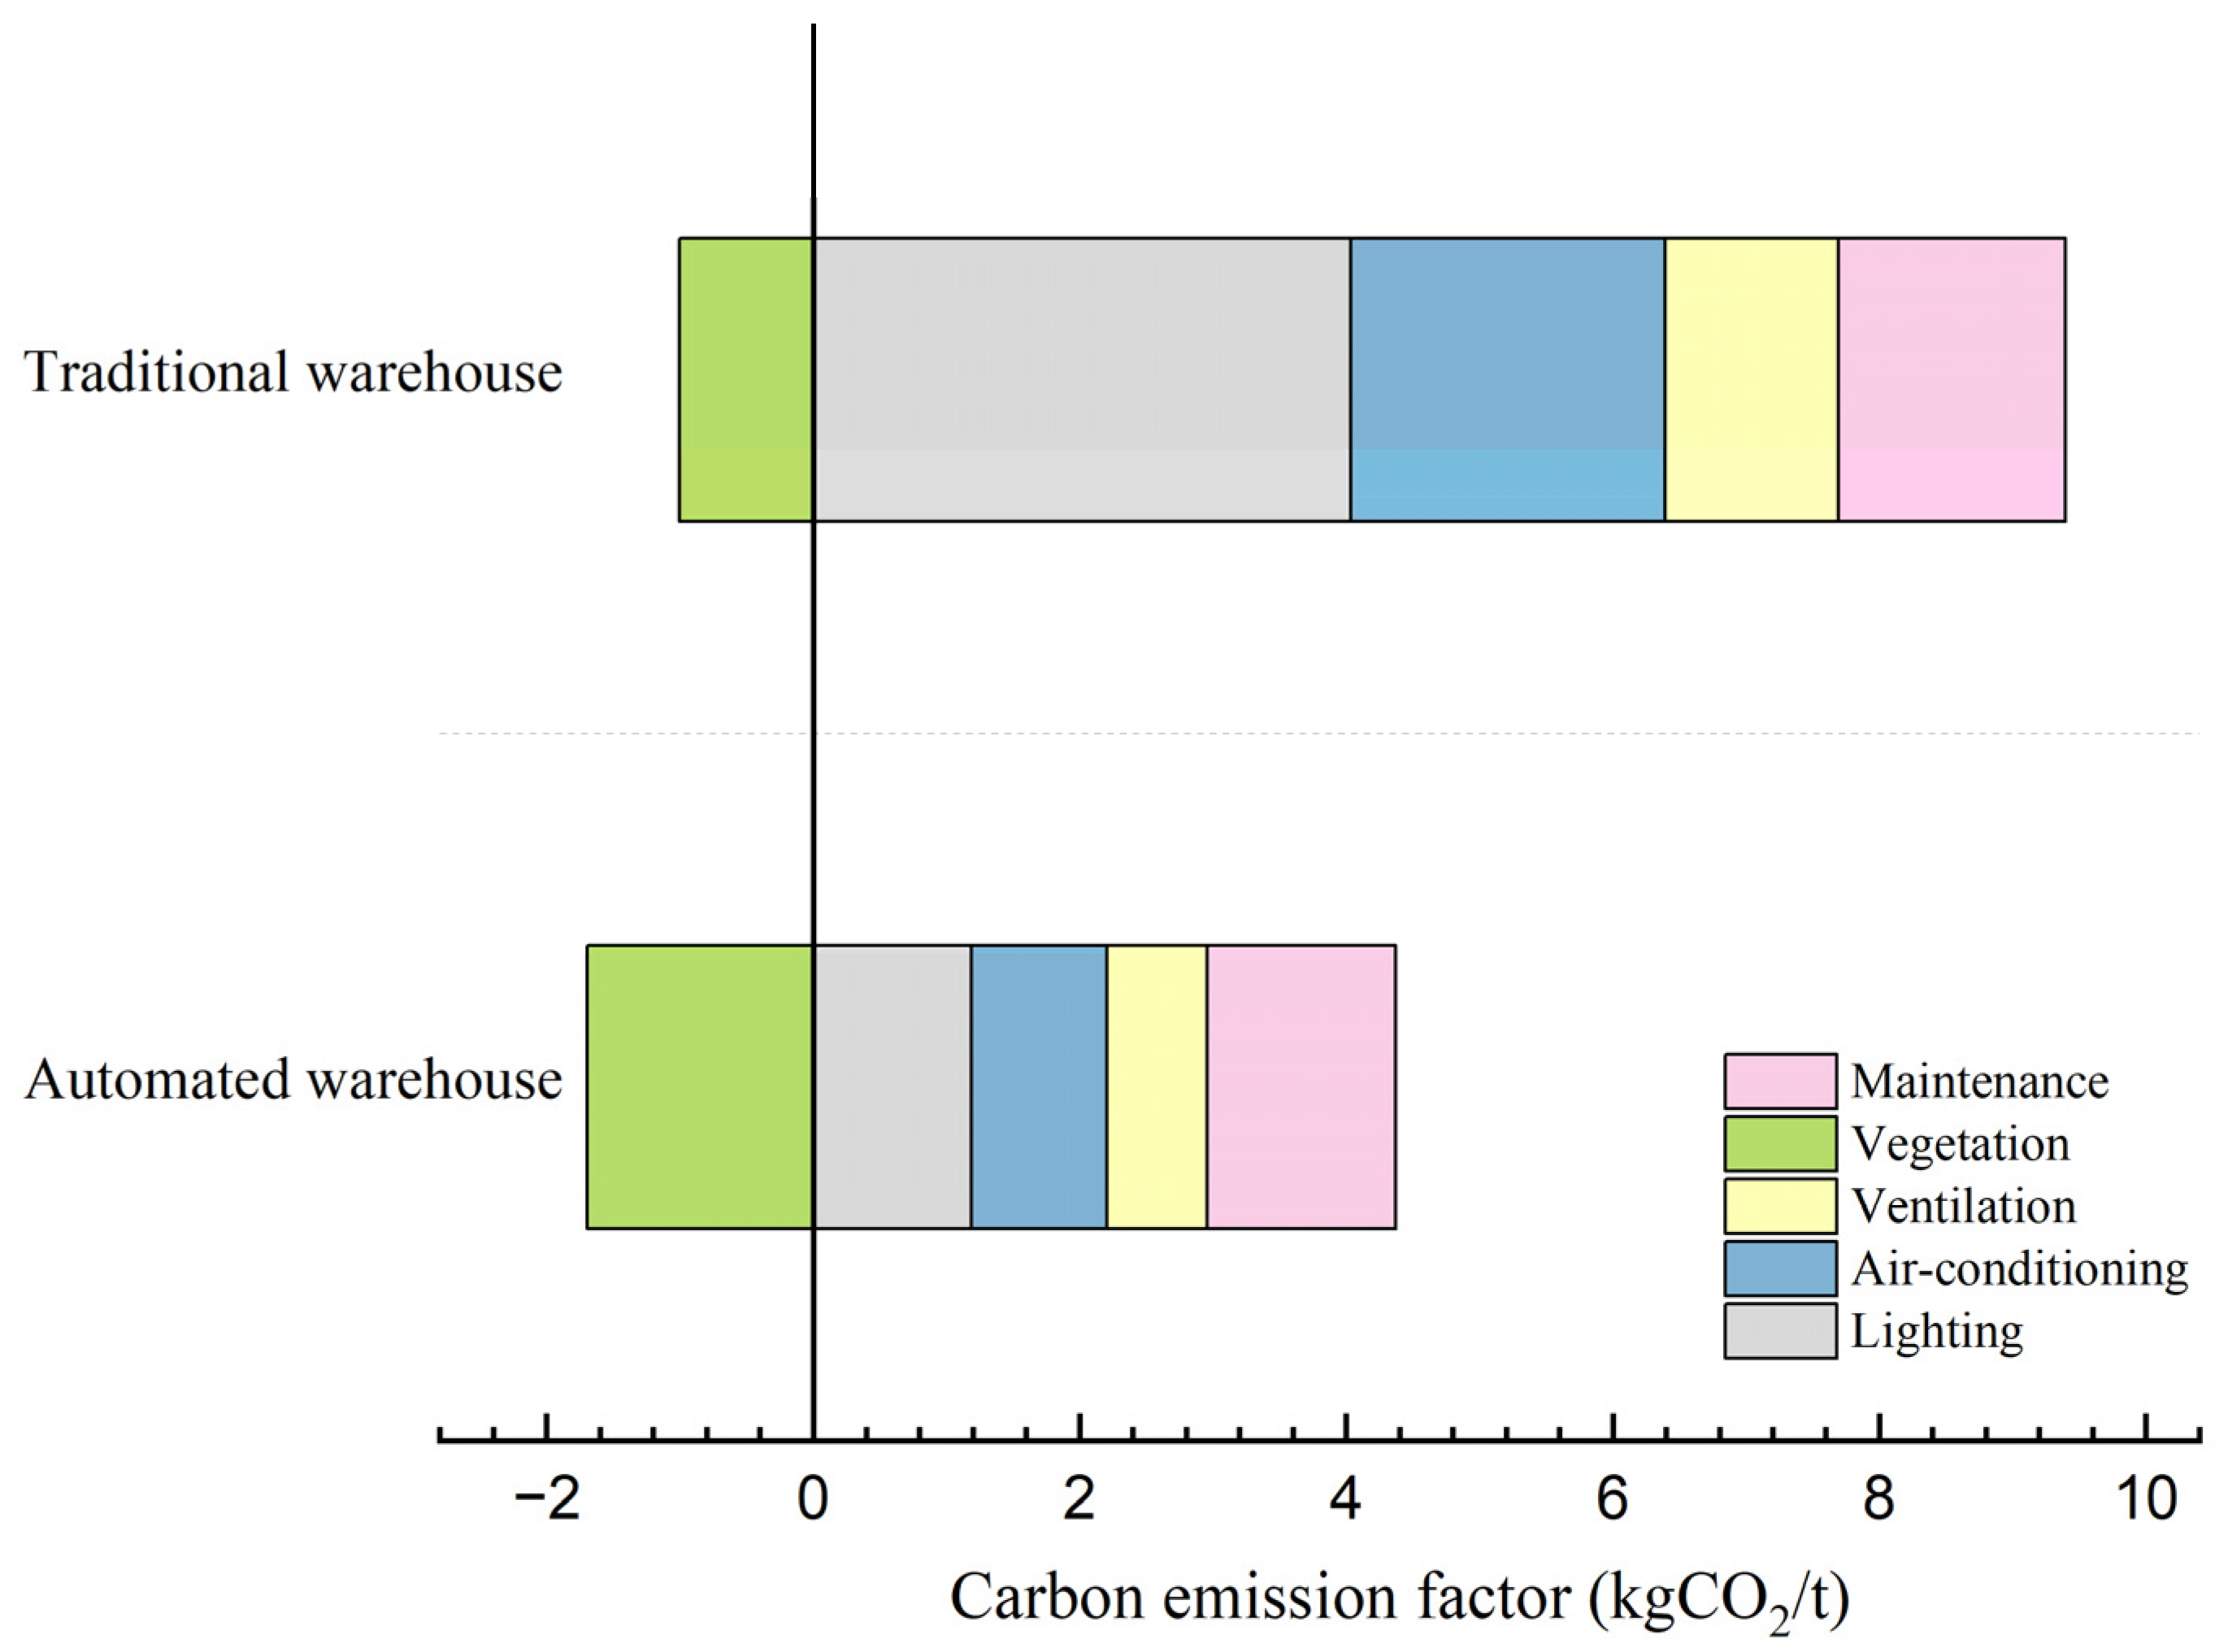
Additionally, the carbon emission factors of specific components within the operation and maintenance of building facilities are further calculated (Figure 5). Vegetation, ventilation, air conditioning, and lighting are considered in the operation stage. The total carbon emission factors during the operation and maintenance stage of traditional warehouses are close to 8.39 kgCO2/t, compared with 2.68 kgCO2/t for automated warehouses. In terms of air conditioning and lighting, the carbon emissions of automated warehouses are significantly lower than those of traditional warehouses due to the use of intelligent control systems and more energy-efficient LED lamps or lighting systems.
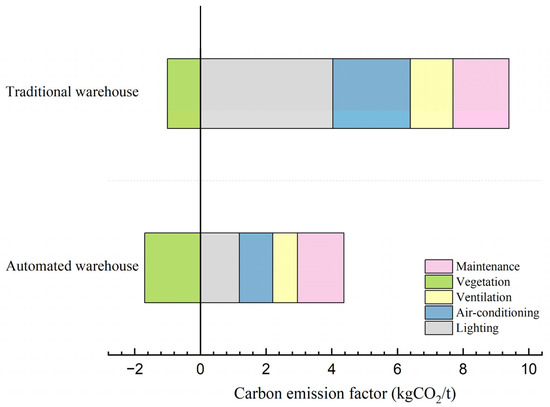
Figure 5.
Carbon emission factors of the operation and maintenance stage.
3.2.2. Loading and Unloading
The carbon emissions of loading and unloading equipment in automated and traditional warehouses are listed in Table 1 and Table 2. According to the calculation, automated warehouses reduce carbon emissions by 3.22 kgCO2/t, accounting for about 44.37% of the total carbon emissions of traditional warehouses.

Table 1.
Carbon emissions of loading and unloading equipment in automated warehouses.
Table 2.
Carbon emissions of loading and unloading equipment in traditional warehouses.
The results show that the adoption of energy-efficient equipment such as AGVs and optimized electric forklifts leads to a substantial reduction in emissions compared with traditional methods. Automated systems minimize operational inefficiencies and leverage advanced technology to reduce energy consumption.
3.2.3. Packaging
Three main types of packaging are considered, namely, trays, crates, and corrugated boxes. Since most current electric power storage enterprises do not have standardized packaging or even have no packaging, enterprises can choose whether to calculate the carbon emissions of the packaging process according to their own circumstances; the proportion of the weight of goods is estimated in this case. The carbon emissions of packaging methods in traditional and automated warehouses are listed in Table 3 and Table 4. According to the calculation, the carbon emissions in the packaging stage of an automated warehouse are 4284.24 tCO2, and the carbon emission factor is 3.49 kgCO2/t, which indicates a reduction in emissions in the packaging stage of 21.25% compared with a traditional warehouse through the use of recyclable and lightweight materials.
Table 3.
Carbon emissions of packaging methods in traditional warehouses.
Table 4.
Carbon emissions of packaging methods in automated warehouses.
3.2.4. Transportation
The total emission factors of the transportation stage include emissions in Scopes 1 and 2 from the use of fuel or electricity for transport, as well as emissions in Scope 3 from vehicle production, maintenance, recycling, and fuel production, as shown in Figure 6. Diesel trucks tend to be used in traditional warehouse transportation, while electric trucks are used more often in automated warehouses to reduce emissions in the transportation stage. Electric vehicles in automated warehouses cut transportation emissions by 42.9%, contributing to a 17% reduction in total emissions compared with traditional warehouses. This is primarily due to the use of electric vehicles and better logistics management, which minimizes empty-load trips and maximizes vehicle utilization rates. The carbon emission factor of traditional warehouses is significantly higher than that of automated warehouses in Scopes 1 and 2. The carbon emissions of traditional warehouses are above 18 kgCO2/t, while those of automated warehouses are only about 10 kgCO2/t. Traditional warehouses have significantly higher direct emissions and indirect emissions associated with electricity and heat power purchases, which indicates that they are less energy-efficient and may rely on high-carbon energy sources.
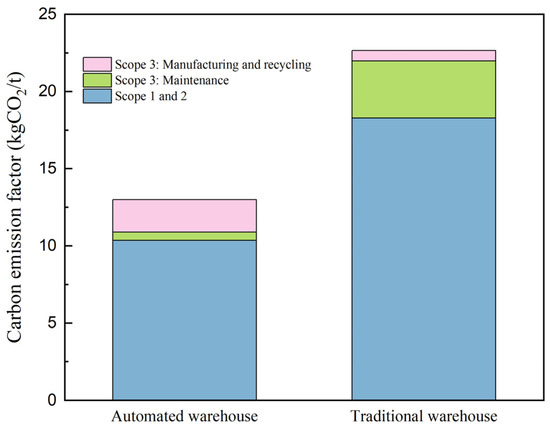
Figure 6.
Carbon emission factors of different carbon emission scopes in the transportation stage.
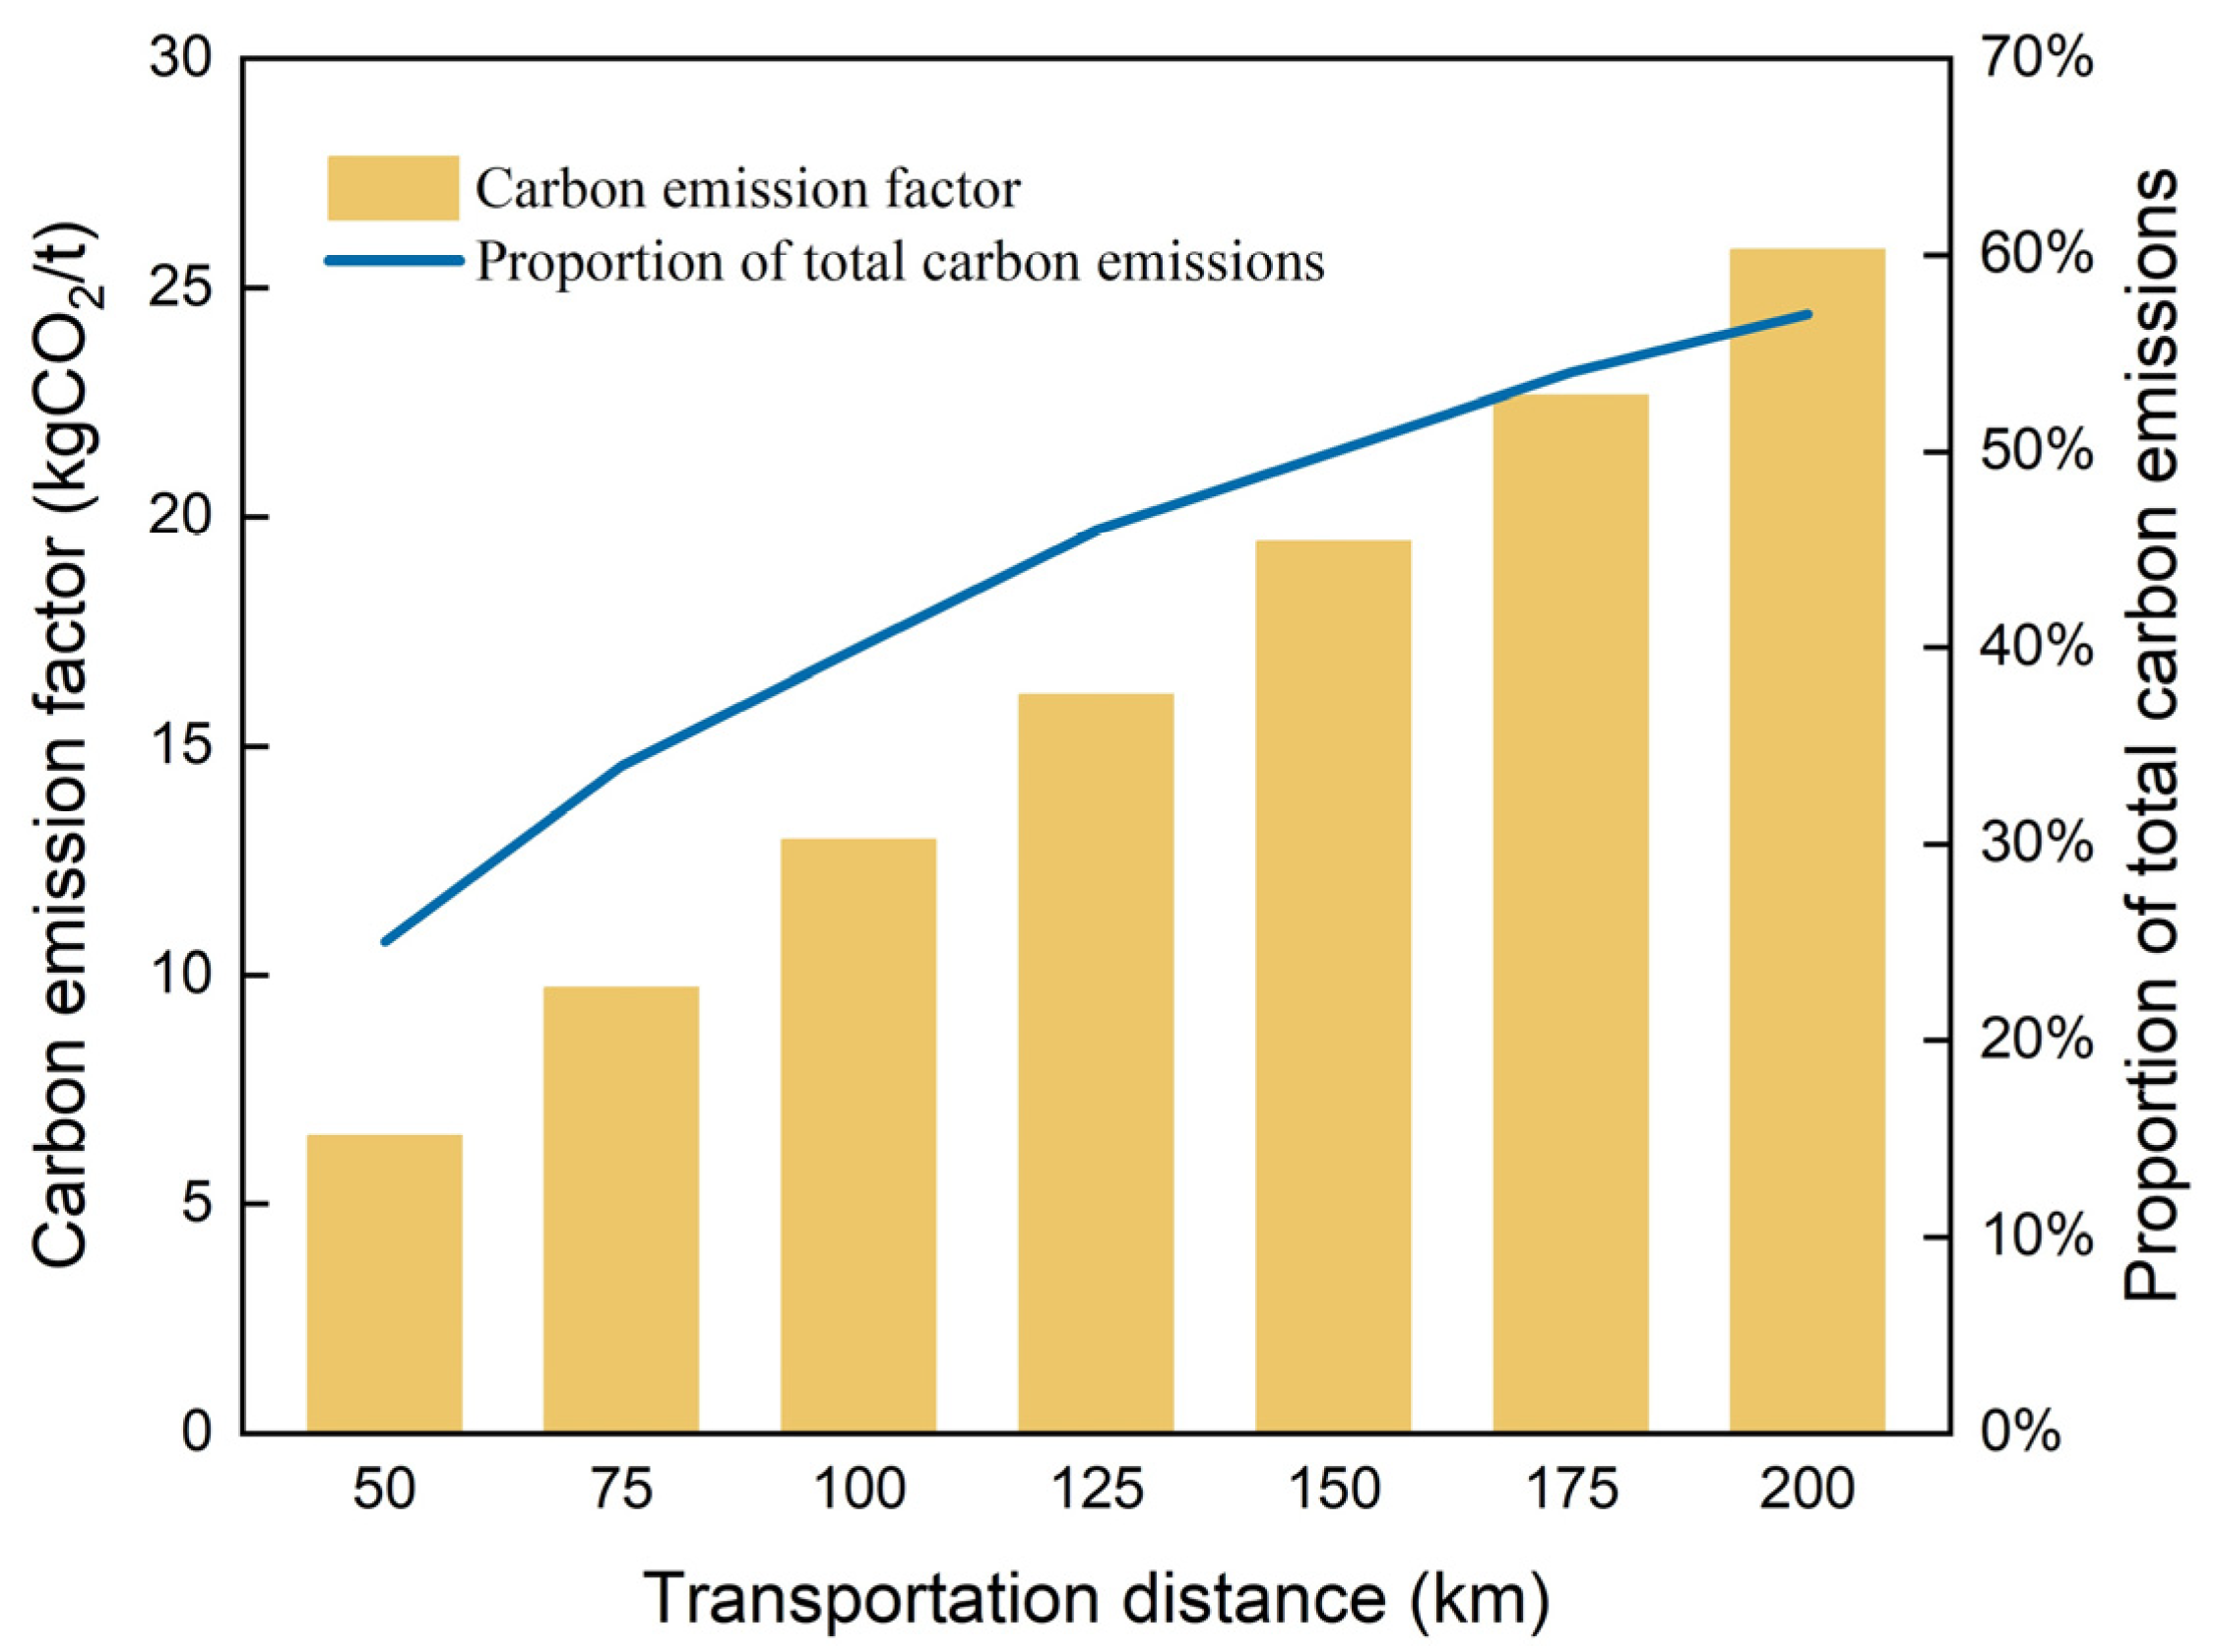
The transportation distance is an important factor affecting carbon emissions and their proportion within the whole transportation stage. Therefore, the influence of transportation distance on carbon emissions is studied by selecting diesel vehicles. From Figure 7, it can be concluded that the longer the transportation distance, the higher the vehicle load rate, and the proportion of carbon emissions in the total emissions in the transportation stage will grow slowly. When the transportation distance reaches 200 km, the proportion can reach 57%. Detailed results can be found in Table S7 of the Supplementary Materials.

Figure 7.
The impact of transportation distance on the carbon emission factor and the overall proportion of the transportation stage.
3.2.5. Intelligent Management and Operation Platform
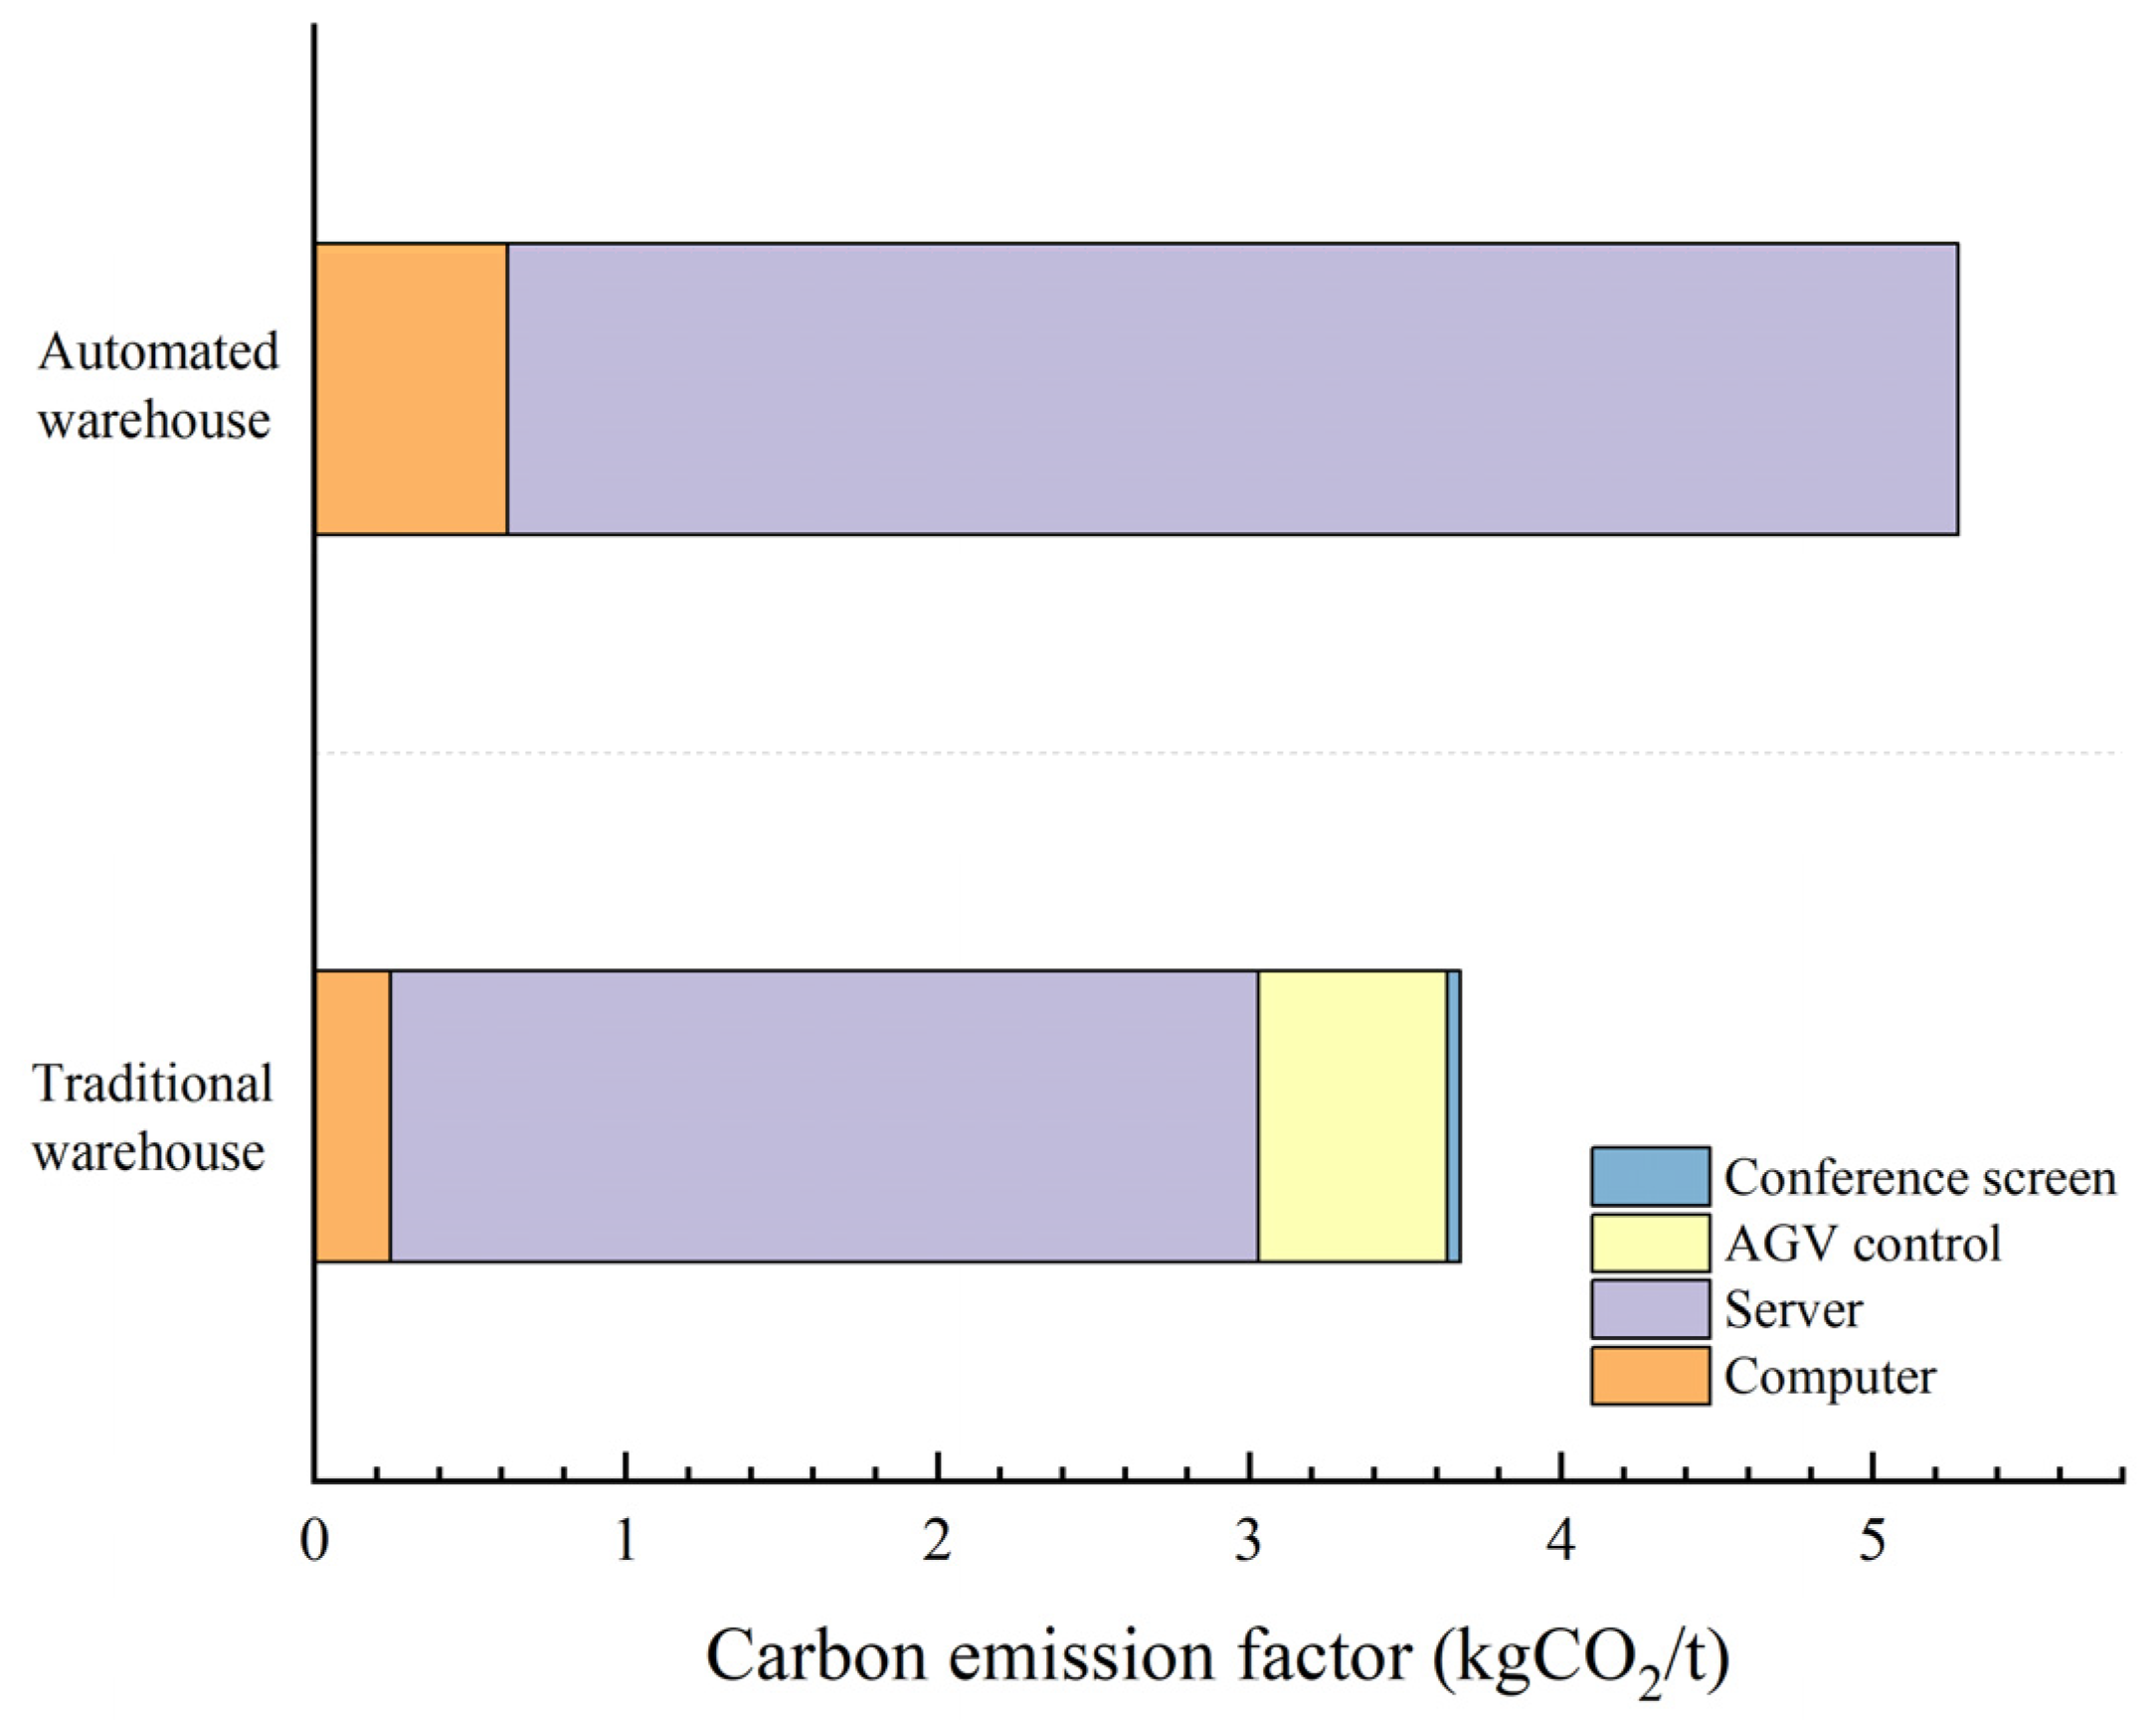
Automated warehouses employ advanced server systems with a lower power usage effectiveness (PUE), resulting in lower energy consumption. The automated warehouse was set up with ten servers of 1000 Watts, and the traditional warehouse was set up with ten servers of 500 Watts. With reference to China’s data center, the power usage efficiency (PUE) is generally between 2 and 3 [23], so the PUE value of the traditional warehouse was set to 2.5. On the other hand, the intelligent management and operation platform of the automated warehouse was transformed, and efficient servers were added. According to the Three-Year Action Plan for the Development of New Data Centers (2021–2023) issued by the Ministry of Industry and Information Technology of China [24], the PUE of newly built large data centers should be reduced to below 1.3 by the end of 2023. Therefore, the PUE value of the automated warehouse was set to 1.3. According to the calculation, the total carbon emissions of the management platform in the automated warehouse were 4516.87 tCO2, which was equivalent to 3.68 kgCO2/t and was lower than the 5.28 kgCO2/t of the traditional warehouse. The carbon emission factor results are shown in Figure 8.
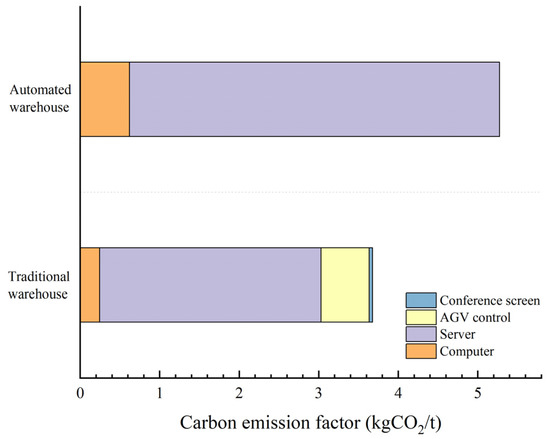
Figure 8.
Carbon emission factors of the information management platform.
4. Conclusions
The comprehensive assessment of life cycle carbon emissions for electric power material warehouses underscores the potential of automated systems to advance decarbonization efforts. Automated warehouses significantly outperform traditional models across all operational stages, achieving a reduction in carbon emissions of 42.85%, with overall life cycle emissions of 39,531.26 tCO2. Transportation, which was identified as the highest-emission stage, highlights the critical role of transitioning to electric transport and optimizing logistics processes.
This study contributes a robust carbon accounting framework tailored to electric power material warehouses, offering a clear roadmap for implementing low-carbon strategies. Key recommendations include integrating renewable energy sources, adopting intelligent control systems, and standardizing packaging protocols to enhance sustainability. Despite the limitations of data availability, particularly in the packaging stage, the findings emphasize the transformative potential of automation technologies in achieving climate targets.
Future research should focus on refining data accuracy through real-time monitoring, exploring the life cycle impacts of emerging materials and technologies, and further expanding the life cycle inventory. The application of probabilistic models, such as Bayesian calibration, can provide more precise estimates for variables such as operational hours and carbon factors, thus further enhancing the robustness of carbon footprint assessments. By addressing these gaps, the framework presented here can serve as a benchmark for sustainable development in the power sector’s supply chain.
Supplementary Materials
The following supporting information can be downloaded at: https://www.mdpi.com/article/10.3390/en17246352/s1, Figure S1: Effect of rooftop photovoltaic area on total carbon emission factor of warehouse; Table S1: Life cycle inventory of different stages of electric power materials warehouses; Table S2: Basic parameters of roof PV; Table S3: Carbon reduction effects of different types of photovoltaic systems; Table S4: The luminous efficiency of different lamps; Table S5: The proportion of different waste treatment methods in low-carbon warehouses; Table S6: Emission factors of different waste treatment methods. Table S7: The impact of transportation distance on carbon emissions.
Author Contributions
Conceptualization, L.G. and X.T.; methodology, X.T.; software, F.L.; validation, L.G., Y.L. and X.Y.; formal analysis, Y.L.; investigation, X.Y.; resources, F.L.; data curation, X.L.; writing—original draft preparation, X.T.; writing—review and editing, Q.W. and L.G.; visualization, F.L.; supervision, Q.W.; project administration, L.G.; funding acquisition, L.G. All authors have read and agreed to the published version of the manuscript.
Funding
This work was financially supported by the National Natural Science Foundation of China (grant number: 72293601).
Data Availability Statement
Data will be made available upon request.
Conflicts of Interest
As author Yongjun Luo was employed by the company Jiangsu Anfang Power Technology Co., Ltd., authors Lei Geng and Xiang Yao were employed by the company State Grid Jiangsu Electric Power Co., Ltd., the remaining authors declare that the research was conducted in the absence of any commercial or financial relationships that could be construed as a potential conflict of interest.
Appendix A
Table A1.
Basic information of an automated and traditional warehouse in Jiangsu, China.
Table A1.
Basic information of an automated and traditional warehouse in Jiangsu, China.
| Warehouse Information | Automated Warehouse | Traditional Warehouse |
|---|---|---|
| Warehouse area (m2) | 13,000 | 10,703 |
| Vegetation area (m2) | 3800 | 1300 |
| Storage racks | Cut-through type | Tray type |
| Utilization rate of warehouse area | 80% | 65% |
| Utilization rate of warehouse capacity | 30% | 60% |
| Availability of intelligent management platform | Yes | No |
| Availability of LED lighting | Yes | No |
| Availability of rooftop photovoltaics | Yes | No |
| Maximum goods storage capacity (tons) | 17,160 | 10,435.425 |
| Overall goods weight in lifespan (tons) | 1,029,600 | 939,188.25 |
| Lifespan (years) | 50 | 50 |
Table A2.
Overall carbon emission results of automated and traditional warehouses.
Table A2.
Overall carbon emission results of automated and traditional warehouses.
| Warehouse Type | Automated Warehouse | Traditional Warehouse | ||
|---|---|---|---|---|
| Stage | Carbon Emission Factor (kgCO2/t) | Total Carbon Emissions (tCO2) | Carbon Emission Factor (kgCO2/t) | Total Carbon Emissions (tCO2) |
| Storage buildings and facilities | 6.196 | 7612.286 | 13.375 | 9469.448 |
| Loading and unloading | 5.848 | 7184.526 | 10.496 | 7431.250 |
| Packaging | 3.487 | 4284.245 | 4.428 | 3135.208 |
| Transportation | 12.970 | 15,933.341 | 22.734 | 16,095.577 |
| Information management platform | 3.677 | 4516.867 | 5.275 | 3734.606 |
| Total | 32.178 | 39,531.264 | 56.308 | 39,866.088 |
References
- Vais, A.A.; Mikhaylov, P.V.; Popova, V.V.; Nepovinnykh, A.G.; Nemich, V.N.; Andronova, A.A.; Mamedova, S.K. Carbon Sequestration Dynamics in Urban-Adjacent Forests: A 50-Year Analysis. Civ. Eng. J. 2023, 9, 2205–2220. [Google Scholar] [CrossRef]
- Peng, K.; Feng, K.; Chen, B.; Shan, Y.; Zhang, N.; Wang, P.; Fang, K.; Bai, Y.; Zou, X.; Wei, W.; et al. The Global Power Sector’s Low-Carbon Transition May Enhance Sustainable Development Goal Achievement. Nat. Commun. 2023, 14, 3144. [Google Scholar] [CrossRef] [PubMed]
- Hu, J.; Harmsen, R.; Crijns-Graus, W.; Worrell, E. Barriers to Investment in Utility-Scale Variable Renewable Electricity (VRE) Generation Projects. Renew. Energy 2018, 121, 730–744. [Google Scholar] [CrossRef]
- Pehl, M.; Arvesen, A.; Humpenöder, F.; Popp, A.; Hertwich, E.G.; Luderer, G. Understanding Future Emissions from Low-Carbon Power Systems by Integration of Life cycle Assessment and Integrated Energy Modelling. Nat. Energy 2017, 2, 939–945. [Google Scholar] [CrossRef]
- AlOmar, M.K.; Hameed, M.M.; Al-Ansari, N.; Razali, S.F.M.; AlSaadi, M.A. Short-, Medium-, and Long-Term Prediction of Carbon Dioxide Emissions Using Wavelet-Enhanced Extreme Learning Machine. Civ. Eng. J. 2023, 9, 815–834. [Google Scholar] [CrossRef]
- Li, M. Research on the Electric Power Storage and Logistics Management Method Based on the Internet of Things Technology. Inf. Comput. 2023, 35, 60–62. [Google Scholar]
- Jin, X.; Yu, L. Research and Implementation of High Priority Scheduling Algorithm Based on Intelligent Storage of Power Materials. Energy Rep. 2022, 8, 398–405. [Google Scholar] [CrossRef]
- Ren, Q.; Tao, J. KPI Corporate Management and Business Intelligence Analysis on the Application of Electric Power Enterprises. In Proceedings of the 2012 International Conference on Industrial Control and Electronics Engineering, Xi’an, China, 23–25 August 2012; pp. 1466–1469. [Google Scholar]
- Gao, F.; Cheng, Y. Research on Scheduling Strategy of Intelligent Warehouse and Automatic Verification Line. In Proceedings of the 2020 5th Asia Conference on Power and Electrical Engineering (ACPEE), Chengdu, China, 4–7 June 2020; pp. 112–115. [Google Scholar]
- Shrivastava, S.; Unnikrishnan, S. Life Cycle Assessment of Oil Storage Unit in India. Int. J. Oil Gas Coal Technol. 2021, 27, 95. [Google Scholar] [CrossRef]
- Onat, N.C.; Kucukvar, M.; Tatari, O. Integrating Triple Bottom Line Input–Output Analysis into Life Cycle Sustainability Assessment Framework: The Case for US Buildings. Int. J. Life Cycle Assess. 2014, 19, 1488–1505. [Google Scholar] [CrossRef]
- Pérez, J.; Lumbreras, J.; de la Paz, D.; Rodríguez, E. Methodology to Evaluate the Environmental Impact of Urban Solid Waste Containerization System: A Case Study. J. Clean. Prod. 2017, 150, 197–213. [Google Scholar] [CrossRef]
- Zhou, J.; Li, M.; Xu, Y.; Liu, Z.; Liu, Y.; Tian, D.; Zhao, W. Research and Practice on the Realization Path of Zero-Carbon Power Material Warehouse. Build. Energy Effic. 2024, 52, 80–83+108. [Google Scholar]
- Hong, F.; Ge, C.; Xu, H.; Hu, C.; Fei, D.; Xiao, F. Research on Carbon Emission Accounting Methods in Electricity Warehouse Management Segment. Mod. Manag. 2024, 14, 152–157. [Google Scholar] [CrossRef]
- Turner, C.; Oyekan, J.; Garn, W.; Duggan, C.; Abdou, K. Industry 5.0 and the Circular Economy: Utilizing LCA with Intelligent Products. Sustainability 2022, 14, 14847. [Google Scholar] [CrossRef]
- Manea, A.; Dolci, G.; Grosso, M. Life Cycle Assessment and Cost Analysis of an Innovative Automatic System for Sorting Municipal Solid Waste: A Case Study at Milan Malpensa Airport. Waste Manag. 2024, 183, 63–73. [Google Scholar] [CrossRef] [PubMed]
- Xue, M.; Xu, Z. Application of Life Cycle Assessment on Electronic Waste Management: A Review. Environ. Manag. 2017, 59, 693–707. [Google Scholar] [CrossRef] [PubMed]
- ISO 14040; Environmental Management–Life Cycle Assessment–Principles and Framework. British Standard Institution: London, UK, 2006.
- World Resources Institute and World Business Council for Sustainable Development. The Greenhouse Gas Protocol: A Corporate Accounting and Reporting Standard; World Resources Institute: Washington, DC, USA, 2004. [Google Scholar]
- Ma, J. Order of Ministry of Transport of the People’s Republic of China. Available online: https://www.gov.cn/gongbao/2024/issue_11206/202403/content_6937896.html (accessed on 2 December 2024).
- Cabeza, L.F.; Rincón, L.; Vilariño, V.; Pérez, G.; Castell, A. Life Cycle Assessment (LCA) and Life Cycle Energy Analysis (LCEA) of Buildings and the Building Sector: A Review. Renew. Sustain. Energy Rev. 2014, 29, 394–416. [Google Scholar] [CrossRef]
- Bauer, C.; Hofer, J.; Althaus, H.-J.; Del Duce, A.; Simons, A. The Environmental Performance of Current and Future Passenger Vehicles: Life Cycle Assessment Based on a Novel Scenario Analysis Framework. Appl. Energy 2015, 157, 871–883. [Google Scholar] [CrossRef]
- GB/T 32910.3-2016; Standardization Ministry of China. Data Center—Resource Utilization—Part 3: Electric Energy Usage Effectiveness Requirements and Measuring Methods. Standards Press of China: Beijing, China, 2016.
- Zhu, Y. Notice of the Ministry of Industry and Information Technology on Issuing the Three-Year Action Plan for the Development of New Data Centres (2021–2023). Available online: https://www.gov.cn/zhengce/zhengceku/2021-07/14/content_5624964.htm (accessed on 7 October 2024).


Disclaimer/Publisher’s Note: The statements, opinions and data contained in all publications are solely those of the individual author(s) and contributor(s) and not of MDPI and/or the editor(s). MDPI and/or the editor(s) disclaim responsibility for any injury to people or property resulting from any ideas, methods, instructions or products referred to in the content. |
© 2024 by the authors. Licensee MDPI, Basel, Switzerland. This article is an open access article distributed under the terms and conditions of the Creative Commons Attribution (CC BY) license (https://creativecommons.org/licenses/by/4.0/).