Article

How to Decarbonize Greece by Comparing Wind and PV Energy: A Land Eligibility Analysis

1
School of Biological Sciences, University of Aberdeen, Cruickshank Building, St. Machar Drive, Aberdeen AB24 3UU, Scotland, UK
2
Institute of Geoenergy, Foundation for Research and Technology Hellas, 73100 Chania, Greece
3
Cologne Institute for Renewable Energy (CIRE), Faculty of Process Engineering, Energy and Mechanical Systems, TH Köln, Betzdorfer Str. 2, 50679 Köln, Germany
4
Marine Biodiscovery Centre, Department of Chemistry, University of Aberdeen, Aberdeen AB24 3UE, Scotland, UK
5
Department of Biology, San Diego State University, San Diego, CA 92182-4614, USA
6
ISATEC GmbH, Rathausstraße 10, 52072 Aachen, Germany
*
Authors to whom correspondence should be addressed.
Energies 2024, 17(3), 567; https://doi.org/10.3390/en17030567
Submission received: 26 September 2023 / Revised: 30 December 2023 / Accepted: 3 January 2024 / Published: 24 January 2024
(This article belongs to the Special Issue Climate Changes and the Impacts on Power and Energy Systems)

Abstract

:
To achieve sustainable development, the energy transition from lignite burning to renewable energy resources for electric power generation is essential for Greece. Wind and solar energy have emerged as significant sources in this transition. Surprisingly, numerous studies have examined the potential for onshore wind based on land eligibility, while few studies on open-field photovoltaic (PV) installations have been conducted. Therefore, based on the Specific Framework for Spatial Planning and Sustainable Development for Renewable Energy Sources (SFSPSD-RES), along with insights from previous relevant studies, this work conducts a land eligibility analysis of onshore wind and open-field PV installations in Greece using the software Geospatial Land Availability for Energy Systems (GLAES 1.2.1) and ArcGIS 10.2. Additionally, through an in-depth exploration of wind and solar PV energy potential in decommissioned lignite mines integrated with wind power density (WPD) and global horizontal irradiation (GHI) maps, this study compares the suitability of wind versus solar as energy sources for the decarbonization of Greece. Overall, despite the greater spatial eligibility for onshore wind turbines compared to open-field PV power plants, the relatively lower wind energy potential and operational limitations of wind turbines lead to the study’s conclusion that solar energy (PV) is more suitable for the decarbonization of Greece.

1. Introduction

In order to keep the global average temperature rise well below 2 K above pre-industrial levels and to pursue efforts to limit the temperature rise to 1.5 K, the Paris Climate Agreement was signed by 196 countries in 2015 [1]. Greece, as one of the signatory countries, has set national energy policies in different periods to achieve a phased sustainable development. Since the early 1960s, Greece has met most of its electric power demand from thermal power stations burning either lignite on the mainland or heavy fuel oil on the islands. Based on the European Energy Policy, the goal of renewable energy penetration in 2020 (Law 3851/2020) formulated at the national level in Greece in 2010 marked the start of the Greek energy transition [2]. As Figure 1 shows, Greek electric power generation shifted from coal to natural gas by 2020 and wind and solar PV gradually became important sources of electric power generation recently [3]. In terms of power generation resources for Greece, solar accounted for 10.7% of the total installed capacity, while wind accounted for 23% of the total installed capacity in 2023 [4]. For the country’s sustainable development, further electric power generation from renewable energy sources (RESs) is needed. The Greek National Energy and Climate Plan (NECP) aims to deploy renewable energy generation systems on the islands, interconnect them with the electricity grid on the mainland, and phase out most of the heavy fuel oil-based power generation on the islands by 2030. Another policy, the National Climate Law, enacted in May 2022, set targets to achieve a 55% reduction in the total greenhouse gas emissions by 2030, an 80% reduction by 2040, and ultimately reach net zero emissions by 2050 [3]. It also outlined the essential emissions reduction measures and set a binding target to end lignite power generation by 2028.
It is evident that the need for RESs to achieve energy transition in Greece is growing rapidly. According to the National Climate Law [3], the energy transition plan of Greece focuses on wind and solar PV. Therefore, it is very timely and topical to study Greece’s wind and PV potential. While there are a plethora of studies about wind potential using the Geographic Information System (GIS) for Greece [6,7,8,9,10], relatively few studies, such as the one by Vagiona [11], have been conducted about the country’s PV potential.
This work aims to explore the prospective wind and PV energy prospects in Greece by identifying the optimal locations for wind turbines and PV installations using geospatial data. The approach contrasts with those of previous studies [6,8,9,10,11] in Greece, which did not incorporate economic criteria into the land eligibility analysis, thereby providing a more comprehensive evaluation of the viability of RESs. It also aims to compare the electric-generating capacity of the existing wind turbines and PV power plants at their present state with the predicted wind and PV potential to assess the most suitable RESs for Greece, either wind or solar. Recognizing their untapped value, while mining areas are normally excluded from such studies, special attention is dedicated to the potential of wind and PV in former lignite mining areas that could markedly increase the efficiency of RESs in Greece. This will not only broaden the scope of land use for energy production but also support the transition to sustainable development by turning neglected sites into productive assets.

2. Materials and Methods
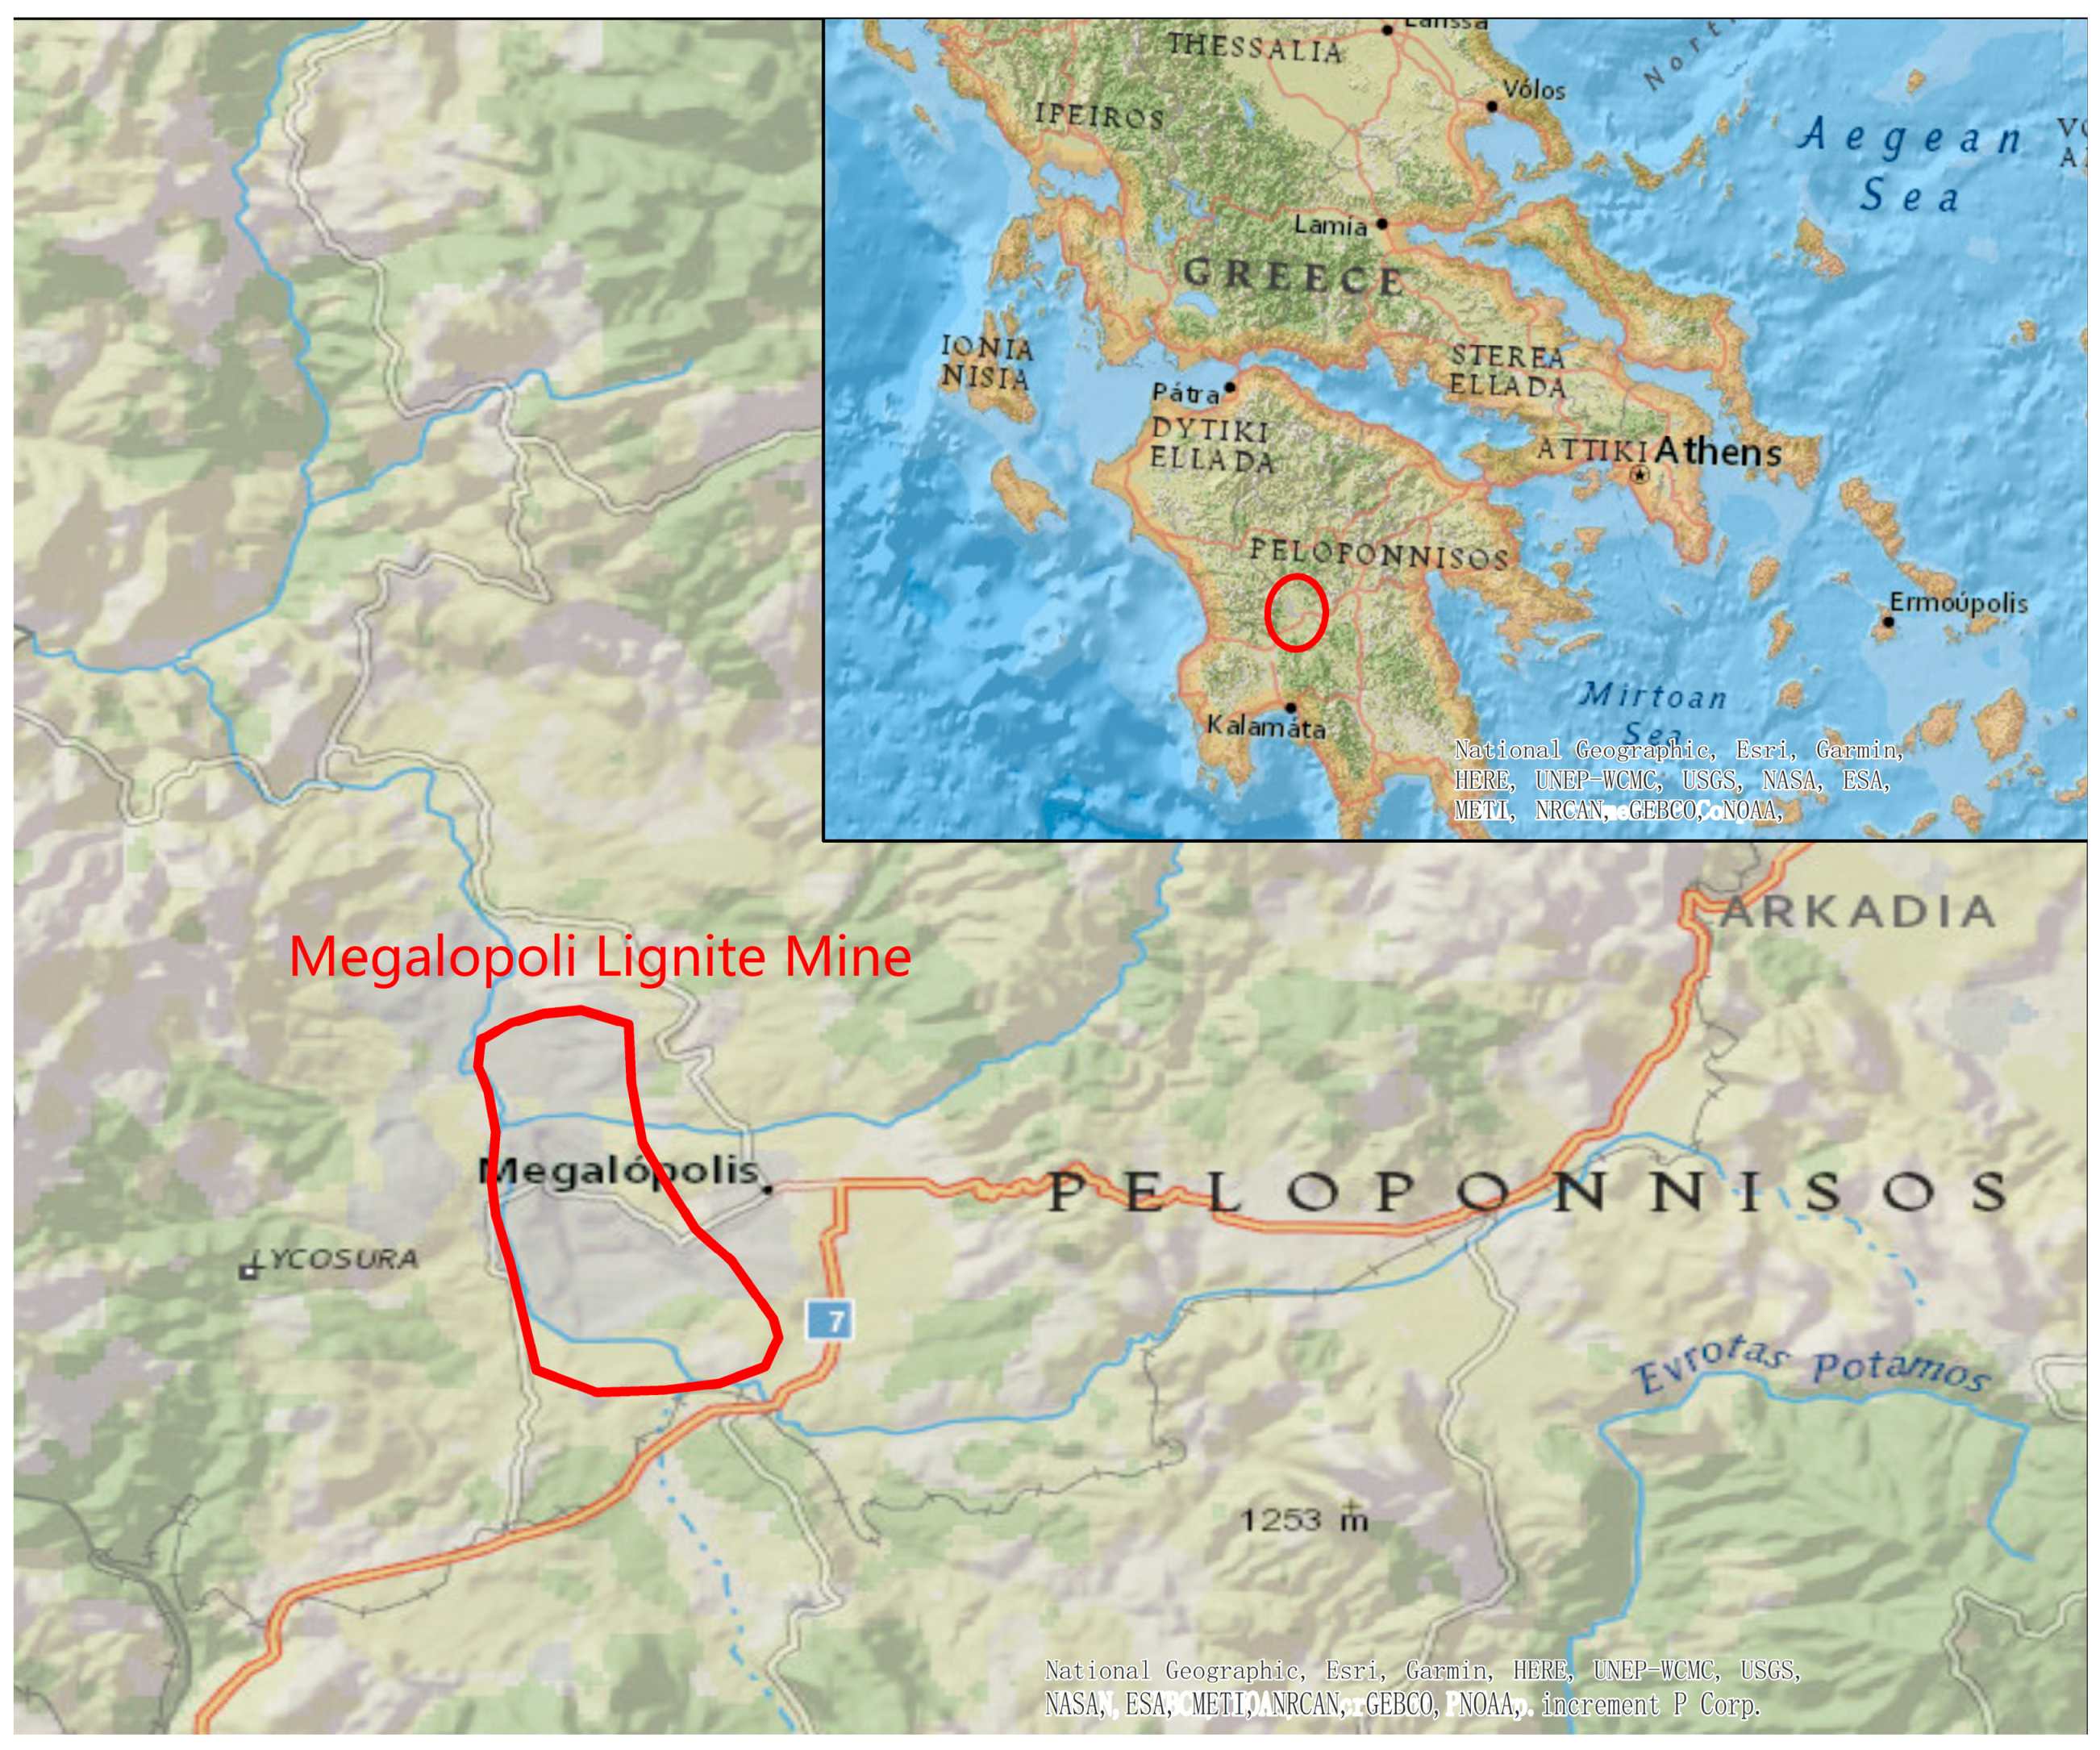
2.1. Study Areas

Greece, a country located in southeastern Europe, consists of 13 regions with a total area of about 132,000 km2. By 2023, according to statistics [12], the total population of Greece was 10,497,595 inhabitants and, among the more than 2000 Greek islands, only about 170 islands were inhabited. Although many uninhabited islands host established nature reserves for flora and fauna, other areas that meet the designated standards are worthy of becoming sites of investment in renewable energy due to the abundance of wind and solar resources [10]. Based on the Archaeological Cadastre of Greece [13], the current inventory reveals the presence of 220 museums, 420 historical sites, 844 protected areas, 3100 archaeological sites, and 17,000 monuments in the entire territory of the country. In the established network of nature protection areas in the European Union, Greece has a total of 446 protected areas, including 239 Special Areas of Conservation (SAC) and 181 Special Protection Areas for birds (SPAs), with the remaining 26 areas falling into both categories [14].
In this work, the operations were based on a shapefile of Greece [15]. Before the land eligibility analysis, Natura 2000 areas were excluded first according to SFSPSD-RES [16]. In order to determine the land position that can support the construction of wind turbines and PV power plants in Greece, the open-source tool GLAES [17] and the Prior datasets containing typical criteria for variable RESs were utilized. A geographic analysis was conducted to assess the wind and solar potential in Greece. This analysis involved the utilization of the Digital Elevation Model of Greece obtained from the European Environment Agency Digital Elevation Model (EU-DEM) [18]. Additionally, WPD data at a height of 100 m were obtained from the Global Wind Atlas [19], while GHI data were obtained from the Global Solar Atlas [20]. These datasets were employed to compare the approximate wind and solar potential in Greece using a Geographic Information System digital platform, specifically ArcGIS 10.8 (Esri, Aylesbury, UK).

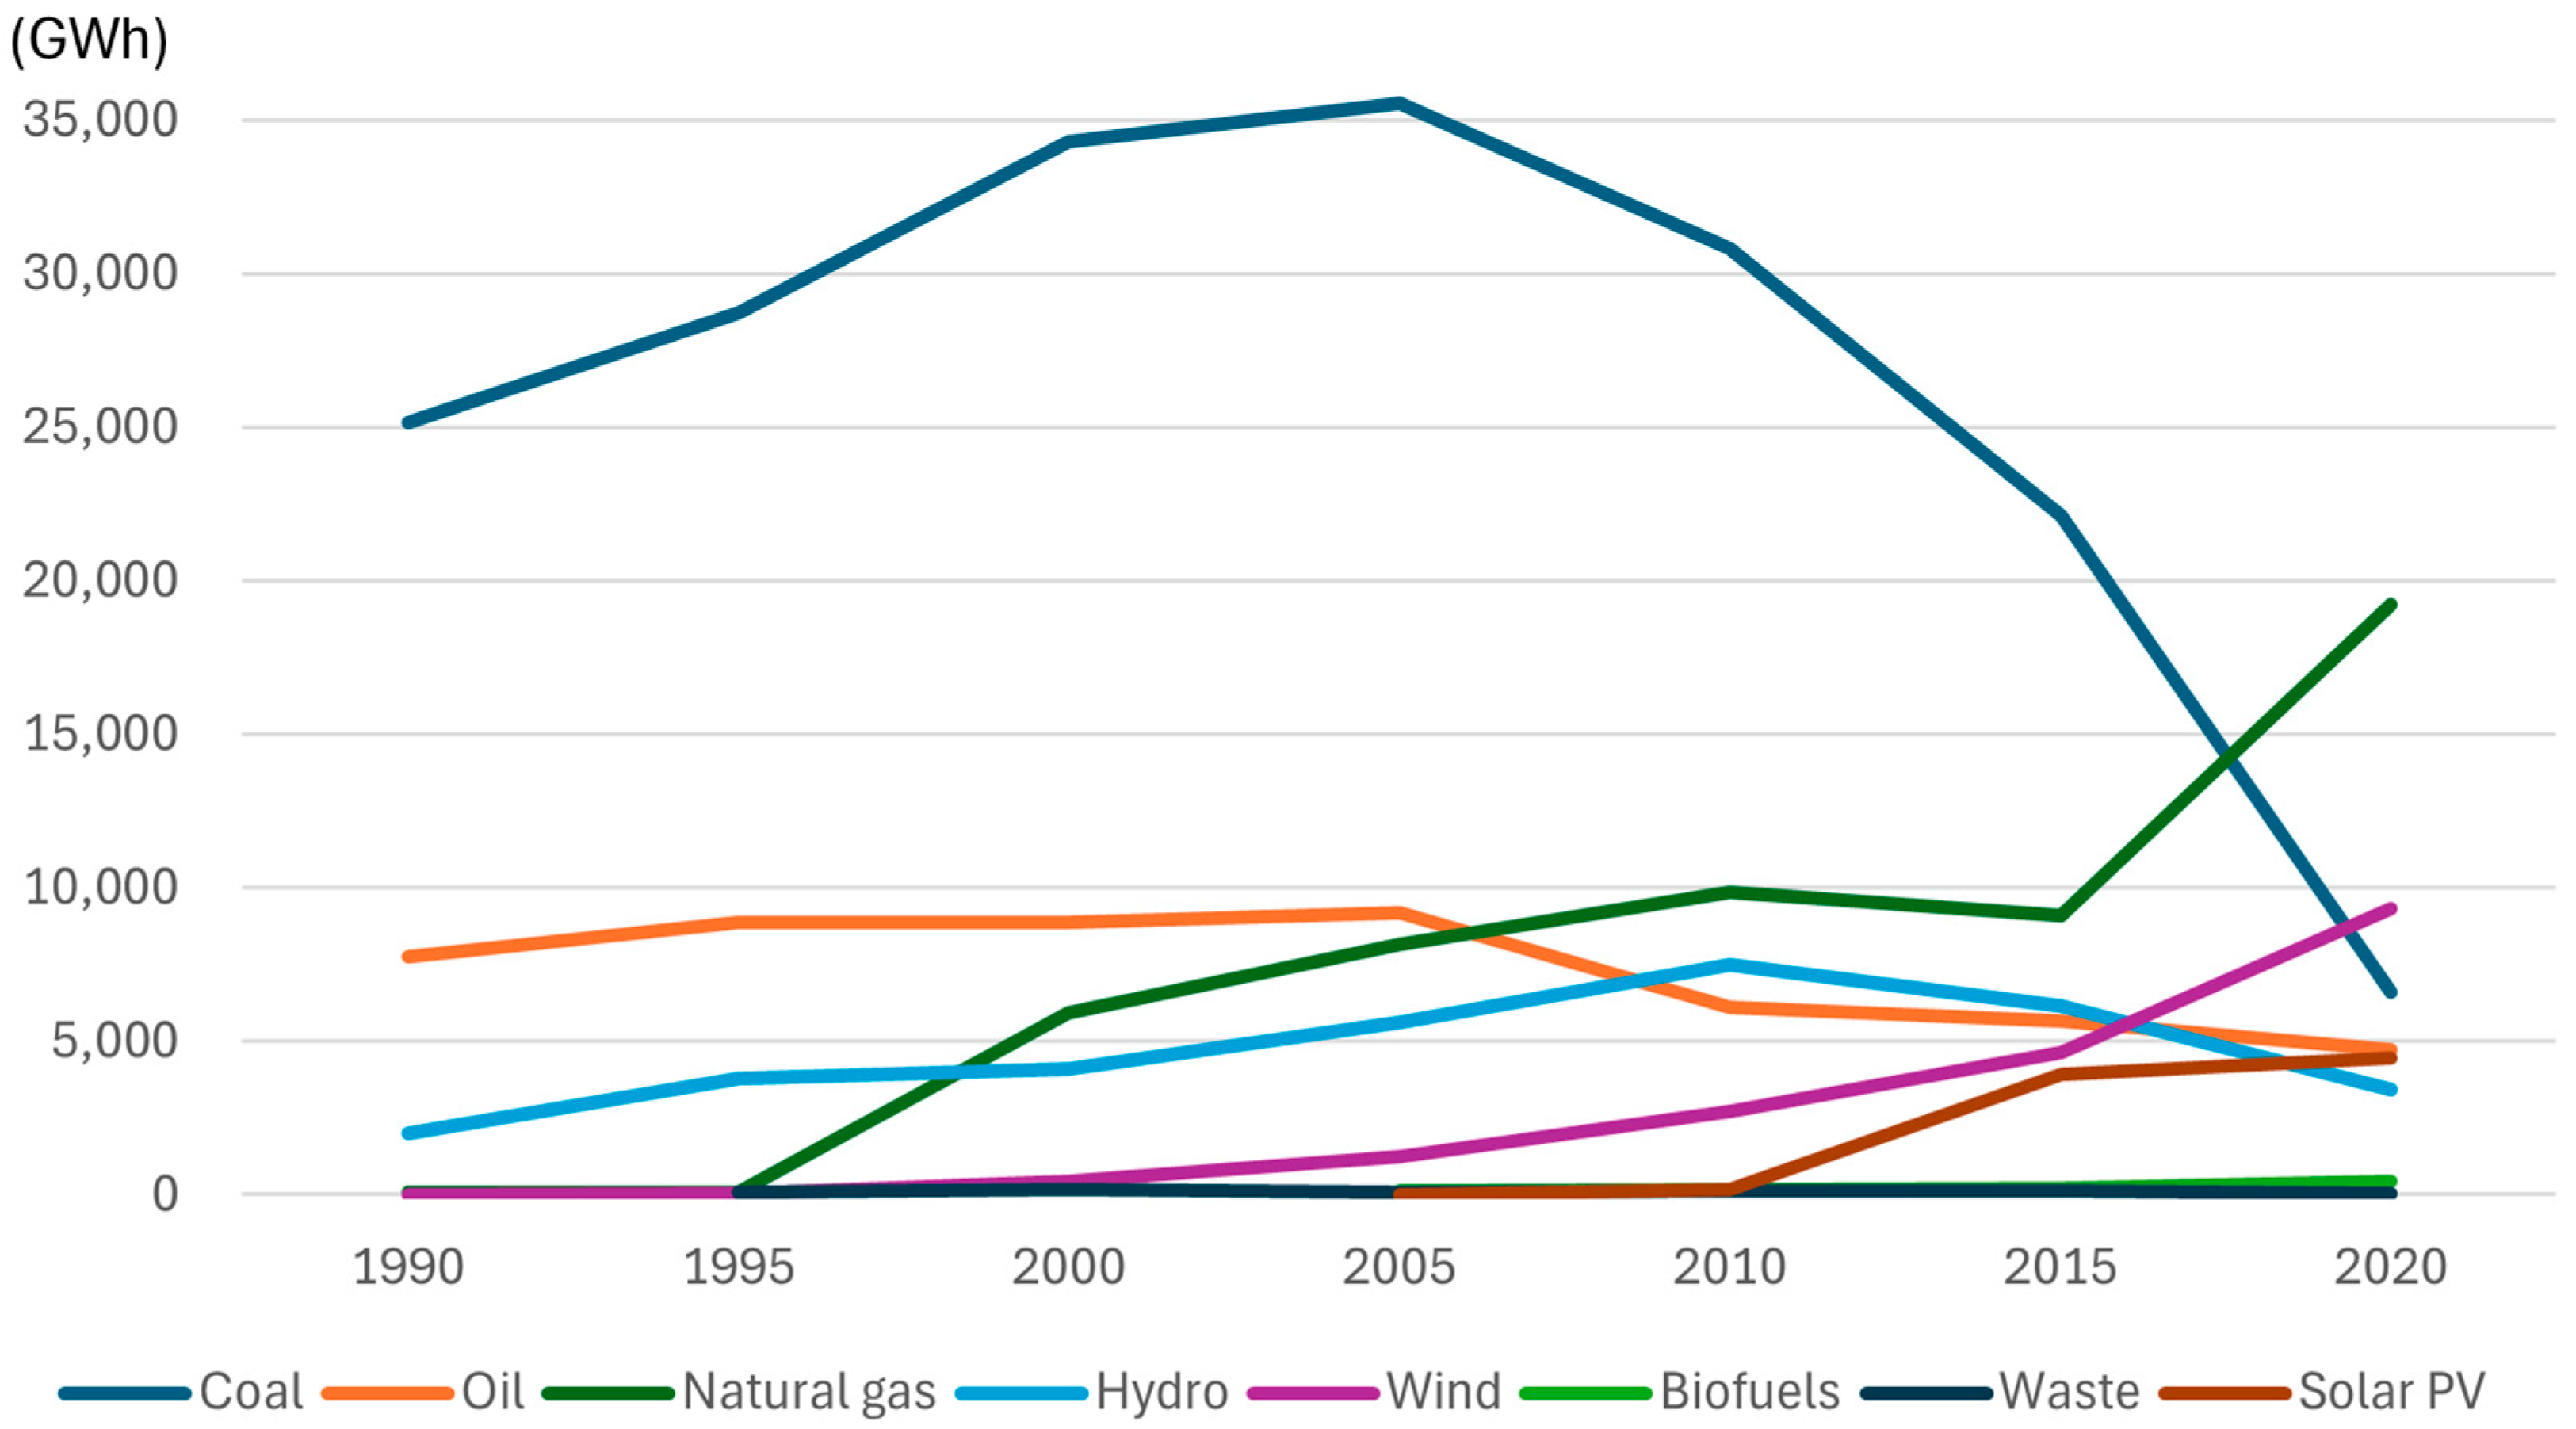
2.2. Current State Analysis

At present, Greece has established many wind and PV farms based on previous or recently designated standards. Data affecting the construction of wind turbines and PV power plants under the current conditions were analyzed to develop a series of land constraints for the suitable placing of wind turbines and PV power plants in Greece. Meanwhile, the data of 2023 from the Geoinformation Map of the Regulatory Authority for Energy [21] were used to present the existing construction areas of wind and solar energy. Subsequently, the areas with installed wind turbines and PV power plants were combined with the DEM map and mean WPD and GHI maps of Greece to understand the topography of the current construction locations and assess the current electric-generating capacity of Greece.

2.3. Geospatial Land Availability for Energy Systems (GLAES)

Land eligibility is a process that evaluates the suitability of a land parcel for implementing a specific technology based on a predetermined set of exclusion constraints and serves as a fundamental and widely utilized procedure through which geospatial criteria shape the distribution patterns across a given region [22]. Since not all open fields are eligible for the installation of wind turbines and PV power plants, land eligibility analysis based on geospatial data is an essential step before analyzing RES potential.
GLAES is based on Python 3 language, providing a simple and efficient way to analyze land eligibility using the Prior datasets [17]. Ryberg et al. [23] examined more than 50 literature sources that independently conducted a land eligibility analysis for prevalent variable RES technologies, documenting the approaches and frequencies used in defining the criteria. In this study, 28 typical criteria were identified, which included the distance from settlements and the distance from airports. Meanwhile, depending on the underlying motivations driving their exclusion, the identified criteria were divided into 4 distinct groups, namely, socio-political, physical, conservation, and economic. The typical criteria were further subdivided into multiple sub-criteria, for example, the exclusion distance from settlements is different for urban and rural areas. Finally, a collection of standardized datasets called Prior was developed [23], which defined common criteria related to variable RESs in the European context. There were 46 Priors in total, each of which represented the values of a criterion or sub-criterion across Europe and was georeferenced using the EPSG:3035 spatial reference system at a spatial resolution of 100 m by 100 m. The comprehensive documentation of each Prior dataset can be found in the work of Ryberg et al. [23]. The GLAES model and the Prior datasets can be obtained via GitHub [17]. The threshold of each criterion in the Prior datasets was determined considering the social, technical, environmental, and economic factors specific to Greece. These are discussed in Section 2.4 and Section 2.5.

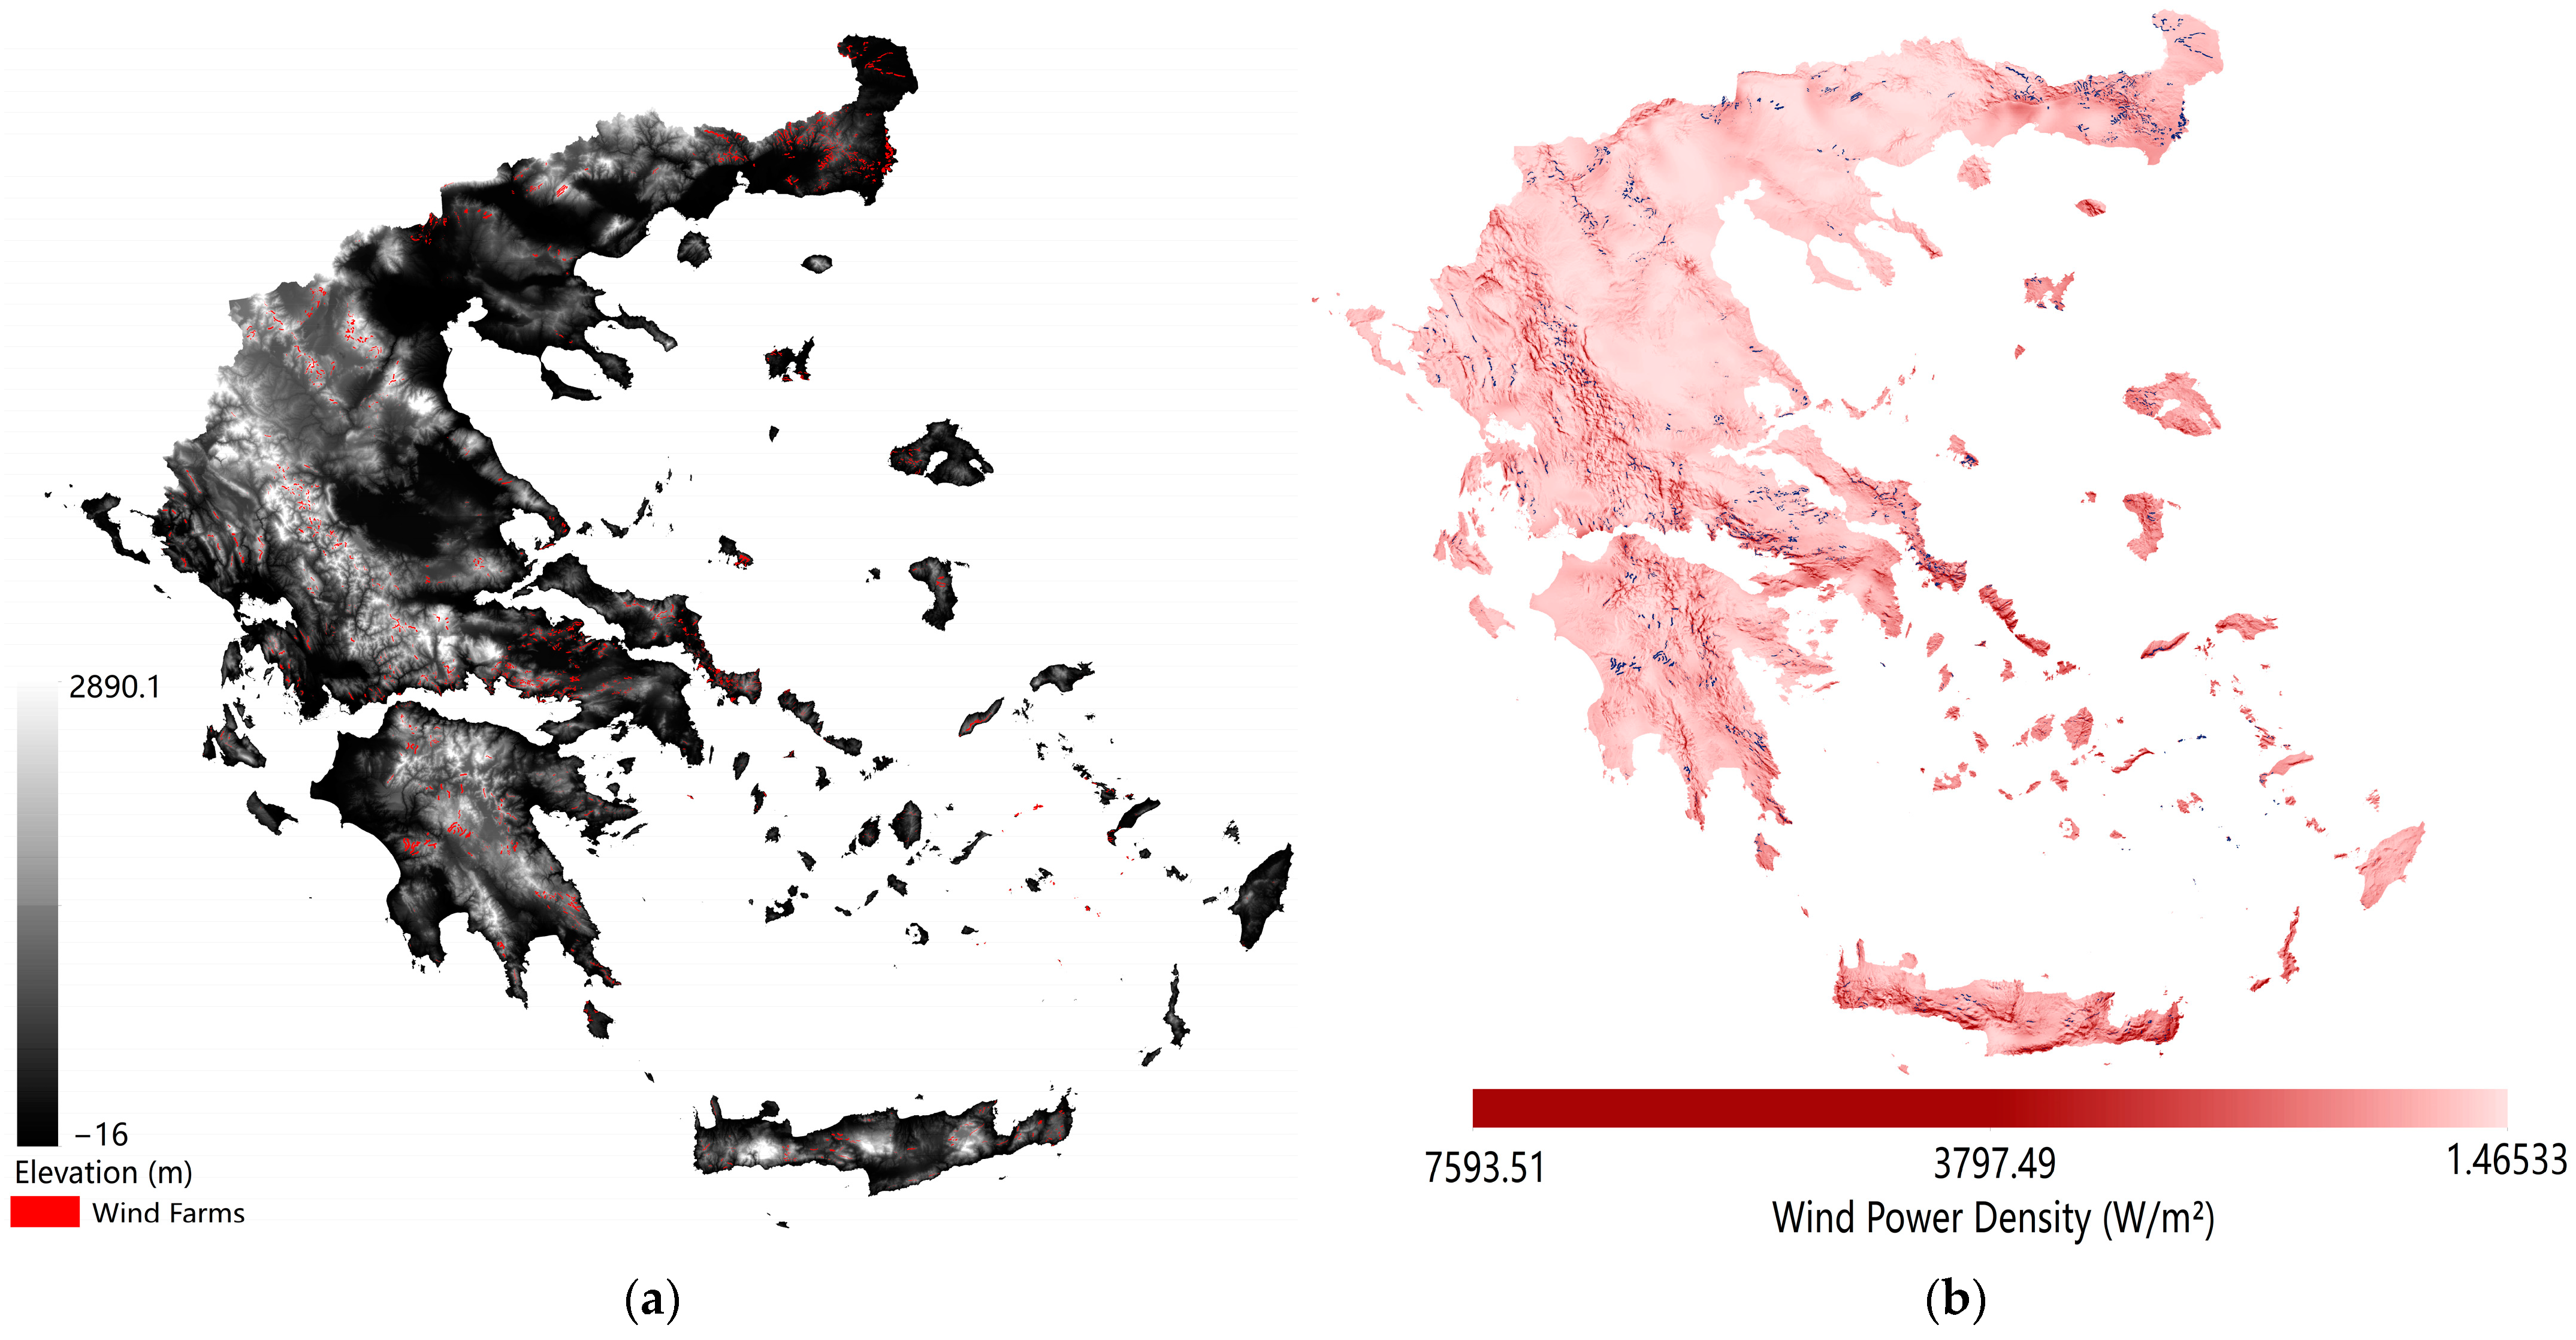
2.4. Onshore Wind Land Eligibility Analysis

For onshore wind energy, there are already many studies on land eligibility considering different series of land constraints. For instance, the European Environment Agency conducted a land eligibility analysis of onshore wind only excluding protected areas, such as Natura 2000, and found that the available area for onshore wind is 85.3% in Europe [24]. In contrast, other studies opted to apply multiple land constraints to analyze land eligibility. McKenna et al. [25] and Eurek et al. [26] both selected agricultural areas, settlement areas, protected areas, forests, waterbodies, slope, and elevation as land constraints, although the set thresholds for each exclusion constraint were different. Eurek et al. [26] found that 40% of the area in Europe is eligible for wind energy. In comparison, in addition to the land constraints mentioned above, McKenna et al. [25] also excluded buffer areas around airports, harbors, roads, and railways and used higher resolution maps, revealing that 23% of land surface in Europe is eligible. Moreover, Ryberg et al. [27] reviewed 53 land eligibility studies to develop a set of common land constraints for Europe considering social, technical, environmental, and economic factors and found that the total eligible area amounts to 1,352,260 km2 for onshore wind turbines in Europe overall, which includes an eligible area of 28,326 km2 in Greece. However, according to the specific circumstances of different countries, there will be certain differences in the formulated exclusion criteria and thresholds. At the national level in Greece, a Special Framework for the Spatial Planning and the Sustainable Development of Renewable Energy Sources (SFSPSD-RES) was formulated, which in addition to considering common land constraints, such as settlements and protected areas, also excluded archaeological reserves and considered visual factors, i.e., the esthetic impact of wind turbines on the landscape [16]. Several subsequent studies on wind farms’ site selection in Greece were based on this framework. Tsoutsos et al. [7] conducted a study in Crete and found that 2517 km2 on the island are available. Latinopoulos and Kechagia [8] also conducted a study in the region of Kozani based on SFSPSD-RES, but they excluded the areas where the average wind speed is below 4.5 m/s and the slope above 25%, concluding that there are 550 km2 available for wind farms.
In this study, the series of land constraints that were used to analyze the land eligibility of onshore wind in Greece are summarized in Table 1. These were based on SFSPSD-RES, a previous study conducted in Greece [16], and a generalized land constraints list for onshore wind developed by Ryberg [27]. In order to estimate the eligible area and distributions for onshore wind turbines, a reference wind turbine was used (Table 2). The parameters of this reference wind turbine correspond to the Vestas V136 wind turbines available at present and to technology changes for future wind turbines by 2050 [28].
In the socio-political group of criteria, SFSPSD-RES set a safe distance to urban (population > 2000 inhabitants) and rural (population < 2000 inhabitants) settlements considering noise and safety factors that could cause a negative impact on society [33]. At the same time, it clearly stipulated that wind turbines must be installed at least 1500 m away from touristic areas. For safety reasons, wind turbines should be installed at a distance from airports due to the possible interference with aviation radar signals [33]. Also, they should be installed at a certain distance from roads, railways, and power lines, but to reduce transportation and transmission cost, the distance should not be too large [34]. Land use covers, such as agricultural, industrial, and mining areas, were excluded in related studies of Greece [6,7,8]. However, this work sought to explore the RES potential of deserted and decommissioned lignite mines in Greece without excluding mining sites.
In the physical group, slope was assessed as the third most significant factor affecting the construction of wind turbines in the study of Karamountzou and Vagiona [10]. Less steep land provides a better access to construct and maintain wind turbines [33,35]; therefore, the present study excluded areas with slopes greater than 17°. According to SFSPSD-RES [16], wind turbines are not allowed to be constructed in the areas of sand, wetland, and woodland and should be constructed 1500 m away from the coastline. Waterbodies and rivers are often covered by protected area status and are important for the functioning of biodiversity and ecosystems [36]. Therefore, waterbodies and rivers were excluded in this work.
Natura 2000 areas are explicitly excluded by SFSPSD-RES. However, Natura 2000 status only includes protected bird and habitat areas. Considering the cultural environment and heritage protection of Greece, it is worth setting a certain exclusion threshold around protected natural monuments, parks, and landscapes [8].
In order not to reduce the performance and increase the cost of construction and maintenance of wind turbines, the study by Karamountzou and Vagiona [10] combined technology and economics to evaluate the criteria, and found four important economic criteria, one of which was slope and the remainder were wind velocity, access distance (the distance from accessible roadways), and connection distance (the distance from a power line). Wind speed is an extremely important factor affecting the operation of wind turbines. The wind turbine starts to work when the wind speed reaches a certain value, at which the wind speed is called cut-in speed [28]. According to the power curve of the reference turbine, the cut-in speed is 4 m/s [28]. Therefore, areas where the average wind speed is below 4 m/s were excluded. Under the condition of ensuring that the wind turbines are at a certain safe distance from roadways and power lines, the distance should not be too large, because it will lead to increased construction, maintenance, and electricity production and transmission costs [9,35]. Finally, the thresholds for access and connection distance were determined based on the study by Ryberg et al. [27].

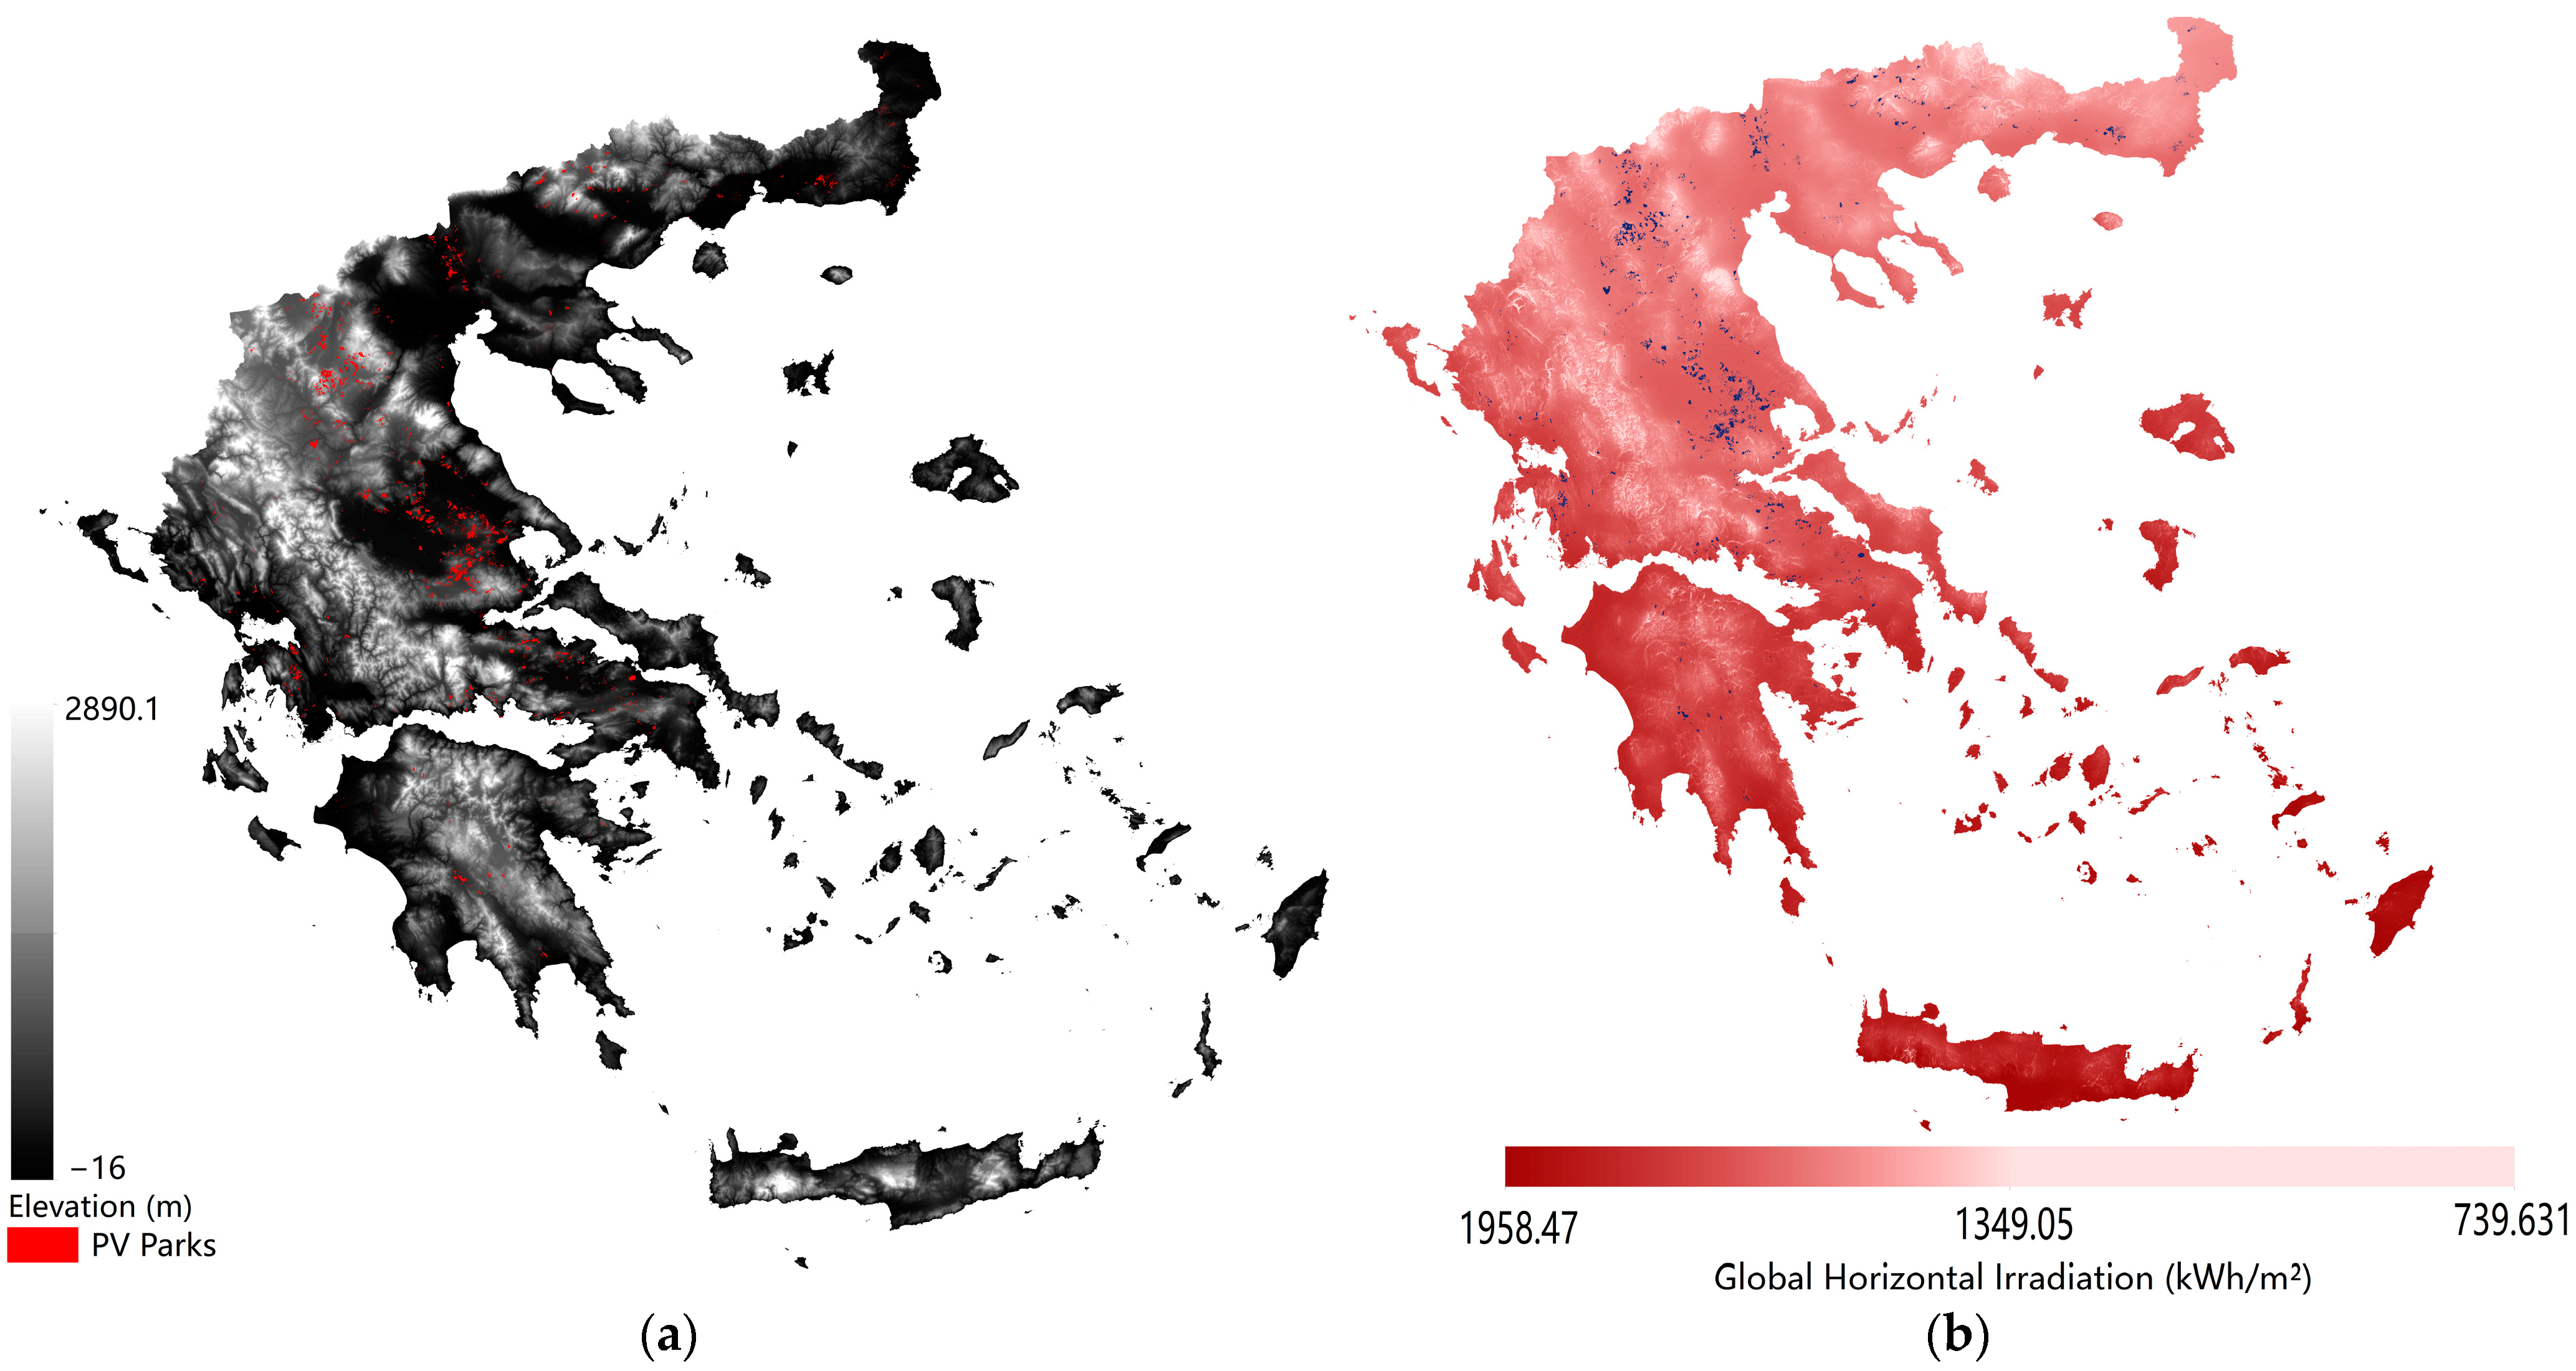
2.5. Open-Field PV Land Eligibility Analysis

While there are many studies on the land eligibility analysis of onshore wind, studies on the suitable construction of open-field PV power plants are relatively few. However, the analysis of land eligibility for PV in open areas adopts the analysis method of multi-criteria exclusion, considering the factors of society, technology, environment, and economy as well as that of onshore wind. A detailed study of European wind and solar energy potential by Ryberg [28] presented a consilient list that included 26 criteria that could be applied as exclusion constraints to select eligible areas for PV at the country level of Europe and found that the area eligible for open-field PV is 294,851 km2 in Europe and the eligible area in Greece is 11,740 km2. Although these established exclusion criteria cannot be fully generalized for open-field PV studies in a specific country, it lays the foundation for related studies in Europe. Based on exclusion criteria listed by Ryberg [28], Tlili et al. [37] conducted a literature review [38] about the areas that need to be excluded for the construction of PV power plants in France and found that the potential area for PV in France is 40,694 km2. Likewise, on the basis of the general exclusion criteria list, Maestre et al. [39] reduced the threshold for some criteria, such as adjusting the distance from settlements areas from 200 m to 100 m, because the work was based on a hypothetical framework favorable to Spanish decarbonization goals between 2030 and 2050, and added some criteria in line with Spanish national conditions, such as historical sites. Finally, Maestre et al. [39] found that there was 143,820 km2 eligible for open-field PV panels in Spain. Few studies have been conducted on the suitable sites of open-field PV in Greece. Vagiona [11] conducted a study on Rhodes Island (Greece), which considered 6 exclusion criteria, such as land cover, distance from protected areas, and altitude, based on SFSPSD-RES and showed that nine sites were eligible for open-field PV on Rhodes Island without mentioning the total eligible area. Unlike other studies [37,39], the criteria chosen for excluding land constraints in the study by Vagiona [11] did not include the slope and northward slope factors, which could lead to a poor performance of the PV panels due to shading [28].
Although the SFSPSD-RES of Greece provides exclusion criteria for wind turbines’ construction and many related studies provide detailed land constraints and thresholds based on this framework, the exclusion criteria for PV power plants have not been elaborated. Therefore, in this section, the analysis of open-field PV land eligibility for Greece was mainly based on some criteria for the site selection of PV parks mentioned in the SFSPSD-RES and the detailed study by Ryberg [28] on analyzing PV potential in Europe (Table 3). Meanwhile, as Greece is very close to Turkey and the climate of the two countries is similar, this section combined relevant studies conducted in Turkey to provide a more informative analysis. Additionally, a specific PV panel (Table 4) was used as a reference to determine the eligible areas for open-field PV power plants and to model their distribution in decommissioned lignite mines. The selected PV panel offered the optimal representation of distribution, while ensuring the highest number of full load hours [28].
Initially, according to SFSPSD-RES [16], the construction of PV parks is prohibited in areas of agriculture, wetlands, forests, natural monuments, protected landscapes, national parks, and Natura 2000 areas.
In the group of socio-political criteria, PV power plants should be built close enough to residential areas to provide a better energy demand and lower costs of electricity transmission without affecting the lives of residents [40]. In order to avoid accidents caused by the reflection of PV panels, based on the study by Vagiona [10], airports and the surrounding area within 2000 m were excluded. Most studies [11,28,41,42] considered some land covers, such as operational industrial and mining areas, as exclusion criteria since activities on them can stain PV panels leading to an inefficient performance. The same applies for land eligibility for onshore wind; however, this study did not exclude mining sites.
In physical criteria, in addition to considering the overall terrain slope (steep terrain can increase the construction cost), the northward slope should be also considered, because the self-shading losses of PV panels can be significantly high even with only slightly north-facing slopes [28]. Constructing PV power plants in high-altitude areas will increase the cost of the installation and transportation of materials; therefore, it is suggested to set the exclusion threshold of elevation to 1500 m [11]. At the same time, in order not to pollute environmental water resources when constructing PV panels, Ryberg’s study [28] suggested that waterbodies and surrounding areas up to 500 m should be excluded. According to several studies [41,42,43], since the topography and geological structure of sands and beaches are not suitable for constructing PV power plants, sandy and beach areas were excluded.
Two significant economic indicators were considered in this section, namely, connection distance (the distance to power lines) and access distance (the distance to accessible roads). It is suggested that PV power plants should be constructed as close as possible to power lines, since the farther away from the power lines, the higher the cost and loss of electricity power transmission [44]. Moreover, it is also necessary to ensure that the distance between PV stations and the road is not too far, because a longer distance will increase the transportation cost of construction and the cost of operation and maintenance [45]. In summary, based on Ryberg’s study [28], this section excluded the areas that were more than 20 km away from power lines and more than 10 km away from roads.

2.6. Deserted Lignite Mine Potential

According to the NECP, the Greek government has set a goal to completely eliminate coal-fired power generation in the country by 2028 [46]. Based on this plan, some lignite power stations, such as Kaida I and II as well as Amyndeo I and II, have been shut down since 2019 [47]. However, for Greece, a country long dependent on lignite for power generation, such an ideal and complete energy transition is difficult. In order to stabilize the electricity power supply system for a future entirely powered by natural gas and RESs, five lignite-burning power stations in Agios Dimitrios, Meliti, and Megalopolis are scheduled to have their operations extended to 2025 by the Public Power Corporation (PPC) in Greece [48]. It is obvious that the phasing out of lignite power generation is inevitable based on the energy transition plan of the Greek government. In the context of the shutdown of lignite-fired stations, lignite mines will be decommissioned, with potentially large areas without conservation value becoming available for other uses, such as renewable power generation. Meanwhile, there is an excellent connection to the power grid at these locations, which can be used by the newly installed PV parks. Therefore, it is important to analyze the RES potential of former lignite mines in Greece.
In this section, a lignite mining site in Megalopoli (Figure 2) and two lignite mining sites in Ptolemaida (Figure 3) were chosen as the study areas. The Ptolemaida Mine of Western Macedonia located in the northern part of Greece is the largest lignite mine in the whole of Greece, followed by what is the largest lignite mine in the Peloponnese Peninsula of Southern Greece, the Megalopoli Mine [49]. Due to the extension of operation at the Megalopoli lignite power station until 2025 and the expected closure of the Ptolemaida lignite power station in 2028, lignite mines in both regions are still in use. However, with the mandatory and inevitable shutdown of lignite power station in Megalopoli, the adjacent mine will be decommissioned in parallel, since lignite is not suitable for long-distance transport.
Without excluding mining sites using GLAES, this section aimed to explore the wind and solar energy potential in the mining areas of Megalopoli and Ptolemaida combined with WPD and GHI. Meanwhile, a reference wind turbine (Table 2) and solar panels (Table 4) were used to assess the renewable energy potential of these open-pit mines after their decommissioning. The separation distance for wind turbines was based on 8D × 4D, where D represents the rotor diameter of the turbine. The separation distance for PV parks was 1000 m.

3. Results

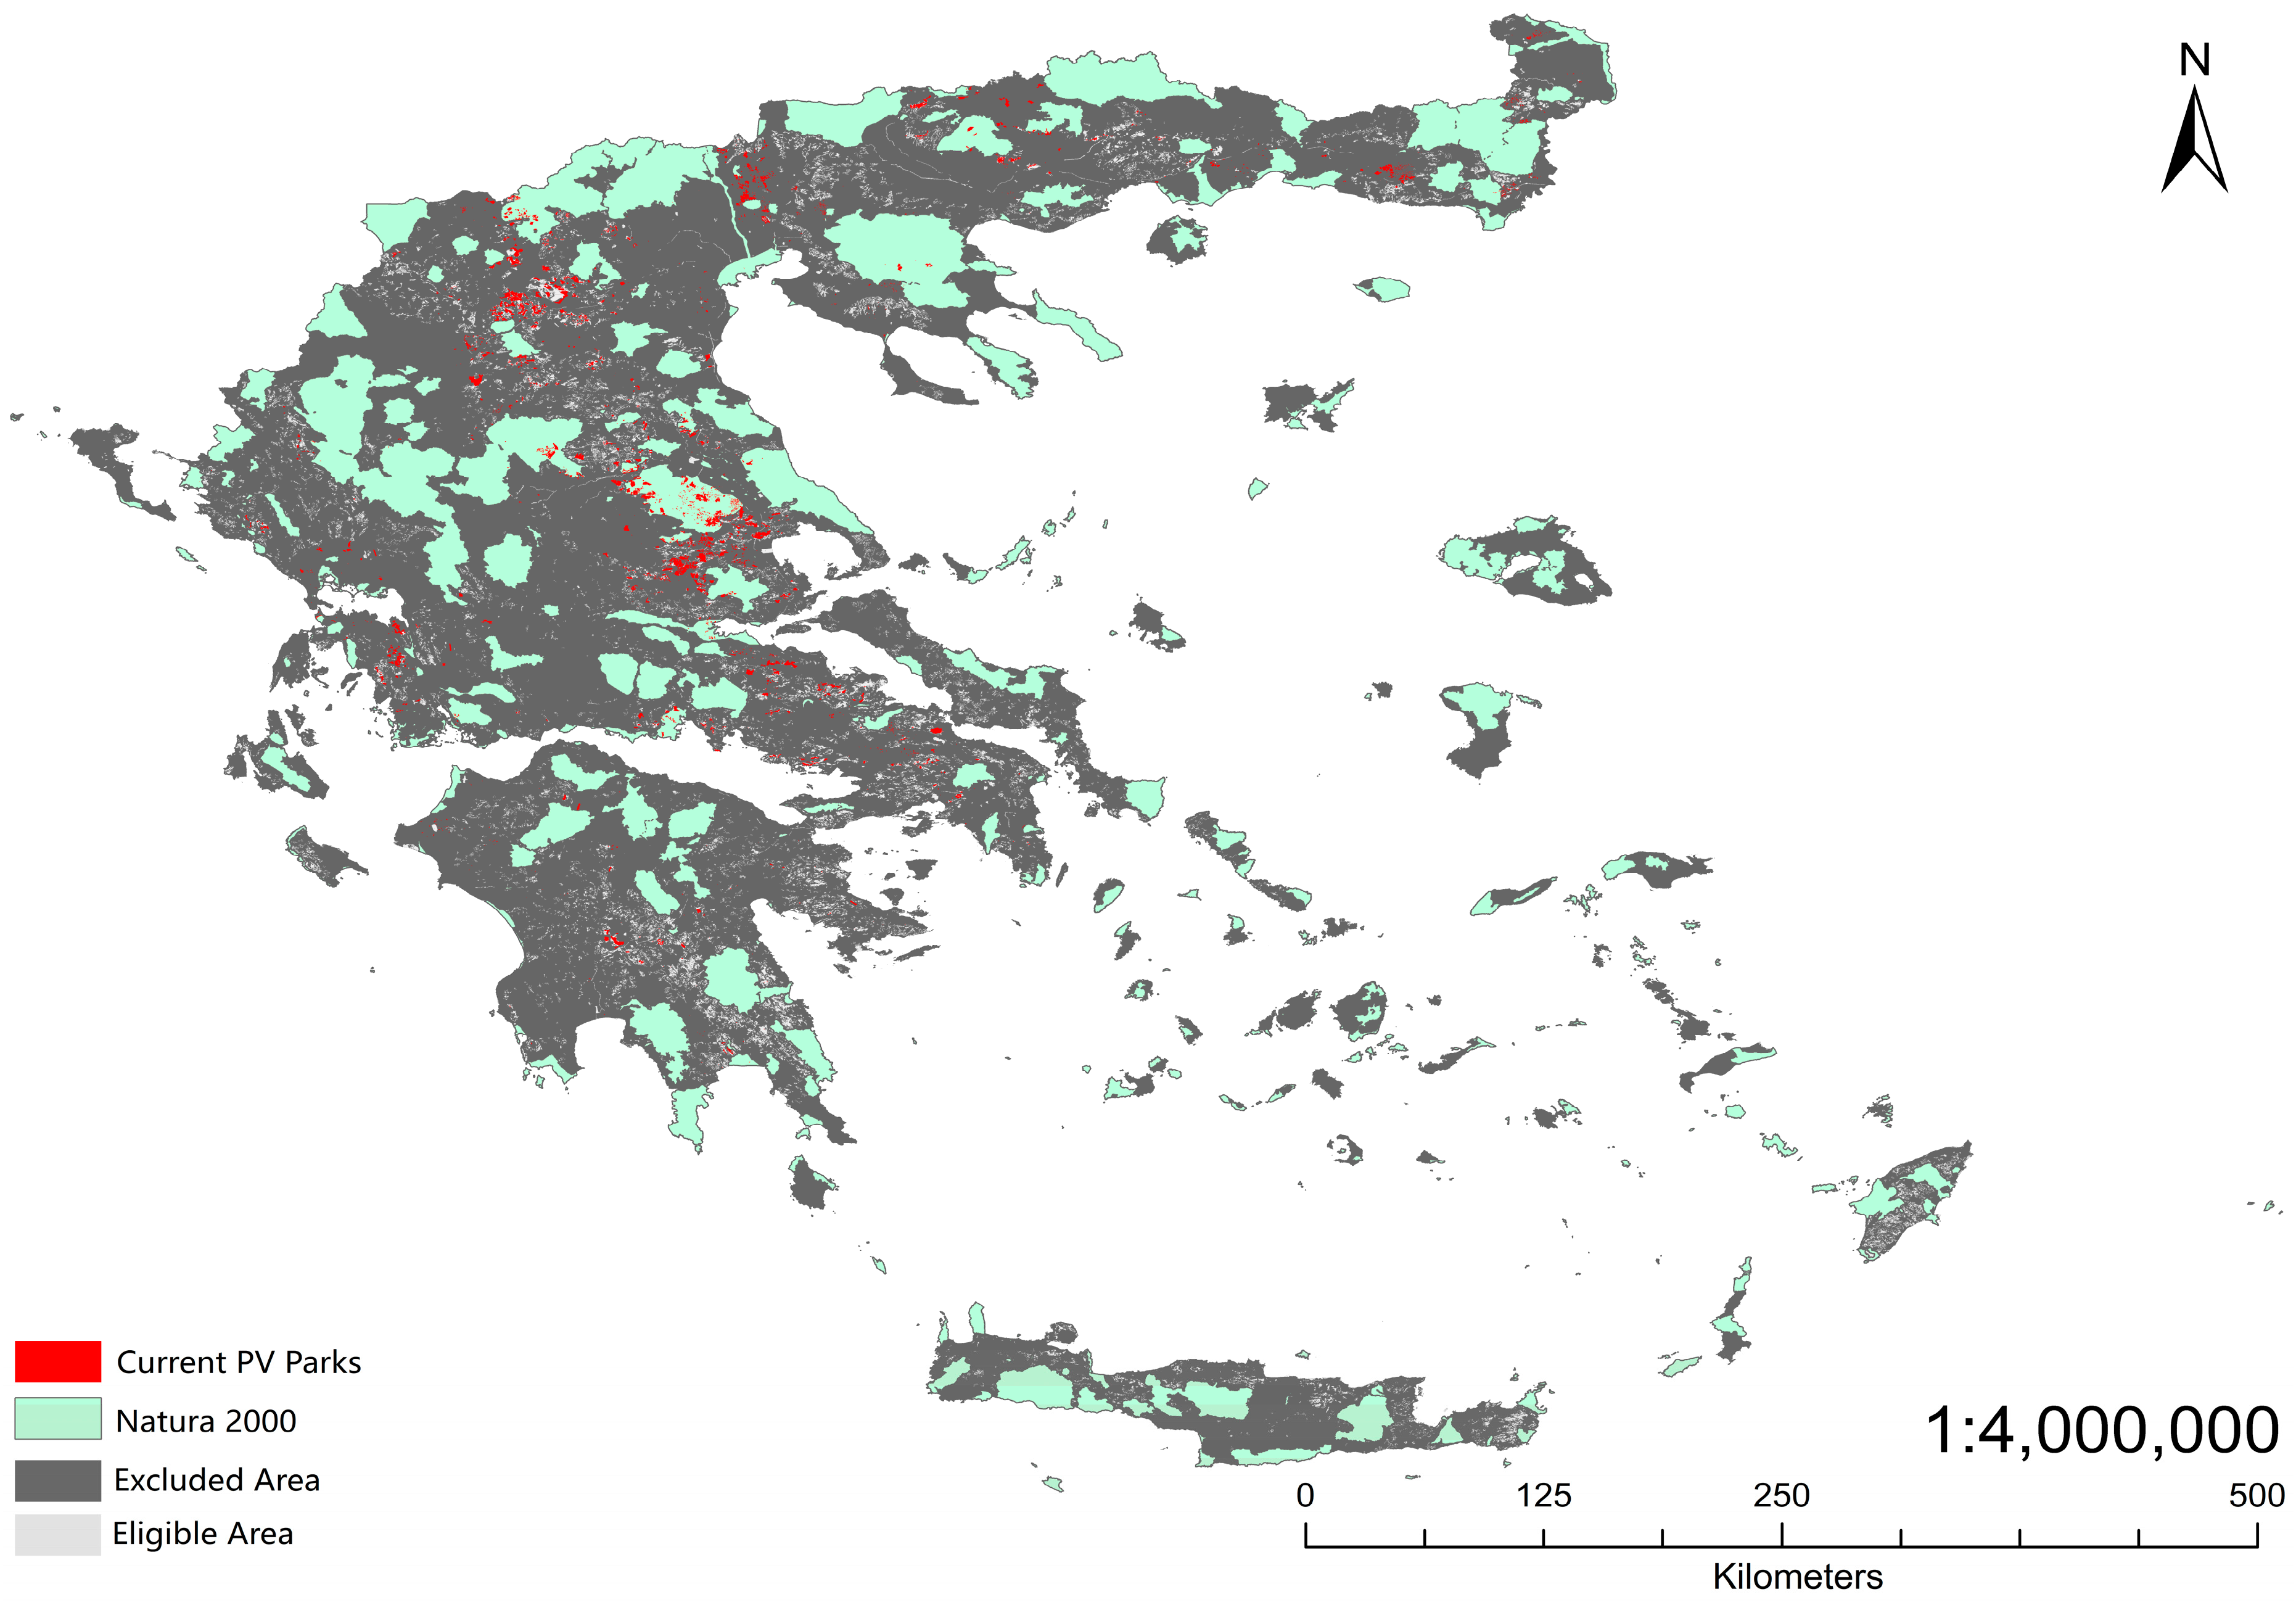
3.1. Current State of Wind Turbines and PV Power Plants

Figure 4 shows the current distribution of installed wind turbines in Greece, with the areas featuring wind turbines highlighted in red. The total area occupied by wind turbines is 2095 km2, accounting for 1.5% of Greece’s total land area.
By the end of 2022, the cumulative installed wind power capacity in Greece reached 4681.4 MW [50]. Wind turbines are predominantly distributed in Thrace, Western Macedonia, Central Greece, and the Peloponnese. Meanwhile, the altitude at which the wind farms were constructed is depicted in Figure 5a. The color of an area corresponds to its altitude, with high altitudes being represented by lighter shades and lower altitude by darker shades. The altitude values adhere to this color scheme in the subsequent diagrams related to DEM. Additionally, Figure 5b presents a WPD map combined with the locations of the existing wind farms. In this map, areas with a redder hue indicate higher mean WPD values, whereas areas with lighter shades of red correspond to lower mean WPD values. It is worth noting that the majority of the wind turbines were installed at relatively high altitudes, as shown in Figure 5a, specifically on mountain ridges. These areas exhibit higher mean WPD values in Greece, as indicated in Figure 5b, and higher average WPD values signify more abundant and favorable wind resources [19].
Figure 6 displays the current areas in Greece where PV parks have been constructed. The total land area occupied by PV parks is 1984 km2, accounting for 1.5% of the total land area of Greece. According to Petrova [51], the cumulative capacity of PV parks in Greece reached 5488 MWp in 2023. Meanwhile, it can be noted that the current PV parks are predominantly situated in Western Macedonia and Thessaly, where they are constructed on flat terrain with a relatively low elevation, as shown in Figure 7a. Since the GHI values can accurately quantify the solar energy potential for PV [52], higher GHI values correspond to a greater solar energy potential. Therefore, PV parks are strategically constructed in areas with relatively high GHI values, as shown in Figure 7b.

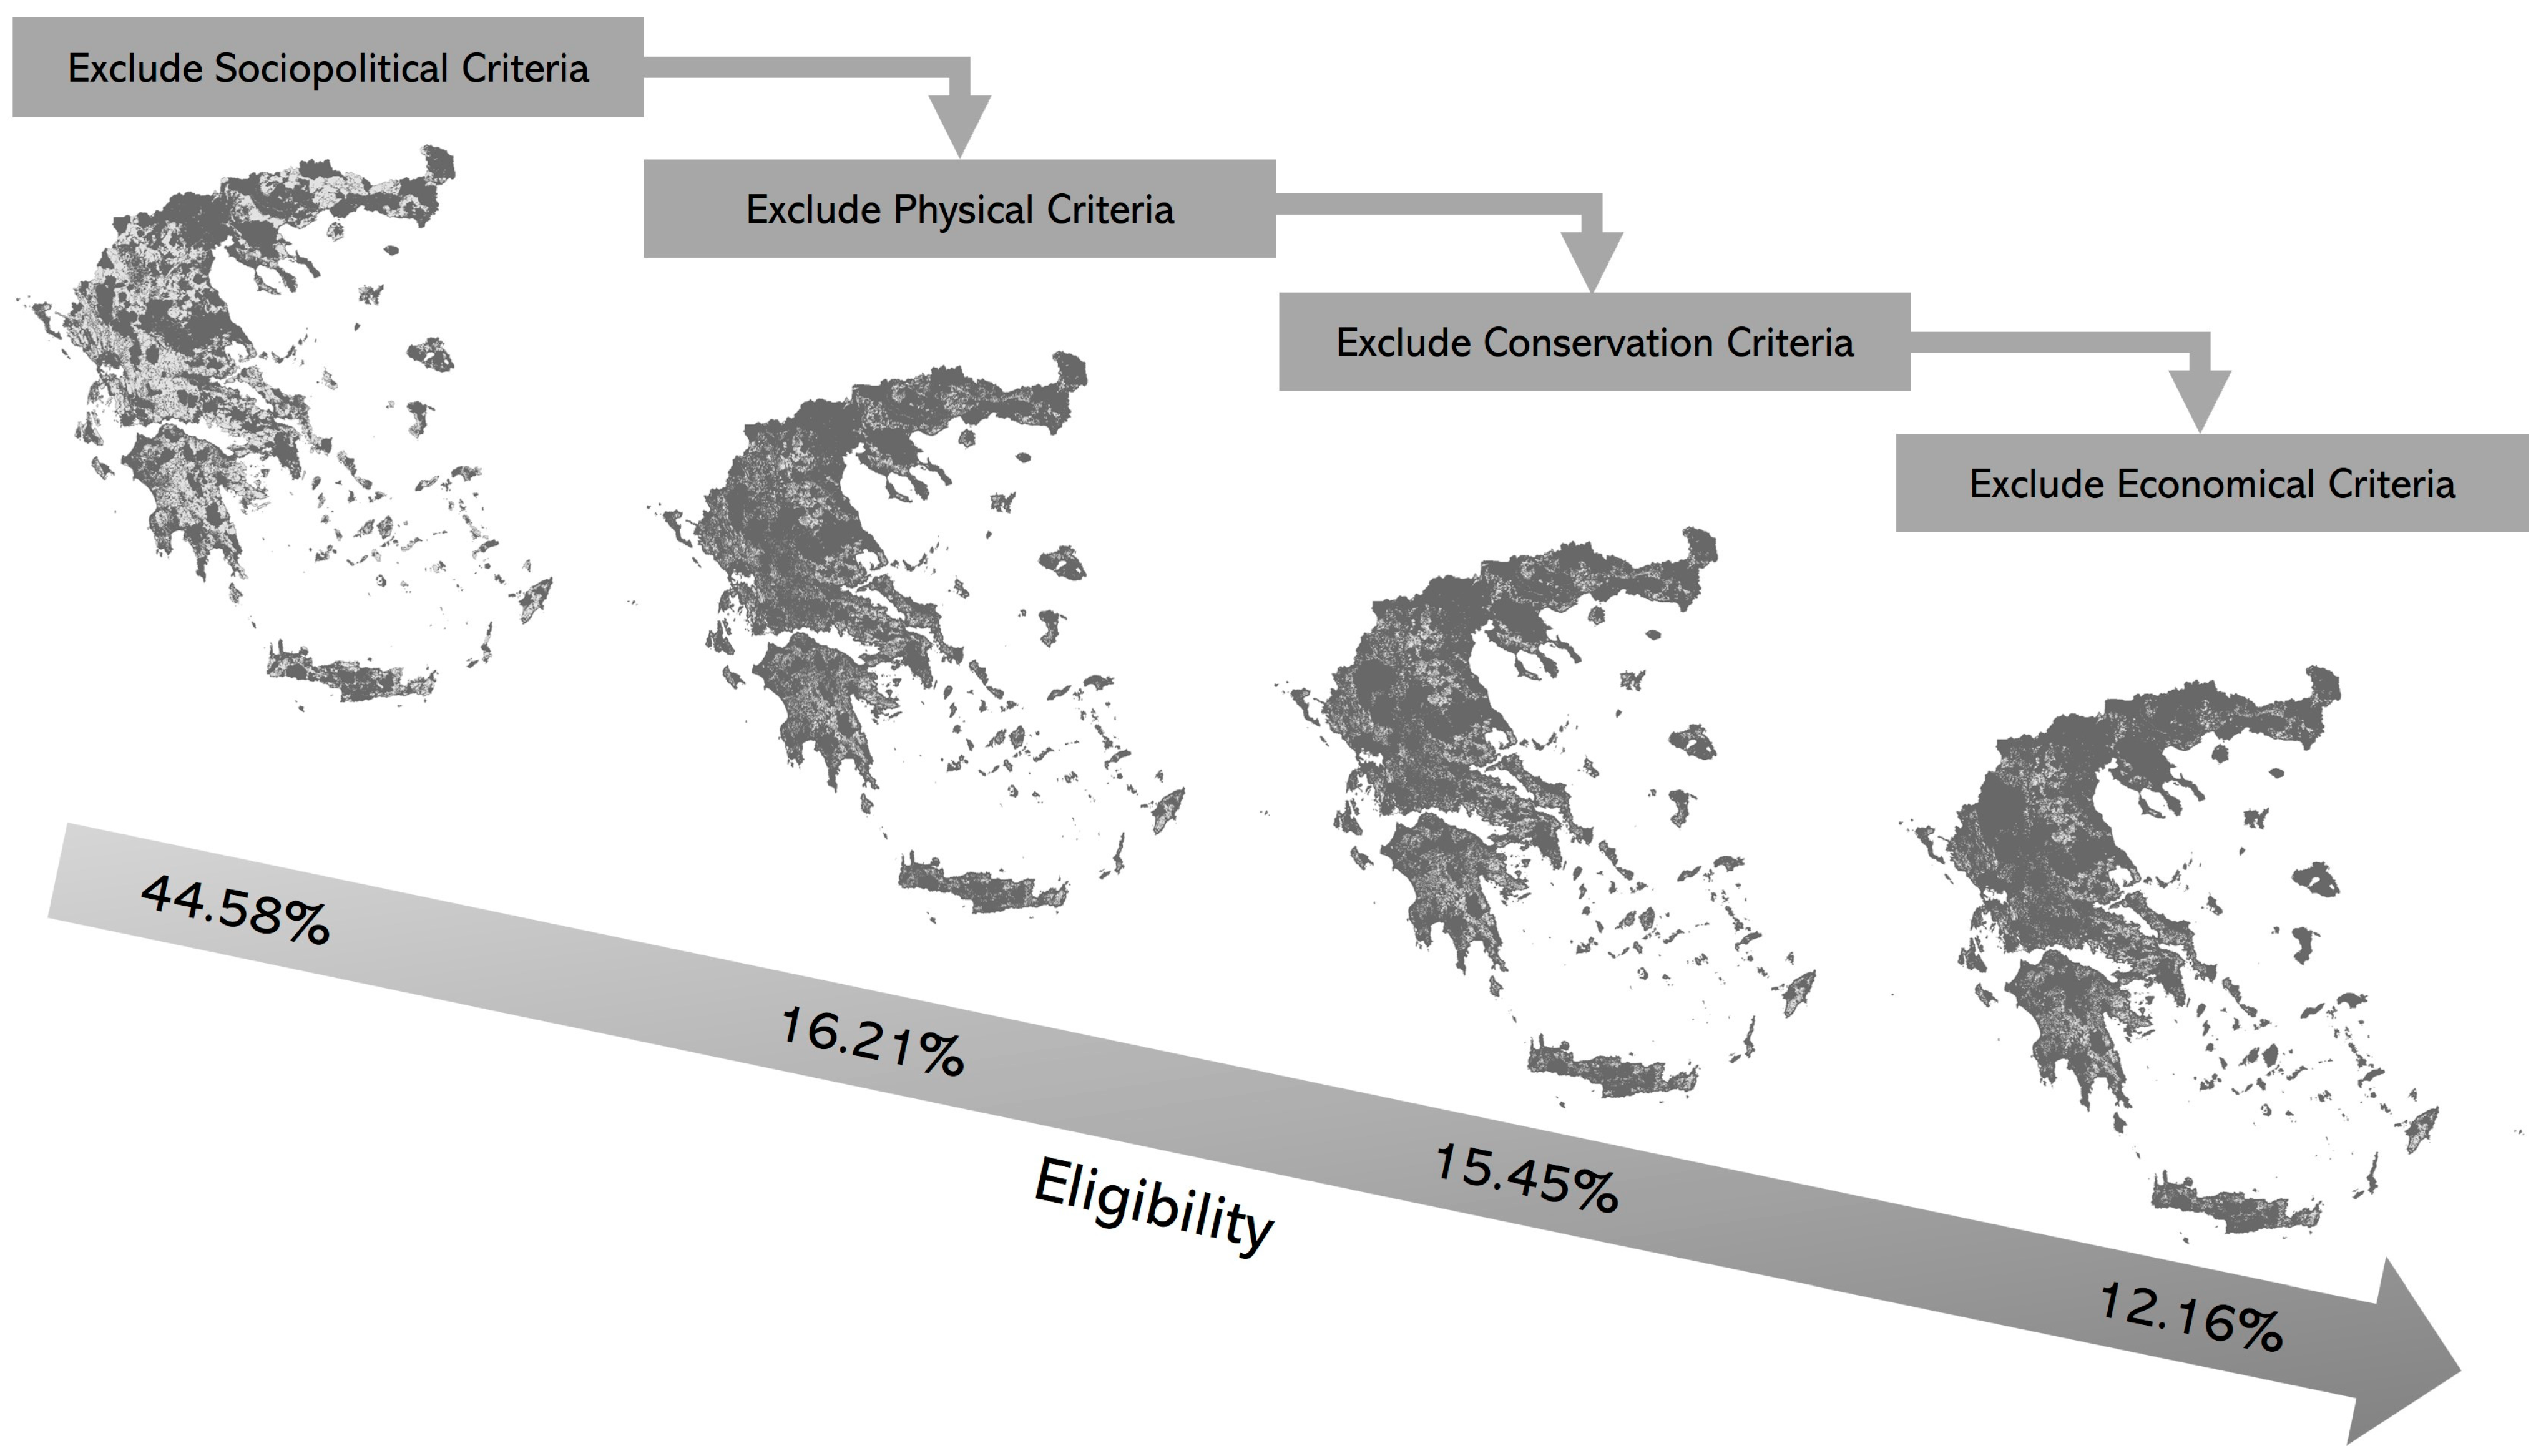
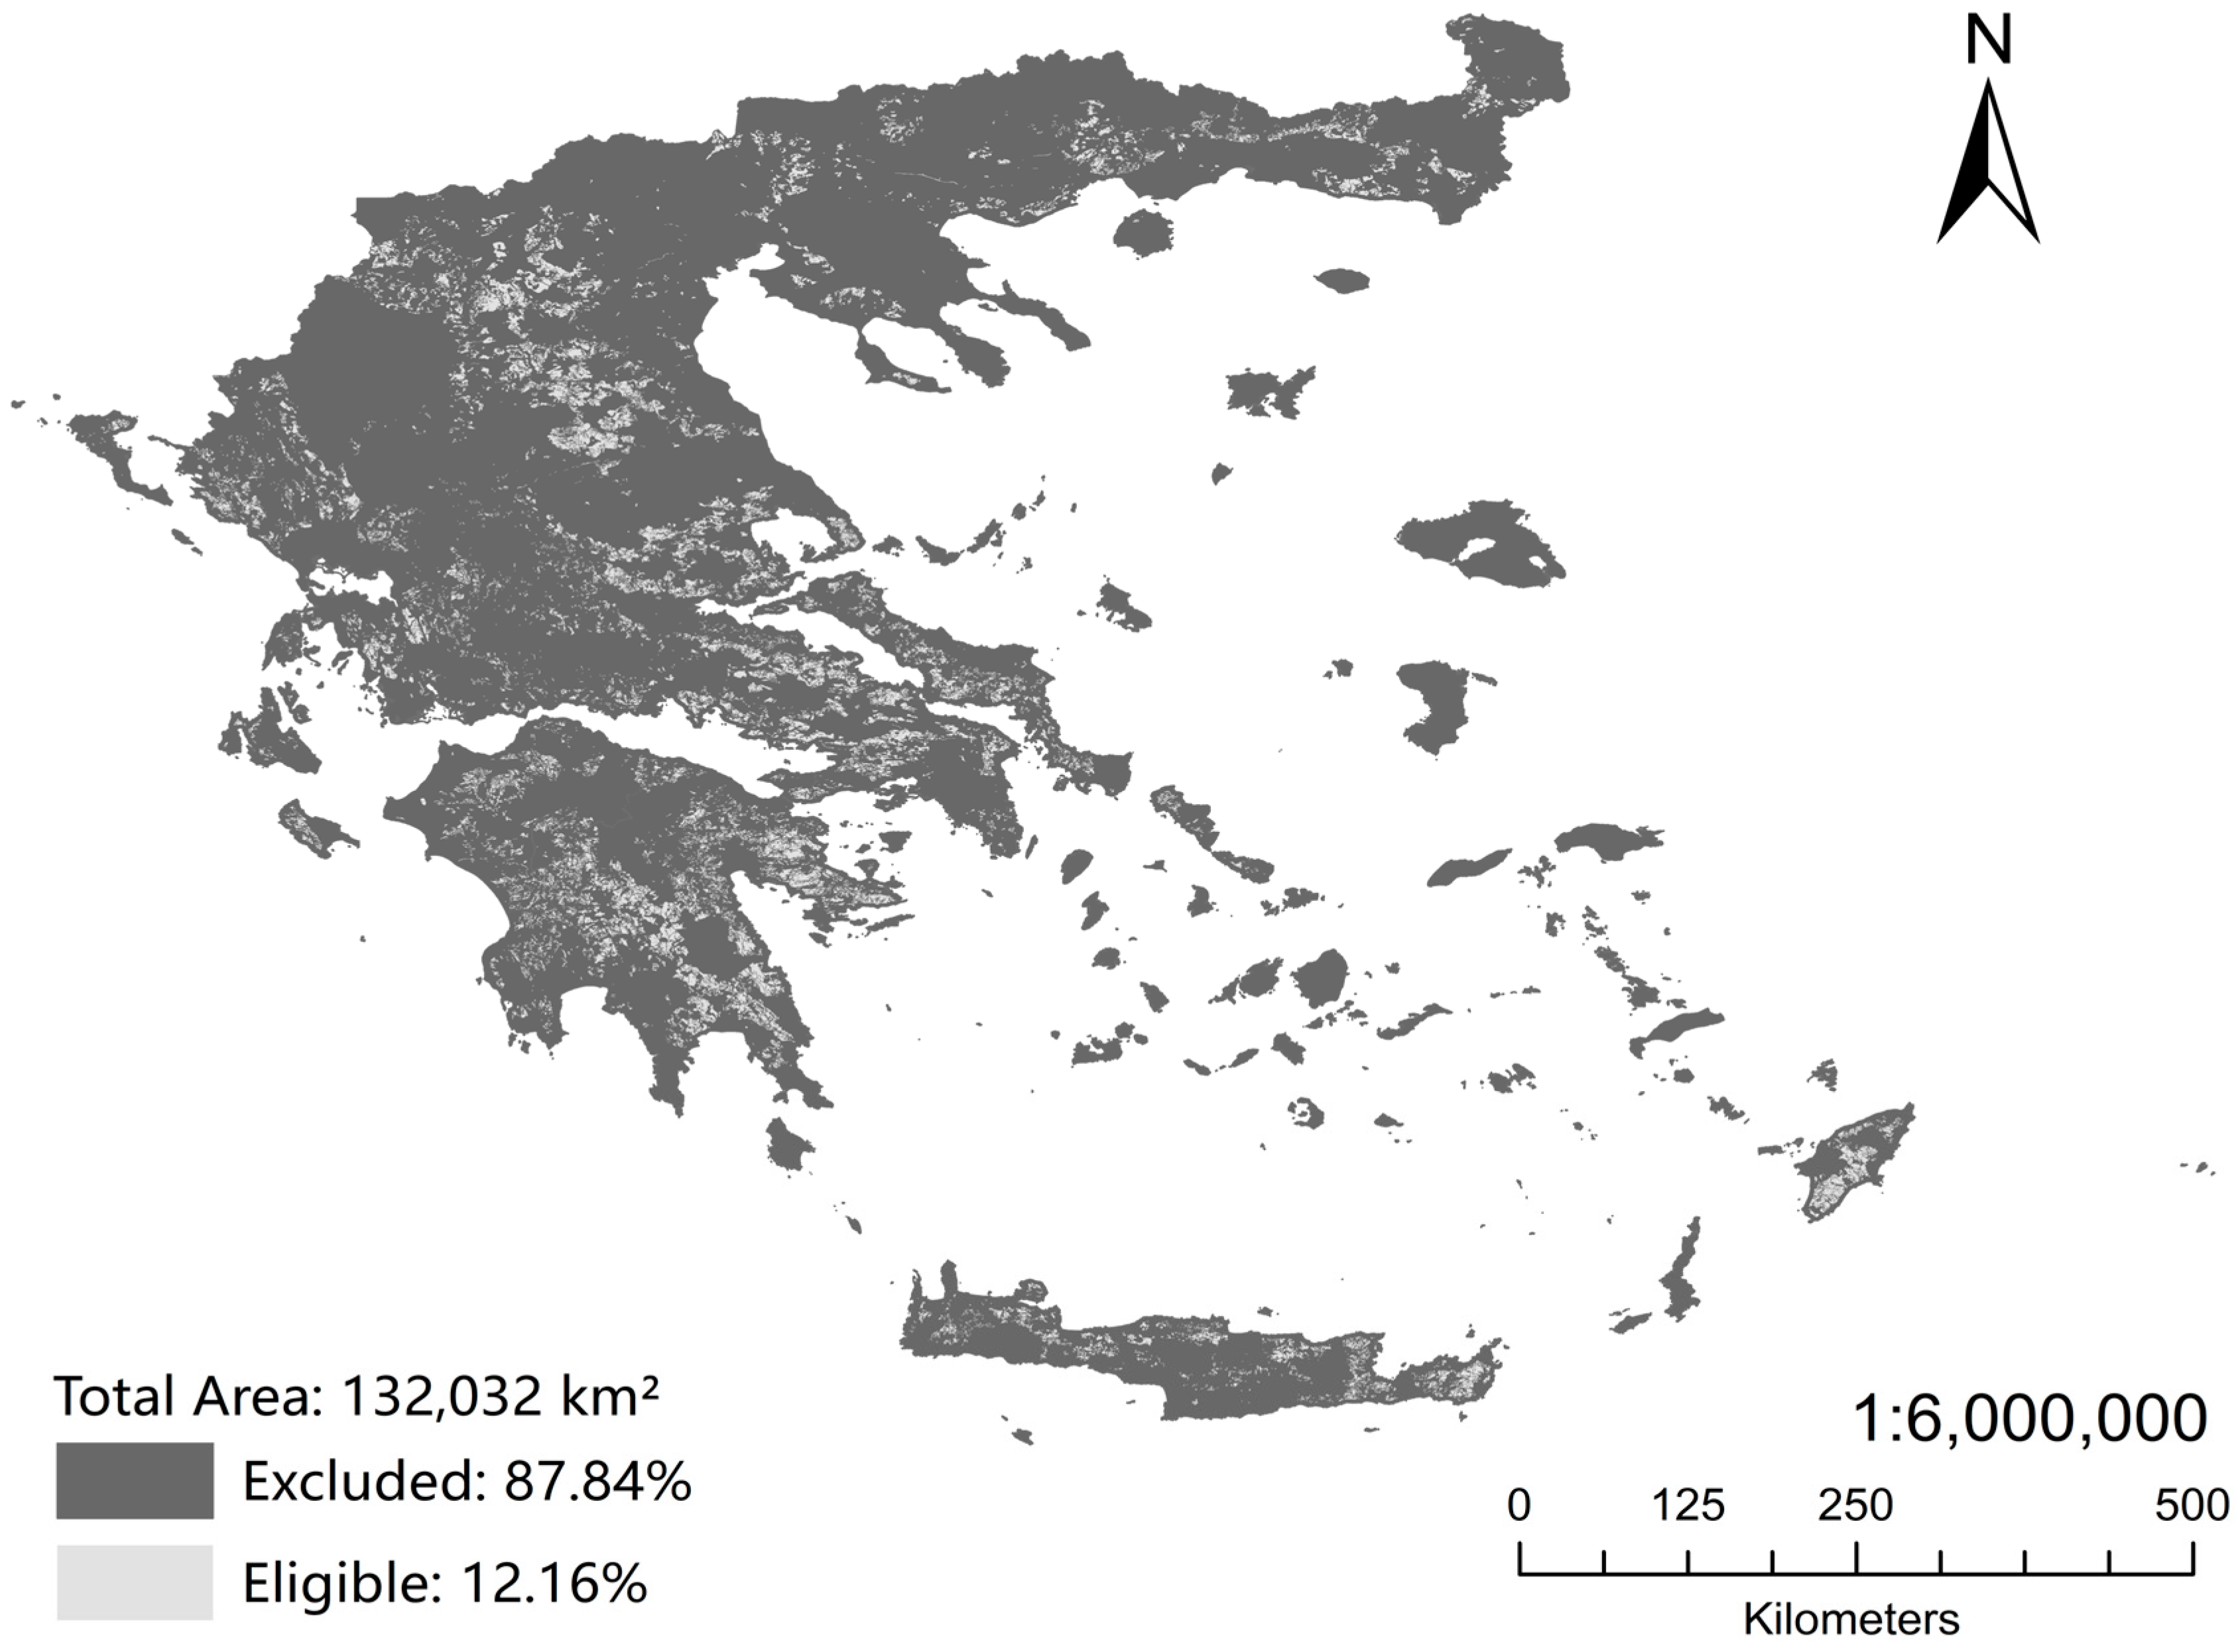
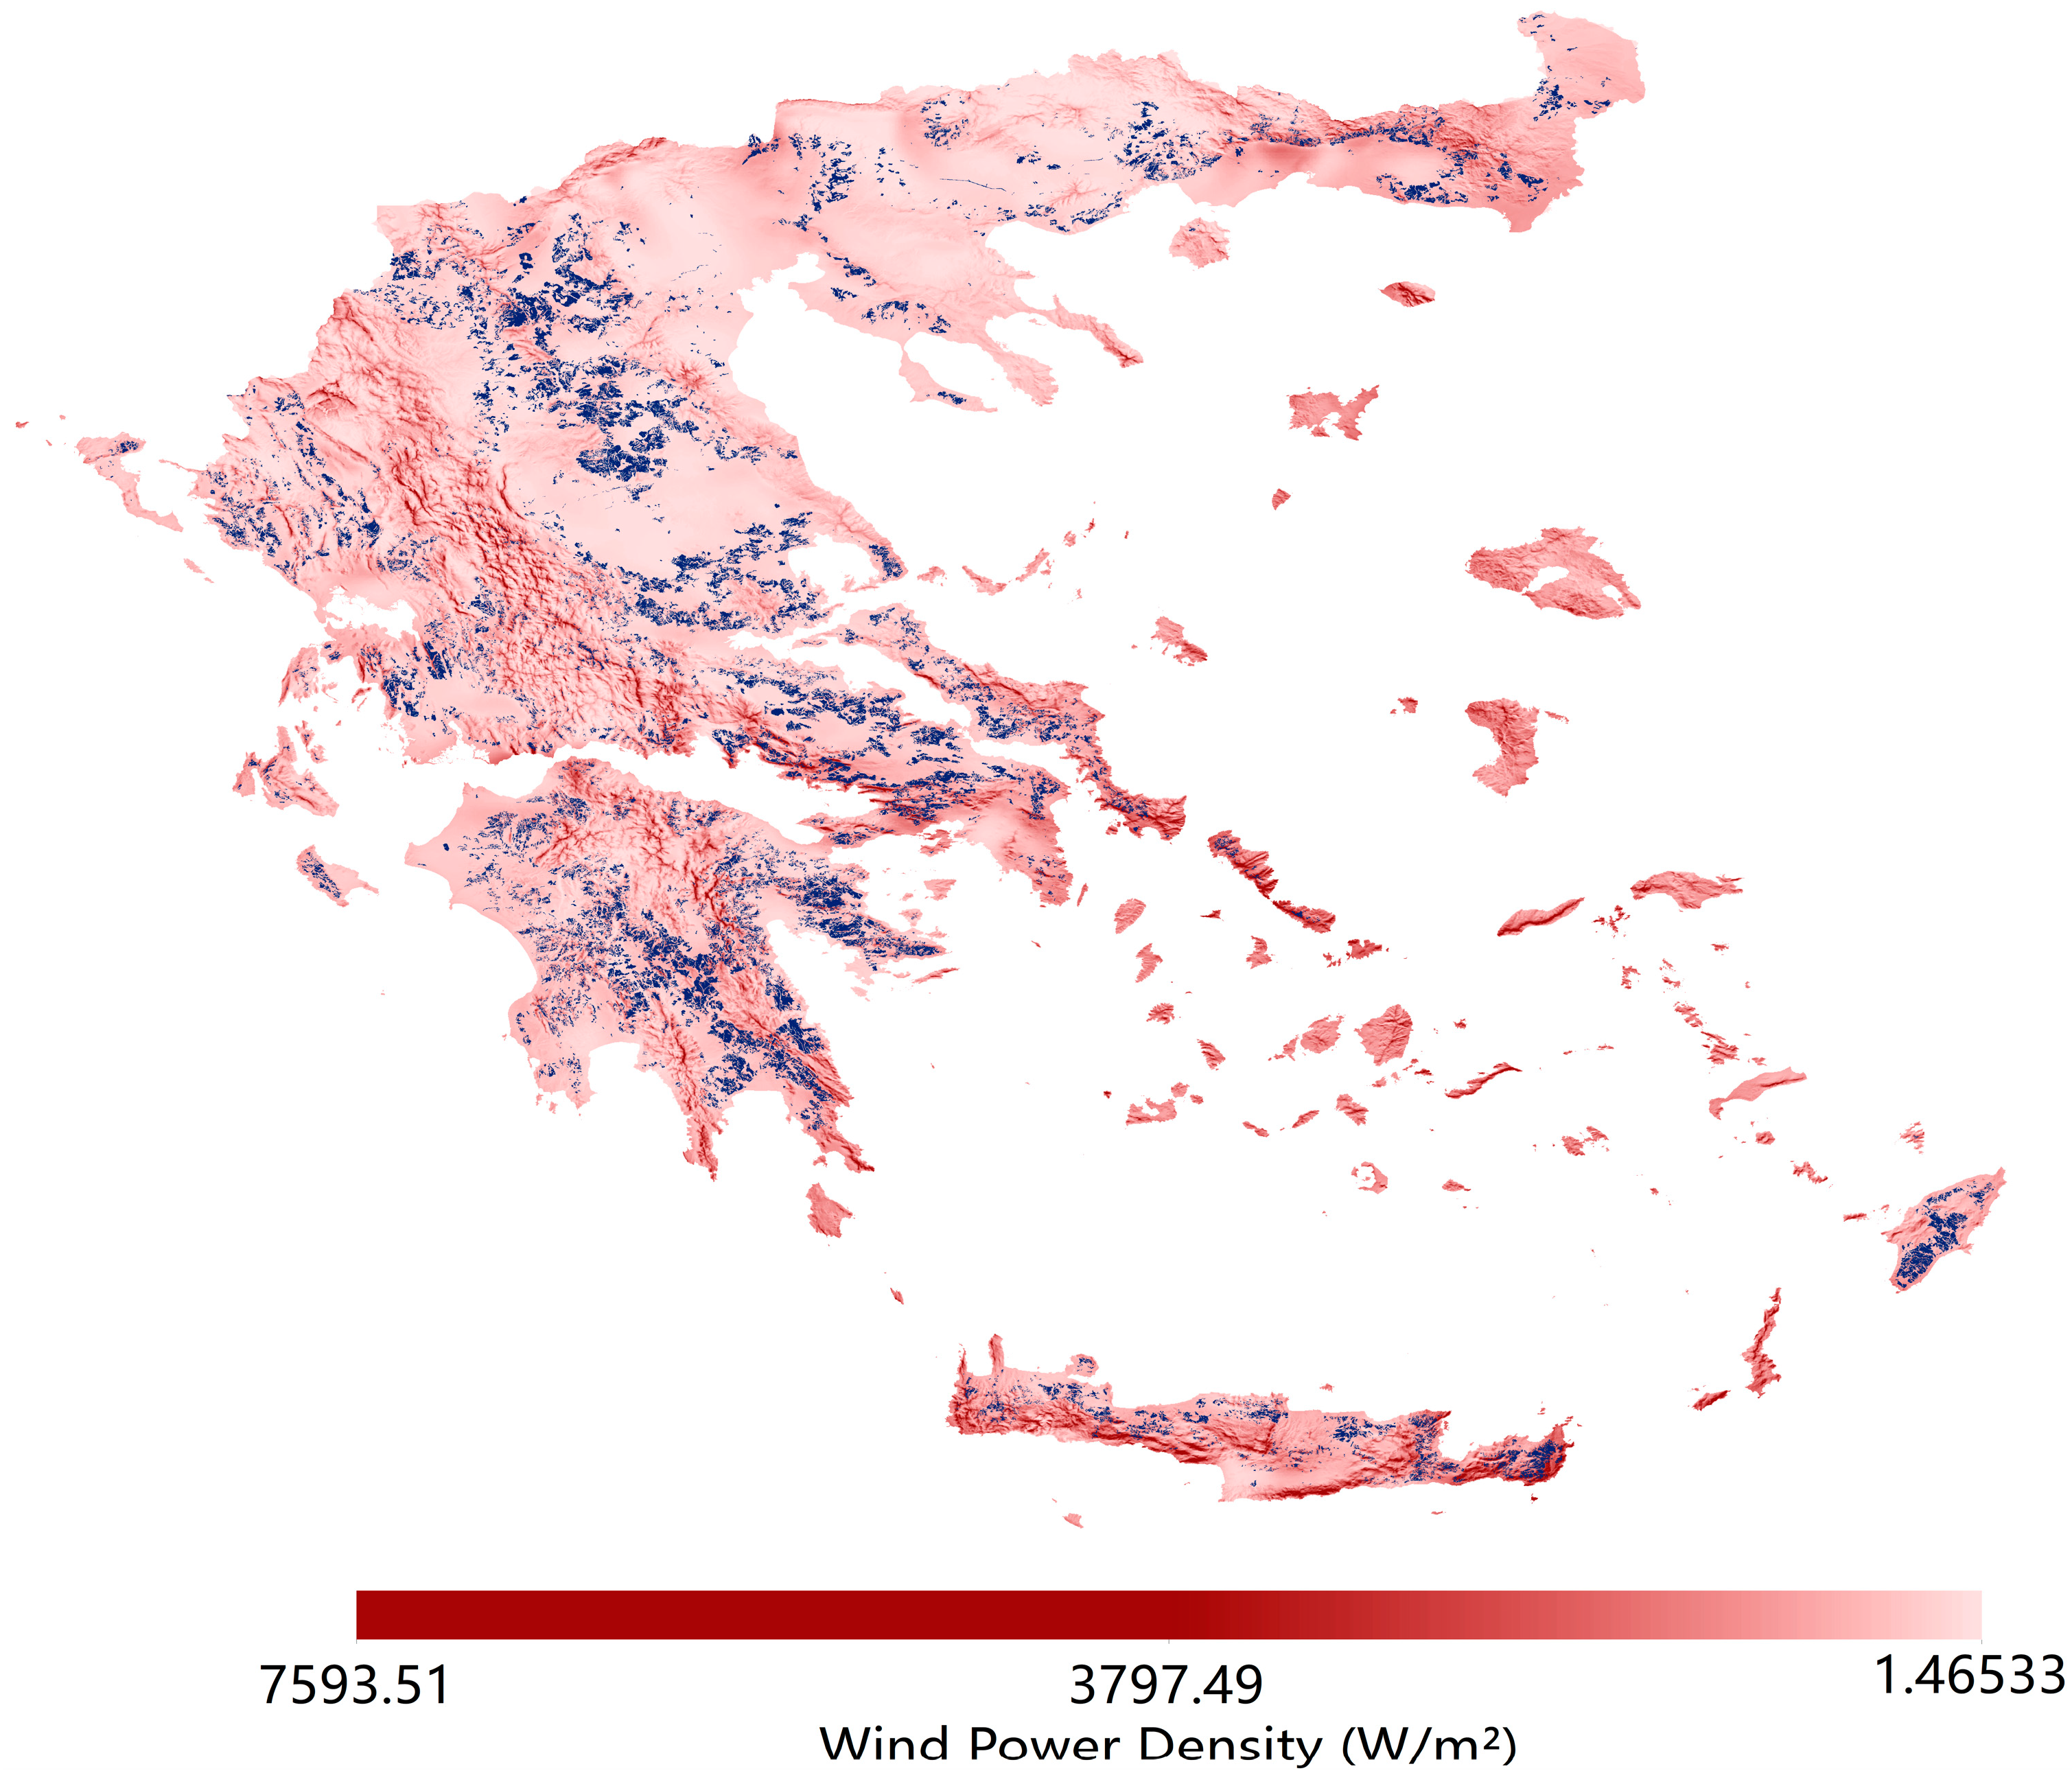
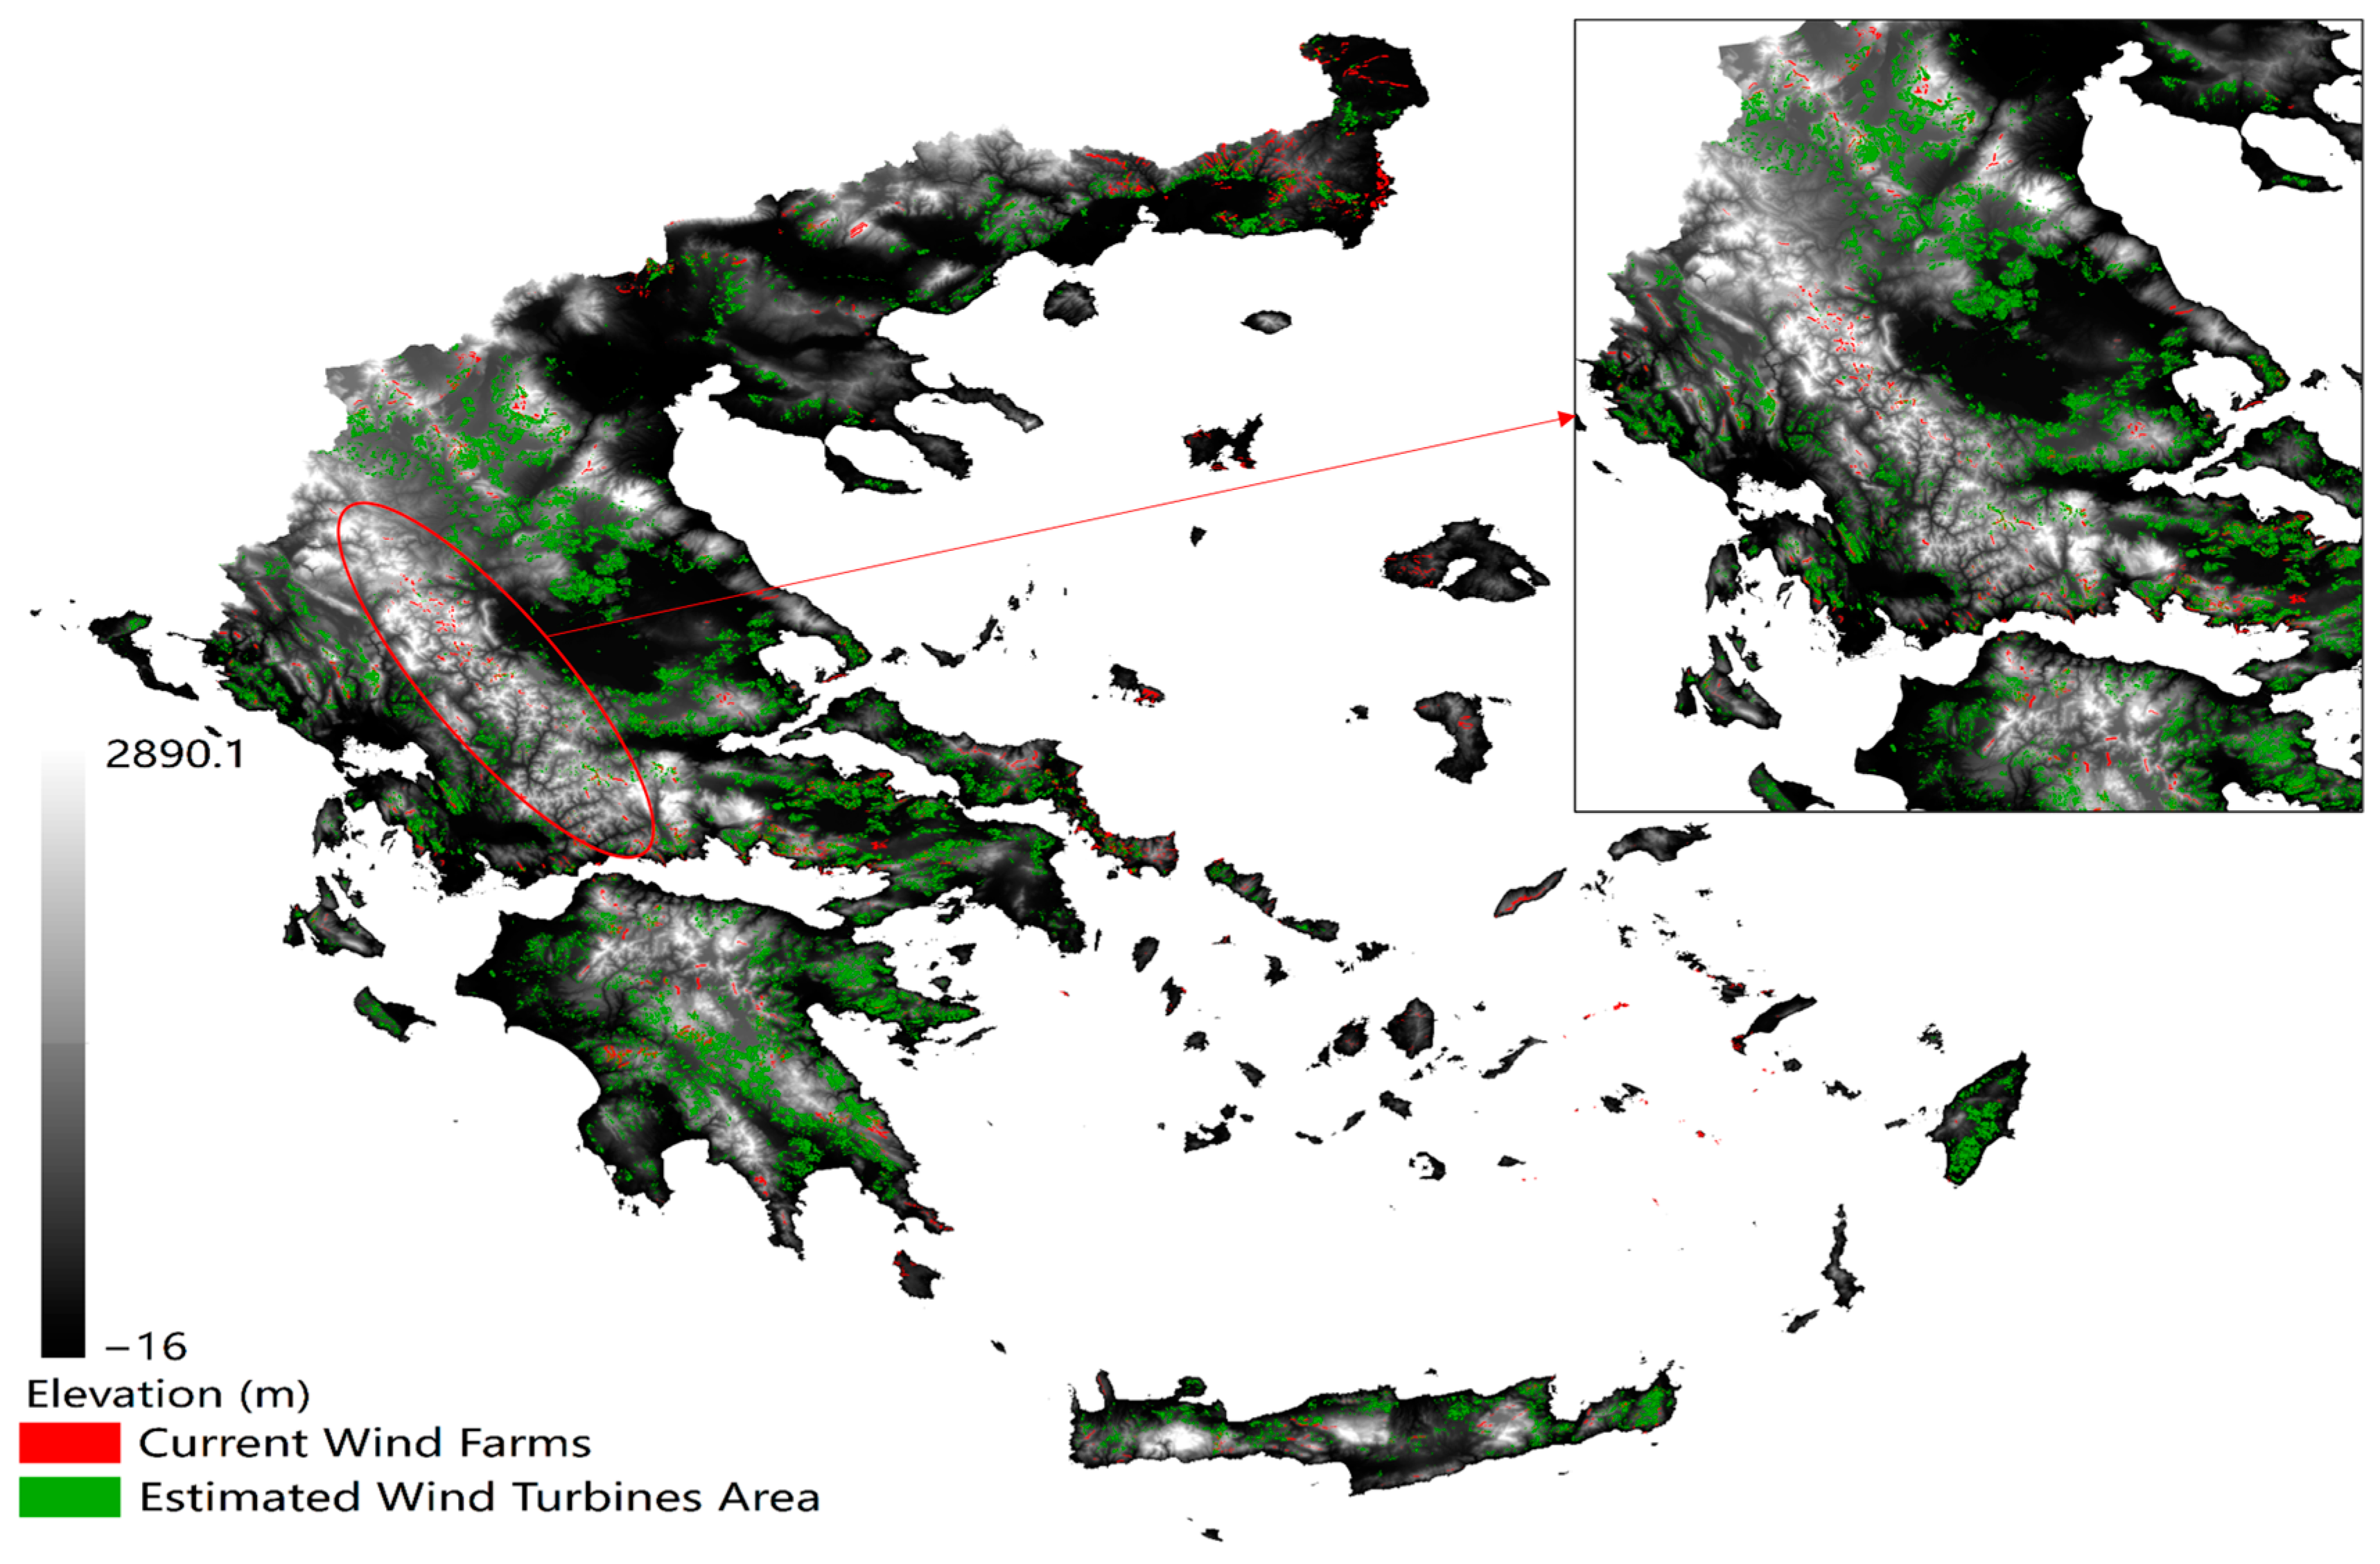
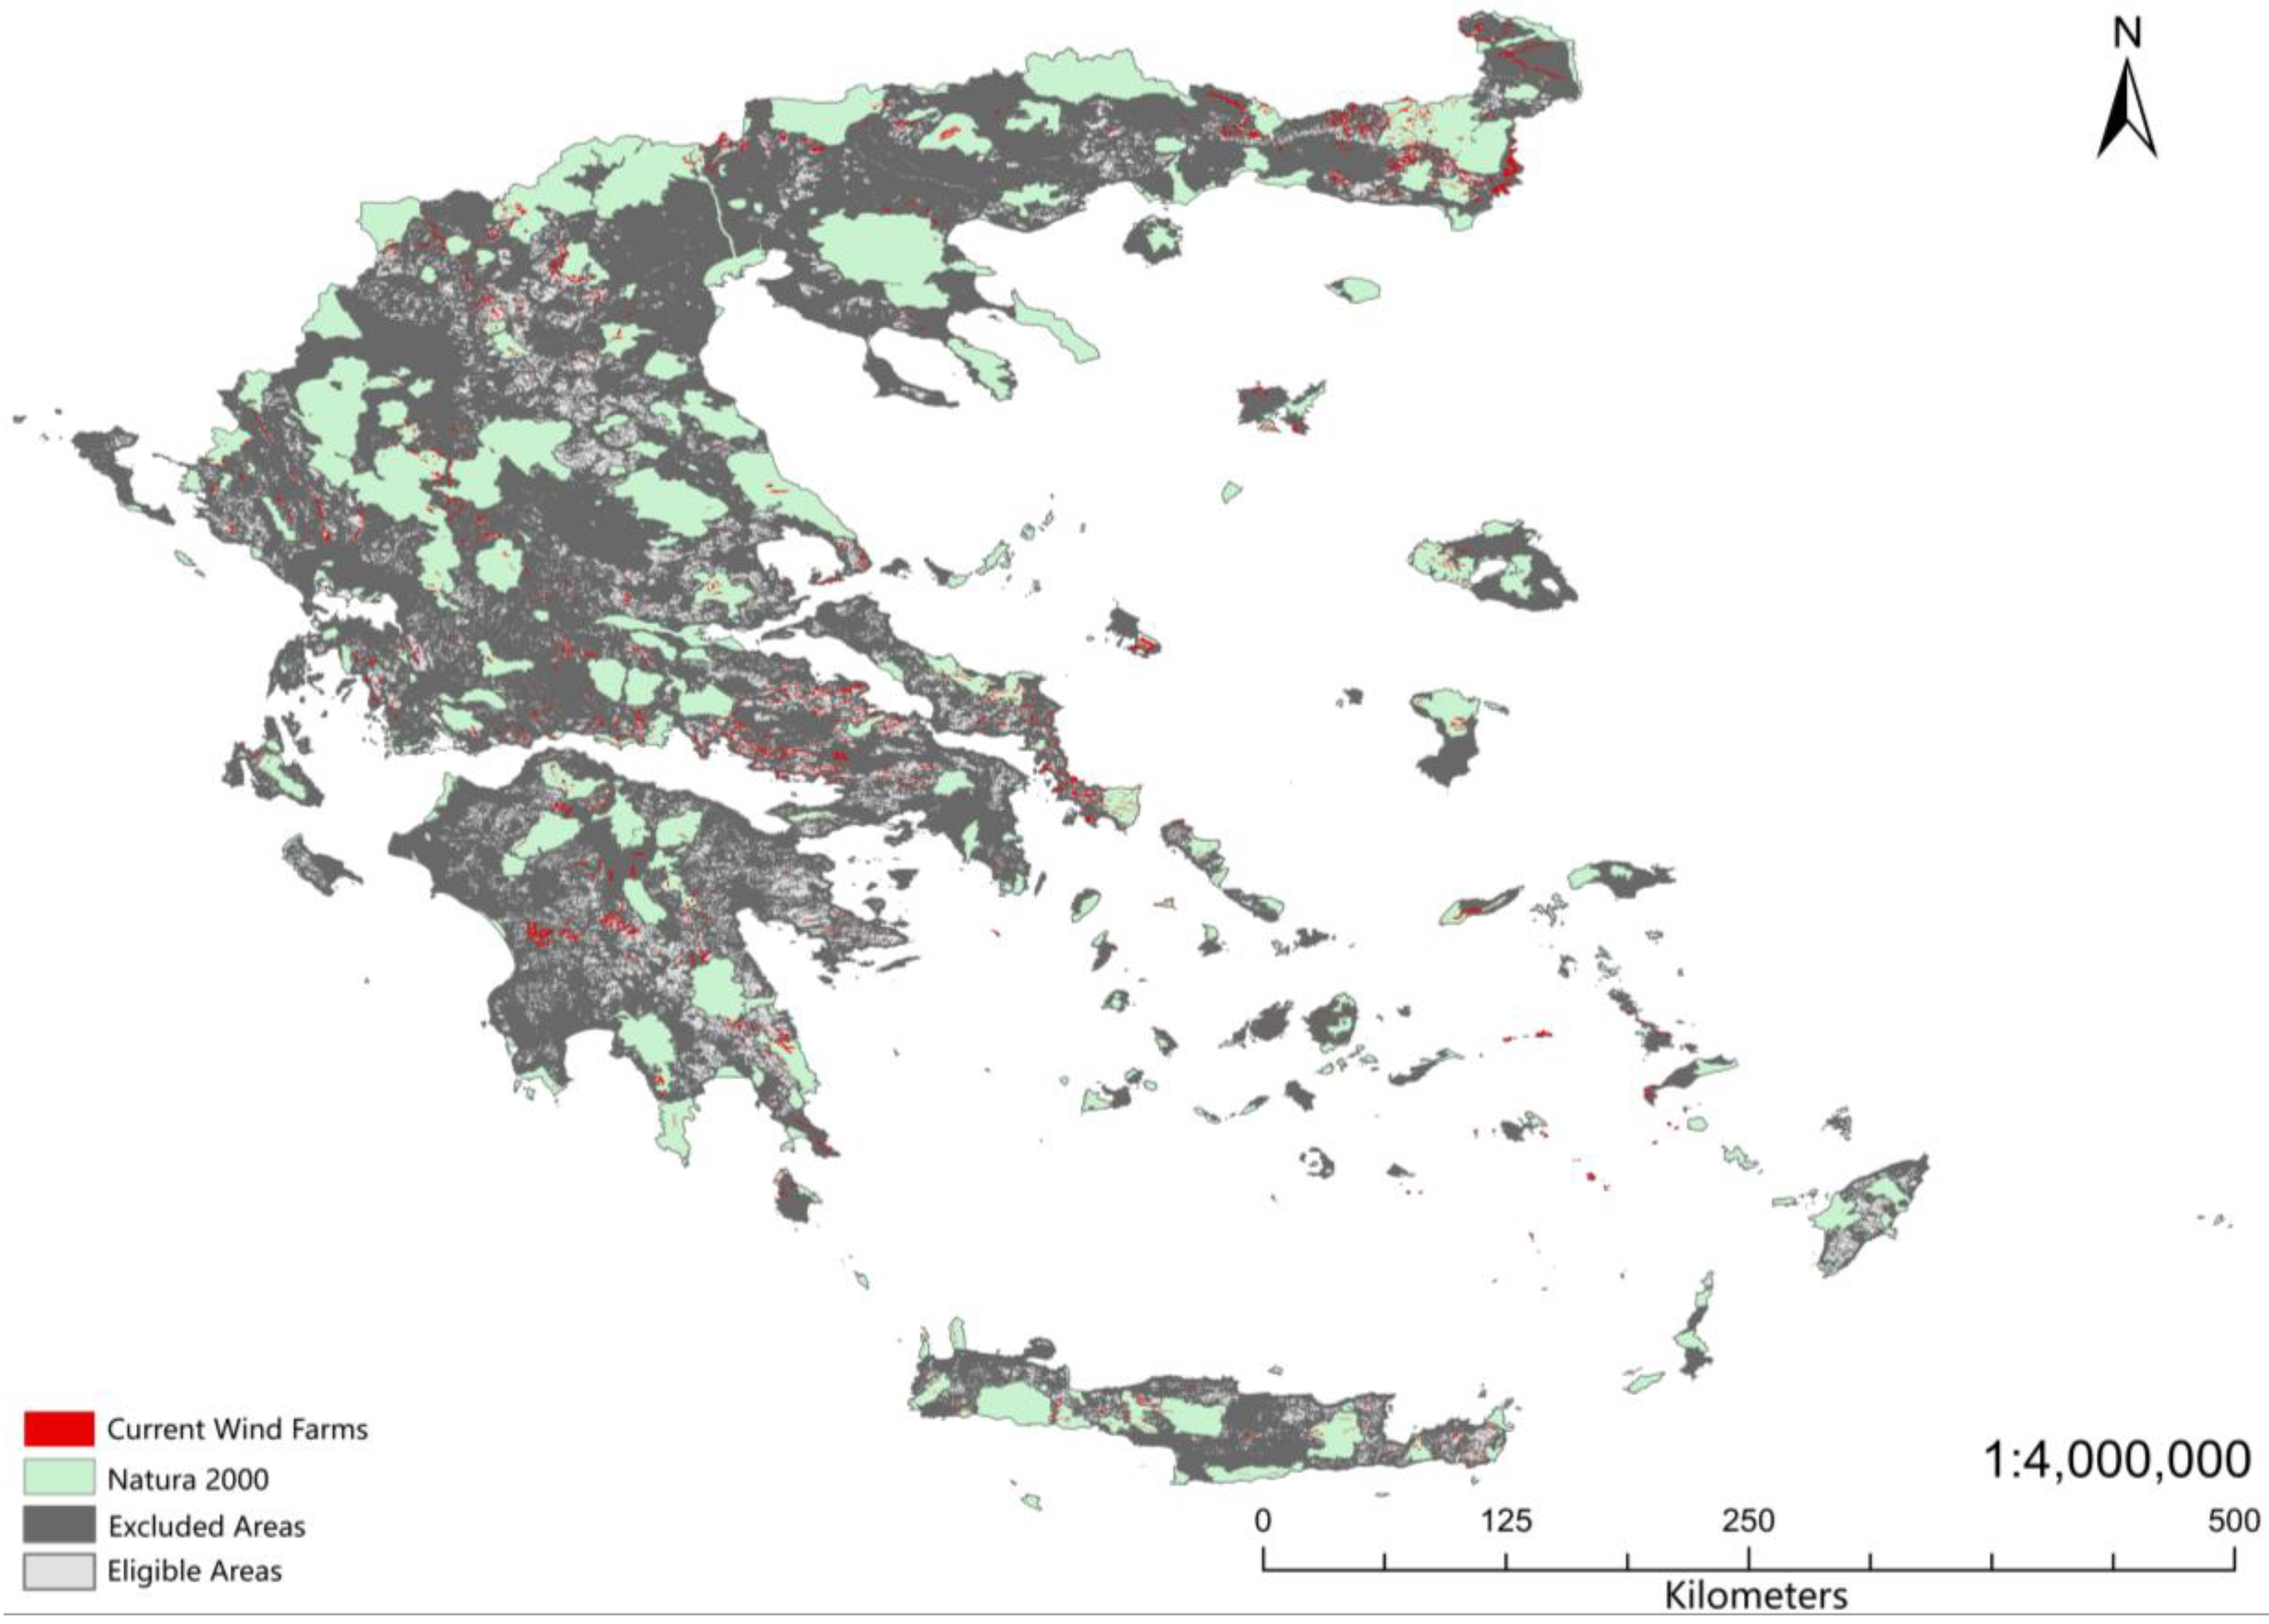
3.2. Onshore Wind Potential

As stated in Section 3.4, the Natura 2000 areas were excluded from the start of analysis. The remaining socio-political, physical, conservation, and economic constraints were excluded sequentially using GLAES (Figure 8). Upon the exclusion of the socio-political criteria, the land eligibility for onshore wind turbines in Greece was determined to be 44.58%. However, after excluding the physical criteria, the land eligibility ratio dramatically decreased to 16.21% and further dropped to 15.45% after excluding the conservation criteria. Finally, after excluding the economic criteria, the land eligibility for onshore wind turbines in Greece was determined to be 12.16%. Figure 8 clearly indicates that the physical criteria significantly impact the feasibility of constructing onshore wind turbines in Greece. Furthermore, among the economic criteria, the slope is the factor that most affects land eligibility; if the slope criterion is not excluded, land eligibility for onshore wind in Greece increases to 19.9%.
To provide a visual representation of the land eligibility for onshore wind turbines, Figure 9 presents a map where the eligible area constitutes 16,055 km2, accounting for 12.16% of the total Greek area. Additionally, Figure 10 combines the predicted wind turbine locations with the mean WPD map of Greece. These figures demonstrate that the projected wind turbine sites are concentrated in Western Macedonia and Northern Thessaly, the eastern part of Central Greece, the Peloponnese, and the islands of Crete and Rhodes. As mentioned in Section 4.1, areas with a higher mean WPD are predominantly situated in mountainous regions with high altitudes. However, most eligible areas predicted by GLAES are distributed across flat terrain with relatively low mean WPD values. Only a few areas with a high mean WPD, such as the island of Crete and the junction area of the southern part of Central Greece and Attica, can support wind turbine construction.

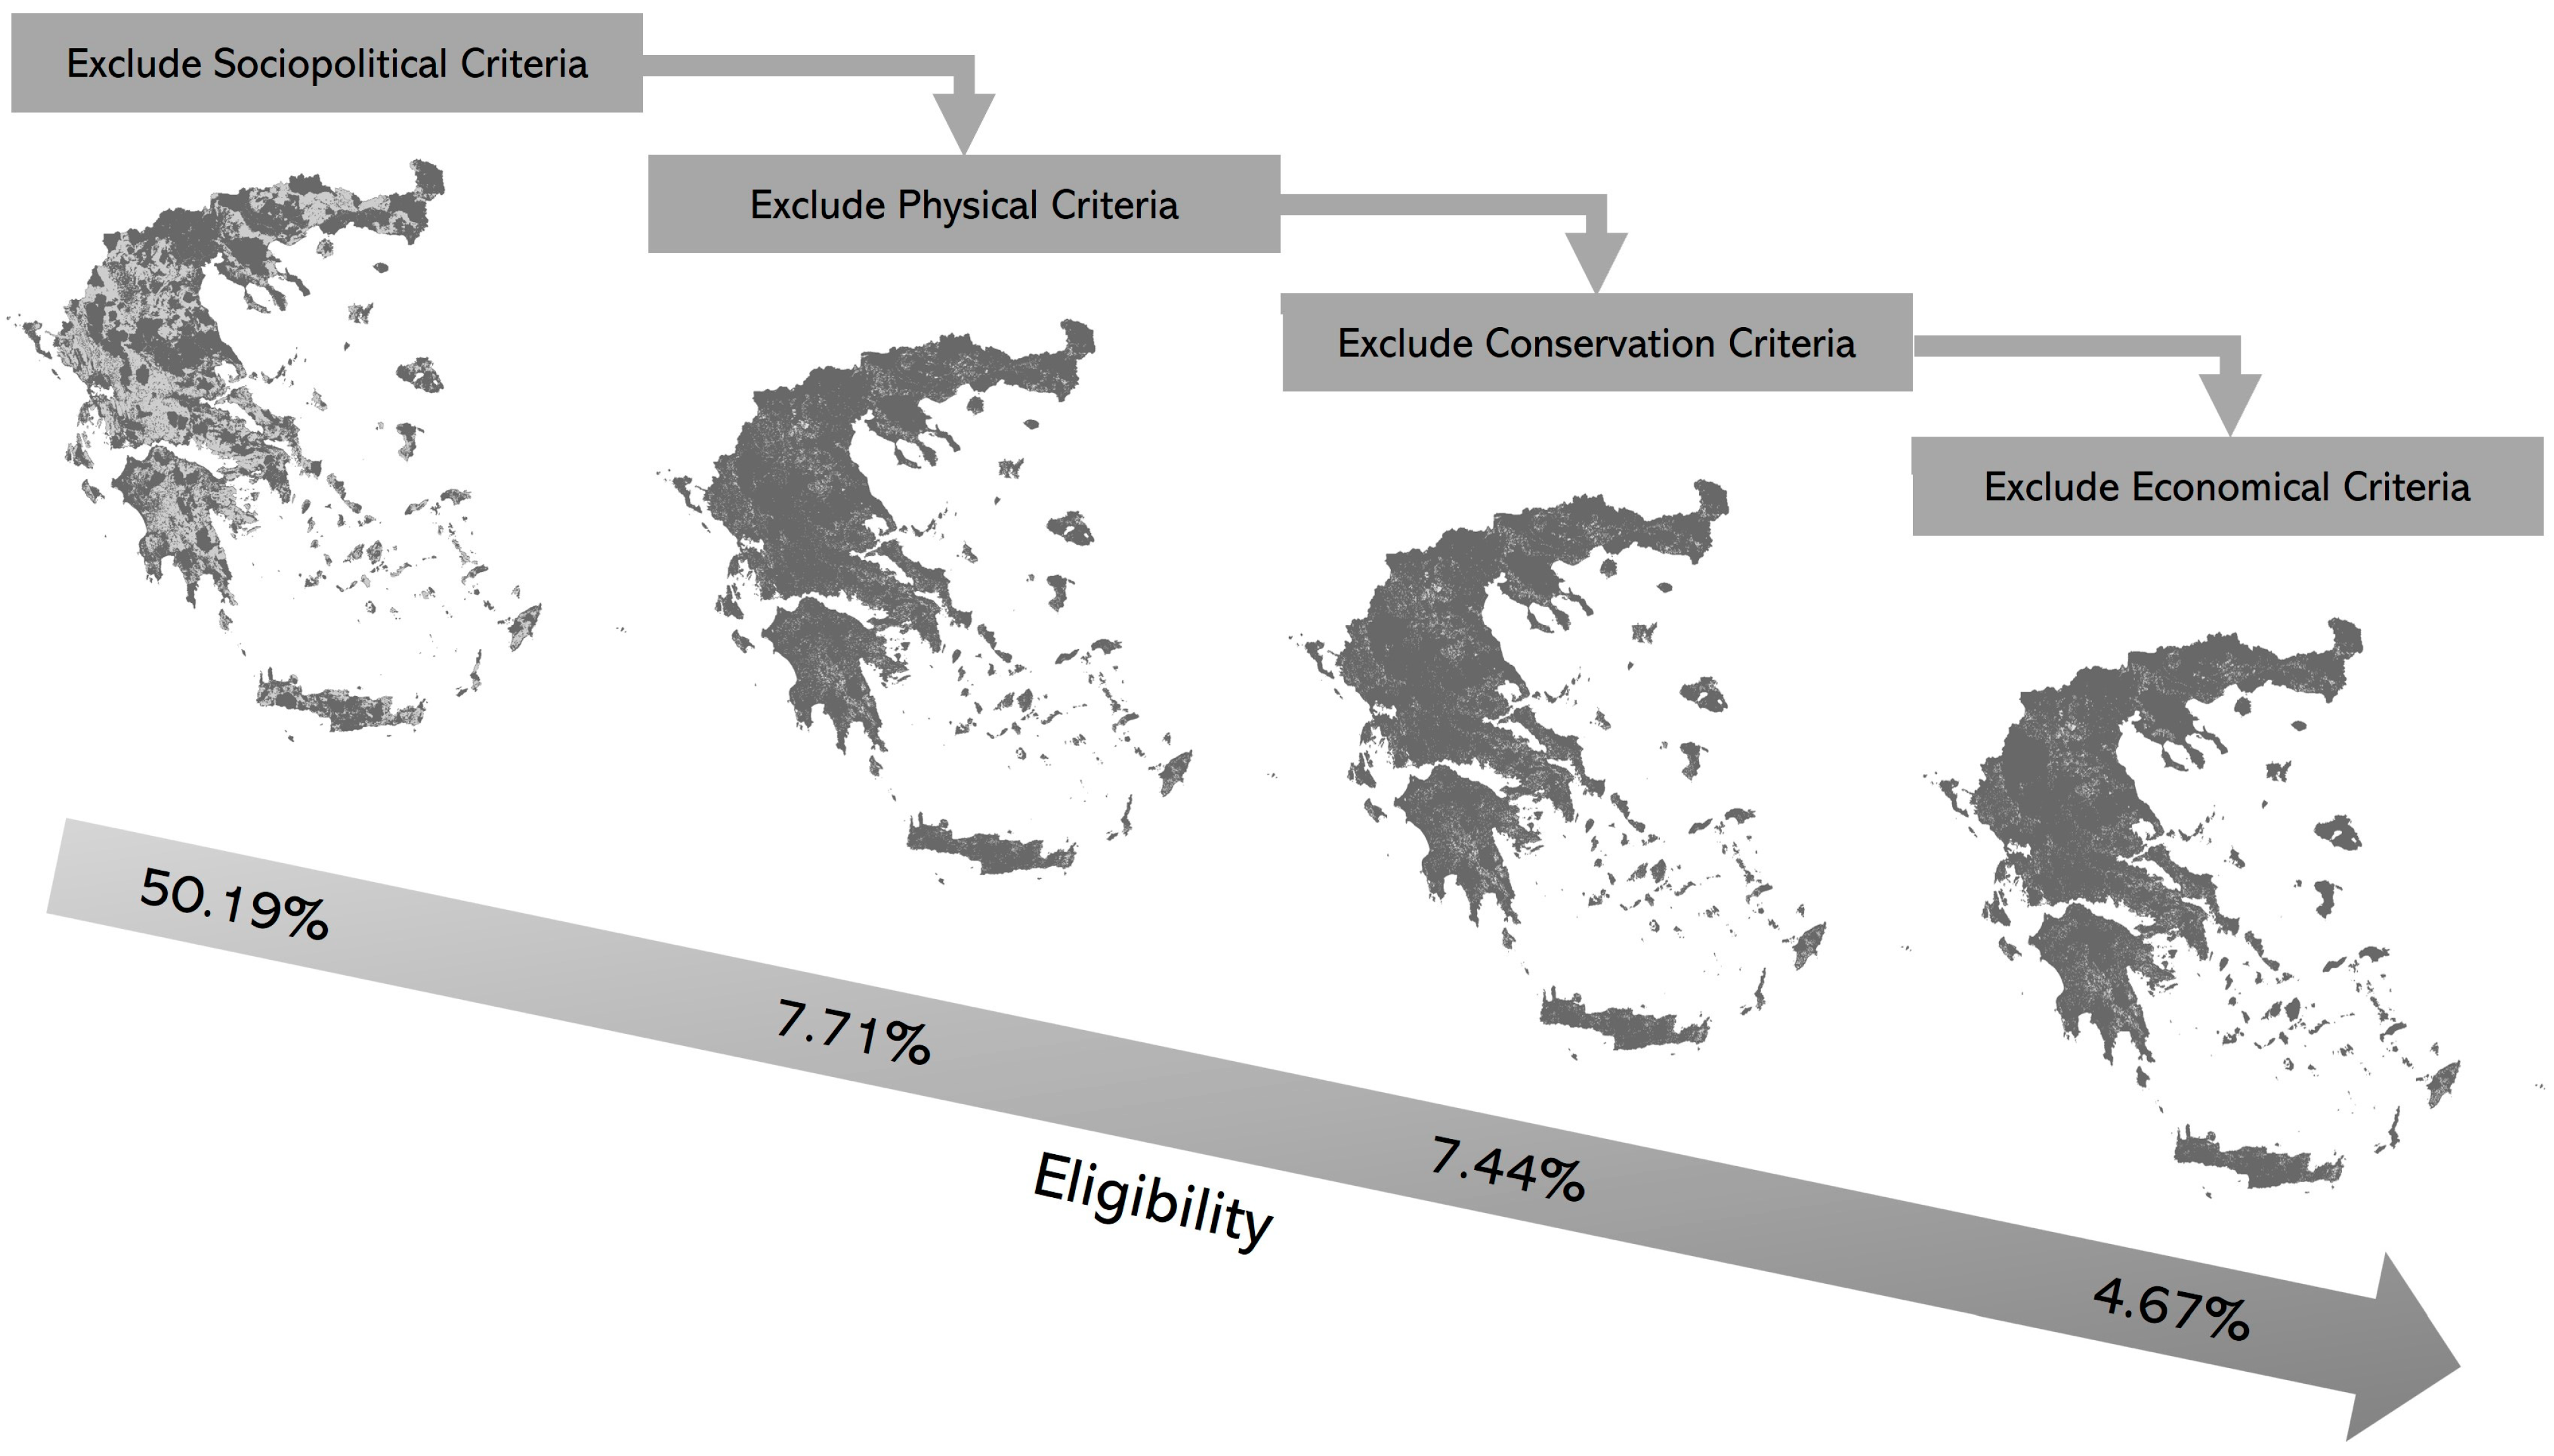
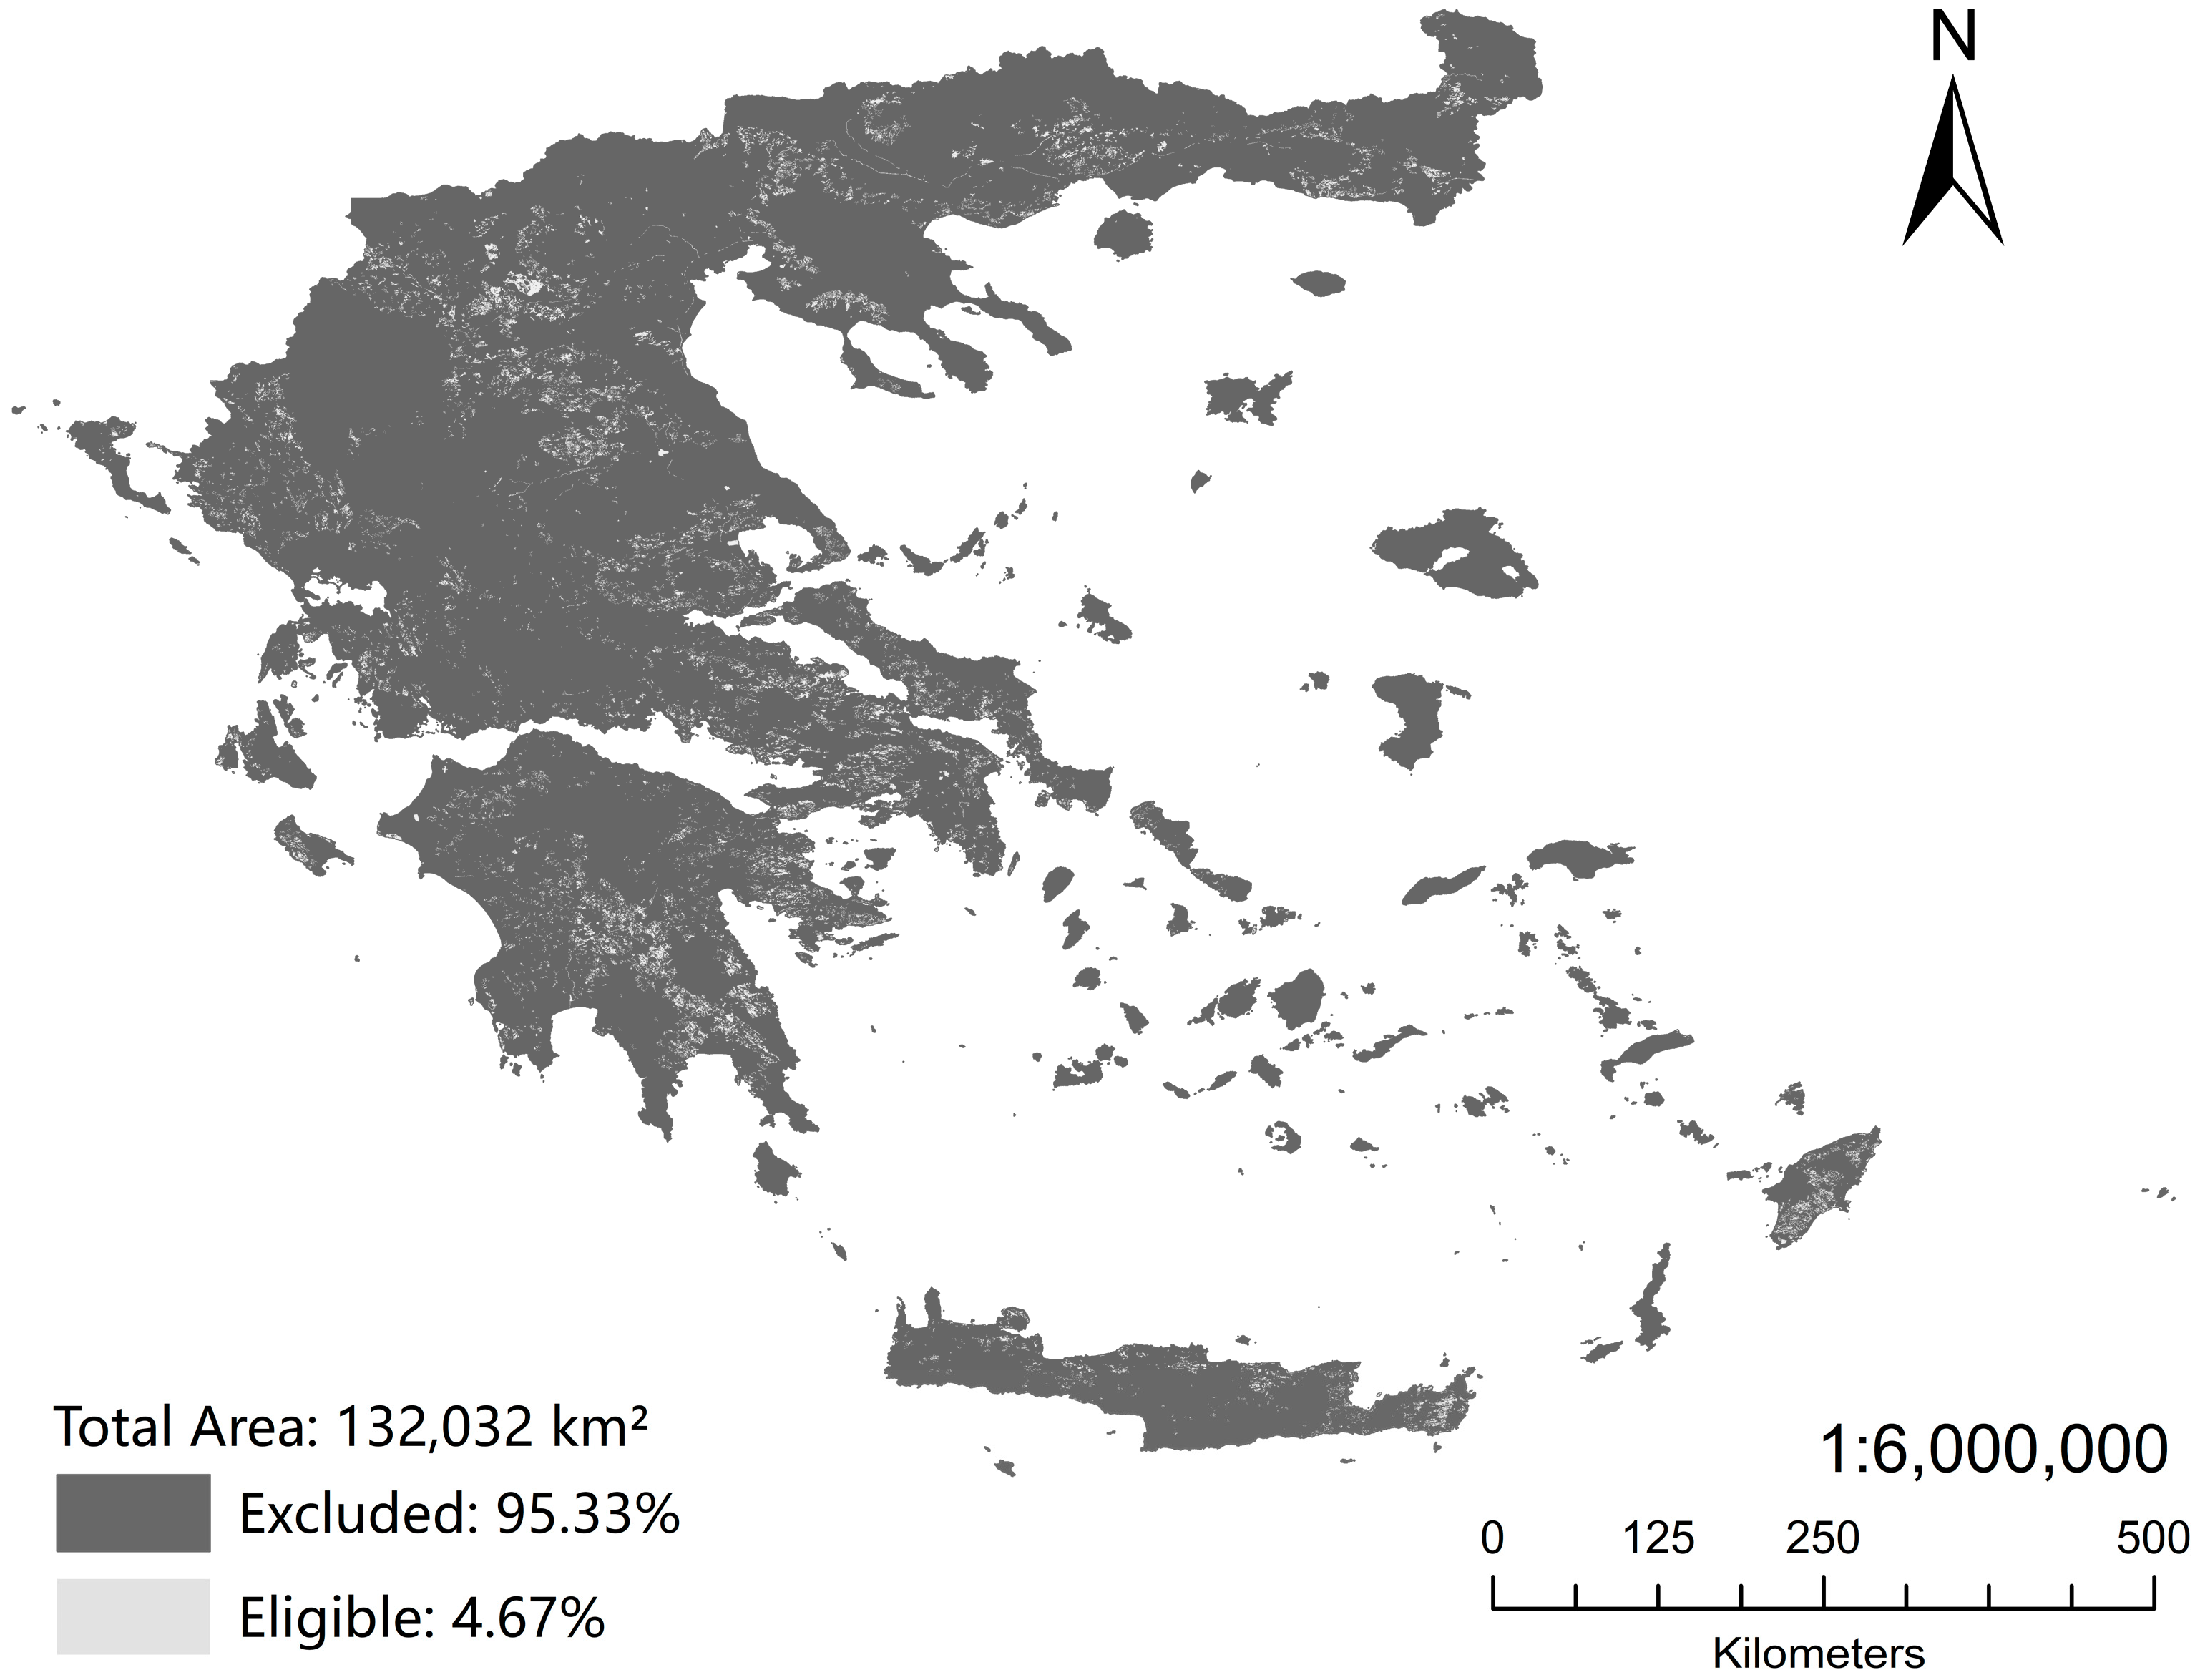
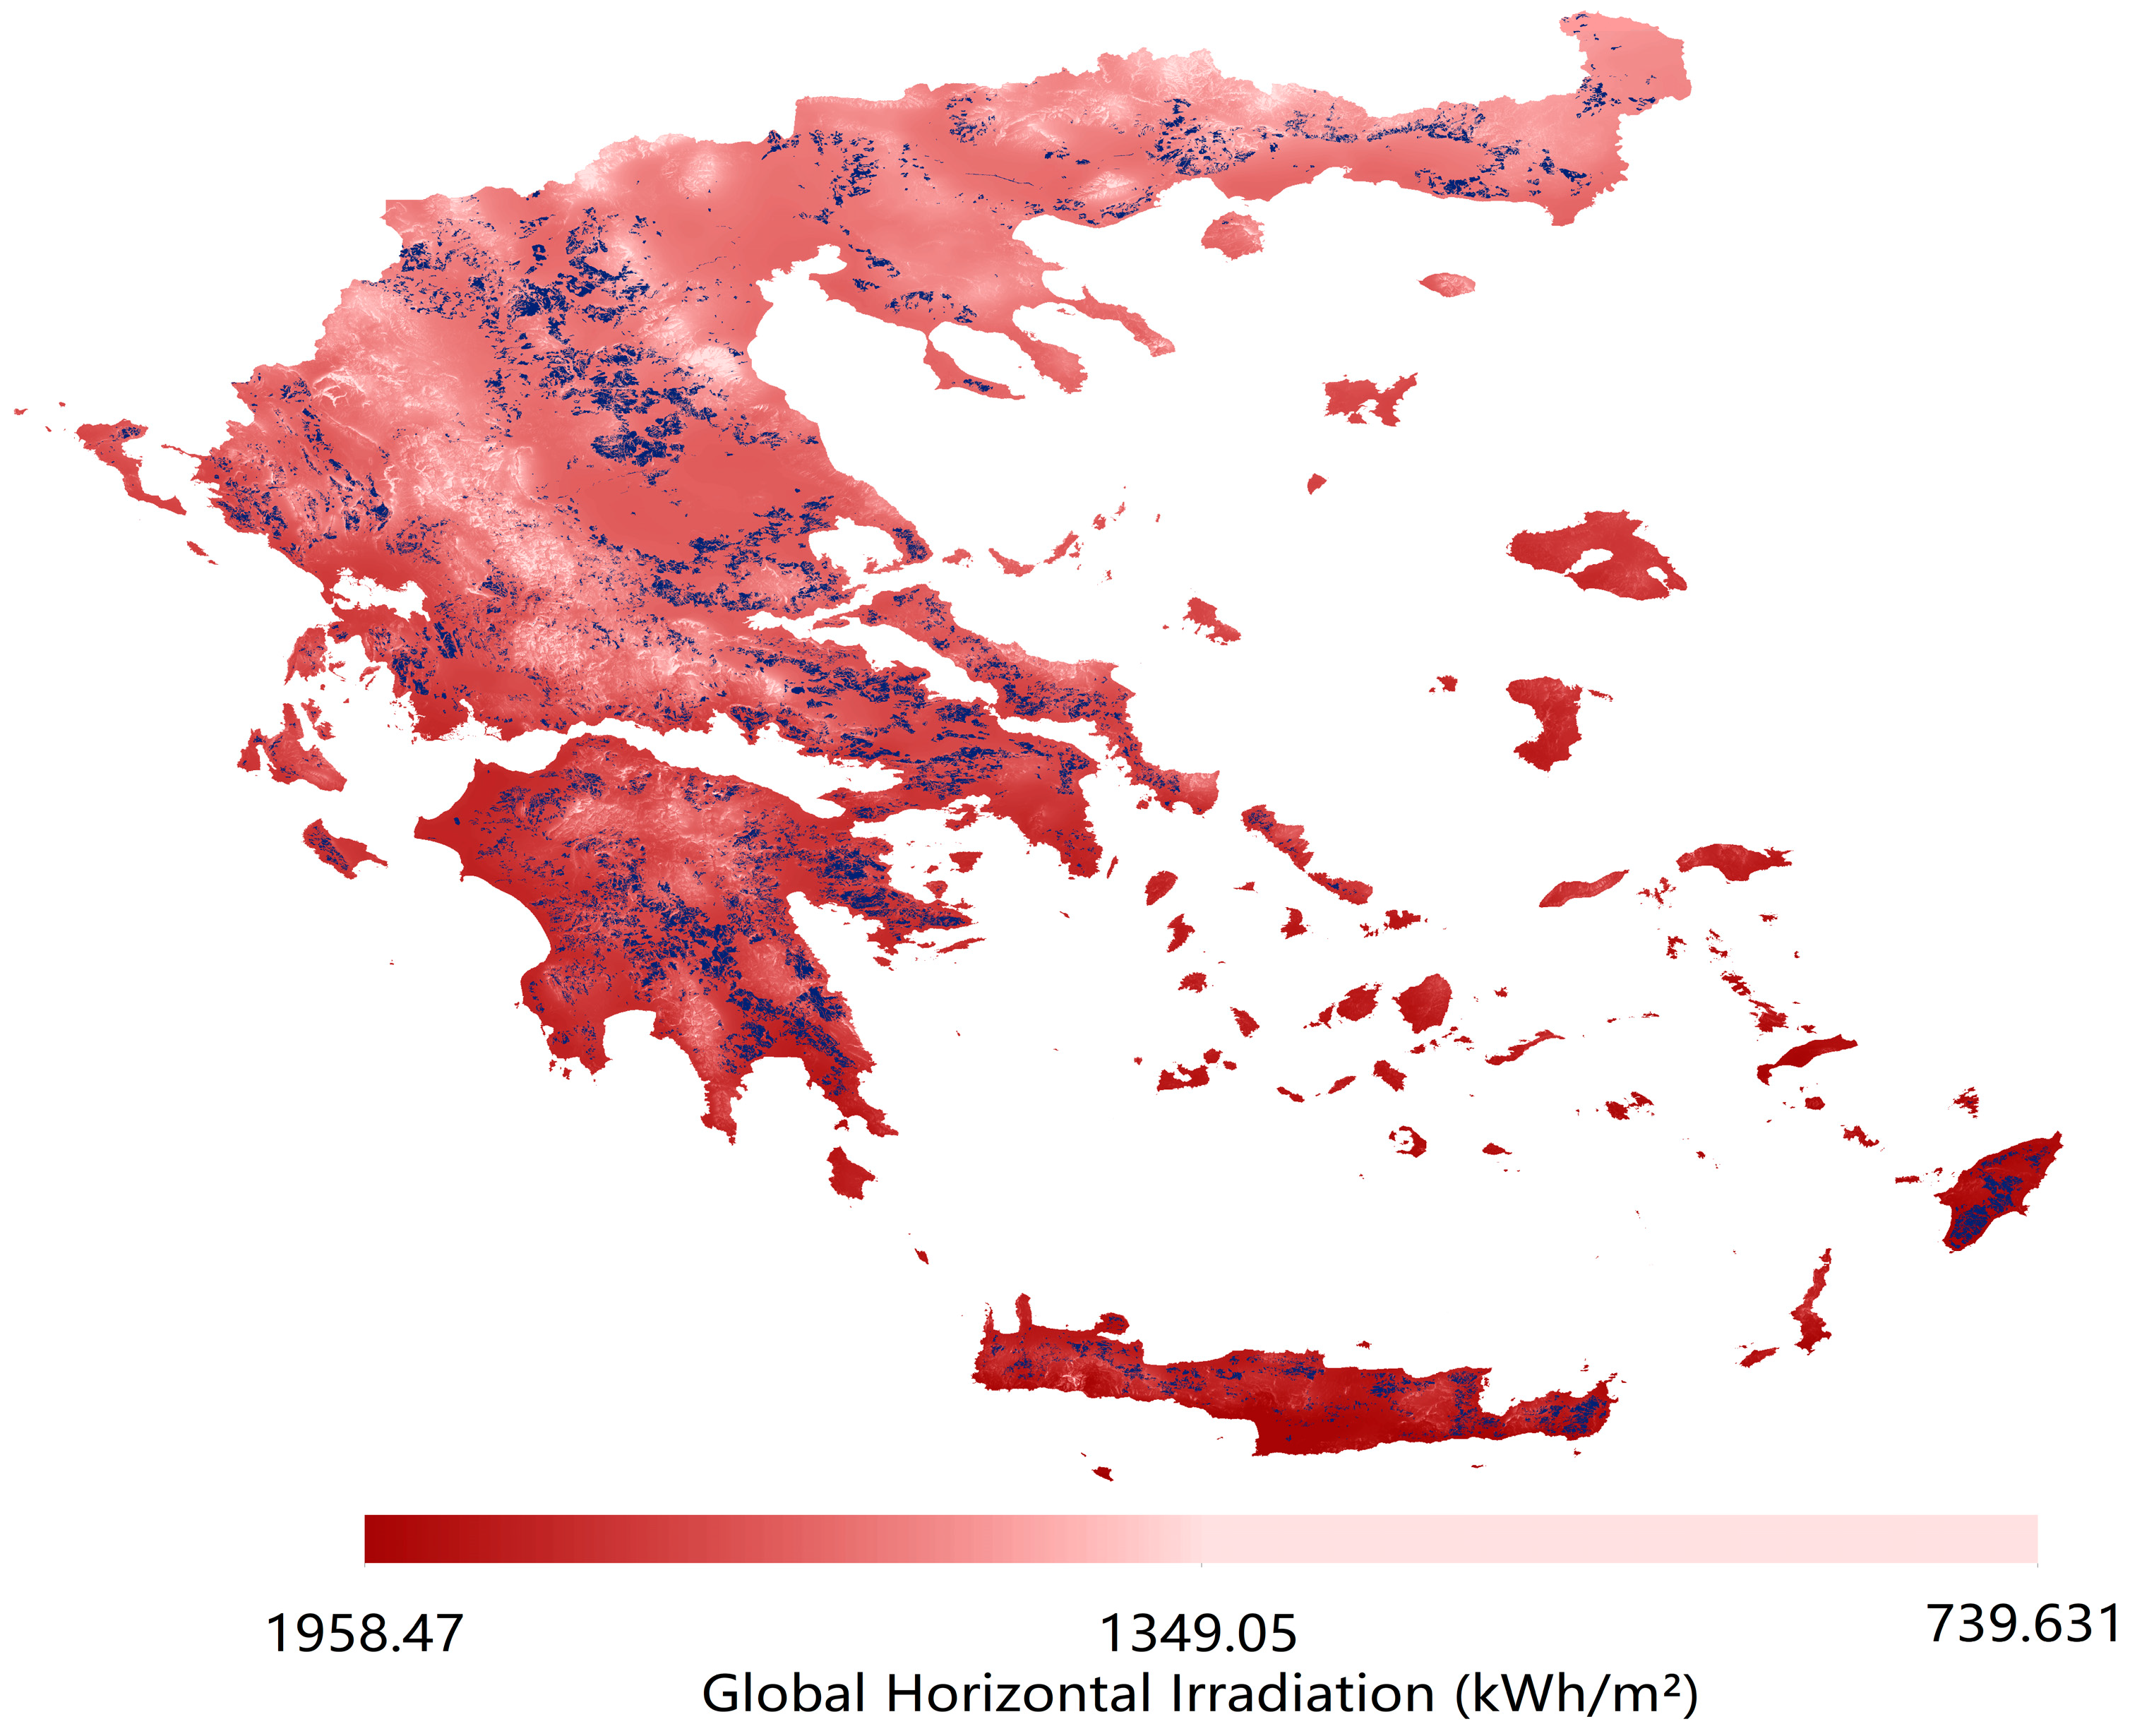
3.3. Open-Field PV Potential

The four categories of the exclusion criteria were successively excluded using GLAES, and the outcomes of each exclusion process are presented in Figure 11. Initially, the exclusion of the socio-political criteria resulted in 50.19% of the land being deemed eligible for open-field PV construction. However, this proportion drastically decreased to 7.71%, marking a reduction of 42.48%, when the physical criteria were excluded. The exclusion of the conservation criteria did not significantly impact the proportion of eligible land, with the value remaining at 7.44%. Finally, after excluding the economic criteria, the area suitable for PV power plants in open areas of Greece amounted to 4.67% of the country’s total land area. Generally, physical criteria significantly influence the land eligibility for open-field PV power plants, with slope being the most important factor. Without excluding the slope criterion, the land eligibility for open-field PV increased to 18.17%.
Figure 12 illustrates a map displaying the eligible areas for open-field PV power plants as predicted by GLAES. The total eligible area in Greece encompasses 6166 km2, accounting for 4.67% of the country’s total land surface. The predicted open-field PV power plant locations are predominantly on flat terrain. Moreover, Figure 13 clearly shows the relatively high mean GHI values in the eligible areas, particularly in the southern regions of Greece, such as the Peloponnese and the islands of Crete and Rhodes. These regions present peak GHI values, indicating the substantial solar energy potential of open-field PV installations in the predicted eligible land areas.

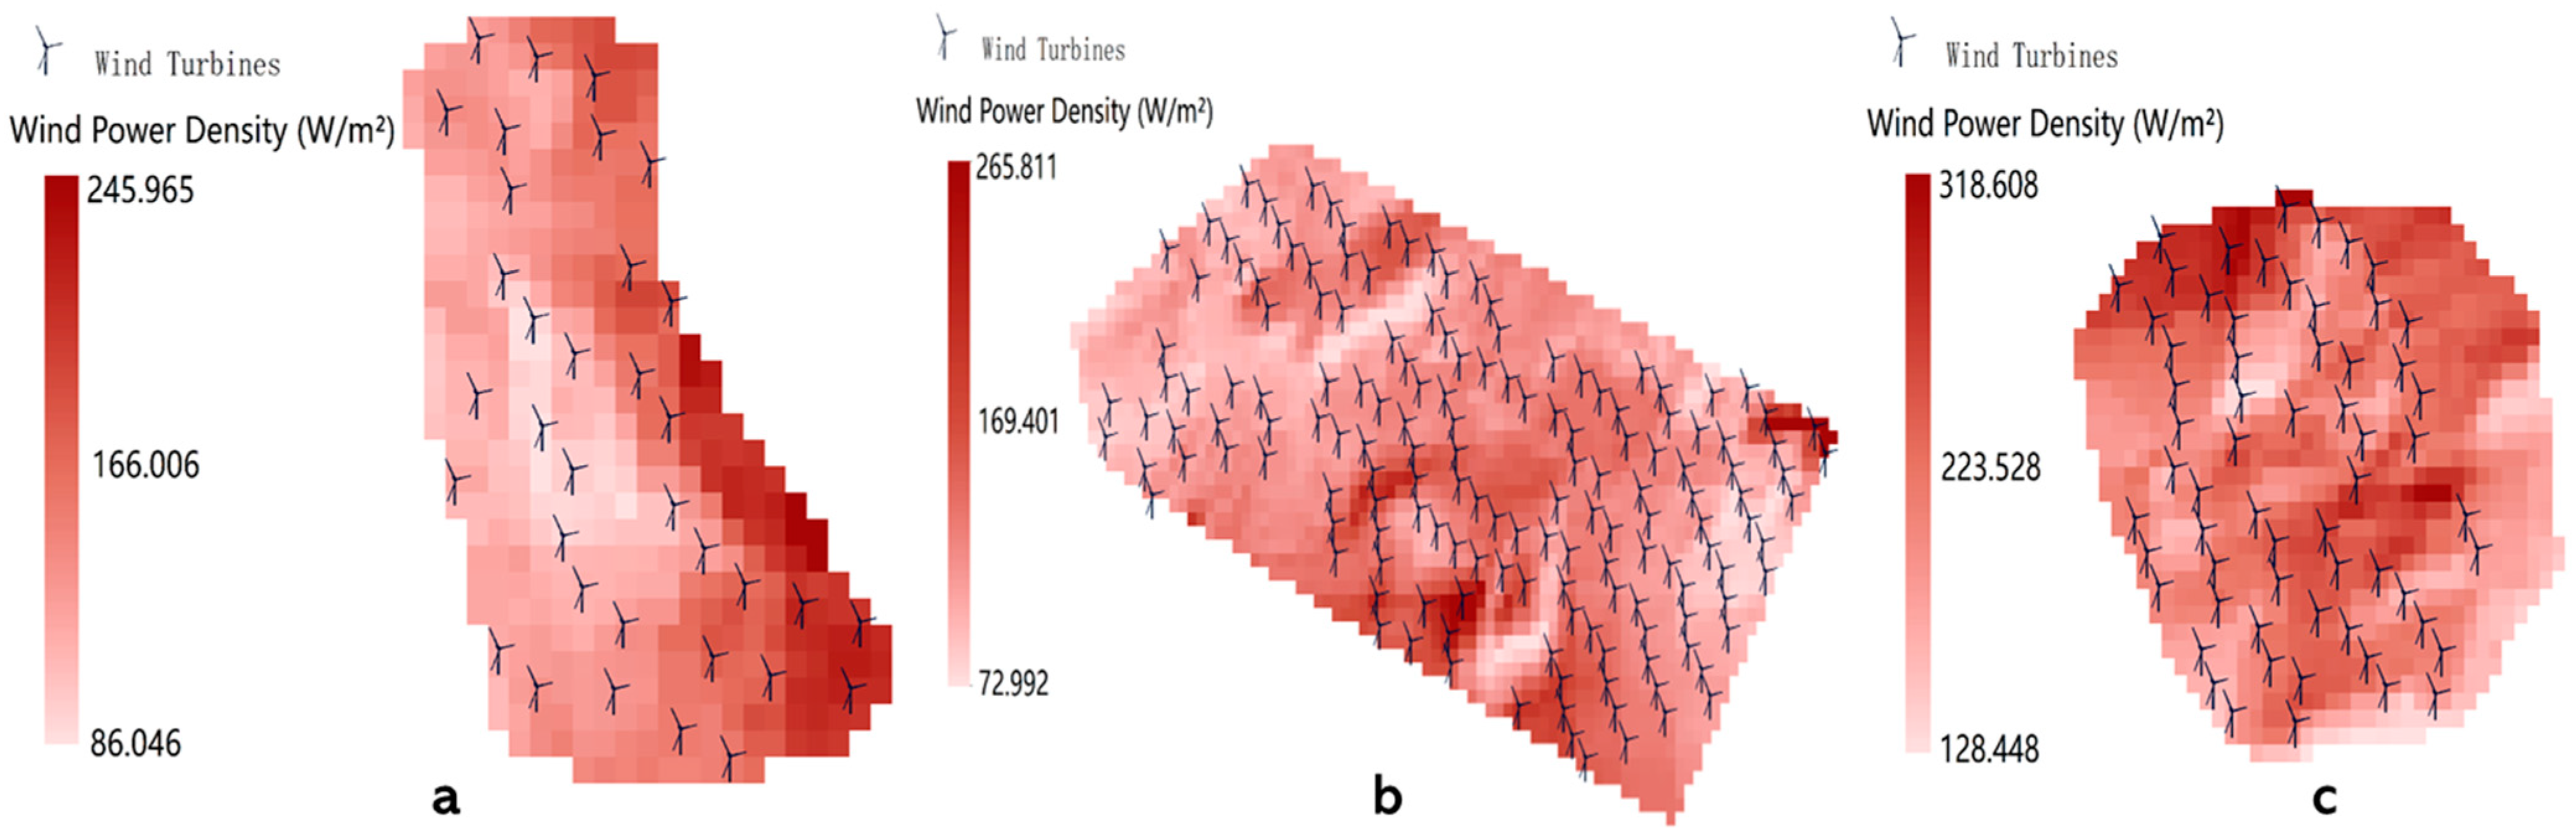
3.4. Renewables’ Potential of Decommissioned Lignite Mines

The potential installation of wind turbines and PV panels in the lignite mining areas of Megalopoli (25 km2), Ptolemaida I (134 km2), and Ptolemaida II (57 km2) was simulated using GLAES as the basis. The investigation employed a baseline wind turbine (Table 2) and a reference PV panel (Table 4) for the analysis. Table 5 presents the findings for wind turbines’ and PV parks’ placements, along with the respective annual energy potential.
In the context of wind turbines, the Megalopoli Mine has a capacity of 34 turbines, possessing a total energy potential of 428 GWh annually. As for the Ptolemaida I Mine, it can accommodate 155 turbines, producing 1953 GWh of energy potential annually. Meanwhile, the Ptolemaida II Mine can host 61 turbines and is capable of producing 769 GWh of energy potential. Furthermore, the Megalopoli Mine can accommodate 21 PV parks, covering an area of 21 km2 and generating an energy potential of 2324 GWh. The Ptolemaida I Mine can be covered by 102 PV parks, accounting for an area of 68.9 km2 and yielding an impressive energy potential of 13,901 GWh annually. The Ptolemaida II Mine, on the other hand, has the capacity for 37 PV parks, covering an area of 22.1 km2 with an energy potential of 4465 GWh per annum.
Overall, significantly, based on the results of the three lignite mines studied, the PV parks have an almost 7-fold greater potential for electric energy generation compared to wind turbines. A detailed breakdown of the distribution of the wind turbines and PV parks is provided in Section 4.2, followed by a comprehensive discussion of the comparative electric power generation potential of both technologies.

4. Discussion

4.1. Comparison between the GLAES-Defined Eligible Areas with the Current State

Compared to previous studies [6,8,9,10,11,16], this work incorporated wind speed, access, and connection distance directly into the exclusion criteria. Based on the land eligibility analysis conducted for onshore wind turbines and open-field PV power plants, it is evident that the area identified as eligible by the GLAES model was considerably larger than the areas presently developed for such use in Greece. Specifically, the land area deemed eligible for onshore wind turbines surpassed the extent of wind farms by 13,960 km2, while the eligible area for PV power plants exceeded the current coverage of PV parks by 4182 km2. These comparative findings emphasize the significant land capacity available for the deployment of wind and solar projects in Greece.
Figure 14 illustrates a spatial comparison between the areas suitable for wind turbines’ construction according to GLAES and areas where wind turbines have already been installed. It is apparent that a significant number of predicted eligible areas are situated on low-elevation and flat terrain, which differs from the current state of wind turbines’ placement. Notably, many wind turbines have been installed at high elevations, a practice not accounted for in the GLAES model. Nevertheless, the identification of unsuitable areas for wind turbine installation by GLAES does not imply that these areas are actually unsuitable for constructing wind turbines. While considering land constraints, the actual construction also needs to evaluate the wind energy potential of specific locations. Given that Greece exhibits a greater wind energy potential at higher elevations, the installation of wind turbines in such areas is justifiable.
Furthermore, the land eligibility maps, which indicate the predicted suitability of land for onshore wind and open-field PV, were merged with the existing wind farms and PV parks, as shown in Figure 15 and Figure 16, respectively. Figure 15 reveals that a significant proportion, specifically 76.5% of the established wind farms, are situated in regions that were excluded from the onshore wind land eligibility analysis because of the terrain slope. Moreover, with potential implications for nature conservation, it was observed that 10.1% of wind farms have been constructed within Natura 2000 areas. Similarly, Figure 16 illustrates that 49.3% of the existing PV parks have been constructed in regions that were excluded by the land eligibility analysis for open-field PV installations. Additionally, 10.1% of these PV parks are situated in Natura 2000 areas. It should be noted that the reason for this can be attributed Greece’s early initiative in the construction of wind farms, which date back to the early 1980s [53], before the implementation of Natura 2000. Additionally, the utilization of solar PV technology commenced in 2006 with the introduction of feed-in tariffs [54]. However, it was not until 2012 that a specific framework for the development of RESs in Greece, known as SFSPSD-RES, was proposed and implemented. Moreover, due to the later start in constructing PV power plants compared to wind turbines, the area covered by PV parks in the excluded regions is significantly smaller.

4.2. Comparison of the Wind and Solar PV Energy Potential in the Mining Areas under Study

Figure 17 depicts the distribution of wind turbines in conjunction with the mean WPD for each mining area. Additionally, Figure 18 illustrates the distribution of PV parks combined with the mean GHI in each lignite mine.
Although there is potential for constructing additional wind turbines in decommissioned lignite mines, it should be noted that the wind energy potential of the three mining areas may not surpass the solar energy potential when comparing Figure 17 and Figure 18. This observation is supported by the WPD and GHI maps for the entire country. The data revealed that the average WPD for Greece is 797 W/m2 [19], whereas the average GHI is 1550 kWh/m2 [20]. Interestingly, Figure 17 clearly illustrates that the WPD peaks of the three lignite mines correspond to low-value areas within the whole area of Greece, with values of 245.965 W/m2, 265.881 W/m2, and 318.608 W/m2, which are significantly lower than the average WPD. Furthermore, it is evident that there are only a few wind turbines situated in the regions with the peak WPD values of each mine, with a mere total of 15 wind turbines having been observed. On the contrary, the extreme GHI values in the three lignite mines all exceed the average value of GHI for the entire region of Greece, amounting to 1707.5 kWh/m2, 1577.2 kWh/m2, and 1593.2 kWh/m2, as shown in Figure 18. Notably, the peak GHI areas of the Megalopoli Mine and the Ptolemaida II Mine contain four PV parks each, while almost all PV parks are concentrated in the extreme GHI area of the Ptolemaida I Mine. For robust verification, this study conducted a comprehensive examination by consolidating the electric energy potential WPD values achievable from wind turbines and the electric energy potential GHI values achievable from PV panels, revealing that the potential of electric generation by PV panels in the three lignite mines significantly surpasses that of wind turbines. The results from Table 5 further confirm that the potential of wind energy in the three lignite mines is lower than that of solar PV. Therefore, it is concluded that the total potential of solar PV in the lignite mines of Megalopoli, Ptolemaida I, and Ptolemaida II is 20,690 GWh, which is almost 7-fold greater than that (3150 GWh) of wind.
However, PV fields with such a high peak power output as the ones that can be built on the areas of the three lignite mines from this study could be a critical component in the electricity grid of Greece. Daily and seasonal variations in electricity production need to be smoothed by employing means for the storage of electricity, e.g., hydrogen or thermal energy storage. The seasonal storage of renewable energy using hydrogen involves capturing excess energy during the times of high renewable generation, such as sunny or windy days, and converting it into hydrogen through electrolysis. This hydrogen can then be stored for extended periods, i.e., several months, serving as a clean and efficient energy carrier. During low renewable energy periods, like calm or cloudy days, the stored hydrogen can be utilized in fuel cells or natural-gas-fired power stations to generate electricity, providing a reliable energy source. This approach addresses the intermittency of renewable sources, enabling a more consistent and sustainable power supply throughout the year. Additionally, the deployment of hydrogen in seasonal storage contributes to the decarbonization of the energy sector by offering a versatile solution for large-scale energy storage and distribution. What is more, the study of Schmidt et al. [55] showed that, for a few load cycles per year, hydrogen storage is more cost effective than using batteries. Another promising option for storing surplus renewable electrical energy is the application of the so-called Carnot batteries, which can store large amounts of energy in the form of high-temperature heat in inexpensive materials, such as water, stone, or molten salt, and are much cheaper than batteries [56]. In conjunction with seasonal heat storage systems, they can store heat energy for months. The size, capacity, and energy management of Carnot batteries can be adapted to the specific demand, i.e., the capacities of several megawatts are expected to be available from 2030 onwards.
In general, at the regional level in Greece, the potential for open-field PV is greater than that of onshore wind. It is safe to assume that the potential is even greater when roof areas, parking sites, and industrial areas are included (as they should be). At the same time, although the adoption of PV power generation in Greece came after wind power generation, a recent report indicated that the total installed PV capacity has exceeded the total installed wind capacity for Greece in 2022 [57]. Additionally, the abundance of sunshine in Greece allows for less restricted operations of PV power plants. In contrast, wind turbine operations face more complex limitations. For instance, low wind speeds generally make the installation of wind turbines unviable, while wind speeds that are too high necessitate the shutdown of wind turbines for their protection. Moreover, the construction of wind farms generally entails higher material and financial costs compared to that of PV power plants [57]—the cost of photovoltaic energy has declined by about 90% over the last decade, resulting in a remarkable 30% growth per year [58]. Furthermore, the focus on PV power plants will potentially allow for the further enhancement of biodiversity conservation in Greece. This is because the current focal areas for wind power production (Thrace, Western Macedonia, Central Greece, and the Peloponnese as well as, overall, the higher elevation areas) are regions of potentially high biodiversity value [59]. A focus on PV power production provides an opportunity for the Natura network of protected areas to expand further in those regions. In conclusion, the combination of the present analysis and considering the wider efficiency, economic, and biodiversity protection factors, this study concluded that solar energy (PV) is better suited than wind power for the decarbonization efforts of Greece.
Last but not least, a very important advantage of the proposed use of decommissioned lignite mining areas is that no valuable agricultural land is consumed for the generation of renewable electric energy.

4.3. Limitations

Based on the SFSPSD-RES of Greece, this study incorporated land eligibility analysis for onshore wind and open-field PV, combining insights from previous relevant research conducted in Europe, particularly in Greece. In order to assess land suitability, a comprehensive list of land constraints was formulated, encompassing social, technological, environmental, and economic factors. By imposing exclusion land constraints using GLAES, the areas eligible for constructing wind turbines and PV power plants were obtained. However, it is important to note that the land eligibility analysis, based solely on the current policies and previous empirical studies, can only provide indicative results. The overall process of constructing renewable energy system entails complex aspects that must be considered. These include assessing the potential of RESs, evaluating construction costs, and analyzing topographic and geological conditions specific to the target area. Further investigations can be carried out to examine the discrepancy between the estimated suitability areas for wind turbines and the wind turbines actually built (see Figure 5). Especially on mountain tops, the wind potential is systematically underestimated when using averaged wind speed data, as shown in the study by Hu et al. [60]. In a future study, the effect of topology at the sub-grid level will be included in the land suitability analysis.
Additionally, it is crucial to secure the support and involvement of local residents and stakeholders, among other relevant considerations. Consequently, the successful implementation of wind turbines and PV power plants necessitates not only model simulations but also thorough field investigations, which together enable optimizing electric power generation efficiency and minimizing costs to ensure the utmost effectiveness of renewable energy generation.
With the phasing out of lignite mines in Greece, there is a significant opportunity to construct renewable energy systems in decommissioned lignite mines. However, there are certain limitations in constructing wind turbines and PV power plants in these mining areas. Geotechnical stability, slopes, and landslides, for Example, should be considered during construction [61]. Moreover, this study compared the potential of wind energy and solar PV energy in Greece, specifically focusing on decommissioned lignite mines. The analysis mainly utilized the WPD and GHI maps of Greece for discussion. It should be noted that there is no direct relationship between WPD and GHI values; rather, they serve as reference indices for estimation proposes. The electric power output of wind energy and solar PV predominantly depends on their respective power capacities. Therefore, this work used a reference wind turbine and a reference PV panel to estimate the number of constructable turbines and the area for PV parks so that the energy potential can be calculated under ideal conditions. Finally, it was found that the PV energy potential significantly surpassed that of wind energy in the decommissioned lignite mines under study. It is essential to recognize that the estimated potential represents a technically possible maximum. The exploitable potential may be substantially lower due to practical, ecological, or technological limitations (which cannot be addressed in this work). Detailed site-specific studies are imperative for a realistic assessment.
Furthermore, a comprehensive calculation of electric generation is an intricate process that necessitates the consideration of numerous factors. In the case of wind energy, the power generation capacity is determined by climatic factors, such as air density and temperature, as well as physical factors, like wind speed and the spatial and temporal variations in wind patterns. Similarly, the power generation capacity of solar PV is influenced by climatic parameters, like air quality and sunshine hours, in addition to physical factors, such as solar irradiance in combination with atmospheric conditions. Overall, the calculation of wind energy and solar PV energy capacities for the whole territory of Greece is an intricate and challenging task, thus representing a limitation.

5. Conclusions

In the context of Greece’s energy transition dominated by wind and solar energy, this work assessed the land eligibility of onshore wind turbines and open-field PV power plants to provide insights of reference for their suitable construction. Meanwhile, the electric generation potential of the two RESs in the decommissioned lignite mines of Megalopoli and Ptolemeida were specifically compared to further discuss the most suitable RESs for Greece, either wind or solar. This work concluded that solar (PV) energy in Greece has a greater potential of electricity generation than that of wind energy. Considering only land eligibility during optimal conditions, Greece’s 132,032 km2 of suitable areas for PV could generate an electricity of 205 TWh, significantly surpassing the country’s total electricity consumption of 52.8 TWh in 2020 provided by International Energy Agency. And in decommissioned lignite mines, while wind turbines appear unsuitable for electricity generation, PV systems have significant potential. Moreover, it is worth mentioning that a joint venture between the German utility RWE and Public Power Corp. (PPC) of Greece is already constructing solar projects, named Amynteo Cluster I and II, with a total capacity of 210 MWp and 280 MWp, respectively, in the former Amynteo open-pit lignite mine of Western Macedonia [62].
Through the land eligibility analysis of onshore wind turbines and open-field PV power plants using GLAES, it was found that Greece has significant land potential for both compared to the current state. It is worth noting that the construction locations of wind turbines modeled using GLAES is quite different from the current installations. Most of the current wind turbines are located at high altitudes with a high wind energy potential, which is contrary to the predicted results. Additionally, although the eligible area for wind turbines (12.16%) is much larger than that of PV power plants (4.67%), a significant proportion of the predicted eligible land for wind turbines is located in low electric generation potential areas, especially in the studied lignite mining areas. Meanwhile, this study made a start to analyze the land eligibility for both the onshore wind and open-field PV of Greece and compared the electric energy potential of wind and solar power. In general, the successful construction of wind turbines and PV power plants not only needs to be based on model predictions considering socio-politics, technology, the environment, and economy, but also requires a thorough field investigation of the target construction areas. Moreover, the most direct way to compare the potential of wind and solar energy sources is to calculate their electric power capacity. However, due to the complexity of the calculation, which needs to consider many climatic factors, this work did not conduct the calculation, thus remaining a limitation. Overall, this work provided meaningful references for the construction of wind turbines and open-field PV power plants for Greek decarbonization. Notably, part of the wider significance of this study lies in the estimation of the potential of renewable energy available by using the areas of three decommissioned lignite mines, which is in the order of magnitude of the electricity produced by gas in 2020 in all of Greece.

Author Contributions

Conceptualization, Q.W., F.C.K., E.G. and M.S.; methodology, Q.W., M.S., E.G. and P.S.; software, Q.W., P.S. and M.S.; validation, Q.W., E.G., P.S. and M.S.; formal analysis, Q.W.; investigation, Q.W., E.G., M.S., F.C.K. and V.L.; resources, F.C.K.; data curation, Q.W. and M.S.; writing—original draft preparation, Q.W.; writing—review and editing, Q.W., M.S., F.C.K., P.S. and E.G.; visualization, Q.W.; supervision, M.S., E.G., F.C.K. and P.S.; project administration, F.C.K. All authors have read and agreed to the published version of the manuscript.

Funding

This research received no external funding.

Data Availability Statement

Data are contained within the article.

Conflicts of Interest

Author Martin Spiller was employed by the ISATEC GmbH. The remaining authors declare that the research was conducted in the absence of any commercial or financial relationships that could be construed as a potential conflict of interest.

Abbreviations

DEMDigital Elevation Model
GLAESGeospatial Land Availability for Energy Systems
GHIGlobal Horizontal Irradiation
GISGeographic Information System
NECPNational Energy and Climate Plan
PVPhotovoltaic
RESRenewable Energy Source
WPDWind Power Density
SFSPSD-RESSpecific Framework for Spatial Planning and Sustainable Development for Renewable Energy Sources

References

  1. United Nations. Paris Agreement; United Nations: Paris, France, 2015. [Google Scholar]
  2. Kaldellis, J.K.; Kapsali, M.; Katsanou, E. Renewable Energy Applications in Greece—What Is the Public Attitude? Energy Policy 2012, 42, 37–48. [Google Scholar] [CrossRef]
  3. IEA. Energy Policy Review Greece 2023. Available online: https://iea.blob.core.windows.net/assets/5dc74a29-c4cb-4cde-97e0-9e218c58c6fd/Greece2023.pdf (accessed on 26 June 2023).
  4. Central Intelligence Agency Greece Country Summary. Available online: https://www.cia.gov/the-world-factbook/countries/greece/#energy (accessed on 27 June 2023).
  5. IEA 2023. Greece—Countries & Regions. Available online: https://www.iea.org/countries/greece (accessed on 30 December 2023).
  6. Mourmouris, J.C.; Potolias, C. A Multi-Criteria Methodology for Energy Planning and Developing Renewable Energy Sources at a Regional Level: A Case Study Thassos, Greece. Energy Policy 2013, 52, 522–530. [Google Scholar] [CrossRef]
  7. Tsoutsos, T.; Tsitoura, I.; Kokologos, D.; Kalaitzakis, K. Sustainable Siting Process in Large Wind Farms Case Study in Crete. Renew. Energy 2015, 75, 474–480. [Google Scholar] [CrossRef]
  8. Latinopoulos, D.; Kechagia, K. A GIS-Based Multi-Criteria Evaluation for Wind Farm Site Selection. A Regional Scale Application in Greece. Renew. Energy 2015, 78, 550–560. [Google Scholar] [CrossRef]
  9. Bili, A.; Vagiona, D.G. Use of Multicriteria Analysis and GIS for Selecting Sites for Onshore Wind Farms: The Case of Andros Island (Greece). Eur. J. Environ. Sci. 2018, 8, 5–13. [Google Scholar] [CrossRef]
  10. Karamountzou, S.; Vagiona, D.G. Suitability and Sustainability Assessment of Existing Onshore Wind Farms in Greece. Sustainability 2023, 15, 2095. [Google Scholar] [CrossRef]
  11. Vagiona, D.G. Comparative Multicriteria Analysis Methods for Ranking Sites for Solar Farm Deployment: A Case Study in Greece. Energies 2021, 14, 8371. [Google Scholar] [CrossRef]
  12. Greece. Available online: https://www.britannica.com/place/Greece (accessed on 26 June 2023).
  13. National Archive of Monuments. Available online: https://www.arxaiologikoktimatologio.gov.gr/ (accessed on 26 June 2023).
  14. Natura 2000 Viewer. Available online: https://natura2000.eea.europa.eu/ (accessed on 26 June 2023).
  15. Regions of Greece. Available online: https://geodata.gov.gr/en/dataset/periphereies-elladas (accessed on 26 June 2023).
  16. Baltas, A.E.; Dervos, A.N. Special Framework for the Spatial Planning & the Sustainable Development of Renewable Energy Sources. Renew. Energy 2012, 48, 358–363. [Google Scholar] [CrossRef]
  17. Ryberg, D.S.; Tulemat, Z.; Robinius, M.; Stolten, D. Geospatial Land Availability for Energy Systems (GLAES). Available online: https://github.com/FZJ-IEK3-VSA/glaes (accessed on 23 June 2023).
  18. European Evironment Agency Digital Elevation Model over Europe. Available online: https://www.eea.europa.eu/data-and-maps/data/eu-dem (accessed on 28 June 2023).
  19. Global Wind Atlas. Available online: https://globalwindatlas.info/en/ (accessed on 26 June 2023).
  20. Global Solar Atlas. Available online: https://globalsolaratlas.info/global-pv-potential-study (accessed on 26 June 2023).
  21. RAE Geospatial Map for Energy Units & Requests. Available online: https://geo.rae.gr/?tab=viewport_maptab (accessed on 27 June 2023).
  22. Iqbal, M.; Azam, M.; Naeem, M.; Khwaja, A.S.; Anpalagan, A. Optimization Classification, Algorithms and Tools for Renewable Energy: A Review. Renew. Sustain. Energy Rev. 2014, 39, 640–654. [Google Scholar] [CrossRef]
  23. Ryberg, D.S.; Robinius, M.; Stolten, D. Methodological Framework for Determining the Land Eligibility of Renewable Energy Sources. arXiv 2017, arXiv:1712.07840. [Google Scholar]
  24. European Environment Agency Europe’s Onshore and Offshore Wind Energy Potential: An Assessment of Environmental and Economic Constraints; Publications Office: Luxembourg, 2009.
  25. McKenna, R.; Hollnaicher, S.; Ostman, V.D.; Leye, P.; Fichtner, W. Cost-Potentials for Large Onshore Wind Turbines in Europe. Energy 2015, 83, 217–229. [Google Scholar] [CrossRef]
  26. Eurek, K.; Sullivan, P.; Gleason, M.; Hettinger, D.; Heimiller, D.; Lopez, A. An Improved Global Wind Resource Estimate for Integrated Assessment Models. Energy Econ. 2017, 64, 552–567. [Google Scholar] [CrossRef]
  27. Ryberg, D.S.; Tulemat, Z.; Stolten, D.; Robinius, M. Uniformly Constrained Land Eligibility for Onshore European Wind Power. Renew. Energy 2020, 146, 921–931. [Google Scholar] [CrossRef]
  28. Ryberg, D.S. Generation Lulls from the Future Potential of Wind and Solar Energy in Europe. 2020, pp. 96–109. Available online: https://publications.rwth-aachen.de/record/805445 (accessed on 12 June 2023).
  29. GISCO Corine Land Cover V2012 2012. Available online: https://land.copernicus.eu/pan-european/corine-land-cover/clc-2012 (accessed on 12 July 2023).
  30. GISCO Clusters: Urban 2011 2016. Available online: http://ec.europa.eu/eurostat/web/gisco/geodata/reference-data/elevation/hydrography-laea (accessed on 12 July 2023).
  31. OpenStreetMap Contributors Planet Dump 2017. Available online: https://planet.osm.org (accessed on 12 July 2023).
  32. UNEP-WCMC and IUCN Protected Planet: The World Database on Protected Areas (WDPA) 2016. Available online: https://www.protectedplanet.net/en/search-areas?filters%5Bdb_type%5D%5B%5D=wdpa&geo_type=region (accessed on 12 July 2023).
  33. Baseer, M.A.; Rehman, S.; Meyer, J.P.; Alam, M.M. GIS-Based Site Suitability Analysis for Wind Farm Development in Saudi Arabia. Energy 2017, 141, 1166–1176. [Google Scholar] [CrossRef]
  34. Sánchez-Lozano, J.M.; García-Cascales, M.S.; Lamata, M.T. Identification and Selection of Potential Sites for Onshore Wind Farms Development in Region of Murcia, Spain. Energy 2014, 73, 311–324. [Google Scholar] [CrossRef]
  35. Ayodele, T.R.; Ogunjuyigbe, A.S.O.; Odigie, O.; Munda, J.L. A Multi-Criteria GIS Based Model for Wind Farm Site Selection Using Interval Type-2 Fuzzy Analytic Hierarchy Process: The Case Study of Nigeria. Appl. Energy 2018, 228, 1853–1869. [Google Scholar] [CrossRef]
  36. Höfer, T.; Sunak, Y.; Siddique, H.; Madlener, R. Wind Farm Siting Using a Spatial Analytic Hierarchy Process Approach: A Case Study of the Städteregion Aachen. Appl. Energy 2016, 163, 222–243. [Google Scholar] [CrossRef]
  37. Tlili, O.; Mansilla, C.; Robinius, M.; Ryberg, D.S.; Caglayan, D.G.; Linssen, J.; André, J.; Perez, Y.; Stolten, D. Downscaling of Future National Capacity Scenarios of the French Electricity System to the Regional Level. Energy Syst. 2022, 13, 137–165. [Google Scholar] [CrossRef]
  38. Réfet de la Région Nord-Pas-de-Calais Annexe: ‘Schéma Régional Eolien’. Available online: https://www.hauts-de-france.developpement-durable.gouv.fr/IMG/pdf/sre_et_srs_npdc-2.pdf (accessed on 16 August 2023).
  39. Maestre, V.M.; Ortiz, A.; Ortiz, I. Transition to a Low-Carbon Building Stock. Techno-Economic and Spatial Optimization of Renewables-hydrogen Strategies in Spain. J. Energy Storage 2022, 56, 105889. [Google Scholar] [CrossRef]
  40. Colak, H.E.; Memisoglu, T.; Gercek, Y. Optimal Site Selection for Solar Photovoltaic (PV) Power Plants Using GIS and AHP: A Case Study of Malatya Province, Turkey. Renew. Energy 2020, 149, 565–576. [Google Scholar] [CrossRef]
  41. Günen, M.A. Determination of the Suitable Sites for Constructing Solar Photovoltaic (PV) Power Plants in Kayseri, Turkey Using GIS-Based Ranking and AHP Methods. Environ. Sci. Pollut. Res. 2021, 28, 57232–57247. [Google Scholar] [CrossRef]
  42. Kocabaldır, C.; Yücel, M.A. GIS-Based Multicriteria Decision Analysis for Spatial Planning of Solar Photovoltaic Power Plants in Çanakkale Province, Turkey. Renew. Energy 2023, 212, 455–467. [Google Scholar] [CrossRef]
  43. Tercan, E.; Saracoglu, B.O.; Bilgilioğlu, S.S.; Eymen, A.; Tapkın, S. Geographic Information System-Based Investment System for Photovoltaic Power Plants Location Analysis in Turkey. Environ. Monit. Assess. 2020, 192, 297. [Google Scholar] [CrossRef] [PubMed]
  44. Perpiña Castillo, C.; Batista E Silva, F.; Lavalle, C. An Assessment of the Regional Potential for Solar Power Generation in EU-28. Energy Policy 2016, 88, 86–99. [Google Scholar] [CrossRef]
  45. Yousefi, H.; Hafeznia, H.; Yousefi-Sahzabi, A. Spatial Site Selection for Solar Power Plants Using a GIS-Based Boolean-Fuzzy Logic Model: A Case Study of Markazi Province, Iran. Energies 2018, 11, 1648. [Google Scholar] [CrossRef]
  46. National Energy and Climate Plan; HELLENIC REPUBLIC Ministry of the Environment and Energy: Athens, Greece, 2019.
  47. Argyropoulos, D. Coal, on Its Way out—Greece’s Plans to Phase out Lignite Are Boosted by the Pandemic. 2020. Available online: https://energytransition.org/2020/09/coal-on-its-way-out-how-the-greek-plans-to-phase-out-lignite-are-boosted-by-the-pandemic/ (accessed on 5 July 2023).
  48. Liaggou, C. PPC Extends Operation of Seven Lignite Units to Ensure Supply 2021. Available online: https://www.ekathimerini.com/economy/1174648/ppc-extends-operation-of-seven-lignite-units-to-ensure-supply/ (accessed on 5 July 2023).
  49. Chatzitheodoridis, F.; Kolokontes, A.D.; Vasiliadis, L. Lignite Mining and Lignite-Fired Power Generation in Western Macedonia of Greece: Economy and Environment. J. Energy Dev. 2023, 33, 267–282. [Google Scholar]
  50. 2022 Annual Statistics of Wind Farms 2023. Available online: https://resinvest.gr/2023/02/01/2022-annual-statistics-hellenic-wind-energy-association-2/ (accessed on 7 July 2023).
  51. Petrova, V. Greece Adds Record 1.4 GW of Fresh Solar in 2022—Report 2023. Available online: https://renewablesnow.com/news/greece-adds-record-14-gw-of-fresh-solar-in-2022-report-818214/ (accessed on 7 July 2023).
  52. Suri, M.; Betak, J.; Rosina, K.; Chrkavy, D.; Suriova, N.; Cebecaue, T.; Caltik, M.; Erdelyi, B. Global Photovoltaic Power Potential by Country (English); Energy Sector Management Assistance Program (ESMAP): Washington, DC, USA; World Bank Group: Washington, DC, USA, 2020. [Google Scholar]
  53. 30 Years of Policies for Wind Energy: Lessons from Greece; International Renewable Energy Agency. Available online: https://www.irena.org/publications/2013/Jan/30-Years-of-Policies-for-Wind-Energy-Lessons-from-12-Wind-Energy-Markets (accessed on 9 July 2023).
  54. Greek PV Market Investment Opportunities. Hellenic Association of Photovoltaic Companies. Available online: https://helapco.gr/pdf/Greek_PV_Market_Opportunities_Aug2019.pdf (accessed on 10 January 2024).
  55. Schmidt, O.; Melchior, S.; Hawkes, A.; Staffell, I. Projecting the Future Levelized Cost of Electricity Storage Technologies. Joule 2019, 3, 81–100. [Google Scholar] [CrossRef]
  56. Tassenoy, R.; Couvreur, K.; Beyne, W.; De Paepe, M.; Lecompte, S. Techno-Economic Assessment of Carnot Batteries for Load-Shifting of Solar PV Production of an Office Building. Renew. Energy 2022, 199, 1133–1144. [Google Scholar] [CrossRef]
  57. Aposporis, H. Solar Power Capacity in Greece Overtakes Wind for First Time 2022. Available online: https://balkangreenenergynews.com/solar-power-capacity-in-greece-overtakes-wind-for-first-time/ (accessed on 10 July 2023).
  58. Creutzig, F.; Hilaire, J.; Nemet, G.; Müller-Hansen, F.; Minx, J.C. Technological Innovation Enables Low Cost Climate Change Mitigation. Energy Res. Soc. Sci. 2023, 105, 103276. [Google Scholar] [CrossRef]
  59. Kougioumoutzis, K.; Kokkoris, I.; Panitsa, M.; Kallimanis, A.; Strid, A.; Dimopoulos, P. Plant Endemism Centres and Biodiversity Hotspots in Greece. Biology 2021, 10, 72. [Google Scholar] [CrossRef]
  60. Hu, W.; Scholz, Y.; Yeligeti, M.; Bremen, L.V.; Deng, Y. Downscaling ERA5 Wind Speed Data: A Machine Learning Approach Considering Topographic Influences. Environ. Res. Lett. 2023, 18, 094007. [Google Scholar] [CrossRef]
  61. Antoniadis, A.; Roumpos, C.; Anagnostopoulos, P.; Paraskevis, N. Planning RES Projects in Exhausted Surface Lignite Mines—Challenges and Solutions. In Proceedings of the International Conference on Raw Materials and Circular Economy, Athens, Greece, 5–9 September 2021; p. 93. [Google Scholar]
  62. Knauber, S. RWE and PPC to Build Solar Projects with 280 Megawatts of Capacity in Greece. Available online: https://www.rwe.com/en/press/rwe-renewables-europe-australia/23-07-31-rwe-and-ppc-to-build-solar-projects-with-280-mw-of-capacity-in-greece/ (accessed on 10 December 2023).
Figure 1. Electric power generation by variable sources in Greece from 1990 to 2020 [5].
Energies 17 00567 g001
Figure 2. Location and region of the Megalopoli lignite mine.
Energies 17 00567 g002
Figure 3. Location and region of the Ptolemaida lignite mine.
Energies 17 00567 g003
Figure 4. Currently installed wind farms’ area in Greece.
Energies 17 00567 g004
Figure 5. (a) The current wind farms combined with the DEM map of Greece. (b) Mean WPD map of Greece with the installed wind farms, where the blue areas indicate the areas with wind turbines.
Energies 17 00567 g005
Figure 6. Areas of the currently installed PV parks in Greece.
Energies 17 00567 g006
Figure 7. (a) The current PV parks combined with the DEM map of Greece. (b) Mean GHI of Greece with the installed PV parks, where the blue areas indicate the areas with PV parks.
Energies 17 00567 g007
Figure 8. Land eligibility prediction process for onshore wind in Greece.
Energies 17 00567 g008
Figure 9. Onshore wind land eligibility excluding the land constraints from Table 1.
Energies 17 00567 g009
Figure 10. Predicted onshore wind turbine areas with the mean WPD map, in which blue areas indicate the areas with predicted wind turbines.
Energies 17 00567 g010
Figure 11. Land eligibility prediction process for open-field PV in Greece.
Energies 17 00567 g011
Figure 12. Open-field PV land eligibility excluding the land constraints from Table 3.
Energies 17 00567 g012
Figure 13. Predicted open-field PV area with the mean GHI map, in which blue areas indicate the areas with PV power plants.
Energies 17 00567 g013
Figure 14. Current wind farms and predicted wind turbine areas shown in the DEM map of Greece.
Energies 17 00567 g014
Figure 15. Unsuitable areas for wind turbines’ construction and the existing wind farms in Greece. White areas present the eligible land, while gray areas present the unsuitable land. Green areas and red areas, respectively, stand for Natura 2000 sites and the current wind farms.
Energies 17 00567 g015
Figure 16. Unsuitable areas for the construction of PV power plants and the existing PV parks in Greece. White areas present the eligible land, while gray areas present the unsuitable land. Green areas and red areas, respectively, stand for Natura 2000 sites and the current PV parks.
Energies 17 00567 g016
Figure 17. (a) Simulated placements of wind turbines with the WPD map of the Megalopoli Mine. (b) Simulated placements of wind turbines with the WPD map of the Ptolemaida I Mine. (c) Simulated placements of wind turbines with the WPD map of the Ptolemaida II Mine.
Energies 17 00567 g017
Figure 18. (a) Simulated placements of PV parks with the GHI map of the Megalopoli Mine. (b) Simulated placements of PV parks with the GHI map of the Ptolemaida I Mine. (c) Simulated placements of PV parks with the GHI map of the Ptolemaida II Mine.
Energies 17 00567 g018
Table 1. Land constraints for onshore wind turbines.
ConstraintThresholdData Source
Socio-political:
Distance from Rural Settlements>500 mCLC [29]
Distance from Urban Settlements>1000 mEuroStat [30]
Distance from Roadways>120 mOpen Street Map [31]
Distance from Railways>120 mOpen Street Map [31]
Distance from Power Lines>120 mOpen Street Map [31]
Distance from Touristic Areas>1500 mOpen Street Map [31]
Distance from Airports>3000 mCLC [29], EuroStat [30]
Distance from Agricultural AreasExcludedCLC [29]
Physical:
Terrain Slope<17°EuroDEM [18]
Distance from Coastlines>1500 mCLC [29]
Distance from Sandy AreasExcludedCLC [29]
Distance from WoodlandsExcludedCLC [29]
Distance from WaterbodiesExcludedCLC [29]
Distance from RiversExcludedEuroStat [30]
Distance from WetlandsExcludedCLC [29]
Conservation:
Distance from Natural Monuments>800 mWDPA [32]
Distance from Parks>800 mWDPA [32]
Distance from Landscapes>1000 mWDPA [32]
Natura 2000 AreasExcludedNatura 2000 [14]
Economic:
Wind Speed<4 m/sGlobal Wind Atlas [19]
Access Distance<5 kmOpen Street Map [31]
Connection Distance<20 kmOpen Street Map [31]
Table 2. Summary of the parameters of the reference wind turbine [28].
ParameterValue
Hub Height120 m
Rotor Diameter136 m
Capacity4200 kW
Specific Power289 W/m2
Table 3. Land constraints for open-field PV.
ConstraintThresholdData Source
Socio-political:
Distance from Settlements>200 mCLC [29]
Distance from Airports>2000 mCLC [29], EuroStat [30]
Distance from Industrial AreasExcludedCLC [29]
Distance from Agricultural AreasExcludedCLC [29]
Physical:
Terrain Slope: Total<10°EuroDEM [18]
Terrain Slope: Northward<3°EuroDEM [18]
Distance from Elevation<1500 mEuroDEM [18]
Distance from Waterbodies>500 mCLC [29]
Distance from WoodlandsExcludedCLC [29]
Distance from WetlandsExcludedCLC [29]
Distance from CoastlinesExcludedCLC [29]
Distance from Sandy AreasExcludedCLC [29]
Conservation:
Distance from Natural Monuments>200 mWDPA [32]
Distance from LandscapesExcludedWDPA [32]
Distance from ParksExcludedWDPA [32]
Natura 2000 AreasExcludedNatura 2000 [14]
Economic:
Connection Distance<20 kmOpen Street Map [31]
Access Distance<10 kmOpen Street Map [31]
Table 4. Summary of the parameters of the reference open-field PV panels, Winaico WSx-240P6 [28].
ParameterValue
Max Power240.4 W
Area1.663 m2
TechnologyPolycrystalline
Table 5. The predicted placements of wind turbines and PV parks along with the energy potential of both in the lignite mines of Megalopoli and Ptolemaida I and II.
Lignite MineMegalopoliPtolemaida IPtolemaida IITotal
Wind:
Wind Turbines3415561250
Wind Turbine Power (kW)420042004200
Energy Yield (kWh/kW)300030003000
Wind Energy Potential (GWh)42819537693150
Solar:
PV Parks2110237160
Area for PV (km2)11.568.922.1102.5
PV Peak Power (GWp)1.79.93.2
Energy Yield (kWh/kWp)140014001400
PV Energy Potential (GWh)232413,901446520,690
Disclaimer/Publisher’s Note: The statements, opinions and data contained in all publications are solely those of the individual author(s) and contributor(s) and not of MDPI and/or the editor(s). MDPI and/or the editor(s) disclaim responsibility for any injury to people or property resulting from any ideas, methods, instructions or products referred to in the content.

