Abstract
To investigate the economic impact of carbon reduction technology on power transmission and transformation projects, carbon reduction technologies adapted to power transmission and transformation projects were investigated, and the evaluation indicator system for cost-benefit in power transmission and transformation projects was established based on AHP (Analytic Hierarchy Process) and EWM (Entropy Weight Method). Taking 110 kV and 220 kV transmission and transformation projects in a province located in northwest China as an example, a sensitivity analysis was carried out for the weight of each carbon reduction technology. Additionally, based on the evaluation indicator system, eight alternative carbon reduction schemes were proposed, and the net present value and scheme scores were analyzed with TOPSIS (Technique for Order of Preference by Similarity to Ideal Solution). The results showed that in the criterion layer of the 110 kV case, the highest proportion of weight is “high-efficiency transformer”, accounting for 34.12%, and in the indicator layer, the highest proportion of weight is “ parasitic losses”, accounting for 12.35%. After conducting error analysis on the 110 kV and 220 kV cases, it was found that the errors were within an acceptable range both in the criterion layer and index layer. Moreover, it is expected to achieve greater economic benefits through lower costs according to Scheme VI, and due to the limitations of carbon reduction technologies and the lack of a relevant policy system, it is difficult to achieve the goal of covering costs with benefits for the eight schemes studied.
1. Introduction
In recent decades, the destruction of environmental resources and global warming caused by industrialization has led to a global consensus on greenhouse gas emissions reduction worldwide. The power industry accounted for the largest share of China’s carbon dioxide emissions in 2022, so after China’s proposal to “peak carbon emissions by 2030 and achieve carbon neutrality by 2060”, the power industry has been actively striving to take the lead in achieving peak carbon emissions [1].
As a dominant force in carbon emission reduction, the power industry contributes to carbon reduction in various ways, including the applications of CCUS (Carbon Capture, Utilization, and Storage) in the power generation process, the enhancement of energy saving, and the upgrading of the consumer side, etc. [2,3] However, at present, there are few carbon reduction measures in transmission and transformation projects [4]. Data show that the total investment in China’s power grid during the “14th Five-Year Scheme” period is close to 3 trillion yuan, higher than the “Twelfth Five-Year Scheme” and “thirteenth Five-Year Scheme” period of 2 trillion yuan and 2.57 trillion yuan of investment [5]. In 2022, the annual investment in State Grid Ltd. has been scheduled to exceed 500 billion yuan for the first time.
In March 2021, in order to implement the concept of green development of power transmission and transformation projects and form scalable scientific management experience, State Grid Ltd. organized the preparation of the Evaluation Criteria for Green Construction of Transmission and Transformation Projects (Trial) and carried out the pilot project of green construction for power transmission and transformation projects [6]. In addition to this, State Grid Ltd. carried out inspection and evaluation in combination with the selection of high-quality power transmission and transformation projects, selected demonstration projects, summarized advanced typical experience, and fully stimulated the endogenous power of each unit [7]. Before 15 April 2021, provincial companies have selected 2–4 projects to pilot carbon reduction construction of power transmission and transformation projects. The pilot project took into account voltage level and project type, intended to participate in the company’s 2021 power transmission and transformation quality project Gold and Silver Award selection. The surge in power grid investment also brings about the allocation of funds. It is particularly important to maximize the utilization rate of funds by investing government funds into carbon reduction technologies with significant carbon reduction effects and low costs [8].
The low-carbon construction of transmission and transformation projects is emerging as a pivotal direction for the sustainable development of power systems. The foreseeable future anticipates continued innovation and application of low-carbon technologies to mitigate climate change and enhance energy efficiency. Emerging technologies such as smart grids, efficient transformers, and clean air-insulated equipment are poised for widespread adoption to elevate the overall efficiency of transmission and transformation systems. Policy initiatives are expected to further support the integration of renewable energy, propelling the power industry towards a low-carbon, efficient, and renewable trajectory. The ongoing in-depth research and application of these advanced technologies provide a robust academic foundation and practical support for low-carbon construction in transmission and transformation projects.
Some experts have researched carbon reduction technologies for transmission and transformation projects. Chau et al. [9] evaluated the impacts of carbon reduction engineering projects on the environment by using the full lifecycle energy-saving evaluation method and the carbon emission analysis method, pointing out that each of them has its own focus in the evaluation process, but the difficulty lies in defining the lifecycle and setting up the analysis framework. Li Zhengmao et al. [10] proposed a multi-objective coordinated energy dispatch and voyage scheduling method for the cruising ship, which is presented to simultaneously reduce the ship operating cost and gas emissions by the augmented ε-constraint method. Wu, Jiahui et al. [11] first presents a comprehensive evaluation system for conducting static and transient voltage stability analysis in electric power systems based on the subjective analytic hierarchy process weighting method and the objective entropy weighting method.
This paper fully summarizes previous research results and combines them with engineering practice, starting from the energy-saving potential of building design, electrical main equipment, and electrical auxiliary equipment. Six carbon reduction technologies adapted to transmission lines and substations are investigated, including passive building, building materials with carbon capture production processes, energy-saving conductors, high-efficiency transformers, new reactive power compensation equipment, reduced energy consumption of auxiliary equipment, and combined with the main factors affecting the six carbon reduction technologies, we constructed an evaluation system that can comprehensively evaluate the costs and benefits of carbon reduction in transmission and transformation projects. Then, the Analytic Hierarchy Process (AHP) is used to calculate the influence weights of primary and secondary indicators on transmission and transformation projects, and the entropy weight method is used to objectify the weights, which gives the evaluation system the advantages of both subjective and objective evaluation and is more perfect than the existing evaluation system. Based on this evaluation system, the 110 kV transmission and transformation project is selected for case calculation, and after obtaining the weights of each indicator, a sensitivity analysis is carried out for the six carbon reduction technologies, and eight carbon reduction schemes are set up according to the evaluation system, and the cash inflows, cash outflows and net cash flows of each carbon reduction scheme are calculated, and the economics of the eight carbon reduction schemes are finally scored and ranked, so that the carbon reduction scheme best adapted to the case is optimized. The most suitable carbon reduction scheme for the case was selected.
The remainder of this paper is organized as follows: Section 2 provides an evaluation system of carbon reduction technologies in power transmission and transformation projects. Section 3 provides a full lifecycle cost-benefit analysis of carbon reduction technologies for transmission and transformation projects, and Section 4 provides conclusions.
2. Evaluation System of Carbon Reduction Technologies in Power Transmission and Transformation Projects
2.1. Construction of the Indicator System
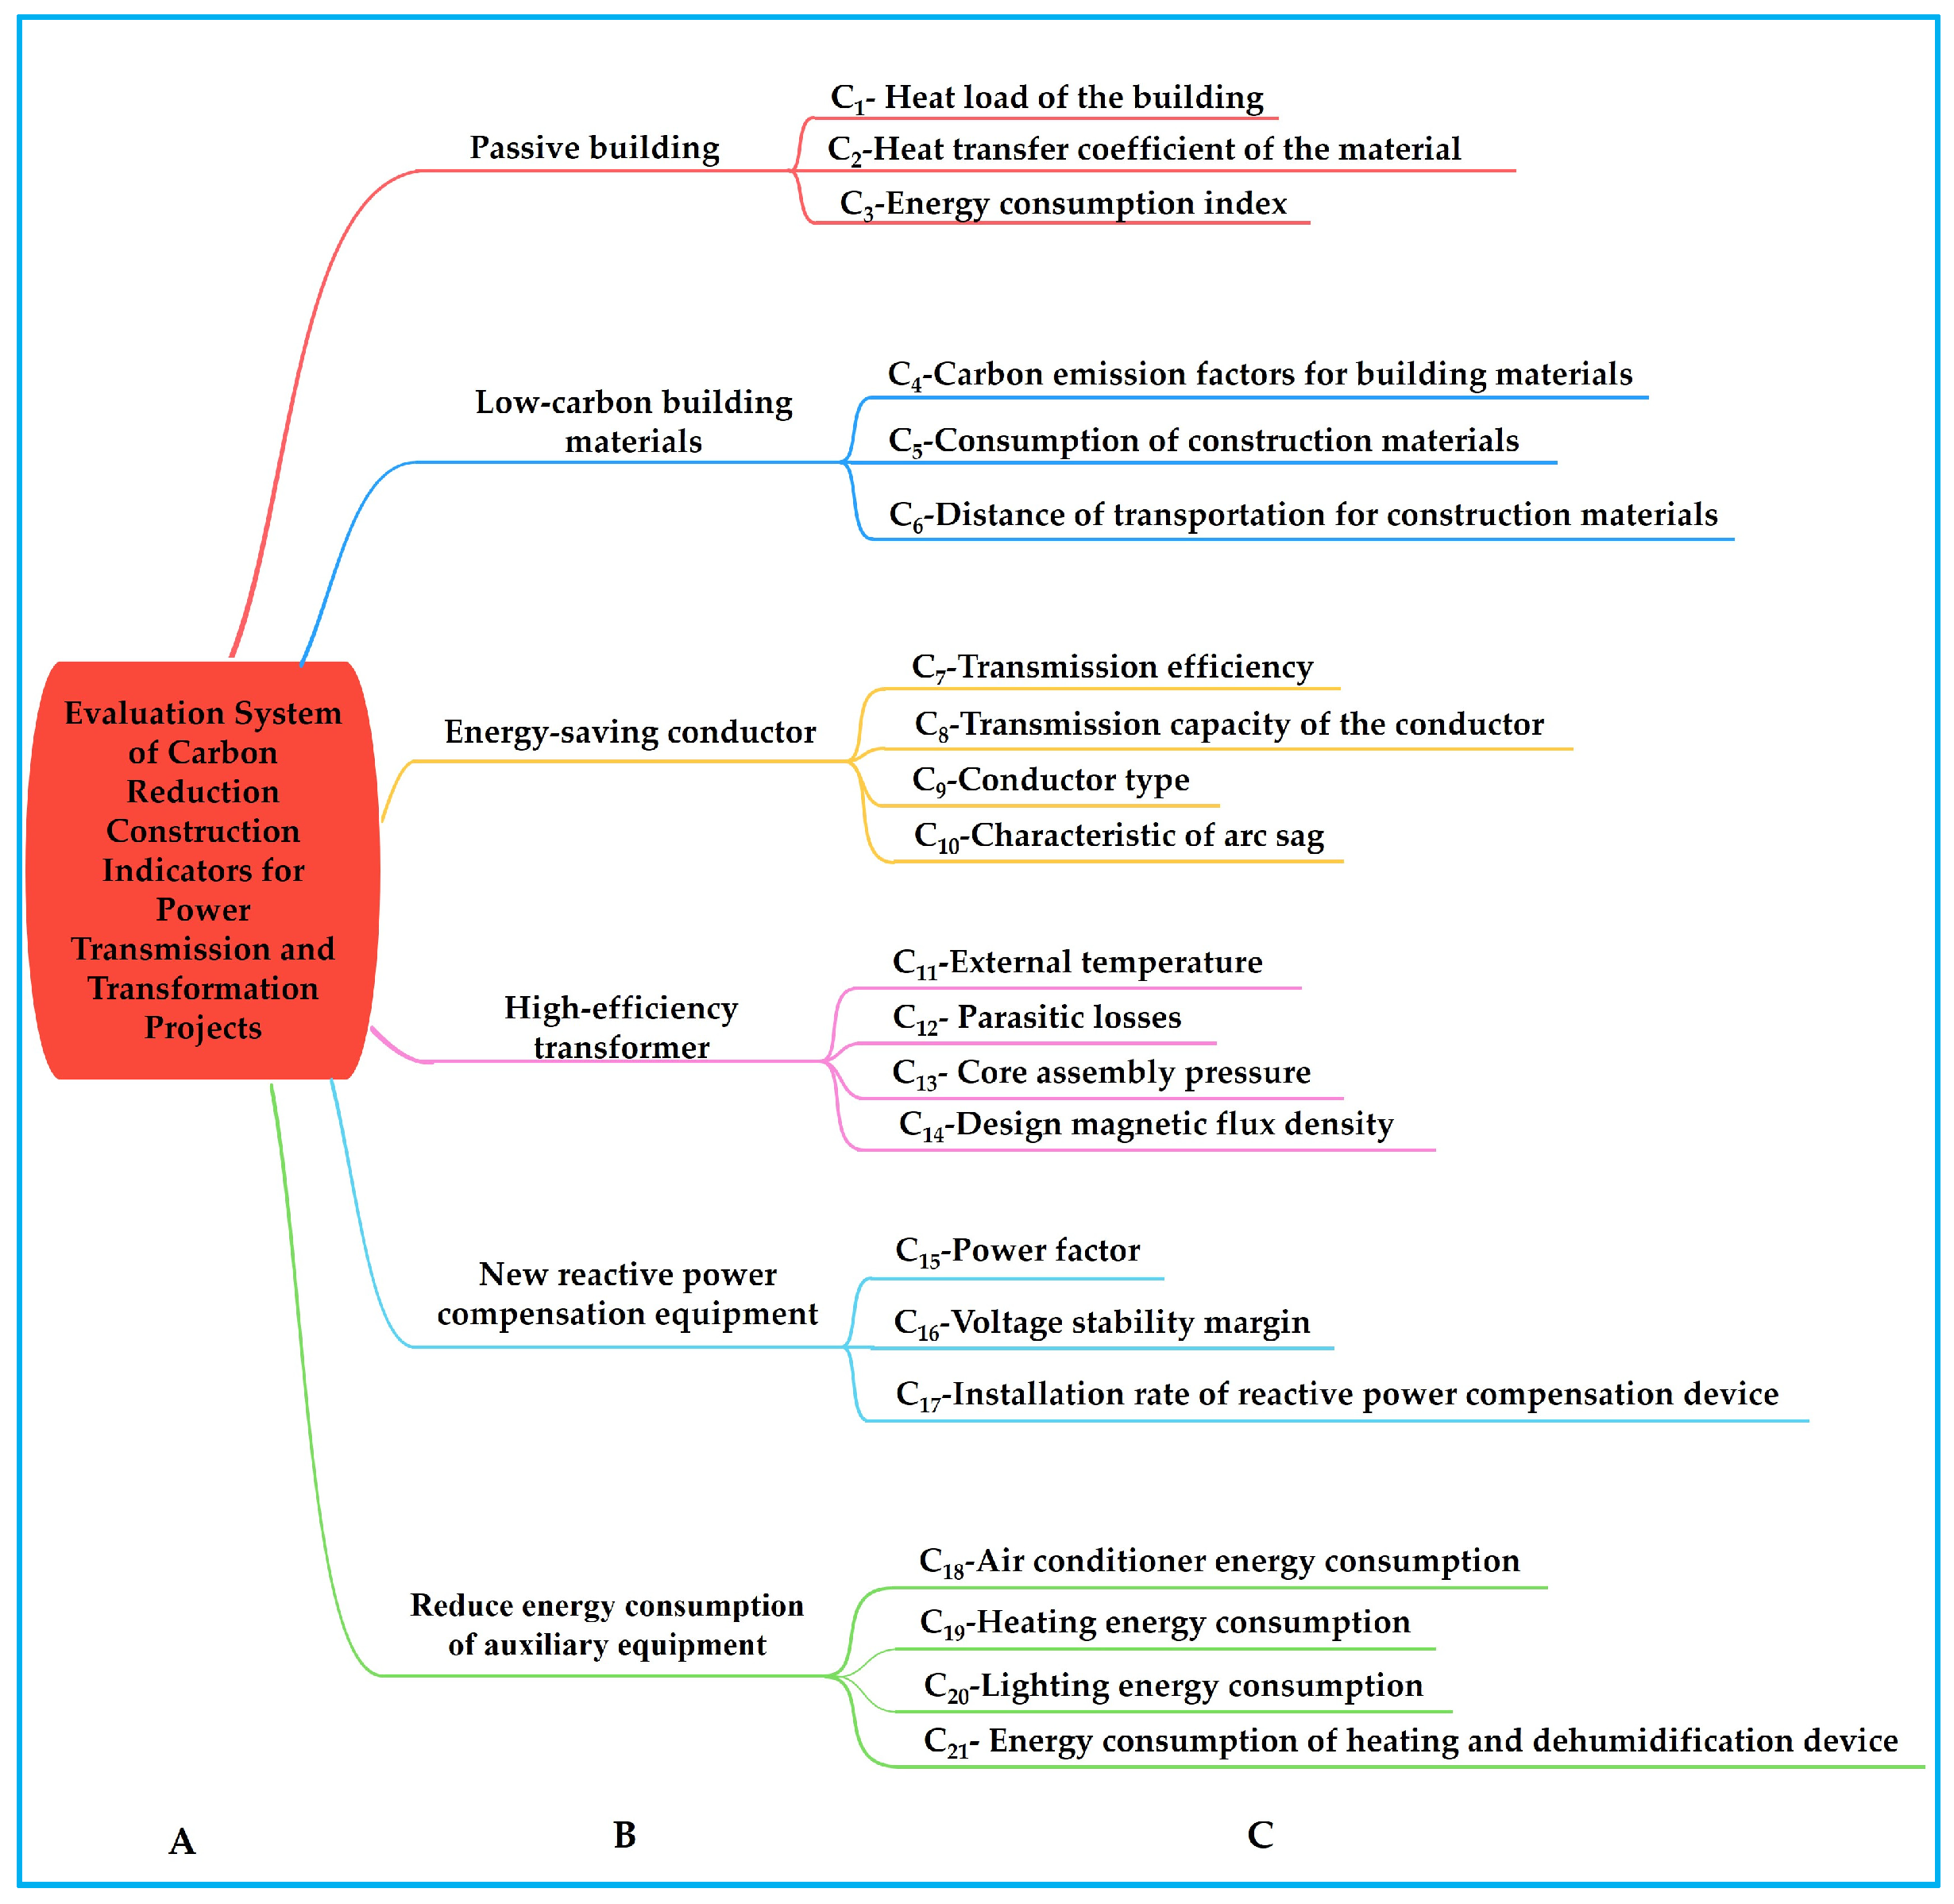
Based on the results of literature research and the advice given by experts with high professional knowledge and experience, a comprehensive evaluation indicator system for transmission and transformation projects in the context of carbon reduction demands was established, as shown in Figure 1. In the figure, layer A is the target layer of the evaluation system that represents the object of the study. Layer B shows each carbon reduction technology applicable to transmission and transformation projects, called the criterion layer, and layer C, the indicator layer of the evaluation system, which is used to represent the main indicators affecting the costs and benefits of each carbon reduction technology.
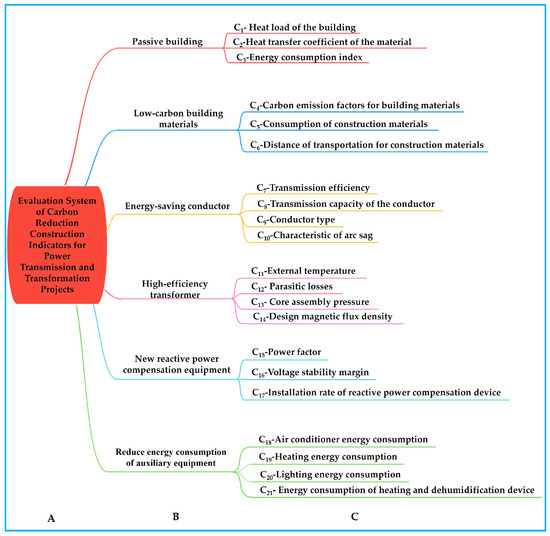
Figure 1.
Evaluation indicator system of carbon reduction technology in transmission and transformation projects.
2.2. Calculation of Indicator Weights
2.2.1. The Analytic Hierarchy Process (AHP)
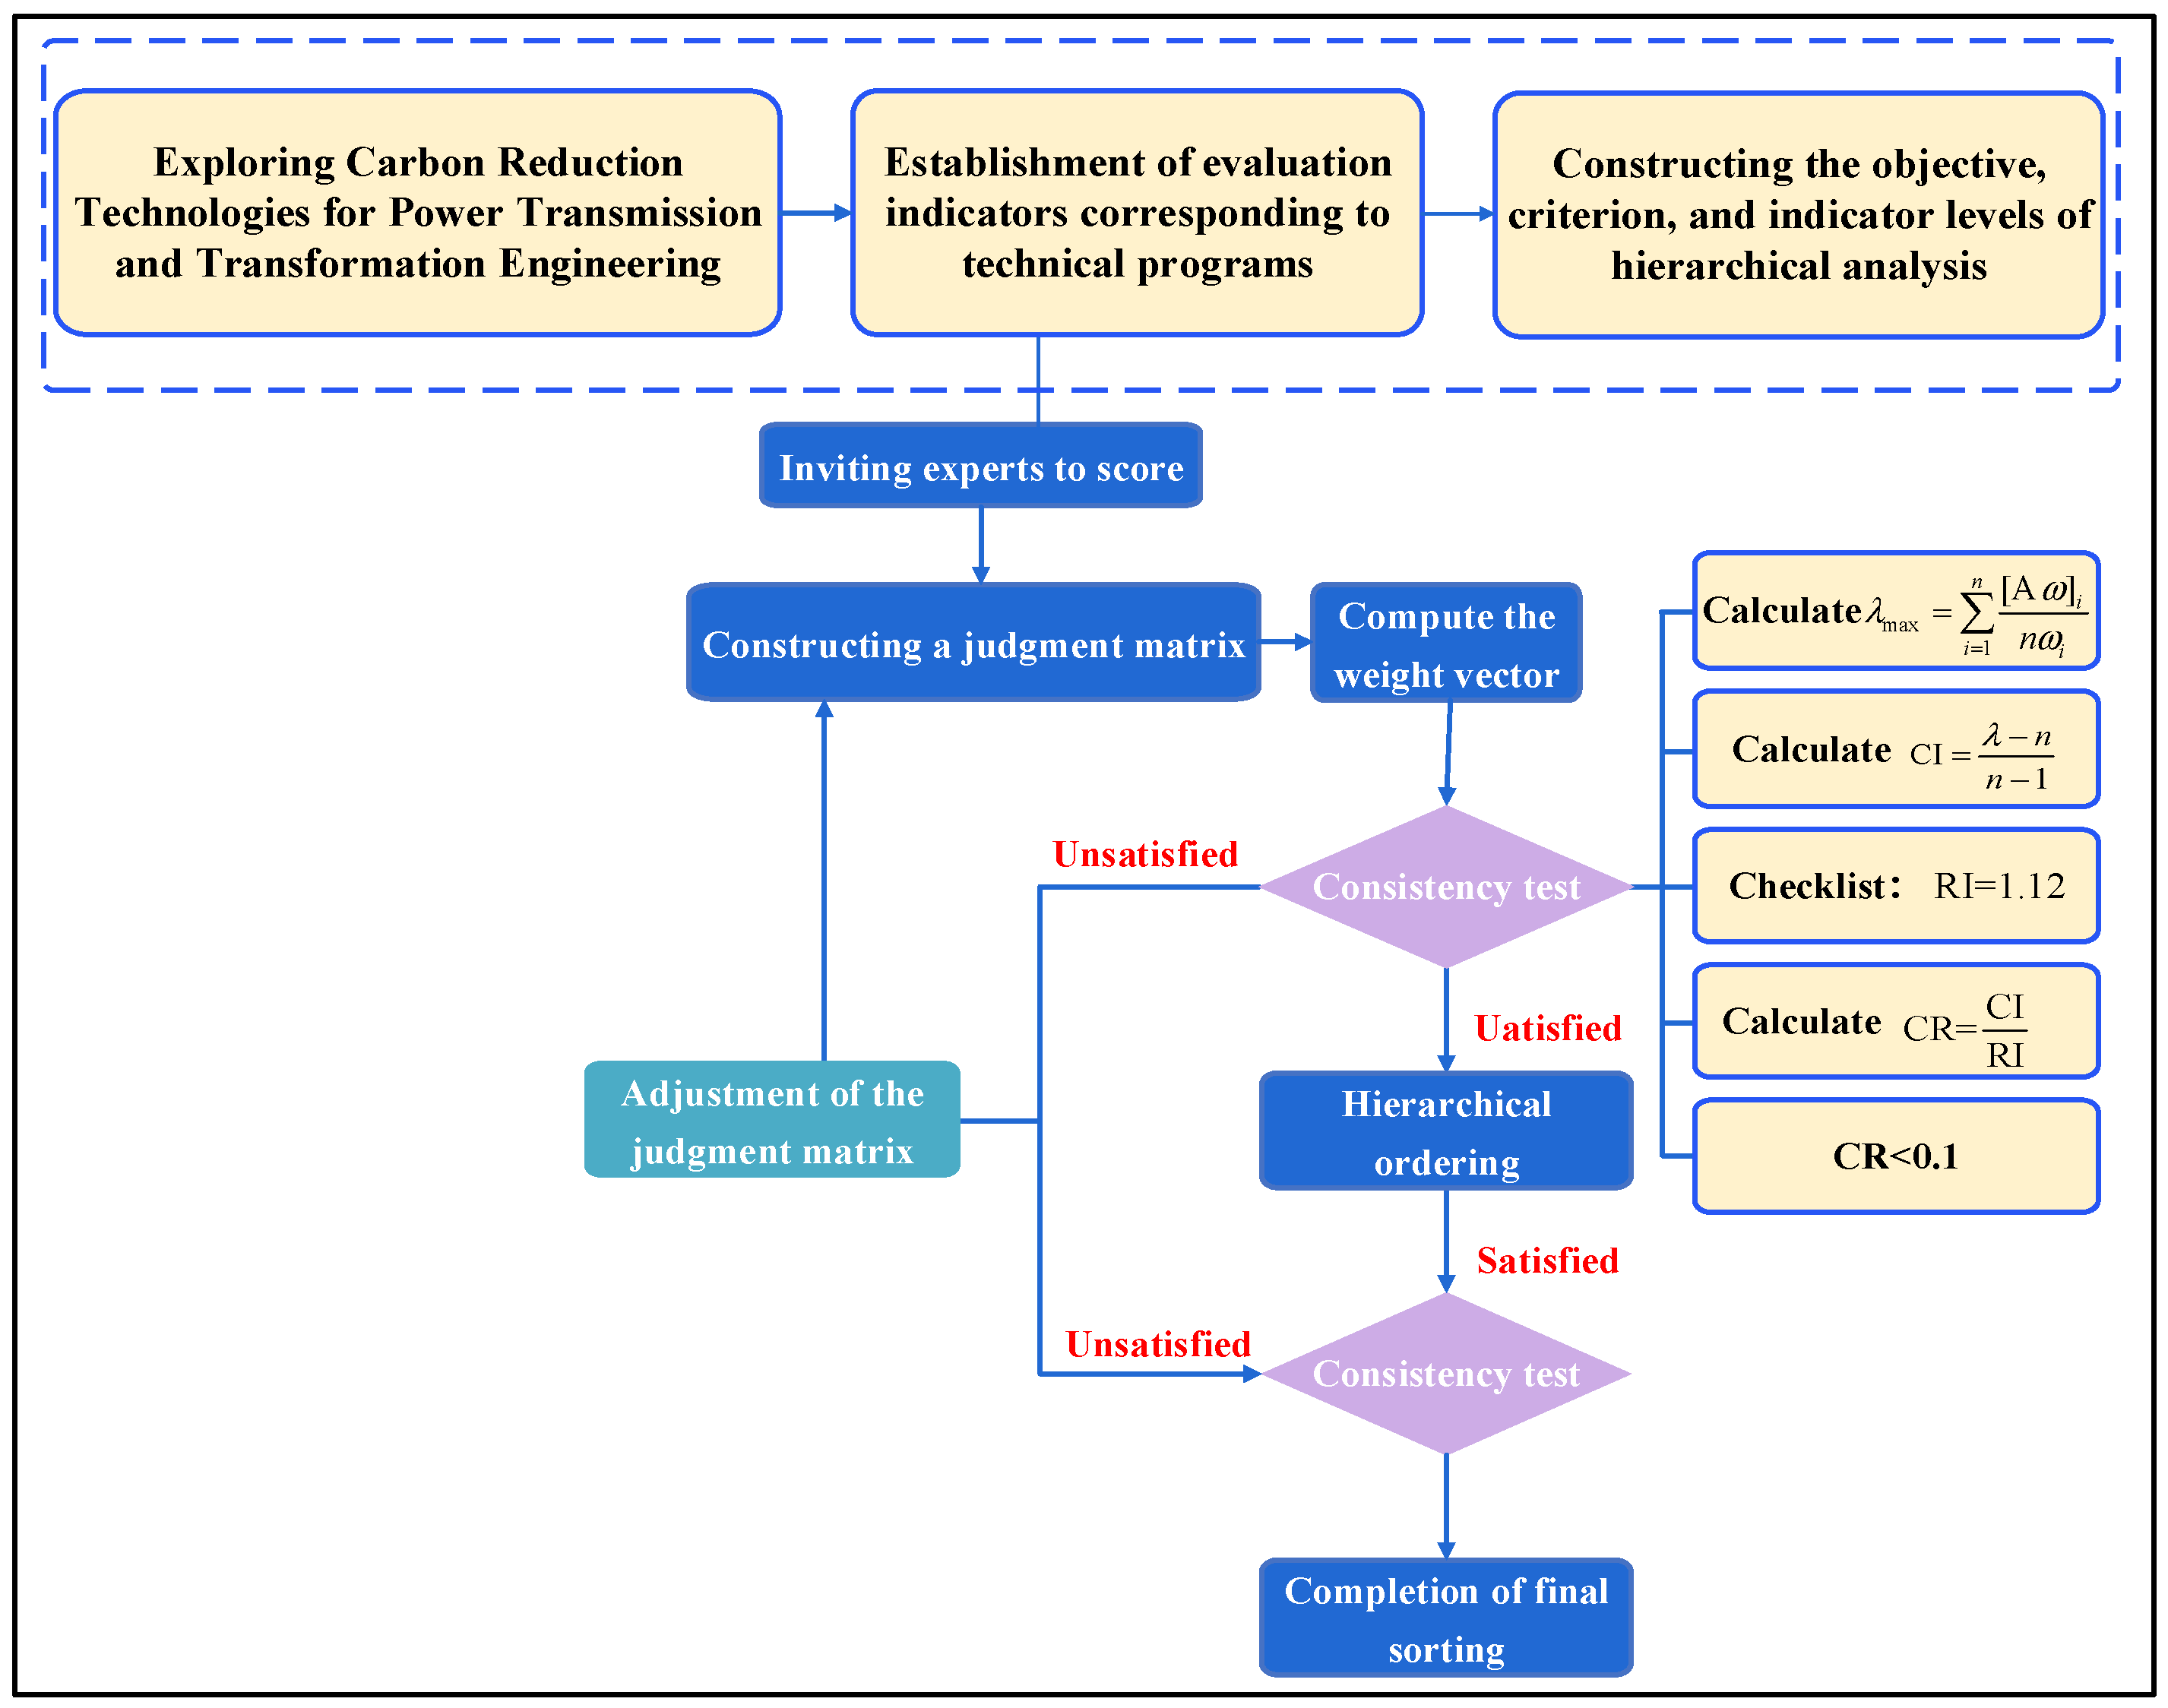
The analytic Hierarchy Process (AHP) was proposed by Saaty, an American operations researcher and professor at the University of Pittsburgh, in the 1970s [12]. It is used for weighting analysis of the influencing factors for the target problem and scheme selection, and its calculation process is shown in Figure 2. The calculation steps are as follows:
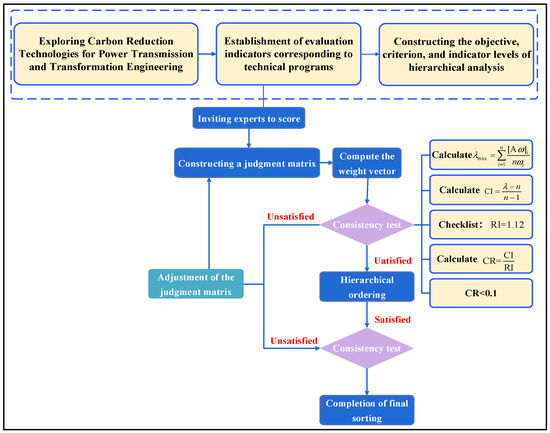
Figure 2.
Calculation process of hierarchical analysis.
- (1)
- Hierarchical model
Firstly, the main body of the problem is divided into three levels: the target layer, the criterion layer, and the scheme layer. In practical application, the model is not necessarily limited to these three layers but can be divided according to the actual situation; this paper sets the target layer, criterion layer, and indicator layer.
- (2)
- Judgment matrix
Several experts with high professional knowledge and experience were invited to score the judgment matrix so that qualitative problems can be described quantitatively. The judgment matrix C is an n × n matrix, where n denotes the number of sub-targets, and the matrix C is constructed to compare the magnitude of importance between different elements, which is defined as:
The judgment matrix is determined as follows:
- a.
- Define a comparison scale: to fill the elements of the judgment matrix, it is necessary to define a comparison scale for quantifying the relative importance between two criteria or scenarios. A scale from 1 to 9 is generally used, and the meanings are given in Table 1.
 Table 1. Level scale method and meaning [13]. (Adapted with permission from Pedram Ahadi et al., Renewable Energy; published by Elsevier, 2023).
 - b.
- Complete the judgment matrix: fill in the elements of the judgment matrix, ensuring that the symmetry of the elements on the diagonal is 1.
- c.
- Calculate the weight vector
The weight vector is a column vector used to represent the importance of each factor or sub-objective and is calculated as follows:
- d.
- Consistency test
The equations for the consistency indicator CI and consistency ratio CR are as follows, where the range of values of RI is shown in Table 2, and the judgment matrix consistency test is considered to be passed when CR < 0.1 [14].
Table 2.
Average random consistency indicator RI [14]. (Adapted with permission from Dimitrios K. Alexopoulos et al., ScienceDirect; published by Elsevier, 2022).
2.2.2. Entropy Weight Method (EWM)
Entropy Weight Method (EWM) is an objective decision-making method adapted to multi-indicator constraints [15], whose basic principle is to determine the importance of each indicator by calculating the information entropy, which can be used to determine the weights of each indicator through the characteristics of the data itself without the need for subjective judgment [16]. The calculation process of the entropy weight method is shown in Figure 3, and the calculation steps and equations are shown in Table 3.
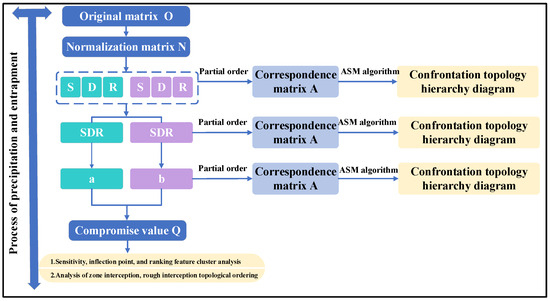
Figure 3.
Calculation process of EWM.
Table 3.
Calculation steps of EWM [17]. (Adapted with permission from Yongjun Li et al., published by Elsevier, 2020).
Since AHP and EWM have their own advantages and disadvantages, we decided to establish a linear combination method to get the combination weight; that is, after calculating each weight using AHP, EWM is used to standardize the indicators and modify the weight. The calculation method of combination weight is based on the following equation [18,19]:
where is the combined weight for the i-th indicator, is the subjective weight for the i-th indicator calculated by AHP, and is the objective weight for the i-th indicator calculated by EWM.
3. Full Lifecycle Cost-Benefit Analysis of Carbon Reduction Technologies for Transmission and Transformation Projects
3.1. Cost Analysis of Carbon Reduction Technologies
- 1.
- Passive building
While traditional buildings mainly consume primary energy to regulate the indoor environment and provide a suitable living environment for human beings, passive buildings focus on the performance-based design, fully consider the regional climatic conditions, optimize the building layout and orientation to reduce the energy demand of the building, to achieve the purpose of energy saving and carbon reduction [20,21]. Compared with traditional buildings, passive buildings can achieve ultra-low energy consumption, zero energy consumption, or even negative energy consumption, which has great development potential in the direction of carbon reduction and energy saving [22]. Its incremental cost is composed of two parts: the upfront incremental cost and the technological incremental cost, which is calculated as follows:
where is the full lifecycle cost of passive buildings and and are the upfront incremental cost and the technological incremental cost, respectively. and are the consultancy costs and accreditation costs, respectively. , , and are the energy-saving costs, water-saving costs, and material-saving costs, respectively.
- 2.
- Low-carbon building materials
The building materials of transmission and transformation projects, such as steel, cement, concrete, etc., will produce a large amount of carbon emissions during the production process, and it is a big trend to use carbon capture technology to capture carbon emissions. Literature took a cement scheme as an example [23]; based on the chemical absorption method of post-combustion carbon capture technology, the existing 5000 t/d clinker production line is modified.
- 3.
- Energy-saving conductors
In recent years, the cable industry has developed rapidly in China, and a variety of new conductors have emerged, one after another, which can achieve effective carbon reduction. The life cycle cost of energy-saving conductors is calculated as follows [24]:
where is the full lifecycle cost of energy-saving conductors, , , , and are the construction cost, the operating cost, the maintenance costs, and the discard costs on energy-saving conductors, respectively.
where is the construction cost of each transmission line and is the collection of all lines.
where is maximum load loss time, is the price of electricity, is Modified line active losses at maximum distribution network load on a typical day, and is the maximum value of active losses for each transmission line.
where L is the length of the transmission line.
where is the sum of construction costs for energy-saving conductors and is an operating cycle of the transmission line.
- 4.
- High-efficiency transformers
As an important piece of equipment in power transmission and transformation, the transformer plays an important role in carbon reduction [25]. With the development of science and technology, the application of high-efficiency transformers will promote more efficient and low-carbon operations for transmission and transformation projects [26]. Its full life cycle cost is calculated as follows [27,28]:
where is the full lifecycle cost of high-efficiency transformers, , , , and are the construction costs, operating costs, maintenance costs, and discard costs on high-efficiency transformers.
where is the construction costs of each high-efficiency transformer and is the collection of all high-efficiency transformers.
where and are the variable and invariable losses in each distribution transformer on a typical day, respectively, is the life cycle of the transformer, is the no-load losses for each transformer, and is the load losses for each transformer.
where is the maintenance costs on high-efficiency transformers for the first phase, is the maintenance costs for overhaul, and is the construction costs on each high-efficiency transformer. New reactive power compensation equipment.
- 5.
- New reactive power compensation equipment
Reactive power compensation devices play a role in the power supply system to improve the power factor of the grid as well as the power supply efficiency [29], which is indispensable equipment in the power system. Reasonable selection of reactive power compensation devices can minimize network losses, improve the quality of the grid, and indirectly reduce carbon emissions from transmission and transformation lines [30]. The specific calculation equation is as follows:
where is the full lifecycle cost of the reactive power compensation equipment, and are the discard cost and the construction cost of each reactive power compensation equipment, is the sum of construction costs for the reactive power compensation equipment.
3.2. Analysis of the Benefits of Carbon Reduction Technologies
Due to the specificity of power transmission and transformation projects, it is difficult to produce carbon emission reduction effects directly, but by improving transmission efficiency or reducing line loss, there are other indirect ways to achieve carbon emission reduction. So, according to the literature recommended, we quantify the carbon reduction benefits as the gains from electricity savings resulting from carbon reduction technologies; the calculation equation is as follows [2]:
where C is the benefits of carbon reduction technologies, is annual electricity saving, and is current feed-in tariffs.
4. The Case of the 110 kV Transmission and Transformation Project
4.1. Calculation of the Weights for the Indicators
To verify the accuracy of the proposed evaluation indicator system for power transmission and transformation projects and to propose a carbon reduction technology path adapted to power transmission and transformation projects, 110 kV and 220 kV transmission and transformation projects in a province located in northwest China were taken as a typical example for calculation and analysis. The basic parameters used in the case are shown in Table 4.
Table 4.
Basic parameters of the 110 kV case.
Experts were invited to carry out preliminary scoring of each indicator and review relevant literature to establish the judgment matrix for the indicator layer shown in Table 5 and Table 6.
Table 5.
Judgment matrix for criterion layer of 110 kV transmission and transformation project.
Table 6.
Judgment matrix for criterion layer of 220 kV transmission and transformation project.
The literature [31] indicates that according to statistics, the loss of a transformer accounts for about 20% of the power system loss, so the energy-saving transformation of the transformer can greatly support the national energy-saving and emission reduction work. Meanwhile, the typical case results in the literature [32] indicate that when replacing the S11 transformer with S15, the full lifecycle cost of the transformer will be reduced from 156,565 yuan, equivalent to reducing CO2 emissions by about 240,920 t and saving 456.4 million yuan in electricity costs. In addition, the article [33] proposes that conductor type and transmission capacity have an important impact on the cost of the conductor, while the cost of conventional wire is 438,100 yuan/km, with resistance loss of 737.51 MWh/km, if the conventional conductor is replaced with steel-core high-conductivity aluminum stand, the cost of the conductor will rise to 463,000 yuan/km, the resistance loss decreased to 717.23 MWh/km. All these show that high-efficient transformers and energy-saving conductors play a very important role in carbon reduction in power transmission and transformation.
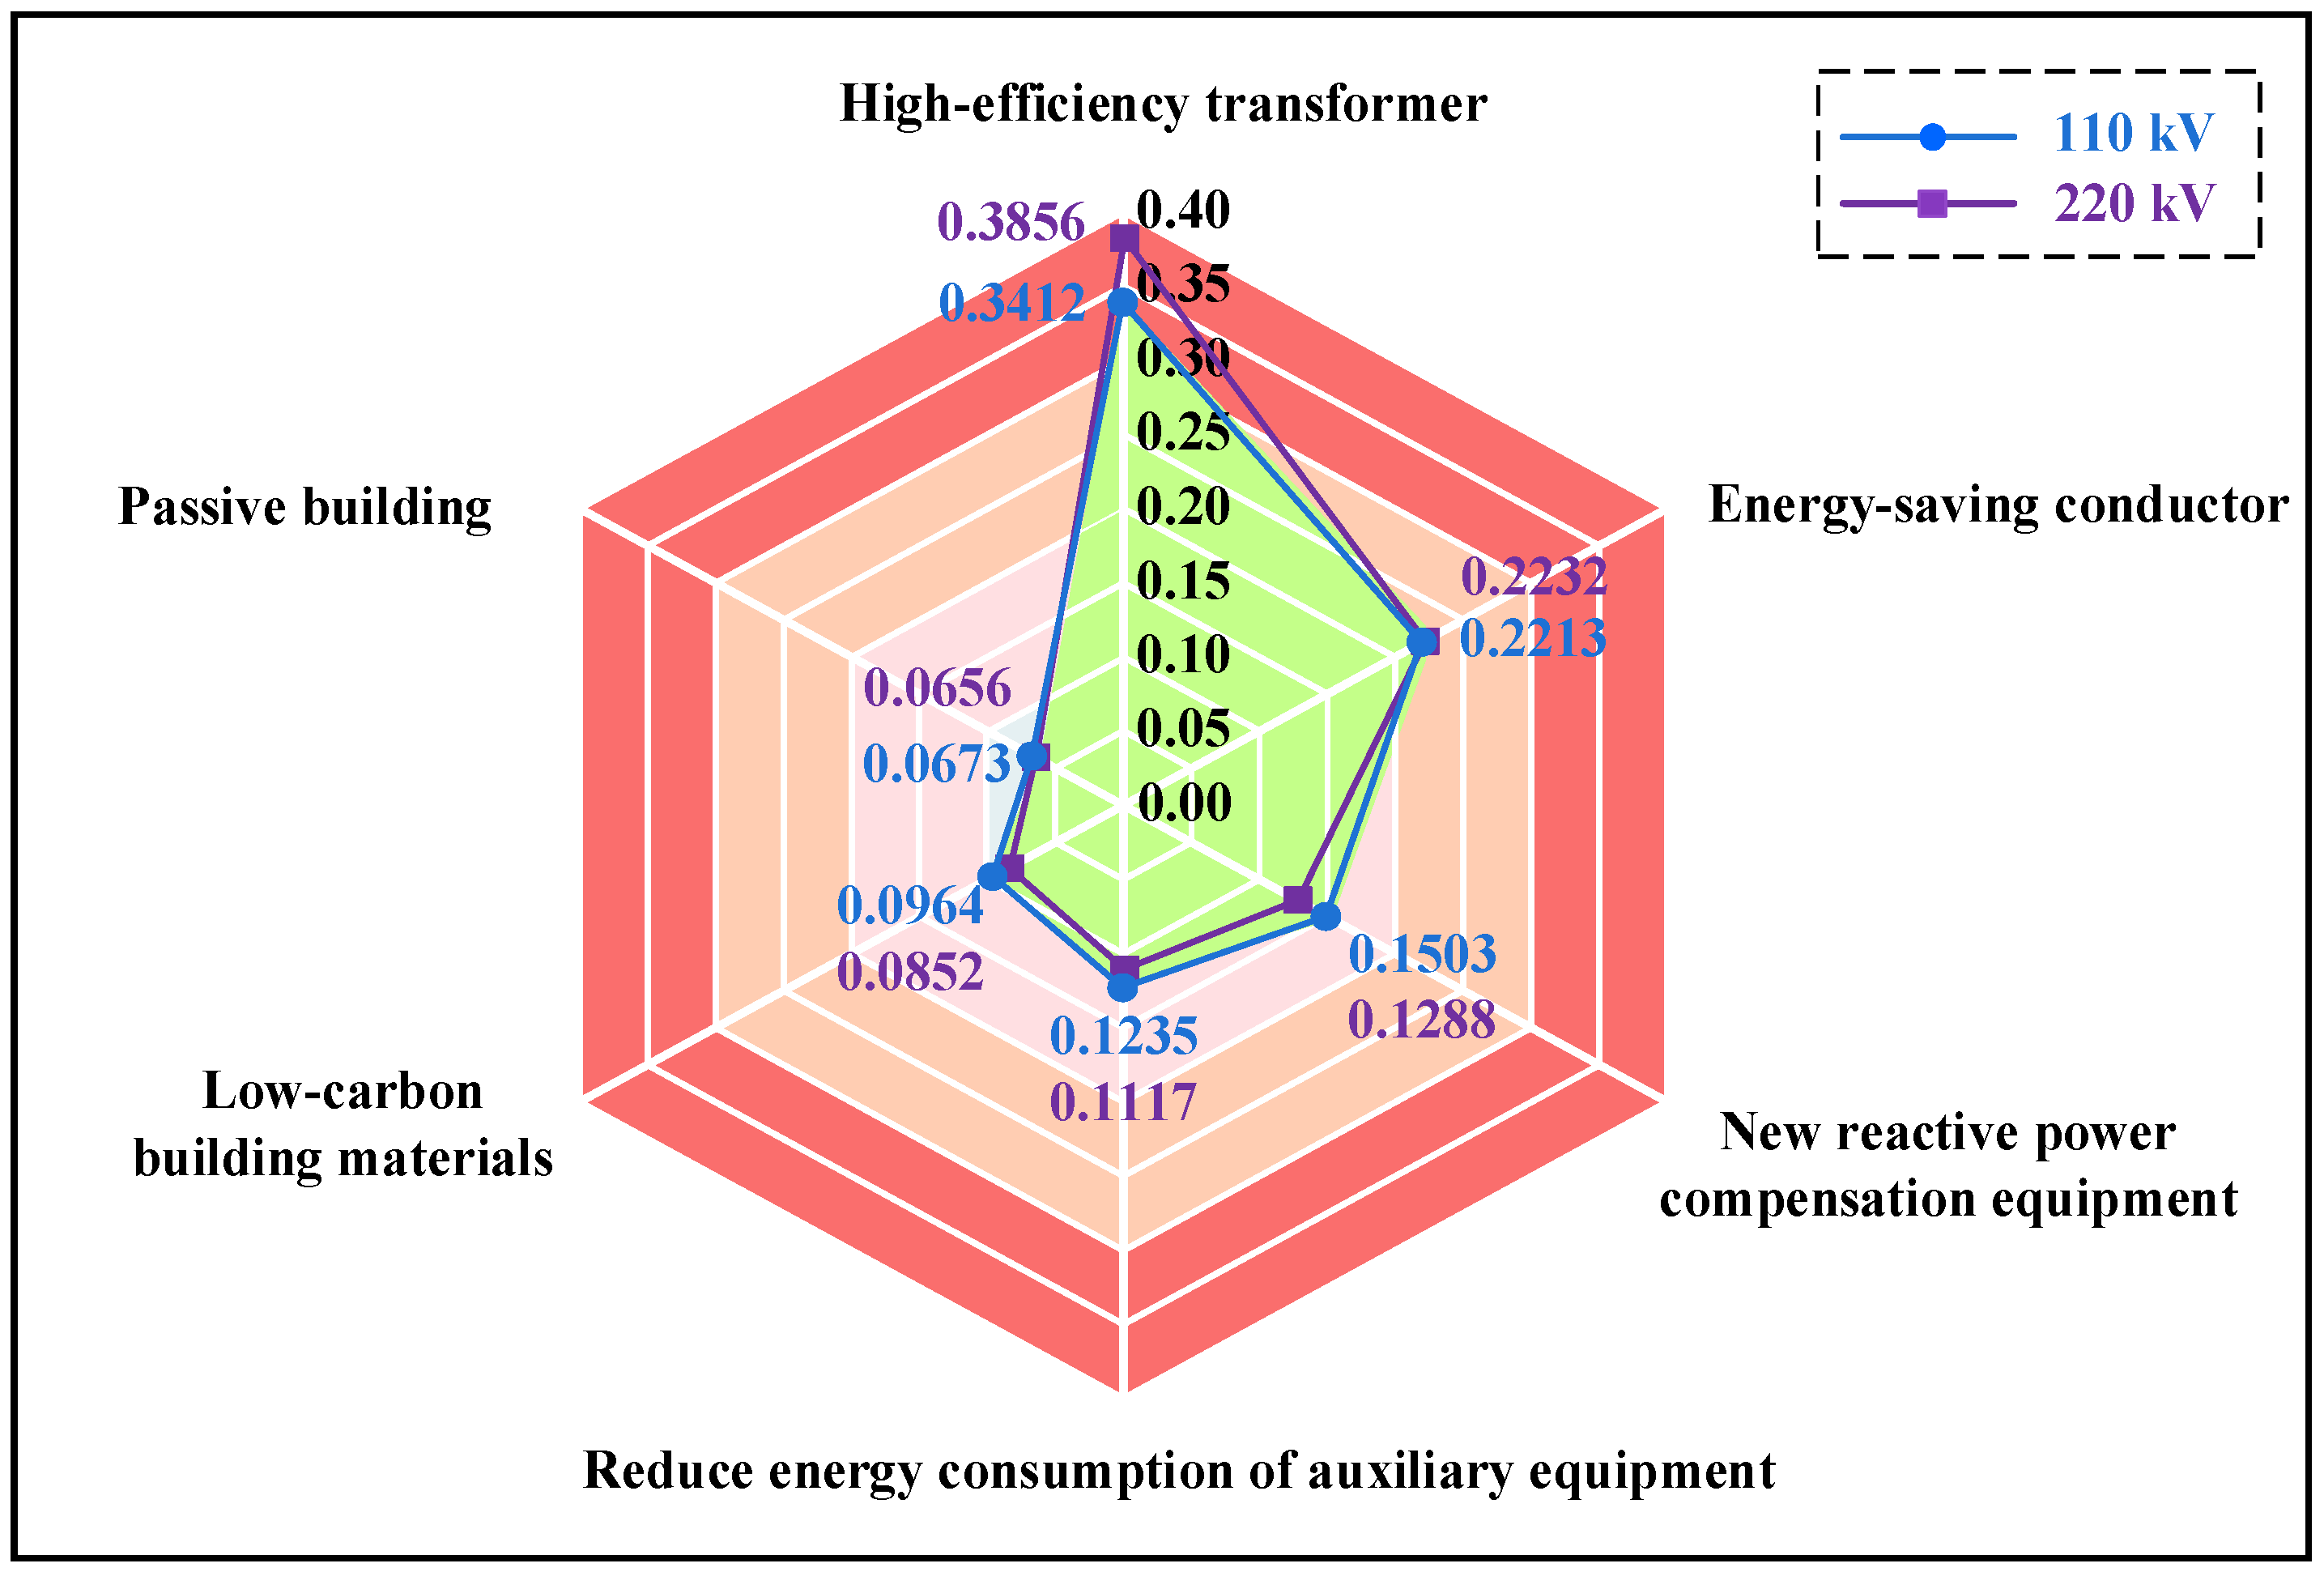
After that, based on the aforementioned AHP and EWM calculation process and the estimation method for the cost-benefit of each carbon reduction technology, the 110 kV and 220 kV transmission and transformation projects were weighted, and the results for the weights of the criterion layer and the indicator layer are shown in Figure 4 and Figure 5.
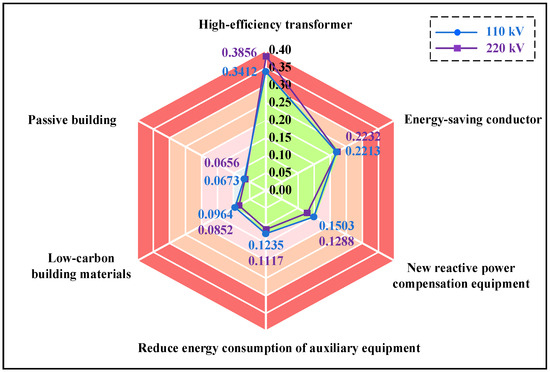
Figure 4.
The weight of the criterion layer for the evaluation system in power transmission and transformation projects.

Figure 5.
The weight of the indicator layer for the evaluation system in power transmission and transformation projects.
From the results of the case study of the 110 kV transmission and transformation project, it can be seen that the weights of the various carbon reduction technologies in the transmission and transformation project vary greatly in the criterion layer. Among them, the one with the highest proportion is the “high-efficiency transformer”, which is as high as 34.12%, followed by the energy-saving conductor, which has a proportion of 22.13% in the carbon emission reduction evaluation index system of transmission and transformation project due to its excellent effect in improving electrical conductivity; in addition, reactive power compensation device relying on the improvement of power factor of the grid also has a high proportion, which is 15.03%. The contribution of the remaining carbon emission reduction technologies to carbon emission reduction in transmission and transformation projects is relatively small, about 10%.
In terms of the indicator layer, “Parasitic losses” has the highest weighting, accounting for 14.36% of all index items, followed by “Conductor type” for energy efficient conductors, accounting for 12.35%. The rest of the indicators are weighted at less than 10 percent, and “parasitic losses” are weighted at about twice the weight of “core assembly pressure”. In addition, the one with the lowest weighting is “building heat load” for passive buildings, which accounts for only 1.02%. 220 kV transmission and transformation project has roughly the same weighting trend as the 110 kV transmission and transformation project.
As seen from the results of Table 7, both in the criterion layer and index layer, based on the proposed index system and mathematical modeling method, the error in the weights of 110 kV and 220 kV transmission and transformation projects is within 20%. Among all 21 index layer weights, 14 weights have an error of 10% or less. Among all six index layer weights of the criterion layer, there are three weights with errors within 10%, which are all within the error allowable range. It can be seen that the proposed indicator system and mathematical modeling method have a high degree of universality and reliability.
Table 7.
Error rates in weights of criterion layer and index layer for cases of 110 kV and 220 kV transmission and transformation projects.
4.2. Sensitivity Analysis
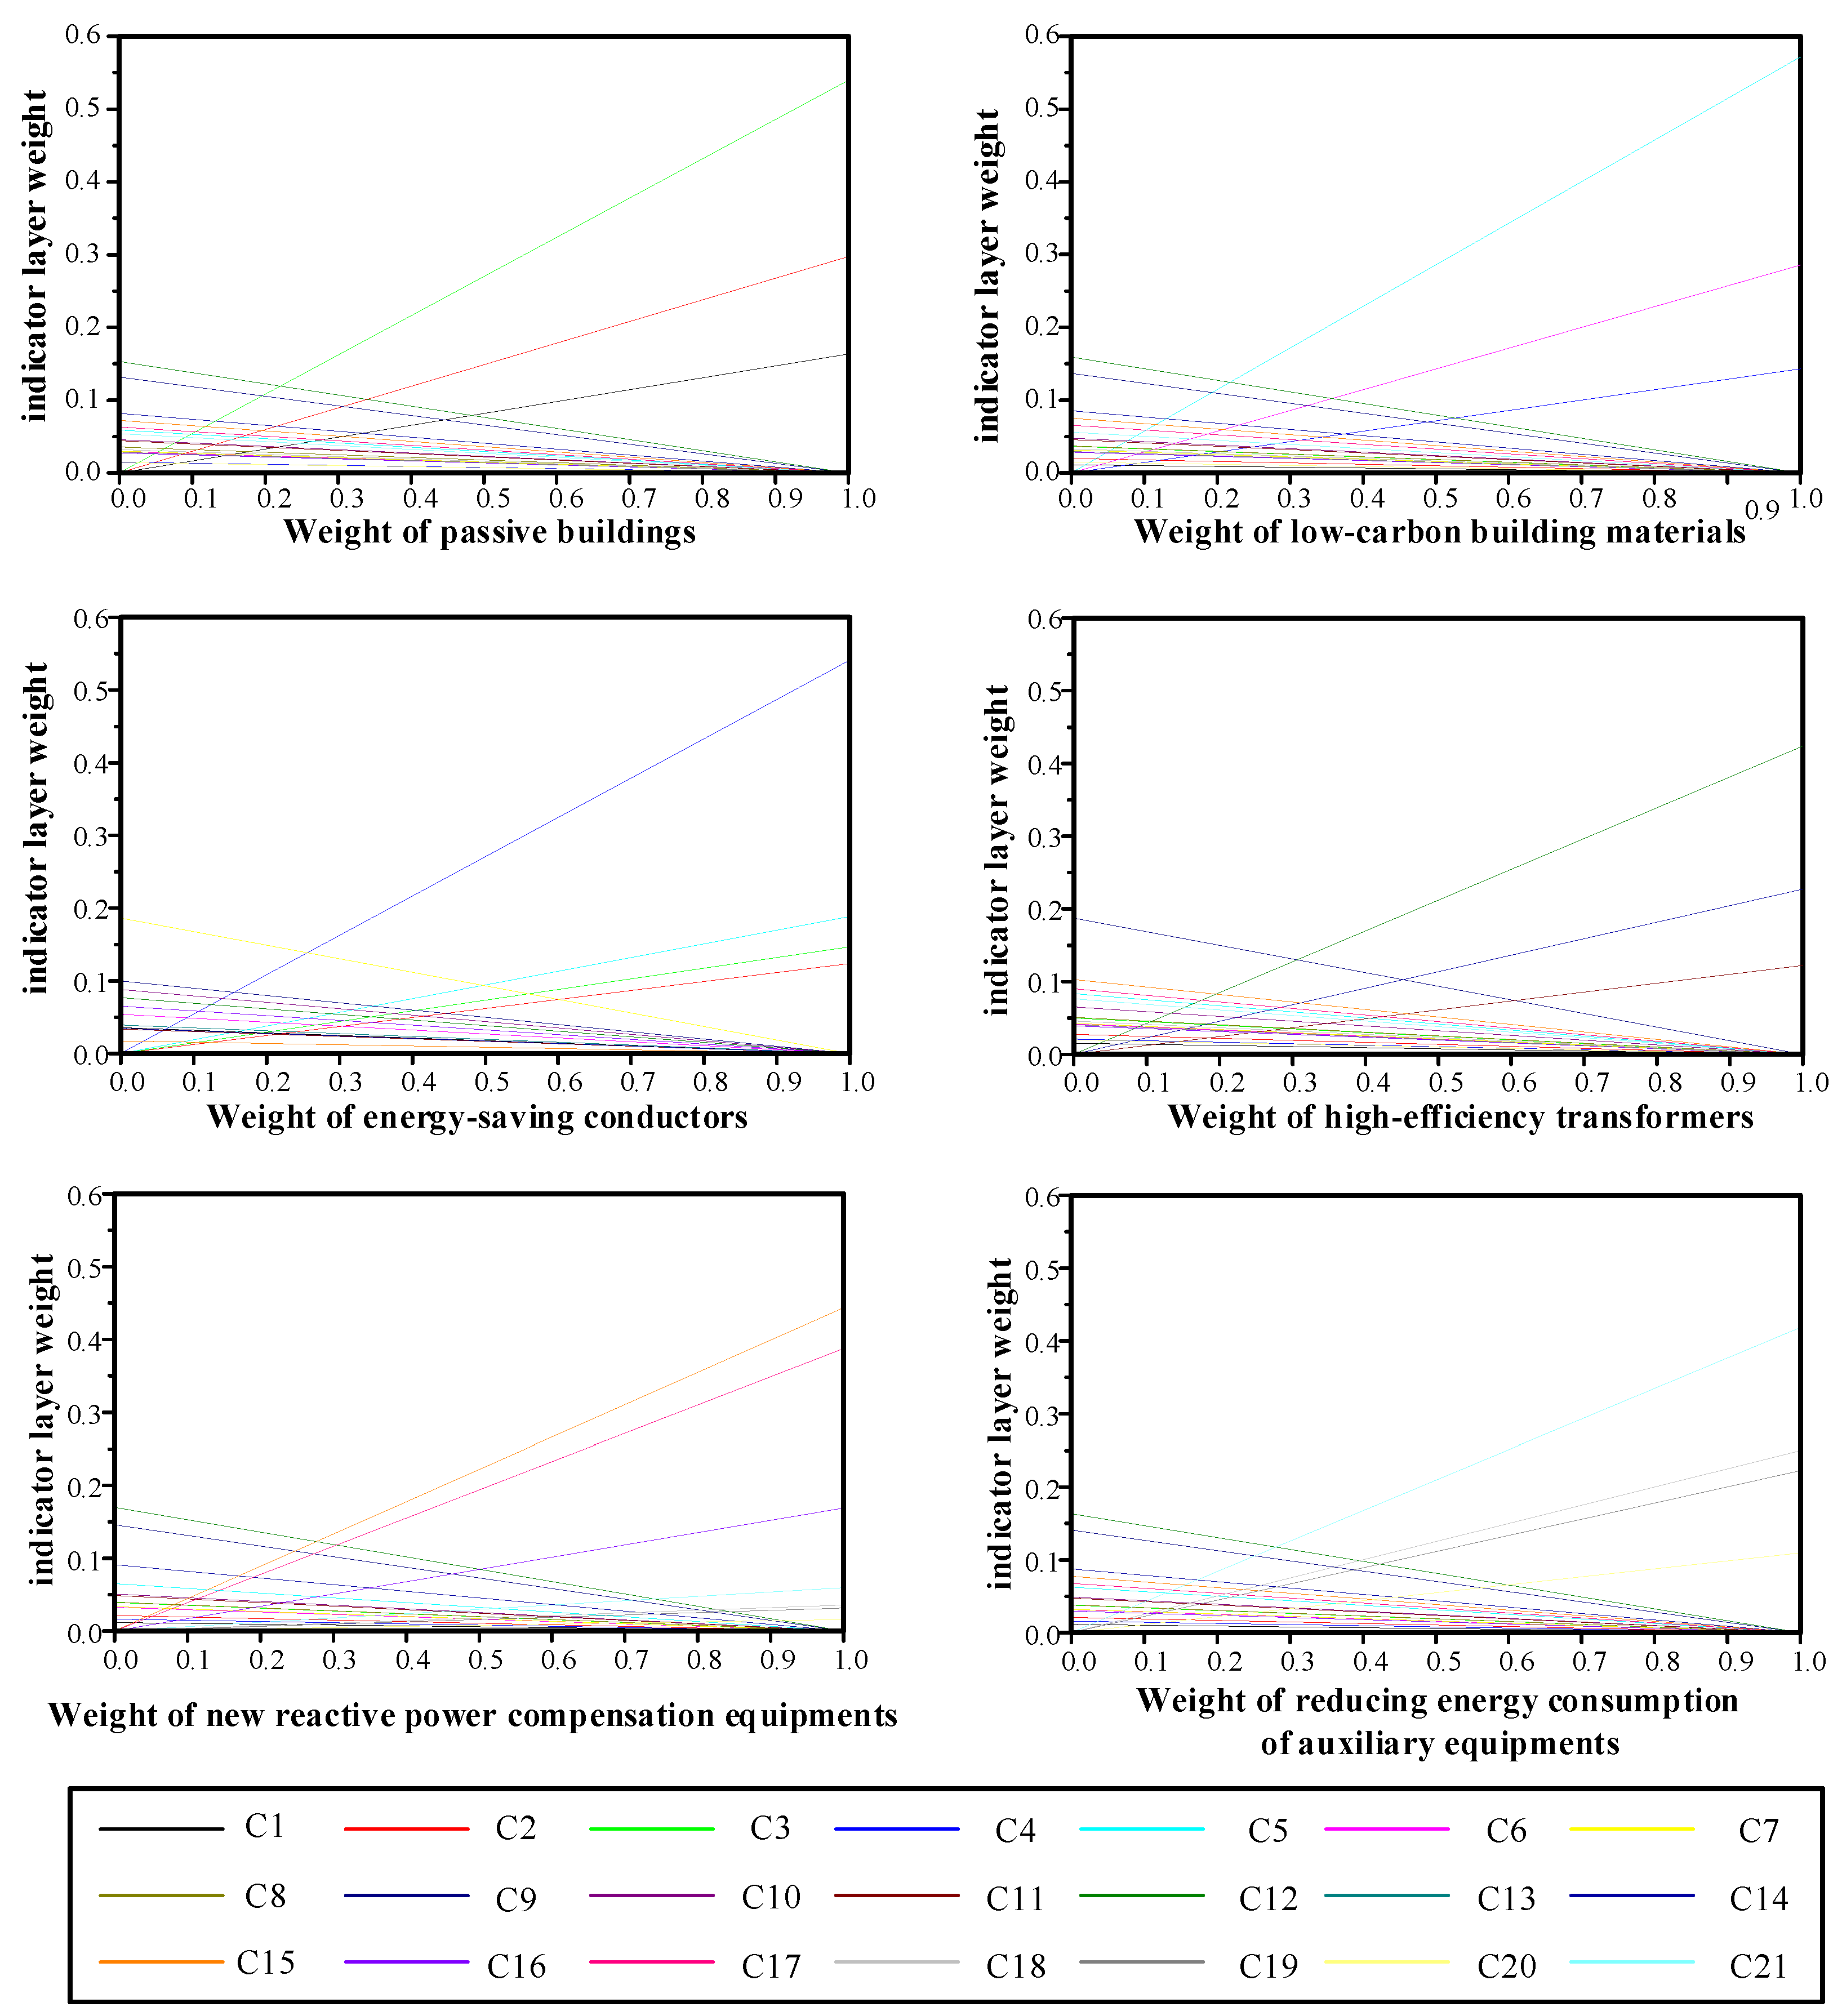
To further study the trend and range of changes in the indicator layer when the weight of a criterion layer changes, to guide decision makers to make decisions at a higher level, 1000 samples were selected for each criterion layer indicator in the aforementioned evaluation system to test its sensitivity. The results are shown in Figure 6 and Figure 7.
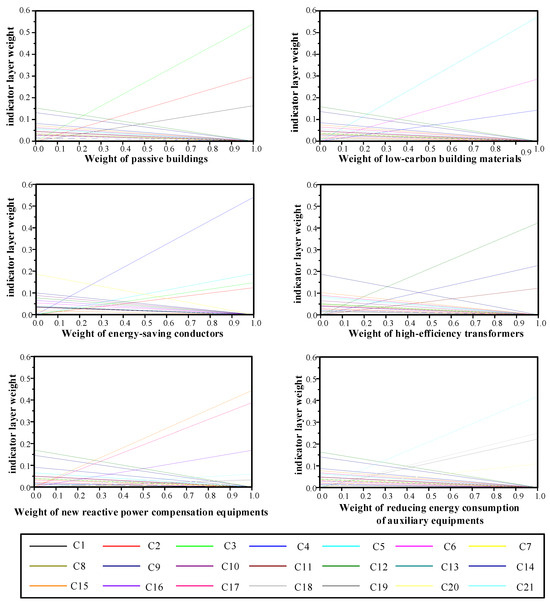
Figure 6.
Results of sensitivity analysis for the criterion layer of 110 kV transmission and transformation project.
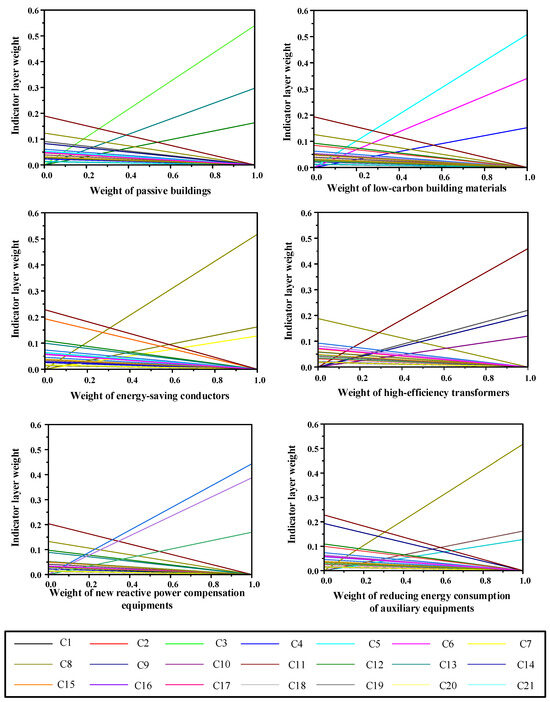
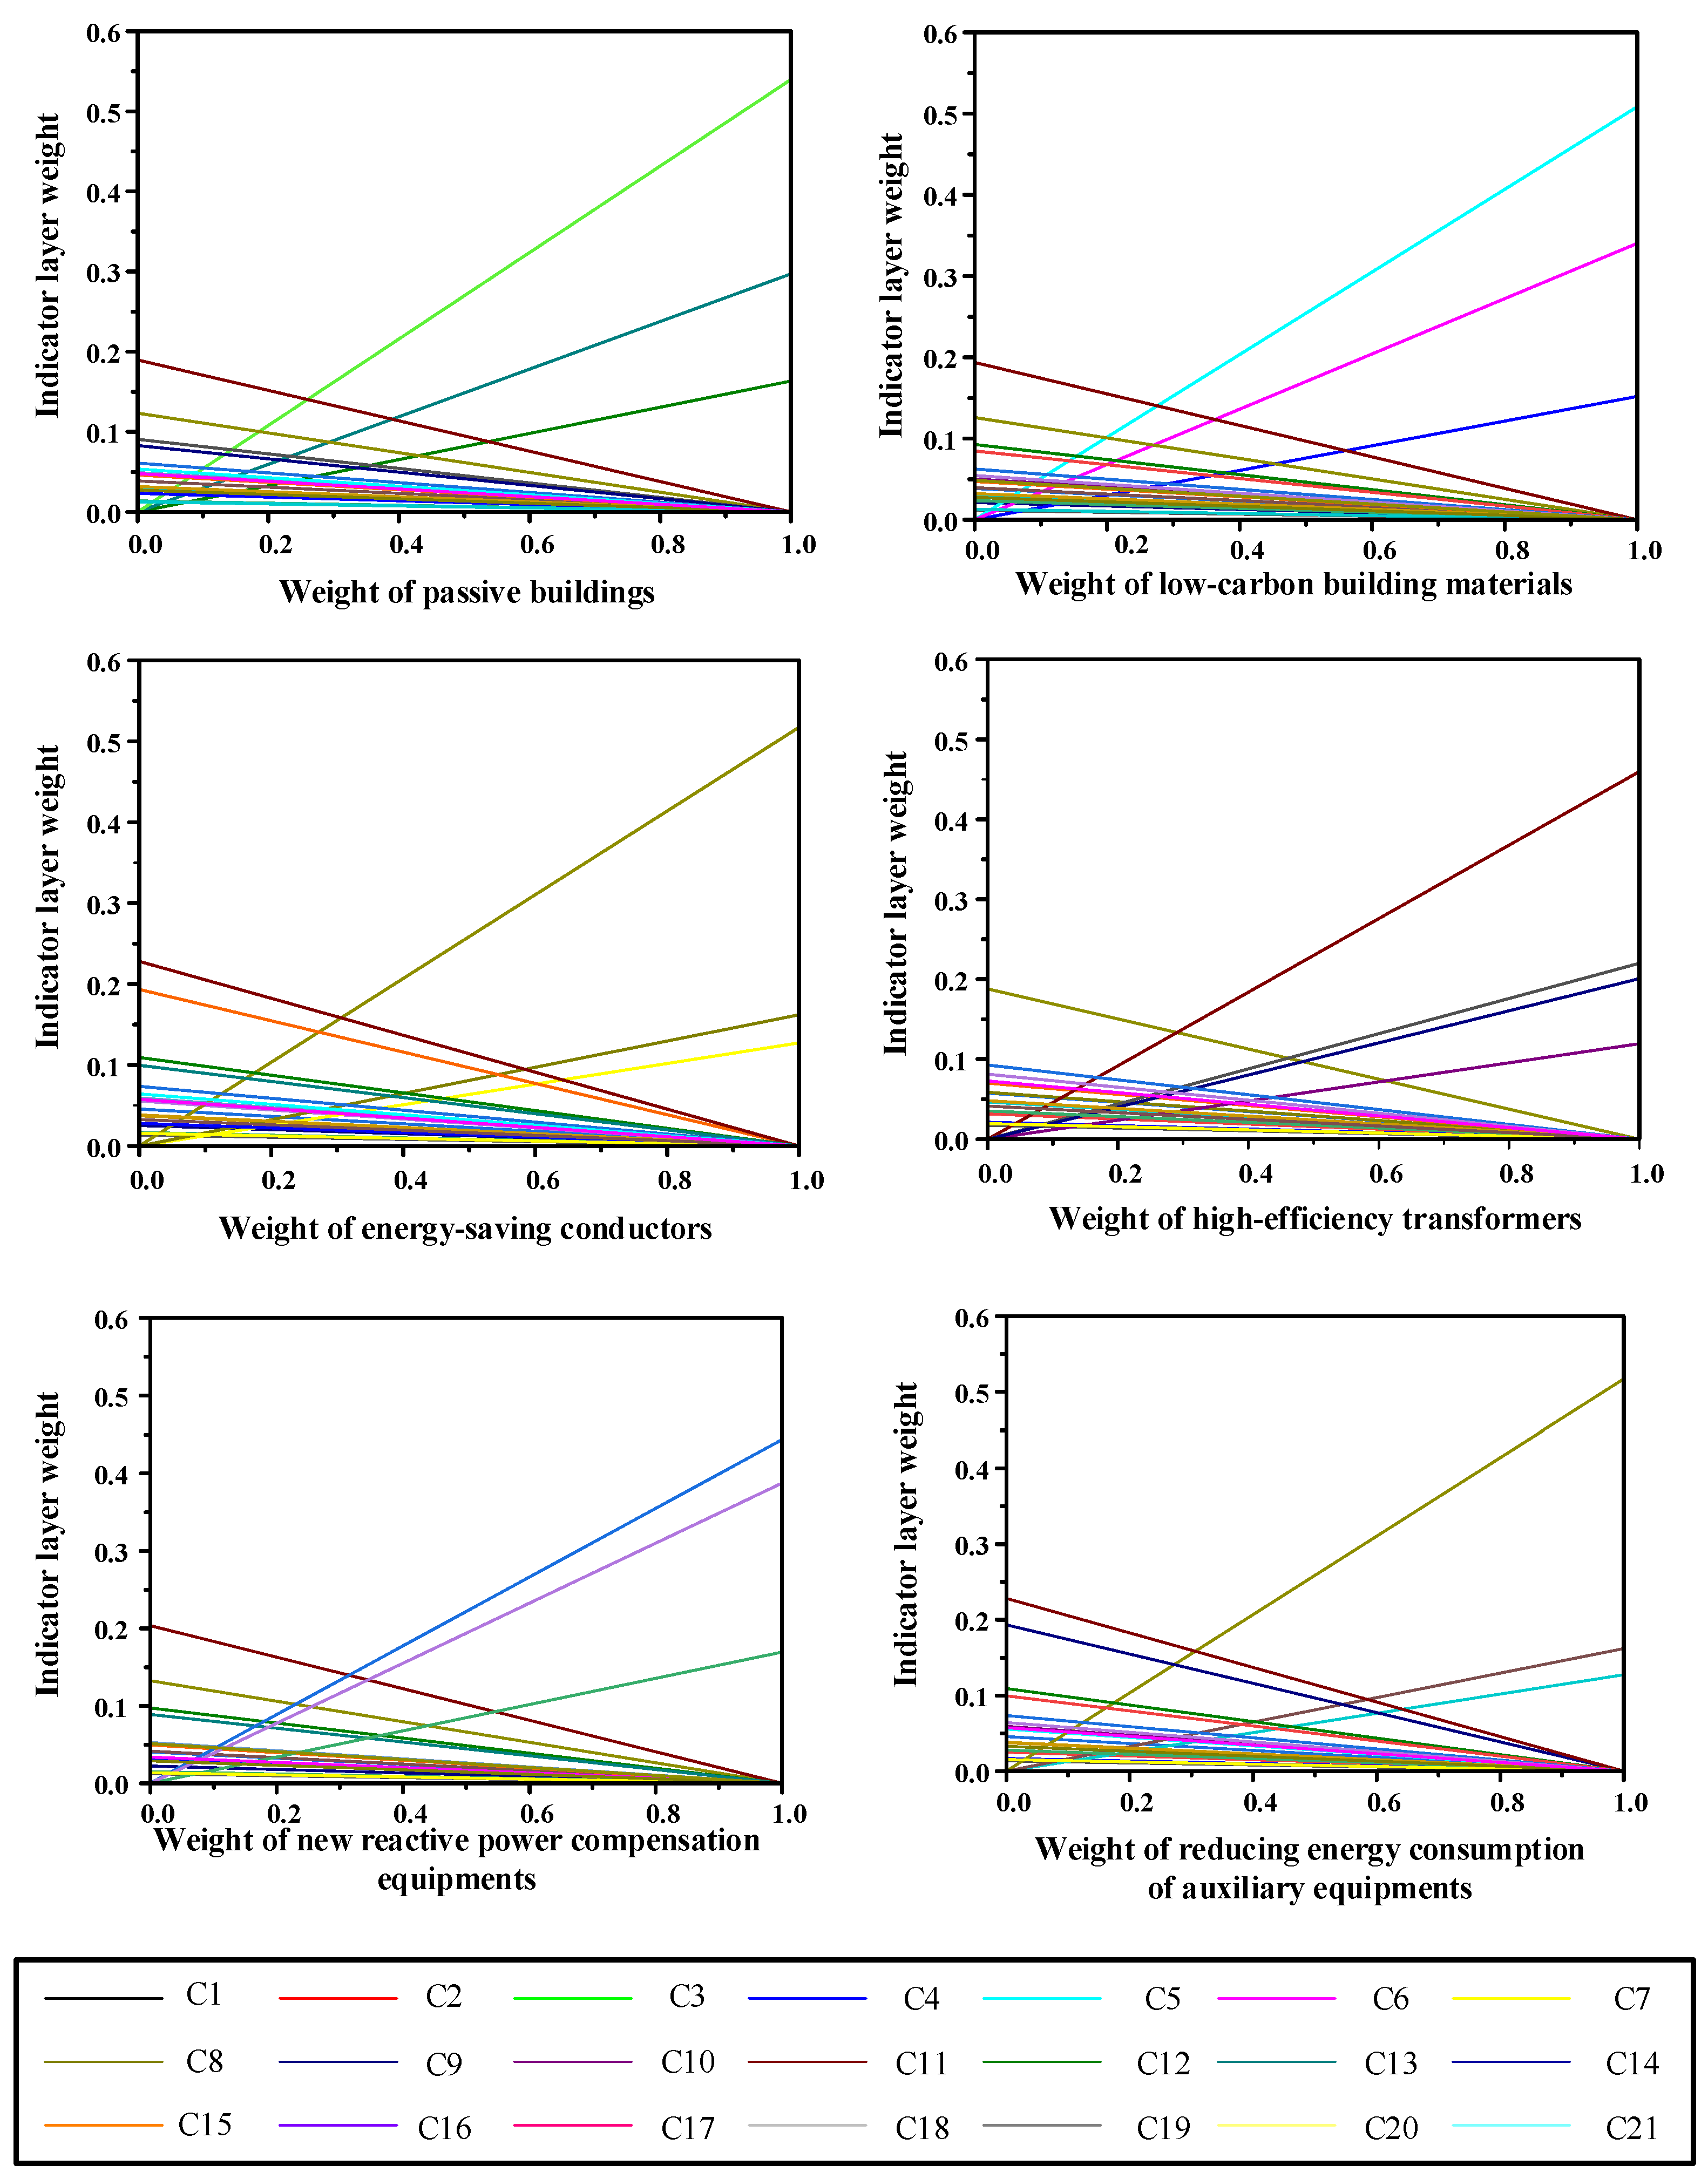
Figure 7.
Results of sensitivity analysis for the criterion layer of 220 kV transmission and transformation project.
In Figure 6, taking the criterion layer “passive building” as an example, when the weight of “passive building” increases, the weights of “ heat load of the building”, “heat transfer coefficient of the material” and “energy consumption indicator” will increase, and the weights of the rest of the indicators will decrease. This indicates that in the process of low-carbon construction of transmission and transformation projects, the more attention is paid to the weight of the passive building, the more the significance of the three rising indicators can be reflected. At the same time, the intersection of the two lines in the graph indicates the point where the importance of the two indicators changes, such as the intersection of “energy consumption indicator” and “ conductor type”, which indicates that the importance of “energy consumption indicator” is greater than that of “ conductor type” before this horizontal coordinate, while “ conductor type” is more important than “energy consumption indicator” after this horizontal coordinate. The same is true for the other five graphs, as well as the 220 kV transmission and transformation project. The sensitivity analysis is of great significance for the rational selection of the weights for each indicator.
4.3. Carbon Reduction Technology Scheme Optimization
To provide more practical suggestions for carbon reduction retrofits for power transmission and transformation projects, eight carbon reduction schemes for power transmission and transformation projects are proposed based on the above evaluation indicator system, as shown in Table 8. In the table, the shaded area indicates the adoption of corresponding carbon reduction technologies.
Table 8.
Carbon reduction retrofit Schemes for 110 kV power transmission and transformation projects.
The scheme selection is based on the results of the criterion layer ranking. The higher the weight of a carbon reduction technology, the greater its impact on the evaluation system for carbon reduction technology in power transmission and transformation projects. Therefore, we selected the three carbon reduction technologies with the highest weights (They are “high-efficiency transformer”, “energy-saving conductor”, and “reactive power compensation equipment”, respectively). And then, two types of energy-saving conductors, two types of transformers, and two types of reactive power compensation devices were selected to form eight carbon reduction schemes, representing three different carbon reduction potentials, namely, “low-potential carbon reduction scenario”, “medium-potential carbon reduction scenario” and “high-potential carbon reduction scenario”. The thought behind the development of the schemes is as follows:
- Low potential carbon reduction scenario: Of the three carbon reduction technologies selected, only one of them adopts carbon reduction measures, while the remaining two stay in their original state, so the low potential carbon reduction scenario consists of three specific schemes in which each carbon reduction technology is adopted separately. The advantage of this scenario is that the retrofit cost is small because only one carbon reduction measure is adopted, but the carbon reduction benefit is weak because there are fewer carbon reduction measures.
- Medium potential carbon reduction scenario: Among the three selected carbon reduction technologies, two of them adopt carbon reduction measures, and the remaining one maintains its original state, so the “medium potential carbon reduction scenario” contains three specific schemes. Since the “medium potential carbon reduction program” adopts two carbon reduction measures, its retrofit cost is higher than the “low potential carbon reduction program”, and its carbon reduction benefit is lower than that of the “high potential carbon reduction program”.
- High potential carbon reduction scenario: All of the three selected carbon reduction technologies adopt carbon reduction measures. The “high potential carbon reduction scenario” has the highest carbon reduction benefit among the three potential carbon reduction scenarios due to the adoption of all three carbon reduction technologies, but at the same time, it also has the highest retrofit cost among the three potential carbon reduction scenarios.
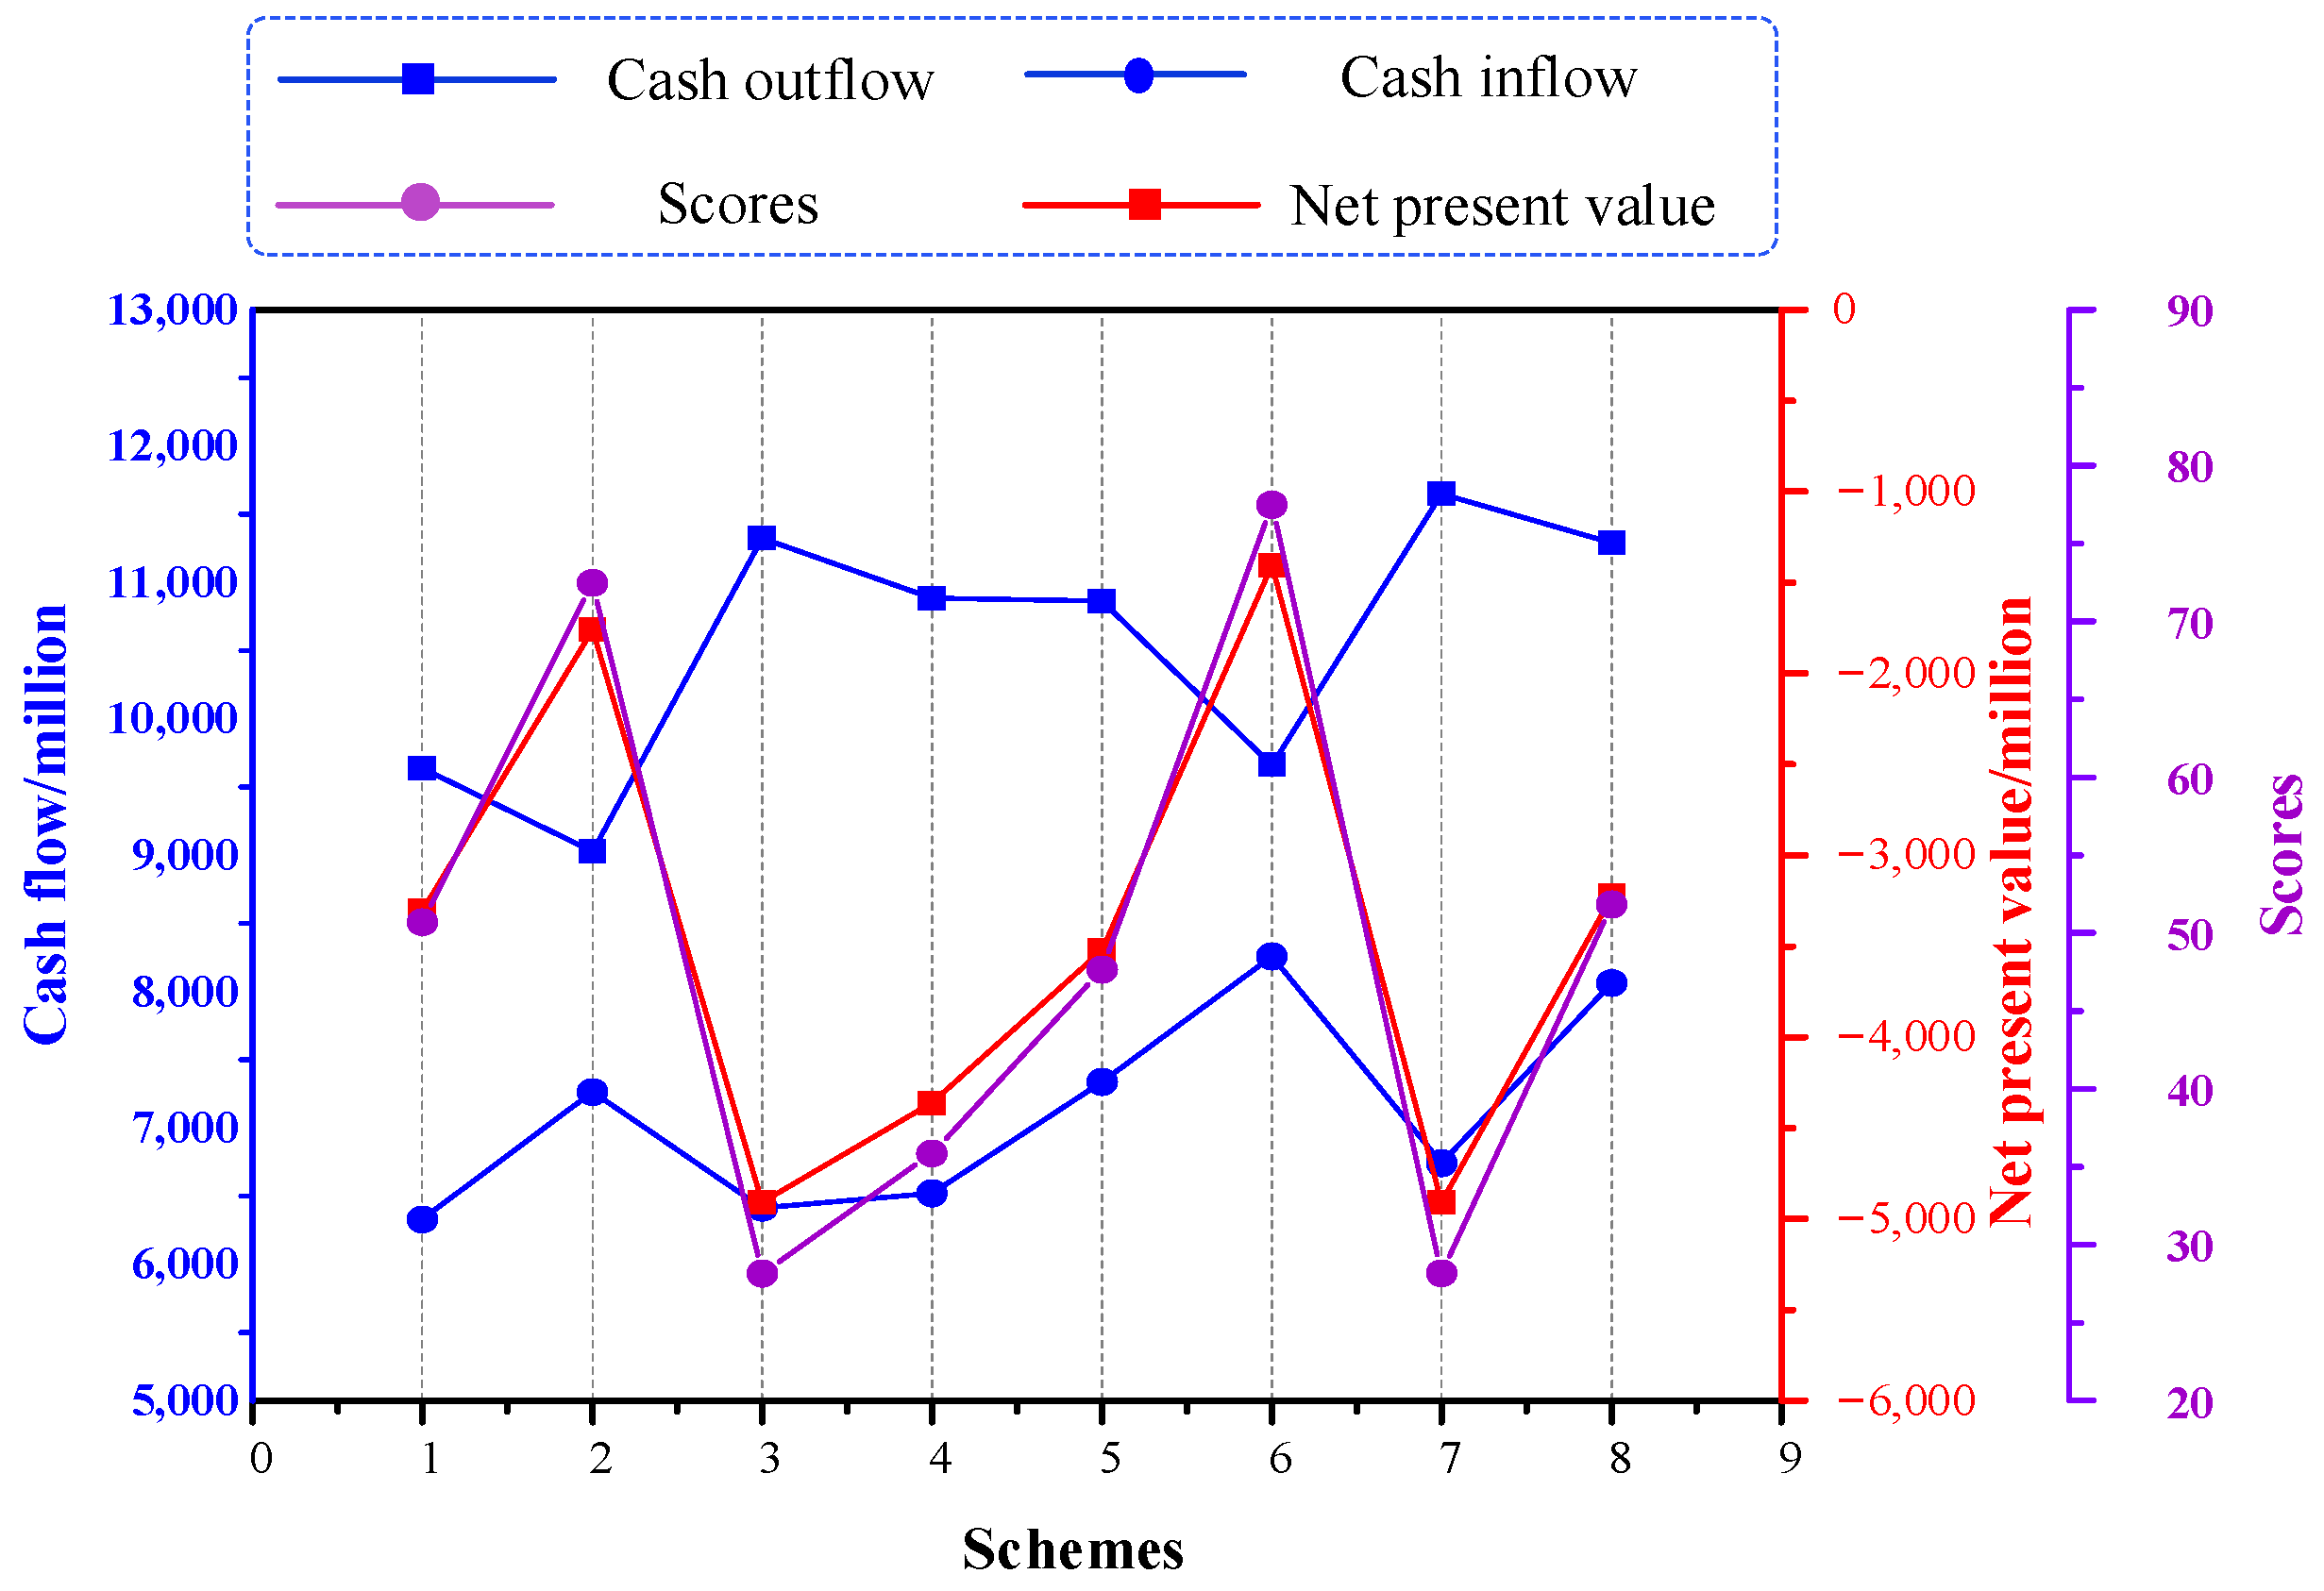
Based on the aforementioned cost-benefit methodology for carbon-reduction technologies, cash flow and net present value calculations were carried out for the eight alternatives. And TOPSIS, a mathematical method that scores programs, was used to score each scheme [34]. The steps of the TOPSIS are as follows, and the final results are shown in Figure 8.

Figure 8.
Net present value of the three schemes and the results of the scheme scoring.
- 1.
- Construct the judgment matrix B
- 2.
- Construct the normalized decision matrix [35]
T = (tij)m × n and the weighted normalized judgment matrix Z = (zij)m × n
where is the weight of the indicator.
- 3.
- The positive ideal solution Z+ and the negative ideal solution Z− [36].
For the benefit-based indicators:
For the cost-based indicators:
- 4.
- Euclidean distance from positive and negative ideal solutions:
- 5.
- Proximity to the ideal solution scheme Si:
- 6.
- Program scoring:
Since the percentage scoring approach is more intuitive to judgment, the percentage judgment function Fi is obtained from the TOPSIS method.
From the results, it can be seen that Scheme VI (Medium-strength all-aluminum alloy strand JLHA3-335, S11, and TSVG) has the highest net present value and scheme score, followed by Scheme II (Medium-strength all-aluminum alloy strand JLHA3-335, S11 and conventional reactive power compensation device) and Scheme VIII (Medium-strength all-aluminum alloy strand JLHA3-335, S13 and TSVG). That means if the carbon reduction technology of Scheme VI is adopted in the power transmission and transformation projects, it is expected to achieve greater economic benefits through lower costs. However, Scheme VII (steel-cored aluminum stranded conductor JL/G1A-300/25, S13, TSVG) and Scheme III (steel-cored aluminum stranded conductor JL/G1A-300/25, S13, conventional) have the lowest scores, so it is not recommended to choose the conductor, the transformer and the reactive power compensation device of the scheme in practical engineering.
Based on the above analysis, it is evident that among the three decarbonization potentials—low potential carbon reduction scenario, medium potential carbon reduction scenario, and high potential carbon reduction scenario—medium potential carbon reduction scenario stands out as the most adept at balancing cost and benefit. Among the three specific proposals of medium potential carbon reduction scenario, Scheme VI achieves the highest score. Despite exclusively incorporating “medium-strength all-aluminum alloy strand” and the “S13” high-efficiency transformer without the inclusion of “TSVG”, Scheme VI excels due to the widespread application of high-efficiency transformers in 2023, which has resulted in equipment prices that are essentially on par with conventional transformers. However, the energy-saving and decarbonization benefits are notably significant. Furthermore, the case involves an extensive power transmission line of 26.88 km, resulting in considerable decarbonization benefits from the adoption of energy-saving conductors. While the decarbonization benefits of “TSVG” are noteworthy, the associated retrofitting costs are significantly high, reaching 758,372 yuan per unit in the case study. Conversely, high-efficiency transformers and energy-saving conductors achieve decarbonization goals through optimization without the need for new equipment purchases. In summary, compared to Scheme V and Scheme VII, Scheme VI exhibits the most optimal economic benefits.
In addition, the results show that the cash outflow of the eight schemes is higher than the cash inflow, that is, the net cash flow is negative. This is mainly because the current development of carbon reduction technology in power transmission and transformation projects is not perfect, the cost of carbon reduction transformation is high, and the relevant policy system is not perfect, resulting in high costs and weak benefits of carbon reduction transformation in power transmission and transformation projects. However, with the further promotion of the “double carbon” goal and the continuous development of carbon reduction technology, the relevant retrofit costs will be reduced, and the benefits will be long-term. The retrofit of carbon reduction technology in power transmission and transformation projects will be more and more economical.
5. Discussion
5.1. Conclusions
The hierarchical analysis method is used to calculate the influence weight of each indicator on the carbon reduction and transformation project for transmission and transformation projects. Then, the entropy weighting method is used to standardize the indicators and correct the objectivity. Then, 1000 sampling points are selected for each technical scheme to carry out the sensitivity analysis, establish a more comprehensive evaluation system for transmission and transformation projects, and finally come up with the following conclusions:
- In the criterion layer, the three carbon-reducing technologies with the highest weights are “adopting high-efficiency transformer” technology, “adopting energy-saving conductors”, and “installing new reactive power compensation devices”. In the indicator layer, the top three indicators are “parasitic losses”, “conductor type”, and “design magnetic flux density”. What is more, “parasitic losses” are weighted at about twice the weight of “core assembly pressure”.
- In the carbon reduction transformation of transmission and transformation project, more attention is paid to the improvement of the high-efficiency transformer, then “external temperature”, “parasitic losses”. “core assembly pressure”, and “design magnetic flux density” will be greater. The more attention is paid to the transformation of energy-saving conductors, the greater the advantages of “transmission capacity of the conductor”, “transmission efficiency”, “conductor type”, and “characteristic of arc sag” will be greater.
- It is recommended to use the conductor, the transformer, and the reactive power compensation device of Scheme VI in the power transmission and transformation project because it is expected to achieve greater economic benefits through lower costs. The conductor, the transformer, and the reactive power compensation device of Scheme VII and Scheme III are not recommended.
- At present, due to the limitations of the carbon reduction technology and the lack of a relevant policy system, it is difficult to achieve the goal of covering costs with benefits for the eight schemes studied. However, in the future, with the continuous development of technology and the improvement of policies, the carbon reduction retrofit for power transmission and transformation projects will be more economical.
- Both in the criterion layer and index layer, based on the proposed index system and mathematical modeling method, the error in the weights of 110 kV and 220 kV transmission and transformation projects is within 20%. Among all 21 index layer weights, 14 weights have an error of 10% or less. Among all six index layer weights of the criterion layer, there are three weights with errors within 10%, all within the error allowable range. It can be seen that the proposed indicator system and mathematical modeling method have a high degree of universality and reliability.
5.2. Prospects and Limitations
With the increasing prominence of energy issues and the urgent need for environmental protection, reducing carbon emissions in the transmission and transformation process is critical to achieving a low-carbon power system. The trends in the development of carbon reduction technologies for power transmission and transformation and possible directions for future research in this area are as follows:
- Digitalization and Intelligence: Digitalization and intelligence are important development trends in the field of power transmission and transformation, dedicated to the intelligent monitoring, management, and control of power systems. Through the wide application of advanced sensors, transmission equipment can collect a large amount of data in real time, including current, voltage, temperature, and other parameters. These data are analyzed through cloud computing and big data to provide in-depth insights into system operation, enabling operations and maintenance personnel to more accurately monitor equipment status, identify potential problems in a timely manner, and take preventive measures. Intelligent transmission systems also enable precise regulation of current through automated control systems to adapt to dynamic changes in the power network and improve system stability and reliability.
- Integration of renewable energy sources: With the widespread use of renewable energy sources, such as wind and solar, transmission systems need to be more resilient and intelligent in order to better adapt to the volatility of these energy sources. Through intelligent sensing devices and advanced communication technologies, transmission and transformation projects can monitor power flows and adjust current distribution in real-time, thus more flexibly matching the characteristics of renewable energy generation, achieving optimal management of these energy sources, and realizing carbon emission reduction in transmission and transformation projects.
- Power electronics innovation: Innovations in power electronics technology are critical to the energy efficiency of power transmission and transformation systems and can significantly improve the energy efficiency of the system. For example, high-temperature superconducting transformers can significantly reduce energy losses and improve energy efficiency, and flexible DC transmission technology can reduce transmission losses and improve system stability and reliability.
- Currently, many countries have specific policies in place to support carbon reduction in transmission and transformation projects. These policies include encouraging renewable energy access and promoting the development of efficient transformers and smart grids through subsidies and incentives. In the future, governments are also likely to further promote the implementation of transmission carbon reduction through incentives to encourage companies to adopt low-carbon technologies. The formulation and implementation of these policies will help establish a sustainable power system while further improving the economics of low-carbon transformation of transmission and transformation projects and laying the foundation for future energy transformation. In the follow-up study, we will try to consider government subsidies to make the results more informative.
In this study, we conducted a comprehensive analysis of the indicator system, economy, and solution optimization for carbon reduction initiatives in power transmission and transformation projects. However, it is imperative to acknowledge certain limitations inherent in the constraints of the article’s length and authors’ cognitive:
- Limitations of the proposed methodology exist, as well as potential challenges in its real-world application. The AHP-EWM, although effective in decision-making, has some limitations. One of the disadvantages is that it is more sensitive to the initial weight values, which may introduce bias. In addition, AHP assumes that the criteria are independent of each other and may oversimplify complex relationships. The calculation of the EWM may be limited by the quality of data and the amount of data and is more data-dependent. We will try our best to reduce the limitations of this mathematical method in our future research so that it will be more reliable in the study.
- Only six major carbon reduction technologies are discussed in the paper, with relatively limited exploration of additional technologies. The following two types of carbon reduction technologies are potential for future development in transmission and transformation projects: The Clean Air Insulated Gas Insulated Switchgear (CA-GIS) plays a key role in carbon reduction in power transmission. Compared with traditional insulated switches, CA-GIS adopts environmentally friendly air-insulated media, which significantly reduces greenhouse gas emissions, plays an active role in improving power system operation efficiency and reducing maintenance costs, and promotes low-carbon transformation in transmission and transformation projects. High-voltage direct current (HVDC) transmission technology is an efficient power transmission technology that enables power transmission over long distances and reduces current losses and voltage drops in the transmission process. Compared to traditional AC transmission technology, HVDC technology has lower transmission losses and reduces the use of pylons and cables required for transmission lines, thereby reducing carbon emissions. In our subsequent research, we will explore these two techniques in more depth.
Author Contributions
Methodology, S.Z.; formal analysis, X.J.; investigation, H.C.; resources, Y.W.; data curation, C.J.; writing—original draft preparation, S.Z.; writing—review and editing, C.X. All authors have read and agreed to the published version of the manuscript.
Funding
This work was supported by the Science and Technology Project of State Grid Corporation of China (Grant No. 5200-202356133A-1-1-ZN, Research on key technologies of scheme optimization and cost control for transmission and transformation projects considering the development of a unified large market and carbon emission reduction). The authors declare that this study received funding from State Grid Corporation of China. The funder had the following involvement with the study: Participate in research and provide public data required for research.
Data Availability Statement
The datasets used and/or analyzed during the current study are available from the corresponding author upon reasonable request.
Conflicts of Interest
Author Xue Jiang was employed by the company Economic and Technical Research Institute of State Grid Liaoning Electric Power Co., Author Cheng Xin was employed by the company State Grid Economic and Technical Research Institute Co., Ltd. The remaining authors declare that the research was conducted in the absence of any commercial or financial relationships that could be construed as a potential conflict of interest.
References
- Qin, J.; Zhou, C.; Lin, Y.; Bai, D.; Zheng, W. Based on the combination prediction method for the characteristic parameters prediction of power transmission and transformation equipment. Energy Rep. 2022, 8, 589–595. [Google Scholar] [CrossRef]
- Chen, X.; Ou, Y. Carbon emission accounting for power transmission and transformation equipment: An extended life cycle approach. Energy Rep. 2023, 10, 1369–1378. [Google Scholar] [CrossRef]
- Lagoeiro, H.; Davies, G.; Marques, C.; Maidment, G. Heat recovery opportunities from electrical substation transformers. Energy Rep. 2023, 10, 2931–2943. [Google Scholar] [CrossRef]
- Santos, G.R.; Zancul, E.; Manassero, G.; Spinola, M. From conventional to smart substations: A classification model. Electr. Pow. Syst. Res. 2023, 226, 109887. [Google Scholar] [CrossRef]
- Chen, F.; Yang, K.; Wang, L.; Zhang, Y.; Liu, H. Comprehensive evaluation of power transmission and transformation project based on electric power big data. Energy Rep. 2022, 8, 733–741. [Google Scholar] [CrossRef]
- Zhang, K.; Zhang, W.; Shi, Q.; Zhang, J.; Yuan, J. Coupling effects of cross-region power transmission and disruptive technologies on emission reduction in China. Resour. Conserv. Recycl. 2023, 189, 106773. [Google Scholar] [CrossRef]
- Tan, X.; Lin, S.; Liu, Y.; Xie, B. Has the inter-regional transmission expansion promoted the low-carbon transition of China’s power sector? Comput. Ind. Eng. 2022, 168, 108059. [Google Scholar] [CrossRef]
- Zhang, Q.; Niu, G.; Jiang, W.; Qiao, M.; Li, D. Research on key index evaluation of power transmission and transformation wiring based on three-dimensional intelligent evaluation. Energy Rep. 2022, 8, 522–534. [Google Scholar] [CrossRef]
- Chau, C.K.; Leung, T.M.; Ng, W.Y. A review on Life Cycle Assessment, Life Cycle Energy Assessment and Life Cycle Carbon Emissions Assessment on buildings. Appl. Energy 2015, 143, 395–413. [Google Scholar] [CrossRef]
- Li, Z.; Xu, Y.; Fang, S.; Wang, Y.; Zheng, X. Multi-objective Coordinated Energy Dispatch and Voyage Scheduling for a Multi-energy Cruising Ship. IEEE Trans. Ind. Appl. 2019, 56, 989–999. [Google Scholar] [CrossRef]
- Wu, J.; Wang, H.; Yao, L.; Kang, Z.; Zhang, Q. Comprehensive evaluation of voltage stability based on EW-AHP and Fuzzy-TOPSIS. Heliyon 2019, 5, e2410. [Google Scholar] [CrossRef] [PubMed]
- Han, G.; Feng, G.; Tang, C.; Pan, C.; Zhou, W.; Zhu, J. Evaluation of the ventilation mode in an ISO class 6 electronic cleanroom by the AHP-entropy weight method. Energy 2023, 284, 128586. [Google Scholar] [CrossRef]
- Ahadi, P.; Fakhrabadi, F.; Pourshaghaghy, A.; Kowsary, F. Optimal site selection for a solar power plant in Iran via the Analytic Hierarchy Process (AHP). Renew. Energy 2023, 215, 118944. [Google Scholar] [CrossRef]
- Alexopoulos, D.K.; Anastasiadis, A.G.; Kaminaris, S.D.; Vokas, G.A.; Psomopoulos, C.S. Assessing flexibility options in power systems using Fuzzy Logic and AHP methods. Energy Rep. 2022, 8, 776–791. [Google Scholar] [CrossRef]
- Chen, P. Effects of the entropy weight on TOPSIS. Expert Syst. Appl. 2021, 168, 114186. [Google Scholar] [CrossRef]
- Li, Q.; Hu, H.; Ma, L.; Wang, Z.; Arıcı, M.; Li, D.; Luo, D.; Jia, J.; Jiang, W.; Qi, H. Evaluation of energy-saving retrofits for sunspace of rural residential buildings based on orthogonal experiment and entropy weight method. Energy Sustain. Dev. 2022, 70, 569–580. [Google Scholar] [CrossRef]
- Li, Y.; Zhang, Q.; Wang, L.; Liang, L. Regional environmental efficiency in China: An empirical analysis based on entropy weight method and non-parametric models. J. Clean. Prod. 2020, 276, 124147. [Google Scholar] [CrossRef]
- Zare Banadkouki, M.R. Selection of strategies to improve energy efficiency in industry: A hybrid approach using entropy weight method and fuzzy TOPSIS. Energy 2023, 279, 128070. [Google Scholar] [CrossRef]
- Xu, S.; Xu, D.; Liu, L. Construction of regional informatization ecological environment based on the entropy weight modified AHP hierarchy model. Sustain. Comput. Inform. Syst. 2019, 22, 26–31. [Google Scholar] [CrossRef]
- Su, X.; Huang, Y.; Chen, C.; Xu, Z.; Tian, S.; Peng, L. A dynamic life cycle assessment model for long-term carbon emissions prediction of buildings: A passive building as case study. Sustain. Cities Soc. 2023, 96, 104636. [Google Scholar] [CrossRef]
- Wu, Z.; Shi, X.; Fang, F.; Wen, G.; Mi, Y. Co-optimization of building energy systems with renewable generations combining active and passive energy-saving. Appl. Energy 2023, 351, 121514. [Google Scholar] [CrossRef]
- Chen, Y.; Chen, Z.; Wang, D.; Liu, Y.; Zhang, Y.; Liu, Y.; Zhao, Y.; Gao, M.; Fan, J. Co-optimization of passive building and active solar heating system based on the objective of minimum carbon emissions. Energy 2023, 275, 127401. [Google Scholar] [CrossRef]
- Xu, B.; Xie, X.; Pei, G. New method of equivalent energy consumption for evaluating thermal performance of energy-saving materials in passive buildings. Appl. Therm. Eng. 2023, 230, 120774. [Google Scholar] [CrossRef]
- Hui, X.; Lixun, S.; Zhi, L. Technical-Economic Analysis on Application of Energy-Saving Conductors in Transmission Lines. China Light Power 2020, 18, 59–61. [Google Scholar] [CrossRef]
- Chitty-Venkata, K.T.; Mittal, S.; Emani, M.; Vishwanath, V.; Somani, A.K. A survey of techniques for optimizing transformer inference. J. Syst. Architect 2023, 144, 102990. [Google Scholar] [CrossRef]
- Krishnan, R.; Nair, K.R.M. Carbon Footprint of Transformer and the Potential for Reduction of CO2 Emissions. In Proceedings of the 2019 IEEE 4th International Conference on Technology, Informatics, Management, Engineering & Environment (TIME-E), Bali, Indonesia, 13–15 November 2019; pp. 138–143. [Google Scholar]
- Jin, L.; Kim, D.; Abu-Siada, A. State-of-the-art review on asset management methodologies for oil-immersed power transformers. Electr. Power Syst. Res. 2023, 218, 109194. [Google Scholar] [CrossRef]
- Li, C.; Zhang, H.; Zhou, H.; Sun, D.; Dong, Z.; Li, J. Double-layer optimized configuration of distributed energy storage and transformer capacity in distribution network. Int. J. Electr. Power Energy Syst. 2023, 147, 108834. [Google Scholar] [CrossRef]
- Blasco, P.A.; Montoya-Mira, R.; Diez, J.M.; Montoya, R. Algorithm for passive reactive power compensation of an unbalanced three-phase four-wire system using capacitors ensuring minimum line losses. Electr. Power Syst. Res. 2022, 227, 109972. [Google Scholar] [CrossRef]
- Guamán, W.P.; Pesántez, G.N.; Torres R, M.A.; Falcones, S.; Urquizo, J. Optimal dynamic reactive power compensation in power systems: Case study of Ecuador-Perú interconnection. Electr. Power Syst. Res. 2023, 218, 109191. [Google Scholar] [CrossRef]
- Zhao, R. Study on the 220 kV Energy Saving Transformer. Master’s Thesis, Shandong University, Jinan, China, 2019. [Google Scholar]
- Luo, J. Energy Saving Potentiality and Technology Economic Evaluation of Distribution Transformers in CSG. Master’s Thesis, South China University of Technology, Guangzhou, China, 2019. [Google Scholar]
- Zhang, Y.; Sun, X.; Wang, J.; Pei, K.; Xiang, Y.; Deng, Y. Life Cycle Cost Assessment of 500kV Transmission Line Considering Energy-saving Conductor. J. Three Gorges Univ. (Nat. Sci. Ed.) 2020, 42, 80–86. [Google Scholar]
- Liu, Y.; Xu, Q.; Liu, Y.; Yang, B. Comprehensive Evaluation of Power Quality Based on Improved TOPSIS Method and Combination Weights. In Proceedings of the 2022 IEEE 5th International Electrical and Energy Conference (CIEEC), Nangjing, China, 27–29 May 2022; pp. 2609–2614. [Google Scholar]
- Chisale, S.W.; Lee, H.S. Evaluation of barriers and solutions to renewable energy acceleration in Malawi, Africa, using AHP and fuzzy TOPSIS approach. Energy Sustain. Dev. 2023, 76, 101272. [Google Scholar] [CrossRef]
- Goh, Q.H.; Zhang, L.; Ho, Y.K.; Chew, I.M.L. Modelling and multi-objective optimisation of sustainable solar-biomass-based hydrogen and electricity co-supply hub using metaheuristic-TOPSIS approach. Energy Convers. Manag. 2023, 293, 117484. [Google Scholar] [CrossRef]


Disclaimer/Publisher’s Note: The statements, opinions and data contained in all publications are solely those of the individual author(s) and contributor(s) and not of MDPI and/or the editor(s). MDPI and/or the editor(s) disclaim responsibility for any injury to people or property resulting from any ideas, methods, instructions or products referred to in the content. |
© 2024 by the authors. Licensee MDPI, Basel, Switzerland. This article is an open access article distributed under the terms and conditions of the Creative Commons Attribution (CC BY) license (https://creativecommons.org/licenses/by/4.0/).