Article

The Windcatcher: A Renewable-Energy-Powered Device for Natural Ventilation—The Impact of Upper Wing Walls

by
Payam Nejat
1,*,
Yashar Fekri
2,
Mohammadamin Sheikhshahrokhdehkordi
3,
Fatemeh Jomehzadeh
4,
Hayder Alsaad
1 and
Conrad Voelker
1
1
Department of Building Physics, Bauhaus-University Weimar, 99423 Weimar, Germany
2
Faculty of Mechanical Engineering, Tarbiat Modares University, Tehran 15614, Iran
3
Department of Mechanical Engineering and Engineering Science, University of North Carolina at Charlotte, Charlotte, NC 28223, USA
4
Faculty of Engineering, Universiti Teknologi Malaysia, UTM, Skudai 81310, Malaysia
*
Author to whom correspondence should be addressed.
Energies 2024, 17(3), 611; https://doi.org/10.3390/en17030611
Submission received: 28 November 2023 / Revised: 9 January 2024 / Accepted: 22 January 2024 / Published: 26 January 2024
(This article belongs to the Section G: Energy and Buildings)

Abstract

:
In recent years, there has been increased interest in natural ventilation solutions as a means to achieve sustainable and energy-efficient building design. Windcatchers, ancient Middle Eastern architectural elements, have surfaced as viable passive cooling devices in modern architecture, thereby enhancing interior air quality and reducing the reliance on mechanical ventilation systems. Integrating upper wing walls (UWWs) is hypothesized to augment a windcatcher’s effectiveness by optimizing wind capture, air circulation, and thermal regulation. Therefore, this study aimed to explore the influence of incorporating a two-sided windcatcher with UWWs, with a particular emphasis on the effect of the UWW angle on ventilation performance within building spaces. To achieve this aim, a series of numerical simulations were conducted to assess the synergy between the windcatcher and the wing wall configuration with varying UWW angles and under varying wind speed conditions. As the first step of the research methodology, the CFD model was validated through a comparison between the numerical results and the experimental data. The findings showed good agreement between these methods. In the next phase, windcatchers with different UWW angles spanning the range of 0° to 90° were subjected to rigorous evaluation. The results revealed that the configuration with a 30° angle exhibited the optimal performance concerning critical ventilation parameters encompassing the airflow rate, air change rate, and mean age of air. Finally, the selected configuration underwent an evaluation under diverse wind speed conditions, which affirmed that even under low-wind-speed conditions, the windcatcher provides ventilation levels that align with the standard requirements.

1. Introduction

Buildings across the globe constitute a substantial portion of energy consumption, accounting for an estimated 30 to 40 percent of the total worldwide [1]. Due to the fact that this energy consumption is frequently derived from fossil fuels, buildings account for over one third of all emissions released into the atmosphere, which has a significant impact on climate change and global warming [2]. The increased energy demand in buildings is primarily influenced by cooling and ventilation systems, which are particularly significant in regions with humid or tropical climates [3,4]. Consequently, an increasing focus has emerged within the scientific community on identifying strategies to reduce the energy consumption linked to ventilation and cooling. The incorporation of passive methods, such as natural ventilation, into structures is a sustainable solution [5,6].
Natural ventilation is a critical element in sustainable building design, providing numerous advantages. Its contribution is not limited to its considerable energy savings; it also significantly enhances indoor air quality [7,8]. In contrast to energy-intensive mechanical ventilation systems that consume a considerable amount of energy, natural ventilation utilizes outdoor airflows to regulate the temperature (thermal comfort) and air quality within buildings, consequently minimizing the reliance on conventional energy sources and thereby reducing greenhouse gas emissions. Moreover, natural ventilation serves as a cost-effective means of achieving adaptive thermal comfort and improving the thermal sensation of occupants [9].
The necessity and significance of natural ventilation extend beyond energy efficiency and indoor comfort. It also has substantial implications for human health and productivity, and access to fresh outdoor air plays a vital role in cognitive performance, productivity, and overall well-being [10]. Furthermore, natural ventilation assists in reducing the risk of sick building syndrome by promoting the dispersion of contaminants [11]. Therefore, its incorporation in building design is essential, not only to guarantee environmental sustainability but also to address indoor environmental issues that affect health, comfort, and productivity.
A compelling illustration of natural ventilation can be found in windcatchers, which have received significant attention in recent years due to their remarkable capacity to take in a considerable amount of fresh air while simultaneously expelling stale air from inside buildings. Windcatchers rely on two primary mechanisms to ventilate interior spaces: buoyancy forces, stemming from temperature disparities between the indoor and outdoor environments, and wind forces, attributed to pressure differentials across openings [12,13]. The concept of windcatchers dates back centuries to the Middle East [14]. However, in contemporary architecture, the application of windcatchers has been found in various types of buildings, including educational institutions, offices, and hospitals. A good example of large-scale usage of windcatchers in modern architecture is the UK, where more than 7000 windcatchers have been installed in recent years [15,16,17].
Furthermore, a distinct advantage of windcatchers is their inherent lack of moving components, resulting in low maintenance costs. Additionally, in contrast to simpler natural ventilation devices like windows, windcatchers can catch the wind at elevated levels, resulting in higher ventilation rates [18]. The usage of windcatchers is not limited to residential or commercial buildings, and in interesting research with a solid methodology (wind tunnel experiments and the Large Eddy Simulation model), the impact of a windcatcher on the ventilation and indoor air quality of an underground garage was studied by Chu and Su [19]. A simulation of the transport of carbon monoxide (CO) in the space showed that the windcatcher could significantly improve the ventilation inside the garage if the opening was normal to the wind direction.
This is particularly important in dense urban environments where adjacent structures can disturb the airflow. However, it is important to note that both modern and traditional windcatchers are not without challenges; for example, in low-wind-speed climates or conditions, a windcatcher’s performance is questionable.
One innovative way to overcome this challenge is the integration of a windcatcher with other passive strategies to strengthen its capacity to achieve better ventilation and thermal comfort. For instance, to enhance the cooling performance of a windcatcher, Kahkzand et al. devised a new configuration that was a combination of a windcatcher, radiative cooling, and a solar chimney. The findings showed that this configuration could provide 7.8 to 8.3 air changes per hour with a 3 °C temperature decrease during peak hours, which led to 60% and 80% energy savings for cooling and ventilation purposes, respectively, in the warm arid climate of Iran [20].
In another study [21], the integration of a windcatcher with air humidification was explored in terms of thermal comfort for warm climate conditions. The findings indicated that opting for an appropriate arrangement and implementing a chamfer can greatly enhance ventilation and thermal comfort. Furthermore, the researchers discovered the optimal rate at which mass should flow for humidification in order to achieve a feeling of neutral thermal comfort and minimize water usage. The utilization of a windcatcher, together with the implementation of humidification throughout the crucial periods of the day, would ensure optimal thermal comfort throughout the day, with a predicted percentage of dissatisfied (PPD) rate of less than 10%. These findings indicate that energy-efficient systems that utilize natural ventilation and air humidification can effectively provide cooling and thermal comfort.
In prior research [22], the authors explored the integration of windcatchers with external fins (wing walls) as a novel approach to enhancing natural ventilation in buildings, and the impact of the length and angle of the side wing wall on the ventilation performance of the windcatchers was comprehensively studied. In other studies, by the authors [23,24], a new fin called the anti-short-circuit device (ASCD) was developed to prevent the short-circuit phenomena in the inlet channels of windcatchers.
The other type of wing wall is the upper wing wall (UWW), and the impact of its angle on ventilation performance was not explored in the previous studies. Therefore, the present work, which is an extension of the authors’ preceding research, aimed to assess the influence of the UWW angle (0° to 90°) on the induced supply airflow and ventilation parameters. After finding the optimal angle, this configuration was selected for further analysis in different wind speed conditions to examine whether the windcatcher could meet the ventilation requirements at low wind speeds.

2. Methodology

In this study, a two-sided windcatcher mounted on top of a generic room (representing a small classroom) was investigated using CFD. The model’s geometry consisted of a full-scale cuboidal building with a volume of 4   m × 6   m × 3   m   equipped with a roof-mounted two-sided windcatcher with a width, length, and height of 1 m, 2 m, and 1.5 m, respectively (Figure 1a). Square openings with areas of ( 1 × 1   m 2 ) were positioned on both the windward and leeward sides of the windcatcher to let the air flow in and out of the building. The structure of the windcatcher contained a partition that prevented a direct connection between the inlet and outlet of the windcatcher. The deviation angle of the side wing walls from the perpendicular direction of the inlet and outlet faces was 30°. The length of the UWW was 50 cm, which was based on the results explained in [25], and its angle (α in Figure 1) with the horizon varied from 0° to 90° (in 10° increments) in different simulations.
By considering the characteristic height of the building (H), which equaled the sum of the heights of the building and the windcatcher, the inlet and each of the lateral faces of the computational domain were positioned at a 5H distance from the windward and leeward sides of the building. The total height of the domain was 6H, and the outlet extended 15H downstream from the building’s leeward wall. All of the selected dimensions for the computational domain were based on the general recommendations of the COST 732 guidelines for CFD simulations in built environments [26].
A computational grid with hex-dominant cells (6.5 million elements) was constructed for the discretization of the governing equations (Figure 1b). The density of the grid was not homogenous throughout the domain due to the flow field complexity. The mesh elements were highly refined in the vicinity of the sharp edges due to the appearance of strong velocity gradients near these regions. The produced mesh near the solid walls was based on boundary layer considerations, and the first cell height of the elements adjacent to the walls was selected in a manner that met the Y-plus constraints of the standard wall function, in which the centroid of the first cell near the solid wall should be placed within the log-law layer.
Numerical simulations based on the Finite Volume Method (FVM) were followed by means of the commercial CFD package ANSYS Fluent 21.2. Three-dimensional Steady Reynolds Averaged Navier–Stokes (SRANS) equations were implemented, while the standard wall function was selected for the near-wall treatment. The acceptable capability of the combined SRANS approach and standard wall function in the prediction of flow field details inside and around buildings was demonstrated in previous studies [27,28,29,30,31]. The Semi-Implicit Method for Pressure-Linked Equations (SIMPLE) algorithm was used for the velocity–pressure coupling. Second-order schemes were implemented for the discretization of the conservation equations.
The mass and momentum conservation equations were discretized over the generated computational elements and then solved numerically to produce the flow field. All of the simulations were performed in steady-state and isothermal conditions. The governing equations of the steady flow are presented as follows:
The continuity equation:
  . ρ u = 0  
where ρ is the density and u is the velocity vector.
Momentum conservation equation:
  . ρ u u = P + ρ g + . μ u . τ t  
where P, g, and μ represent the pressure, gravitational acceleration vector, and molecular dynamic viscosity, respectively. The last term on the right-hand side of the equation calculates the divergence of the fluid stress tensor.
Equations of the turbulent kinetic energy and energy dissipation rate, as turbulence closure model equations, were solved along with the momentum conservation equation to simulate the turbulent nature of the flow.
Turbulent kinetic energy:
. ρ k u = . a k μ e f f k + G k + G b ρ ε  
Energy dissipation rate:
  . ρ ε u = . a ε μ e f f ε + C 1 ε ε k G k + C 3 ε G b C 2 ε ρ ε 2   k  
where G k and G b are the sources of turbulent kinetic energy (TKE), which are caused by the velocity gradient and buoyancy force, respectively. a k and a ε denote turbulent Prandtl numbers, while C, C, and C correspond to empirical model constants. COST 732 [26] and Architectural Institute of Japan (AIJ) [32] guidelines were followed to set appropriate boundary conditions for the simulation of the wind-driven flow without considering the buoyancy effects.
It is conventional to use the power law profile or the logarithmic profile to model the atmospheric boundary layer details of wind flow. However, the logarithmic velocity profile was imposed at the inlet, which accounted for the blowing wind boundary layer behavior, since as reported in [32], the logarithmic velocity profile leads to more accurate results when the key parameters of the study are investigated in regions near the ground. In the current study, the gradient height was large enough in comparison with the characteristic length of the building, so the choice of the logarithmic profile was appropriate. This profile is expressed as follows [33]:
U z = u A B L * κ ln z + z 0 z 0
where ( κ = 0.41 ) is the von Karmann constant; u A B L * denotes the atmospheric boundary layer friction velocity; and z 0 is the aerodynamic roughness length, which depends on the type of terrain the wind blows over. In the present study, the reference velocity (VA) equaled 4 m/s, which is the daily average wind velocity in Berlin, Germany, measured at the reference height ( z r e f ) of 10 m (according to official meteorological data [34]). Profiles of the turbulence kinetic energy and turbulence dissipation rate at the inlet were calculated as follows:
k z =   u A B L * 2 C μ
ε z =   u A B L * 3 κ z + z 0
where ( C μ = 0.09 ) is a non-dimensional constant [35]. The velocity at the boundary varied from 10% to 100% of the reference velocity (VA) in 10% increments in different simulations.
A no-slip condition was applied to all solid walls, which established a value of zero for the velocity magnitude on these walls. In addition, the sand-grain roughness height ( k s ) and roughness constant ( C s ) were defined for solid walls to simulate the effects of wall roughness [36]:
k s =   9.793   ×   z o C s  
For all walls of the building, the values of the sand-grain roughness height and roughness constant were set to 0 and 0.5, respectively.
The symmetry boundary was selected for the upper face and the side faces of the domain, which forced the normal velocity, along with the gradients of all variables, to be zero across the boundary. A zero-static-pressure condition was imposed on the outlet.
Since numerical CFD simulations are based on the iterative solution method, appropriate criteria for convergence should be considered. The convergence criteria for the conservation equations (continuity and momentum) were set as 10 6 for x, y, and z momentum; k; and ε and as 10 4 for continuity. Over 5000 iterations were performed to meet the predefined convergence criteria. Moreover, the flow velocity magnitude was monitored at two critical points in both the inlet and outlet channels of the windcatcher to ensure that the values remained unchanged for the rest of the iterations. In the end, the mass flux balance was checked for the converged solution based on the entering and exhausting mass flow rates.

3. Results and Discussions

This section provides a detailed view of the outcomes derived from the CFD simulation of the windcatcher’s operation. In the first subsection, to validate the computational model, the CFD results are compared to the experimental data from a prior study conducted by the authors [25]. Subsequently, the results of windcatchers featuring different UWW angles are presented and discussed in the next part. Finally, the optimal configuration is assessed under varying wind speeds.

3.1. Validation

3.1.1. Grid Adaption

Grid adaptation needed to be performed in order to guarantee that the outcomes were not influenced by the grid’s size. Consequently, various computational models were evaluated, each possessing the same boundary conditions but utilizing a distinct grid number ranging from 1.5 million to 9 million. Figure 2 illustrates the average value of the airflow entering the chamber along the vertical line within the windcatcher inlet channel as the grid size increased from 1.5 to 9 million. The position of this vertical line in the center of the inlet channel is illustrated in Figure 2 (left). This value served as an error indicator. Given the negligible disparity (less than 1%) between the medium and fine mesh sizes, conducting additional simulations utilizing a finer mesh had no impact on the obtained results. Hence, the model possessing a mesh size of 6.5 million was sufficiently accurate to execute simulations with precision.

3.1.2. Comparison between CFD and Experimental Results

For the purpose of validating the CFD model utilized in the present study, numerical data were compared to the experimental data obtained from wind tunnel tests that were published in the authors’ previous study [25]. In brief, a small-scale (1/10) windcatcher model with a horizontal UWW was tested in a wind tunnel at a wind speed of 10 m/s, and the air velocity inside the inlet and outlet channels was measured at 12 points: 6 points located in the inlet (I1–I6) and 6 points in the outlet (O1–O6). More details of the experiment can be found in the above-mentioned study.
A comparison between the experimental and CFD results is illustrated in Figure 3. Comparing the CFD results with the experiment point by point for the inlet and exhaust of the model revealed that in the majority of instances, the predicted results followed the experimental trend and there was adequate adaptation at the majority of the points except point I5, which had a 15% difference. The observed variation at I5 may be attributed to the inherent limitations of k-epsilon turbulence models, specifically in situations involving separation and complex flows.
The average discrepancy between the CFD and experimental results was 8%. As a result of the satisfactory correspondence between the experimental results and the numerical model, it was demonstrated that the simulation model can precisely predict the airflow in the model.
In numerical studies, turbulence sensitivity analysis is a critical and indispensable component that verifies that the chosen model can accurately determine the flow pattern within the domain with precision. This study used mesh and boundary conditions similar to the previous study; therefore, a similar turbulence model (the standard k-ε model) was chosen to perform the CFD analysis, which was consistent with other prior investigations’ findings described in [29,37,38,39,40].

3.2. Integration of UWW with the Windcatcher

First, the effect of the UWW angle on the ventilation performance of the windcatcher exposed to wind flow at the reference speed of 4 m/s was studied. Ten different configurations were assessed. While the angles of the UWW changed from 0° (horizontal) to 90° (vertical) in 10° increments, the other geometrical details of the windcatcher and the building remained unchanged. After finding the optimal angle, which provided the best ventilation performance, this configuration was analyzed under different lower wind speeds (described in the second main part of this section). The indicating parameters of the ventilation that are discussed in this section include the velocity magnitude and static pressure, the airflow rate and air changes per hour (ACH), streamline illustrations, the mean age of air (MAA), and dead zone areas.

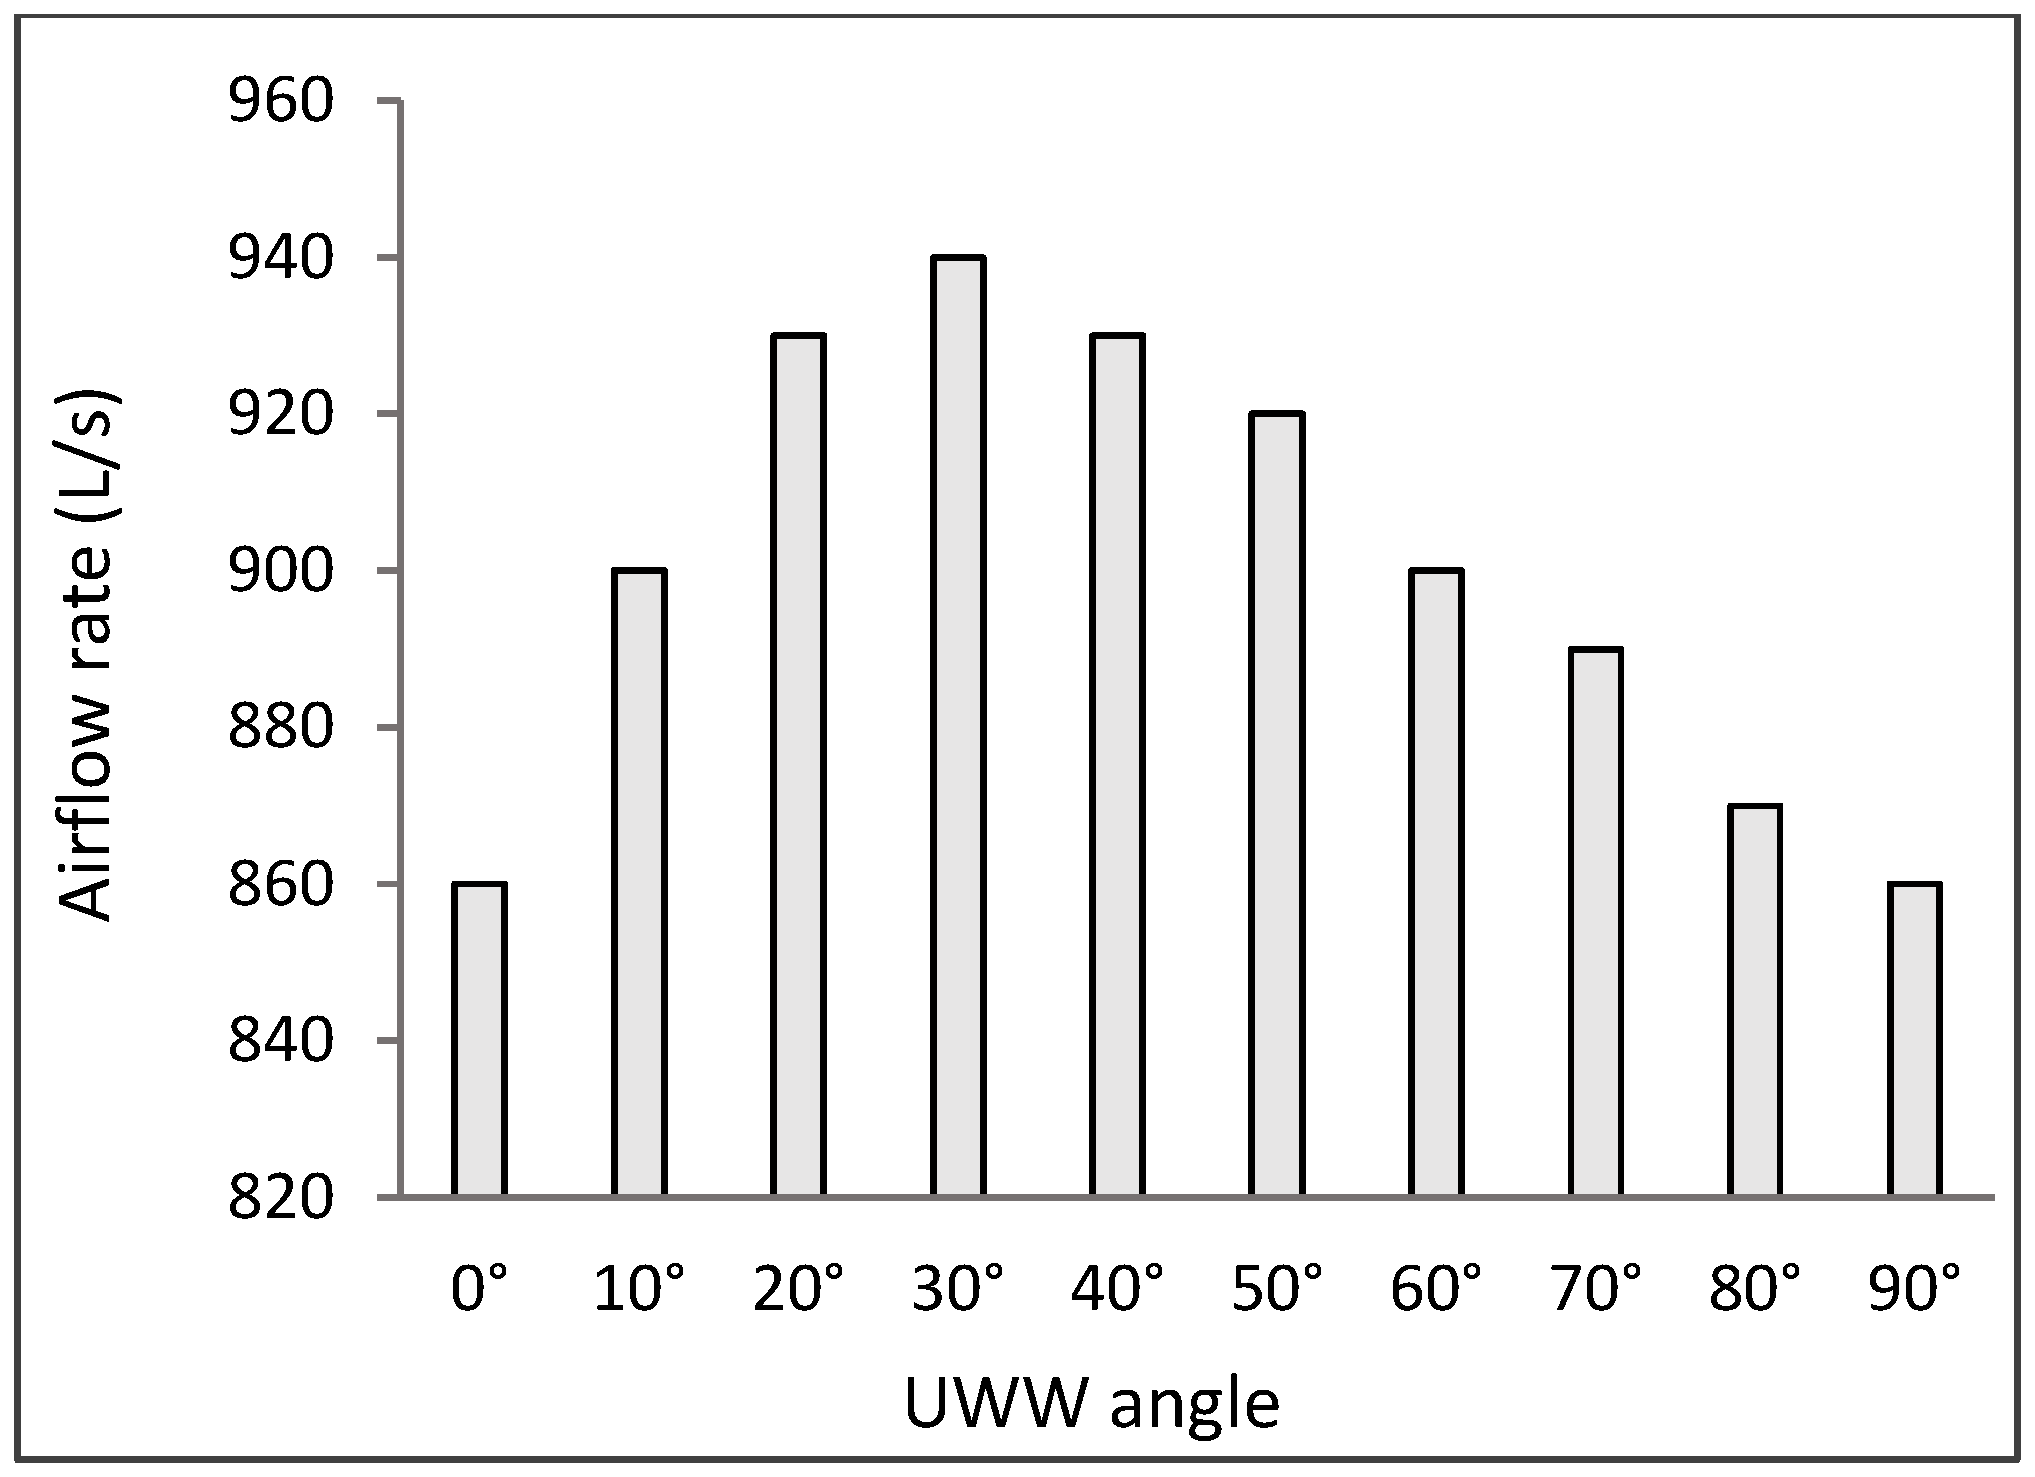
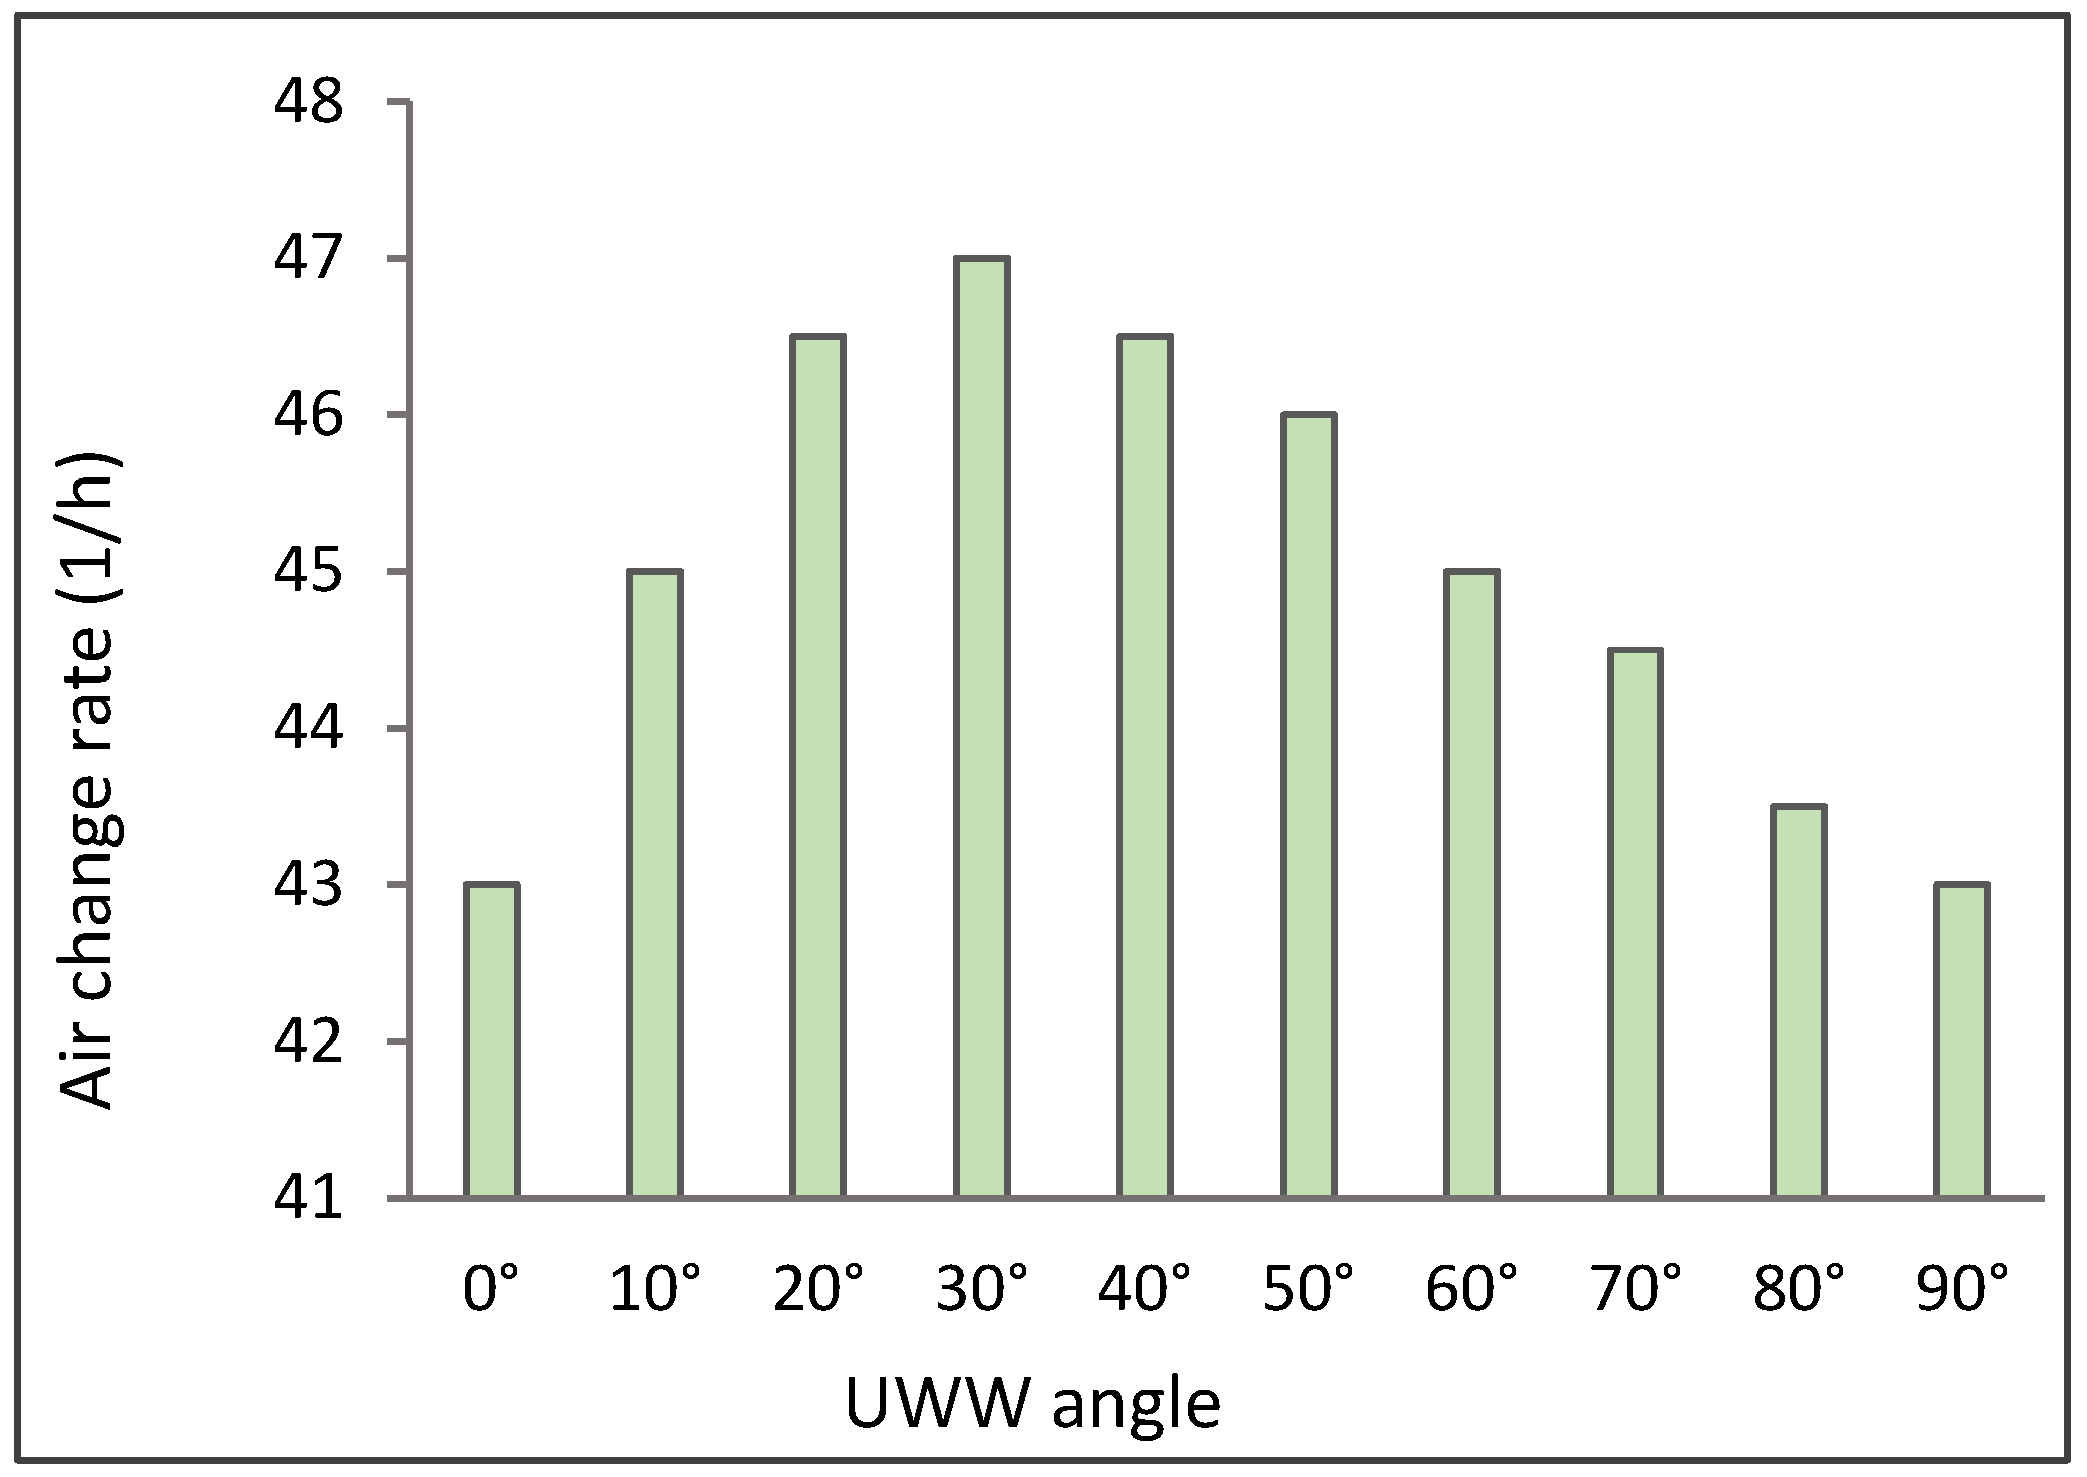
3.2.1. The Effect of the UWW Angle on the Ventilation Performance

Airflow Rate and Air Changes Per Hour (ACH)

The airflow rate and the air changes per hour (ACH) are prominent parameters in the assessment of ventilation efficiency since they directly contribute to indoor air quality and occupants’ health issues. The variations in the airflow rate with respect to the UWW angle are presented in Figure 4, which shows that the variation trend was not monotonic. It increased to some extent and dropped after reaching a peak when the angle was 30°. Considering the airflow rate value of 860 L/s (for the horizontal UWW) as the reference case, the wing wall with an angle of 30° increased the airflow rate by 9%. The values of the airflow rate increased from 860 L/s for the 0° angle to 940 L/s (peak angle) and decreased to reach the value of 860 L/s for the 90° angle, which was the same as the reference case. It is worth mentioning that the airflow rates were much higher than the value of 94 L/s recommended by the ASHRAE 62.1 standard [41] for all angles.
Figure 5 reveals that the windcatcher with a UWW angle of 30° enabled an ACH value of 47 h 1 , which was the highest ACH value among the considered cases and was 9% higher than the reference case, as was expected.

Mean Age of Air

The mean age of air (MAA) defines the average time required for fresh air to reach different points in a building under a specific ventilation scenario. The MAA parameter is defined point by point and has a spatial distribution. In order to obtain the results of the MAA, an additional scalar transport equation needed to be solved. In addition, defining a user-defined scalar (UDS) and compiling a user-defined function (UDF) accompanied by appropriate boundary conditions for the UDS was necessary to obtain the MAA distribution.
Figure 6 (left) presents the average of the MAA in the vertical cross-sectional plane (which can be seen on the right side of Figure 6). Based on these results, the UWWs with a deviation angle of 30° showed the minimum MAA, and as the angle increased, the MAA also had an upward trend. Considering the MAA parameter, the UWW angles equal to or larger than 70° had an unfavorable effect on the ventilation performance of the windcatcher.
To provide deeper insight, the distribution of the MAA in the vertical cross-sectional plane of the building in the presence of the 30° UWW is shown in Figure 6 (right). According to the figure, three regions with different MAA distributions were seen inside the room. The region that was covered by the high-velocity jet entering the room had the lowest MAA values, especially at the core of the jet. The region next to the windward wall of the room had the highest values (146 s), while the region near the leeward wall experienced fresher air and possessed lower values. The distribution of the MAA was compatible with the flow field pattern since the deflection of the guided jet toward the leeward wall resulted in increased MAA values in the region in close proximity to the windward wall, especially in the upper corner.

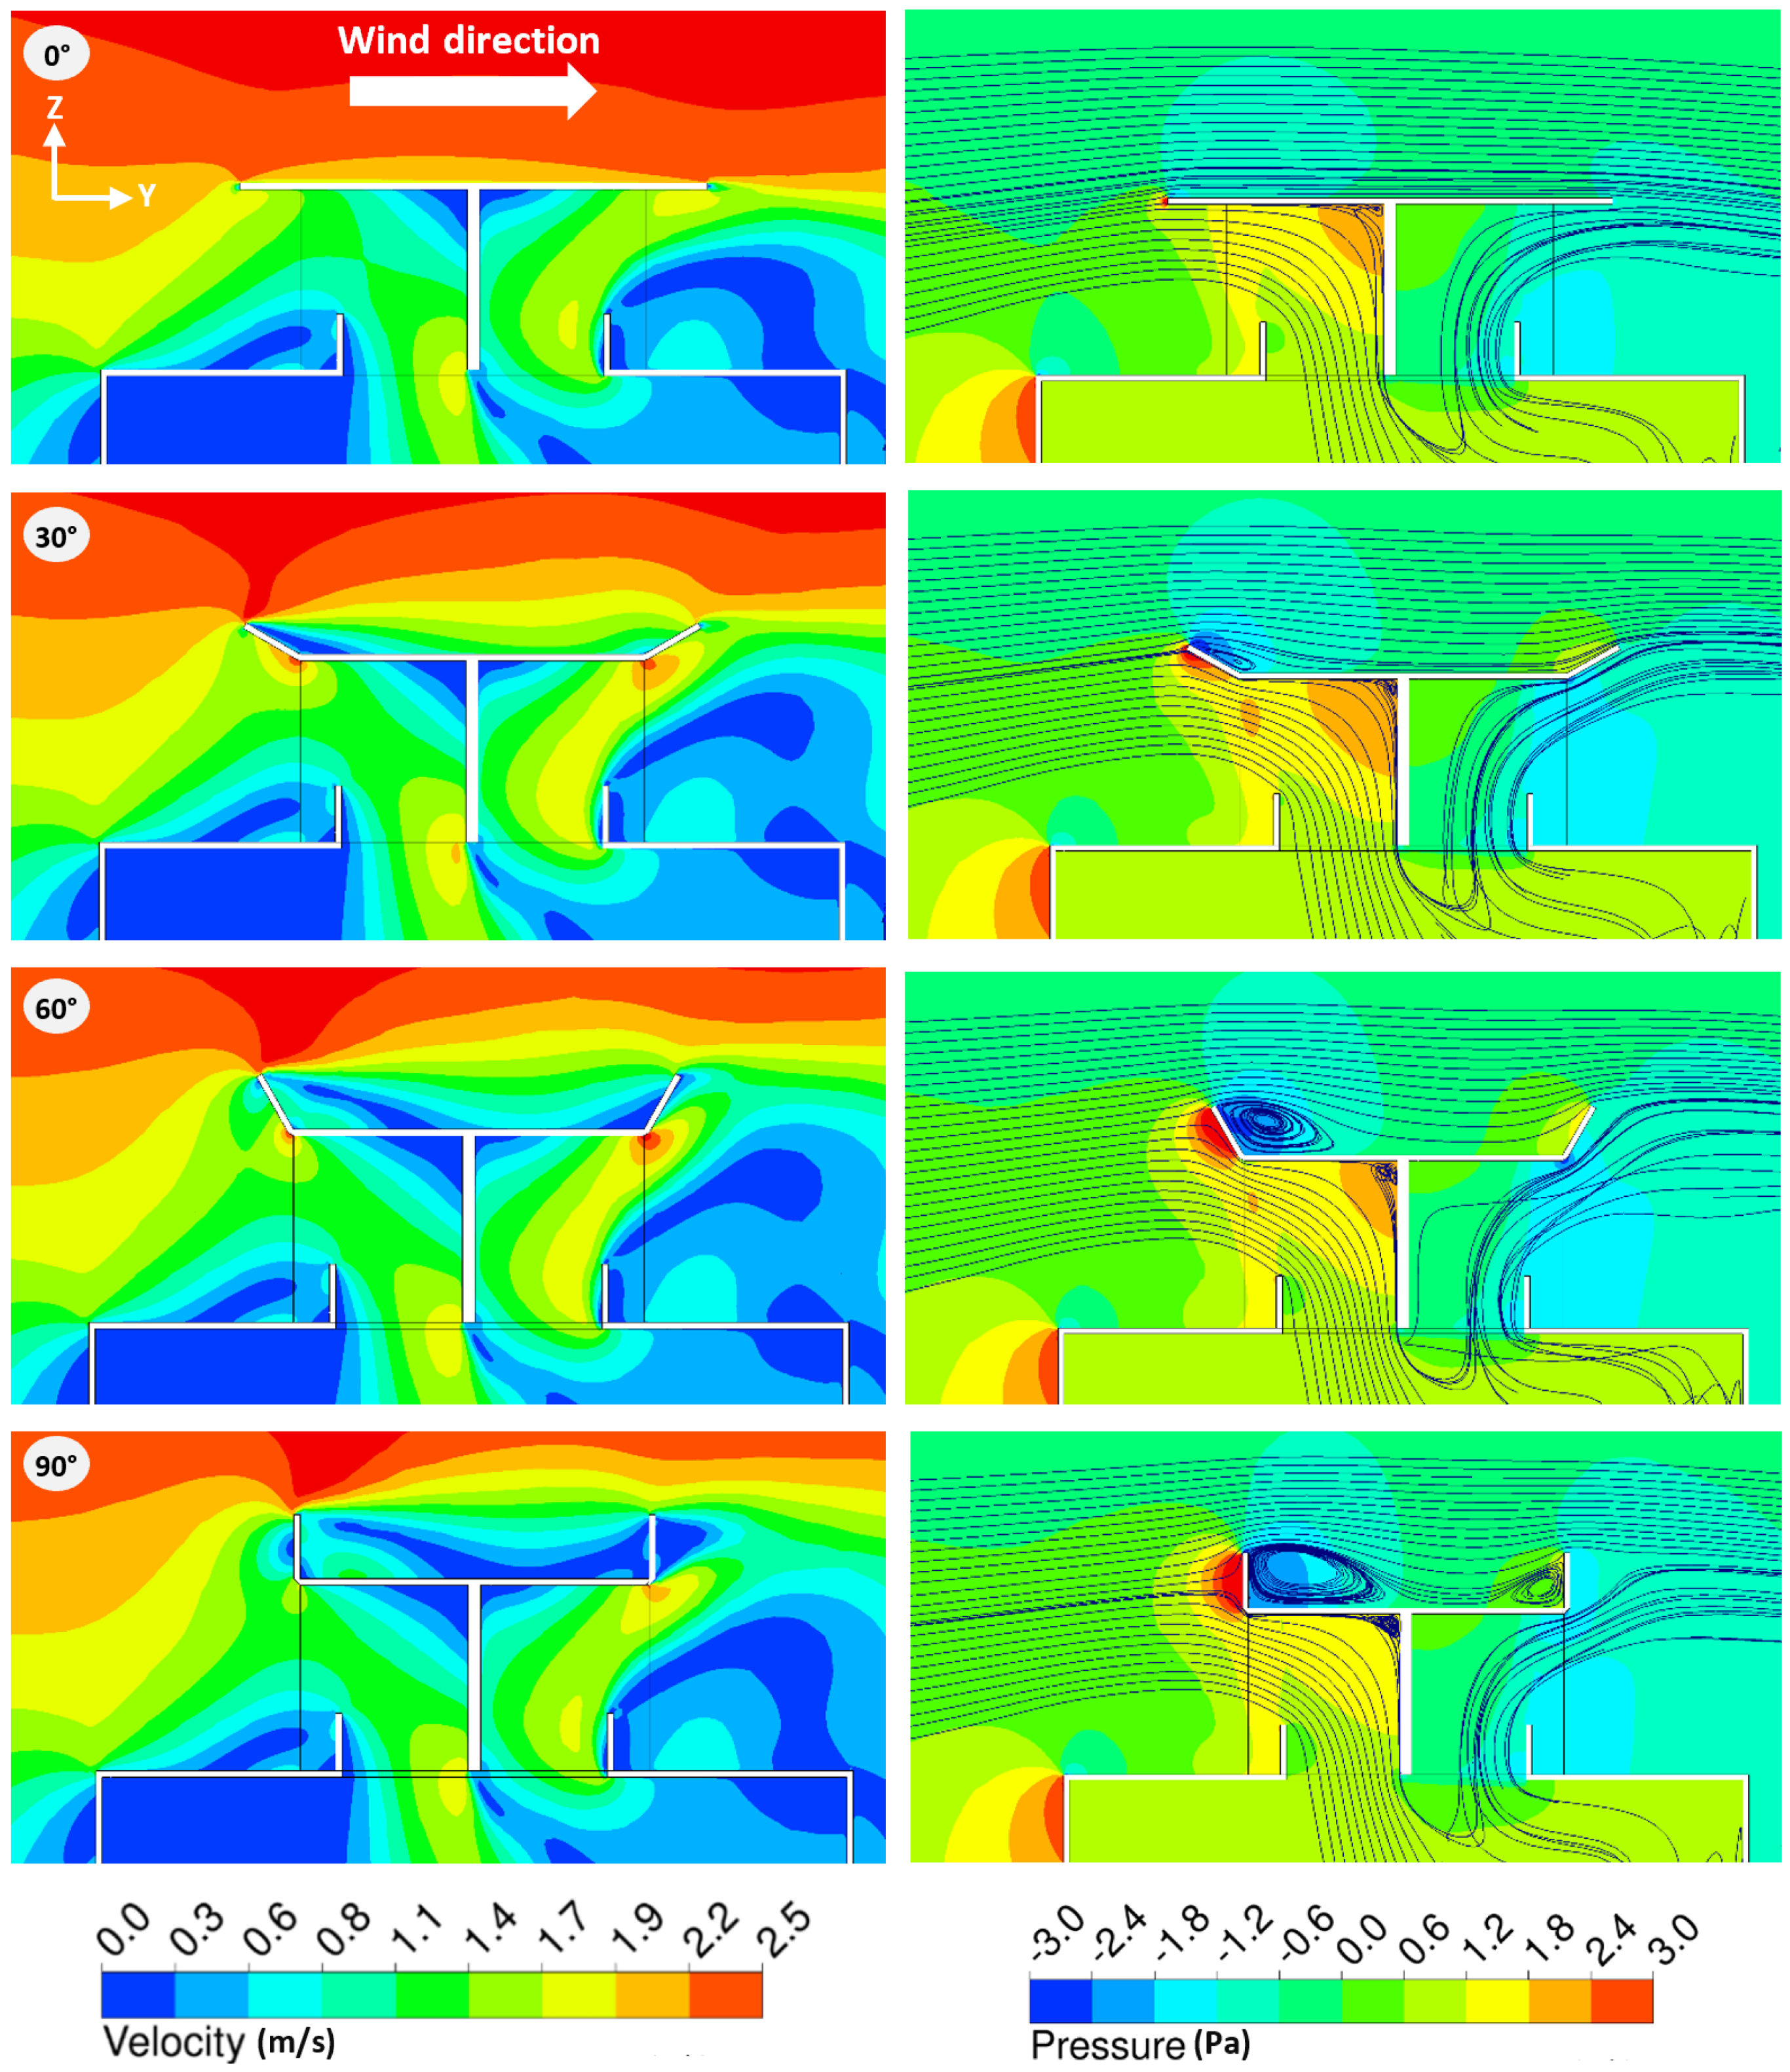
3.2.2. Qualitative Analysis of the UWW’s Impact on Aerodynamic Performance and Flow Field Pattern

To provide deeper insight into the impact of the integration of the UWW with the windcatcher on ventilation and the pattern and distribution of flow, a qualitative analysis with the help of contours (velocity and static pressure) and streamlines is discussed in this subsection. Contours of the velocity magnitude and static pressure accompanied by streamlines of the flow inside and around the windcatcher are presented for UWW angles of 0°, 30°, 60°, and 90° in Figure 7. These four angles were selected to visualize the flow behavior for these angles and to reveal useful information about the reasons for variations in the ventilation parameters. The angles of 0° and 90° are the minimum and maximum angles, respectively. The tilt angle of 30° is the optimal angle (according to the ventilation parameters in the last section), while 60° is the middle angle between 30° and 90°. The other objective of this part is to explore why the configuration with a 30° UWW performed better than the others.
As can be seen in Figure 7 (all cases), the blowing wind was disturbed by the building and a wide affected wake region formed behind the building downstream of the flow field. The low-velocity region behind the building created negative pressure gauge values (suction) near the outlet of the windcatcher, which were the main driving force of the continued airflow from the inlet to the outlet.
In the vicinity of the windward wall of the building, the velocity of the flow dropped to lower values as part of the flow was trapped and forced to recirculate in that region. A high-pressure zone was seen near the windward wall of the building as the approaching flow became nearly stagnant and its kinetic energy was converted to pressure energy. At the sharp edges of the building, flow separation occurred and the flow detached.
As the wind flow entered the windcatcher, the part of the flow that was near the internal windward wall of the windcatcher faced separation, and as a result, a recirculation zone developed in that region. The main entering flow passed the recirculation region and was pushed toward the leeward wall of the windcatcher, forming a high-velocity jet that continued downward. The formation of the high-momentum wall jet was the main flow field characteristic of the windcatcher, as clearly seen in Figure 7.
As made clear by the pressure contours, as the deviation angle of the UWW increased, the high-pressure region in the vicinity of the bottom side of the wing wall became wider. This happened because as the wing wall’s orientation tended toward a completely vertical condition, the projected area of the wing wall in the stream direction increased. As a result, the approaching wind flow faced a larger obstacle.
In all cases, a group of the streamlines that entered the building took the shortest route toward the windcatcher’s outlet, exiting the structure without providing any useful ventilation. This phenomenon, known as short-circuiting, adversely affected the ventilation efficiency of the windcatcher.
In the conventional design with a completely horizontal UWW, the approaching wind flow streamlines were smoothly divided by the wing wall. A group of them was directed into the windcatcher, while the rest of them went over the roof of the windcatcher. When the streamlines near the lower part of the opening entered the windcatcher, they were forced to go through a sharp bend. As a result, the streamlines could not keep their alignment with the path, and the separation that occurred forms a recirculation region in the vicinity of the internal windward wall of the windcatcher. A part of the entering flow was trapped and circulated near the corner of the leeward wall.
In the case of the 30° UWW, the tilted surface of the UWW trapped more streamlines of the approaching flow and guided them toward the windcatcher, which increased the ventilation capacity of the windcatcher, as more fresh air was supplied. Over the roof of the windcatcher, flow separation occurred and a recirculation region developed on the upper surface of the wing wall.
Increasing the deviation angle of the UWW to 60° reversed the favorable effect of the wing wall. As the tilt angle increased the projected area of the wing wall in the direction of the main stream, the UWW appeared as an obstacle rather than a guiding surface. In the case with a completely vertical UWW, the obstacle effect of the wing wall became more pronounced and flow stagnation behavior was seen in the vicinity of the front surface of the UWW. The recirculation region behind the vertical wing wall covered a wide area, as the streamlines could not pass the wing wall smoothly.
According to the flow patterns illustrated in Figure 7, the area of the recirculation region in the upper corner of the windcatcher’s leeward wall became wider as the UWW angle increased. For the UWW angle of 90°, the recirculation zone in the corner had the largest area among all the cases. This trend was also responsible for the poor ventilation functionality of the windcatcher when it had high UWW angles. In other words, the wide area of the recirculation zone in the corner reduced the effective area of the entering airflow passage.
It is concluded that as the UWW angle increased from 0° to 30°, the guiding effect of the wing wall improved the windcatcher’s efficacy since more air was captured and guided toward the interior space of the building. For UWW angles larger than 30°, the obstacle effect of the wing wall surface became stronger than the guiding effect, which changed the ventilation performance of the windcatcher in an unfavorable manner.

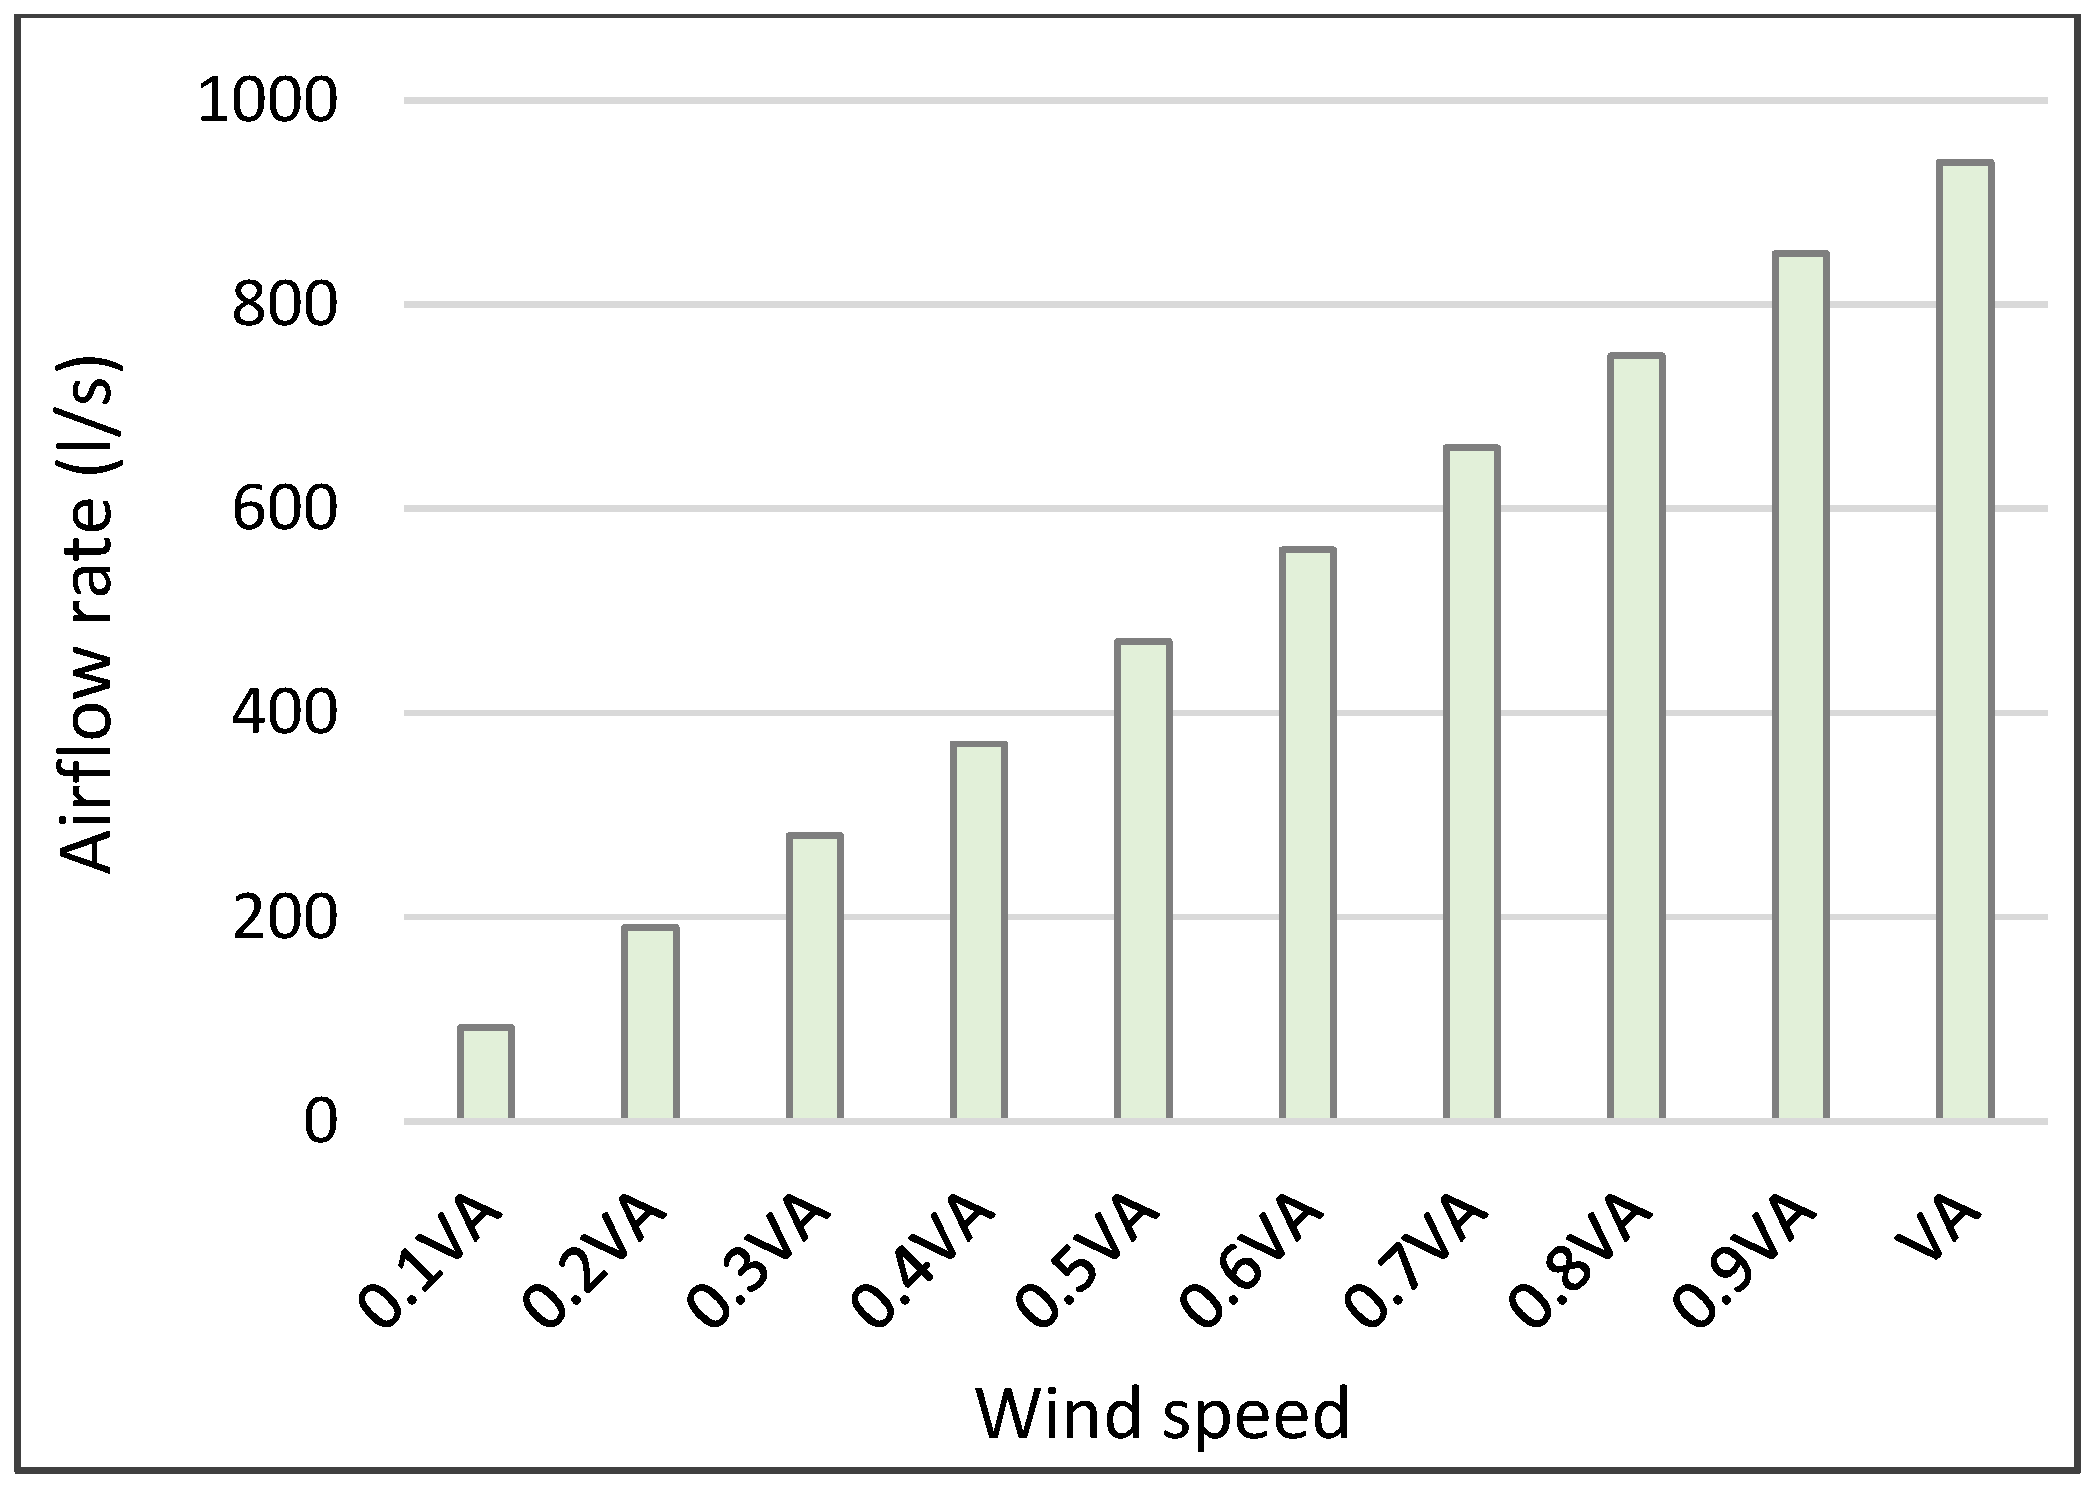
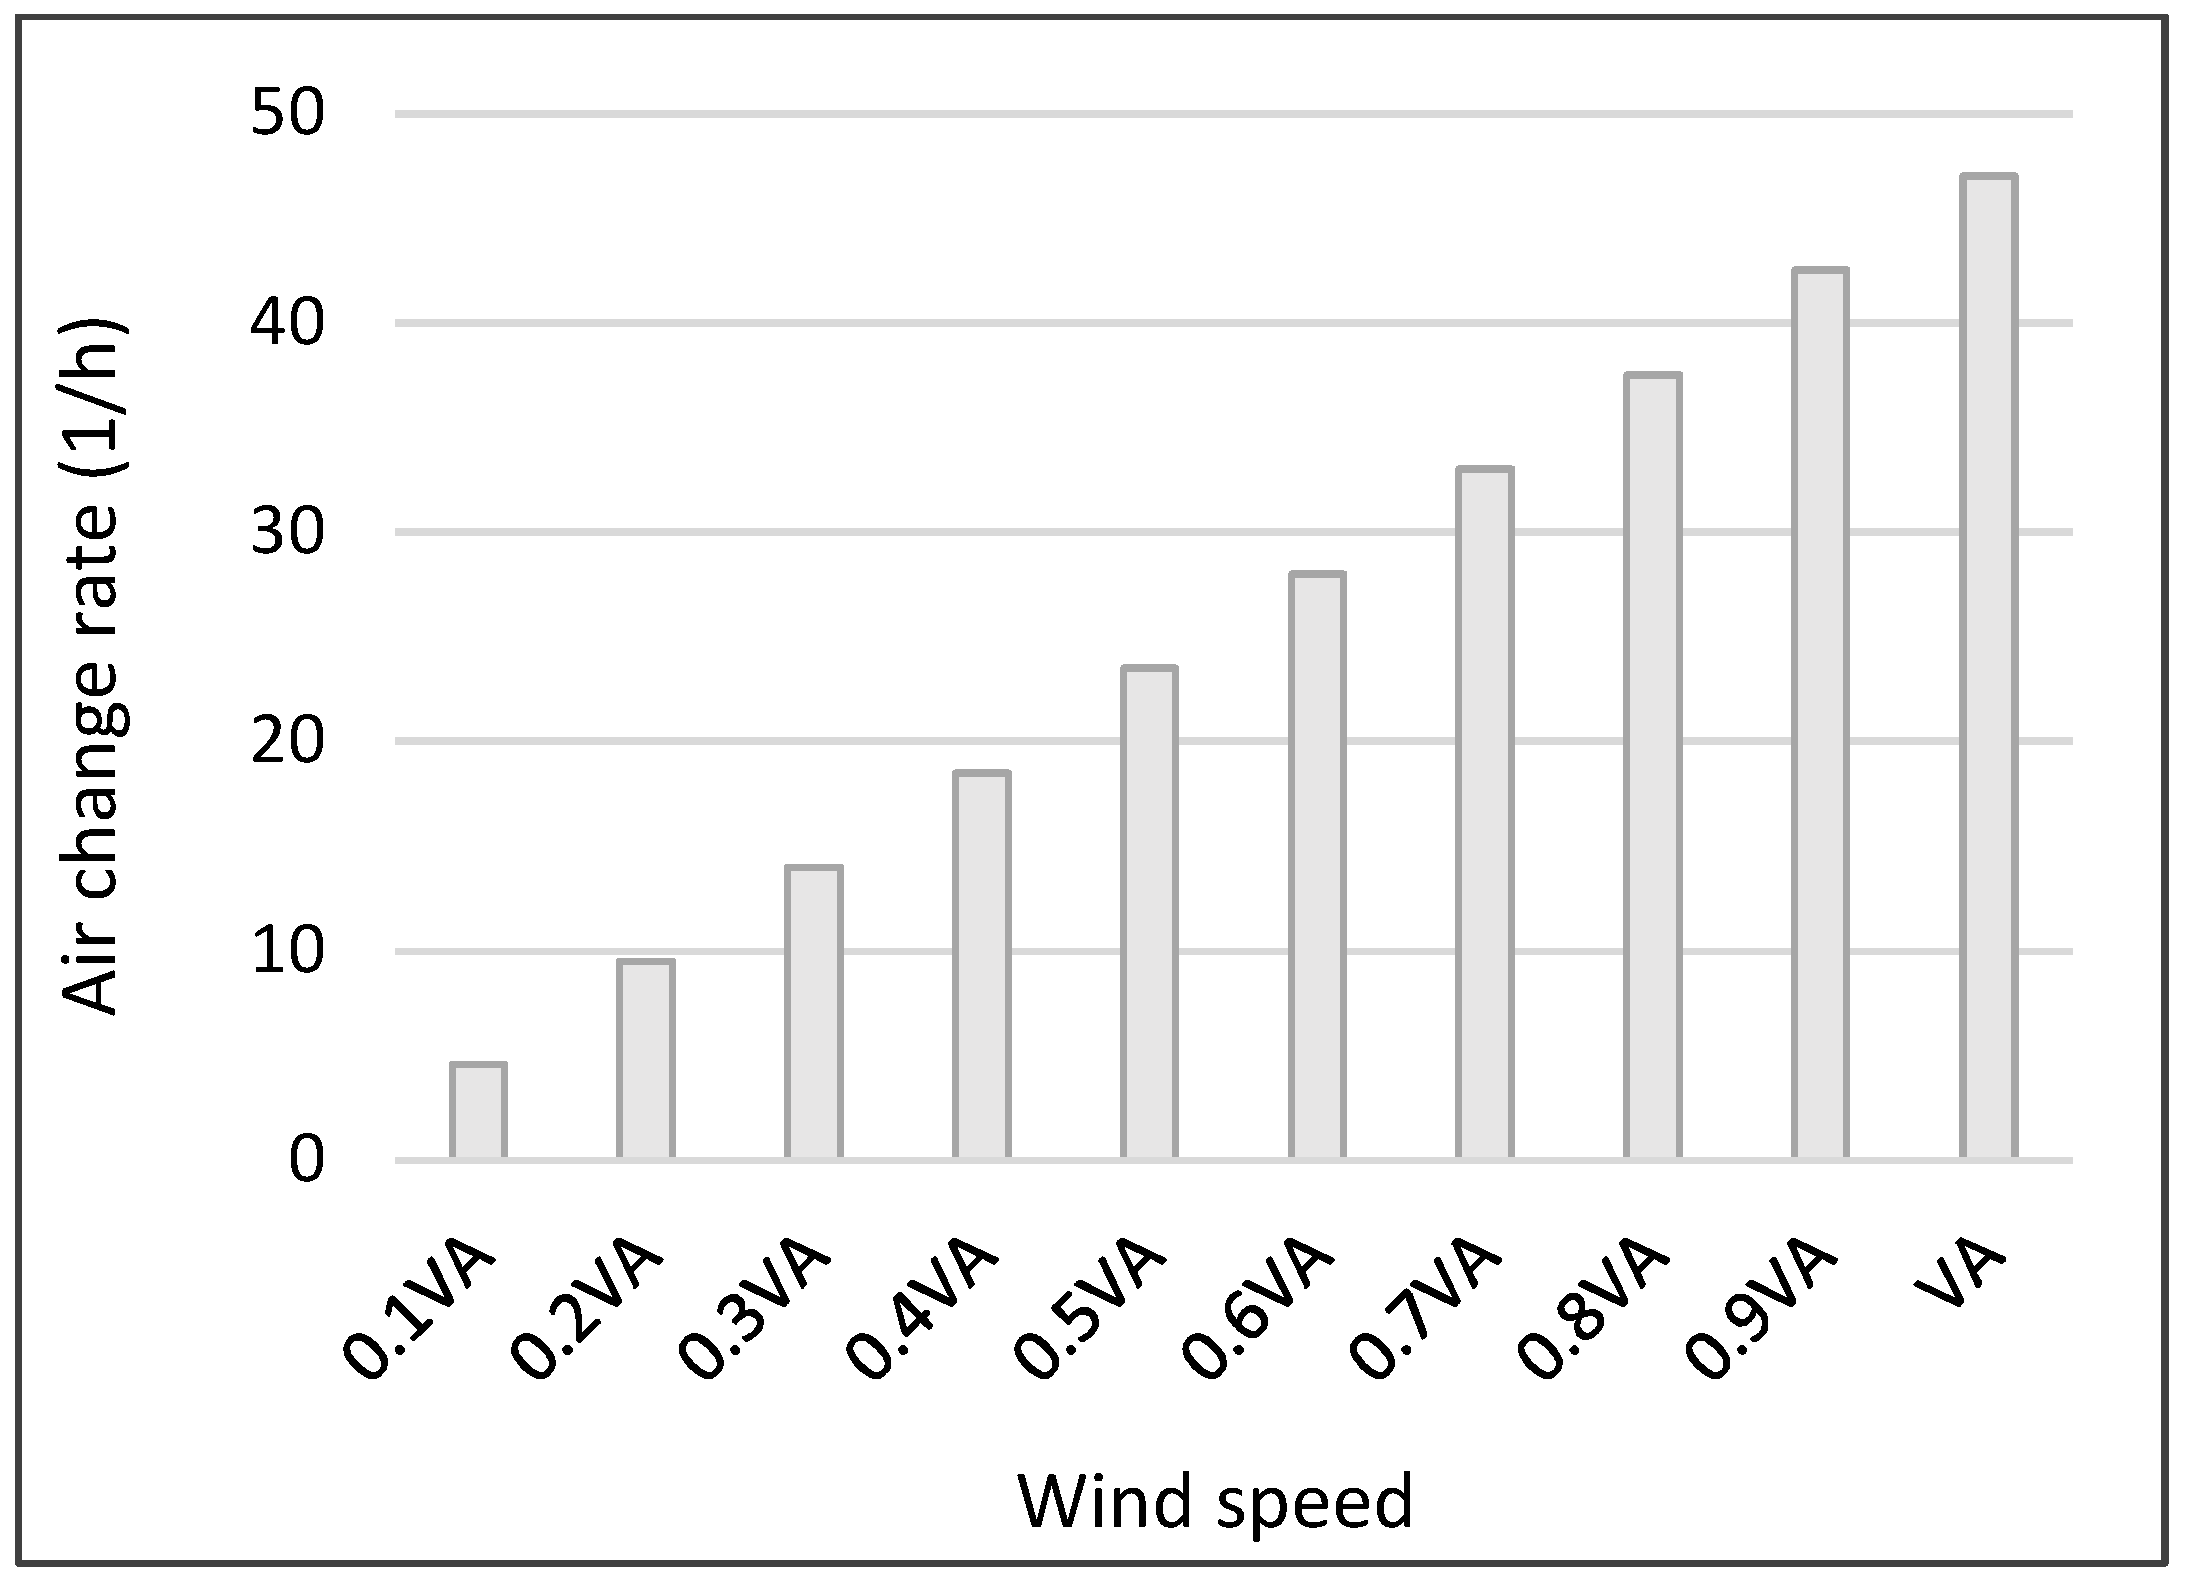
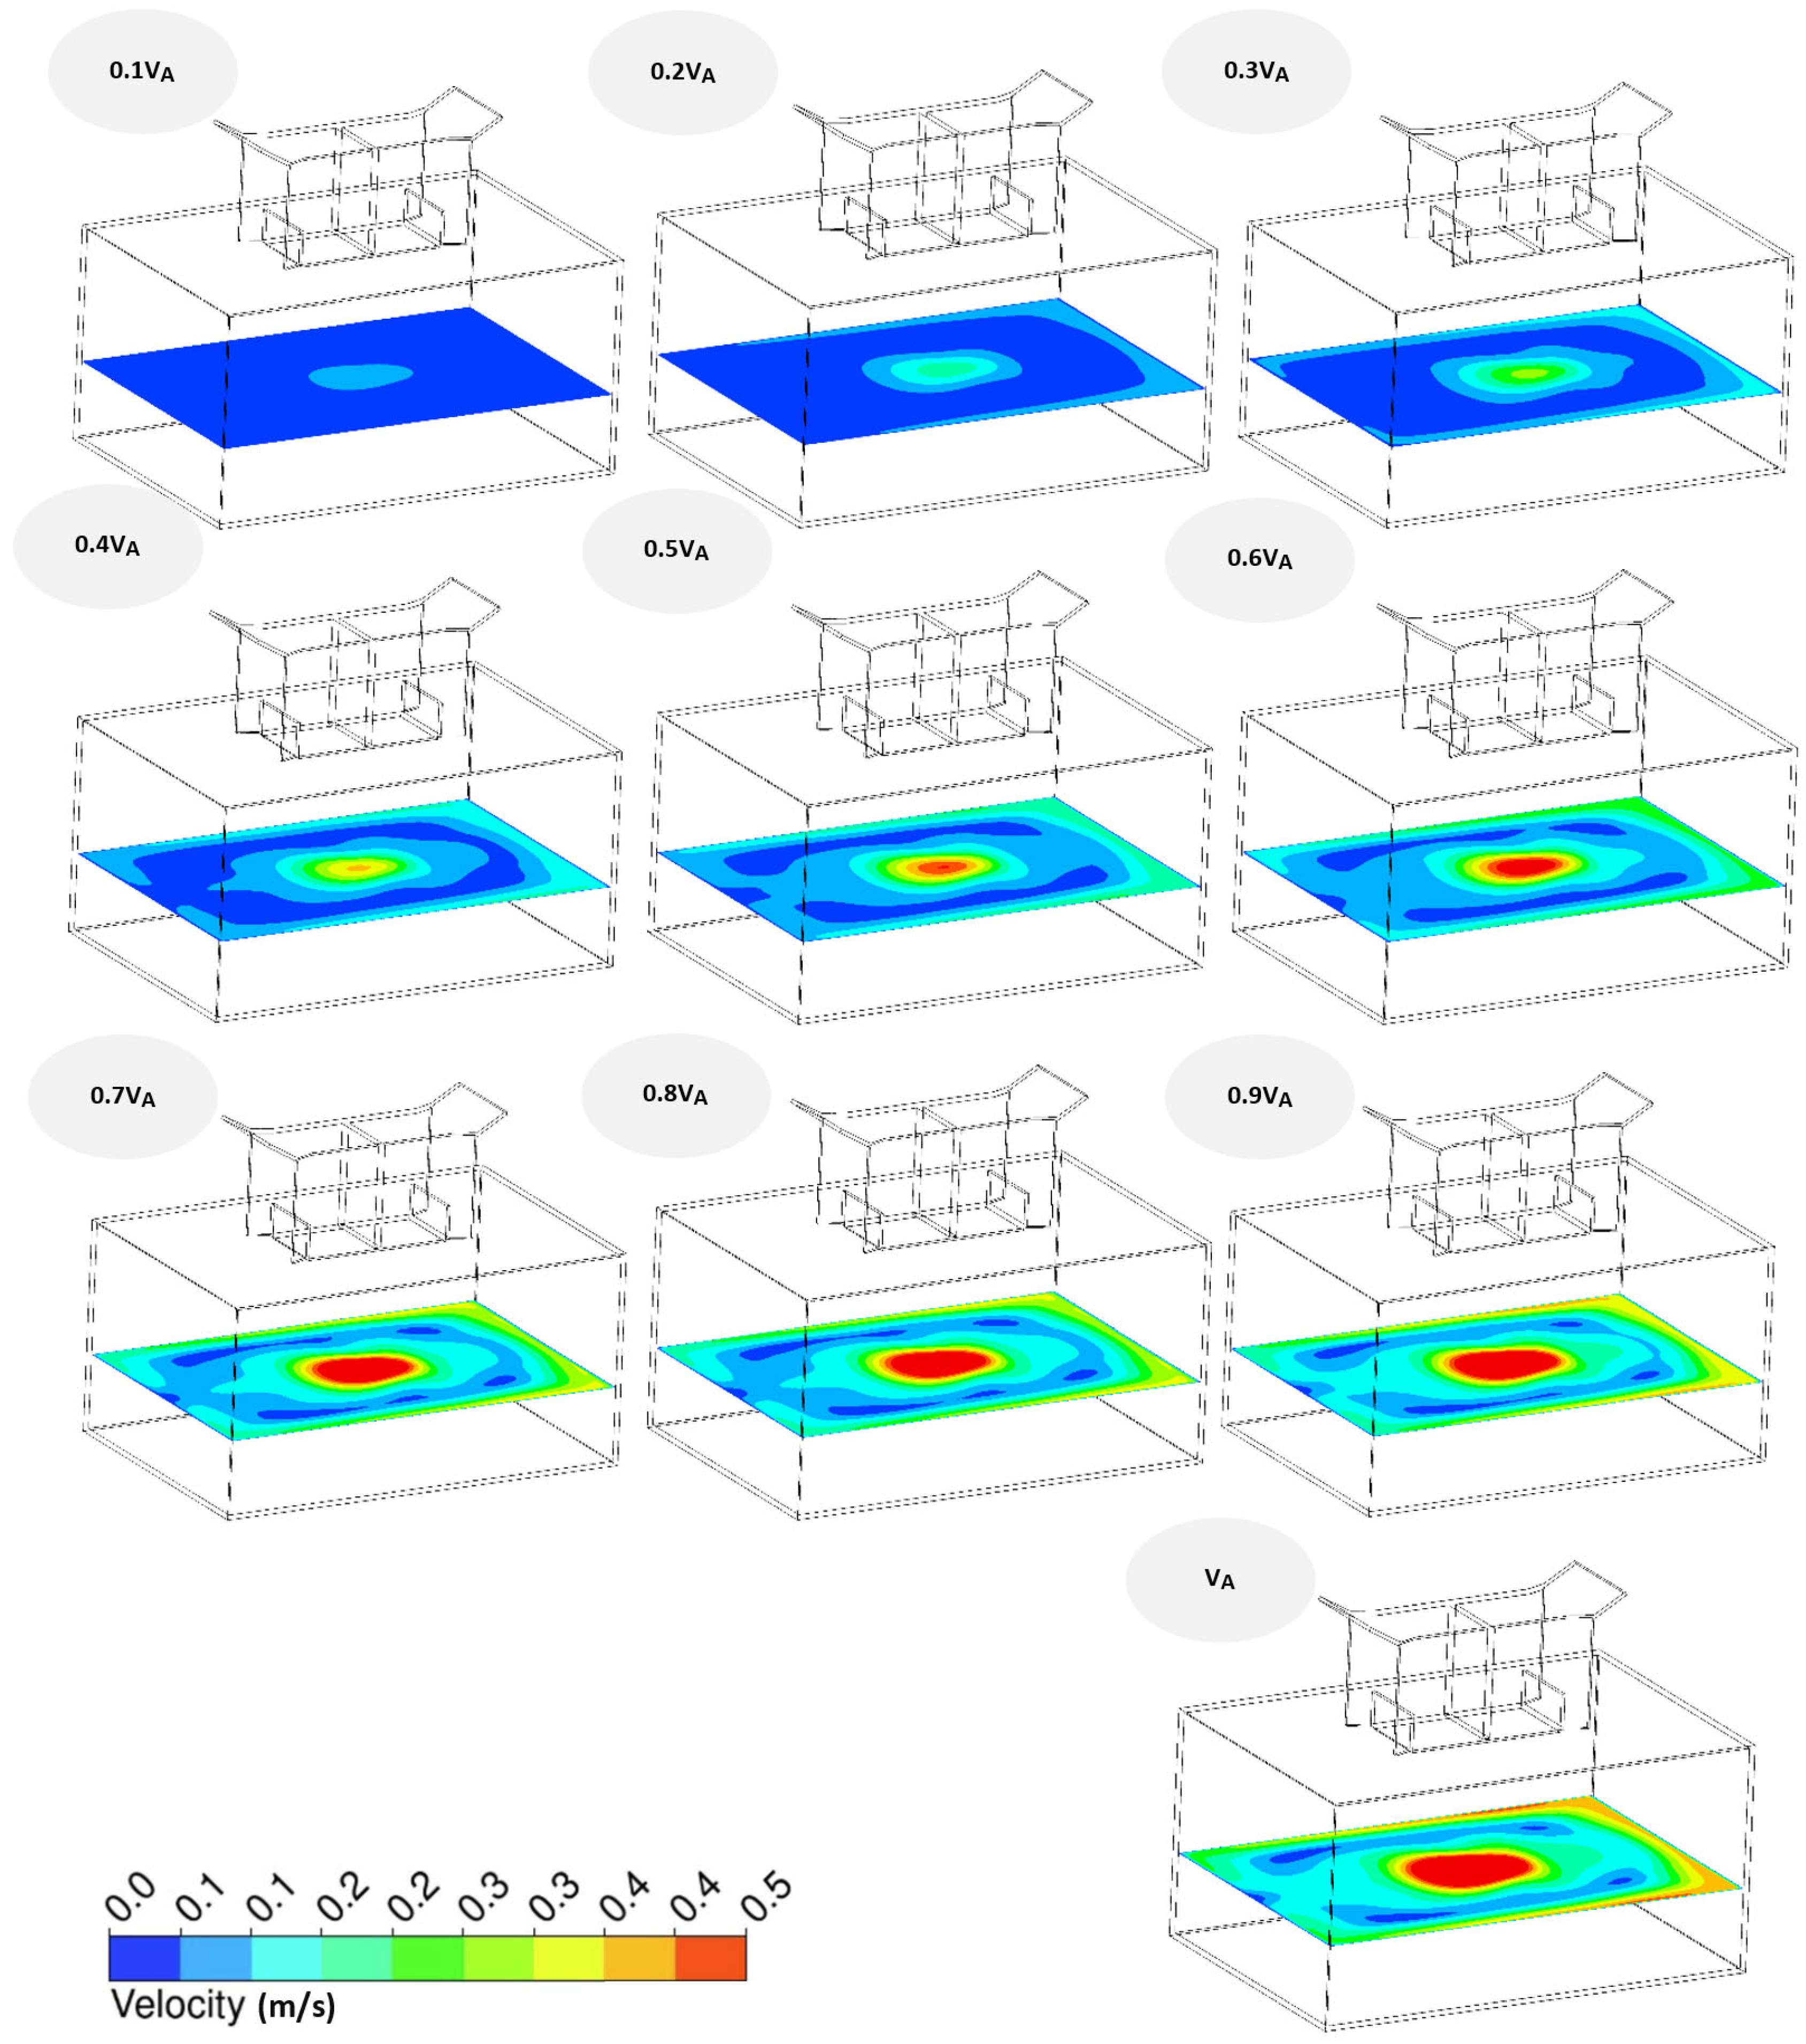
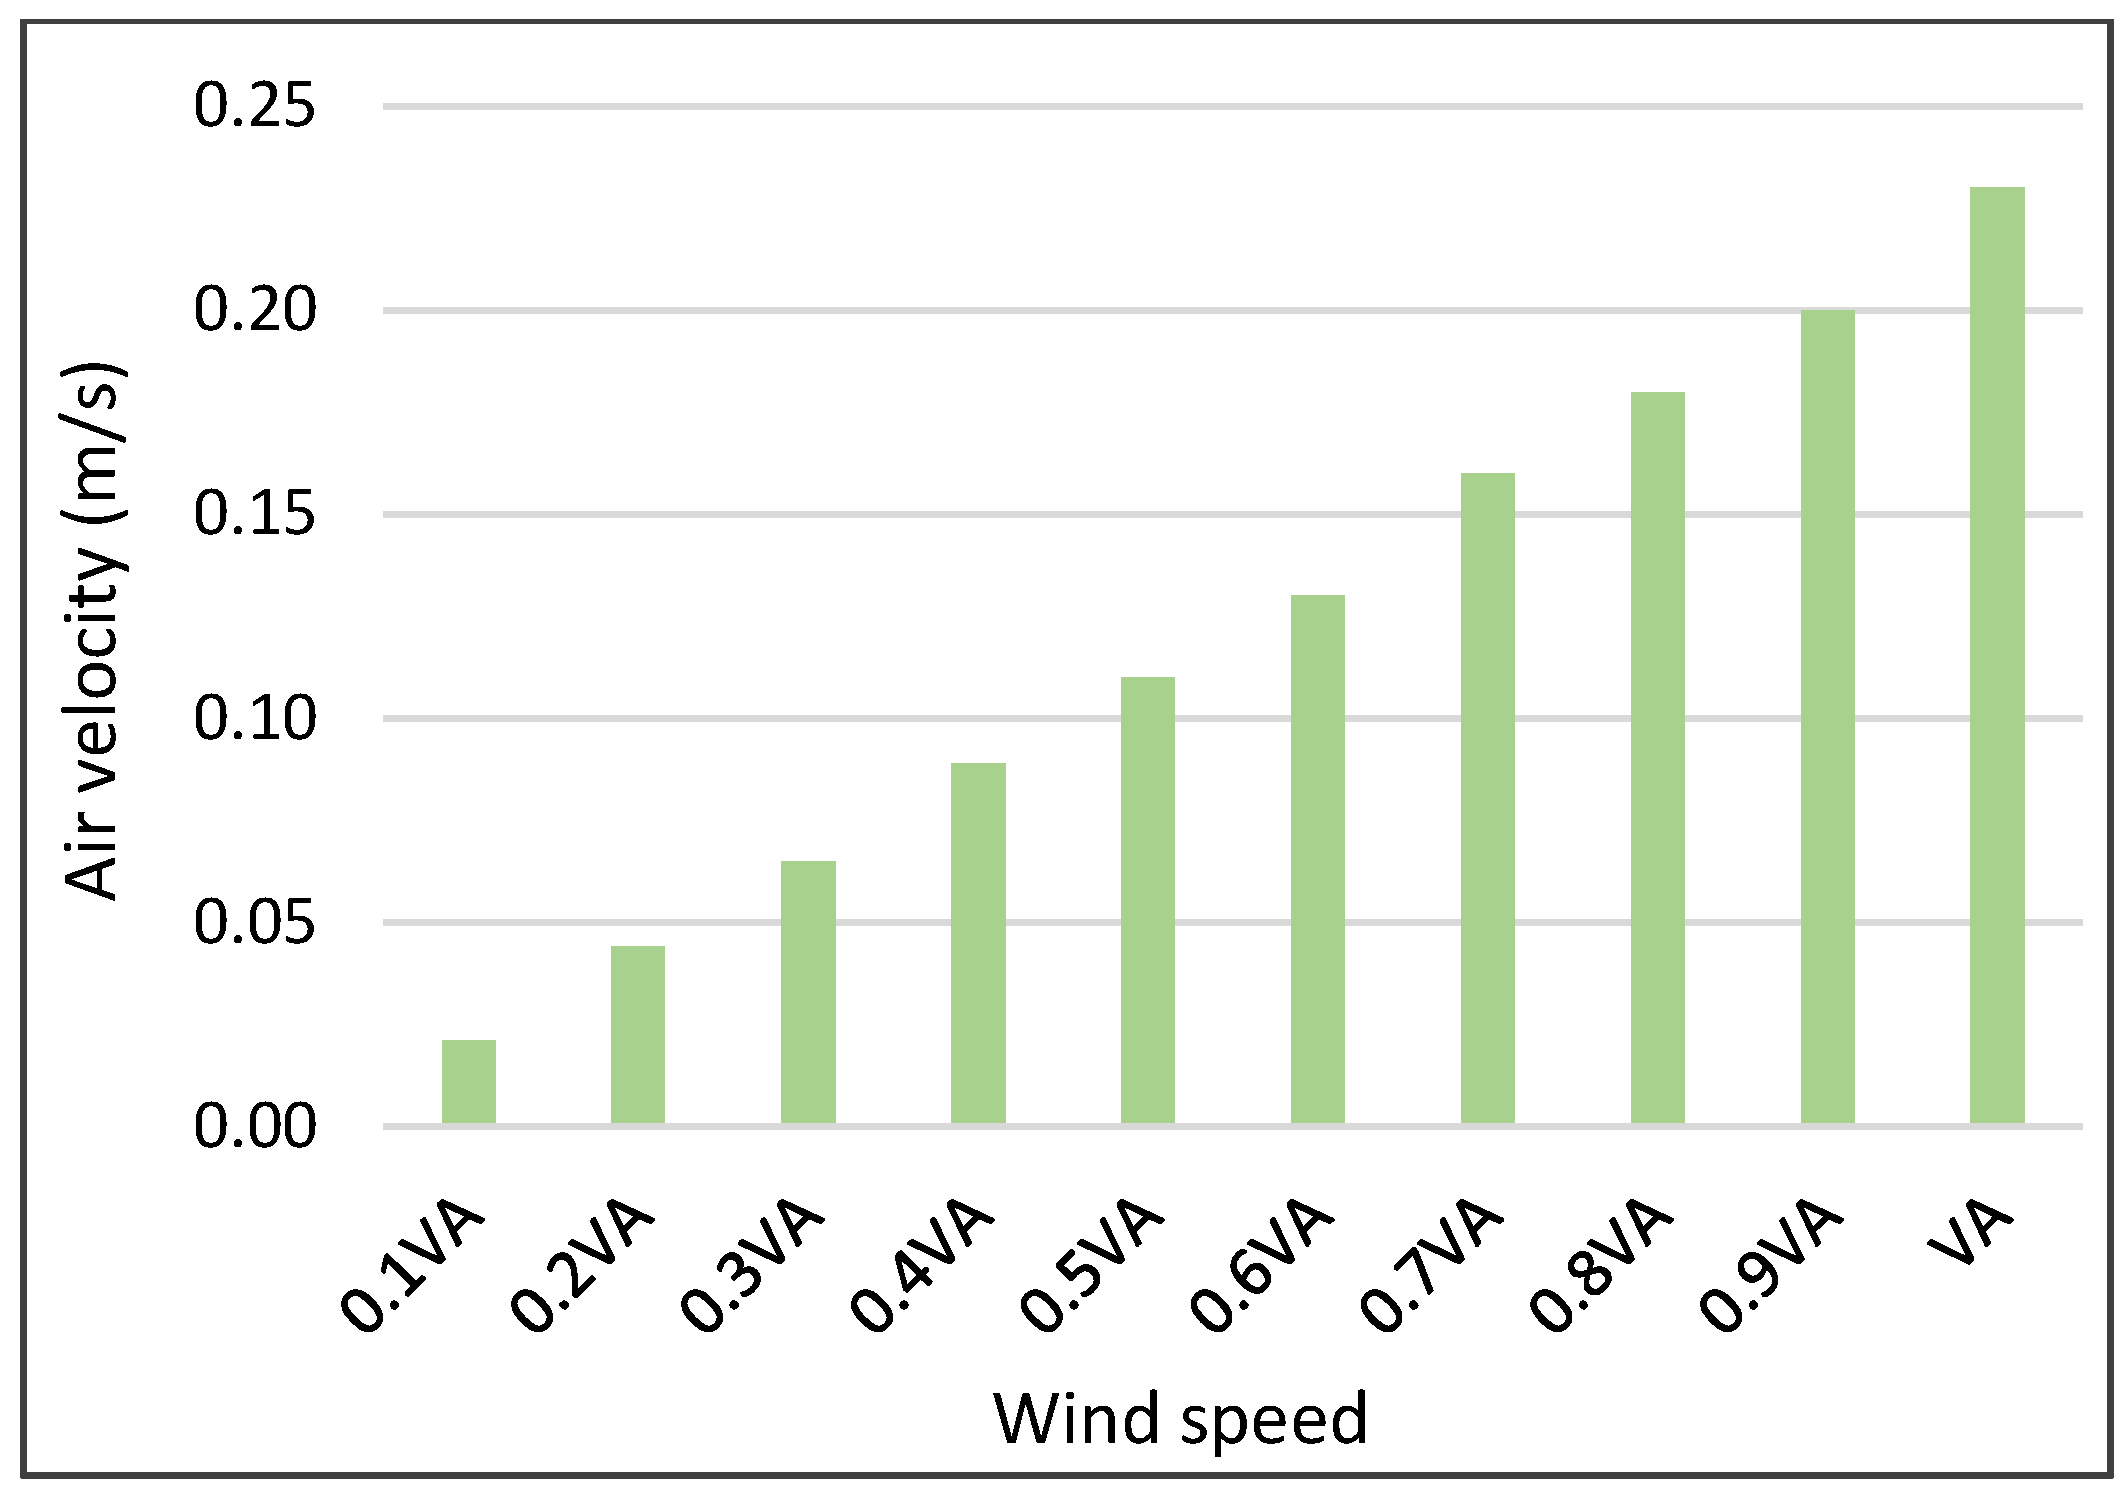
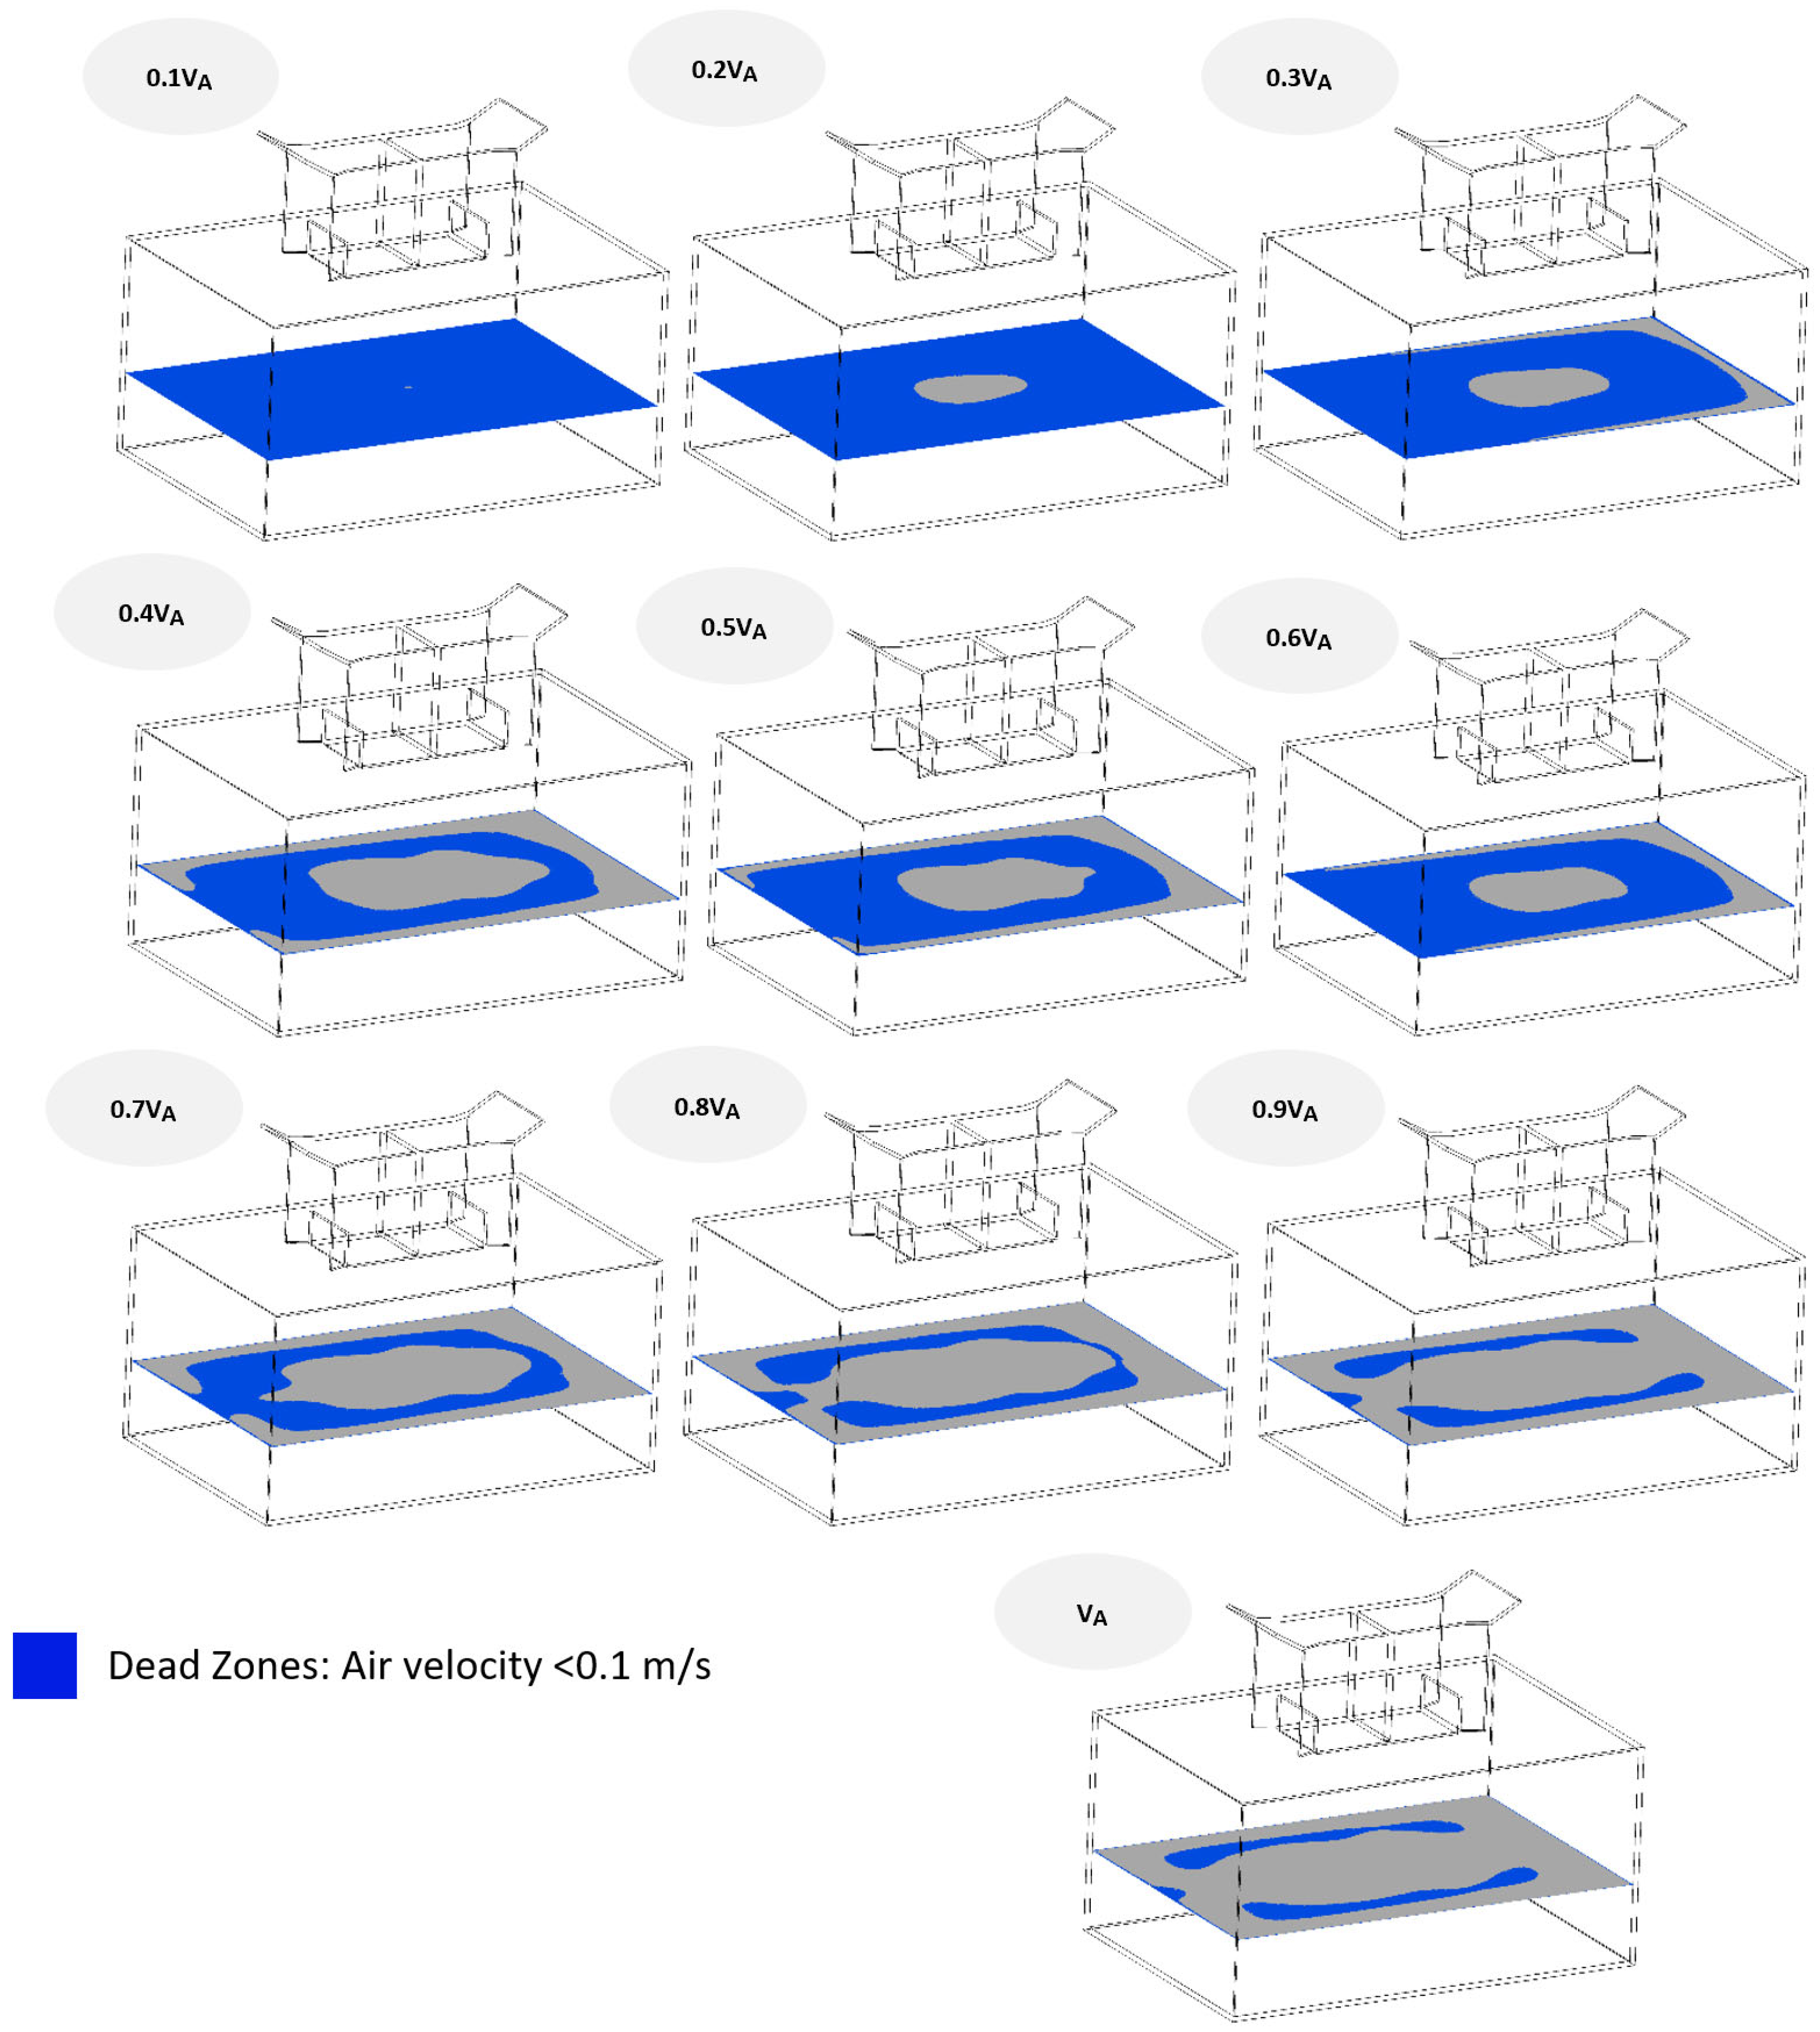
3.2.3. Ventilation Performance under Different Wind Speeds

The ventilation efficacy of the windcatcher with the 30° UWW angle (the optimal angle) is evaluated in this section at ten different wind velocities ranging from 0.1   V A to V A (4 m/s). The main objective of this section is to examine the natural ventilation efficacy of the selected optimal design in low-speed wind conditions. The investigated parameters of ventilation that are discussed in this section are velocity magnitude, airflow rate, air changes per hour (ACH), and dead zone areas.

Airflow Rate and ACH

The non-dimensional findings of the airflow rate and air change rate provided to the building at different wind velocities are depicted in Figure 8 and Figure 9, respectively. The trend of the variations in the airflow rate and ACH versus the wind speed is a completely monotonic function, as these parameters are directly proportional to the wind speed.
As the upstream wind speed increased from 0.1   V A to V A , the kinetic energy of the airflow also increased and influences the amount of fresh air that passed through the inlet of the windcatcher. The airflow rate ranged from 92 L/s (corresponding to 0.1   V A ) to 940 L/s (corresponding to V A ). For all upstream wind velocities higher than 0.1   V A , the windcatcher with the optimal UWW angle was able to provide an airflow rate much higher than the recommended value of the ASHRAE 62.1 standard, which according to the size and number of occupants in this case was 94 L/s [41]. The minimum supplied airflow rate, which occurred at 0.1   V A , was just 2 L/s lower than the reported value of the stated standard. This shows that a windcatcher-based natural ventilation system can meet the minimum ventilation requirements, even in low-wind-speed conditions. The considered windcatcher was capable of providing the building with maximum and minimum ACH values of 47 h 1 and 4.6 h 1 with approaching wind speeds of V A and 0.1   V A , respectively.

Airflow Velocity at Head Height

The contours of the velocity magnitude in the horizontal plane positioned at a height of 1.1 m when exposed to different wind speed conditions are presented in Figure 10, while the corresponding average values are reported in Figure 11.
As seen in the velocity contours, the maximum values of the velocity magnitude were reached in a region beneath the inlet diffuser of the windcatcher. This area was located in the path of the entering high-momentum wall jet. The airflow velocity had maximum values of 0.4 m/s to 0.5 m/s in the core region of the wall jet within the wind speed range of 0.4 VA to VA. However, the maximum velocity magnitude decreased to 0.1 m/s when the wind blew at a speed of 0.1 VA. The area with the maximum velocity was reduced as the wind speed decreased since the momentum of the entering core jet flow was directly supplied by the upstream wind flow’s kinetic energy. At a wind speed of VA, the flow velocity reached a value of 0.4 m/s near the leeward wall of the building, while the stated value was below 0.1 m/s in the case of a wind speed of 0.1 VA.

Dead Zones

Dead zones are defined as the regions inside a building with an airflow velocity lower than 0.1 m/s [42]. The areas covered by dead zones are critical since in these regions the air becomes nearly stagnant and the danger of contaminant accumulation increases, which can lead to health issues and human discomfort. The formation of dead zones at the head height of a seated individual (plane standing at a height of 1.1 m) is of great importance since the air quality at this height has a direct impact on the occupant’s respiratory system. Figure 12 illustrates the dead zones at the breathing height of a seated occupant inside the room ventilated under different wind flow speeds.
The dead zone region in the average-wind-velocity condition ( V A ) is only 15% of the total plane area, while at the low wind speed of 0.1   V A it covers nearly 96% of the total plane area. The dead zone near the windward wall of the building is wider than the regions near the leeward wall since the supplied fresh air deviates toward the leeward wall as it enters the room.

4. Conclusions

The current study aimed to investigate the influence of the UWW angle (in the range of 0° to 90°) on the natural ventilation of a roof-mounted two-sided windcatcher. The numerical CFD results were produced using two sets of simulations. First, the effect of the UWW angle on the ventilation process was investigated at the wind speed of 4   m / s ( V A ) . In the second series of simulations, the ventilation functionality of the windcatcher with the optimal UWW angle (30°) was studied under different wind speeds from 0.1   V A to V A .
According to the results, the ventilation parameters were a non-monotonic function of the UWW angle. Increasing the UWW angle strengthened the guiding effect of the wing wall and improved the ventilation parameters, but after reaching an extremum, the opposing obstacle effect of the wing wall’s front surface overshadowed the guiding effect and changed the increasing trend. The UWW with a tilt angle of 30° showed the best natural ventilation performance among the considered designs, and it was selected as the optimal UWW angle. Installing a UWW with an angle of 30° provided the ventilated room with an airflow rate of 940 L/s and 47 air changes per hour (ACH), which were 9.3% higher than those of the windcatcher with a horizontal UWW (reference case). The optimal UWW angle increased the average value of the velocity magnitude at a height of 1.1 m (the breathing height of a seated occupant) by 10% and reduced the average and maximum values of the mean age of air (MAA) in that plane by 5% and 10%, respectively, in comparison with the primary design. The dead zone area in the horizontal plane at a height of 1.1 m was reduced to 3.7 m 2 , which was a 12% improvement in the presence of the 30° UWW relative to the reference case. When using UWW angles above 70°, the adverse impact of the wing wall led to unfavorable ventilation performance in comparison to the reference case. For all wind speeds above 0.1   V A , the configuration with the optimal angle of 30° was able to meet much higher ventilation requirements than what the ASHRAE 62.1 standard recommends.

Author Contributions

Conceptualization, P.N. and H.A.; Methodology, Y.F. and P.N.; Software, P.N. and Y.F.; Validation, P.N.; Writing—original draft, P.N., Y.F., M.S. and F.J.; Writing—review & editing, H.A. and C.V.; Supervision, H.A. and C.V.; Project administration, H.A. and C.V.; Funding acquisition, H.A. and C.V. All authors have read and agreed to the published version of the manuscript.

Funding

This research was supported by institutional funds from the Bauhaus-University Weimar, provided through the Research Operations Office within the scope of the Seed Financing Fund. The APC was funded by the Open Access Publication Fund of the Bauhaus-University Weimar and the Deutsche Forschungsgemeinschaft (DFG).

Data Availability Statement

Data are contained within the article.

Conflicts of Interest

The authors declare no conflict of interest.

References

  1. Xu, X.; Yu, H.; Sun, Q.; Tam, V.W.Y. A Critical Review of Occupant Energy Consumption Behavior in Buildings: How We Got Here, Where We Are, and Where We Are Headed. Renew. Sustain. Energy Rev. 2023, 182, 113396. [Google Scholar] [CrossRef]
  2. Afroz, Z.; Burak Gunay, H.; O’Brien, W. A Review of Data Collection and Analysis Requirements for Certified Green Buildings. Energy Build. 2020, 226, 110367. [Google Scholar] [CrossRef] [PubMed]
  3. Gomis, L.L.; Fiorentini, M.; Daly, D. Potential and Practical Management of Hybrid Ventilation in Buildings. Energy Build. 2020, 231, 110597. [Google Scholar] [CrossRef]
  4. Wu, Y.; Gao, N.; Niu, J.; Zang, J.; Cao, Q. Numerical Study on Natural Ventilation of the Wind Tower: Effects of Combining with Different Window Configurations in a Low-Rise House. Build. Environ. 2020, 188, 107450. [Google Scholar] [CrossRef]
  5. Harrouz, J.P.; Ghali, K.; Ghaddar, N.; Paul Harrouz, J.; Ghali, K.; Ghaddar, N. Integrated Solar—Windcatcher with Dew-Point Indirect Evaporative Cooler for Classrooms. Appl. Therm. Eng. 2021, 188, 116654. [Google Scholar] [CrossRef]
  6. Omrani, S.; Garcia-Hansen, V.; Capra, B.; Drogemuller, R. Natural Ventilation in Multi-Storey Buildings: Design Process and Review of Evaluation Tools. Build. Environ. 2017, 116, 182–194. [Google Scholar] [CrossRef]
  7. Calautit, J.K.; Hughes, B.R. Wind Tunnel and CFD Study of the Natural Ventilation Performance of a Commercial Multi-Directional Wind Tower. Build. Environ. 2014, 80, 71–83. [Google Scholar] [CrossRef]
  8. Afshin, M.; Sohankar, A.; Manshadi, M.D.; Esfeh, M.K. An Experimental Study on the Evaluation of Natural Ventilation Performance of a Two-Sided Wind-Catcher for Various Wind Angles. Renew. Energy 2016, 85, 1068–1078. [Google Scholar] [CrossRef]
  9. Ding, C.; Lam, K.P. Data-Driven Model for Cross Ventilation Potential in High-Density Cities Based on Coupled CFD Simulation and Machine Learning. Build. Environ. 2019, 165, 106394. [Google Scholar] [CrossRef]
  10. Gil-Baez, M.; Lizana, J.; Becerra Villanueva, J.A.; Molina-Huelva, M.; Serrano-Jimenez, A.; Chacartegui, R. Natural Ventilation in Classrooms for Healthy Schools in the COVID Era in Mediterranean Climate. Build. Environ. 2021, 206, 108345. [Google Scholar] [CrossRef]
  11. Fortenberry, C.; Walker, M.; Dang, A.; Loka, A.; Date, G.; Cysneiros de Carvalho, K.; Morrison, G.; Williams, B. Analysis of Indoor Particles and Gases and Their Evolution with Natural Ventilation. Indoor Air 2019, 29, 761–779. [Google Scholar] [CrossRef]
  12. Nejat, P.; Jomehzadeh, F.; Majid, Z.; Mohd Yusof, B.; Zeynali, I. Windcatcher as Sustainable Passive Cooling Solution for Natural Ventilation in Hot Humid Climate of Malaysia. IOP Conf. Ser. Mater. Sci. Eng. 2019, 620, 012087. [Google Scholar] [CrossRef]
  13. Carreto-Hernandez, L.G.; Moya, S.L.; Varela-Boydo, C.A.; Francisco-Hernandez, A. Numerical-Experimental Study of Mixed Convection in a Wind Tower-Room System. Build. Environ. 2023, 237, 110294. [Google Scholar] [CrossRef]
  14. Bahadori, M.N.N.; Mazidi, M.; Dehghani, A.R. Experimental Investigation of New Designs of Wind Towers. Renew. Energy 2008, 33, 2273–2281. [Google Scholar] [CrossRef]
  15. Sadeghi, M.; Wood, G.; Samali, B.; de Dear, R. Effects of Urban Context on the Indoor Thermal Comfort Performance of Windcatchers in a Residential Setting. Energy Build. 2020, 219, 110010. [Google Scholar] [CrossRef]
  16. Varela-Boydo, C.A.; Moya, S.L. Inlet Extensions for Wind Towers to Improve Natural Ventilation in Buildings. Sustain. Cities Soc. 2020, 53, 101933. [Google Scholar] [CrossRef]
  17. Bahadori, M.N.; Dehghani-sanij, A. Wind Towers: Architecture, Climate and Sustainability; Sayigh, A., Ed.; Springer: Berlin/Heidelberg, Germany, 2014; ISBN 3319058762. [Google Scholar]
  18. Vassella, C.C.; Koch, J.; Henzi, A.; Jordan, A.; Waeber, R.; Iannaccone, R.; Charrière, R. From Spontaneous to Strategic Natural Window Ventilation: Improving Indoor Air Quality in Swiss Schools. Int. J. Hyg. Environ. Health 2021, 234, 113746. [Google Scholar] [CrossRef]
  19. Chu, C.R.; Su, Z.Y. Natural Ventilation Design for Underground Parking Garages. Build. Environ. 2023, 227, 109784. [Google Scholar] [CrossRef]
  20. Kahkzand, M.; Deljouiee, B.; Chahardoli, S.; Siavashi, M. Radiative Cooling Ventilation Improvement Using an Integrated System of Windcatcher and Solar Chimney. J. Build. Eng. 2024, 83, 108409. [Google Scholar] [CrossRef]
  21. Carreto-Hernandez, L.G.; Moya, S.L.; Varela-Boydo, C.A.; Francisco-Hernandez, A. Studies of Ventilation and Thermal Comfort in Different Wind Tower-Room Configurations Considering Humidification for a Warm Climate of Mexico. J. Build. Eng. 2022, 46, 103675. [Google Scholar] [CrossRef]
  22. Nejat, P.; Calautit, J.K.; Majid, M.Z.A.; Hughes, B.R.; Zeynali, I.; Jomehzadeh, F. Wind Tunnel and Numerical Data on the Ventilation Performance of Windcatcher with Wing Wall. Data Brief 2016, 9, 448–452. [Google Scholar] [CrossRef] [PubMed]
  23. Nejat, P.; Hussen, H.M.; Fadli, F.; Chaudhry, H.N.; Calautit, J.; Jomehzadeh, F. Indoor Environmental Quality (IEQ) Analysis of a Two-Sided Windcatcher Integrated with Anti-Short-Circuit Device for Low Wind Conditions. Processes 2020, 8, 840. [Google Scholar] [CrossRef]
  24. Nejat, P.; Fekri, Y.; Gohari, M.; Alsaad, H.; Voelker, C. Short-Circuiting Reduction in Windcatchers: Shape Effect of Anti-Short-Circuit Device. In Proceedings of the BauSim Conference 2022: 9th Conference of IBPSA-Germany and Austria; IBPSA-Germany and Austria, Weimar, Germany, 20–22 September 2022; Volume 9. [Google Scholar]
  25. Nejat, P.; Salim Ferwati, M.; Calautit, J.; Ghahramani, A.; Sheikhshahrokhdehkordi, M. Passive Cooling and Natural Ventilation by the Windcatcher (Badgir): An Experimental and Simulation Study of Indoor Air Quality, Thermal Comfort and Passive Cooling Power. J. Build. Eng. 2021, 41, 102436. [Google Scholar] [CrossRef]
  26. Franke, J.; Hellsten, A.; Schlünzen, H.; Carissimo, B. COST Action 732, Best Practice Guideline for the CFD Simulation of Flows in The Urban Environment; University of Hamburg: Hamburg, Germany, 2007. [Google Scholar]
  27. Alsailani, M.; Montazeri, H.; Rezaeiha, A. Towards Optimal Aerodynamic Design of Wind Catchers: Impact of Geometrical Characteristics. Renew. Energy 2021, 168, 1344–1363. [Google Scholar] [CrossRef]
  28. Montazeri, H.; Montazeri, F. CFD Simulation of Cross-Ventilation in Buildings Using Rooftop Wind-Catchers: Impact of Outlet Openings. Renew. Energy 2018, 118, 502–520. [Google Scholar] [CrossRef]
  29. Zaki, A.; Richards, P.; Sharma, R. Analysis of Airflow inside a Two-Sided Wind Catcher Building. J. Wind Eng. Ind. Aerodyn. 2019, 190, 71–82. [Google Scholar] [CrossRef]
  30. Esfeh, M.K.; Sohankar, A.; Shahsavari, A.R.; Rastan, M.R.; Ghodrat, M.; Nili, M. Experimental and Numerical Evaluation of Wind-Driven Natural Ventilation of a Curved Roof for Various Wind Angles. Build. Environ. 2021, 205, 108275. [Google Scholar] [CrossRef]
  31. Varela-Boydo, C.A.; Moya, S.L.; Watkins, R. Analysis of Traditional Windcatchers and the Effects Produced by Changing the Size, Shape, and Position of the Outlet Opening. J. Build. Eng. 2021, 33, 101828. [Google Scholar] [CrossRef]
  32. Tominaga, Y.; Mochida, A.; Yoshie, R.; Kataoka, H.; Nozu, T.; Yoshikawa, M.; Shirasawa, T. AIJ Guidelines for Practical Applications of CFD to Pedestrian Wind Environment around Buildings. J. Wind Eng. Ind. Aerodyn. 2008, 96, 1749–1761. [Google Scholar] [CrossRef]
  33. Richards, P.J.; Hoxey, R.P. Appropriate Boundary Conditions for Computational Wind Engineering Models Using the K-ϵ Turbulence Model. J. Wind Eng. Ind. Aerodyn. 1993, 46, 145–153. [Google Scholar] [CrossRef]
  34. Berlin Climate, Weather by Month, Average Temperature (Germany)—Weather Spark. Available online: https://weatherspark.com/y/75981/Average-Weather-in-Berlin-Germany-Year-Round (accessed on 8 September 2023).
  35. Ferziger, J.H. Computational Methods for Fluid Dynamics, 3rd ed.; Perić, M., Ed.; Springer: Berlin/Heidelberg, Germany, 2002. [Google Scholar]
  36. Blocken, B.; Stathopoulos, T.; Carmeliet, J.; Blockena, B.; Stathopoulosb, T.; Carmelieta, J. CFD Simulation of the Atmospheric Boundary Layer: Wall Function Problems. Atmos. Environ. 2007, 41, 238–252. [Google Scholar] [CrossRef]
  37. Moosavi, L.; Zandi, M.; Bidi, M.; Behroozizade, E.; Kazemi, I. New Design for Solar Chimney with Integrated Windcatcher for Space Cooling and Ventilation. Build. Environ. 2020, 181, 106785. [Google Scholar] [CrossRef]
  38. Sadeghi, H.; Kalantar, V. Performance Analysis of a Wind Tower in Combination with an Underground Channel. Sustain. Cities Soc. 2018, 37, 427–437. [Google Scholar] [CrossRef]
  39. Benkari, N.; Fazil, I.; Husain, A. Design and Performance Comparison of Two Patterns of Wind-Catcher for a Semi-Enclosed Courtyard. Int. J. Mech. Eng. Robot. Res. 2017, 6, 396–400. [Google Scholar] [CrossRef]
  40. Nejat, P.; Calautit, J.K.; Fekri, Y.; Sheikhshahrokhdehkordi, M.; Alsaad, H.; Voelker, C. Influence of Terrain and Atmospheric Boundary Layer on the Ventilation and Thermal Comfort Performance of Windcatchers. J. Build. Eng. 2023, 73, 106791. [Google Scholar] [CrossRef]
  41. ASHRAE Standard 62.1; Ventilation for Acceptable Indoor Air Quality. American Society of Heating, Refrigerating and Air-Conditioning Engineers, Inc.: Atlanta, GA, USA, 2019.
  42. Dehghan, A.A.A.; Esfeh, M.K.; Manshadi, M.D. Natural Ventilation Characteristics of One-Sided Wind Catchers: Experimental and Analytical Evaluation. Energy Build. 2013, 61, 366–377. [Google Scholar] [CrossRef]
Figure 1. The size and components of the model and α, the angle of UWW (a) dimensions are in cm and the generated mesh (b).
Energies 17 00611 g001
Figure 2. Mesh independence along the vertical line in inlet channel (left). Dimensions are in mm. The results of different mesh sizes from 1.5 million to 9 million (right).
Energies 17 00611 g002
Figure 3. Comparison between the CFD results and the experimental data.
Energies 17 00611 g003
Figure 4. The supplied airflow rates for the different UWW angles.
Energies 17 00611 g004
Figure 5. The air change rate per hour (ACH) for the different UWW angles.
Energies 17 00611 g005
Figure 6. The average values of the MAA of the vertical cross-sectional plane for the different UWW angles (left) and contour of the mean age of air (seconds) in the cross-sectional vertical plane for the 30° UWW (right).
Energies 17 00611 g006
Figure 7. Contours of velocity magnitude (left) and static pressure along with streamlines (right) in the vertical plane (X = 0) of the model for the different UWW angles.
Energies 17 00611 g007
Figure 8. The values of airflow rate for the optimal angle (30°) and under different wind speeds.
Energies 17 00611 g008
Figure 9. ACH for the optimal angle (30°) and under different wind speeds.
Energies 17 00611 g009
Figure 10. Velocity magnitude contours at the head height of a seated occupant under different wind speeds.
Energies 17 00611 g010
Figure 11. The average values of the velocity magnitude in the horizontal plane positioned at the head height of a seated occupant under different wind speeds.
Energies 17 00611 g011
Figure 12. The contours of dead zone areas at a seated person’s head height under different outdoor wind speeds.
Energies 17 00611 g012
Disclaimer/Publisher’s Note: The statements, opinions and data contained in all publications are solely those of the individual author(s) and contributor(s) and not of MDPI and/or the editor(s). MDPI and/or the editor(s) disclaim responsibility for any injury to people or property resulting from any ideas, methods, instructions or products referred to in the content.

