Article

Expectations for the Role of Hydrogen and Its Derivatives in Different Sectors through Analysis of the Four Energy Scenarios: IEA-STEPS, IEA-NZE, IRENA-PES, and IRENA-1.5°C

College of Engineering, University of Buraimi, Al Buraimi 512, Oman
Energies 2024, 17(3), 646; https://doi.org/10.3390/en17030646
Submission received: 11 January 2024 / Revised: 24 January 2024 / Accepted: 27 January 2024 / Published: 30 January 2024
(This article belongs to the Special Issue Climate Change and Sustainable Energy Transition)

Abstract

:
Recently, worldwide, the attention being paid to hydrogen and its derivatives as alternative carbon-free (or low-carbon) options for the electricity sector, the transport sector, and the industry sector has increased. Several projects in the field of low-emission hydrogen production (particularly electrolysis-based green hydrogen) have either been constructed or analyzed for their feasibility. Despite the great ambitions announced by some nations with respect to becoming hubs for hydrogen production and export, some quantification of the levels at which hydrogen and its derived products are expected to penetrate the global energy system and its various demand sectors would be useful in order to judge the practicality and likelihood of these ambitions and future targets. The current study aims to summarize some of the expectations of the level at which hydrogen and its derivatives could spread into the global economy, under two possible future scenarios. The first future scenario corresponds to a business-as-usual (BAU) pathway, where the world proceeds with the same existing policies and targets related to emissions and low-carbon energy transition. This forms a lower bound for the level of the role of hydrogen and its penetration into the global energy system. The second future scenario corresponds to an emission-conscious pathway, where governments cooperate to implement the changes necessary to decarbonize the economy by 2050 in order to achieve net-zero emissions of carbon dioxide (carbon neutrality), and thus limit the rise in the global mean surface temperature to 1.5 °C by 2100 (compared to pre-industrial periods). This forms an upper bound for the level of the role of hydrogen and its penetration into the global energy system. The study utilizes the latest release of the annual comprehensive report WEO (World Energy Outlook—edition year 2023, the 26th edition) of the IEA (International Energy Agency), as well as the latest release of the annual comprehensive report WETO (World Energy Transitions Outlook—edition year 2023, the third edition) of the IRENA (International Renewable Energy Agency). For the IEA-WEO report, the business-as-usual situation is STEPS (Stated “Energy” Policies Scenario), and the emissions-conscious situation is NZE (Net-Zero Emissions by 2050). For the IRENA-WETO report, the business-as-usual situation is the PES (Planned Energy Scenario), and the emissions-conscious situation is the 1.5°C scenario. Through the results presented here, it becomes possible to infer a realistic range for the production and utilization of hydrogen and its derivatives in 2030 and 2050. In addition, the study enables the divergence between the models used in WEO and WETO to be estimated, by identifying the different predictions for similar variables under similar conditions. The study covers miscellaneous variables related to energy and emissions other than hydrogen, which are helpful in establishing a good view of how the world may look in 2030 and 2050. Some barriers (such as the uncompetitive levelized cost of electrolysis-based green hydrogen) and drivers (such as the German H2Global initiative) for the hydrogen economy are also discussed. The study finds that the large-scale utilization of hydrogen or its derivatives as a source of energy is highly uncertain, and it may be reached slowly, given more than two decades to mature. Despite this, electrolysis-based green hydrogen is expected to dominate the global hydrogen economy, with the annual global production of electrolysis-based green hydrogen expected to increase from 0 million tonnes in 2021 to between 22 million tonnes and 327 million tonnes (with electrolyzer capacity exceeding 5 terawatts) in 2050, depending on the commitment of policymakers toward decarbonization and energy transitions.

1. Introduction

1.1. Energy-Emission Modeling

Due to the anthropogenic emissions of greenhouse gases (GHG), particularly carbon dioxide (CO2), the global average surface (both land and sea) temperature of the earth has increased; and this rise reached about 1.2 °C in 2020 compared to 1850 as a baseline for the pre-industrial periods [1,2,3,4,5]. In relation to this, the global average atmospheric CO2 concentration in 2020 reached 415 ppm (parts per million), compared to its pre-industrial level of 285 ppm, in around 1850 [6]. When the average temperature increases by an amount, the local temperature (especially on the land rather than the sea) may actually increase by a multiple of that amount. Thus, the relatively small amount of the average surface temperature rise can be misleading in terms of describing the size of the global warming problem [7,8], which extends to the broader problem of climate change through the altered pattern of other climate variables besides temperature [9]. In order to properly combat the CO2 emissions that cause global warming, it is important to understand the dependence of these CO2 emissions on their source activities, such as electricity generation and industrial processes. Through long-term global predictive models, the energy-emissions nexus can be understood [10].

1.2. IEA-WEO

The International Energy Agency (IEA) adopted the Global Energy and Climate (GEC) model as a large-scale simulation tool to replicate how energy markets function, and to generate detailed long-term scenarios for the global energy system as well as its dependent emissions. The IEA’s GEC model replaced (in 2021) a couple of older models that used to be implemented in parallel to each other, which are the IEA’s World Energy Model (WEM), and the IEA’s Energy Technology Perspectives (ETP) model [11]. The specific energy-emissions scenarios (or pathways) covered by the GEC include (1) the Stated Policies Scenario, or Stated Energy Policies Scenario (STEPS), (2) Announced Pledges Scenario (APS), and (3) the Net-Zero Emissions by 2050 Scenario (NZE). STEPS predicts the direction of energy system progression assuming that the current policies remain in action and no additional mitigating changes are seriously taken to curb climate change by limiting energy-based and process-based emissions [12]. This type of forecasting that has a clear starting point and a clear assumption that guides the progression path but does not aim to reach a specific target is described as “exploratory”. The additional IEA energy-emissions pathway (Announced Pledges Scenario, APS) was introduced in 2021. It can be viewed as an intermediate scenario between STEPS and NZE. It is an exploratory forecasting model (like STEPS), but its assumption is that all the announced major national ambitions and targets (such as net zero “carbon neutrality” pledges) are fulfilled on time [13]. In the current study, APS is not covered because the two other limiting pathways of STEPS and NZE are more relevant to the aims of the study’s aims. On the other hand, NZE shows a predicted set of changes for the global energy sector that enables reaching the global target of net zero CO2 emissions by 2050. Additionally, NZE is consistent with limiting the global average temperature rise to 1.5 °C, with at least a 50% probability [14]. This type of forecasting that has a clear starting point and a clear end point (target), and predicts a path to reach that target is described as “normative”. The World Energy Outlook (WEO) is an annual public report published by IEA, where modeling is used to provide in-depth analysis for different aspects of the global energy system. Although an edition of WEO was published in 1977, it became a regular annual publication in 1998 [15,16]. Thus, the first edition is considered here to be the first one in the series form, which is the 1998 edition. Thus, the 2023 edition (released in October 2023) of IEA’s WEO is considered here as the 26th edition. It was the latest edition at the time of preparing the current study [17].

1.3. IRENA-WETO

The International Renewable Energy Agency (IRENA) launched an annual report series in 2021, which is titled World Energy Transitions Outlook (WETO). Thus, WETO-2021 was the first edition, while WETO-2023 was the third edition, and was the latest edition at the time of preparing the current study [18]. In its third edition, the WETO publication was divided into two volumes, with volume 1 focusing on progress across all energy sectors, and suggesting (based on available technologies) a set of actions that should be implemented by 2030 in order to limit the global average temperature rise to 1.5 °C by 2100 (relative to pre-industrial levels), by achieving net-zero CO2 emissions (carbon neutrality) by 2050. Volume 2 of WETO-2023 is based on econometric modeling by IRENA, and it focuses on the socio-economic impacts of the proposed IRENA-1.5°C pathway, compared to current policy settings, which are referred to as the Planned Energy Scenario (PES) by IRENA. Thus, volume 1 of WETO-2023 aims to address the technological and regulatory aspects of the energy transition, while volume 2 of WETO-2023 focuses its attention on the socio-economic implications of such an energy transition (such as its effect on employment and on welfare). In the present study, only volume 1 is covered, because volume 2 is outside the scope of the study. It might be useful to add that WETO-2021, WETO-2022, and WETO-2023 (volume 1 only) were made available in an interactive online version in addition to the offline version (in the form of a PDF document). WETO-2021 was released in June 2021, WETO-2022 was released in March 2022, volume 1 of WETO-2023 was released in June 2023, and volume 2 of WETO-2023 was released in November 2023.

1.4. Hydrogen and Its Derived Products as Alternative Energy Carriers

While hydrogen and its derived synthetic fuels (or e-fuels, or electrofuels) do not currently represent a significant portion of the global energy market, efforts have been made toward more exploitation of these emerging energy carriers (particularly for environmental reasons) and thus to establish a large-scale hydrogen economy with alternatives to conventional fossil fuels [19,20,21,22,23,24,25].
Hydrogen can be produced in a clean way that releases no (or little) CO2 emissions. Electrolysis-based green hydrogen requires electricity to power water electrolyzers that split water into molecular hydrogen and molecular oxygen. The electricity should be from a renewable energy source, such as solar energy or wind energy, in order for the produced hydrogen to qualify as green [26,27,28,29]. Furthermore, products derived from green hydrogen can also be described as green (or electricity-based); such as green ammonia (or e-ammonia); green methanol (or e-methanol); and green kerosene (or e-kerosene), which may also be called e-SAF: electricity-based sustainable aviation fuel [30,31]. Blue hydrogen is produced from a fossil fuel, but with reduced CO2 emissions through a carbon capture technology. Environmentally, electrolysis-based green hydrogen is a preferable option to blue hydrogen, where indirect CO2 emissions due to the extraction of the feedstock fossil fuels are unavoidable [32]. On the other hand, green hydrogen is more expensive than blue hydrogen, although this may be reversed if green hydrogen electrolyzers and renewable energy costs for powering these electrolyzers drop sufficiently in the future [33,34].
Applications of hydrogen and its derived products include electricity generation via fuel cells [35], electricity generation via gas turbines [36], fuel-cell electric vehicles—FCEVs [37], fuel-cell electric unmanned aerial vehicles—UAVs [38], iron industry through direct reduction iron—DRI [39], oil refining [40], ammonia (NH3) production via the power-to-liquid (PtL) concept [41,42], alternative synthetic non-fossil fuels derived from electrolysis-based green hydrogen (via PtL, PtG, PtX) like e-methane or e-kerosene [43,44,45,46,47,48], and electricity storage by combining electrolyzers for hydrogen production and fuel cells for subsequent electricity production at the time of demand [49].
The combustion of hydrogen (or its dissociation followed by oxidation in PEM fuel cells) does not release any carbon dioxide, which is an environmental advantage over any carbonaceous fuel [50,51,52,53]. The replacement of fossil fuels with hydrogen (like replacing natural gas with gaseous hydrogen for heating homes and for cooking, or replacing gasoline/petrol with hydrogen for cars) helps to mitigate direct CO2 emissions, which in turn helps to stop global warming and support sustainability [54,55,56,57]. Such decarbonization (even at a partial level) of the energy sector or the building sector improves the outdoor environment quality, and consequently the indoor environment quality [58,59,60,61,62].

1.5. Barriers to a Large Global Hydrogen Economy

Despite the apparently attractive shift toward hydrogen and its derivatives (in the electricity sector, the transport sector, the industry sector, and the building sector), expansion in the utilization of hydrogen and its derivatives is hampered by some barriers that need to be addressed before the investment in hydrogen and its products can be accelerated globally [63,64,65,66,67].
One of the barriers to a large-scale hydrogen economy is the relative high cost per unit energy of hydrogen compared to other conventional fuels. Based on the lower heating value (LHV), 1 kg of hydrogen has 120 MJ or 33.3 kWh [68,69]. On the other hand, gasoline (petrol) has a volumetric LHV (its LHV-based volumetric energy density) of 32.4 MJ/L or 9.00 kWh/L [70,71] and a gravimetric LHV of 43.0 MJ/kg or 11.9 kWh/kg (with a similar value for diesel fuel) [72,73]. Thus, for energy equivalence, 1 kg of hydrogen (1 kg H2) can replace 2.79 kg of gasoline or 3.70 L, which is approximately 1 U.S. gallon [74]. Based on recent data, the price of 1 U.S. gallon of regular gasoline in the USA is nearly USD 3.1 [75]. Thus, 1 kg H2 should be sold at this rate in order to be both economically and thermally equivalent to gasoline. In the Sultanate of Oman, the recent price of gasoline is nearly 0.23 OMR/L [76]. Thus, 1 kg H2 should be sold at a price of OMR 0.85 (less than 1 Omani rial) in order to be both economically and thermally equivalent to gasoline. The levelized cost of hydrogen (LCOH) largely depends on the country, the hydrogen production technology, and the hydrogen production capacity [77,78]. However, recent studies suggest that for electrolysis-based green hydrogen, LCOH may be in the range of USD 1.35–7.7 globally [79,80], RMB 16.4–51.8 (or USD 2.3–7.3, assuming a rate of 7.10 RMB/USD) in China [81,82], OMR 2.17 (or USD 5.63, assuming a rate of 2.60 USD/OMR) in Oman [83], and EUR 1.0 (or USD 1.1 assuming a rate of 1.1 USD/EUR in the Atacama Desert, Chile or EUR 2.7 (or USD 3.0 assuming a rate of 1.1 USD/EUR) in Helsinki, Finland [84,85]. It is expected that the production costs of hydrogen will fall in the future, due to the increase in the manufacturing scale of the electrolyzers, the maturity of the electrolyzers’ supply chains, and the decline in the cost of renewable electricity to power the electrolyzers [86,87,88]. However, the listed costs do not suggest that hydrogen is globally competitive compared to conventional fuels, but that the gap is not dramatic. Green hydrogen is more expensive than blue hydrogen (about twice or thrice the cost), which is partly due to the cost of the renewable electricity required for powering the electrolyzers, and partly due to the cost of the electrolysis system that consists of the electrolyzers and their auxiliary components, such as cooling units [89].
A second barrier to the hydrogen economy is the high water consumption of hydrogen production (regardless of the technology); such as the water required to supply electrolysis, steam in a steam reforming, liquid coolant, or for the auxiliary carbon capture, utilization and storage (CCUS) process. For example, PEM-based electrolysis may consume 17.5 L of water, and require about 8.2 L of additional recirculating water to produce 1 kg H2. Alkaline-based electrolysis may consume 22.3 L of water, and require about 9.9 L of additional recirculating water to produce 1 kg H2. Natural gas steam-methane reforming (SMR) combined with CCUS may consume 32.2 L of water, and require about 4.5 L of additional recirculating water to produce 1 kg H2. Without CCUS, the water requirements for the SMR of natural gas may drop from 32.2 L to 17.5 L (consumption) and from about 4.5 L to about 2.5 L (reuse). Coal gasification with CCUS may consume 49.4 L of water, and require about 30.8 L of additional recirculating water to produce 1 kg H2. Without CCUS, the water requirements for coal gasification drop from 49.4 L to 31.0 L (consumption) and from about 30.8 L to about 18.8 L (reuse) [90,91,92]. This matter can be specifically important for countries with limited access to renewable potable water. Despite this apparent concern, a recent study [93] showed that if only electrolysis-based green hydrogen is produced (no blue hydrogen, thus no water-consuming carbon capture and storage—CCS), then globally there should be no water problem even if the global production of hydrogen reaches 2300 Mt H2/yr, with a negligible amount of water consumed relative to the amount of water available. It should be noted that the study mentioned assumed that 1 kg H2 requires only 9 kg of water (consumption). This is just the theoretical demand based on stoichiometric (perfect) splitting of water, with zero water loss and with zero additional water needs for auxiliary operations. Therefore, this study assumed that the global water demand for hydrogen production does not exceed about 20,500 Mt of freshwater (or 20.5 billion m3 of freshwater) per year.
A third barrier that hinders the rapid growth of the hydrogen economy is the lack of an adequate governmental regulatory framework for low-emission hydrogen and its derivatives (as relatively new commodities). This barrier is related to licensing and coordination with local authorities for hydrogen production projects and the related infrastructure, such as hydrogen pipelines and hydrogen storage facilities. This barrier is also concerned with establishing internationally recognized standards for the export/import of hydrogen and its derivatives, certification of the hydrogen grade, clearly defining what low-emission hydrogen (or clean hydrogen or sustainable hydrogen) is, and international trade of not only hydrogen and its derivatives but also electrolyzers and equipment for electricity generation using renewable energy [94,95,96].
There are minor issues that affect the growth of the hydrogen economy, such as the safety concerns regarding the handling of hydrogen [97,98,99,100]. Hydrogen is a flammable gas that has the most hazardous flammability level (level 4) in the National Fire Protection Association (NFPA) 704 diamond classification. This level indicates a substance that burns readily at atmospheric pressure and normal ambient temperature [101]. Another issue is building sufficient competence and specialized skills to ensure qualified personnel are available to work in the various stages of the hydrogen supply chain, from the production to the end-use [102,103]. Increasing public awareness and acceptance of the transition to hydrogen and its derivatives is a third issue, where people’s behavior should adapt to the alternatives provided by hydrogen and its derivatives. This includes, for example, the use of a hydrogen refueling station (HRS) instead of a traditional gas station (petrol station), and the willingness to choose a fuel-cell electric vehicle rather than a conventional gasoline vehicle [104,105].

1.6. Drivers for a Large Global Hydrogen Economy

Despite the mentioned barriers, there are also drivers that encourage the development of a hydrogen economy. Such hydrogen economy drivers include the formal or voluntary aims to adopt environmentally friendly solutions with emissions mitigation, and local (national) incentives or subsidies [106,107]. The H2Global Foundation (“H2Global Stiftung” in German) is an international incentivizing scheme to accelerate a global hydrogen market. Through the H2Global funding instruments, large electrolysis-based green hydrogen production projects outside the European Union (EU) can apply for a 10-year fixed-price hydrogen purchase agreement (HPA) where they guarantee they can market their green hydrogen-derived product to the German government-backed off-taker company HINT.CO (Hydrogen Intermediary Network Company GmbH), which is a subsidiary of the German non-profit project H2Global Foundation. HINT.CO acts as an intermediary, by purchasing hydrogen-derived products (lot 1: green ammonia, lot 2: green methanol, lot 3: green kerosene or electricity-based sustainable aviation fuel—e-SAF) from a supplier outside the EU through auction-based HPAs, and then selling that green hydrogen product in Germany or another EU country through auction-based hydrogen sales agreements (HSAs), whose duration is limited to a maximum of 1 year. The operation of HINT.CO resembles the Contracts for Difference (CfD) or the Carbon Contracts for Difference (CCfD) approach [108,109], with the difference between the supply prices (including both the production stage and the transport stage) and the demand prices is offset by available grants. The H2Global Foundation was established in June 2021. It was financially supported by the Federal Ministry for Economic Affairs and Energy in Germany (BMWi: Bundesministerium für Wirtschaft und Energie), which in December 2021 became the Federal Ministry for Economic Affairs and Climate Action (BMWK: Bundesministerium für Wirtschaft und Klimaschutz). The German ministry provides the necessary financial aid to cover any gap between the selling price of the green hydrogen product (in EU) and the production cost of it (outside the EU). The initial governmental funding grant in 2021 was EUR 900 million [110,111]. In the first HPA tender (started 30 November 2022), only green ammonia (lot 1) was demanded, and the 10 contract years were 2024–2033 [112].

2. Aims and Contributions of the Study

The primary aim of the current study is to describe the expected size of the hydrogen role in the future, within the energy economy in general and in specific sectors such as the transport sector, by analyzing the latest outlook reports (the 2023 edition) of IEA and IRENA. This helps in answering questions like:
  • Can low-carbon hydrogen and its derivatives totally replace conventional fuels?
  • Which hydrogen type/color (particularly, either green hydrogen or blue hydrogen) is expected to dominate low-carbon hydrogen production?
The second aim of the current study is to assess the gap between the future predictions of the energy models by IEA and IRENA, when similar sets of assumptions are implied. In particular, this aim is about identifying the prediction dissimilarity between IEA-STEPS and IRENA-PES, and between IEA-NZE and IRENA-1.5°C.
The third and final aim of the current study is to present miscellaneous forecasting data related to various variables in the global energy system, as well as the CO2 emissions, for 2030 or 2050.
The above stated aims are also viewed as the contributions made by the current study to the broad fields of hydrogen energy, energy transition, and emissions forecasting.
Dillman and Heinonen [113] described the development of the hydrogen economy as being largely unknown. They used the 2021 edition of WEO, whereas the present study uses the updated edition of 2023, and thus it is contributing to the previous research conducted about that topic. Dillman et al. [114] reported a socio-technical transition study of the mobility sector in Iceland. The aim was to study temporal changes and associated sustainability outcomes. Their work reflects a comprehensive analysis but it is mainly in the form of a case study (one country and one sector). In contrast, the current study addresses global developments and in multiple sectors. Wang et al. [115] warned against environmental degradation as a consequence of intensified global economic activities, and how this can largely affect the sustainable development goals (SDGs). Their findings provided policy recommendations for improving sustainable development. Their study focused on 36 OECD (Organisation for Economic Co-operation and Development) countries, while the current study covers global performance metrics. Their study did not dedicate a big part specifically to hydrogen and its derivatives, while the current study does that. So, the current study is considered to be contributing to the field of sustainable development and SDGs at a global level, and with emphasis on the nascent hydrogen energy. Other researchers performed a number of studies [116,117,118,119,120] that included using a modified linear ordinary least squares (OLS) model and a non-linear panel threshold regression (NPTR) model to investigate how foreign direct investment (FDI) and trade openness influence carbon neutrality, through economic growth with limited carbon dioxide emissions. Their work was geographically broad, covering 114 countries. The current study also covers carbon neutrality from multiple perspectives, including the region-to-region low-carbon hydrogen trade, which was not covered in their work. In addition, the current study compares the pathway to carbon neutrality as recommended by different models, which was not mentioned in their work. Zheng et al. [121] proposed a roadmap for hydrogen development in the coastal Chinese province “Guangdong”, and it can be applied in other regions. They discussed the technical maturity of five methods for hydrogen production, namely as industrial byproducts, from coal, using wind energy, using hydropower, and using solar photovoltaic (PV) energy. In the current study, electrolysis-based green hydrogen is treated as one type of hydrogen, irrespective of the exact renewable energy used in producing it. This is a preferred simplified approach, where specifying additional details about the exact energy source type becomes undesired as it does not strongly serve the aims of the current study. Again, the current study gives a global overview, rather than treating a case in a certain geographic location. Hassan et al. [122] studied the integration of green hydrogen into different sectors, including power generation, industry, and transport. They emphasized the ability of green hydrogen to decarbonize carbon-intensive activities, by reducing the use of fossil fuels. Their work does not include an assessment of IEA and IRENA forecasting models, as performed in the current work, making the present study useful in providing novel findings.

3. Research Method

The current study relies on the analysis of existing data. However, as a result of the data processing, novel sets of results are derived from the collected raw data through careful data curation, data inspection and validation, deriving new data through mathematical processes, extracting data from published charts by digitizing them, and preparing customized tables and charts that particularly fit the aims of the study. In addition, many resources in the literature were used for auxiliary purposes, such as for discussing barriers and drivers with regard to clean or low-emission hydrogen advancement.
Although the raw data came mostly from two sources, namely: the IEA’s WEO-2023 report and the IRENA’s WETO-2023 report (a small portion was taken from data released by IEA, made available through its “Data and Statistics” online portal); this should not be considered a drawback. It is actually aligned with the scope of the study; whose second aim is to identify the gap between the two sources when describing a similar quantity. In addition, either annual report is considered a comprehensive flagship publication issued by a reputable expert organization with a worldwide scope of interests. This reduces concerns about the reliability of the raw data. There are various published works in the literature that followed a similar research method and utilized WEO data in their findings [123,124,125,126], and this further justifies the method followed here. In addition, having many sources of raw data may raise problems of discrepancies and ambiguity of terminology. In fact, this matter was faced here even with only two sources. For example, the use of “low-emissions hydrogen” (by IEA) versus the use of “clean hydrogen” (by IRENA). The term LCH (low-carbon hydrogen) is thus used here as a generalized term that can refer to either of those two terms. Finally, the use of raw data issued by international organizations (rather than local research groups) enabled access to global data not focusing on a particular country or region. All the data presented in the coming parts are thus global, which is considered a favored feature in the current study.

4. Results (Part 1 of 4): Non-Hydrogen Common Quantities in IEA and IRENA
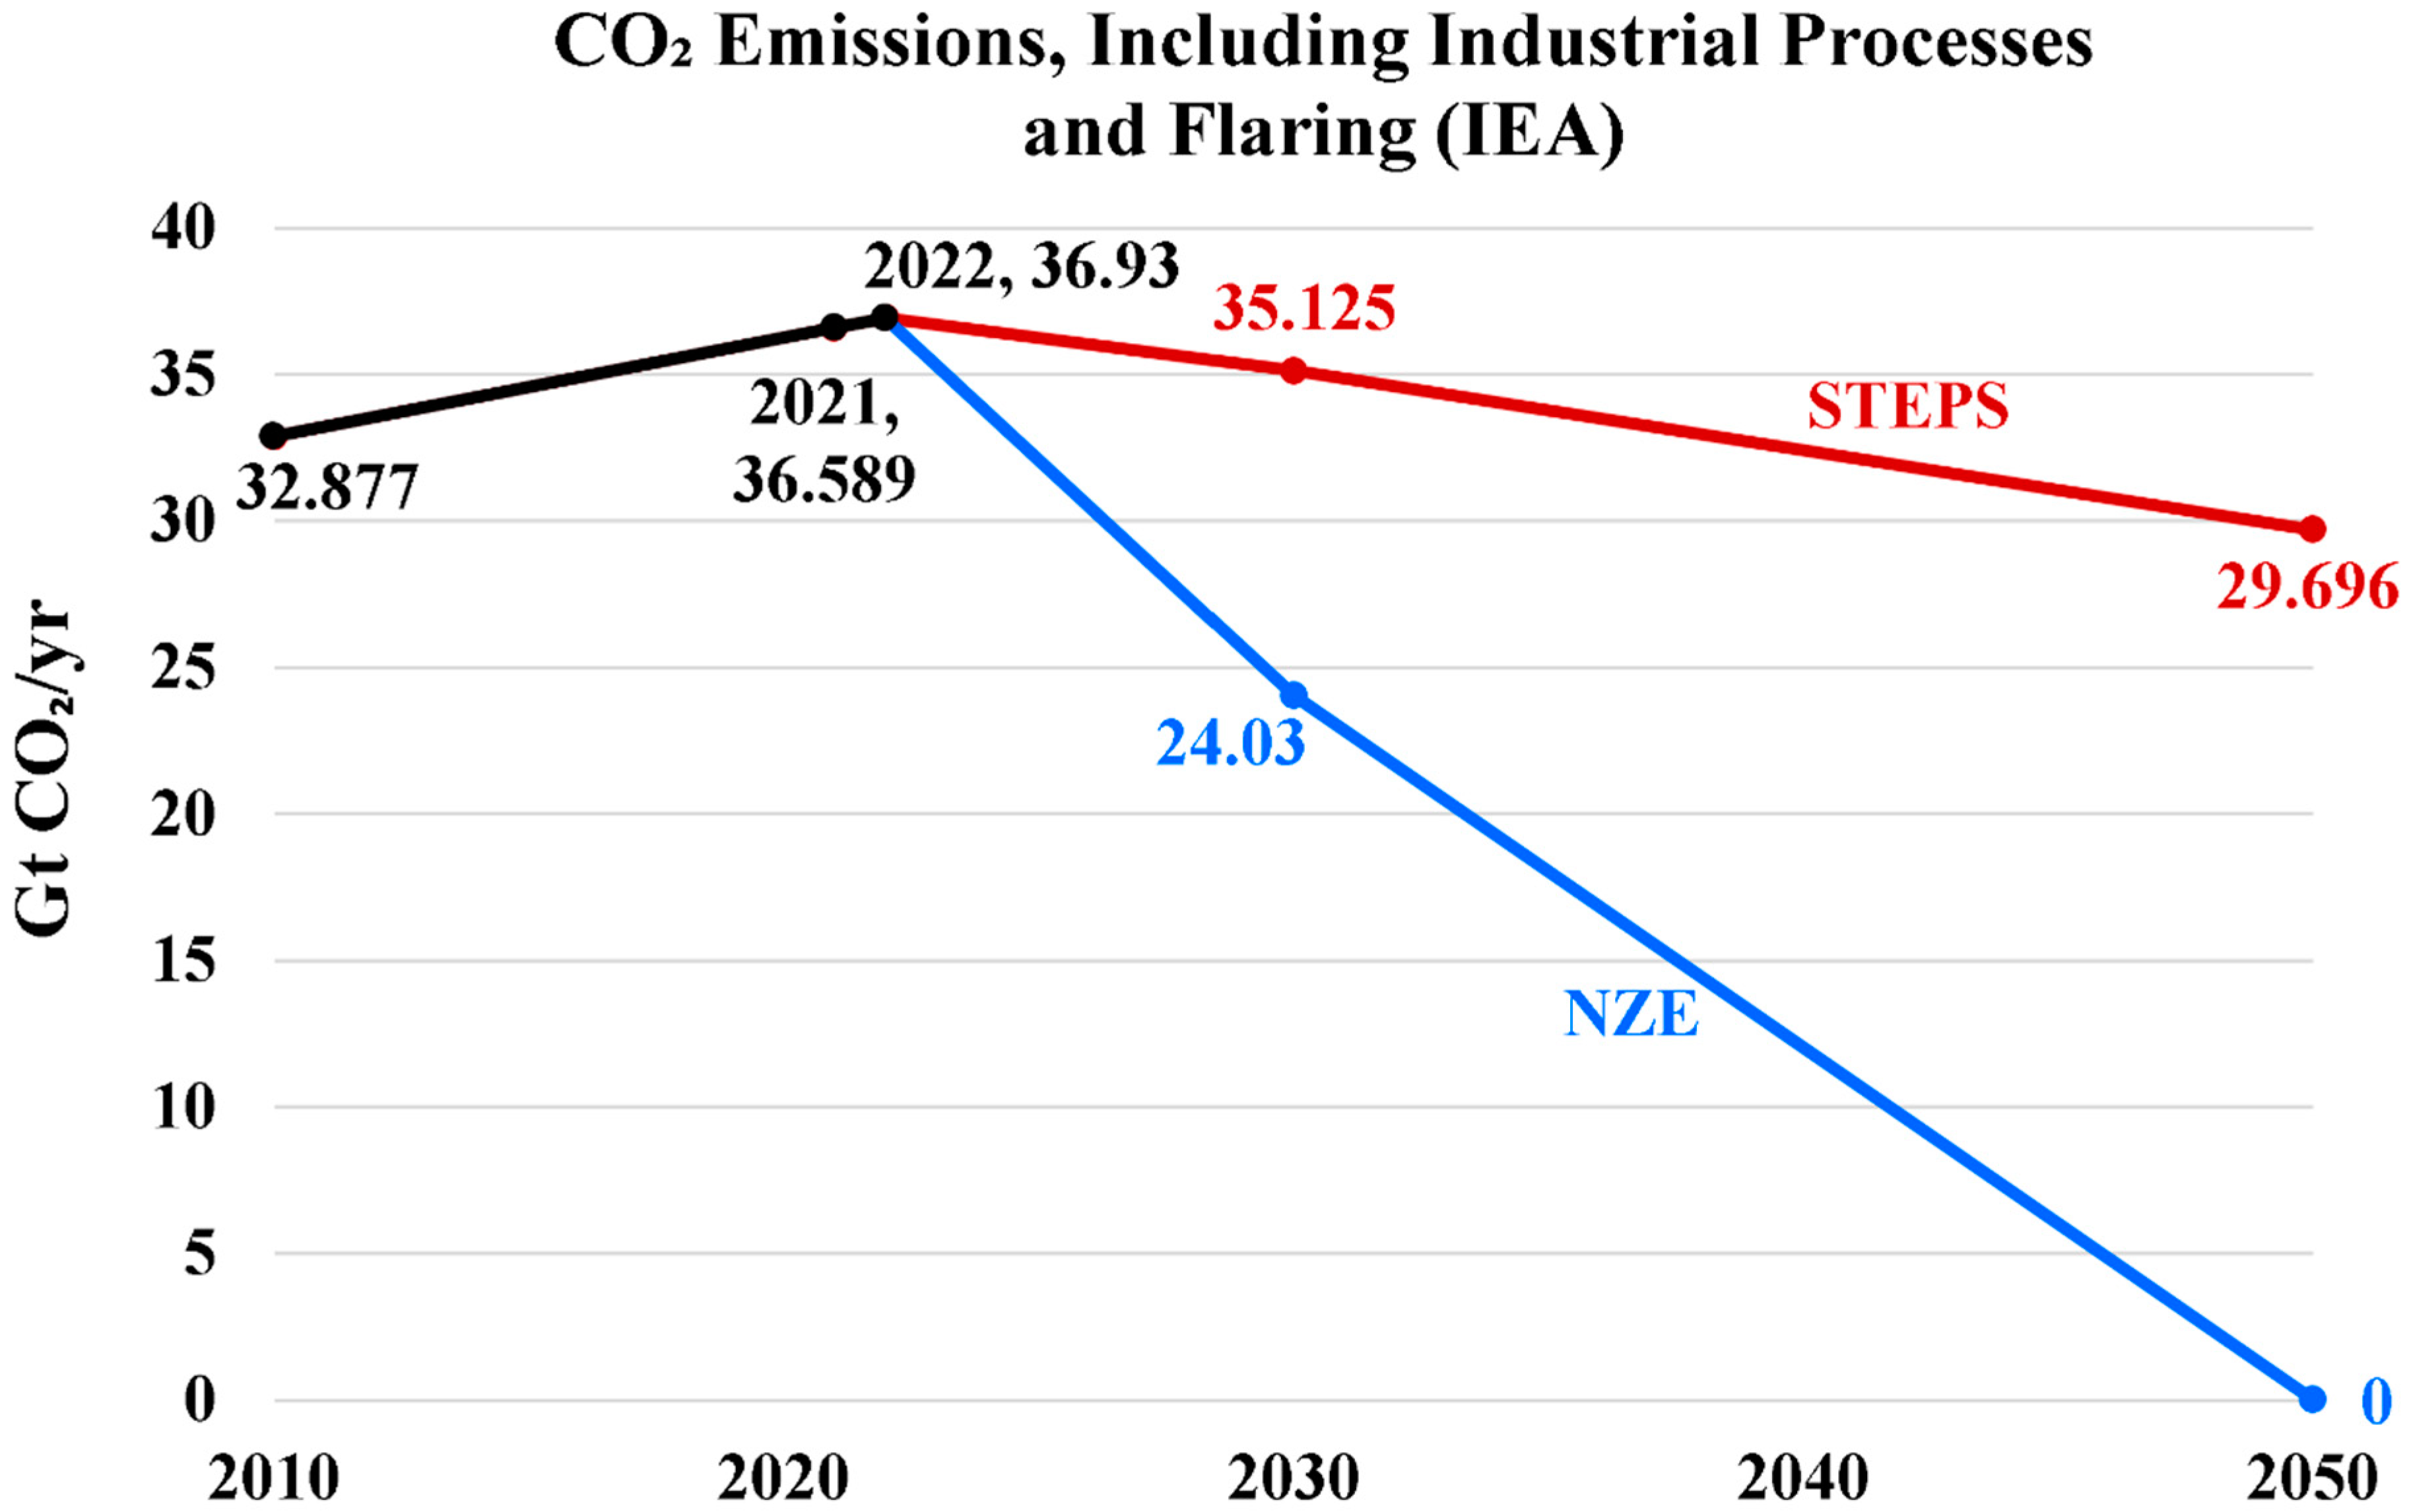
In this part, some data that appear commonly in IEA and IRENA reports are presented together. This facilitates the identification of any differences in the reported predictions. There are four quantities covered in this part, which are: (1) global carbon dioxide emissions, (2) global electric-energy generation, (3) global electric-power generation capacity, and (4) global final total energy consumption.

4.1. CO2 Emissions

Carbon dioxide (CO2) emissions form an important variable to consider in global energy scenarios. Although such emissions by themselves are not among traditional energy sources, they depend on energy production and consumption. Also, global CO2 emissions can be used to set a target for an energy scenario (as in the case of NZE). Thus, it is reasonable to start the results sections in the current study with this important environmental indicator.
Figure 1 and Figure 2 show historical (past) records for global CO2 emissions, as well as predicted values in 2030 and 2050, under the four scenarios covered (STEPS, NZE, PES, and 1.5°C). The first observation to make here is that the 1.5°C scenario does not reach exactly 0 Gt CO2 in 2050, but a slightly negative value of −0.2 Gt CO2. The second observation is that the STEPS scenario predicts fewer CO2 emissions than PES for either 2030 or 2050. In particular, in 2030, STEPS predicts a decline in CO2 emissions compared to PES, whereas PES predicts the opposite situation. Thus, it can be stated that IEA-STEPS is more optimistic than IRENA-PES with regard to CO2 emissions. On the other hand, IRENA-1.5°C is more optimistic than IEA-NZE with regard to CO2 emissions, with the 1.5°C scenario predicting fewer CO2 emissions than NZE for both years 2030 and 2050.

4.2. Electricity Generation

The total amount of electricity generation is also an important element in the energy system. More electricity generation implies electrification of processes that were relying on fossil fuels. It also implies more exploitation of renewable energy sources, which are commonly exploited in the form of electricity.
Figure 3 and Figure 4 show the trends of global total electricity generation as predicted by the four scenarios covered. The gap between the IEA scenarios (STEPS and NZE) in 2050 is smaller than its counterpart gap for the IRENA scenarios (PES and 1.5°C). The reason is that STEPS overestimates the electricity generation compared to PES, while NZE underestimates it, compared to 1.5°C. Despite this, both NZE and 1.5°C scenarios expected an accelerated rate of electricity generation between 2030 and 2050 compared to the period before 2030. According to either NZE or 1.5°C, the world electricity generation in 2050 is expected to be more than twice its value in 2030. On the other hand, the STEPS and PES scenarios expect a nearly fixed rate of growth in electricity generation from now till 2050, with the annual electricity generation in 2050 at about 1.5 times its value in 2030. According to IRENA, the annual global total electricity generation in 2020 was 26.991 PWh, which is compatible with the reported IEA’s value of 28.346 PWh for the following year of 2021 (which then increased to 29.033 PWh in 2022).

4.3. Electricity Capacity

Related to the generation of electricity (as energy), the electricity capacity (as power) is also an indication of the size of the electricity sector.
Figure 5 and Figure 6 show the global electricity capacity expectation till 2050 based on the four covered scenarios. In 2030 and 2050, NZE and 1.5°C predict similar values near 15 TW and 36 TW, respectively, (36.956 TW for NZE, and 35.339 TW for 1.5°C). However, PES underestimates the electricity capacity compared to STEPS for both 2030 (by 18% of the STEPS value of 14.168 TW) and 2050 (by 24% of the STEPS value of 25.956 TW).

4.4. Total Final Energy Consumption

Figure 7 shows the expected growth in the global total final energy consumption (TFEC) till 2050 based on the two IEA scenarios covered. IRENA-WETO has TFEC predictions only for 2050 for the 1.5°C scenario (but no information for the PES scenario or for 2030), as well as the historical value from 2020, as visualized in Figure 8. The 1.5°C predicted annual value is 353 EJ in 2050, compared to a higher value of 374 EJ in 2020. This is larger than (but close to) the NZE value of 343 EJ in 2050 (compared to the higher IEA value of 442 EJ in 2022), and it is much lower than the 2050 STEPS value of 536 EJ. Although the predicted decline in TFEC from now till 2050 is not huge, it actually reflects a big boost in the energy efficiency and better use of the total primary energy supply (TPES) from natural resources, because the consumption declines despite the anticipated population growth and the extended urbanization level [127,128,129].
IRENA also gives additional details about the share of four energy carriers in TFEC. In 2020, clean hydrogen and its derived fuels made practically no contribution to TFEC. However, their share is expected to be 14% in 2050. Simultaneously, the share of fossil fuels in TFEC is expected to shrink from 63% in 2020 to 12% (but not totally eliminated) in 2050. IRENA-WETO explains the presence of fossil-fuel use in 2050 by clarifying that these are (1) natural gas, which is expected to remain in use mainly within the industry sector and the transport sector; (2) crude oil, whose derived products are expected to be mainly in use within the industry sector and the transport sector; and (3) coal, which is expected to remain in use within the industry sector for producing cement, chemicals (petrochemical), and iron. Thus, in 2050, the expected share of clean hydrogen and its derivatives in TFEC exceeds the expected share of all fossil fuels. The electrification level (as expressed by the percentage of electricity in TFEC) is expected to grow from 22% in 2020 to 51% in 2050 according to the 1.5°C scenario.

5. Results (Part 2 of 4): Additional IEA Non-Hydrogen Quantities

This part provides a selected set of results that correspond only to the IEA-WEO report (no similar ones appeared in IRENA-WETO). Although they are not directly connected to hydrogen, they are presented here as useful variables that influence modeling the energy and emissions pathways.
Figure 9 shows the expected trend of world population, which is expected to reach 9.681 billion in 2050 (compared to 7.95 billion in 2022). This population profile is independent of the specific energy scenario (it is the same for STEPS and NZE).
Figure 10 shows an expected decline in the CO2 intensity of electricity generation, whose global average in 2022 was 460 gCO2/kWh. In STEPS, this CO2 intensity of electricity generation is expected to drop largely (although STEPS is a relatively passive scenario in terms of not taking new steps for emissions mitigation and energy transition) to 131 gCO2/kWh in 2050. In NZE, the CO2 intensity of electricity generation is even expected to be negative in 2050, where generating electricity leads effectively to absorbing atmospheric CO2. This can happen as a result, for example, of using BECCS (bioenergy combined with carbon capture, utilization, and storage), which has negative CO2 emissions [130,131].
Figure 11 shows an expected decline in the global conventional crude oil demand, which was 62.8 Mb/d in 2022. In NZE, this is expected to fall to 15.8 Mb/d (but not be totally eliminated, as explained earlier). In the case of STEPS, crude oil demand nearly remains unchanged (there is a slow decline to 61.3 Mb/d in 2030, and then to 58.2 Mb/d in 2050).

6. Results (Part 3 of 4): Additional IRENA Non-Hydrogen Quantities

Similar to the previous part, the current part includes additional IRENA-specific results that are beneficial in depicting the expected progress in the global energy system, and this may be useful for discussing potential developments in hydrogen and its derivatives (for example, by setting benchmarking levels for comparisons with the hydrogen results).
As its full name implies, IRENA pays attention to renewable energy sources. Figure 12 shows the IRENA’s expectations for global renewable electricity (electricity generation from renewables), and the share of that generation to the total electricity generation (from renewables, nuclear fuels, and fossil fuels). In PES and 1.5°C, the share of renewable electricity is expected to grow from 28% in 2020 to either 73% (PES) or 91% (1.5°C) in 2050. Furthermore, the 1.5 °C scenario forecasts a rapid increase in the share of renewable electricity to reach 68% in 2030 (thus, close to the share of PES in 2050).
Figure 13 has similar types of information, but for the renewable-based electricity capacity. The renewable share in the total electricity capacity according to PES and 1.5°C is expected to grow from 37% in 2020 to either 80% (PES) or 94% (1.5°C) in 2050. As was the case for electricity generation, the expected 2030 share according to 1.5°C (77%) is close to the 2050 share according to PES (80%). For renewables, having a higher capacity share than the share in the electricity generated can be explained by the relatively lower capacity factor for power plants operating on renewable energy sources (particularly solar energy and wind energy) compared to conventional fossil-fuel-fired power plants and nuclear power plants. Thus, the nominal (nameplate) installed electric power capacity is not fully exploited most of the time in many cases of renewable energy power plants.
Figure 14 shows a breakdown of the global total electricity generation by source according to the 1.5°C scenario. As mentioned previously, the share of renewables is expected to increase from 28% in 2020 to 91% in 2050. The figure gives additional information about the share of nuclear power, which is expected to decrease from 10% in 2020 to only 4% in 2050. The figure also gives additional information about the share of fossil fuels, which is expected to decrease from 62% in 2020 to only 5% in 2050.
Figure 15 shows the expected growth in the global electrification percentage in the total final energy consumption (TFEC). In 2020, it was 22%. In either the PES or the 1.5°C scenario, this percentage is expected to increase. For the 1.5°C scenario, about half (51%) of TFEC is expected to be in the form of direct use of electricity in 2050. This is an advantage due to the eliminated direct CO2 emissions (compared to any carbonaceous fuel) [132,133]. For the PES scenario, the TFEC electrification percentage is expected to increase by only 6 percentage points in 2050, reaching 28% (about half the predicted share in the 1.5°C scenario).

7. Results (Part 4 of 4): Hydrogen-Specific Quantities

The last set of results concerns hydrogen, and thus it is the most important part of the overall results in the current study. This set is divided into three topics: (1) hydrogen production, (2) hydrogen demand and international trade from one geographic region to another, and (3) hydrogen use (in the electricity sector, in TFEC, in the transport sector, in the industry sector, and in the building sector).

7.1. Hydrogen Production

Figure 16 shows a breakdown of the global annually produced hydrogen (regardless of the emissions being abated or unabated) in 2019, 2020, and 2021, by the production technology according to IEA data published online (not part of WEO-2023) [134]. It can be seen that the total amount of produced hydrogen was nearly constant (approximately 90 Mt H2) in the three consecutive years. It even decreased slightly in 2020 compared to 2019. There was no green hydrogen production, and the share of blue hydrogen was very small, while gray hydrogen (from fossil fuels without CCS/CCUS) being the dominant portion. Based on this figure, the annual global low-emission hydrogen (LEH) or clean hydrogen (which practically was blue hydrogen only) was about 0.6 Mt H2 (not counting by-product hydrogen).
Figure 17 and its companion Table 1 show the expected profile of annual global low-emission hydrogen (LEH) production, and the share of electrolysis-based green hydrogen in this LEH, according to IEA modeling. In 2022, there was only 1 Mt H2 (rounded to the nearest integer) of LEH produced, with practically zero green hydrogen contained in this. Regardless of the IEA scenario (STEPS or NZE), electrolysis-based green hydrogen is expected to dominate (more than 70%) the production of LEH in the future, with a share of 73% in 2050 according to STEPS, and a higher share of 78% in 2050 according to NZE. According to NZE, in 2050, it is expected that LEH production will reach 420 Mt H2. For STEPS, the expected annual LEH production is limited to 10% or less of the annual LEH production for NZE, either in 2030 (7 Mt H2 compared to 70 Mt H2) or in 2050 (30 Mt H2 compared to 420 Mt H2). This is an important observation, where fast growth in LEH production requires support by policymakers taking emission mitigation actions and fostering energy transitions.
Table 2 summarizes the historical (2020) and the expected (2030 and 2050) annual global production of clean hydrogen, according to IRENA’s PES and 1.5°C scenarios. The reported annual production in 2020 (0.7 Mt H2) is not very different from the 0.6 Mt H2 mentioned earlier in the same year (based on IEA data). In 2050, the PES estimation of annual clean hydrogen production is 21 Mt H2 (compared to 30 Mt H2 of LEH according to STEPS), and the 1.5°C estimation is 523 Mt H2 (compared to 420 Mt H2 of LEH according to NZE). Despite the differences in these estimation pairs, the two IRENA scenarios agree with the two IEA scenarios that there is a huge suppression in the production of low-carbon hydrogen (LCH) if the global energy transition for carbon neutrality is not activated through the adoption of adequate measures to reach zero CO2 emissions by 2050.
Figure 18 shows the expected electrolyzer capacity for producing green hydrogen, according to the IRENA-1.5 °C scenario. From zero capacity in 2020, a capacity of 513 GW is expected in 2030, which is expected to increase significantly (11 times) to reach 5647 GW or 5.647 TW (16.0% of the 35.339 TW electricity generator capacity according to 1.5 °C, as mentioned earlier), in 2050.

7.2. Hydrogen Demand and Longr-Distance Trade

Figure 19 shows a breakdown of the global annual hydrogen demand in 2019, 2020, and 2021; by the demand sector; according to IEA data published online (not part of WEO-2023) [136]. It can be seen that the demand within each sector remained nearly the same over the three years. Refining was the application with highest demand, with a share of more than 40% in each of the three years. The application with the second highest demand was ammonia production, with a share of more than 35% in each of the three years. The third highest was methanol production, with a share of about 15% in each of the three years. The fourth was iron production, with a small share of about 5% in each of the three years.
Table 3 presents the global demand for low-emission hydrogen-based liquid fuels (LELs), and its ratio to the conventional crude oil demand (which was discussed earlier), based on IEA modeling. The use of conventional crude oil demand is carried out here just for benchmarking, and the ratio shown is not a fraction (not limited to an upper limit of 100%). Despite the expected large ratio of 38.0% in 2050 according to NZE, it should be noted that one reason for such a high ratio is the big decline in the demand for conventional crude oil (from 62.8 Mb/d in 2022 to 15.8 Mb/d in 2050, thus a drop to about only 25% of the recent demand). However, the expected demand of 6.0 Mboe/d for low-emission hydrogen-based liquid fuels in 2050 according to NZE is approximately 10% of the recent 2022 demand for conventional crude oil, which makes LELs a clear contributor among liquid fuels.
Figure 20 shows the expected annual global region-to-region trade (long-distance trade) of LEH and its derived energy products, according to IEA data. It also shows the computed share of this traded LEH and its derivative products and the demand for LEH and its derivative products. Similar to the case of LEH production, there is a huge gap between the STEPS scenario and the NZE scenario in terms of the amount of anticipated trade of LEH and its derivatives. This emphasizes the sensitivity of the LEH market to the attention given by policymakers to emissions mitigation. The share of this region-to-region traded LEH in the global LEH demand is limited to 21% only for both scenarios, in either 2030 or 2050.

7.3. Hydrogen Use

With regard to the utilization of hydrogen, Table 4 gives the IEA’s past (2010, 2021, 2022) and future expectations (2030, 2050) for the global electricity generation (either by direct combustion or through fuel cells) from low-emission hydrogen (LEH), and from derived low-emission ammonia (LEA) as a low-emission liquid fuel and hydrogen carrier. The table also gives the share of this type of hydrogen-originated electricity generation in the total electricity generation. Regardless of the energy forecasting scenario (STEPS or NZE), the combined role of LEH and LEA in electricity generation is of minor importance, with the best estimate being only 2% (more precisely 1.51%) in 2050 according to NZE.
Table 5 has a similar structure of the previous table, also with IEA’s results, but it is for global electricity capacity (rather than global electricity generation). It affirms the relatively weak role of low-emission hydrogen and derived low-emission ammonia in the electricity sector, with only a 1% combined share (more precisely 1.16%, with 427 GW by LEH and LEA compared to the expected total electricity capacity of 36,956 GW) in 2050 according to NZE. A comparison of the small percentage values in this table with the larger ratio values discussed earlier (describing the global demand for low-emission hydrogen-based liquid fuels—LELs, relative to global demand for conventional crude oil) suggests that the role of LELs as liquid fuels (for any purpose, including heating) may be much more pronounced than the role of LEH and LEA in the narrow purpose within the electricity sector alone.
Moving from IEA data to IRENA data, Table 6 shows the IRENA’s past and expected global share of clean hydrogen (through both direct use, and indirect use as derived e-fuels) in the total final energy consumption (TFEC). The two IRENA’s TFEC values mentioned earlier (past value for 2020, and expected future value for 2050 according to 1.5°C) are included in the table. Similar to a previous remark made when discussing IEA results for expected future LEH production and discussing IRENA results for expected future clean hydrogen production, unless the 1.5°C scenario is realized, the role of clean hydrogen and its derivatives may be very limited in TFEC (less than 1% energy share, even in 2050).
Finally, sector-specific estimations of the past and the expected global share of clean hydrogen (from both direct use, and indirect use as derived e-fuels) in the final energy consumption (FEC) within the three sectors are presented, still using IRENA data. Table 7 shows that the transport sector has good potential for utilizing clean hydrogen or its derived fuels, with the share in transport FEC is expected to reach 24% in 2050 according to the 1.5°C scenario. Thus, hydrogen could play a noticeable role in decarbonizing the transport sector through fuel-cell electric vehicles (FCEVs) and fuel-cell electric trains (FCETs). Table 8 shows the corresponding share for the industry sector, where the maximum expected share in industry FEC (17%) is also appreciable. Direct reduced iron (DRI), for example, is one way where clean hydrogen can become an important feedstock for producing iron in a clean way compared to the conventional use of carbon as a reduction agent of iron ore (iron oxides) [137,138]. Table 9 shows the corresponding share for the building sector. Unlike the previous two sectors, the expected share of clean hydrogen and its derived e-fuels in the building FEC is negligible (less than 1%) in either 2030 or 2050, according to both the PES scenario and the 1.5°C scenario.

8. Conclusions

In the current study, various barriers and drivers for a large-scale hydrogen economy (especially electrolysis-based green hydrogen) were discussed. A selective analysis of the most-recent edition (2023) of the World Energy Outlook (WEO, 26th edition) of the International Energy Agency (IEA), and the most-recent edition (2023) of the World Energy Transitions Outlook (WETO, third edition, volume 1 of two volumes) of the International Renewable Energy Agency (IRENA) was presented.
With regard to the first (and the primary) aim of the current study, the future of hydrogen (particularly green hydrogen) is largely speculative, with a very wide range of its possible development (from being negligible to being far-reaching), depending on whether or not governments take serious action to mitigate global carbon dioxide (CO2) emissions by 2050, by decarbonizing various sectors. Assuming that a fully decarbonized global economy (in terms of net-zero CO2 emissions) is realized in 2050, the annual green and blue hydrogen production may exceed 500 Mt H2 in 2050 (with most of this being green hydrogen from water electrolysis, with a global electrolyzer capacity exceeding 5000 GW). With such fully decarbonized global activities in 2050, the share of green and blue hydrogen in the global total final energy consumption (TFEC) may reach 14%, which is a little more than the share of fossil fuels (12%), and a little less than the share of biomass (16%). Hydrogen and its derived fuels have a better chance of being exploited within the transport sector and within the industry sector, but not within the building sector.
With regard to the second aim of the current study, it was found that IEA’s Stated Policies Scenario (STEPS), and IRENA’s Planned Energy Scenario (PES) vary noticeably in their predictions for 2030 and 2050 in some cases (with the deviation exceeding 20%, such as in the predicted total electricity capacity in 2050 being 25.956 TW for STEPS and 19.748 TW for PES), but can also be consistent in other cases (the deviation is less than 1% for the predicted annual total electricity generation in 2030 of 35.802 PWh for STEPS and 36.119 PWh for PES). IEA’s Net-Zero Emissions by 2050 (NZE), and IRENA’s 1.5°C pathway (1.5°C) were found to be overall similar, but not identical, in terms of their examined forecasting. For example, the deviation in their predicted global total final energy consumption (TFEC) in 2050 was only about 10 EJ, which is less than 3% of either of the other reported values, (343 EJ for NZE, and 353 EJ for 1.5°C).
With regard to the third (and the last) aim of the current study, the share of direct electricity use in TFEC is expected to be approximately one-half in 2050 under the condition of net-zero global emissions of CO2 at that time. However, in that situation of global decarbonization, fossil fuels (coal, crude oil, and natural gas) are not expected to be totally phased out, but their use is expected to be mostly limited to the transport sector and some industries. If the current energy policies and targets remain in place, the share of renewable energy sources in global electricity generation is expected to increase from 28% in 2020 to nearly half of the global total electricity generation in 2030, and to nearly three-quarters of the global total electricity generation in 2050. In relation to this boosted electrification, the corresponding carbon dioxide emissions per kWh of generated electricity decline by 34.1% from 460 gCO2 (global average) in 2020 to 303 gCO2 in 2030, and then decline by an additional 37.4% (relative to the 2020 value) to 131 gCO2 in 2050.

8.1. Policy Implications

Based on the findings of the current study, the current policies and energy targets are inadequate to achieve global carbon neutrality by the middle of the current century. The current policies do not even enable a considerable drop in the carbon dioxide emissions in 2050 compared to the 2022 value, which was near 37 Gt CO2. It should be noted that this shortcoming does not pertain to a specific country, but it is about the overall collection of all governmental energy-related policies.
Because CO2 emissions and the induced global warming are worldwide problems, only international collaboration can lead to adequately controlling them. Isolated national or regional efforts are not sufficient. The study recommends that cooperative technical, economic, and legislative support is provided to the national governments to accelerate the deployment of green hydrogen production, trade, certification, and utilization. The study also recommends community awareness activities, particularly for school students, about the opportunities that low-carbon hydrogen can bring for improving our lives.

8.2. Limitations and Future Recommendations

The current study did not provide technical details or mathematical modeling information about the processes of producing hydrogen or consuming it. For example, the amount of renewable electricity needed to produce 1 kg H2 of green hydrogen using water electrolysis was not discussed. Also, how the conversion efficiency of this input electric energy depends on the electrolyzer type (particularly alkaline electrolyzers versus proton exchange membrane electrolyzers) was missing. Similarly, details about hydrogen fuel cells and their advantages/disadvantages relative to other clean electricity generation technologies were not given. When the water needs for hydrogen production were discussed, the quality requirements of this water (such as the permissible level of dissolved solids) for the electrolysis operation were not covered. The drivers for having a large-scale hydrogen economy were largely focused on the H2Global initiative in Germany as a single demonstrative case, rather than covering multiple cases from different countries. For example, the National Green Hydrogen Mission in India [139] (which provides governmental incentives to strengthen the production of green hydrogen and the manufacturing of electrolyzers), the Hydrogen Program of the United States Department of Energy [140] (which involves activities to scale up the role of hydrogen and fuel cells through technology validation, research, and awareness), and the Hydrogen Oman or Hydrom in the Sultanate of Oman [141] (which was established as a central government-owned entity for coordinating the national interest in large-scale green hydrogen projects) are additional examples that were not mentioned. Despite apparently being limitations, it is actually reasonable to skip these additional details as they do not crucially influence the current study and they may make it unsuitably large and incoherent. Future work may address one or more of these topics, as a narrower but deeper investigation regarding the viability of hydrogen energy.

Funding

This research received no external funding.

Institutional Review Board Statement

Not applicable.

Informed Consent Statement

Not applicable.

Data Availability Statement

Data are contained within the article.

Conflicts of Interest

The authors declare no conflicts of interest.

Nomenclature

1.5°C (by IRENA) It is a normative forecasting model, showing a possible pathway to limit the global temperature rise to 1.5 °C by 2100 relative to the pre-industrial level. It simultaneously implies bringing CO2 emissions to a nearly net-zero (slightly negative) value by 2050. As a reference, the global average rise in the earth’s surface temperature in 2021 reached around 1.2 °C above the pre-industrial level.
APSAnnounced Pledges Scenario.
Blue hydrogenA type of hydrogen produced though abated fossil-based hydrogen production, where hydrogen is obtained from a fossil fuel (such as by steam-methane reforming “SMR” of natural gas, or by autothermal reforming “ATR” of natural gas), but the process is combined with a form of CCS/CCUS to largely reduce the CO2 emissions to the atmosphere.
BMWKGerman: Bundesministerium für Wirtschaft und Klimaschutz (English: Federal Ministry for Economic Affairs and Climate Action). In December 2021, it replaced the former BMWi.
BMWiGerman: Bundesministerium für Wirtschaft und Energie (English: Federal Ministry for Economic Affairs and Energy). In December 2021, it was replaced by BMWK.
CCSCarbon capture and storage (or sequestration).
CCUSCarbon capture, utilization (or usage), and storage.
Clean hydrogenA term used by IRENA to refer collectively to: (1) green hydrogen, and (2) blue hydrogen. This is approximately equivalent to “low-emission hydrogen” or LEH for IEA.
CO2Carbon dioxide.
DRIDirect reduced iron.
e-fuelElectricity-based fuel (or electrofuel).
EJExajoule (1018 J).
e-SAFElectricity-based sustainable aviation fuel.
EU European Union.
gCO2Gram of carbon dioxide.
GEC (by IEA)Global Energy and Climate.
Green hydrogenA type of hydrogen produced by either (1) electrolysis of water, with the required electricity generated from a renewable energy source, or (2) biomass gasification using renewable energy for powering the process. The electrolysis-based green hydrogen is the dominant type of both categories, and often the term “green hydrogen” refers exclusively to electrolysis-based hydrogen.
Gt CO2Gigatonne (1012 kg) of carbon dioxide.
GWGigawatt (109 W).
HINT.COHydrogen Intermediary Network Company GmbH.
HPAHydrogen purchase agreement.
HRSHydrogen refueling station.
HSAHydrogen sales agreement.
IEAInternational Energy Agency.
IRENAInternational Renewable Energy Agency.
kg H2 Kilogram of hydrogen.
kWh Kilowatt hour (3.6 MJ).
LLiter.
LCHLow-carbon hydrogen (a generic term that refers to either clean hydrogen or low-emission hydrogen).
LCOHLevelized cost of hydrogen.
LEALow-emission ammonia. It is a low-emission hydrogen-based liquid fuel (NH3) produced from low-emission hydrogen (such as electrolysis-based hydrogen where the consumed electricity to produce it comes from low-emission electricity generation sources).
LEHLow-emission hydrogen. It is a term used by IEA to refer collectively to: (1) green hydrogen, (2) blue hydrogen, (3) pink hydrogen, and (4) turquoise hydrogen. This is approximately equivalent to “clean hydrogen” according to IRENA terms.
LELs Low-emission hydrogen-based liquid fuels.
LHVLower heating value (of a fuel).
Mb/d Million barrels of crude oil (petroleum) per day. One barrel has a volume of 42 U.S. gallons (about 159 L).
Mboe/d Million barrels of oil equivalent per day. If 1 tonne of oil equivalent (toe) has 7.40 boe, and 1 toe has a lower heating value (LHV) of 41,868 MJ, then 1 boe is equivalent to a LHV of 5658 MJ (1572 kWh). However, there is no universal value of boe.
MJ Megajoule (106 J).
Mt H2 Million tonnes of hydrogen.
NFPANational Fire Protection Association. It is a US-based global nonprofit professional organization, and an internationally recognized leader in providing fire safety standards.
NZE (by IEA)Net-Zero Emissions by 2050. It is a normative forecasting model, predicting the necessary mix of clean energy technologies to reach net-zero energy-related CO2 emissions by 2050. NZE corresponds to an increase of 1.5 °C in the average global surface temperature in 2100 (with a 50% probability), with limited overshoot before that.
PEMProton exchange membrane (also called polymer electrolyte membrane).
PES (by IRENA)Planned Energy Scenario. It is an exploratory forecasting model, predicting the expected developments in the energy system and the dependent emissions based on currently existing governments’ energy plans and targets.
Pink hydrogen A type of hydrogen produced by electrolysis of water, with the needed electric power generated from a nuclear power plant.
PtG or P2GPower-to-gas.
PtL or P2LPower-to-liquid.
PtX or P2XPower-to-X (X is a generic energy carrier).
PWh Petawatt-hour (3.6 EJ).
RenewablesRenewable energy sources, including hydroelectric energy, solar energy, wind energy, bioenergy, geothermal energy, and ocean/marine energy (from tides or from waves).
SMRSteam-methane reforming.
STEPS (by IEA)Stated (Energy) Policies Scenario. It is an exploratory forecasting model, predicting the expected developments in the energy system and the dependent emissions based on currently existing sector-by-sector energy policies and measures by different countries or geographical regions. STEPS corresponds to an increase of 2.4 °C in the average global surface temperature in 2100 (with a 50% probability).
TFC/TFECTotal final energy consumption. IEA uses the abbreviation “TFC”, while IRENA uses the abbreviation “TFEC”. It is the sum of consumption by the end-use sector, for example by the industry sector (such as manufacturing, mining, chemicals production, blast furnaces), and by the transport sector.
Turquoise hydrogenA type of hydrogen produced through a pyrolysis process (called methane pyrolysis, methane splitting, or methane cracking), when the gaseous methane (or natural gas) is heated electrically such that it is broken down into gaseous hydrogen and solid carbon. The process does not release carbon dioxide emissions (like green hydrogen), but it is based on a fossil fuel (like blue hydrogen).
TWTerawatt (1000 GW).
WEO (by IEA)World Energy Outlook.
WETO (by IRENA)World Energy Transitions Outlook.
yr Year.

References

  1. Yan, M.; Liu, J.; Wang, Z.; Ning, L. Biogeophysical impacts of land use/land cover change on 20th century anthropogenic climate compared to the impacts of greenhouse gas change. Int. J. Climatol. 2020, 40, 6560–6573. [Google Scholar] [CrossRef]
  2. Marzouk, O.A. Assessment of global warming in Al Buraimi, sultanate of Oman based on statistical analysis of NASA POWER data over 39 years, and testing the reliability of NASA POWER against meteorological measurements. Heliyon 2021, 7, E06625. [Google Scholar] [CrossRef]
  3. Matthews, H.D.; Wynes, S. Current global efforts are insufficient to limit warming to 1.5 °C. Science 2022, 376, 1404–1409. [Google Scholar] [CrossRef]
  4. Meinshausen, M.; Lewis, J.; McGlade, C.; Gütschow, J.; Nicholls, Z.; Burdon, R.; Cozzi, L.; Hackmann, B. Realization of Paris Agreement pledges may limit warming just below 2 °C. Nature 2022, 604, 304–309. [Google Scholar] [CrossRef]
  5. Marzouk, O.A. Chronologically-Ordered Quantitative Global Targets for the Energy-Emissions-Climate Nexus, from 2021 to 2050. In Proceedings of the 2022 International Conference on Environmental Science and Green Energy (ICESGE), Virtual, 9–11 December 2022; pp. 1–6. [Google Scholar] [CrossRef]
  6. Chen, J.M. Carbon neutrality: Toward a sustainable future. Innovation 2021, 2, 100127. [Google Scholar] [CrossRef]
  7. NASA [United States National Aeronautics and Space Administration]—Earth Observatory. World of Change: Global Temperatures. 2024. Available online: https://earthobservatory.nasa.gov/world-of-change/global-temperatures (accessed on 5 January 2024).
  8. IPCC [Intergovernmental Panel on Climate Change]. Climate Change 2014 Synthesis Report Fifth Assessment Report—Future Changes, Risks and Impacts. 2024. Available online: https://ar5-syr.ipcc.ch/topic_futurechanges.php (accessed on 5 January 2024).
  9. Vitousek, P.M. Beyond global warming: Ecology and global change. Ecology 1994, 75, 1861–1876. [Google Scholar] [CrossRef]
  10. Krey, V. Global energy-climate scenarios and models: A review. Wiley Interdiscip. Rev. Energy Environ. 2014, 3, 363–383. [Google Scholar] [CrossRef]
  11. IEA [International Energy Agency]. Global Energy and Climate Model—Documentation 2023. 2023. Available online: https://iea.blob.core.windows.net/assets/ff3a195d-762d-4284-8bb5-bd062d260cc5/GlobalEnergyandClimateModelDocumentation2023.pdf (accessed on 5 January 2024).
  12. IEA [International Energy Agency]. Stated Policies Scenario (STEPS)—Global Energy and Climate Model. 2023. Available online: https://www.iea.org/reports/global-energy-and-climate-model/stated-policies-scenario-steps (accessed on 5 January 2024).
  13. IEA [International Energy Agency]. Announced Pledges Scenario (APS)—Global Energy and Climate Model. 2023. Available online: https://www.iea.org/reports/global-energy-and-climate-model/announced-pledges-scenario-aps (accessed on 19 January 2024).
  14. IEA [International Energy Agency]. Net Zero Emissions by 2050 Scenario (NZE)—Global Energy and Climate Model. 2023. Available online: https://www.iea.org/reports/global-energy-and-climate-model/net-zero-emissions-by-2050-scenario-nze (accessed on 5 January 2024).
  15. IEA [International Energy Agency]. World Energy Outlook—Previous Editions. 2023. Available online: https://www.iea.org/reports/world-energy-outlook-2023#previous-editions (accessed on 27 December 2023).
  16. FAO [Food and Agriculture Organization of the United Nations]. World Energy Outlook Series. 2023. Available online: https://www.fao.org/forestry/energy/catalogue/search/detail/fr/c/1305396 (accessed on 26 December 2023).
  17. IEA [International Energy Agency]. World Energy Outlook 2023. Annual Report (26th Edition). 2023. Available online: https://iea.blob.core.windows.net/assets/42b23c45-78bc-4482-b0f9-eb826ae2da3d/WorldEnergyOutlook2023.pdf (accessed on 27 December 2023).
  18. IRENA [International Renewable Energy Agency]. World Energy Transitions Outlook 2023: 1.5°C Pathway, Volume 1. Annual Report (Third Edition). 2023. Available online: https://mc-cd8320d4-36a1-40ac-83cc-3389-cdn-endpoint.azureedge.net/-/media/Files/IRENA/Agency/Publication/2023/Jun/IRENA_World_energy_transitions_outlook_v1_2023.pdf (accessed on 26 December 2023).
  19. Tseng, P.; Lee, J.; Friley, P. A hydrogen economy: Opportunities and challenges. Energy 2005, 30, 2703–2720. [Google Scholar] [CrossRef]
  20. Bockris, J.O.M. The hydrogen economy: Its history. Int. J. Hydrogen Energy 2013, 38, 2579–2588. [Google Scholar] [CrossRef]
  21. Oliveira, A.M.; Beswick, R.R.; Yan, Y. A green hydrogen economy for a renewable energy society. Curr. Opin. Chem. Eng. 2021, 33, 100701. [Google Scholar] [CrossRef]
  22. Squadrito, G.; Maggio, G.; Nicita, A. The green hydrogen revolution. Renew. Energy 2023, 216, 119041. [Google Scholar] [CrossRef]
  23. Marzouk, O.A. 2030 Ambitions for Hydrogen, Clean Hydrogen, and Green Hydrogen. Eng. Proc. 2023, 56, 14. [Google Scholar] [CrossRef]
  24. Fajín, J.L.; Cordeiro, M.N.D. Renewable hydrogen production from biomass derivatives or water on trimetallic based catalysts. Renew. Sustain. Energy Rev. 2024, 189, 113909. [Google Scholar] [CrossRef]
  25. Garlet, T.B.; Savian, F.S.; Ribeiro, J.L.D.; Siluk, J.C.M. Unlocking Brazil’s green hydrogen potential: Overcoming barriers and formulating strategies to this promising sector. Int. J. Hydrogen Energy 2024, 49, 553–570. [Google Scholar] [CrossRef]
  26. Kakoulaki, G.; Kougias, I.; Taylor, N.; Dolci, F.; Moya, J.; Jäger-Waldau, A. Green hydrogen in Europe—A regional assessment: Substituting existing production with electrolysis powered by renewables. Energy Convers. Manag. 2021, 228, 113649. [Google Scholar] [CrossRef]
  27. Marzouk, O.A. Tilt sensitivity for a scalable one-hectare photovoltaic power plant composed of parallel racks in Muscat. Cogent Eng. 2022, 2, 2029243. [Google Scholar] [CrossRef]
  28. Schrotenboer, A.H.; Veenstra, A.A.T.; uit het Broek, M.A.J.; Ursavas, E. A Green Hydrogen Energy System: Optimal control strategies for integrated hydrogen storage and power generation with wind energy. Renew. Sustain. Energy Rev. 2022, 168, 112744. [Google Scholar] [CrossRef]
  29. Marzouk, O.A. Energy Generation Intensity (EGI) of Solar Updraft Tower (SUT) Power Plants Relative to CSP Plants and PV Power Plants Using the New Energy Simulator “Aladdin”. Energies 2024, 17, 405. [Google Scholar] [CrossRef]
  30. Salmon, N.; Bañares-Alcántara, R. Green ammonia as a spatial energy vector: A review. Sustain. Energy Fuels 2021, 5, 2814–2839. [Google Scholar] [CrossRef]
  31. Schmidt, P.R.; Weindorf, W.; Failer, S.; Astono, Y.; Ullmann, A. E-SAF: Techno-Economics of PtL and PtH2—Focus North America and Europe. Report by LBST—Ludwig-Bölkow-Systemtechnik GmbH. Available online: https://en.lbst.de/wp-content/uploads/2023/12/DA_E-SAF_Report_final_2023_12_04.pdf (accessed on 8 January 2024).
  32. Longden, T.; Beck, F.J.; Jotzo, F.; Andrews, R.; Prasad, M. ‘Clean’ hydrogen?—Comparing the emissions and costs of fossil fuel versus renewable electricity based hydrogen. Appl. Energy 2022, 306, 118145. [Google Scholar] [CrossRef]
  33. Newborough, M.; Cooley, G. Developments in the global hydrogen market: The spectrum of hydrogen colours. Fuel Cells Bull. 2020, 2020, 16–22. [Google Scholar] [CrossRef]
  34. Yu, M.; Wang, K.; Vredenburg, H. Insights into low-carbon hydrogen production methods: Green, blue and aqua hydrogen. Int. J. Hydrogen Energy 2021, 46, 21261–21273. [Google Scholar] [CrossRef]
  35. Crespi, E.; Guandalini, G.; Gößling, S.; Campanari, S. Modelling and optimization of a flexible hydrogen-fueled pressurized PEMFC power plant for grid balancing purposes. Int. J. Hydrogen Energy 2021, 46, 13190–13205. [Google Scholar] [CrossRef]
  36. Pilavachi, P.A.; Stephanidis, S.D.; Pappas, V.A.; Afgan, N.H. Multi-criteria evaluation of hydrogen and natural gas fuelled power plant technologies. Appl. Therm. Eng. 2009, 29, 2228–2234. [Google Scholar] [CrossRef]
  37. Marzouk, O.A. Growth in the Worldwide Stock of E-Mobility Vehicles (by Technology and by Transport Mode) and the Worldwide Stock of Hydrogen Refueling Stations and Electric Charging Points between 2020 and 2022. Key Eng. Mater. 2023, 469, 89–96. [Google Scholar] [CrossRef]
  38. Çalışır, D.; Ekici, S.; Midilli, A.; Karakoc, T.H. Benchmarking environmental impacts of power groups used in a designed UAV: Hybrid hydrogen fuel cell system versus lithium-polymer battery drive system. Energy 2023, 262, 125543. [Google Scholar] [CrossRef]
  39. Cavaliere, P.; Perrone, A.; Dijon, L.; Laska, A.; Koszelow, D. Direct reduction of pellets through hydrogen: Experimental and model behaviour. Int. J. Hydrogen Energy 2024, 49, 1444–1460. [Google Scholar] [CrossRef]
  40. Moradpoor, I.; Syri, S.; Santasalo-Aarnio, A. Green hydrogen production for oil refining–Finnish case. Renew. Sustain. Energy Rev. 2023, 175, 113159. [Google Scholar] [CrossRef]
  41. Bahnamiri, F.K.; Khalili, M.; Pakzad, P.; Mehrpooya, M. Techno-economic assessment of a novel power-to-liquid system for synthesis of formic acid and ammonia, based on CO2 electroreduction and alkaline water electrolysis cells. Renew. Energy 2022, 187, 1224–1240. [Google Scholar] [CrossRef]
  42. Pagani, G.; Hajimolana, Y.; Acar, C. Green hydrogen for ammonia production—A case for the Netherlands. Int. J. Hydrogen Energy 2024, 52, 418–432. [Google Scholar] [CrossRef]
  43. Matschoss, P.; Steubing, M.; Pertagnol, J.; Zheng, Y.; Wern, B.; Dotzauer, M.; Thrän, D. A consolidated potential analysis of bio-methane and e-methane using two different methods for a medium-term renewable gas supply in Germany. Energy Sustain. Soc. 2020, 10, 41. [Google Scholar] [CrossRef]
  44. Ince, A.C.; Colpan, C.O.; Hagen, A.; Serincan, M.F. Modeling and simulation of Power-to-X systems: A review. Fuel 2021, 304, 121354. [Google Scholar] [CrossRef]
  45. Ueckerdt, F.; Bauer, C.; Dirnaichner, A.; Everall, J.; Sacchi, R.; Luderer, G. Potential and risks of hydrogen-based e-fuels in climate change mitigation. Nat. Clim. Change 2021, 11, 384–393. [Google Scholar] [CrossRef]
  46. Yilmaz, H.Ü.; Kimbrough, S.O.; van Dinther, C.; Keles, D. Power-to-gas: Decarbonization of the European electricity system with synthetic methane. Appl. Energy 2022, 323, 119538. [Google Scholar] [CrossRef]
  47. Atsonios, K.; Li, J.; Inglezakis, V.J. Process analysis and comparative assessment of advanced thermochemical pathways for e-kerosene production. Energy 2023, 278, 127868. [Google Scholar] [CrossRef]
  48. Nemmour, A.; Inayat, A.; Janajreh, I.; Ghenai, C. Green hydrogen-based E-fuels (E-methane, E-methanol, E-ammonia) to support clean energy transition: A literature review. Int. J. Hydrogen Energy 2023, 48, 29011–29033. [Google Scholar] [CrossRef]
  49. Boretti, A. A market opportunity in power generation for hydrogen energy storage systems. Int. J. Hydrogen Energy 2024, 49, 166–172. [Google Scholar] [CrossRef]
  50. Zhou, B.; Huang, W.; Zong, Y.; Sobiesiak, A. Water and pressure effects on a single PEM fuel cell. J. Power Sources 2006, 155, 190–202. [Google Scholar] [CrossRef]
  51. Marzouk, O.A.; Huckaby, E.D. A Comparative Study of Eight Finite-Rate Chemistry Kinetics for CO/H2 Combustion. Eng. Appl. Comput. Fluid Mech. 2010, 4, 331–356. [Google Scholar] [CrossRef]
  52. Saeed, W.; Warkozek, G. Modeling and analysis of renewable PEM fuel cell system. Energy Procedia 2015, 74, 87–101. [Google Scholar] [CrossRef]
  53. Marzouk, O.A. Adiabatic Flame Temperatures for Oxy-Methane, Oxy-Hydrogen, Air-Methane, and Air-Hydrogen Stoichiometric Combustion using the NASA CEARUN Tool, GRI-Mech 3.0 Reaction Mechanism, and Cantera Python Package. Eng. Technol. Appl. Sci. Res. 2023, 13, 11437–11444. [Google Scholar] [CrossRef]
  54. Hernández, F.; Gual, M.Á.; Del Río, P.; Caparrós, A. Energy sustainability and global warming in Spain. Energy Policy 2004, 32, 383–394. [Google Scholar] [CrossRef]
  55. Fernández, Y.F.; López, M.A.F.; Blanco, B.O. Innovation for sustainability: The impact of R&D spending on CO2 emissions. J. Clean. Prod. 2018, 172, 3459–3467. [Google Scholar] [CrossRef]
  56. Field, R.A.; Derwent, R.G. Global warming consequences of replacing natural gas with hydrogen in the domestic energy sectors of future low-carbon economies in the United Kingdom and the United States of America. Int. J. Hydrogen Energy 2021, 46, 30190–30203. [Google Scholar] [CrossRef]
  57. Marzouk, O.A. Zero Carbon Ready Metrics for a Single-Family Home in the Sultanate of Oman Based on EDGE Certification System for Green Buildings. Sustainability 2023, 15, 13856. [Google Scholar] [CrossRef]
  58. Lee, S.C.; Chang, M. Indoor and outdoor air quality investigation at schools in Hong Kong. Chemosphere 2000, 41, 109–113. [Google Scholar] [CrossRef]
  59. Cheng, Y.; Zhang, S.; Huan, C.; Oladokun, M.O.; Lin, Z. Optimization on fresh outdoor air ratio of air conditioning system with stratum ventilation for both targeted indoor air quality and maximal energy saving. Build. Environ. 2019, 147, 11–22. [Google Scholar] [CrossRef]
  60. Tofful, L.; Canepari, S.; Sargolini, T.; Perrino, C. Indoor air quality in a domestic environment: Combined contribution of indoor and outdoor PM sources. Build. Environ. 2021, 202, 108050. [Google Scholar] [CrossRef]
  61. Mundackal, A.; Ngole-Jeme, V.M. Evaluation of indoor and outdoor air quality in university academic buildings and associated health risk. Int. J. Environ. Health Res. 2022, 32, 1076–1094. [Google Scholar] [CrossRef] [PubMed]
  62. Marzouk, O.A. Compilation of Smart Cities Attributes and Quantitative Identification of Mismatch in Rankings. J. Eng. 2022, 2022, 5981551. [Google Scholar] [CrossRef]
  63. Rand, D.A.J.; Dell, R.M. Hydrogen Energy: Challenges and Prospects; Royal Society of Chemistry (RSC) Publishing: London, UK, 2007. [Google Scholar]
  64. Ball, M.; Wietschel, M. The future of hydrogen–opportunities and challenges. Int. J. Hydrogen Energy 2009, 34, 615–627. [Google Scholar] [CrossRef]
  65. Mazloomi, K.; Gomes, C. Hydrogen as an energy carrier: Prospects and challenges. Renew. Sustain. Energy Rev. 2012, 16, 3024–3033. [Google Scholar] [CrossRef]
  66. Yue, M.; Lambert, H.; Pahon, E.; Roche, R.; Jemei, S.; Hissel, D. Hydrogen energy systems: A critical review of technologies, applications, trends and challenges. Renew. Sustain. Energy Rev. 2021, 146, 111180. [Google Scholar] [CrossRef]
  67. Ishaq, H.; Dincer, I.; Crawford, C. A review on hydrogen production and utilization: Challenges and opportunities. Int. J. Hydrogen Energy 2022, 47, 26238–26264. [Google Scholar] [CrossRef]
  68. Chiesa, P.; Lozza, G.; Mazzocchi, L. Using hydrogen as gas turbine fuel. J. Eng. Gas Turbines Power 2005, 127, 73–80. [Google Scholar] [CrossRef]
  69. Ugurlu, A. An emission analysis study of hydrogen powered vehicles. Int. J. Hydrogen Energy 2020, 45, 26522–26535. [Google Scholar] [CrossRef]
  70. Dupuis, D.P.; Grim, R.G.; Nelson, E.; Tan, E.C.; Ruddy, D.A.; Hernandez, S.; Westover, T.; Hensley, J.E.; Carpenter, D. High-octane gasoline from biomass: Experimental, economic, and environmental assessment. Appl. Energy 2019, 241, 25–33. [Google Scholar] [CrossRef]
  71. Agrawal, R.; Singh, N.R. Synergistic routes to liquid fuel for a petroleum-deprived future. AIChE J. 2009, 55, 1898–1905. [Google Scholar] [CrossRef]
  72. Amaral, L.V.; Santos, N.D.S.A.; Roso, V.R.; Sebastião, R.C.O.; Pujatti, F.J.P. Effects of gasoline composition on engine performance, exhaust gases and operational costs. Renew. Sustain. Energy Rev. 2021, 135, 110196. [Google Scholar] [CrossRef]
  73. Hunicz, J.; Krzaczek, P.; Gęca, M.; Rybak, A.; Mikulski, M. Comparative study of combustion and emissions of diesel engine fuelled with FAME and HVO. Combust. Engines 2021, 184, 72–78. [Google Scholar] [CrossRef]
  74. Bothast, R.J.; Schlicher, M.A. Biotechnological processes for conversion of corn into ethanol. Appl. Microbiol. Biotechnol. 2005, 67, 19–25. [Google Scholar] [CrossRef] [PubMed]
  75. EIA [U.S. Energy Information Administration]. Gasoline and Diesel Fuel Update. 2024. Available online: https://www.eia.gov/petroleum/gasdiesel (accessed on 7 January 2024).
  76. NSS [National Subsidy System—Sultanate of Oman]. Fuel Price—January’24. 2024. Available online: https://nss.gov.om/site/home?ln=EN (accessed on 7 January 2024).
  77. Khouya, A. Levelized costs of energy and hydrogen of wind farms and concentrated photovoltaic thermal systems. Case Study Morocco. Int. J. Hydrogen Energy 2020, 45, 31632–31650. [Google Scholar] [CrossRef]
  78. Minutillo, M.; Perna, A.; Forcina, A.; Di Micco, S.; Jannelli, E. Analyzing the levelized cost of hydrogen in refueling stations with on-site hydrogen production via water electrolysis in the Italian scenario. Int. J. Hydrogen Energy 2021, 46, 13667–13677. [Google Scholar] [CrossRef]
  79. BloombergNEF. Hydrogen Economy Outlook. 2020. Available online: https://data.bloomberglp.com/professional/sites/24/BNEF-Hydrogen-Economy-Outlook-Key-Messages-30-Mar-2020.pdf (accessed on 11 May 2023).
  80. Abdin, Z.; Khalilpour, K.; Catchpole, K. Projecting the levelized cost of large scale hydrogen storage for stationary applications. Energy Convers. Manag. 2022, 270, 116241. [Google Scholar] [CrossRef]
  81. Fan, J.-L.; Yu, P.; Li, K.; Xu, M.; Zhang, X. A levelized cost of hydrogen (LCOH) comparison of coal-to-hydrogen with CCS and water electrolysis powered by renewable energy in China. Energy 2022, 242, 123003. [Google Scholar] [CrossRef]
  82. XE.com Inc. 1 USD to CNY—Convert US Dollars to Chinese Yuan Renminbi. 2024. Available online: https://www.xe.com/currencyconverter/convert/?Amount=1&From=USD&To=CNY (accessed on 7 January 2024).
  83. Marzouk, O.A. Levelized cost of green hydrogen (LCOH) in the Sultanate of Oman using H2A-Lite with polymer electrolyte membrane (PEM) electrolyzers powered by solar photovoltaic (PV) electricity. In Proceedings of the International Conference on Energy and Green Computing (ICEGC’2023), Fez, Morocco, 23–24 November 2023; Volume 469, p. 00101. [Google Scholar] [CrossRef]
  84. Vartiainen, E.; Breyer, C.; Moser, D.; Medina, E.R.; Busto, C.; Masson, G.; Bosch, E.; Jäger-Waldau, A. True cost of solar hydrogen. Sol. RRL 2022, 6, 2100487. [Google Scholar] [CrossRef]
  85. XE.com Inc. 1 EUR to USD—Convert Euros to US Dollars. 2024. Available online: https://www.xe.com/currencyconverter/convert/?Amount=1&From=EUR&To=USD (accessed on 7 January 2024).
  86. Hydrogen Council. Path to Hydrogen Competitiveness—A Cost Perspective. 2020. Available online: https://hydrogencouncil.com/wp-content/uploads/2020/01/Path-to-Hydrogen-Competitiveness_Full-Study-1.pdf (accessed on 11 May 2023).
  87. Janssen, J.L.L.L.C.C.; Weeda, M.; Detz, R.J.; van der Zwaan, B. Country-specific cost projections for renewable hydrogen production through off-grid electricity systems. Appl. Energy 2022, 309, 118398. [Google Scholar] [CrossRef]
  88. Hydrogen Council. Hydrogen Insights 2023. 2023. Available online: https://hydrogencouncil.com/wp-content/uploads/2023/05/Hydrogen-Insights-2023.pdf (accessed on 28 June 2023).
  89. IRENA [International Renewable Energy Agency]. Green Hydrogen Cost Reduction: Scaling up Electrolysers to Meet the 1.5°C Climate Goal. 2020. Available online: https://www.irena.org/-/media/Files/IRENA/Agency/Publication/2020/Dec/IRENA_Green_hydrogen_cost_2020.pdf (accessed on 22 May 2023).
  90. IRENA and Bluerisk [International Renewable Energy Agency, and Bluerisk—A Water Strategy and Data Analytics Consultancy]. Water for Hydrogen Production. Joint Report. 2023. Available online: https://mc-cd8320d4-36a1-40ac-83cc-3389-cdn-endpoint.azureedge.net/-/media/Files/IRENA/Agency/Publication/2023/Dec/IRENA_Bluerisk_Water_for_hydrogen_production_2023.pdf (accessed on 25 December 2023).
  91. Yang, L.; Lv, H.; Jiang, D.; Fan, J.; Zhang, X.; He, W.; Zhou, J.; Wu, W. Whether CCS technologies will exacerbate the water crisis in China?—A full life-cycle analysis. Renew. Sustain. Energy Rev. 2020, 134, 110374. [Google Scholar] [CrossRef]
  92. Marzouk, O.A. Performance analysis of shell-and-tube dehydrogenation module. Int. J. Energy Res. 2017, 41, 604–610. [Google Scholar] [CrossRef]
  93. Beswick, R.R.; Oliveira, A.M.; Yan, Y. Does the green hydrogen economy have a water problem? ACS Energy Lett. 2021, 6, 3167–3169. [Google Scholar] [CrossRef]
  94. dena and WEC [Deutsche Energie-Agentur GmbH—German Energy Agency, and World Energy Council—Germany Section]. Global Harmonisation of Hydrogen Certification—Overview of Global Regulations and Standards for Renewable Hydrogen. Report. 2022. Available online: https://www.weltenergierat.de/wp-content/uploads/2022/01/dena_WEC_Harmonisation-of-Hydrogen-Certification_digital_final.pdf (accessed on 25 December 2023).
  95. IEA [International Energy Agency]. Global Hydrogen Review 2023. Annual Report. 2023. Available online: https://www.iea.org/reports/global-hydrogen-review-2023 (accessed on 18 October 2023).
  96. IRENA and WTO [International Renewable Energy Agency, and World Trade Organization]. International Trade and Green Hydrogen—Supporting the Global Transition to a Low-Carbon Economy. Joint Report. 2023. Available online: https://mc-cd8320d4-36a1-40ac-83cc-3389-cdn-endpoint.azureedge.net/-/media/Files/IRENA/Agency/Publication/2023/Dec/IRENA_WTO_International_trade_green_hydrogen_2023.pdf (accessed on 25 December 2023).
  97. Galassi, M.C.; Papanikolaou, E.; Baraldi, D.; Funnemark, E.; Håland, E.; Engebø, A.; Haugom, G.P.; Jordan, T.; Tchouvelev, A.V. HIAD–hydrogen incident and accident database. Int. J. Hydrogen Energy 2012, 37, 17351–17357. [Google Scholar] [CrossRef]
  98. Merilo, E.G.; Groethe, M.A.; Colton, J.D.; Chiba, S. Experimental study of hydrogen release accidents in a vehicle garage. Int. J. Hydrogen Energy 2011, 36, 2436–2444. [Google Scholar] [CrossRef]
  99. Mohammadfam, I.; Zarei, E. Safety risk modeling and major accidents analysis of hydrogen and natural gas releases: A comprehensive risk analysis framework. Int. J. Hydrogen Energy 2015, 40, 13653–13663. [Google Scholar] [CrossRef]
  100. Abohamzeh, E.; Salehi, F.; Sheikholeslami, M.; Abbassi, R.; Khan, F. Review of hydrogen safety during storage, transmission, and applications processes. J. Loss Prev. Process Ind. 2021, 72, 104569. [Google Scholar] [CrossRef]
  101. NOAA [National Oceanic and Atmospheric Administration]. Computer-Aided Management of Emergency Operations (CAMEO) Chemicals|Online Database of Hazardous Materials|Chemical Datasheet|Hydrogen. 2024. Available online: https://cameochemicals.noaa.gov/chemical/8729 (accessed on 7 January 2024).
  102. Beasy, K.; Emery, S.; Pryor, K.; Vo, T.A. Skilling the green hydrogen economy: A case study from Australia. Int. J. Hydrogen Energy 2023, 48, 19811–19820. [Google Scholar] [CrossRef]
  103. Sandri, O.; Holdsworth, S.; Wong, P.S.P.; Hayes, J. Upskilling plumber gasfitters for hydrogen: An empirical study using the Theory of Planned Behavior. Renew. Energy 2024, 221, 119800. [Google Scholar] [CrossRef]
  104. Ricci, M.; Bellaby, P.; Flynn, R. What do we know about public perceptions and acceptance of hydrogen? A critical review and new case study evidence. Int. J. Hydrogen Energy 2008, 33, 5868–5880. [Google Scholar] [CrossRef]
  105. Gordon, J.A.; Balta-Ozkan, N.; Nabavi, S.A. Homes of the future: Unpacking public perceptions to power the domestic hydrogen transition. Renew. Sustain. Energy Rev. 2022, 164, 112481. [Google Scholar] [CrossRef]
  106. Dolci, F.; Thomas, D.; Hilliard, S.; Guerra, C.F.; Hancke, R.; Ito, H.; Jegoux, M.; Kreeft, G.; Leaver, J.; Newborough, M.; et al. Incentives and legal barriers for power-to-hydrogen pathways: An international snapshot. Int. J. Hydrogen Energy 2019, 44, 11394–11401. [Google Scholar] [CrossRef]
  107. Bartlett, J.; Krupnick, A. Decarbonized Hydrogen in the US Power and Industrial Sectors: Identifying and Incentivizing Opportunities to Lower Emissions. RRF (Resources for the Future) Report. 2020. Available online: https://media.rff.org/documents/RFF_Report_20-25_Decarbonized_Hydrogen.pdf (accessed on 8 January 2024).
  108. Kristiansen, T. Pricing of Contracts for Difference in the Nordic market. Energy Policy 2004, 32, 1075–1085. [Google Scholar] [CrossRef]
  109. Hesel, P.; Braun, S.; Zimmermann, F.; Fichtner, W. Integrated modelling of European electricity and hydrogen markets. Appl. Energy 2022, 328, 120162. [Google Scholar] [CrossRef]
  110. BMWK [German: Bundesministerium für Wirtschaft und Klimaschutz, English: Federal Ministry for Economic Affairs and Climate Action]. H2Global—Term Sheet: Hydrogen Purchase Agreements (Draft 7 July 2022)—Work in Progress/Subject to Alignment with BMWK. 2022. Available online: https://www.bmwk.de/Redaktion/DE/Downloads/h2global/draft-term-sheet-hpa-market-consultation-h2global.pdf (accessed on 31 July 2023).
  111. BMWK [German: Bundesministerium für Wirtschaft und Klimaschutz, English: Federal Ministry for Economic Affairs and Climate Action]. Newsletter Energiewende—What Exactly Is H2Global? 2022. Available online: https://www.bmwk-energiewende.de/EWD/Redaktion/EN/Newsletter/2022/01/Meldung/direkt-account.html (accessed on 8 January 2024).
  112. TED [Tenders Electronic Daily]. Supplies—675894-2022—TED Tenders Electronic Daily. 2022. Available online: https://ted.europa.eu/udl?uri=TED:NOTICE:675894-2022:TEXT:EN:HTML&tabId=0 (accessed on 8 January 2024).
  113. Dillman, K.J.; Heinonen, J. A ‘just’ hydrogen economy: A normative energy justice assessment of the hydrogen economy. Renew. Sustain. Energy Rev. 2022, 167, 112648. [Google Scholar] [CrossRef]
  114. Dillman, K.J.; Heinonen, J.; Davíðsdóttir, B. Of booms, busts, and sustainability: A socio-technical transition study of Iceland’s mobility regime and its proximity to strong sustainability. Environ. Innov. Soc. Transit. 2023, 48, 100755. [Google Scholar] [CrossRef]
  115. Wang, Q.; Ge, Y.; Li, R. Does improving economic efficiency reduce ecological footprint? The role of financial development, renewable energy, and industrialization. Energy Environ. 2023; advance online publication. [Google Scholar] [CrossRef]
  116. Wang, Q.; Wang, L.; Li, R. Trade openness helps move towards carbon neutrality—Insight from 114 countries. Sustain. Dev. 2023; advance online publication. [Google Scholar] [CrossRef]
  117. Li, R.; Wang, Q.; Li, L.; Hu, S. Do natural resource rent and corruption governance reshape the environmental Kuznets curve for ecological footprint? Evidence from 158 countries. Resour. Policy 2023, 85, 103890. [Google Scholar] [CrossRef]
  118. Wang, Q.; Sun, T.; Li, R. Does artificial intelligence promote green innovation? An assessment based on direct, indirect, spillover, and heterogeneity effects. Energy Environ. 2024; advance online publication. [Google Scholar] [CrossRef]
  119. Wang, Q.; Hu, S.; Li, R. Could information and communication technology (ICT) reduce carbon emissions? The role of trade openness and financial development. Telecommun. Policy, 2023; advance online publication. [Google Scholar] [CrossRef]
  120. Wang, Q.; Ren, F.; Li, R. Exploring the impact of geopolitics on the environmental Kuznets curve research. Sustain. Dev. 2023; advance online publication. [Google Scholar] [CrossRef]
  121. Zheng, L.; Zhao, D.; Wang, W. Medium and long-term hydrogen production technology routes and hydrogen energy supply scenarios in Guangdong Province. Int. J. Hydrogen Energy 2024, 49, 1–15. [Google Scholar] [CrossRef]
  122. Hassan, Q.; Algburi, S.; Sameen, A.Z.; Salman, H.M.; Jaszczur, M. Green hydrogen: A pathway to a sustainable energy future. Int. J. Hydrogen Energy 2024, 50, 310–333. [Google Scholar] [CrossRef]
  123. Khatib, H. IEA world energy outlook 2011—A comment. Energy Policy 2012, 48, 737–743. [Google Scholar] [CrossRef]
  124. Fazendeiro, L.M.; Simões, S.G. Historical variation of IEA energy and CO2 emission projections: Implications for future energy modeling. Sustainability 2021, 13, 7432. [Google Scholar] [CrossRef]
  125. Dechamps, P. The IEA World Energy Outlook 2022—A brief analysis and implications. Eur. Energy Clim. J. 2023, 11, 100–103. [Google Scholar] [CrossRef]
  126. Shen, H.; Wen, X.; Trutnevyte, E. Accuracy assessment of energy projections for China by Energy Information Administration and International Energy Agency. Energy Clim. Change 2023, 4, 100111. [Google Scholar] [CrossRef]
  127. Lee, R. The outlook for population growth. Science 2011, 3336042, 569–573. [Google Scholar] [CrossRef] [PubMed]
  128. Vehmas, J.; Kaivo-Oja, J.; Luukkanen, J. Energy efficiency as a driver of total primary energy supply in the EU-28 countries–incremental decomposition analysis. Heliyon 2018, 4, e00878. [Google Scholar] [CrossRef]
  129. Marzouk, O.A. Benchmarking the Trends of Urbanization in the Gulf Cooperation Council: Outlook to 2050. In Proceedings of the 1st National Symposium on Emerging Trends in Engineering and Management (NSETEM’2017), Muscat, Sultanate of Oman, 13–14 November 2017. Paper 17SIMP0051. [Google Scholar] [CrossRef]
  130. Gough, C.; Upham, P. Biomass energy with carbon capture and storage (BECCS or Bio-CCS). Greenh. Gases Sci. Technol. 2011, 1, 324–334. [Google Scholar] [CrossRef]
  131. Fajardy, M.; Mac Dowell, N. Can BECCS deliver sustainable and resource efficient negative emissions? Energy Environ. Sci. 2017, 10, 1389–1426. [Google Scholar] [CrossRef]
  132. Liu, X.; Elgowainy, A.; Vijayagopal, R.; Wang, M. Well-to-wheels analysis of zero-emission plug-in battery electric vehicle technology for medium-and heavy-duty trucks. Environ. Sci. Technol. 2020, 55, 538–546. [Google Scholar] [CrossRef]
  133. Marzouk, O.A. Urban air mobility and flying cars: Overview, examples, prospects, drawbacks, and solutions. Open Eng. 2022, 12, 662–679. [Google Scholar] [CrossRef]
  134. IEA [International Energy Agency]. Global Hydrogen Production by Technology in the Net Zero Scenario, 2019–2030—Last Updated 8 Sep 2022—IEA Data and Statistics. 2022. Available online: https://www.iea.org/data-and-statistics/charts/global-hydrogen-production-by-technology-in-the-net-zero-scenario-2019-2030 (accessed on 20 January 2024).
  135. IEA [International Energy Agency]. Hydrogen Production and Infrastructure Projects Database. 2023. Available online: https://www.iea.org/data-and-statistics/data-product/hydrogen-production-and-infrastructure-projects-database (accessed on 20 January 2024).
  136. IEA [International Energy Agency]. Global Hydrogen Demand by Sector in the Net Zero Scenario, 2019–2030—Last Updated 16 Sep 2022—IEA Data and Statistics. 2022. Available online: https://www.iea.org/data-and-statistics/charts/global-hydrogen-demand-by-sector-in-the-net-zero-scenario-2019-2030 (accessed on 20 January 2024).
  137. Liu, G.-S.; Strezov, V.; Lucas, J.A.; Wibberley, L.J. Thermal investigations of direct iron ore reduction with coal. Thermochim. Acta 2004, 410, 133–140. [Google Scholar] [CrossRef]
  138. Bhaskar, A.; Assadi, M.; Somehsaraei, H.N. Decarbonization of the iron and steel industry with direct reduction of iron ore with green hydrogen. Energies 2020, 13, 758. [Google Scholar] [CrossRef]
  139. MoNRE [Ministry of New and Renewable Energy, Government of India]. National Green Hydrogen Mission. 2023. Available online: https://cdnbbsr.s3waas.gov.in/s3716e1b8c6cd17b771da77391355749f3/uploads/2023/01/2023012338.pdf (accessed on 24 January 2024).
  140. US DoE [Department of Energy, United States]. Hydrogen Program Mission and Goals. 2024. Available online: https://www.hydrogen.energy.gov/about/mission (accessed on 24 January 2024).
  141. Hydrom [Hydrogen Oman]. Hydrom—About Us. 2024. Available online: https://hydrom.om/Hydrom.aspx?cms=iQRpheuphYtJ6pyXUGiNqiQQw2RhEtKe (accessed on 24 January 2024).
Figure 1. Global CO2 emissions, including industrial processes and flaring emissions (data source: IEA). The black line (from 2010 to 2022) represents historical values rather than predictions, and thus these values are identical for either the STEPS scenario or the NZE scenario.
Energies 17 00646 g001
Figure 2. Global net annual CO2 emissions, related to energy and process activities (data source: IRENA).
Energies 17 00646 g002
Figure 3. Global total electricity generation (data source: IEA). The black line (from 2010 to 2022) represents historical values rather than predictions, and thus these values are identical for either the STEPS scenario or the NZE scenario.
Energies 17 00646 g003
Figure 4. Global total electricity generation (data source: IRENA).
Energies 17 00646 g004
Figure 5. Global total electricity capacity (data source: IEA). The black line (from 2010 to 2022) represents historical values rather than predictions, and thus these values are identical for either the STEPS scenario or the NZE scenario.
Energies 17 00646 g005
Figure 6. Global total installed electricity capacity (data source: IRENA).
Energies 17 00646 g006
Figure 7. Global total final consumption of energy (data source: IEA). The black line (from 2010 to 2022) represents historical values rather than predictions, and thus these values are identical for either the STEPS scenario or the NZE scenario.
Energies 17 00646 g007
Figure 8. Breakdown of the global total final energy consumption by energy carrier (data source: IRENA). Hydrogen in the figure refers to clean hydrogen (electrolysis-based green hydrogen and blue hydrogen). E-fuels in the figure refer to e-ammonia (green ammonia) and e-methanol (green methanol).
Energies 17 00646 g008
Figure 9. World population (data source: IEA).
Energies 17 00646 g009
Figure 10. Global CO2 intensity of electricity generation (data source: IEA). The black line (from 2010 to 2022) represents historical values rather than predictions, and thus these values are identical for either the STEPS scenario or the NZE scenario.
Energies 17 00646 g010
Figure 11. Global demand for conventional crude oil (data source: IEA). The black line (from 2010 to 2022) represents historical values rather than predictions, and thus these values are identical for either the STEPS scenario or the NZE scenario.
Energies 17 00646 g011
Figure 12. Global electricity generation from renewables, and its share in total electricity generation (data source: IRENA).
Energies 17 00646 g012
Figure 13. Global total installed electricity capacity from renewables, and its share in total electricity capacity (data source: IRENA).
Energies 17 00646 g013
Figure 14. Breakdown of total electricity generation by source (data source: IRENA).
Energies 17 00646 g014
Figure 15. Global electrification percentage in the total final energy consumption (data source: IRENA).
Energies 17 00646 g015
Figure 16. Global hydrogen production by technology, historical values (data source: IEA).
Energies 17 00646 g016
Figure 17. Global low-emission hydrogen production, and the portion of electrolysis-based green hydrogen in this (data source: IEA).
Energies 17 00646 g017
Figure 18. Global total electrolyzer capacity for producing electrolysis-based green hydrogen (data source: IRENA).
Energies 17 00646 g018
Figure 19. Global hydrogen demand by sector, historical values (data source: IEA).
Energies 17 00646 g019
Figure 20. Globally region-to-region traded low-emission hydrogen and its derivatives, and the share of these traded items in the global low-emission hydrogen demand and its derivatives (data source: IEA). Trading here refers to the exchange between any two geographic regions (not between individual countries), and excludes exchange within the same region. There are seven geographic regions considered in IEA modeling, which are: (1) North America (Canada, USA, Mexico), (2) Central and South America, (3) Europe (including Turkey), (4) Africa (including all North African countries), (5) Middle East (including Iran), (6) Eurasia (Russia and the Caspian zone), and (7) Asia Pacific (including India and Pakistan).
Energies 17 00646 g020
Table 1. Global low-emission hydrogen production, and the share of the electrolysis-based green hydrogen of this production (IEA).
Low-Emission Hydrogen Production, in Mt H2Water-Electrolysis Hydrogen Production, in Mt H2Share of Electrolysis-Based Hydrogen Production (in Low-Emission Hydrogen)
YearSTEPSNZESTEPSNZESTEPSNZE
2022100%
203077055171%73%
2050304202232773%78%
Table 2. Global production of clean hydrogen, in Mt H2/yr (IRENA).
YearPES1.5°C
20200.7 *
20302125
205021523
* Based on operational projects’ capacity through October 2022 (IRENA used the IEA Hydrogen Project Database [135]).
Table 3. Global low-emission hydrogen-based liquid fuel demand, and its ratio to the conventional crude oil demand (IEA).
Low-Emission Hydrogen-Based Liquid Fuel * Demand, in Mboe/d **Conventional Crude Oil Demand, in Mb/dRatio of Low-Emission Hydrogen-Based Liquid Fuel Demand to Conventional Crude Oil Demand
YearSTEPSNZESTEPSNZESTEPSNZE
2010067.40.0%
2022062.80.0%
203000.761.3480.0%1.5%
20500.26.058.215.80.3%38.0%
* Low-emission hydrogen-based liquid fuels (LELs) include ammonia, methanol, and other synthetic liquid hydrocarbons (such as kerosene) derived from low-emission hydrogen. If carbon inputs (like CO2) are needed to synthesize such fuels, they must not come from fossil fuel emissions or from process emissions. ** Low-emission hydrogen-based liquid fuels (LELs) are expressed in energy equivalent volumes, and are reported in Mboe/d (million barrels of oil equivalent per day).
Table 4. Global electricity generation from low-emission hydrogen and derived ammonia, and the share of this in total electricity generation (IEA).
Electricity Generation from Low-Emission Hydrogen and Derived Ammonia, in TWhTotal Electricity Generation, in TWhShare of Electricity Generation from Low-Emission Hydrogen and Derived Ammonia (in Total Electricity Generation)
YearSTEPSNZESTEPSNZESTEPSNZE
2010021,5330%
2021028,3460%
2022029,0330%
20302237335,80238,2070%1%
205091116153,98576,8380%2%
Table 5. Global electricity capacity due to low-emission hydrogen and derived ammonia, and the share of this in the total electricity capacity (IEA).
Electricity Capacity by Low-Emission Hydrogen and Derived Ammonia, in GWTotal Electricity Capacity, in GWShare of Electricity Capacity by Low-Emission Hydrogen and Derived Ammonia (in Total Electric Capacity)
YearSTEPSNZESTEPSNZESTEPSNZE
2010051870%
2021082300%
2022086430%
2030812914,16816,1800%1%
20501942725,95636,9560%1%
Table 6. Global clean hydrogen (direct use and e-fuels) share in total final energy consumption (IRENA).
YearPES1.5°C
2020<1% (TFEC 374 EJ/yr)
2030<1%2%
2050<1%14% (TFEC 353 EJ/yr)
Table 7. Transport sector: global clean hydrogen (direct use and e-fuels) share in the final energy consumption within that sector (IRENA).
YearPES1.5°C
2020<1%
2030<1%<1%
20502%24%
Table 8. Industry sector: global clean hydrogen (direct use and e-fuels) share in the final energy consumption within that sector (IRENA).
YearPES1.5°C
2020<1%
2030<1%5%
2050<1%17%
Table 9. Building sector: global clean hydrogen (direct use and e-fuels) share in the final energy consumption within that sector (IRENA).
YearPES1.5°C
2020<1%
2030<1%<1%
2050<1%<1%
Disclaimer/Publisher’s Note: The statements, opinions and data contained in all publications are solely those of the individual author(s) and contributor(s) and not of MDPI and/or the editor(s). MDPI and/or the editor(s) disclaim responsibility for any injury to people or property resulting from any ideas, methods, instructions or products referred to in the content.

