Abstract
Machine learning (ML) algorithms are now part of everyday life, as many technological devices use these algorithms. The spectrum of uses is wide, but it is evident that ML represents a revolution that may change almost every human activity. However, as for all innovations, it comes with challenges. One of the most critical of these challenges is providing users with an understanding of how models’ output is related to input data. This is called “interpretability”, and it is focused on explaining what feature influences a model’s output. Some algorithms have a simple and easy-to-understand relationship between input and output, while other models are “black boxes” that return an output without giving the user information as to what influenced it. The lack of this knowledge creates a truthfulness issue when the output is inspected by a human, especially when the operator is not a data scientist. The Building and Construction sector is starting to face this innovation, and its scientific community is working to define best practices and models. This work is intended for developing a deep analysis to determine how interpretable ML models could be among the most promising future technologies for the energy management in built environments.
1. Introduction
Machine learning (ML) is now used in many industrial and scientific fields, from aerospace to marketing and advertising. In the architecture, engineering and construction (AEC) sector, ML models and algorithms can be applied to building automation systems (BASs) and building digital twins (BDT) to improve building energy efficiency and flexibility by making use of widely available building operational data [1]. Such systems can automate building management, reducing global consumption of primary resources (i.e., energy and water), increasing indoor comfort, increasing structural safety, and reducing the need for building maintenance. It is well known that the building sector is one of the major contributors to carbon emissions, accounting for up to 36% of global energy consumption and 37% of CO2 emissions [2,3]. Moreover, the operation phase can account for up to 80–90% of the total energy consumption throughout a building’s entire life cycle [4]. Considering these data, the size of the impact of the building sector on global warming is evident. A reduction in such consumption is crucial for reaching carbon neutrality, as advised in the Sustainable Development Goals [5,6] proposed by the United Nations and for reaching 55% CO2 reduction by 2030, as recommended in the Green New Deal [7].
A good way to reach such challenging goals is to implement inside BASs or BDT ML models to improve building sustainability and reduce the related environmental impact. There are many such examples in the literature, wherein heating, ventilation, and air conditioning (HVAC); energy storage; renewable-energy production systems and smart lighting interface with automatic control systems [8,9,10,11,12]. Traditionally, these systems were managed using experience-based algorithms such as “proportional integrative and derivative” (PID) controllers, threshold actuators or, in some cases, physical models. However, this approach can be difficult to implement due to the complex interactions between the different energy systems that coexist inside a building [13]. However, owing to the recent diffusion of Internet of Things (IoT) devices, it is possible to obtain real-time data at low costs. Moreover, most of these devices are widely used, making them a reliable and simple solution for monitoring the environment [14,15,16]. Then, the data collected can be easily sent to big-data platforms to develop innovative control strategies and historical analysis. ML models can be implemented directly in IoT devices, into an edge or fog node (a system able to collect and process data coming from different IoT devices and placed near them or somewhere inside the infrastructure), or in a remote/cloud server [17]. This system allows the models to learn directly from the environment, to consider the actual and ever-changing needs of users, and to adapt to changes almost in real time. This approach is called “data-driven” and is considered paradigm of digitalization [18,19]. With this approach, buildings can be monitored and can be enabled to make decisions autonomously, with or without human intervention [20]. By integrating real-time data with geometrical information from the project phase (as from building information modelling, or BIM), it is possible to develop digital twins (DTs), a digital construct that can replicate and simulate the behaviour of a building in real time. It is important to emphasize that to develop a proper DT, the system must be able to “interact” with the environment. There is also the possibility of employing a human-in-the-loop approach [21,22]. Therefore, ML models are adopted by operators as a part of the control process [23]. In the future, ML will likely be used in almost all the process related to building management and energy systems and will be considered to have the same importance as other components, such as HVAC and electrical systems.
However, many models are essentially “black boxes”, making it difficult for users to understand how they work and the relationship between input and output data. This lack of transparency can lead to a truthfulness issue for lay users because it may be difficult to understand results and resolve problems [24]. Such models are opposed to “white boxes”, which are transparent and interpretable. However, white boxes are purely theoretical, and most ML models can be considered “grey boxes,” being somewhere in between the two extremes. Interpretable, or explainable, ML models are intended to solve this issue by providing information on how and why the outcome is generated. Their aim is to explain the relationship between the cause and the effect observed within a system, giving the user information about what types of input affect the output. In other words, such systems make known to the user which inputs are the most predictive of the output (i.e., which have the greatest effect on the output) and how predictions change depending on the inputs (i.e., the effect of changing the input). Interpretable ML models are currently widely discussed in the scientific and industrial communities because of their relevance. The concepts of interpretability and explainability concepts are also defined in the ISO/IEC TR 29119-11:2020 regulation, though with a difference: interpretability is defined as the level of knowledge of how an artificial intelligence (AI) model works, while explainability is defined as the level of understanding of how an AI model returns a given result. The difference is subtle, and the two concepts are usually used interchangeably.
Therefore, while ML models are increasingly used in BASs and BDT, there is a in the understanding of results that can lead to a lack of trust from users. Interpretability aims to bridge this gap using specially developed ML models and algorithms. However, the scientific community has not reached a global agreement about how to evaluate success with regard to interpretability. Therefore, the present work aims to discuss possible future directions for this new and debated field. Starting from a focus on the main research fields and using examples from the scientific literature, we introduce the meaning and importance of interoperability, with a focus on definitions; discuss the main characteristics of interpretable models; and introduce interpretability levels. The main interpretability models in use are described with reference to the different fields of usage and with examples and case studies from the international literature. In conclusion, it is evident that there is a lack of global definitions despite the wide international interest in the topic. Therefore, it would be advisable to adopt a common framework for ML interpretability to broaden knowledge about its benefits and challenges.
2. Fields of Application
Over the last decade, the number of ML applications dedicated to energy management for building environment has increased significantly, as evidenced by the high number of scientific studies and reviews in the literature [11,24,25,26,27,28,29,30,31,32,33,34,35,36,37,38]. The main topics investigated are prediction of load and power, fault detection and diagnosis (FDD), and occupancy-related applications. Moreover, many industries have included fundamental algorithms inside their commercial platforms. For instance, IBM implemented DT features inside its “Maximo” platform [39]. Another example is Microsoft Azure, which includes programmable ML features applicable to many use cases, from energy management to mobility infrastructure [40,41], as is also the case for Amazon Web Service (AWS) [42,43]. There are also other commercial platforms, but the focus of this work is on the application of ML interpretable models, not the development of a discussion on DT platforms. For further information, the reader can consult reviews specific to that topic [44,45].
What follows is a brief description of some of the most relevant use cases for the application of ML models in building energy management.
2.1. Load and Power Prediction
Load prediction (LP) is related to the ability of a ML model to develop accurate predictions of the energy usage of a system/building in terms of power and energy consumption. By contrast, power prediction (PP) is used to predict the amount of power generated by renewable/traditional power-generation systems, such as photovoltaic (PV) panels, wind turbines, co-generators, or other power-generation devices. The main objective of LP and PP is to increase buildings’ sustainability by reducing the energy taken from the electrical network [27], instead relying as much as possible on locally generated power. This concept can be implemented by adaptation of the loads based on the production schedule or by using energy when the electrical network has a surplus, as in the case of local energy districts [46,47]. ML models designed for these applications can be used for both demand-side management and prediction. For instance, using a demand-side model, it is possible to balance the energy supply and demand in real time while using renewable energy sources as much as possible. Using a predictive model, local energy storage can be optimized to regulate battery charging or the operation of power equipment based on when during the day the cost of energy is lowest [48,49]. Therefore, the model’s choice depends on the goal and the systems under analysis. As an example, if there are straight constraints on power-system operations, a demand-side model is advisable; if instead, the goal is to reduce the global energy usage, a model predictive control is the better choice [50]. ML models do not necessarily require physical information related to equipment (energy equations, efficiencies, etc.) but can use historicized data for training. By this method, application development is quicker, but the time before the applications are fully operative can be long because a historical database covering a sufficiently long period is required [51].
Among the different types of ML algorithms, such as artificial neural networks (ANNs), tree-based methods, and deep neural networks (DNNs), autoregressive models are the most used, as evidenced by many literature studies [27,52,53,54]. This is not surprising because ANNs are highly suitable for managing complex real-world problems such as prediction of solar radiation [55] or heating/cooling efficiency [56]. Moreover, ANNs are considerably more flexible than tree-based methods because they do not depend on linear approximations or binary logics, as those methods do. DNNs seems to be very promising for load prediction, especially if they are coupled with long short-term memory layers (LSMT) [57].
2.2. Fault Detection and Diagnosis
FDD is a widely discussed topic because it is essential to maintain building efficiency, especially in buildings where energy-intensive loads (such as chillers and heaters) are installed [58,59]. Using ML, it is possible to monitor the status and life cycle of devices using self-learning energy signature models. For example, such a system might be used in contexts where electrical motors are installed [60,61]. A correct assessment of the status of energy appliances leads to a reduction in energy consumption because timely responses to failures and ageing are directly related to energy savings. For example, fan malfunctions can increase the fan’s electrical consumption by up to 10% [62] and mechanical failures can decrease the coefficient of performance (COP) of HVAC systems by up to 33% [62]. Other FDD ML techniques use the average energy consumption of a device to detect anomalies [63], monitor production (for PV panels [64]) or vibration (for wind turbines [65]). It is also possible to use device-independent models that are trained on common electrical equipment and devices [66,67]. The most-used ML models are support vector machines (SVMs), ANN, convolutional neural network (CNN) models, recurrent neural network (RNN) models, and deep generative systems [29]. Moreover, faults are also related to safety and security, as evidenced by some famous disasters. Famous examples include the fire in the cathedral of Notre Dame De Paris in 2019, in which a short circuit caused a fire that devoured part of the building [68,69]; the Windsor Building fire in Madrid (2015) [70]; and the Cathedral of St. Peter and St. Paul of Nantes fire in France (2020) [71]. Tne use of appropriate technological measures results in a reduction in the probability of faults occurring and can help to detect them before they cause damage. FDD is thus also related to building safety and security; it is not purely a matter of energy use.
2.3. Occupancy-Related Applications
Occupancy-related applications are intended to monitor the presence and activity of people inside an environment. This monitoring is possible thanks to occupancy-level prediction and activity recognition, which are two branches of computer Vision models that use ML and AI models to analyse the number of people inside an environment and their current activities. One application of such an algorithm is seasonal-customized occupancy prediction (SCOP). Its value can be calculated using a gradient-boosting decision tree, a random forest model, or an ANN with an overall accuracy above 80% [72]. It is also possible to obtain occupancy data from indirect measurements, as is done for common indoor air pollutants such as CO2 [73], internet traffic [74], mobile phones [75], power loads [76,77,78], expected indoor activities [79], air conditioning systems and temperature profiles [80] and lights [81]. Data from different sources and devices can also be considered conjointly [82,83,84,85]. It must be noted that occupancy is strictly related to indoor activities and schedules; therefore, every application is based on the specific characteristics and usage of the single room or environment. To obtain accurate information, it is mandatory to tailor models and input data based on the expected habits of the occupants. IoT plays a fundamental role in this process, making it possible to obtain data on parameters that are otherwise difficult to evaluate. However, knowledge of occupancy alone is meaningless for the optimization of a building’s energy balance. It must be used as an input for other ML models or in simple control routines (i.e., lights on or off). For example, in energy-related applications, it is possible to use occupancy data to regulate thermostats [86,87], control HVAC systems and air-exchange rate [62,88,89,90,91,92], control lighting systems [86,87,93], and generally control electrically powered systems [94]. To give a reference value, energy consumption could be reduced by up to 23% by using occupancy predictions to control HVAC systems and by up to 20% beyond that value by using activity recognition [34,95].
It is also possible to increase the complexity of the control system to incorporate other parameters, such as those related to indoor environmental quality. For example, predicted means vote (PVM) systems can be used to reduce a building’s energy consumption by up to 58% and CO2 emissions by up to 24% [33,96]. It is also possible to calculate PVM and PPD using classification and regression trees (CART), with good accuracy [97], or the ASHRAE seven-value scale [98]. Another field of application is the evaluation of indoor air quality [86,87,93], which can lead to similar advantages in energy savings.
3. Machine Learning Interpretability
One of the main problems that can arise when a ML model is used is that it can be difficult to discern what data affect the process, how they affect it, and which feature has the greatest influence on the predictions. Sometimes, the efforts related to the comprehension these elements be beyond human capabilities and ML models are not worth using [99]. An example of this limitation is for the FDD of electrical equipment using ANN: although the problem is well defined, the data that affect the results is not always easy to understand and can vary depending on the device and the specific fault. The ANN input structure is clear to the user, but the ways in which the data are interpreted by the model are obscured. This disadvantage can reduce the use of ML models due to a lack of interpretability. The relationship between the fault and the cause may be difficult to identify. ANNs are composed of many hidden layers that are trained on the dataset, the outputs of which are usually not understandable by humans. Moreover, as the number of layers increases (as for DNNs), the model becomes deeper and darker. It is possible to employ simpler models such as support vector machine (SVM), k-NN and regressors; however, there is an associated trade-off in terms of accuracy [100,101,102]. Despite the current large-scale adoption of ML for use in everyday tasks, the lack of interpretability is one of the main challenges for real-world applications [103]. This issue is commonly related to a general absence of “real” physical data from the process and to the presence of incomplete or badly structured data [104]. It is possible to represent the different ML models on an accuracy/interpretability plane, as shown in Figure 1. The vertical arrow represents the rise in accuracy associated with more complex “black box” models, while the horizontal arrow represents the intrinsic interpretability of simpler ones.

Figure 1.
Accuracy– interpretability relationship for most common ML models. The increase in accuracy is associated with more complex “black box” models (vertical arrow), while most simple models have an intrinsic interpretability (horizontal arrow).
The “black box” ML models produce output without any explanations, and users usually need support in interpreting the results so that they can understand, control, and act on the physical environment. This opacity leads to scepticism in the building industry about the application of such models. Moreover, they are sometimes considered untrustworthy if they are not trained on real operational data. Therefore, scientists are working to generate accessible interpretations that can explain the ML model’s predictions without oversimplifying essential details or sacrificing performance [105,106,107,108]. For instance, considering a HVAC system, an interpretable model can explain why and how the efficiency of a system changes in relation to the input, thus increasing the user’s trust in the model (Figure 2).
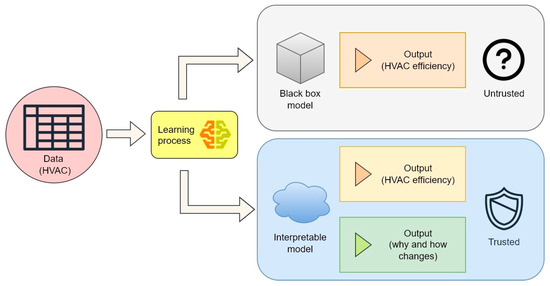
Figure 2.
Trust–interpretability relationship in M models; example using HVAC systems.
Moreover, it is possible to interpretate data on a global or local level, depending on the specific requirements of the application. Global interpretation explains an ML model based on a full view of the data structure, as opposed to local interpretation, which explains each prediction individually [24]. Global models are intended for correlating data with predictions, considering relationships within the whole input dataset. When applying such models, it is important for users to have an overview of the prediction process; for example, they may need an explanation of what features are most significant for predicting energy consumption. Instead, local models provide a more transparent understanding of how predictions are generated for a specific feature [24]. Therefore, they explain how every single input affects the prediction. Unlike for global models, such explanations are important in allowing users to trust the output and to understand whether it is correct. For example, local models can explain the effect on external air temperature on HVAC power consumption and efficiency. Global and local interpretations are graphically explained in Figure 3, using as reference standard layouts for K-means and general classification-tree models.
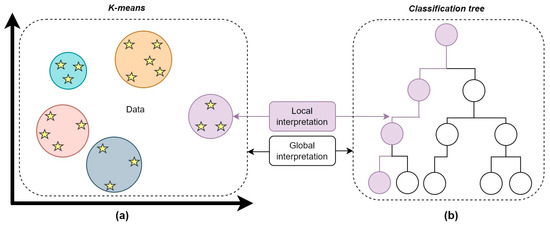
Figure 3.
Local and global interpretation, using as examples K-means (a) and classification-tree (b) models.
Interpretation is done before or after model training, depending on the model used:
- Ante-hoc models are interpretable before the training process;
- Post-Hoc models are interpretable after the training process.
Ante-hoc models are also called intrinsic or transparent models. For example, a linear regression is an ante-hoc model intended for forecasting the value of one variable based on the value of another [109]. The model is self-explanatory because it fits the expected value of a variable with a linear equation; this concept is easy to understand and explain [108]. Although linear regression is highly interpretable, it can be too simple to address complex problems encompassing many variables, such as the prediction of power consumption inside buildings [110]. Generalized additive models (GAMs) were developed to overcome the limits of linear regression by using a series of smoothing functions to better regress the data [111,112]. By contrast, post-hoc models can be applied to “black box” models after their training. They can return the dependency and significance of an input in relation to the output without giving information on the internal model structure. They can be interpreted by examining the interrelationships between input features and predictions without knowledge of the process [113,114]. These models are also called “surrogate” models because they act as an additional layer in data interpretation. One example of such a model is local interpretable model-agnostic explanations (LIME) [115], which will be discussed further in this work. The graphical representation in Figure 4 shows post-hoc and ante-hoc implementation in a common ML working flow; an ante-hoc flow involved the use of an interpretable model and goes directly to the evaluation step, while a post-hoc flow is developed using a surrogate model, which provides explanations after model training.

Figure 4.
Ante-hoc and post-hoc workflows for ML. Ante-hoc models are directly interpretable before training. By contrast, post-hoc models are explainable after a surrogate model is implemented, after training.
ML interpretability techniques can also be “model-agnostic” or “model-specific”. For example, an interpretability technique that can be used for a single ML model is “specific”; if it can be used with any model, it is “agnostic” (Figure 5).

Figure 5.
Model-agnostic and model-specific interpretability techniques for ML. On the left (a) model-specific techniques that can be used for a single ML model. On the right (b) model-agnostic techniques that are interoperable between different ML models.
Model-agnostic techniques can be used in combination with any ML model because they require only data and do not consider the models’ structure. Usually, post-hoc interpretability techniques are also model-agnostic [24]. An example is SHapley Additive exPlanations (SHAP), a post-hoc model-agnostic technique intended for approximating any ML model locally [115]. By contrast, model-specific techniques are dedicated to single ML models, providing interpretability to specific models. For example, an attention mechanism and perturbation-based approaches can be used in combination with ANNs to improve interpretability [116,117].
How to Assess ML Interpretability
Within the scientific community, there is no consensus about how to measure interpretability [106]. However, a common framework for the definition of interpretability is necessary. Doshi-Velez and Kim [118,119] proposed an evaluation methodology based on three main levels, as described below (Figure 6):

Figure 6.
Interpretability levels as proposed by Doshi-Velez and Kim [118,119].
The levels are related to the knowledge/experience of the user, the costs of development, and the degree of abstraction from the real process.
- Application-level (real task): The explanation is given at the end of the process, and its quality is evaluated by the end user. For example, a ML crack-detection software can locate cracks and marks them in images. At the application level, the end-user can test the crack-detection software directly to evaluate the model. This testing requires a good experimental setup and a good understanding of how the quality of the output is assessed. Therefore, the quality of the evaluation relies on the user knowledge/experience with regard to both the specific task and models.
- Human-level (simple task): the explanation is given at the application level. The difference is that the assessment is carried out not by a domain expert, but by anyone. This approach makes evaluation cheaper (because it is not necessary to find an expert), and it is easier to find testers. In this case, many explanations can be developed by the ML model, and the users choose the best one. However, this method is somewhat limited by the user and their capacity to make the correct choice; therefore, it is not suitable for complex tasks for which an expert is required for output evaluation.
- Function-level (proxy task): at this level, users are not required to assess the explanation. This level is intended for a model has been already evaluated and tested with human-level evaluation (level 2) or in an application-level evaluation (level 1). The task is performed autonomously by the ML algorithm, and the user is only a supervisor who trusts the model’s output.
Despite the proposal of interpretability levels and the associated taxonomy, many of the models/approaches developed by the scientific community lack a proper definition of interpretability or do not assess the effectiveness of their approach from an end-user perspective. This deficiency leads to difficulties in comparing different works and problems when the models are applied in the real world. Moreover, the evaluation is related to the use-case and should be developed with the participation of the users. This approach would be difficult or impossible in some cases for several reasons: data could be protected under a non-disclosure agreement (NDA), safety concerns may make testing difficult, or the end-user may not be interested in publishing the results. Considering the current interest in ML models and the high number of scientific papers related to the topic, it is advisable to adopt a common framework for interpretability assessment. Sucha framework could be used by all authors to evaluate and share the level of interpretability of their models.
4. Models and Techniques for Energy Assessment and Optimization for Built Environment
The variety of ML models is quite wide, with many variants having developed over time. However, they can be organized based on the task they perform, the type of learning they use, and the related input data [120]. The classification scheme is shown in Figure 7.
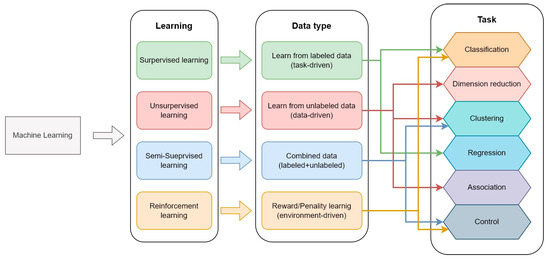
Figure 7.
Classification of ML models based on learning type and tasks.
It is not an objective of this paper to describe the learning methods of ML models. Therefore, for further detail, the reader can consult the literature specific to that subject [120,121,122,123]. However, generally, it is possible to describe data types as follows:
- Structured: input data must be well-defined and structured, with information organized and described in detail. For instance, device names, times, power, temperatures, locations, occupancy, etc. are examples of structured data.
- Unstructured: if the data has no pre-defined format or organization, it is considered unstructured. In these cases, the analysis of relevant information is much more difficult to perform. For example, textual input, word processing, audio files, videos, images, etc. can be considered unstructured data.
- Semi-structured: data are not stored in an organized structure (such as a relational database), but have some organizational properties. For example, XML, JSON documents, NoSQL databases, etc., are examples of semi-structured data.
Moreover, input data can also be associated with metadata information, which can be considered structured, unstructured, or semi-structured. Before choosing a ML model, it is important to understand the structure of the input. For interpretability, the optimal data structure is related to the user’s knowledge of the process. Usually, the choice of structured or semi-structured data is advisable, especially when using ante hoc models that are intrinsically interpretable. If data are well structured, it is possible to easily obtain a higher level of interpretability (level 2–3) because the process is repeatable with few accuracy issues and because little knowledge of the specific process under analysis is required [122,123,124]. However, this approach elevates the importance of the other data structures (semi-structured and unstructured) having good interpretability. Below, the most-used interpretable ML models for energy management in built environments are discussed with examples based on the scientific literature on the matter.
4.1. Interpretable Artificial Neural Networks
ANNs are widely used across the scientific and industrial communities because they are quite easy to use and to adapt to different contexts. They were developed to mimic the neural structure of the brain, beginning with the first studies on perception [124]. Usually, they are considered “black box” models because the internal operations performed on the data are usually obscure and difficult for the user to understand [125]. However, in recent years, due to their wide distribution and the widespread interest in them, new and interpretable modified ANN models have emerged. For instance, Jang et al. [126] developed an accurate DNN for daily peak-load forecasting (DPLF) using two buildings as case studies. For interpretability, they applied an hyperparameter optimization and a SHAP model reaching up to 12.74% prediction accuracy, which shows how the previous day’s peak load and temperatures influence the predictions. Li et al. [127] investigated the effectiveness of using an attention mechanism to increase the RNN’s interpretability for 24-h building cooling-load prediction. As a result, they show that past energy consumption has the greatest influence on the prediction due to the building’s thermal inertia. Cheng et al. [128] developed a physics-informed neural network that takes data from a resistance–capacitance (2R2C) thermal model. The use of a physics model gives the user knowledge of the effect of changing input parameters thanks to the intrinsic interpretability of physical law (which can be considered an ante hoc model) and the flexibility of ANN in processing data. Following the same approach, Chen and Zhang [129] proposed a modified LSTM network using thermal dynamics parameters for modelling building thermal performance. Moreover, Di Natale et al. [130] proposed a physically based ANN that was able to integrate environmental knowledge for building thermal modelling. Wang et al. [131] proposed a Direct eXplainable Neural Network (DXNN) to calculate solar irradiance. Modifying the activation function of the neural network they were able to obtain a direct relationship between model’s input and output. Moving to occupancy and activity detection, Cengiz et at. [132] developed CNN to track human activities. The model interpretability was increased using Activity Recognition on Signal Images (HARSI) approach, transforming accelerometers data into signals in the domain of frequency. Yuan et at. [133] proposed a passive multi-modal interpretable data fusion algorithm based on RNN for Human Identification and Activity Recognition (HIAR). The data that comes from a Software Defined Radio (SDR) and Passive InfraRed (PIR) sensors was interpretated using SHAP model to evaluate results. Zhang et al. [134] developed a networks-based Takagi-Sugeno-Kang fuzzy classifier (DBN-TSK-FC) to analyse indoor occupancy. The fuzzy classifies give interpretability to their unsupervised Deep Belief Network (DBN) representing the first layer of neural network hidden nodes as a set of consequent variables of fuzzy rules. E. Kim [135] proposed an Interpretable Convolutional Neural Network (I-CNN) for indoor activity detection by adding temporal convolution and pooling layers into a CNN. Li et al. [136] showed how the day hour was the most influential feature for hourly electricity prediction using an Automatic Relevance Determination (ARD) network, a modified ANN model to reveal the relationship between input features and model output.
4.2. Encoder–Decoder
Encoder models take an input sequence and creates a contextual representation (which is also called context) of it, instead, decoder models take this contextual representation as input and generates output sequence. Therefore, Encoder–Decoder models use textual or categorial input to generate categorical or textual output. A very famous example of Encoder–Decoder model is Google Translator that generates text decoding a textual input [137]. Recently, the attention mechanist has been included inside Encoder–Decoder models to increase machine-to-machine translation performances and the human interpretability of the output [138]. Attention mechanism is intended for mimicking the cognitive attention using “soft” weights for each parameter under investigation that can change during each runtime, in contrast to “hard” weights that are fixed, pre-trained and fine-tuned. Encoder-decoder models can use also be used with time-series [139]. This makes the attention mechanism a useful tool by which to increase interpretability of encoder–decoder models for both regression and classification tasks. Luo et al. [140] used an encode-decode architecture and ConvLSTM attention mechanism for the prediction of multi-energy loads in a micro-energy network showing good accuracy in forecasting energy loads. Li et al. [141] developed a FDD model using time-series data coming from chillers for the forecasting of cooling loads inside a building and proving the possibility of obtaining the importance of each input feature, thus explaining the impact of each feature. Gao and Ruan [142] proposed an accurate building energy consumption prediction model investigating three different interpretable encoder and decoder models based on LSTM and self-attention mechanism. Their model showed the impact of daily temperatures (max, min and mean) and dew point temperature on the predictions. A similar approach was used by Ellis and Chinde [143] for the predictions of HVAC loads in a closed-loop system for a single environment belonging to a multi-zone building. The results were validated using EnergyPlus software and can predict the indoor air temperature and HVAC sensible cooling rate. At least, Azam and Younis [144] developed an encoder–decoder model for the prediction of energy consumption demonstrating the importance of historical feature inputs on model output.
4.3. Clustering and Feature Extraction
Clustering models intended for grouping input data into clusters that shares homogenous proprieties, instead, feature extraction is intended for analysing raw data to extract numerical features that conserve the information of the original dataset. For example, when measuring the efficiency of an HVAC system with a clustering model, it would be theoretically possible to organize them by the thermodynamical cycle; instead, using a feature-extraction model, it is possible to analyse the efficiency of a thermodynamical cycle. Unlike ANNs and encoder–decoder techniques, clustering and feature extraction can be used in addition to any “black box” model without the need to modify processing. Liu et al. [145] proposed a clustering data-mining-based framework to extract typical electricity load patterns (TELPs) for individual buildings. To shrink the dataset, they clustered the shapes of the electricity-load profiles into five statistical features using a density-based spatial clustering model (DBSCAN) and a K-means algorithm. To increase the interpretability of the approach, the authors also implemented a CART algorithm, showing how it is possible to perform an early FDD analysis based on anomalous loads profiles. Prabhakaran et al. [146] proposed a small binary decision tree to increase the interpretability of a K-means model for indoor occupancy estimation. Galli et al. [147] proposed a multi-step methodology based on a clustering algorithm and a LIME to investigate the energy performance classes of buildings using a large set of energy performance certificates (EPCs) as input. Choi and Kim [148] investigated the performances of clustering and tree-based algorithms to evaluate energy-efficiency buildings (EBB). they found that the conditional inference tree (CIT) algorithm performed best in terms of interpretability and classification accuracy compared to other decision-tree and clustering models. Tang et al. [149] used smart meters along with demographic and socio-economic data to identify the main drivers of residential energy consumption, showing a correlation between age and education level and load patterns. Moreover, they obtained better classification performance using feature-extraction algorithms, rather than XGBoost and ANN models. The good performance of simple models in clustering and features extraction has also been evidenced in the work of Grimaldo and Novak [150]. They obtained better accuracy using k-nearest neighbours (kNN) algorithms instead the more complex random forest (RF) and gradient boosted trees (GBT) models for the forecasting of energy usage in buildings. Moreover, their approach is also interpretable because they extracted the relevant information, organizing it and reducing the data complexity [107]. The results are also published in another work, wherein they developed a smart energy dashboard using kNN and decision trees models to visualize daily energy consumption to increase user awareness [151]. An innovative clustering technique that is intended for simulating buildings’ thermal design data was developed by Bhatia et al. [152]. Their approach is called axis-aligned hyper-rectangles and can cluster information, dividing data into hyper-rectangle boundaries interpretable using specific rules. The authors created rules for the calculation of the window-to-wall ratio to assist in the design process of building envelopes in different climate zones. Kasuya [153] proposed a Gaussian mixture (GM) model and a distribution-based clustering (DBC) algorithm for the prediction of loads for the next day, using energy data as input. Miller and Xiao [154,155] showed that a clustering model and energy-consumption data can be used to classify living spaces by their intended use, making results interpretable.
4.4. Generalized Additive Models
GAMs were born as an improvement on linear regression and logistic regression models. They are more generalized than those models but maintain a good degree of interpretability because GAMs are ante-hoc models [108]. Moreover, GAMs can be used on discontinuous and volatile data thanks to the use of a smoothing function and backfitting [156]. Khamma et al. [156] used GAMs to forecast indoor heat and power usage as input the ambient air temperature, solar radiation, and time. As a result, the outdoor air temperature showed a negative relationship with the predicted heating load, while solar radiation had a negative exponential relationship with the predicted heating load. Voss et al. [157] developed a mathematical model for the calculation of building inertia thermal energy storage (BITES) for smart grid control. They used a GAM to obtain BITES input parameters from building data, demonstrating that the ceiling surface temperature can be used as a proxy for the current state of energy use. As a result, they calculated the benefit of using conventional hot water tanks instead of batteries for energy storage and the related potential to reduce the building’s carbon footprint. Li et al. [158] used MLR, GAM, and energy performance index (EPI) to calculate the energy efficiency of a healthcare facility. The authors found that MLR was the most consistent and robust benchmarking model, while GAM appeared to have the best accuracy. Ghose et al. [159] implemented a regression analysis using Kruskal-Wallis (KW) and GAM to support interpretation of = life-cycle assessment (LCA) data for the refurbishment of office buildings in New-Zealand under four different scenarios: business-as-usual, integration of PV panels, integration with an electric renewable-energy grid, and implementation of best construction practices. González-Mahecha et al. [160] proposed a model to evaluate the impact of renewable-energy technologies for zero- or nearly-zero-energy buildings (ZEB and NZEB). GAMS was used to calculate, for every system and on hourly basis, the demand and production of power, using as a case study a real building in Portugal. Their model considers the use of solar PVs panels and miniature wind turbines for energy production and batteries for storage. Their studies also investigated the energy costs related to selling and buying electricity, making the results interpretable in economic terms. In addition, GAMs were also used to perform sensitivity analysis on input features for thermal-comfort modelling [161] and thermal energy-storage modelling [157] and to identify operational patterns of gas-powered HVAC systems [162], distributed PV PP [163], and short-term energy prediction in buildings [156]. The main drawback of GAMs is their simplicity; they cannot be compared to more complex models but can only approximate the real behaviour of the system analysed.
4.5. Local Interpretable Model-Agnostic Explanations
In 2016, Ribeiro et al. [164] introduced LIME as a model-agnostic method designed to provide localized interpretations for individual predictions using a local surrogate model. LIME is particularly valuable for explaining classification problems, as it can provide both contradictory and supportive information for each input feature in relation to a given prediction. Hülsmann et al. [165] used LIME in combination with an ANN to develop an optimization model for a small energy grid of buildings using PV panels and batteries. They showed the advantages in terms of the interpretability, compactness, and robustness of using LIME instead of sensitivity models for the evaluation of energy systems. Wastensteiner et al. [166] applied LIME to interpret ML-based time-series classification models for the assessment of buildings’ energy consumption, then analysed the stability and reliability of the interpretations. Tsoka et al. [167] developed an eXplainable Neural Network (XNN) to evaluate Italians EPCs. Their approach involves the use of an ANN with a LIME model to make the results interpretable, showing that transmittance and the dimensions of opaque surfaces are the main contributors to the EPC value. Chung and Liu [168] used a standardized regression coefficient (SRC) along with LIME and SHAP to evaluate the main parameters for the prediction of energy loads in office buildings on different climate zones via a DNN. Among the models analysed, SHAP needed the smallest number of inputs for an accurate load prediction. Another interesting result observed by the authors is the possibility of removing weather sensors and using climate time-series data instead. Srinivasan et al. [169] used LIME for chiller FDD, inspecting issues such as scaling in condenser fins, sensor errors caused by flow pulsations, and false alarms. They showed that the LIME’s ability to provide contradicting information plays a dual role: it assists decision-makers in identifying faults and can identify false alarms generated by “black box” models. Carlsson et al. [170] applied LIME to a regression problem, evaluating the confidence level of individual predictions related to chiller COPs.
4.6. SHapley Additive exPlanations
The SHAP algorithm was originally proposed by Lundberg and Lee [171] in 2017. It was designed as an interpretability tool to explain individual predictions (local interpretations) or for global interpretation, aggregating the model’s values. Moreover, the authors also proposed KernelSHAP, an alternative, kernel-based estimation approach inspired by local surrogate models, and TreeSHAP, a tree-based estimation model. This model calculates the average marginal contribution of a feature value across all possible coalition values, an approach borrowed from coalitional game theory. In this way, every feature value contributes to the prediction. SHAP has attracted considerable interest from the scientific community, and, like LIME, it has been widely adopted. For instance, Dinmohammadi et al. [172] proposed a model for the prediction of energy consumption in residential buildings under different indoor and outdoor conditions. The authors used a PSO-optimized RF classification algorithm for the identification of the most important factors related to heating demand, a self-organizing map (SOM) for feature aggregation and dimensionality reduction and an ensemble classification model for the forecasting. SHAP was used in addition to a causal inference method to increase model interpretability, revealing a relationship between water-pipe temperature changes, air temperature, and the building’s energy consumption. Sun et al. [173] used SHAP in combination with a DNN for the calculation of the building’s energy efficiency, using EPC data and façade information from Google Street View (GSV) as input. As a result, they developed an automated tool for the identification of the contribution of each building feature to energy efficiency. In a work by S. Park et al. [174], SHAP was used to provide both local and global interpretations of an RF model for FDD in district heating systems. Moon et al. [175] developed an eXplainable Electrical Load Forecasting (XELF) methodology using tree-based ensemble models (RF, GBM, XGBoost, LightGBM, and categorical boosting). SHAP was used by the authors to investigate the main contributors to energy loads, showing that temperature-humidity index and wind-chill index are the most influential factors. Zhang et al. [176] adopted SHAP to provide local interpretations for evaluating thermal comfort, calculating predicted mean vote (PMV) values. The authors also proposed potential solutions to enhance indoor thermal comfort based on SHAP interpretation. A similar work by Yang et al. [177] used SHAP to evaluate three thermal-sensation models: hot, neutral, and cold. Their results showed that air temperature and relative humidity are the most influential features across all models. Shen and Pan [178] developed an automatic tool for energy-performance assessment in buildings, supported by BIM data. Their tool comprises three components: DesignBuilder for simulation, a BO-LGBM (Bayesian optimization-LightGBM) and SHAP model for the prediction and explanation of performance, and an AGE-MOEA algorithm for the optimization of buildings. SHAP results revealed that HAVC systems have the greatest impact on energy consumption. Chang et al. [179] utilized SHAP to analyse and reveal feature importance in PV power generation models. Their results revealed global horizontal irradiance as the most influential feature, a result aligned with the results of Pearson correlation (PC) analyses. Arjunan et al. [180] proposed integrating EnergyStar++ assessment with SHAP models to explain why a building is achieving a particular score. They used multiple linear regression (MLR) with feature interactions (MLRi) and GBT to calculate the scores and SHAP to evaluate the contributions, showing how the features under analysis (number of workers, number of computers, gross flow area, working hours/week, cooling degree days, and cooled gross flow area) are related to the result. Gao et al. [181] used SHAP to interpret RF and light gradient boosting machine (LightGBM) models for chiller FDD. The SHAP model can be also used for occupancy-related tasks, such as to predict CO2 concentration [182]. Jang et al. [126] proposed a methodology for DPLF based on a robust and interpretable DPLF (RAID) model. Their goal was the development of low-resource-intensive model that be used on systems without GPU hardware. SHAP was used to make a MLPRegressor and a Optuna optimizer interpretable, revealing the influence of the previous day’s peak load and temperature-related variables on the predictions. Park and Park [183] used SHAP to rank feature importance in the prediction of natural ventilation rates, finding that the most influential features are pressure differences, outdoor temperature, and wind speed. Wenninger et al. [184] performed an analysis of EPC in England and Wales based on retrofitting interventions, house prices, and socio-demographic information. The authors used SHAP to identify the key factors and relationships between the features, showing that many interventions were related to CO2 emissions and suggesting easy-to-implement policy measure. Papadopoulos and Kontokosta [185] used SHAP to interpretate the results of an XGBoost-based energy benchmark for residential buildings. Akhlaghi et al. [186] used SHAP to interpret performance-related indices (cooling capacity, coefficient of performance (COP), and wet/dew point efficiency) for a dew-point cooler, showing the relationship between cooling capacity and intake air velocity.
4.7. Other Techniques
There are also other interpretable ML techniques that can be used for energy assessment. For instance, permutation importance (PI) can assess feature importance by shuffling feature values and observing the impact on model predictions. A feature is considered important if its shuffling leads to a substantial prediction error. Carlson et al. [170,187] used PI to increase the interpretability of an ANN-based electricity-load prediction. Chahbi et al. [188] used both RF and PI models for the evaluation of building energy consumption. RF was used for the predictions, and PI was used for to make the outcomes interpretable. Singh et al. [189] proposed a component-based ML model (CBML) for building energy prediction. Their approach is based on decomposing the building into small components and calculating intermediate parameters from heat flows and energy components for each zone, using the aggregate of these values to calculate the total energy demand. C. Zhang et al. [190] proposed a hybrid prediction method based on LSTM networks and ANN to forecast the energy loads of buildings. To interpret the results, they used a dimensionless sensitivity index (DSI) and a weighted Manhattan distance to quantify feature importance. Alfalah et al. [191] evaluated the number of occupants in a school building, as well as the occupancy patterns and profiles. They used a hidden Markov model (HMM) for the predictions and Kullback Leibler (KL) for the interpretation of results. A KL model was also used by Kim and Cho [192] to measure feature relevance in energy prediction, using latent states from an encoder–decoder model.
Feature importance can be also assessed using tree-based methods by calculating each feature’s contribution to reducing error within the tree model. These methods include RF, gradient boosting machine (GBM), XGBoost, and Cubist [193,194]. Wang et al. [195] used regression tree (RT) and support vector regression (SVR) for hourly energy-use prediction in two educational buildings in north central Florida. RF was used to identify the most influential features during both semesters, showing how they vary by semester and indicating the existence of different operational conditions for the tested buildings. Smarra et al. [196] developed a data-driven model predictive control (DPC) technique for building energy optimization and climate control using FR and RF models. Liu et al. [197] developed a mixed model for the forecasting of building energy consumption based on the design of the building envelope. RF was used to predict building energy consumption and rank the importance of each parameter, then a Pearson function was used to evaluate the corresponding correlations. Their results revealed that the most influential parameters were the heat-transfer coefficients of the exterior walls and outer windows and the window-wall ratio. Liu et al. [198] developed a rule-set surrogate model to replace an RF model for building energy prediction. Touzani et al. [199] predicted the energy consumption of buildings using a GBM model and found that the model performed better than RF. Zhang et al. [200] combined effect of building characteristics, building geometry, and urban morphology for the evaluation of energy consumption and carbon footprint. They used a light GBM integrated with a SHAP model to provide insights regarding the results. Yigit [201] developed an integrated thermal-design-optimization model for an existing building consisting of a genetic algorithm (GA) and GBM. Interpretability arises from the evaluation of energy-saving measures used as input parameters for the model, such as WWR, insulation thickness, and the orientation of the building. Moon et al. [194] used a Cubist regression to rank the importance of features for energy forecasting, revealing that external factors such as outdoor air temperature and the dates of holidays, along with internal factors like one-day-ahead and one-week-ahead energy loads, play fundamental roles. Sauer et al. [202] used an adaptively tuned XGBoost algorithm to predict the cooling and heating system loads of residential buildings. Mohammadiziazi and Bilec [203] used four different models (RF, XGBoost, single RT, and multiple linear regression), to predict energy-use intensity (EUI) across the USA during the 21st century. They showed that outcomes are related to climate data and that it is therefore crucial to use a comprehensive building dataset to assess energy consumption. Huang et al. [204] compared the performances of LSTM, SVR, and extreme gradient boosting (XGBoost) Networks for the forecasting of energy consumption in public buildings. The result of their study identified the most suitable model for use largely on the natural characteristics of building energy data. Sipple [205] proposed an unsupervised anomaly-detection method for ANNs to identify power-meter device failures in office buildings, employing an integrated gradients approach to interpret anomalies. Zhang et al. [206] used inspected FDD based on building energy consumption anomalies. Anomaly detection is considered a one-sided process. Therefore, to extract the correlation between features and their influence upon the output, the authors introduced a graph convolutional network (GCN) enhanced by a graph attention mechanism. Lei et al. [207] took the data from the building energy monitoring system (BEMS) of a university building to develop an anomaly-detection analysis using a clustering algorithm and particle swarm optimization (PSO) to improve detection and support the adjustment of building-management strategies. Counterfactual explanation is yet another system for generating local interpretations of individual samples. This method creates nearby samples with minimal feature changes that alter the model’s output. Sakkas et al. [208] selected features through statistical analysis and then utilized them for diverse counterfactual explanation (DiCE) model to conduct counterfactual analysis to interpret energy-demand forecasting. Tran et al. [209] developed an innovative context-aware evolutionary learning algorithm (CELA) to both increase the capabilities of existing evolutionary learning methods in handling many features and datasets, and to provide an interpretable model based on the automatically extracted contexts. The authors tested their algorithm on real-world energy-prediction tasks for buildings, with performances comparable to those of XGBoost and ANN.
5. Discussion and Conclusions
ML techniques are currently used in many different technological fields. Moreover, their widespread use is expected to rise in the coming years thanks to the widespread use of smart devices, the increase in computational power, and the ever-increasing presence of technology in everyday life. Using ML algorithms, it is possible to reduce resource consumption in the built environment. However, users and stakeholders may not trust the output of an algorithm due to the intrinsic difficulty of interpretating what it means. A search for published papers in the Scopus database that contain the keywords “Energy”, “Building” and “Machine Learning” revealed that there are more than 1700 records available. However, if the keywords “interpretable” (or “interpretability”) or “explainable” (or “explainability”) are added to the search, the number papers decreases to 140, with the first work having been published in 2014 [210]. The numbers rose in 2019, with 12 papers/year. As a reference, in 2023, a total of 53 such records were published in the database. This overview cannot be considered a deep investigation but is intended to show the rising interest of the international scientific community in this topic. For instance, this work reviewed more than 200 papers, all intended to show the usefulness of ML for energy management in a building environment, and 98 of which specifically focusing on interpretability issues. Moreover, based on the study of the current literature, the main applications are FDD, load and power management, and occupancy-activity prediction. This work also describes the most-used models for prediction/classification and for the assessment of interpretability. A summary based on the reviewed literature of the main advantages and disadvantages of the different interpretable ML models, as well as the applicable reference models, is reported in Table 1.

Table 1.
The main advantages, disadvantages and applicability of interpretable ML models based on the literature analysis.
However, it is evident that there are still some limitations with regard to interpretability. First, it is still difficult to explain what is meant by the term “interpretability”. Secondly, many works lack comparisons between different interpretable models and do not consider a common definitional framework. Therefore, it is difficult to evaluate the real ability of the developed models to give valuable interpretations. Moreover, according to Krishnan [211], there are two more challenges associated with interpretability. The first is related to the general lack of knowledge about what can be provided: it could be difficult to understand whether a provided interpretation is formally valid, considering that interpretable models are used to address the lack of such interpretation. The second challenge relates to the user’s responsibility: interpretations are intended to justify or explain a problem. If a user bases their evaluation only on the provided interpretation, the real causes can be misunderstood, reducing or limiting attention to other parameters. Moreover, the incorrect use of an interpretable model can artificially reduce the solution space, confusion a possible solution with the problem. The introduction of a common framework is advisable for the assessment of the different approaches. Moreover, the AEC sector has only recently started to adopt these technologies, which were originally developed for other industries. Filling the gap still requires time, knowledge and expertise, but this work is one of the challenges to creating a more sustainable future.
Author Contributions
Conceptualization, methodology and writing, L.G.; Visualization by S.A.; Supervision and review by F.C. All authors have read and agreed to the published version of the manuscript.
Funding
The present work has been founded by the National Recovery and Resilience Plan (PNNR), Mission 4 Component 2 Investment 1.5—Call for tender No. 3277of 30/12/2021 of Italian Ministry of University and Research funded by the European Union—NextGenerationEU.
Data Availability Statement
The data that support the findings of this study are available upon request from the corresponding author.
Conflicts of Interest
The authors declare no conflict of interest. Moreover, the funders had no role in the design of the study; in the collection, analyses, or interpretation of data; in the writing of the manuscript; or in the decision to publish the results.
References
- Mesa-Jiménez, J.J.; Stokes, L.; Yang, Q.; Livina, V.N. Machine Learning for BMS Analysis and Optimisation. Eng. Res. Express 2020, 2, 045003. [Google Scholar] [CrossRef]
- Zarco-Periñán, P.J.; Zarco-Soto, F.J.; Zarco-Soto, I.M.; Martínez-Ramos, J.L.; Sánchez-Durán, R. CO2 Emissions in Buildings: A Synopsis of Current Studies. Energies 2022, 15, 6635. [Google Scholar] [CrossRef]
- OECD/IEA. Global Energy & CO2 Status Report 2019–Analysis–IEA; IEA: Paris, France, 2019. [Google Scholar]
- Ramesh, T.; Prakash, R.; Shukla, K.K. Life Cycle Energy Analysis of Buildings: An Overview. Energy Build. 2010, 42, 1592–1600. [Google Scholar] [CrossRef]
- Leal Filho, W.; Vidal, D.G.; Chen, C.; Petrova, M.; Dinis, M.A.P.; Yang, P.; Rogers, S.; Álvarez-Castañón, L.; Djekic, I.; Sharifi, A.; et al. An Assessment of Requirements in Investments, New Technologies, and Infrastructures to Achieve the SDGs. Environ. Sci. Eur. 2022, 34, 58. [Google Scholar] [CrossRef] [PubMed]
- Parra-Domínguez, J.; Gil-Egido, A.; Rodríguez-González, S. SDGs as One of the Drivers of Smart City Development: The Indicator Selection Process. Smart Cities 2022, 5, 1025–1038. [Google Scholar] [CrossRef]
- Kazak, T. European Green Deal. Yearb. Law. Dep. 2022, 9, 304–315. [Google Scholar] [CrossRef]
- Tang, H.; Wang, S.; Li, H. Flexibility Categorization, Sources, Capabilities and Technologies for Energy-Flexible and Grid-Responsive Buildings: State-of-the-Art and Future Perspective. Energy 2021, 219, 119598. [Google Scholar] [CrossRef]
- Hurtado, L.A.; Mocanu, E.; Nguyen, P.H.; Gibescu, M.; Kamphuis, R.I.G. Enabling Cooperative Behavior for Building Demand Response Based on Extended Joint Action Learning. IEEE Trans. Ind. Inf. 2018, 14, 127–136. [Google Scholar] [CrossRef]
- Etxegarai, G.; Zapirain, I.; Camblong, H.; Ugartemendia, J.; Hernandez, J.; Curea, O. Photovoltaic Energy Production Forecasting in a Short Term Horizon: Comparison between Analytical and Machine Learning Models. Appl. Sci. 2022, 12, 2171. [Google Scholar] [CrossRef]
- Chinchero, H.F.; Alonso, J.M. A Review on Energy Management Methodologies for LED Lighting Systems in Smart Buildings. In Proceedings of the 2020 IEEE International Conference on Environment and Electrical Engineering and 2020 IEEE Industrial and Commercial Power Systems Europe, EEEIC/I and CPS Europe 2020, Singapore, 14–17 December 2020. [Google Scholar]
- Manic, M.; Wijayasekara, D.; Amarasinghe, K.; Rodriguez-Andina, J.J. Building Energy Management Systems: The Age of Intelligent and Adaptive Buildings. IEEE Ind. Electron. Mag. 2016, 10, 25–39. [Google Scholar] [CrossRef]
- Chen, Y.; Chen, Z.; Yuan, X.; Su, L.; Li, K. Optimal Control Strategies for Demand Response in Buildings under Penetration of Renewable Energy. Buildings 2022, 12, 371. [Google Scholar] [CrossRef]
- Whitmore, A.; Agarwal, A.; Da Xu, L. The Internet of Things—A Survey of Topics and Trends. Inf. Syst. Front. 2015, 17, 261–274. [Google Scholar] [CrossRef]
- Hwang, Y.-M.; Kim, M.G.; Rho, J.-J. Understanding Internet of Things (IoT) Diffusion. Inf. Dev. 2016, 32, 969–985. [Google Scholar] [CrossRef]
- Rejeb, A.; Rejeb, K.; Zailani, S.H.M.; Abdollahi, A. Knowledge Diffusion of the Internet of Things (IoT): A Main Path Analysis. Wirel. Pers. Commun. 2022, 126, 1177–1207. [Google Scholar] [CrossRef]
- Firouzi, F.; Farahani, B.; Marinšek, A. The Convergence and Interplay of Edge, Fog, and Cloud in the AI-Driven Internet of Things (IoT). Inf. Syst. 2022, 107, 101840. [Google Scholar] [CrossRef]
- Marotta, I.; Guarino, F.; Cellura, M.; Longo, S. Investigation of Design Strategies and Quantification of Energy Flexibility in Buildings: A Case-Study in Southern Italy. J. Build. Eng. 2021, 41, 102392. [Google Scholar] [CrossRef]
- Capozzoli, A.; Cerquitelli, T.; Piscitelli, M.S. Enhancing Energy Efficiency in Buildings through Innovative Data Analytics Technologies. In Pervasive Computing: Next Generation Platforms for Intelligent Data Collection; Morgan Kaufmann: Cambridge, MA, USA, 2016. [Google Scholar]
- Sengupta, P.P.; Chandrashekhar, Y.S. Building Trust in AI. JACC Cardiovasc. Imaging 2021, 14, 520–522. [Google Scholar] [CrossRef] [PubMed]
- Zhang, J.; Tai, Y. Secure Medical Digital Twin via Human-Centric Interaction and Cyber Vulnerability Resilience. Conn. Sci. 2022, 34, 895–910. [Google Scholar] [CrossRef]
- Bononi, L.; Donatiello, L.; Longo, D.; Massari, M.; Montori, F.; Stacchio, L.; Marfia, G. Digital Twin Collaborative Platforms: Applications to Humans-in-the-Loop Crafting of Urban Areas. IEEE Consum. Electron. Mag. 2023, 12, 38–46. [Google Scholar] [CrossRef]
- Geselschap, C.; Meskers, G.; Van Dijk, R.; Van Winsen, I. Digital Twin–Engineering with the Human Factor in the Loop. In Proceedings of the Annual Offshore Technology Conference, Houston, TX, USA, 6–9 May 2019; Volume 2019. [Google Scholar]
- Chen, Z.; Xiao, F.; Guo, F.; Yan, J. Interpretable Machine Learning for Building Energy Management: A State-of-the-Art Review. Adv. Appl. Energy 2023, 9, 100123. [Google Scholar] [CrossRef]
- Khan, A.; Laghari, A.; Awan, S. Machine Learning in Computer Vision: A Review. ICST Trans. Scalable Inf. Syst. 2018, 8, e4. [Google Scholar] [CrossRef]
- Cheng, Y.; Niu, J.; Gao, N. Thermal Comfort Models: A Review and Numerical Investigation. Build. Environ. 2012, 47, 13–22. [Google Scholar] [CrossRef]
- Zhang, L.; Wen, J.; Li, Y.; Chen, J.; Ye, Y.; Fu, Y.; Livingood, W. A Review of Machine Learning in Building Load Prediction. Appl. Energy 2021, 285, 116452. [Google Scholar] [CrossRef]
- Papadonikolaki, E.; Krystallis, I.; Morgan, B. Digital Technologies in Built Environment Projects: Review and Future Directions. Proj. Manag. J. 2022, 53, 501–519. [Google Scholar] [CrossRef]
- Ciaburro, G. Machine Fault Detection Methods Based on Machine Learning Algorithms: A Review. Math. Biosci. Eng. 2022, 19, 11453–11490. [Google Scholar] [CrossRef] [PubMed]
- Shaharuddin, S.; Abdul Maulud, K.N.; Syed Abdul Rahman, S.A.F.; Che Ani, A.I. Digital Twin for Indoor Disaster in Smart City: A Systematic Review. In Proceedings of the International Archives of the Photogrammetry, Remote Sensing and Spatial Information Sciences–ISPRS Archives, Nice, France, 6–11 June 2022; Volume 46. [Google Scholar]
- Wong, J.; Wang, X.; Li, H.; Chan, G.; Li, H. A Review of Cloud-Based Bim Technology in the Construction Sector. J. Inf. Technol. Constr. 2014, 19, 281–291. [Google Scholar]
- Drobnyi, V.; Hu, Z.; Fathy, Y.; Brilakis, I. Construction and Maintenance of Building Geometric Digital Twins: State of the Art Review. Sensors 2023, 23, 4382. [Google Scholar] [CrossRef] [PubMed]
- Qavidel Fard, Z.; Zomorodian, Z.S.; Korsavi, S.S. Application of Machine Learning in Thermal Comfort Studies: A Review of Methods, Performance and Challenges. Energy Build. 2022, 256, 111771. [Google Scholar] [CrossRef]
- Dai, X.; Liu, J.; Zhang, X. A Review of Studies Applying Machine Learning Models to Predict Occupancy and Window-Opening Behaviours in Smart Buildings. Energy Build. 2020, 223, 110159. [Google Scholar] [CrossRef]
- Teng, S.Y.; Touš, M.; Leong, W.D.; How, B.S.; Lam, H.L.; Máša, V. Recent Advances on Industrial Data-Driven Energy Savings: Digital Twins and Infrastructures. Renew. Sustain. Energy Rev. 2021, 135, 110208. [Google Scholar] [CrossRef]
- Gomez-Cabrera, A.; Escamilla-Ambrosio, P.J. Review of Machine-Learning Techniques Applied to Structural Health Monitoring Systems for Building and Bridge Structures. Appl. Sci. 2022, 12, 10754. [Google Scholar] [CrossRef]
- Djenouri, D.; Laidi, R.; Djenouri, Y.; Balasingham, I. Machine Learning for Smart Building Applications: Review and Taxonomy. ACM Comput. Surv. 2019, 52, 24. [Google Scholar] [CrossRef]
- Ardabili, S.; Abdolalizadeh, L.; Mako, C.; Torok, B.; Mosavi, A. Systematic Review of Deep Learning and Machine Learning for Building Energy. Front. Energy Res. 2022, 10, 786027. [Google Scholar] [CrossRef]
- El Khatib, M.M.; Ahmed, G. Improving Efficiency in IBM Asset Management Software System “Maximo”: A Case Study of Dubai Airports and Abu Dhabi National Energy Company. Theor. Econ. Lett. 2018, 8, 1816–1829. [Google Scholar] [CrossRef]
- Fahim, M.; Sharma, V.; Cao, T.V.; Canberk, B.; Duong, T.Q. Machine Learning-Based Digital Twin for Predictive Modeling in Wind Turbines. IEEE Access 2022, 10, 14184–14194. [Google Scholar] [CrossRef]
- Meijers, A. Hands-On Azure Digital Twins: A Practical Guide to Building Distributed IoT Solutions; Packt Publishing Ltd.: Birmingham, UK, 2022. [Google Scholar]
- Wang, Z.; Gupta, R.; Han, K.; Wang, H.; Ganlath, A.; Ammar, N.; Tiwari, P. Mobility Digital Twin: Concept, Architecture, Case Study, and Future Challenges. IEEE Internet Things J. 2022, 9, 17452–17467. [Google Scholar] [CrossRef]
- Saad, A.; Faddel, S.; Mohammed, O. IoT-Based Digital Twin for Energy Cyber-Physical Systems: Design and Implementation. Energies 2020, 13, 4762. [Google Scholar] [CrossRef]
- Suuronen, S.; Ukko, J.; Eskola, R.; Semken, R.S.; Rantanen, H. A Systematic Literature Review for Digital Business Ecosystems in the Manufacturing Industry: Prerequisites, Challenges, and Benefits. CIRP J. Manuf. Sci. Technol. 2022, 37, 414–426. [Google Scholar] [CrossRef]
- van Dinter, R.; Tekinerdogan, B.; Catal, C. Predictive Maintenance Using Digital Twins: A Systematic Literature Review. Inf. Softw. Technol. 2022, 151, 107008. [Google Scholar] [CrossRef]
- Agostinelli, S.; Cumo, F.; Nezhad, M.M.; Orsini, G.; Piras, G. Renewable Energy System Controlled by Open-Source Tools and Digital Twin Model: Zero Energy Port Area in Italy. Energies 2022, 15, 1817. [Google Scholar] [CrossRef]
- Zhou, Y. Advances of Machine Learning in Multi-Energy District Communities—Mechanisms, Applications and Perspectives. Energy AI 2022, 10, 100187. [Google Scholar] [CrossRef]
- Zhao, Y.; Qin, X.; Shi, X. A Comprehensive Evaluation Model on Optimal Operational Schedules for Battery Energy Storage System by Maximizing Self-Consumption Strategy and Genetic Algorithm. Sustainability 2022, 14, 8821. [Google Scholar] [CrossRef]
- Schopfer, S.; Tiefenbeck, V.; Staake, T. Economic Assessment of Photovoltaic Battery Systems Based on Household Load Profiles. Appl. Energy 2018, 223, 229–248. [Google Scholar] [CrossRef]
- Chen, Y.; Guo, M.; Chen, Z.; Chen, Z.; Ji, Y. Physical Energy and Data-Driven Models in Building Energy Prediction: A Review. Energy Rep. 2022, 8, 2656–2671. [Google Scholar] [CrossRef]
- Chen, Z.; Chen, Y.; He, R.; Liu, J.; Gao, M.; Zhang, L. Multi-Objective Residential Load Scheduling Approach for Demand Response in Smart Grid. Sustain. Cities Soc. 2022, 76, 103530. [Google Scholar] [CrossRef]
- Mellit, A.; Pavan, A.M.; Ogliari, E.; Leva, S.; Lughi, V. Advanced Methods for Photovoltaic Output Power Forecasting: A Review. Appl. Sci. 2020, 10, 487. [Google Scholar] [CrossRef]
- Luo, X.J.; Oyedele, L.O.; Ajayi, A.O.; Akinade, O.O. Comparative Study of Machine Learning-Based Multi-Objective Prediction Framework for Multiple Building Energy Loads. Sustain. Cities Soc. 2020, 61, 102283. [Google Scholar] [CrossRef]
- Sierla, S.; Pourakbari-Kasmaei, M.; Vyatkin, V. A Taxonomy of Machine Learning Applications for Virtual Power Plants and Home/Building Energy Management Systems. Autom. Constr. 2022, 136, 104174. [Google Scholar] [CrossRef]
- Bahani, K.; Ali-Ou-Salah, H.; Moujabbir, M.; Oukarfi, B.; Ramdani, M. A Novel Interpretable Model for Solar Radiation Prediction Based on Adaptive Fuzzy Clustering and Linguistic Hedges. In Proceedings of the 13th International Conference on Intelligent Systems: Theories and Applications, Sydney, Australia, 19 May 2008. [Google Scholar]
- Le, L.T.; Nguyen, H.; Dou, J.; Zhou, J. A Comparative Study of PSO-ANN, GA-ANN, ICA-ANN, and ABC-ANN in Estimating the Heating Load of Buildings’ Energy Efficiency for Smart City Planning. Appl. Sci. 2019, 9, 2630. [Google Scholar] [CrossRef]
- Li, G.; Li, F.; Xu, C.; Fang, X. A Spatial-Temporal Layer-Wise Relevance Propagation Method for Improving Interpretability and Prediction Accuracy of LSTM Building Energy Prediction. Energy Build. 2022, 271, 112317. [Google Scholar] [CrossRef]
- Zhang, W.; Wu, Y.; Calautit, J.K. A Review on Occupancy Prediction through Machine Learning for Enhancing Energy Efficiency, Air Quality and Thermal Comfort in the Built Environment. Renew. Sustain. Energy Rev. 2022, 167, 112704. [Google Scholar] [CrossRef]
- Bell, N.O.; Bilbao, J.I.; Kay, M.; Sproul, A.B. Future Climate Scenarios and Their Impact on Heating, Ventilation and Air-Conditioning System Design and Performance for Commercial Buildings for 2050. Renew. Sustain. Energy Rev. 2022, 162, 112363. [Google Scholar] [CrossRef]
- Chikkam, S.; Singh, S. Condition Monitoring and Fault Diagnosis of Induction Motor Using DWT and ANN. Arab. J. Sci. Eng. 2023, 48, 6237–6252. [Google Scholar] [CrossRef]
- Hussain, M.; Memon, T.D.; Hussain, I.; Memon, Z.A.; Kumar, D. Fault Detection and Identification Using Deep Learning Algorithms in Induction Motors. Comput. Model. Eng. Sci. 2022, 133, 435–470. [Google Scholar] [CrossRef]
- Zhang, R.; Hong, T. Modeling of HVAC Operational Faults in Building Performance Simulation. Appl. Energy 2017, 202, 178–188. [Google Scholar] [CrossRef]
- Castangia, M.; Sappa, R.; Girmay, A.A.; Camarda, C.; Macii, E.; Patti, E. Anomaly Detection on Household Appliances Based on Variational Autoencoders. Sustain. Energy Grids Netw. 2022, 32, 100823. [Google Scholar] [CrossRef]
- Zenebe, T.M.; Midtgård, O.M.; Völler, S.; Cali, Ü. Machine Learning for PV System Operational Fault Analysis: Literature Review. In Proceedings of the Communications in Computer and Information Science, Stellenbosch, South Africa, 5–9 December 2022; Volume 1616. [Google Scholar]
- Meyer, A. Vibration Fault Diagnosis in Wind Turbines Based on Automated Feature Learning. Energies 2022, 15, 1514. [Google Scholar] [CrossRef]
- Strobl, C.; Schafer, M.; Rabenstein, R. Predictive Circuit Protection for DC Grids. In Proceedings of the ICEC 2016—28th International Conference on Electric Contacts, Edinburgh, UK, 9 June 2016. [Google Scholar]
- Liu, M.; Xia, L.; Wang, Y.; Chakrabarty, K. Fault Tolerance for RRAM-Based Matrix Operations. In Proceedings of the International Test Conference, Harbin, China, 15–17 August 2018; Volume 2018. [Google Scholar]
- Gros, A.; Guillem, A.; De Luca, L.; Baillieul, É.; Duvocelle, B.; Malavergne, O.; Leroux, L.; Zimmer, T. Faceting the Post-Disaster Built Heritage Reconstruction Process within the Digital Twin Framework for Notre-Dame de Paris. Sci. Rep. 2023, 13, 5981. [Google Scholar] [CrossRef]
- Cinquepalmi, F.; Cumo, F. Using Digital Twin Models (DTM) for managing, protecting and restoring historical buildings. Conserv. Sci. Cult. Herit. 2022, 22, 425–445. [Google Scholar] [CrossRef]
- Kohno, M. High-Rise Building Fires. J. Disaster Res. 2007, 2, 236–249. [Google Scholar] [CrossRef]
- Arbatskaya, E.O.; Borisova, I.O. Responses to disasters in Russian and French speaking Twitter: Notre Dame de Paris and St. Peter and St. Paul of Nantes cathedrals fires cases. Sign Probl. Field Mediaeduc. 2022, 3, 164–174. [Google Scholar] [CrossRef]
- Yang, B.; Haghighat, F.; Fung, B.C.M.; Panchabikesan, K. Season-Based Occupancy Prediction in Residential Buildings Using Machine Learning Models. e-Prime-Adv. Electr. Eng. Electron. Energy 2021, 1, 100003. [Google Scholar] [CrossRef]
- Mumma, S.A. Transient Occupancy Ventilation By Monitoring CO2. IAQ Appl. 2004, 5, 21–23. [Google Scholar]
- Wickramathilaka, M.; Abdullah, M.P.; Hassan, M.Y.; Abdullah, H. Detection of Occupancy Status from Internet Connectivity for Non-Intrusive Load Monitoring. Indones. J. Electr. Eng. Comput. Sci. 2023, 30, 2502–4752. [Google Scholar] [CrossRef]
- Barbour, E.; Davila, C.C.; Gupta, S.; Reinhart, C.; Kaur, J.; González, M.C. Planning for Sustainable Cities by Estimating Building Occupancy with Mobile Phones. Nat. Commun. 2019, 10, 3736. [Google Scholar] [CrossRef] [PubMed]
- Panchabikesan, K.; Haghighat, F.; Mankibi, M. El Data Driven Occupancy Information for Energy Simulation and Energy Use Assessment in Residential Buildings. Energy 2021, 218, 119539. [Google Scholar] [CrossRef]
- Kim, Y.S.; Heidarinejad, M.; Dahlhausen, M.; Srebric, J. Building Energy Model Calibration with Schedules Derived from Electricity Use Data. Appl. Energy 2017, 190, 997–1007. [Google Scholar] [CrossRef]
- Hobson, B.W.; Lowcay, D.; Gunay, H.B.; Ashouri, A.; Newsham, G.R. Opportunistic Occupancy-Count Estimation Using Sensor Fusion: A Case Study. Build. Environ. 2019, 159, 106154. [Google Scholar] [CrossRef]
- Ding, Y.; Chen, W.; Wei, S.; Yang, F. An Occupancy Prediction Model for Campus Buildings Based on the Diversity of Occupancy Patterns. Sustain. Cities Soc. 2021, 64, 102533. [Google Scholar] [CrossRef]
- D’Oca, S.; Hong, T. Occupancy Schedules Learning Process through a Data Mining Framework. Energy Build. 2015, 88, 395–408. [Google Scholar] [CrossRef]
- Candanedo, L.M.; Feldheim, V. Accurate Occupancy Detection of an Office Room from Light, Temperature, Humidity and CO2 Measurements Using Statistical Learning Models. Energy Build. 2016, 112, 28–39. [Google Scholar] [CrossRef]
- Wang, W.; Hong, T.; Xu, N.; Xu, X.; Chen, J.; Shan, X. Cross-Source Sensing Data Fusion for Building Occupancy Prediction with Adaptive Lasso Feature Filtering. Build. Environ. 2019, 162, 106280. [Google Scholar] [CrossRef]
- Wang, W.; Chen, J.; Hong, T. Occupancy Prediction through Machine Learning and Data Fusion of Environmental Sensing and Wi-Fi Sensing in Buildings. Autom. Constr. 2018, 94, 233–243. [Google Scholar] [CrossRef]
- Fayed, N.S.; Elmogy, M.M.; Atwan, A.; El-Daydamony, E. Efficient Occupancy Detection System Based on Neutrosophic Weighted Sensors Data Fusion. IEEE Access 2022, 10, 13400–13427. [Google Scholar] [CrossRef]
- Štěpán, P.; Kulich, M.; Přeuǐl, L. Robust Data Fusion with Occupancy Grid. IEEE Trans. Syst. Man Cybern. Part C Appl. Rev. 2005, 35, 106–115. [Google Scholar] [CrossRef]
- Alanezi, A.; Hallinan, K.P.; Huang, K. Automated Residential Energy Audits Using a Smart Wifi Thermostat-Enabled Data Mining Approach. Energies 2021, 14, 2500. [Google Scholar] [CrossRef]
- Wang, C.; Pattawi, K.; Lee, H. Energy Saving Impact of Occupancy-Driven Thermostat for Residential Buildings. Energy Build. 2020, 211, 109791. [Google Scholar] [CrossRef]
- Casella, E.; Khamesi, A.R.; Silvestri, S.; Baker, D.A.; Das, S.K. HVAC Power Conservation through Reverse Auctions and Machine Learning. In Proceedings of the 2022 IEEE International Conference on Pervasive Computing and Communications, PerCom 2022, Pisa, Italy, 21–25 March 2022. [Google Scholar]
- Wang, M.; Wang, Z.; Geng, Y.; Lin, B. Interpreting the Neural Network Model for HVAC System Energy Data Mining. Build. Environ. 2022, 209, 108449. [Google Scholar] [CrossRef]
- Nikdel, L.; Janoyan, K.; Bird, S.D.; Powers, S.E. Multiple Perspectives of the Value of Occupancy-Based HVAC Control Systems. Build. Environ. 2018, 129, 15–25. [Google Scholar] [CrossRef]
- Dong, J.; Winstead, C.; Nutaro, J.; Kuruganti, T. Occupancy-Based HVAC Control with Short-Term Occupancy Prediction Algorithms for Energy-Efficient Buildings. Energies 2018, 11, 2427. [Google Scholar] [CrossRef]
- Turley, C.; Jacoby, M.; Pavlak, G.; Henze, G. Development and Evaluation of Occupancy-Aware HVAC Control for Residential Building Energy Efficiency and Occupant Comfort. Energies 2020, 13, 5396. [Google Scholar] [CrossRef]
- Huchuk, B.; Sanner, S.; O’Brien, W. Comparison of Machine Learning Models for Occupancy Prediction in Residential Buildings Using Connected Thermostat Data. Build. Environ. 2019, 160, 106177. [Google Scholar] [CrossRef]
- Batra, N.; Arjunan, P.; Singh, A.; Singh, P. Experiences with Occupancy Based Building Management Systems. In Proceedings of the 2013 IEEE 8th International Conference on Intelligent Sensors, Sensor Networks and Information Processing: Sensing the Future, ISSNIP 2013, Melbourne, Australia, 2–5 April 2013; Volume 1. [Google Scholar]
- Javed, A.; Larijani, H.; Wixted, A. Improving Energy Consumption of a Commercial Building with IoT and Machine Learning. IT Prof. 2018, 20, 30–38. [Google Scholar] [CrossRef]
- Kanna, K.; AIT Lachguer, K.; Yaagoubi, R. MyComfort: An Integration of BIM-IoT-Machine Learning for Optimizing Indoor Thermal Comfort Based on User Experience. Energy Build. 2022, 277, 112547. [Google Scholar] [CrossRef]
- Salamone, F.; Belussi, L.; Currò, C.; Danza, L.; Ghellere, M.; Guazzi, G.; Lenzi, B.; Megale, V.; Meroni, I. Integrated Method for Personal Thermal Comfort Assessment and Optimization through Users’ Feedback, IoT and Machine Learning: A Case Study. Sensors 2018, 18, 1602. [Google Scholar] [CrossRef] [PubMed]
- Tardioli, G.; Filho, R.; Bernaud, P.; Ntimos, D. An Innovative Modelling Approach Based on Building Physics and Machine Learning for the Prediction of Indoor Thermal Comfort in an Office Building. Buildings 2022, 12, 475. [Google Scholar] [CrossRef]
- Rudin, C.; Chen, C.; Chen, Z.; Huang, H.; Semenova, L.; Zhong, C. Interpretable Machine Learning: Fundamental Principles and 10 Grand Challenges. Stat. Surv. 2022, 16, 1–85. [Google Scholar] [CrossRef]
- Bourdeau, M.; Zhai, X.Q.; Nefzaoui, E.; Guo, X.; Chatellier, P. Modeling and Forecasting Building Energy Consumption: A Review of Data-Driven Techniques. Sustain. Cities Soc. 2019, 48, 101533. [Google Scholar] [CrossRef]
- Fathi, S.; Srinivasan, R.; Fenner, A.; Fathi, S. Machine Learning Applications in Urban Building Energy Performance Forecasting: A Systematic Review. Renew. Sustain. Energy Rev. 2020, 133, 110287. [Google Scholar] [CrossRef]
- Liu, Z.; Wu, D.; Liu, Y.; Han, Z.; Lun, L.; Gao, J.; Jin, G.; Cao, G. Accuracy Analyses and Model Comparison of Machine Learning Adopted in Building Energy Consumption Prediction. Energy Explor. Exploit. 2019, 37, 1426–1451. [Google Scholar] [CrossRef]
- Burkart, N.; Huber, M.F. A Survey on the Explainability of Supervised Machine Learning. J. Artif. Intell. Res. 2021, 70, 245–317. [Google Scholar] [CrossRef]
- Yan, K.; Zhong, C.; Ji, Z.; Huang, J. Semi-Supervised Learning for Early Detection and Diagnosis of Various Air Handling Unit Faults. Energy Build. 2018, 181, 75–83. [Google Scholar] [CrossRef]
- Saisubramanian, S.; Galhotra, S.; Zilberstein, S. Balancing the Tradeoff between Clustering Value and Interpretability. In Proceedings of the AIES 2020—AAAI/ACM Conference on AI, Ethics, and Society, New York, NY, USA, 7–8 February 2020. [Google Scholar]
- Fan, F.L.; Xiong, J.; Li, M.; Wang, G. On Interpretability of Artificial Neural Networks: A Survey. IEEE Trans. Radiat. Plasma Med. Sci. 2021, 5, 741–760. [Google Scholar] [CrossRef] [PubMed]
- Vigneau, E. Clustering of Variables for Enhanced Interpretability of Predictive Models. Informatica 2021, 45, 507–515. [Google Scholar] [CrossRef]
- Kamath, U.; Liu, J. Explainable Artificial Intelligence: An Introduction to Interpretable Machine Learning; Springer: Cham, Switzerland, 2021. [Google Scholar]
- El Fiorenza Caroline, J.; Parmar, P.; Tiwari, S.; Dixit, A.; Gupta, A. Accuracy Prediction Using Analysis Methods and F-Measures. In Proceedings of the Journal of Physics: Conference Series; IOP Publishing: Bristol, UK, 2019; Volume 1362. [Google Scholar]
- Sha, H.; Xu, P.; Lin, M.; Peng, C.; Dou, Q. Development of a Multi-Granularity Energy Forecasting Toolkit for Demand Response Baseline Calculation. Appl. Energy 2021, 289, 116652. [Google Scholar] [CrossRef]
- Ledmaoui, Y.; El Maghraoui, A.; El Aroussi, M.; Saadane, R.; Chebak, A.; Chehri, A. Forecasting Solar Energy Production: A Comparative Study of Machine Learning Algorithms. Energy Rep. 2023, 10, 1004–1012. [Google Scholar] [CrossRef]
- Lin, Y.; Li, B.; Moiser, T.M.; Griffel, L.M.; Mahalik, M.R.; Kwon, J.; Alam, S.M.S. Revenue Prediction for Integrated Renewable Energy and Energy Storage System Using Machine Learning Techniques. J. Energy Storage 2022, 50, 104123. [Google Scholar] [CrossRef]
- Vilone, G.; Longo, L. A Quantitative Evaluation of Global, Rule-Based Explanations of Post-Hoc, Model Agnostic Methods. Front. Artif. Intell. 2021, 4, 717899. [Google Scholar] [CrossRef]
- Friston, K.; Penny, W. Post Hoc Bayesian Model Selection. Neuroimage 2011, 56, 2089–2099. [Google Scholar] [CrossRef]
- Zafar, M.R.; Khan, N. Deterministic Local Interpretable Model-Agnostic Explanations for Stable Explainability. Mach. Learn. Knowl. Extr. 2021, 3, 27. [Google Scholar] [CrossRef]
- Guo, M.H.; Xu, T.X.; Liu, J.J.; Liu, Z.N.; Jiang, P.T.; Mu, T.J.; Zhang, S.H.; Martin, R.R.; Cheng, M.M.; Hu, S.M. Attention Mechanisms in Computer Vision: A Survey. Comput. Vis. Media 2022, 8, 331–368. [Google Scholar] [CrossRef]
- Robnik-Šikonja, M.; Bohanec, M. Perturbation-Based Explanations of Prediction Models. In Human and Machine Learning: Visible, Explainable, Trustworthy and Transparent; Springer: Berlin/Heidelberg, Germany, 2018. [Google Scholar]
- Doshi-Velez, F.; Kim, B. A Roadmap for a Rigorous Science of Interpretability. arXiv 2017, arXiv:1702.08608v1. [Google Scholar]
- Doshi-Velez, F.; Kim, B. Considerations for Evaluation and Generalization in Interpretable Machine Learning. In Explainable and Interpretable Models in Computer Vision and Machine Learning; Springer: Berlin/Heidelberg, Germany, 2018. [Google Scholar]
- Sarker, I.H. Machine Learning: Algorithms, Real-World Applications and Research Directions. SN Comput. Sci. 2021, 2, 160. [Google Scholar] [CrossRef]
- Li, Z.; Unger, H.; Kyamakya, K. Guest Editorial: Explainability of Machine Learning in Methodologies and Applications. Knowl. Based Syst. 2023, 264, 110357. [Google Scholar] [CrossRef]
- Franchini, G.; Ruggiero, V.; Porta, F.; Zanni, L. Neural Architecture Search via Standard Machine Learning Methodologies. Math. Eng. 2023, 5, 1–21. [Google Scholar] [CrossRef]
- Choi, R.Y.; Coyner, A.S.; Kalpathy-Cramer, J.; Chiang, M.F.; Peter Campbell, J. Introduction to Machine Learning, Neural Networks, and Deep Learning. Transl. Vis. Sci. Technol. 2020, 9, 14. [Google Scholar] [PubMed]
- Vijaychandra, J.; Sesha Sai, B.; Sateesh Babu, B.; Jagannadh, P. A Comprehensive Review on McCulloch-Pitts Neuron Model. Int. J. Innov. Technol. Explor. Eng. 2019, 8, 1516–1522. [Google Scholar]
- Benítez, J.M.; Castro, J.L.; Requena, I. Are Artificial Neural Networks Black Boxes? IEEE Trans. Neural Netw. 1997, 8, 1156–1164. [Google Scholar] [CrossRef]
- Jang, J.; Jeong, W.; Kim, S.; Lee, B.; Lee, M.; Moon, J. RAID: Robust and Interpretable Daily Peak Load Forecasting via Multiple Deep Neural Networks and Shapley Values. Sustainability 2023, 15, 6951. [Google Scholar] [CrossRef]
- Li, A.; Xiao, F.; Zhang, C.; Fan, C. Attention-Based Interpretable Neural Network for Building Cooling Load Prediction. Appl. Energy 2021, 299, 117238. [Google Scholar] [CrossRef]
- Chen, Y.; Yang, Q.; Chen, Z.; Yan, C.; Zeng, S.; Dai, M. Physics-Informed Neural Networks for Building Thermal Modeling and Demand Response Control. Build. Environ. 2023, 234, 110149. [Google Scholar] [CrossRef]
- Chen, Y.; Zhang, D. Theory-Guided Deep-Learning for Electrical Load Forecasting (TgDLF) via Ensemble Long Short-Term Memory. Adv. Appl. Energy 2021, 1, 100004. [Google Scholar] [CrossRef]
- Di Natale, L.; Svetozarevic, B.; Heer, P.; Jones, C.N. Physically Consistent Neural Networks for Building Thermal Modeling: Theory and Analysis. Appl. Energy 2022, 325, 119806. [Google Scholar] [CrossRef]
- Wang, H.; Cai, R.; Zhou, B.; Aziz, S.; Qin, B.; Voropai, N.; Gan, L.; Barakhtenko, E. Solar Irradiance Forecasting Based on Direct Explainable Neural Network. Energy Convers. Manag. 2020, 226, 113487. [Google Scholar] [CrossRef]
- Cengiz, A.B.; Birant, K.U.; Cengiz, M.; Birant, D.; Baysari, K. Improving the Performance and Explainability of Indoor Human Activity Recognition in the Internet of Things Environment. Symmetry 2022, 14, 2022. [Google Scholar] [CrossRef]
- Yuan, L.; Andrews, J.; Mu, H.; Vakil, A.; Ewing, R.; Blasch, E.; Li, J. Interpretable Passive Multi-Modal Sensor Fusion for Human Identification and Activity Recognition. Sensors 2022, 22, 5787. [Google Scholar] [CrossRef]
- Zhang, X.; Chung, F.L.; Wang, S. An Interpretable Fuzzy DBN-Based Classifier for Indoor User Movement Prediction in Ambient Assisted Living Applications. IEEE Trans. Ind. Inf. 2020, 16, 42–53. [Google Scholar] [CrossRef]
- Kim, E. Interpretable and Accurate Convolutional Neural Networks for Human Activity Recognition. IEEE Trans. Ind. Inf. 2020, 16, 7190–7198. [Google Scholar] [CrossRef]
- Li, L.; Yan, J.; Yang, X.; Jin, Y. Learning Interpretable Deep State Space Model for Probabilistic Time Series Forecasting. In Proceedings of the IJCAI International Joint Conference on Artificial Intelligence, Macao, China, 10–16 August 2019; Volume 2019. [Google Scholar]
- Daza, A.; Frank, A. Translate and Label! An Encoder-Decoder Approach for Cross-Lingual Semantic Role Labeling. In Proceedings of the EMNLP-IJCNLP 2019—2019 Conference on Empirical Methods in Natural Language Processing and 9th International Joint Conference on Natural Language Processing, Hong Kong, China, 3–7 November 2019. [Google Scholar]
- Bahdanau, D.; Cho, K.H.; Bengio, Y. Neural Machine Translation by Jointly Learning to Align and Translate. In Proceedings of the 3rd International Conference on Learning Representations, ICLR 2015, San Diego, CA, USA, 7–9 May 2015. [Google Scholar]
- Li, C.; Dong, Z.; Ding, L.; Petersen, H.; Qiu, Z.; Chen, G.; Prasad, D. Interpretable Memristive LSTM Network Design for Probabilistic Residential Load Forecasting. IEEE Trans. Circuits Syst. I Regul. Pap. 2022, 69, 2297–2310. [Google Scholar] [CrossRef]
- Luo, T.; Cao, X.; Li, J.; Dong, K.; Zhang, R.; Wei, X. Multi-Task Prediction Model Based on ConvLSTM and Encoder-Decoder. Intell. Data Anal. 2021, 25, 359–382. [Google Scholar] [CrossRef]
- Li, D.; Li, D.; Li, C.; Li, L.; Gao, L. A Novel Data-Temporal Attention Network Based Strategy for Fault Diagnosis of Chiller Sensors. Energy Build. 2019, 198, 377–394. [Google Scholar] [CrossRef]
- Gao, Y.; Ruan, Y. Interpretable Deep Learning Model for Building Energy Consumption Prediction Based on Attention Mechanism. Energy Build. 2021, 252, 111379. [Google Scholar] [CrossRef]
- Ellis, M.J.; Chinde, V. An Encoder–Decoder LSTM-Based EMPC Framework Applied to a Building HVAC System. Chem. Eng. Res. Des. 2020, 160, 508–520. [Google Scholar] [CrossRef]
- Azam, M.F.; Younis, M.S. Multi-Horizon Electricity Load and Price Forecasting Using an Interpretable Multi-Head Self-Attention and EEMD-Based Framework. IEEE Access 2021, 9, 85918–85932. [Google Scholar] [CrossRef]
- Liu, X.; Ding, Y.; Tang, H.; Xiao, F. A Data Mining-Based Framework for the Identification of Daily Electricity Usage Patterns and Anomaly Detection in Building Electricity Consumption Data. Energy Build. 2021, 231, 110601. [Google Scholar] [CrossRef]
- Prabhakaran, K.; Dridi, J.; Amayri, M.; Bouguila, N. Explainable K-Means Clustering for Occupancy Estimation. In Proceedings of the Procedia Computer Science; Elsevier: Amsterdam, The Netherlands, 2022; Volume 203, pp. 326–333. [Google Scholar]
- Galli, A.; Piscitelli, M.S.; Moscato, V.; Capozzoli, A. Bridging the Gap between Complexity and Interpretability of a Data Analytics-Based Process for Benchmarking Energy Performance of Buildings. Expert. Syst. Appl. 2022, 206, 117649. [Google Scholar] [CrossRef]
- Choi, S.Y.; Kim, S.H. Selection of a Transparent Meta-Model Algorithm for Feasibility Analysis Stage of Energy Efficient Building Design: Clustering vs. Tree. Energies 2022, 15, 6620. [Google Scholar] [CrossRef]
- Tang, W.; Wang, H.; Lee, X.L.; Yang, H.T. Machine Learning Approach to Uncovering Residential Energy Consumption Patterns Based on Socioeconomic and Smart Meter Data. Energy 2022, 240, 122500. [Google Scholar] [CrossRef]
- Grimaldo, A.; Novak, J. Explainable Needn’t Be (Much) Less Accurate: Evaluating an Explainable AI Dashboard for Energy Forecasting. In Proceedings of the IFIP Advances in Information and Communication Technology, Virtual, 12–13 May 2021; Volume 628. [Google Scholar]
- Grimaldo, A.I.; Novak, J. User-Centered Visual Analytics Approach for Interactive and Explainable Energy Demand Analysis in Prosumer Scenarios. In Proceedings of the Lecture Notes in Computer Science (Including Subseries Lecture Notes in Artificial Intelligence and Lecture Notes in Bioinformatics); IOP Publishing: Bristol, UK, 2019; Volume 11754, LNCS. [Google Scholar]
- Bhatia, A.; Garg, V.; Haves, P.; Pudi, V. Explainable Clustering Using Hyper-Rectangles for Building Energy Simulation Data. In Proceedings of the IOP Conference Series: Earth and Environmental Science; IOP Publishing: Bristol, UK, 2019; Volume 238. [Google Scholar]
- Kasuya, T.; Takeshi, T.; Esaki, H. Building Activity Profiling: Explainable and Predictive Modeling for Building Automation. In Proceedings of the 2020 International Conference on Artificial Intelligence in Information and Communication, ICAIIC 2020, Fukuoka, Japan, 19–21 February 2020. [Google Scholar]
- Xiao, T.; Xu, P.; Ding, R.; Chen, Z. An Interpretable Method for Identifying Mislabeled Commercial Building Based on Temporal Feature Extraction and Ensemble Classifier. Sustain. Cities Soc. 2022, 78, 103635. [Google Scholar] [CrossRef]
- Miller, C. What’s in the Box?! Towards Explainable Machine Learning Applied to Non-Residential Building Smart Meter Classification. Energy Build. 2019, 199, 523–536. [Google Scholar] [CrossRef]
- Khamma, T.R.; Zhang, Y.; Guerrier, S.; Boubekri, M. Generalized Additive Models: An Efficient Method for Short-Term Energy Prediction in Office Buildings. Energy 2020, 213, 118834. [Google Scholar] [CrossRef]
- Voss, M.; Heinekamp, J.F.; Krutzsch, S.; Sick, F.; Albayrak, S.; Strunz, K. Generalized Additive Modeling of Building Inertia Thermal Energy Storage for Integration into Smart Grid Control. IEEE Access 2021, 9, 71699–71711. [Google Scholar] [CrossRef]
- Li, Y.; Cao, L.; Zhang, J.; Jiang, Y.; Han, Y.; Wei, J. Energy Benchmarking in Healthcare Facilities: A Comparative Study. J. Constr. Eng. Manag. 2021, 147, 04021159. [Google Scholar] [CrossRef]
- Ghose, A.; Pizzol, M.; McLaren, S.J.; Vignes, M.; Dowdell, D. Refurbishment of Office Buildings in New Zealand: Identifying Priorities for Reducing Environmental Impacts. Int. J. Life Cycle Assess. 2019, 24, 1480–1495. [Google Scholar] [CrossRef]
- González-Mahecha, R.E.; Lucena, A.F.P.; Szklo, A.; Ferreira, P.; Vaz, A.I.F. Optimization Model for Evaluating On-Site Renewable Technologies with Storage in Zero/Nearly Zero Energy Buildings. Energy Build. 2018, 172, 505–516. [Google Scholar] [CrossRef]
- Charalampopoulos, I. A Comparative Sensitivity Analysis of Human Thermal Comfort Indices with Generalized Additive Models. Theor. Appl. Clim. 2019, 137, 1605–1622. [Google Scholar] [CrossRef]
- Pathak, N.; Ba, A.; Ploennigs, J.; Roy, N. Forecasting Gas Usage for Big Buildings Using Generalized Additive Models and Deep Learning. In Proceedings of the 2018 IEEE International Conference on Smart Computing, SMARTCOMP 2018, Taormina, Italy, 18–20 June 2018. [Google Scholar]
- Sundararajan, A.; Ollis, B. Regression and Generalized Additive Model to Enhance the Performance of Photovoltaic Power Ensemble Predictors. IEEE Access 2021, 9, 111899–111914. [Google Scholar] [CrossRef]
- Ribeiro, M.T.; Singh, S.; Guestrin, C. “Why Should i Trust You?” Explaining the Predictions of Any Classifier. In Proceedings of the NAACL-HLT 2016—2016 Conference of the North American Chapter of the Association for Computational Linguistics: Human Language Technologies, San Diego, CA, USA, 12–17 June 2016. [Google Scholar]
- Hülsmann, J.; Barbosa, J.; Steinke, F. Local Interpretable Explanations of Energy System Designs. Energies 2023, 16, 2161. [Google Scholar] [CrossRef]
- Wastensteiner, J.; Michael Weiss, T.; Haag, F.; Hopf, K. Explainable AI for Tailored Electricity Consumption Feedback–An Experimental Evaluation of Visualizations Experimental Evaluation of Visualizations. arXiv 2021, arXiv:2208.11408. [Google Scholar]
- Tsoka, T.; Ye, X.; Chen, Y.Q.; Gong, D.; Xia, X. Building Energy Performance Certificate Labelling Classification Based on Explainable Artificial Intelligence. In Proceedings of the Communications in Computer and Information Science, Guangzhou, China, 27–30 August 2021; Springer Science and Business Media: Berlin/Heidelberg, Germany, 2021; Volume 1449, pp. 181–196. [Google Scholar]
- Chung, W.J.; Liu, C. Analysis of Input Parameters for Deep Learning-Based Load Prediction for Office Buildings in Different Climate Zones Using EXplainable Artificial Intelligence. Energy Build. 2022, 276, 112521. [Google Scholar] [CrossRef]
- Srinivasan, S.; Arjunan, P.; Jin, B.; Sangiovanni-Vincentelli, A.L.; Sultan, Z.; Poolla, K. Explainable AI for Chiller Fault-Detection Systems: Gaining Human Trust. Computer 2021, 54, 60–68. [Google Scholar] [CrossRef]
- Carlsson, L.S.; Samuelsson, P.B.; Jönsson, P.G. Interpretable Machine Learning—Tools to Interpret the Predictions of a Machine Learning Model Predicting the Electrical Energy Consumption of an Electric Arc Furnace. Steel Res. Int. 2020, 91, 2000053. [Google Scholar] [CrossRef]
- Lundberg, S.M.; Lee, S.I. A Unified Approach to Interpreting Model Predictions. In Proceedings of the Advances in Neural Information Processing Systems, Long Beach, CA, USA, 4–9 December 2017; Volume 2017. [Google Scholar]
- Dinmohammadi, F.; Han, Y.; Shafiee, M. Predicting Energy Consumption in Residential Buildings Using Advanced Machine Learning Algorithms. Energies 2023, 16, 3748. [Google Scholar] [CrossRef]
- Sun, M.; Han, C.; Nie, Q.; Xu, J.; Zhang, F.; Zhao, Q. Understanding Building Energy Efficiency with Administrative and Emerging Urban Big Data by Deep Learning in Glasgow. Energy Build. 2022, 273, 112331. [Google Scholar] [CrossRef]
- Park, S.; Moon, J.; Hwang, E. Explainable Anomaly Detection for District Heating Based on Shapley Additive Explanations. In Proceedings of the IEEE International Conference on Data Mining Workshops, ICDMW, Virtual, 7–10 December 2020; Volume 2020. [Google Scholar]
- Ryu, S.H.; Moon, H.J. Development of an Occupancy Prediction Model Using Indoor Environmental Data Based on Machine Learning Techniques. Build. Environ. 2016, 107, 1–9. [Google Scholar] [CrossRef]
- Zhang, W.; Wen, Y.; Tseng, K.J.; Jin, G. Demystifying Thermal Comfort in Smart Buildings: An Interpretable Machine Learning Approach. IEEE Internet Things J. 2021, 8, 8021–8031. [Google Scholar] [CrossRef]
- Yang, Y.; Yuan, Y.; Han, Z.; Liu, G. Interpretability Analysis for Thermal Sensation Machine Learning Models: An Exploration Based on the SHAP Approach. Indoor Air 2022, 32, e12984. [Google Scholar] [CrossRef] [PubMed]
- Shen, Y.; Pan, Y. BIM-Supported Automatic Energy Performance Analysis for Green Building Design Using Explainable Machine Learning and Multi-Objective Optimization. Appl. Energy 2023, 333, 120575. [Google Scholar] [CrossRef]
- Chang, X.; Li, W.; Ma, J.; Yang, T.; Zomaya, A.Y. Interpretable Machine Learning in Sustainable Edge Computing: A Case Study of Short-Term Photovoltaic Power Output Prediction. In Proceedings of the ICASSP, IEEE International Conference on Acoustics, Speech and Signal Processing, Seoul, Republic of Korea, 14–19 April 2024; Volume 2020. [Google Scholar]
- Arjunan, P.; Poolla, K.; Miller, C. EnergyStar++: Towards More Accurate and Explanatory Building Energy Benchmarking. Appl. Energy 2020, 276, 115413. [Google Scholar] [CrossRef]
- Gao, Y.; Han, H.; Lu, H.; Jiang, S.X.; Zhang, Y.; Luo, M.W. Knowledge Mining for Chiller Faults Based on Explanation of Data-Driven Diagnosis. Appl. Therm. Eng. 2022, 205, 118032. [Google Scholar] [CrossRef]
- Ugwuanyi, C. Using Interpretable Machine Learning for Indoor CO2 Level Prediction and Occupancy Estimation. Ph.D. Thesis, University of Strathclyde, Glasgow, UK, 2021. [Google Scholar]
- Park, H.; Park, D.Y. Comparative Analysis on Predictability of Natural Ventilation Rate Based on Machine Learning Algorithms. Build. Environ. 2021, 195, 107744. [Google Scholar] [CrossRef]
- Wenninger, S.; Karnebogen, P.; Lehmann, S.; Menzinger, T.; Reckstadt, M. Evidence for Residential Building Retrofitting Practices Using Explainable AI and Socio-Demographic Data. Energy Rep. 2022, 8, 13514–13528. [Google Scholar] [CrossRef]
- Papadopoulos, S.; Kontokosta, C.E. Grading Buildings on Energy Performance Using City Benchmarking Data. Appl. Energy 2019, 233–234, 244–253. [Google Scholar] [CrossRef]
- Golizadeh Akhlaghi, Y.; Aslansefat, K.; Zhao, X.; Sadati, S.; Badiei, A.; Xiao, X.; Shittu, S.; Fan, Y.; Ma, X. Hourly Performance Forecast of a Dew Point Cooler Using Explainable Artificial Intelligence and Evolutionary Optimisations by 2050. Appl. Energy 2021, 281, 116062. [Google Scholar] [CrossRef]
- Carlsson, L.S.; Samuelsson, P.B.; Jönsson, P.G. Using Interpretable Machine Learning to Predict the Electrical Energy Consumption of an Electric Arc Furnace. Stahl. Eisen 2019, 139, 24–29. [Google Scholar]
- Chahbi, I.; Ben Rabah, N.; Ben Tekaya, I. Towards an Efficient and Interpretable Machine Learning Approach for Energy Prediction in Industrial Buildings: A Case Study in the Steel Industry. In Proceedings of the IEEE/ACS International Conference on Computer Systems and Applications, AICCSA, Abu Dhabi, United Arab Emirates, 5–8 December 2022; IEEE Computer Society: Washington, DC, USA, 2022; Volume 2022. [Google Scholar]
- Singh, M.M.; Singaravel, S.; Geyer, P. Improving Prediction Accuracy of Machine Learning Energy Prediction Models. In Proceedings of the 36th CIB W78 2019 Conference, Northumbria, UK, 18–20 September 2019. [Google Scholar]
- Zhang, C.; Li, J.; Zhao, Y.; Li, T.; Chen, Q.; Zhang, X. A Hybrid Deep Learning-Based Method for Short-Term Building Energy Load Prediction Combined with an Interpretation Process. Energy Build. 2020, 225, 110301. [Google Scholar] [CrossRef]
- Alfalah, B.; Shahrestani, M.; Shao, L. Developing a Hidden Markov Model for Occupancy Prediction in High-Density Higher Education Buildings. J. Build. Eng. 2023, 73, 106795. [Google Scholar] [CrossRef]
- Kim, J.Y.; Cho, S.B. Electric Energy Consumption Prediction by Deep Learning with State Explainable Autoencoder. Energies 2019, 12, 739. [Google Scholar] [CrossRef]
- Moon, J.; Park, S.; Rho, S.; Hwang, E. Robust Building Energy Consumption Forecasting Using an Online Learning Approach with R Ranger. J. Build. Eng. 2022, 47, 103851. [Google Scholar] [CrossRef]
- Moon, J.; Park, S.; Rho, S.; Hwang, E. Interpretable Short-Term Electrical Load Forecasting Scheme Using Cubist. Comput. Intell. Neurosci. 2022, 2022, 6892995. [Google Scholar] [CrossRef]
- Wang, Z.; Wang, Y.; Zeng, R.; Srinivasan, R.S.; Ahrentzen, S. Random Forest Based Hourly Building Energy Prediction. Energy Build. 2018, 171, 11–25. [Google Scholar] [CrossRef]
- Smarra, F.; Jain, A.; de Rubeis, T.; Ambrosini, D.; D’Innocenzo, A.; Mangharam, R. Data-Driven Model Predictive Control Using Random Forests for Building Energy Optimization and Climate Control. Appl. Energy 2018, 226, 1252–1272. [Google Scholar] [CrossRef]
- Liu, Y.; Chen, H.; Zhang, L.; Feng, Z. Enhancing Building Energy Efficiency Using a Random Forest Model: A Hybrid Prediction Approach. Energy Rep. 2021, 7, 5003–5012. [Google Scholar] [CrossRef]
- Zhang, W.; Liu, F.; Wen, Y.; Nee, B. Toward Explainable and Interpretable Building Energy Modelling: An Explainable Artificial Intelligence Approach. In Proceedings of the BuildSys 2021—2021 ACM International Conference on Systems for Energy-Efficient Built Environments, Coimbra, Portugal, 17–18 November 2021. [Google Scholar]
- Touzani, S.; Granderson, J.; Fernandes, S. Gradient Boosting Machine for Modeling the Energy Consumption of Commercial Buildings. Energy Build. 2018, 158, 1533–1543. [Google Scholar] [CrossRef]
- Zhang, Y.; Teoh, B.K.; Wu, M.; Chen, J.; Zhang, L. Data-Driven Estimation of Building Energy Consumption and GHG Emissions Using Explainable Artificial Intelligence. Energy 2023, 262, 125468. [Google Scholar] [CrossRef]
- Yigit, S. A Machine-Learning-Based Method for Thermal Design Optimization of Residential Buildings in Highly Urbanized Areas of Turkey. J. Build. Eng. 2021, 38, 102225. [Google Scholar] [CrossRef]
- Sauer, J.; Mariani, V.C.; dos Santos Coelho, L.; Ribeiro, M.H.D.M.; Rampazzo, M. Extreme Gradient Boosting Model Based on Improved Jaya Optimizer Applied to Forecasting Energy Consumption in Residential Buildings. Evol. Syst. 2022, 13, 577–588. [Google Scholar] [CrossRef]
- Mohammadiziazi, R.; Bilec, M.M. Application of Machine Learning for Predicting Building Energy Use at Different Temporal and Spatial Resolution under Climate Change in USA. Buildings 2020, 10, 139. [Google Scholar] [CrossRef]
- Huang, J.; Algahtani, M.; Kaewunruen, S. Energy Forecasting in a Public Building: A Benchmarking Analysis on Long Short-Term Memory (LSTM), Support Vector Regression (SVR), and Extreme Gradient Boosting (XGBoost) Networks. Appl. Sci. 2022, 12, 9788. [Google Scholar] [CrossRef]
- Sipple, J. Interpretable, Multidimensional, Multimodal Anomaly Detection with Negative Sampling for Detection of Device Failure. In Proceedings of the 37th International Conference on Machine Learning, ICML 2020, Virtual, 13–18 July 2020; Volume 119. [Google Scholar]
- Zhang, Z.; Chen, Y.; Wang, H.; Fu, Q.; Chen, J.; Lu, Y. Anomaly Detection Method for Building Energy Consumption in Multivariate Time Series Based on Graph Attention Mechanism. PLoS ONE 2023, 18, e0286770. [Google Scholar] [CrossRef]
- Lei, L.; Wu, B.; Fang, X.; Chen, L.; Wu, H.; Liu, W. A Dynamic Anomaly Detection Method of Building Energy Consumption Based on Data Mining Technology. Energy 2023, 263, 125575. [Google Scholar] [CrossRef]
- Sakkas, N.; Yfanti, S.; Daskalakis, C.; Barbu, E.; Domnich, M. Interpretable Forecasting of Energy Demand in the Residential Sector. Energies 2021, 14, 6568. [Google Scholar] [CrossRef]
- Tran, B.; Sudusinghe, C.; Nguyen, S.; Alahakoon, D. Building Interpretable Predictive Models with Context-Aware Evolutionary Learning. Appl. Soft Comput. 2023, 132, 109854. [Google Scholar] [CrossRef]
- Jain, R.K.; Damoulas, T.; Kontokosta, C.E. Towards Data-Driven Energy Consumption Forecasting of Multi-Family Residential Buildings: Feature Selection via the Lasso. In Proceedings of the 2014 International Conference on Computing in Civil and Building Engineering, Orlando, FL, USA, 23–25 June 2014. [Google Scholar]
- Krishnan, M. Against Interpretability: A Critical Examination of the Interpretability Problem in Machine Learning. Philos. Technol. 2020, 33, 487–502. [Google Scholar] [CrossRef]
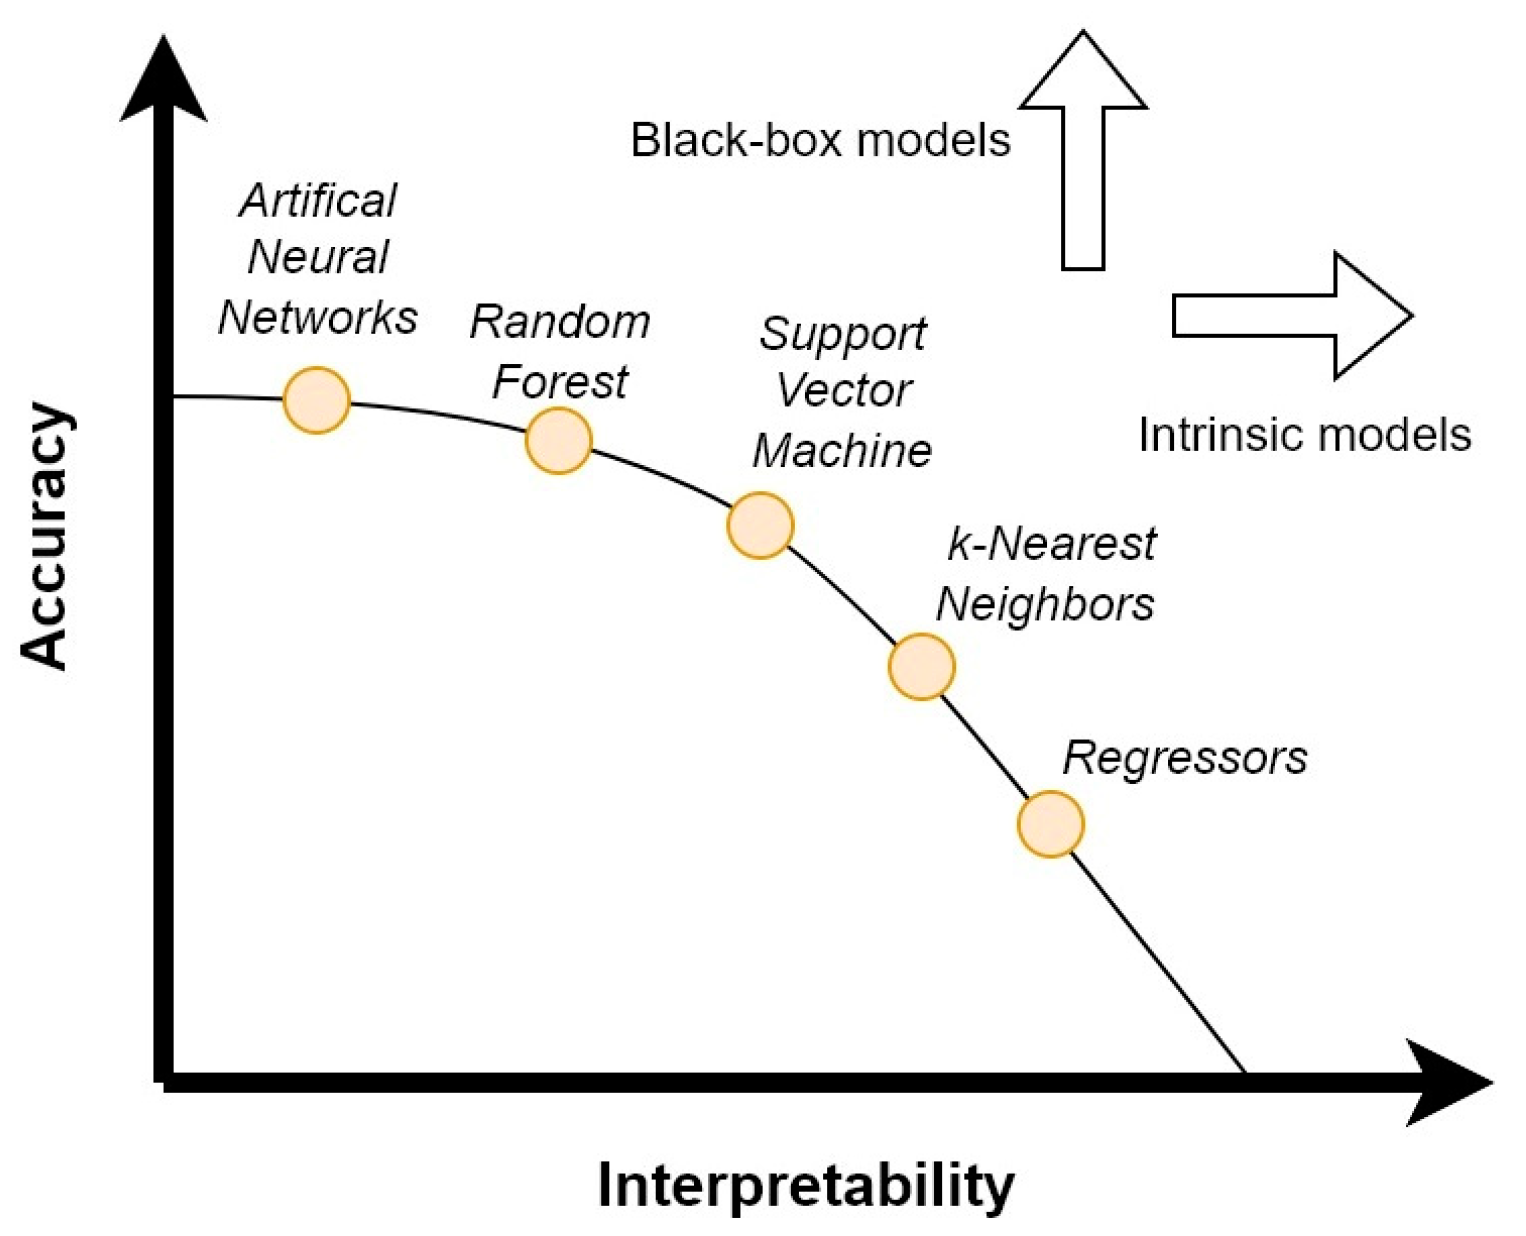
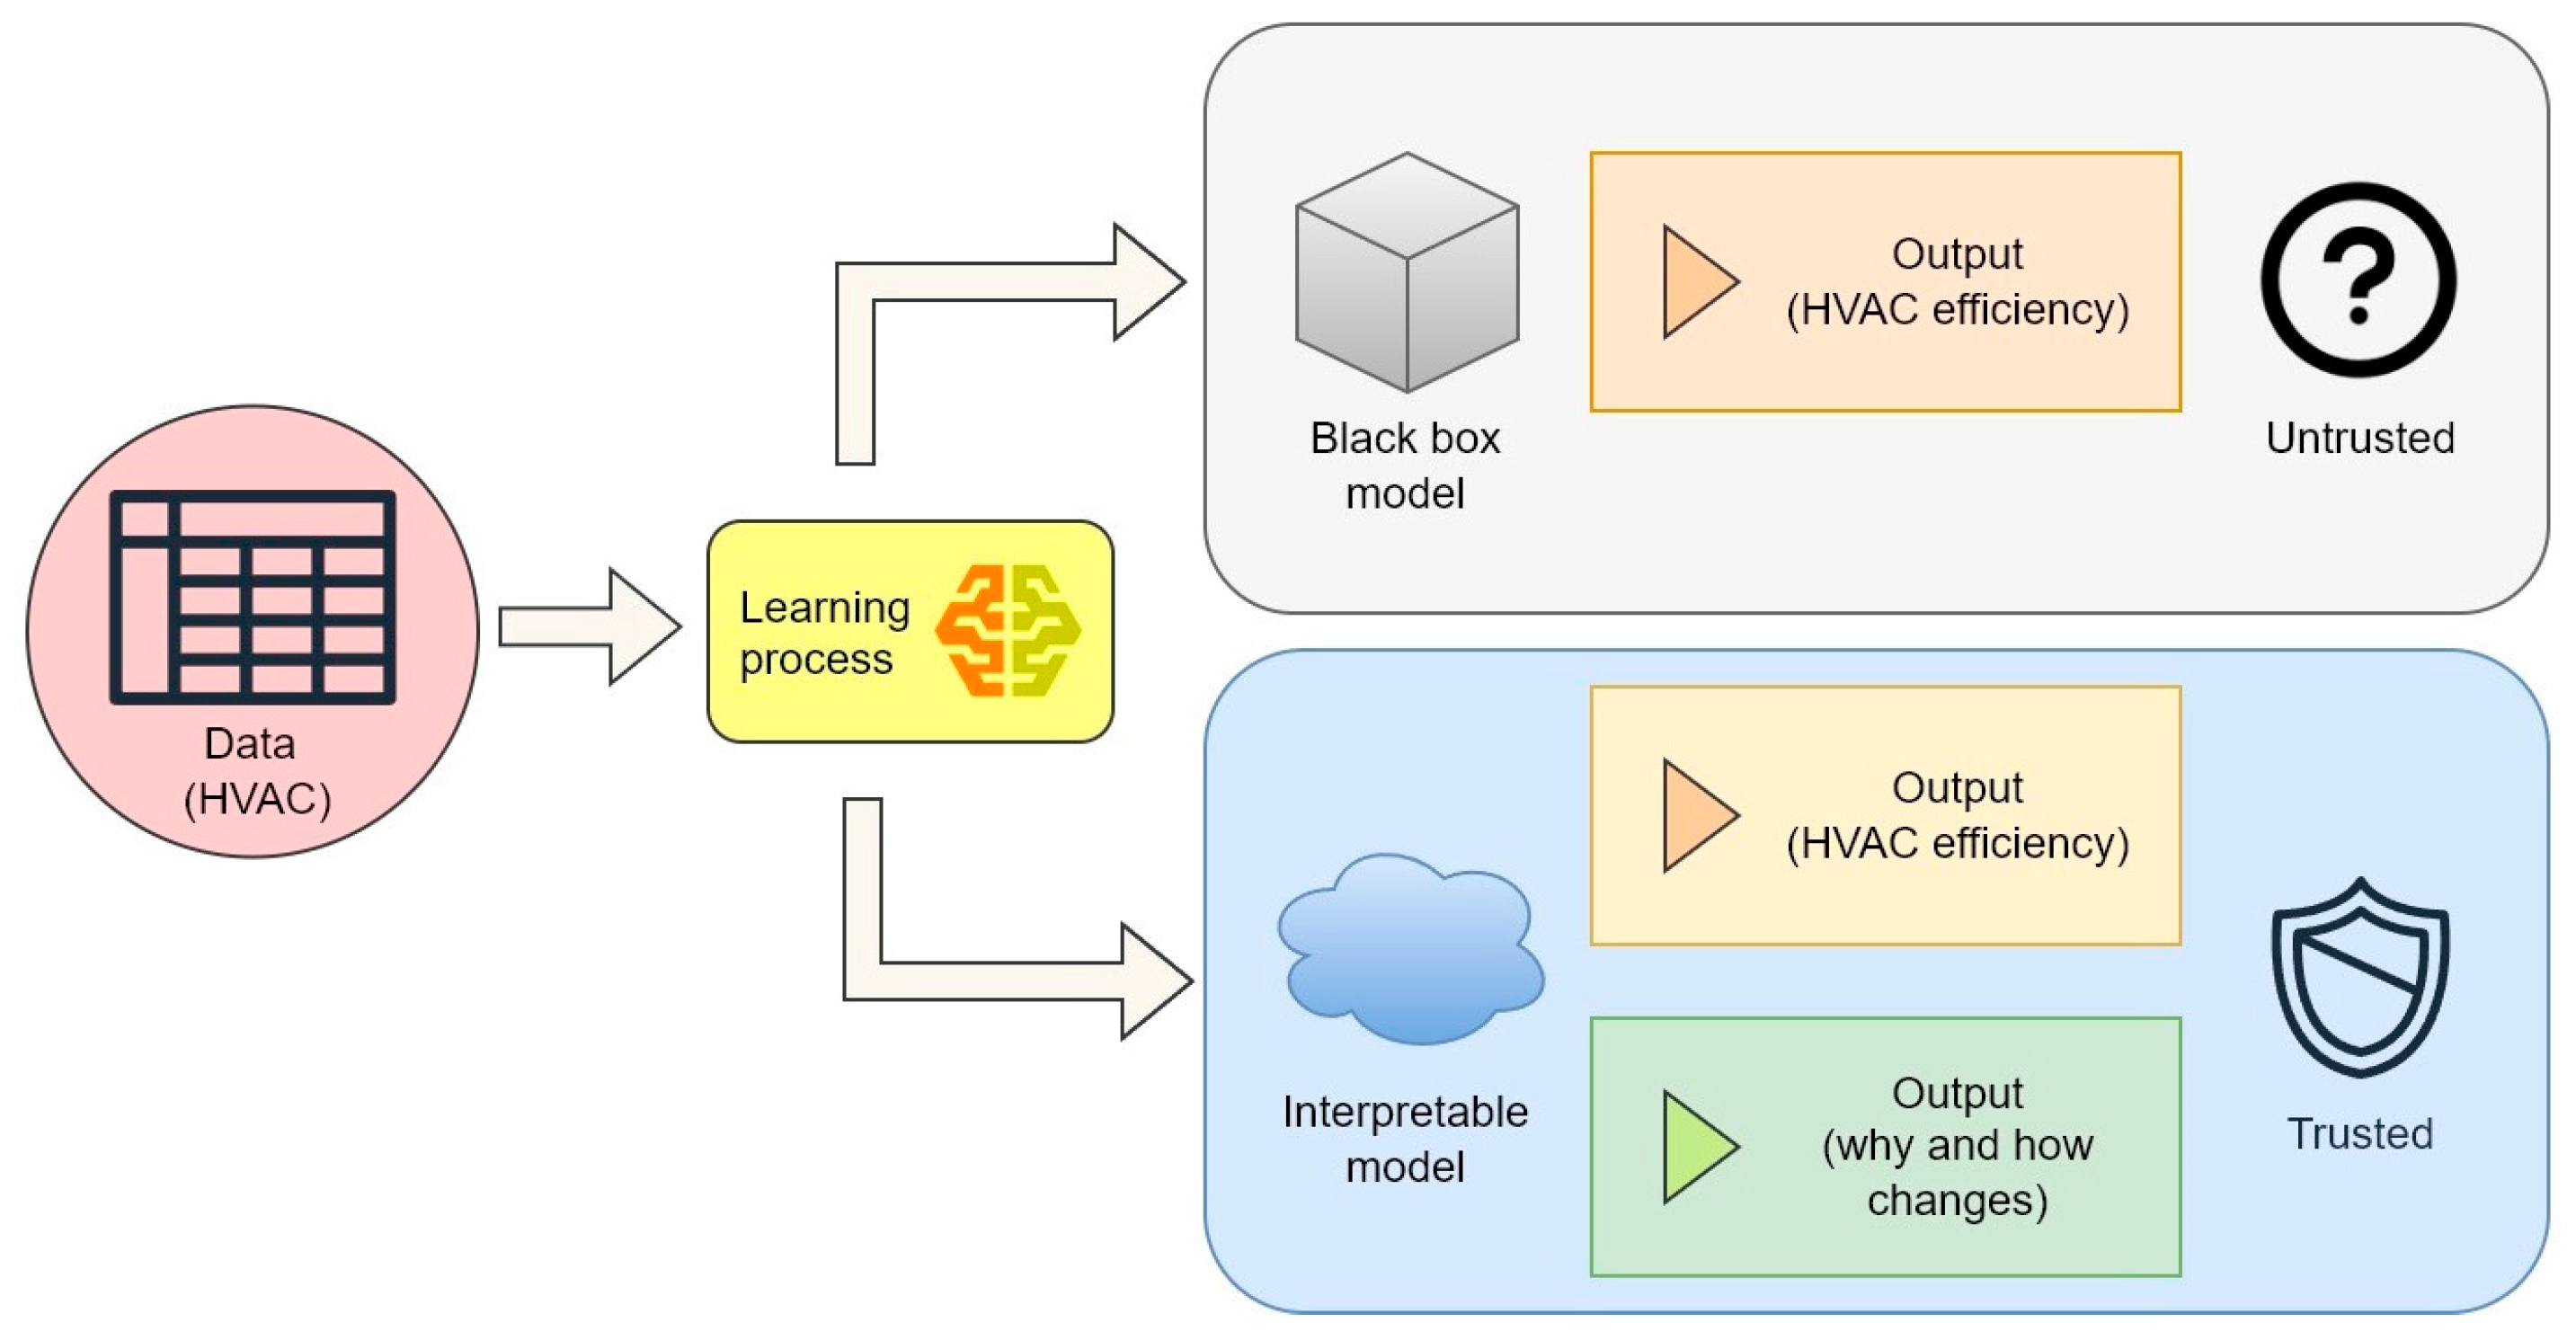

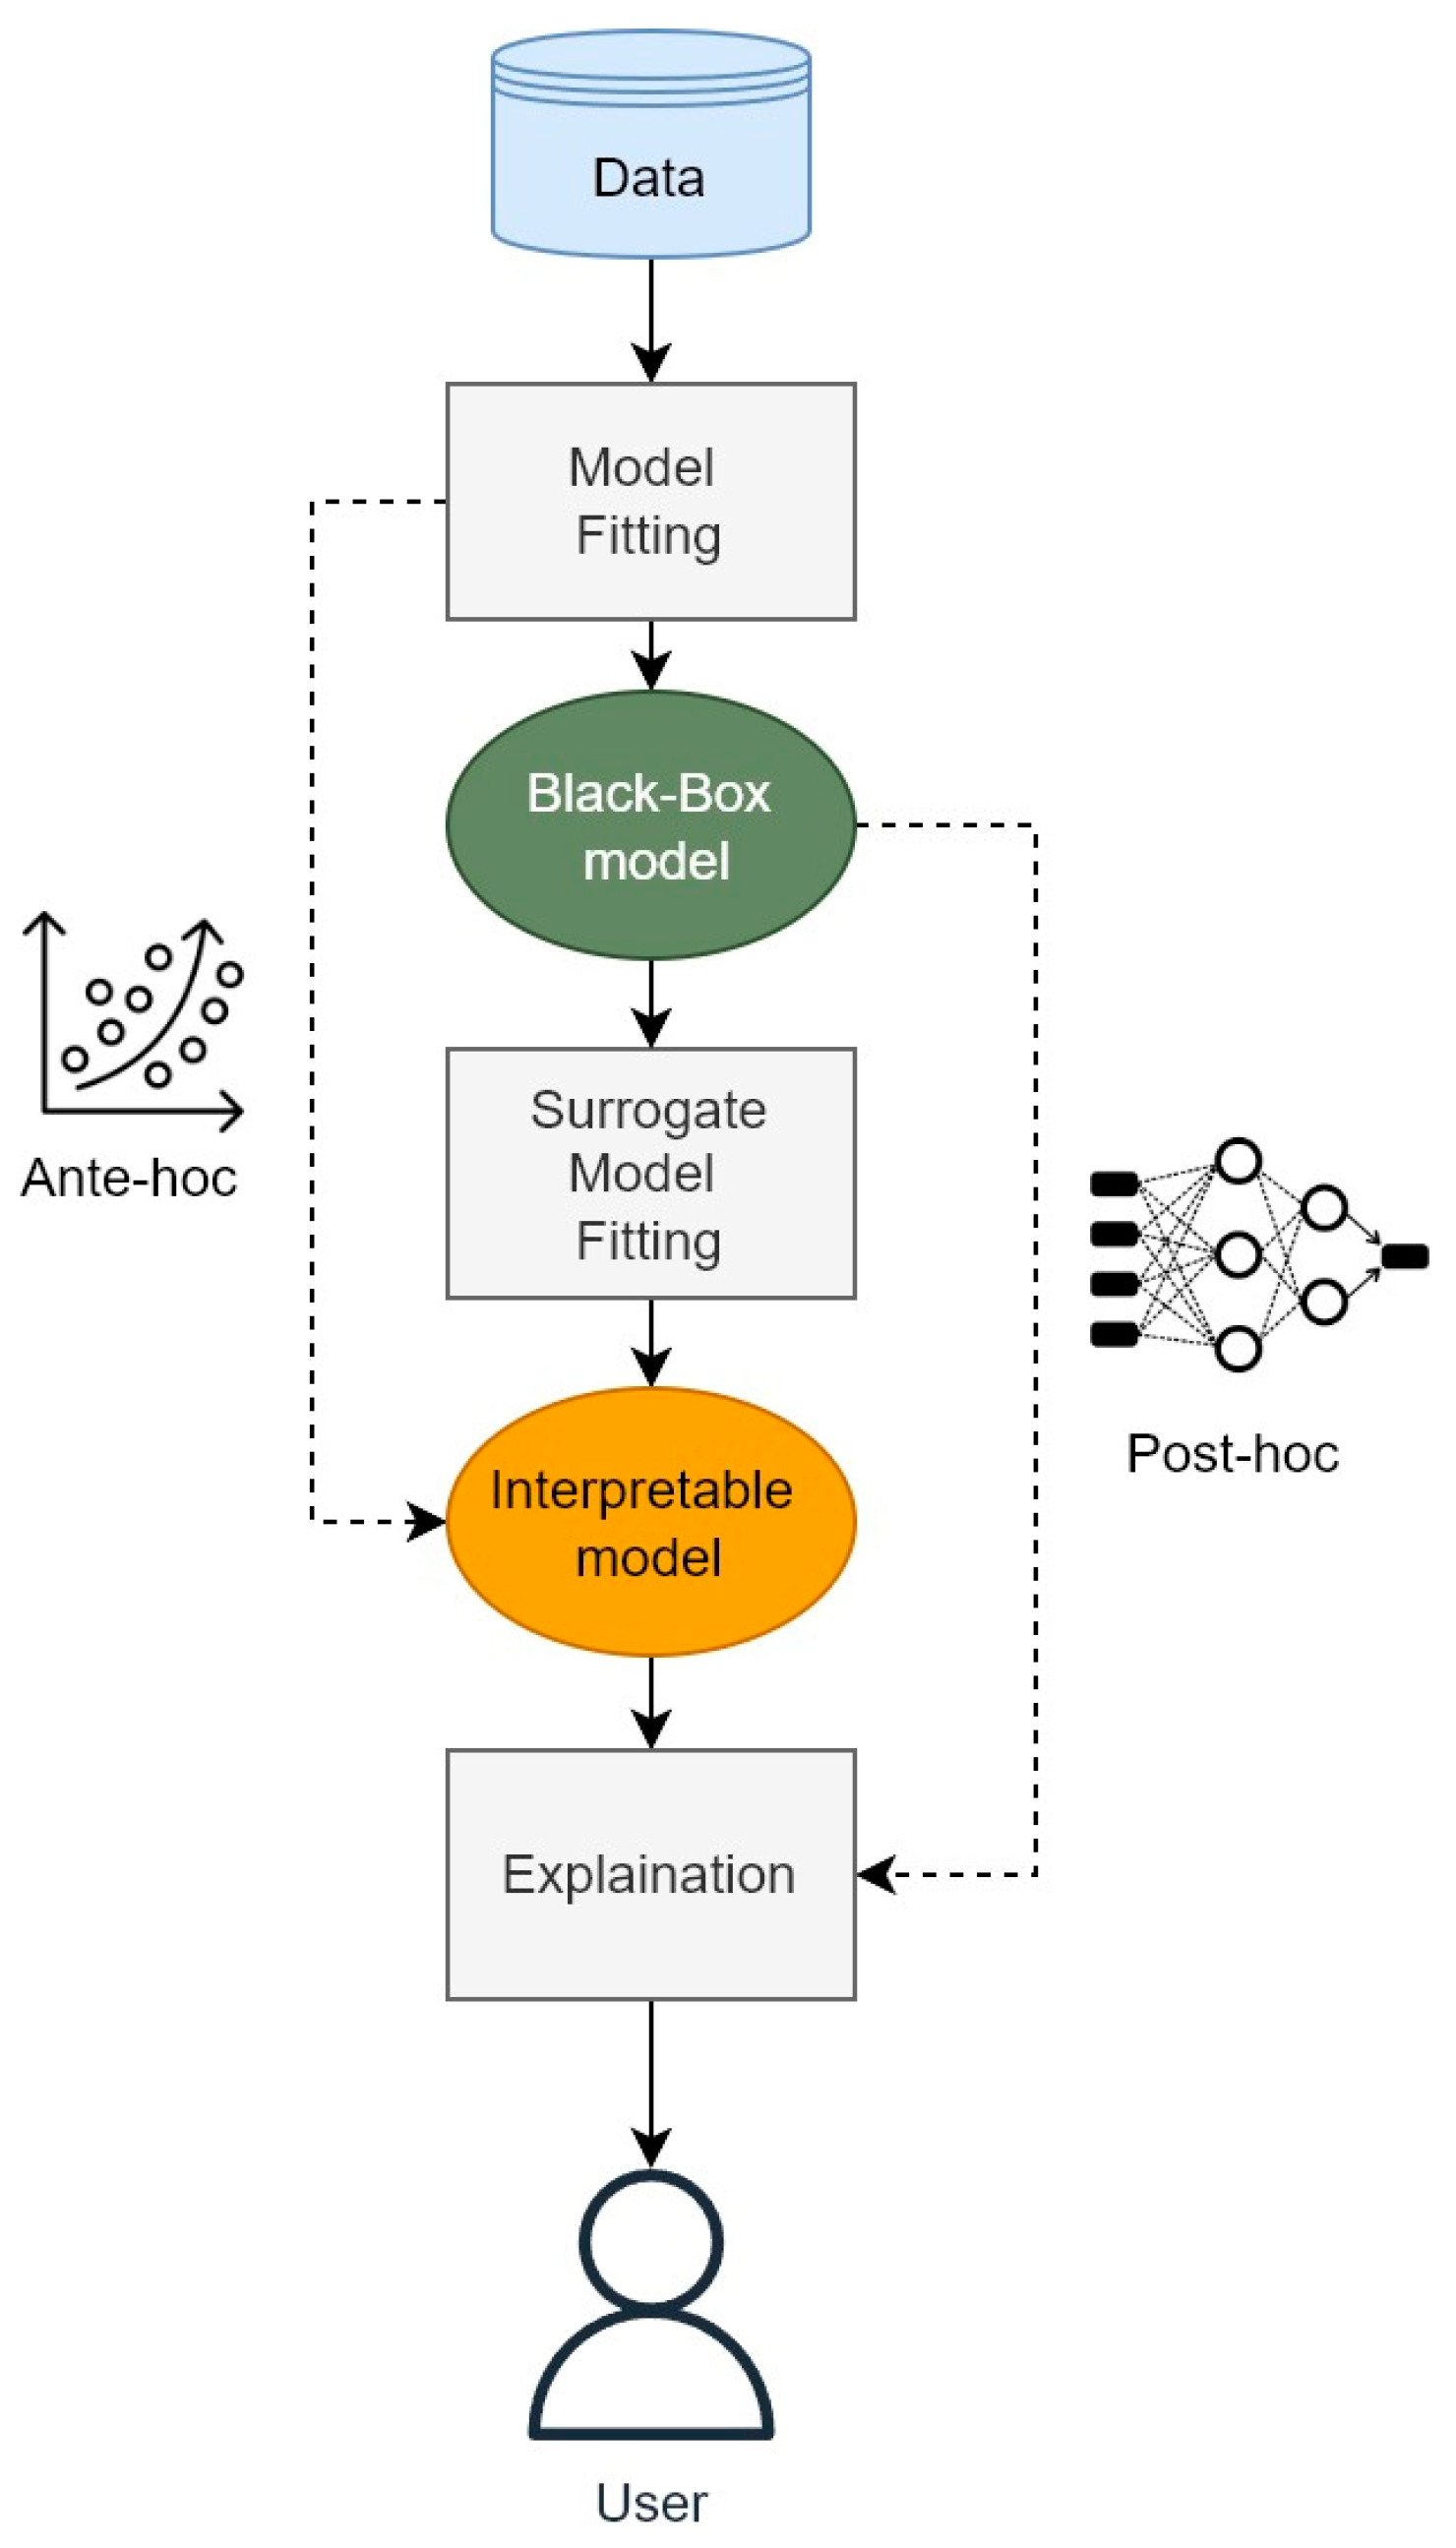
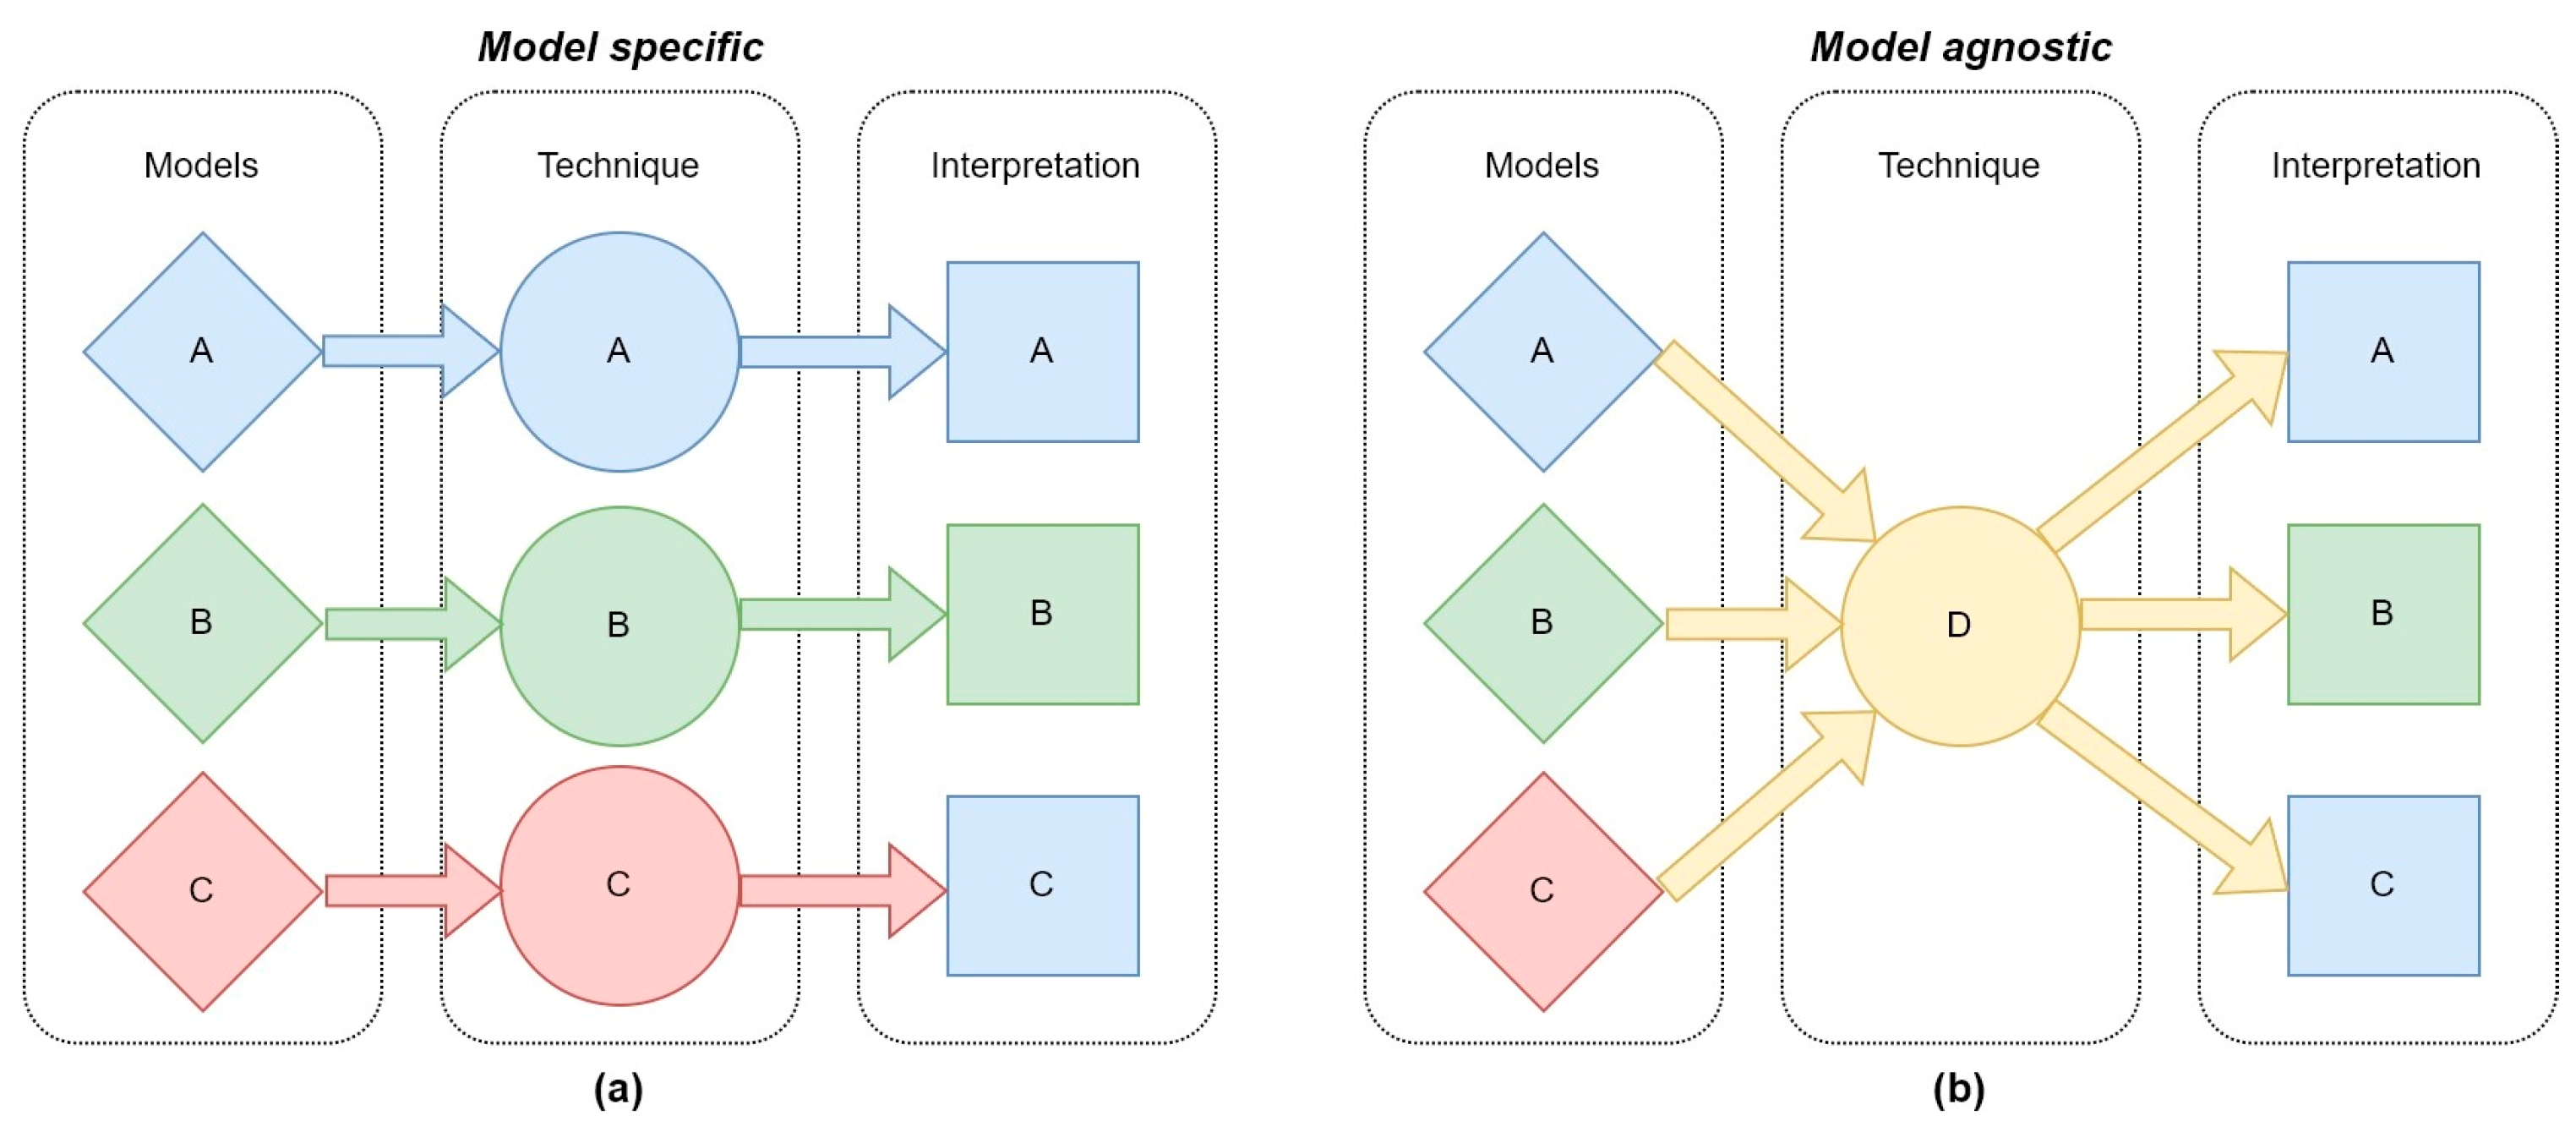
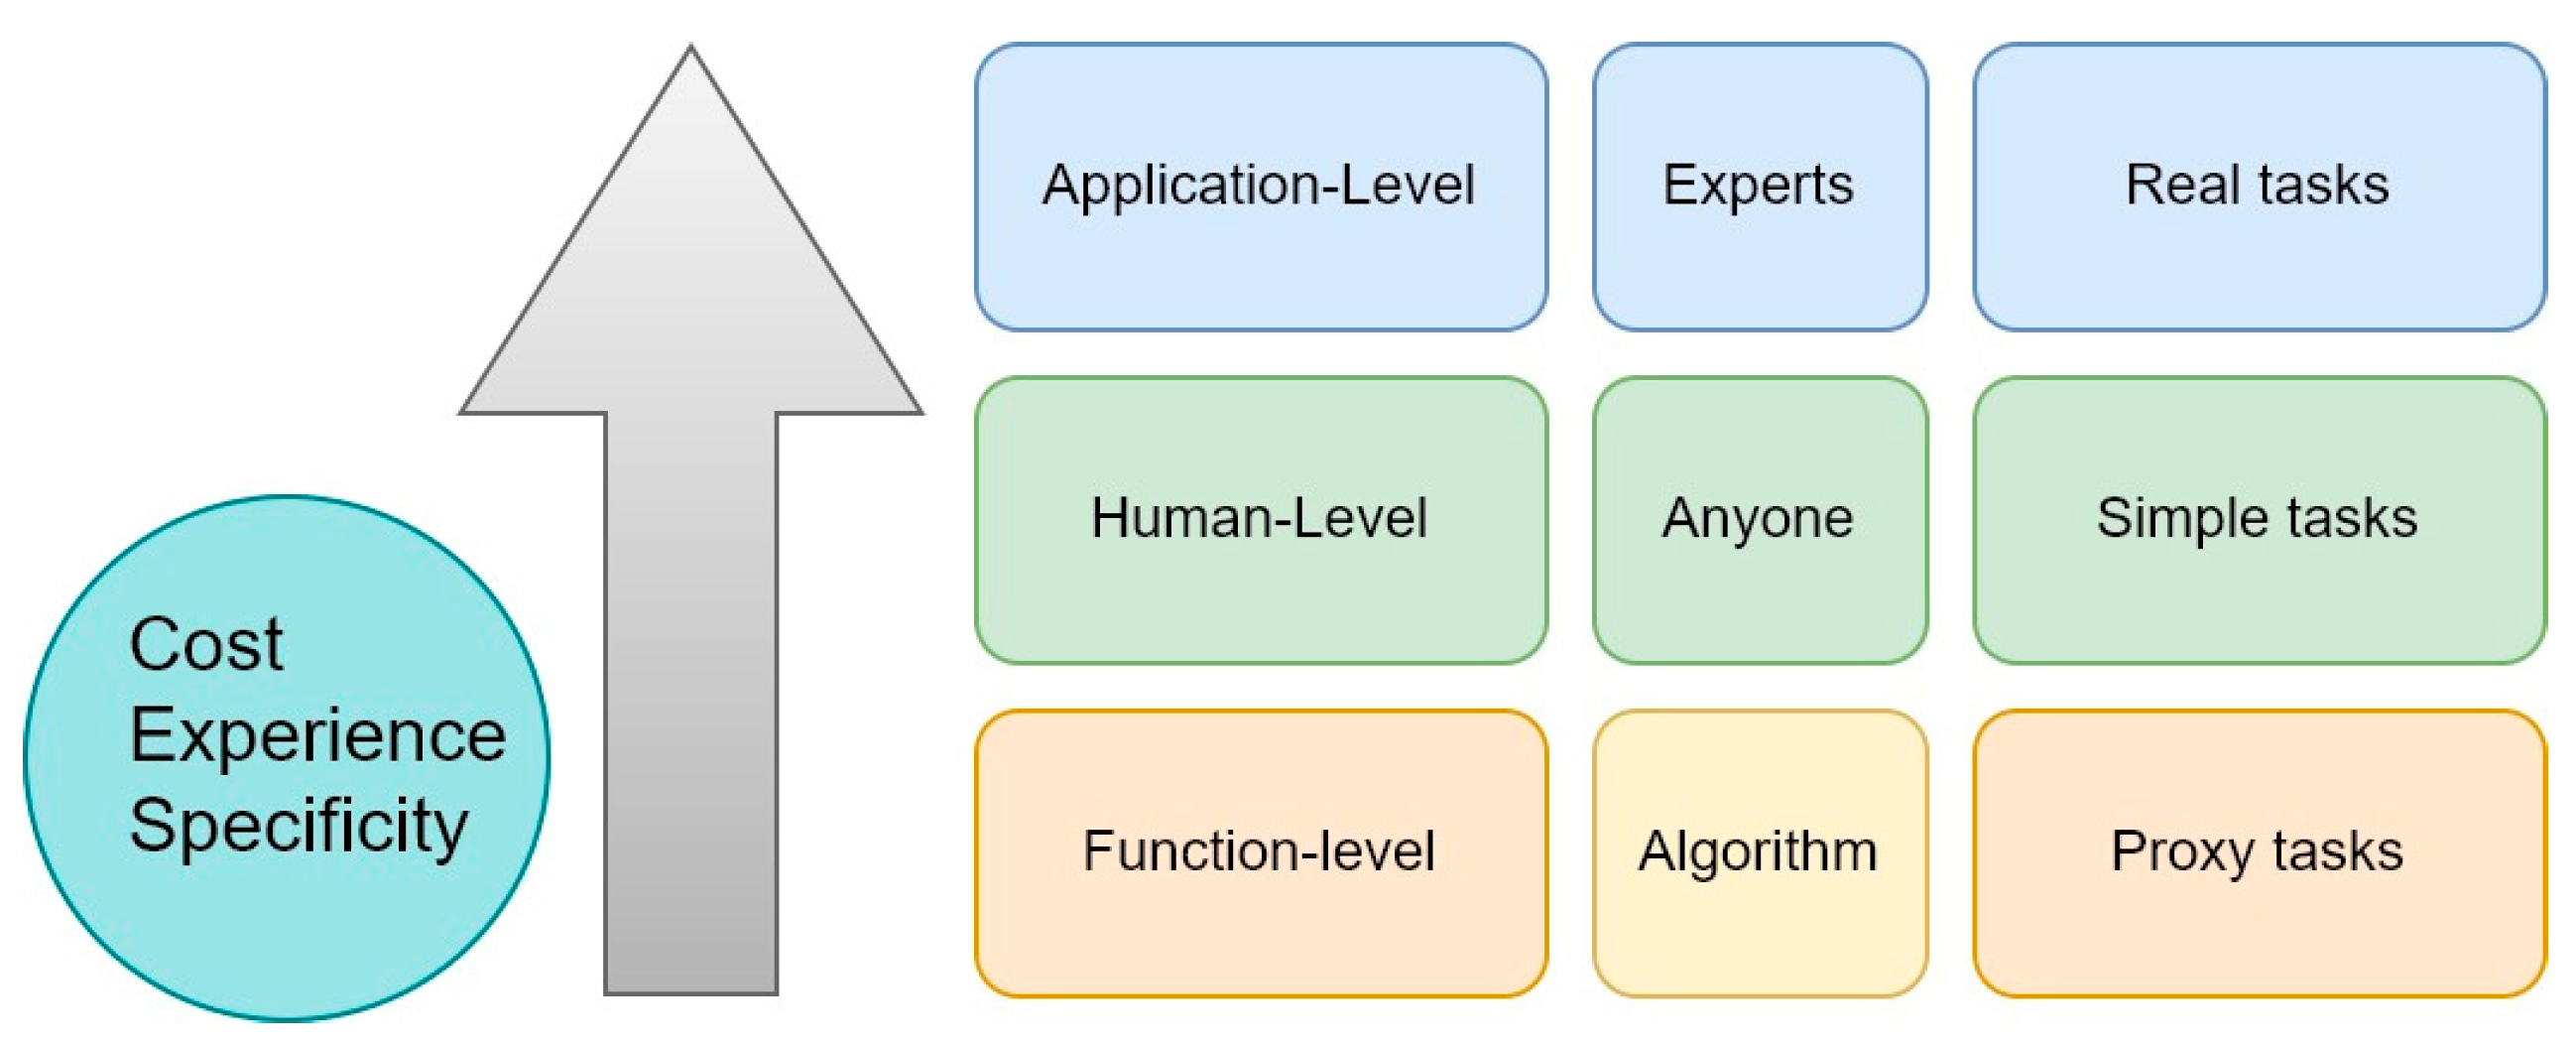

Disclaimer/Publisher’s Note: The statements, opinions and data contained in all publications are solely those of the individual author(s) and contributor(s) and not of MDPI and/or the editor(s). MDPI and/or the editor(s) disclaim responsibility for any injury to people or property resulting from any ideas, methods, instructions or products referred to in the content. |
© 2024 by the authors. Licensee MDPI, Basel, Switzerland. This article is an open access article distributed under the terms and conditions of the Creative Commons Attribution (CC BY) license (https://creativecommons.org/licenses/by/4.0/).