Article

Effect of Machine Learning Algorithms on Prediction of In-Cylinder Combustion Pressure of Ammonia–Oxygen in a Constant-Volume Combustion Chamber †

1
Graduate School of Science and Technology, Sophia University, Tokyo 102-8554, Japan
2
Department of Engineering and Applied Sciences, Sophia University, Tokyo 102-8554, Japan
*
Author to whom correspondence should be addressed.
This paper is an extended version of our paper published in Prediction of Heat Energy Release Rate for Ammonia Combustion in a Constant Volume Combustion Chamber: A Machine Learning Approach, 2023 15th International Conference on Electronics, Computers and Artificial Intelligence (ECAI), Bucharest, Romania, 29–30 June 2023, pp. 1–4.
Energies 2024, 17(3), 746; https://doi.org/10.3390/en17030746
Submission received: 1 December 2023 / Revised: 31 January 2024 / Accepted: 2 February 2024 / Published: 5 February 2024
(This article belongs to the Section C: Energy Economics and Policy)

Abstract

:
Road vehicles, particularly cars, are one of the primary sources of CO2 emissions in the transport sector. Shifting to unconventional energy sources such as solar and wind power may reduce their carbon footprints considerably. Consequently, using ammonia as a fuel due to its potential benefits, such as its high energy density, being a carbon-free fuel, and its versatility during storage and transportation, has now grabbed the attention of researchers. However, its slow combustion speed, larger combustion chamber requirements, ignition difficulties, and limited combustion stability are still major challenges. Therefore, authors tried to analyze the combustion pressure of ammonia in a constant-volume combustion chamber across different equivalence ratios by adopting a machine learning approach. While conducting the analysis, the experimental values were assessed and subsequently utilized to predict the induced combustion pressure in a constant-volume combustion chamber across various equivalence ratios. In this research, a two-step prediction process was employed. In the initial step, the Random Forest algorithm was applied to assess the combustion pressure. Subsequently, in the second step, artificial neural network machine learning algorithms were employed to pinpoint the most effective algorithm with a lower root-mean-square error and R2. Finally, Linear Regression illustrated the lowest error in both steps with a value of 1.0, followed by Random Forest.

1. Introduction

Passenger cars are the largest contributors of CO2 emissions within the transportation sector, emitting 49.6% of the total, with freight vehicles accounting for 36.6% of the emissions in Japan. Consequently, reducing CO2 emissions in the automotive industry is crucial, emphasizing the urgent need for improvements in the fuel efficiency of internal combustion engines [1]. Furthermore, technologies such as Homogeneous Charge-Compression Ignition (HCCI) engines have the potential to concurrently decrease NOx emissions and fuel consumption. Buruiana et al. [2] illustrates the advantages of the HCCI engine by contrasting the emissions and fuel consumption of a single-cylinder engine in its conventional operation with spark ignition, against those observed when the engine operates in HCCI mode. Among conventional engine technologies, there is a notable acceleration in research within the realms of fuel cell vehicles and electric vehicle technology. However, electric vehicles cannot essentially solve the problem of global warming [3]. This is because coal remains the dominant contributor to energy generation globally. Coal accounts for over 50% of the electricity mix in countries like Indonesia, primarily generated from coal power plants. According to the investigation by the Agency for Natural Resources and Energy of Japan, for the whole year of 2020, thermal power generation accounted for 82.6% of the total power generation [4]. In order to achieve zero carbon emissions in the true sense, hydrogen is a good alternative energy source. Although hydrogen-fueled engine vehicles and fuel cell vehicles have been successfully developed, the transportation and storage costs of hydrogen and hydrogen embrittlement still limit the popularization of hydrogen-fueled vehicles. These factors render ammonia an appealing alternative, addressing certain challenges related to hydrogen utilization [5]. However, the combustion process of ammonia also has a few drawbacks; for example, flame propagation in internal combustion engines (ICEs) require rapid fuel combustion speeds, with their performance directly tied to the expansion of the flame front.
Due to the time and cost involved in researching the fuel’s equivalence ratio, the authors have redirected their attention toward the application of artificial intelligence. Artificial intelligence has already demonstrated its potential across various fields like pharmaceuticals, engineering, and biotechnology. In the case of biotechnology, Obreja et al. [6] implemented neural networks to identify and predict areas at risk for biodiversity decline, such as the reduction in water loss to the point of disappearance and imbalances resulting from the unchecked growth of reeds. In the case of heat transfer, Zou et al. [7] used a neural regression model for predicting the thermal conductivity of carbon nanotubes nanofluids with multiple base fluids. In the investigations, they assessed thermal conductivity using nine commonly employed machine learning methods and advocated for the neural regression model due to its superior accuracy. Subsequent investigations involving diesel engines of varying sizes have demonstrated the predictive utility of artificial neural networks (ANNs), particularly in forecasting NOx emissions. Fang et al. [8] examine the utilization and improvement of ANN techniques in predicting NOx emissions from a high-speed direct-injection diesel engine across a broad spectrum of operating conditions. Similarly, Mauro et al. [9] explored the capacity of neural networks to precisely depict the Indicated Mean Effective Pressure (IMEP) and its coefficient of variation (COV of IMEP) in a spark-ignited ICE. They utilized a substantial portion of the experimental dataset to formulate the model, establishing a robust correlation between the modeled COV and the experimental data, which exhibited a systematic tendency to overpredict the COV for low values, while it underpredicted higher COVs. This systematic behavior is likely attributed to the absence of certain physical parameters in the input data for the neural network. In addition, Hlaing et al. [10] carried out two primary studies on a heavy-duty engine operating under lean conditions at mid to low loads. In the initial study, the total fuel energy supplied to the engine remained constant while the intake pressure was altered, thereby changing the overall excess air ratio. In the second study, the intake pressure was held constant, but the fuel quantity was adjusted to modify the overall excess air ratio. Within each excess air ratio setting, the fuel injection into the pre-chamber was systematically varied to evaluate the impact of pre-chamber enrichment on the engine’s operational characteristics. In addition, Jafarzadeh et al. [11] constructed an efficient ANN structure for forecasting hydrogen production rates. To achieve this, the impact of various factors, including reaction temperature, NaBH4 concentration, and catalyst loading, was examined to identify the optimal operational parameters for maximizing hydrogen generation. Papaioannou et al. [12] employed a Random Forest algorithm to predict particle number emissions from a highly boosted Gasoline Direct Injection (GDI) engine, achieving boost levels of up to 32 bars of Brake Mean Effective Pressure (BMEP). The model accurately predicted particle size, concentration, and the geometric standard deviation (GSD) in the accumulation mode. The results were comprehensively analyzed, and a detailed examination of parameter importance was conducted. The Random Forest algorithm served as an estimator, and engine parameters were ranked using a permutation feature importance technique with root-mean-square error (RMSE) as the performance metric. Out of 82 model parameters, only 17 were identified as crucial for predicting PN emission parameters. Furthermore, the permutation importance algorithm indicated that reducing the parameters to nine enhances the model accuracy by mitigating model variance.
The goal of this study was to diminish CO2 and other emissions from ICEs. In order to achieve this, the authors tried to determine the best equivalence ratio for ammonia combustion [13]. Therefore, various machine learning algorithms were investigated for those equivalence ratios which were skipped during the previous experiments. During the analysis, algorithms such as Random Forest and the artificial neural network were used and analyzed. However, based on the RMSE and R2 values, the Linear Regression (LR) model emerged as the top performer among the machine learning models, including the artificial neural network (ANN) algorithm which illustrated a poor fit.

2. Methodology

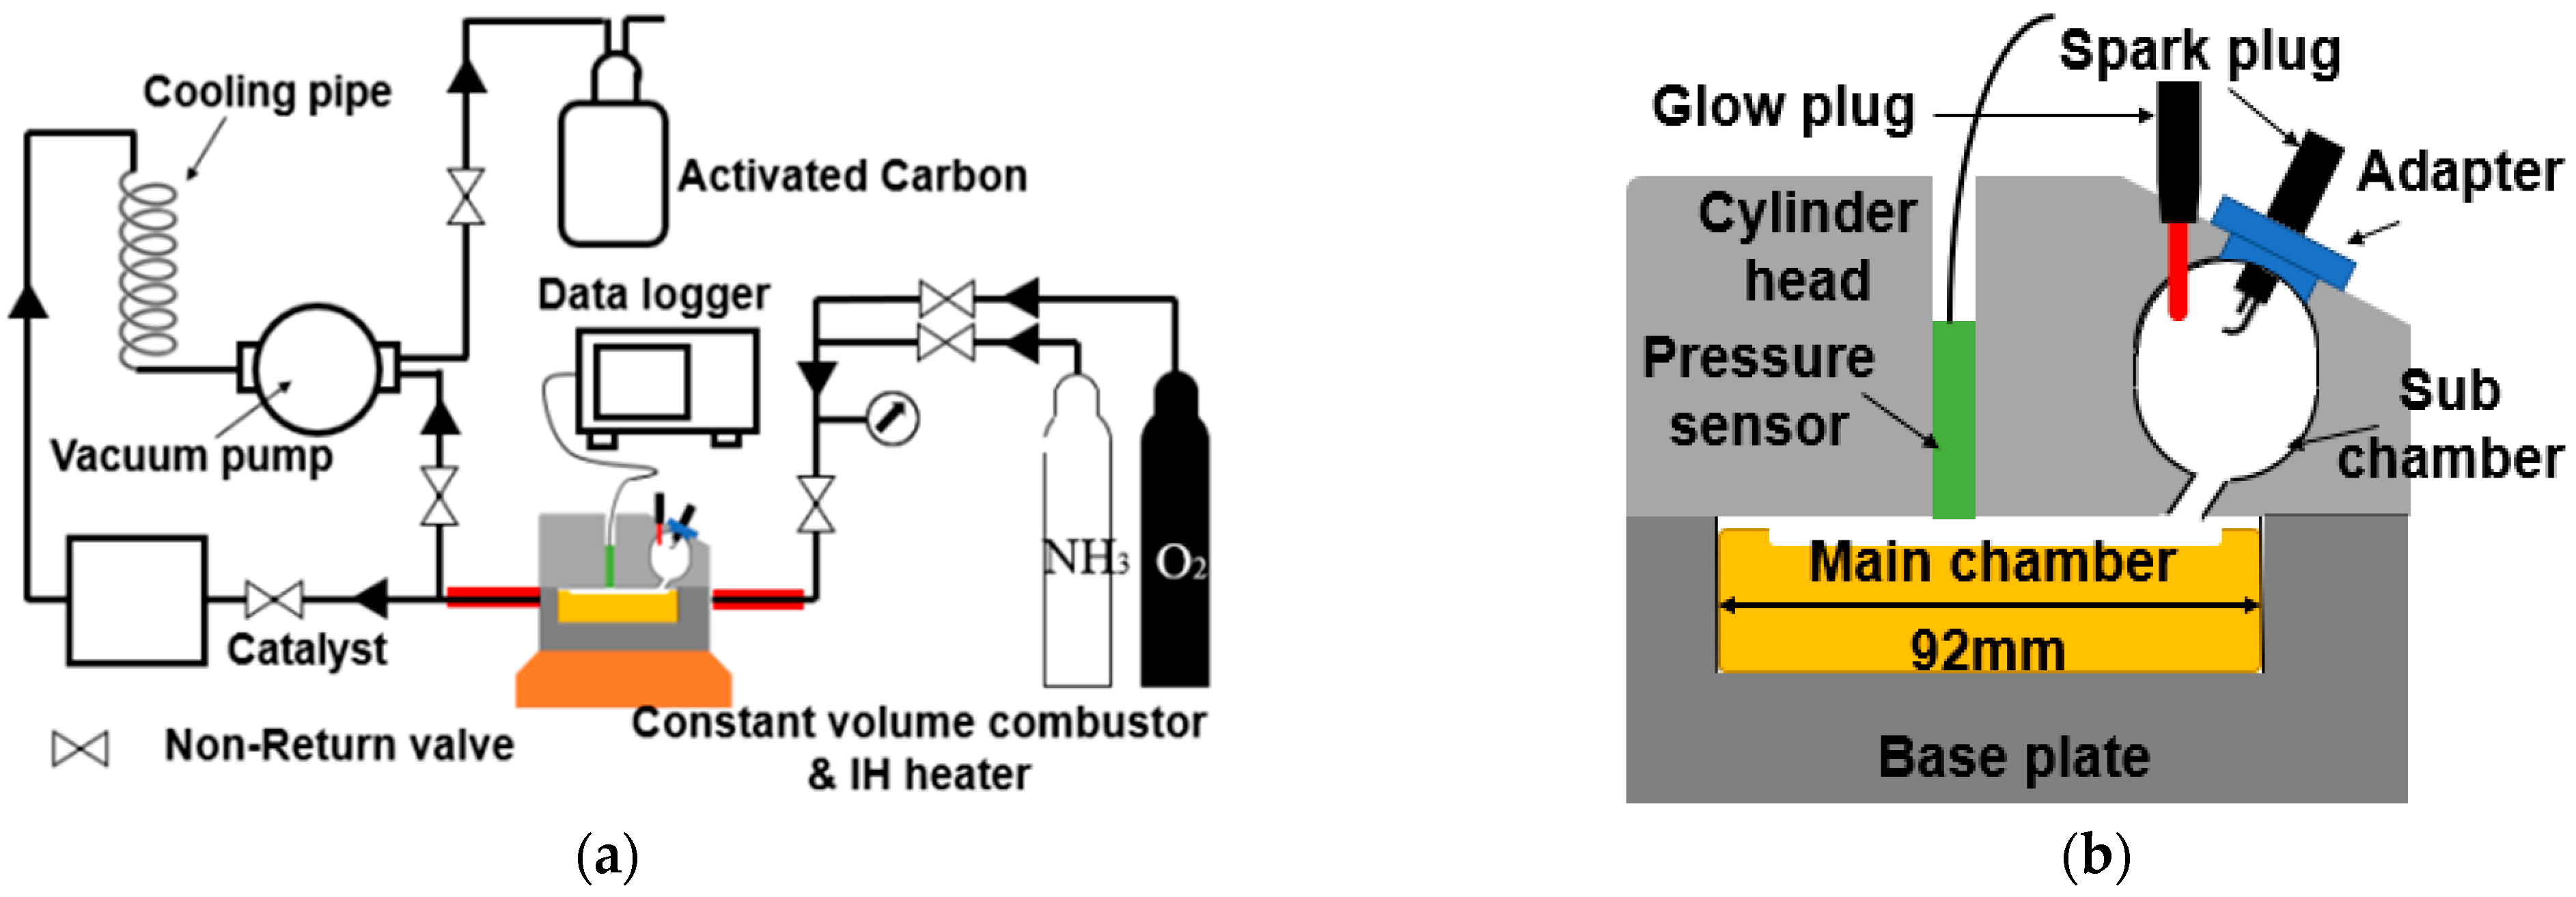
2.1. Experimental Bench Test

The diagram illustrating the experimental setup is shown in Figure 1a [13]. An ammonia cylinder and an oxygen cylinder were connected to an isochoric chamber. A pressure gauge (GC04, Nagano Keiki Co., Ltd., Tokyo, Japan) was installed on the connecting pipe between the cylinders and the combustor to measure the induced pressure inside the constant volume. These measurements were transmitted to a data logger (DS1202Z, RIGOL Technologies, Suzhou, China) for recording and further analyses purposes. A catalyst was used for exhaust gas purification, where a cooling system was placed between the vacuum pump and the catalyst. Additionally, a pipe was used to connect the outlet side of the vacuum pump to the upstream side of the catalyst, allowing the circulation of exhaust gas to pass through the vacuum pump for effective refinement. The constant-volume burner used in the experiment is illustrated in Figure 1b [13], showing a cross-sectional schematic diagram. Within the engine head, a pre-combustion chamber originally designed for the diesel engine (TF120V-E, Yanmar Holdings Co., Ltd., Osaka, Japan) was modified for the experiment. The engine underwent modifications by replacing the injector with a spark plug (NGK-CR8E, Niterra Co., Ltd., Nagoya, Japan) connected to the engine head using a specific connector in the sub-cavity. The yellow component represents the lower surface of the main chamber, a simplified depiction based on a flat piston with a 92 mm diameter. The absolute volume was approximately 425 × 103 mm3, comprising a 235 × 103 mm3 sub-chamber and a 19 × 103 mm3 main chamber interconnected by a cylindrical channel with a cross-sectional area of 526 × 102 mm2. Initially, the pre-chamber was heated using a glow plug to enhance the combustion process, and oxygen was introduced into the pre-chamber through a pipeline. In the subsequent stage, a mixture of ammonia and oxygen was supplied to the constant-volume combustion chamber (CVCC) and ignited using a spark plug installed inside the pre-chamber. Finally, the exhaust gas passed through the oxidation catalyst, undergoing thorough decomposition before being released into the surrounding atmosphere.

2.1.1. Procedure

Initially, the pre-chamber was heated through the activation of a glow plug, functioning as a catalyst to enhance the combustion process. Oxygen was introduced via a pipeline to facilitate the expulsion of air or combustion-generated exhaust gases. Subsequently, a vacuum pump established an absolute pressure of 0.5 bar in the CVCC.
In the second phase, a blend of ammonia and oxygen was supplied to the CVCC and then ignited using a spark plug installed in the pre-chamber. The combustion pressure data were meticulously recorded. Finally, the exhaust gas passed through the oxidation catalyst, undergoing thorough decomposition before being discharged into the surrounding atmosphere.

2.1.2. Experimental Conditions

Table 1 below illustrates the experimental conditions. During the experiments, the equivalence ratio was adjusted between 0.1 and 1.4, while the partial pressures of ammonia and oxygen were modified in accordance with the overall reaction equation. During the experiments, the equivalence ratios of 0.1 and 0.2 were neglected as these cases were incombustible. Furthermore, the 1.2 equivalence ratio was also neglected as it led to unstable combustion. Pressure values in this investigation are denoted as absolute pressure.
Table 2 illustrates the equivalence ratio and the corresponding partial pressure values for ammonia and oxygen. The table includes conditions of incombustibility (0.1, 1.4) and a condition of unstable combustion (1.2). Prior to each set of experiments, oxygen was utilized to purge the exhaust gas from the experimental apparatus. Subsequently, vacuum operation was executed. It is important to note that the vacuum operation did not achieve an absolute pressure of 0 MPa; rather, it attained an absolute pressure of 0.05 MPa. Consequently, the summation of the partial pressures of ammonia and oxygen are given in Table 2, amounting to an absolute pressure of 0.15 MPa and contributing to the overall absolute pressure of 0.2 MPa.

2.1.3. Analysis Methods

During combustion, the pressure within the primary combustor was measured by using a pressure sensor affixed to the cylinder head. This recorded combustion pressure was subsequently employed to compute the heat release rate. In the context of a constant-volume combustor, the heat release rate denotes the quantity of heat generated per unit time through combustion. As the combustion took place within the CVCC, the gas volume remained unaltered throughout the process. As a result, the heat release rate can be mathematically expressed by the following equation:
d Q d t = 1 k 1 . V d P d t
where dQ/dt is the heat release rate [J/s], P is the combustion pressure [MPa], V is the combustor volume [m3], t is time [s], and k is the specific heat ratio [-].

2.2. Machine Learning Prediction Model

The objective of this research was to forecast the in-cylinder pressure for equivalence ratios that were not considered in the real experiments. Therefore, machine learning techniques were implemented to save time and experimental cost. Figure 2 shows the overall architecture of the machine learning process initiating with data collection and concluding the prediction. The various steps include the input of the experimental dataset, split into testing and training. After implementing various algorithms, a model was created and then the error was evaluated based on the RMSE and R2. Finally, further details are provided in the following sections.

2.2.1. Prediction Conditions

It was found from the experimental results that an equivalence ratio between 0.2 and 1.0 played a crucial role in combustion. Thus, the authors chose to predict the equivalence ratios which were missing in the experimental studies, ranging from 0.2 to 1.0. Table 3 illustrates the equivalence boundary conditions on which the combustion pressure was predicted.

2.2.2. Error Analysis

The motive of the studies was to predict the in-cylinder pressure at missing equivalence ratios that were skipped during the experiments. These predicted values were not compared with the experimental values at the same equivalence ratio, as the experiments were not carried out. However, before predicting the pressure at various equivalence ratios, the predicted heat release rate which was induced from combustion pressure was compared to experimental values at an equivalence ratio of 0.4. Figure 3 illustrates the error between the experimental and predicted heat release rate at an equivalence ratio of 0.4. Furthermore, in the figure, the red line represents the function line of y = x. When the predicted values align closely with the red line, it suggests that the error in the predicted value is minimal. Thus, the error between the experimental and predicted value at the same equivalence ratio was very low; thus, it can be neglected and further prediction of the hidden equivalence ratio can be carried out.

2.2.3. Algorithms Applied

Firstly, the combustion pressure was predicted at various equivalence ratios as illustrated in Table 3 above. During the prediction, the Random Forest algorithm was utilized for the combustion pressure evaluation. Consequently, a total of four distinct algorithms—Random Forest, Gradient Boosting, Support Vector Machine, and Linear Regression—were utilized and compared against each other, which are explained in the following section.

Support Vector Regression

Support Vector Regression (SVR) [14] is a supervised machine learning algorithm used for regression tasks designed to predict continuous outcomes rather than discrete categories. The main objective of SVR is to find a regression function that best fits the given data while minimizing the prediction errors. It is particularly effective in situations where the relationship between variables is non-linear. In SVR, the training data points with the most significant influence on the regression model are known as support vectors. These are the data points that are located closer to the calculated hyperplane. The SVR algorithm seeks to find a hyperplane that best fits the data while maintaining a margin of tolerance. The margin represents a range within which errors are allowed, and points outside this margin contribute to the loss function. SVR is used in various fields, including finance, economics, and engineering, where predicting continuous outcomes is essential. It is especially valuable when dealing with datasets with complex and non-linear patterns.

Random Forest

Random Forest [15] is an ensemble learning algorithm widely used in both classification and regression tasks. It is a versatile and powerful machine learning technique that builds multiple decision trees and merges their outputs to improve overall predictive accuracy and generalization. Random Forest belongs to the ensemble learning category, which involves combining the predictions of multiple models to enhance overall performance. In the case of Random Forest, the individual models are decision trees. The basic building blocks of a Random Forest are decision trees. Each tree is constructed based on a random subset of the training data and a random subset of features at each split. This randomness helps reduce overfitting and increases the diversity of the individual trees. Its application is unique in combustion [16].

Linear Regression

Linear Regression [17] is simple and easy to interpret, making it the go-to method for understanding the relationship between variables. This model assumes a linear combination of the input features to predict the output. Linear Regression employs the least-squares method to find the line that minimizes the sum of the squared differences between the predicted and actual values. This method aims to minimize the overall prediction error. While Linear Regression is a simple model, there are extensions such as polynomial regression and regularized regression (e.g., ridge regression, lasso regression) that can accommodate more complex relationships and prevent overfitting.

Gradient Boosting

Gradient Boosting [18] is a powerful machine learning technique that belongs to the ensemble learning family. It builds a predictive model in the form of an ensemble of weak learners, typically decision trees, and combines their predictions to create a strong, accurate model. Gradient Boosting constructs an ensemble of weak learners sequentially, with each learner addressing the errors of its predecessor. It builds trees iteratively, focusing on minimizing the residual errors. Gradient Boosting is versatile and applicable to various tasks, including regression and classification problems. Its flexibility allows it to handle both structured and unstructured data. In this research, a total of six columns representing time and combustion pressure were generated, comprising a total dataset of 998 entries. During the pre-processing phase, no missing or duplicate values were identified. To derive the regression equation from the analysis of experimental data, the authors initially employed Random Forest due to the non-linear relationship observed between the input features and the target variable. In the subsequent step, the authors fitted the Random Forest model to the training data and utilized it to make predictions on the testing data. The GridSearchCV class from the Sk-learn machine learning module in Google Colab was utilized for this purpose. The dataset consisted of a total of 998 samples obtained from physical experiments. These samples were divided into a training set of 798 (about 80%) and a testing set of 200 (about 20%).

3. Result and Discussion

In this section, the experimental results obtained from the CVCC are illustrated and discussed. Furthermore, as described in Table 3, at various equivalence ratios, the predicted results of the induced combustion pressure of ammonia are presented. Both the experimental and predicted results were evaluated at 298 K and at a pressure of 0.1 MPa. In order to predict the values at various equivalence ratios of the ammonia and oxygen pressure, experimental values were utilized to prepare an algorithm and evaluate the values. The algorithm used during the analysis described the importance of the various algorithm models. During the analysis, the algorithm was designed into two steps. In step-I, experimental values were considered to create the model and predict the output (induced cylinder pressure) for the same time at equivalence ratios of 0.1, 0.3, 0.5, 0.7, and 0.9. In step-II, different ML algorithms were used to identify the best algorithm, i.e., with minimum errors. To train the model, predicted values as well as experimental values were considered to determine the RMSE. In the first case, the Random Forest algorithm was first implemented as the data were continuous, non-linear, and had multiple inputs at each equivalence ratio.

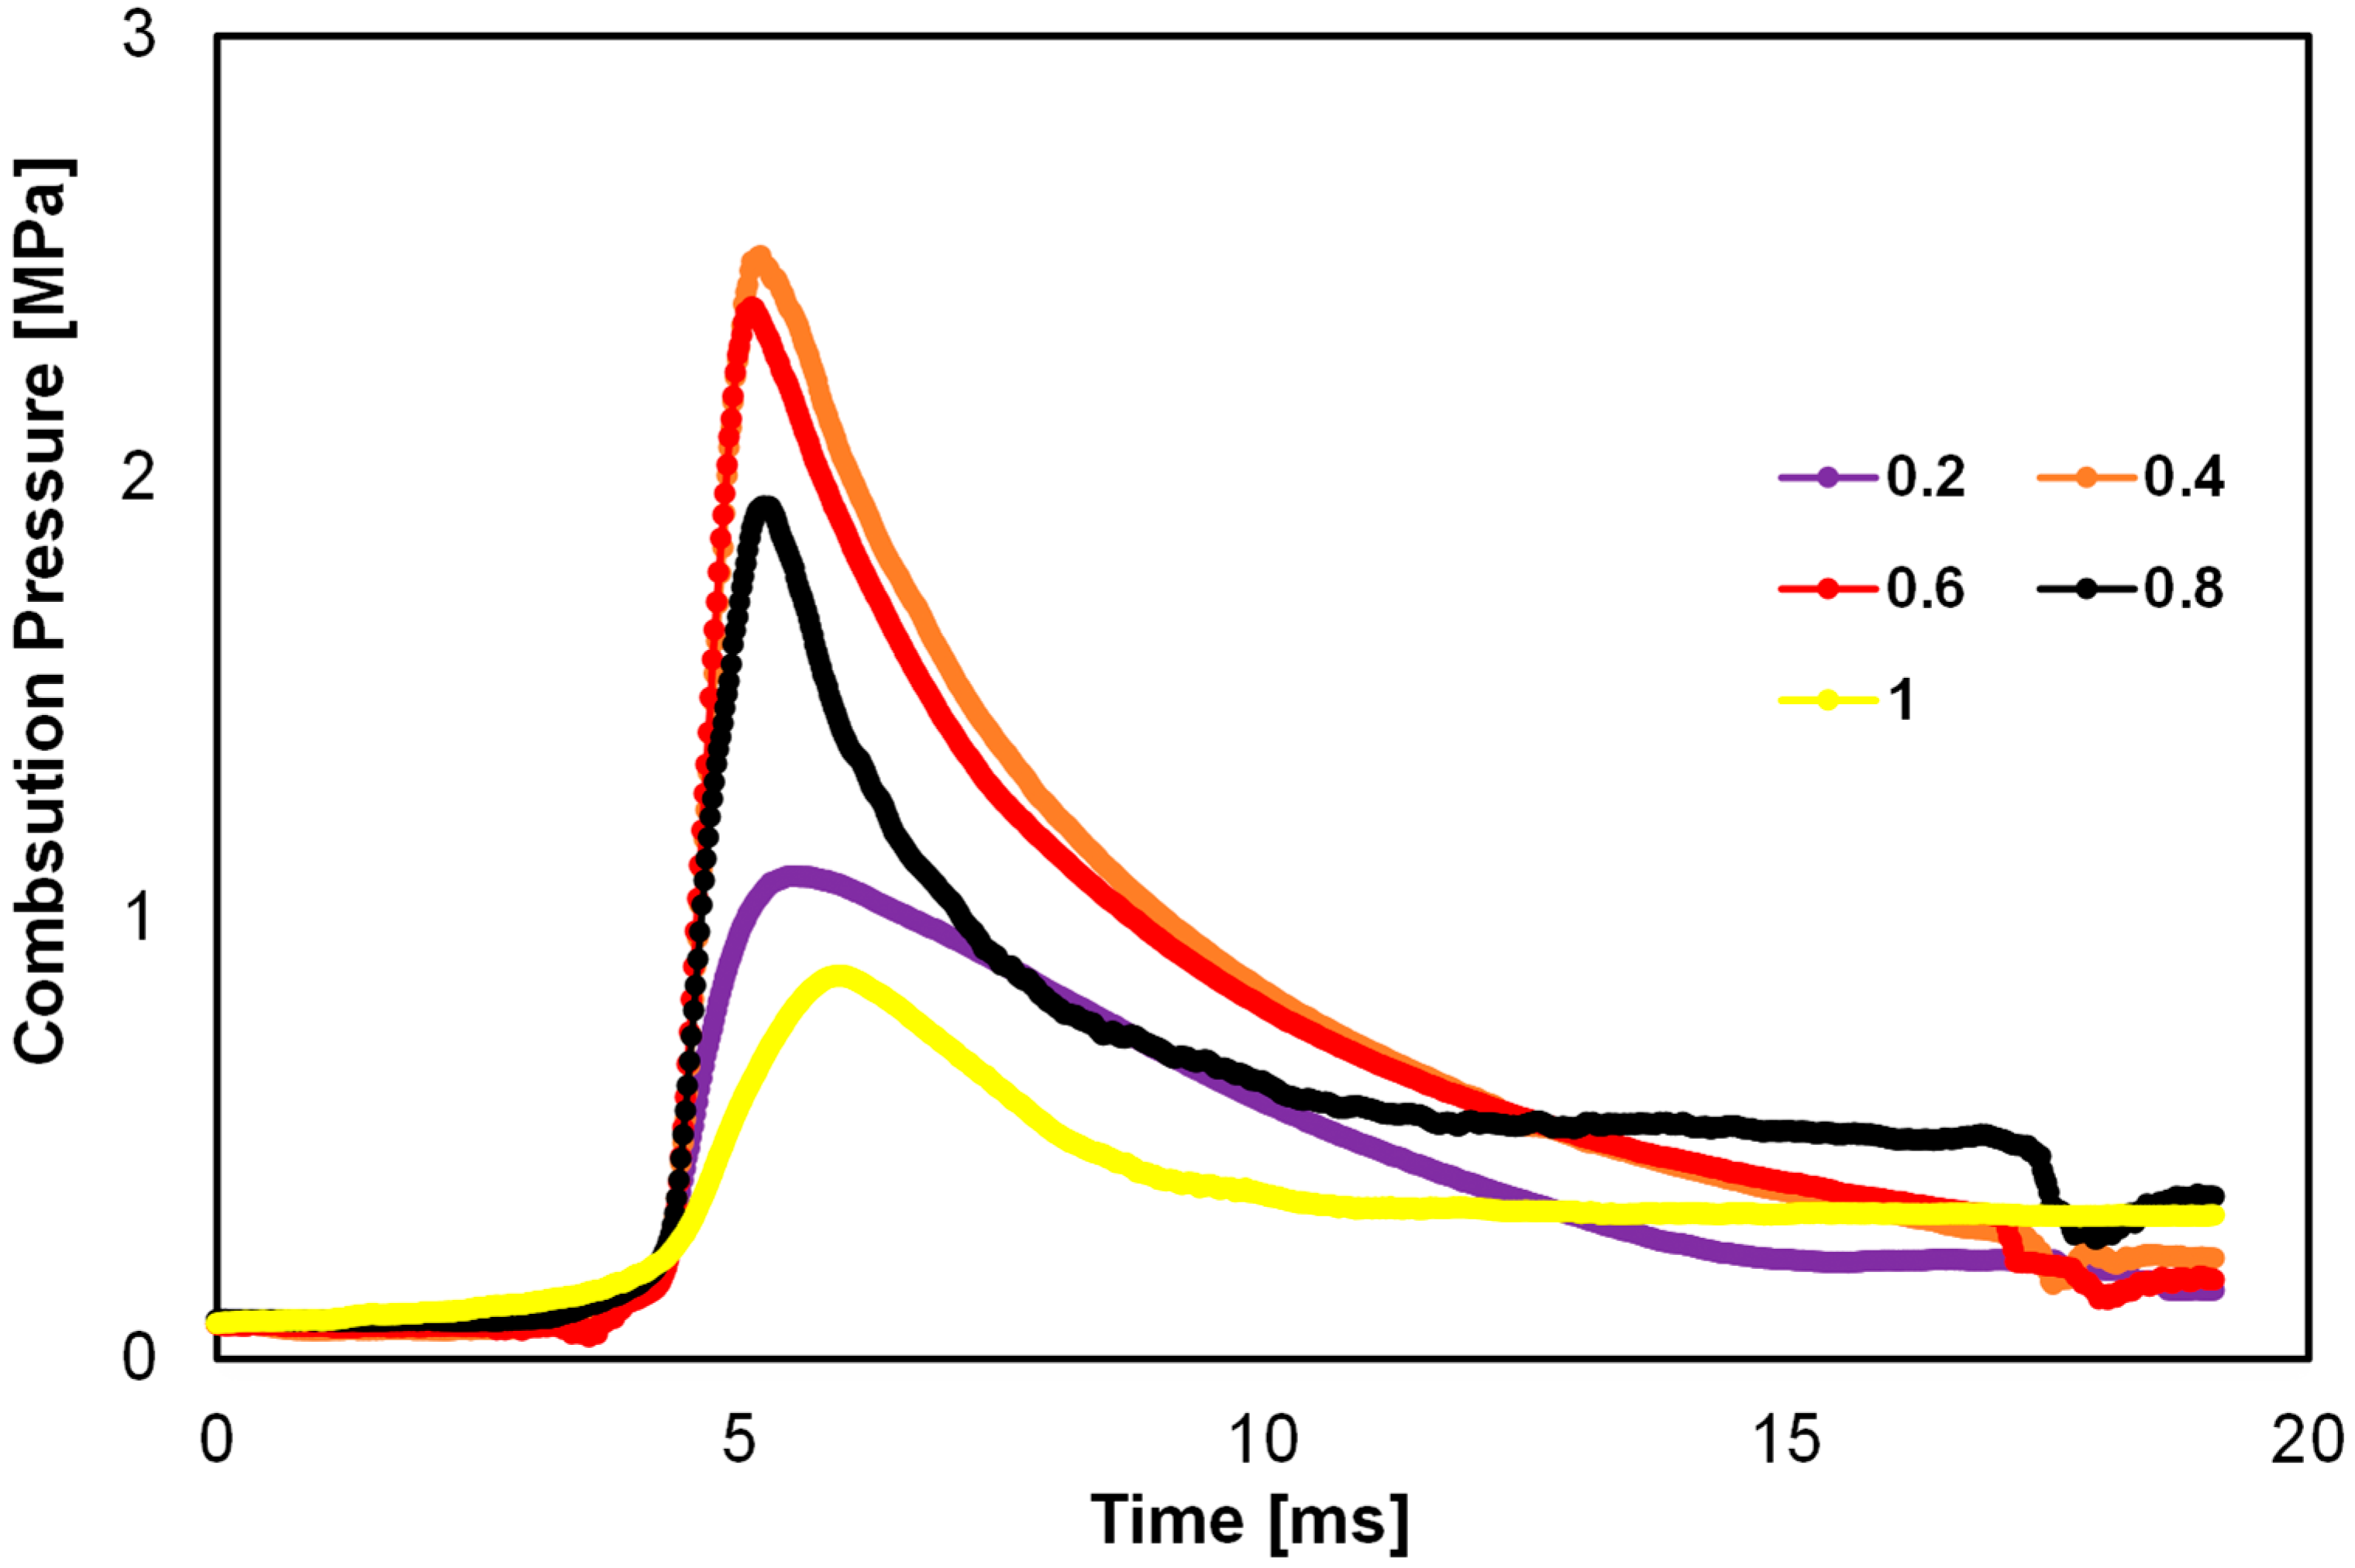
3.1. Experimental Results at Various Equivalence Ratios

The relationship of the in-cylinder combustion pressure of ammonia with respect to time at various equivalence ratios is represented in Figure 4 [13]. It is clear from the experiments that the combustion of ammonia was stable within the equivalence ratio range of 0.2 to 1.0. However, under an equivalence ratio of 1.2, combustion did not occur in some experiments, indicating instability. Conditions with equivalence ratios of 0.1 and 1.4 resulted in the mixture being unable to burn. Therefore, the results focus on equivalence ratios ranging from 0.2 to 1.0. Furthermore, the experiment revealed that ammonia could be burned at a relatively low lean condition; however, it was difficult to burn under rich conditions. The in-cylinder pressure varied for different equivalence ratio conditions, indicating differences in the combustion flame front. Figure 4 illustrates that at equivalence ratios of 0.2 and 1.0, the peak combustion pressure is lowest.

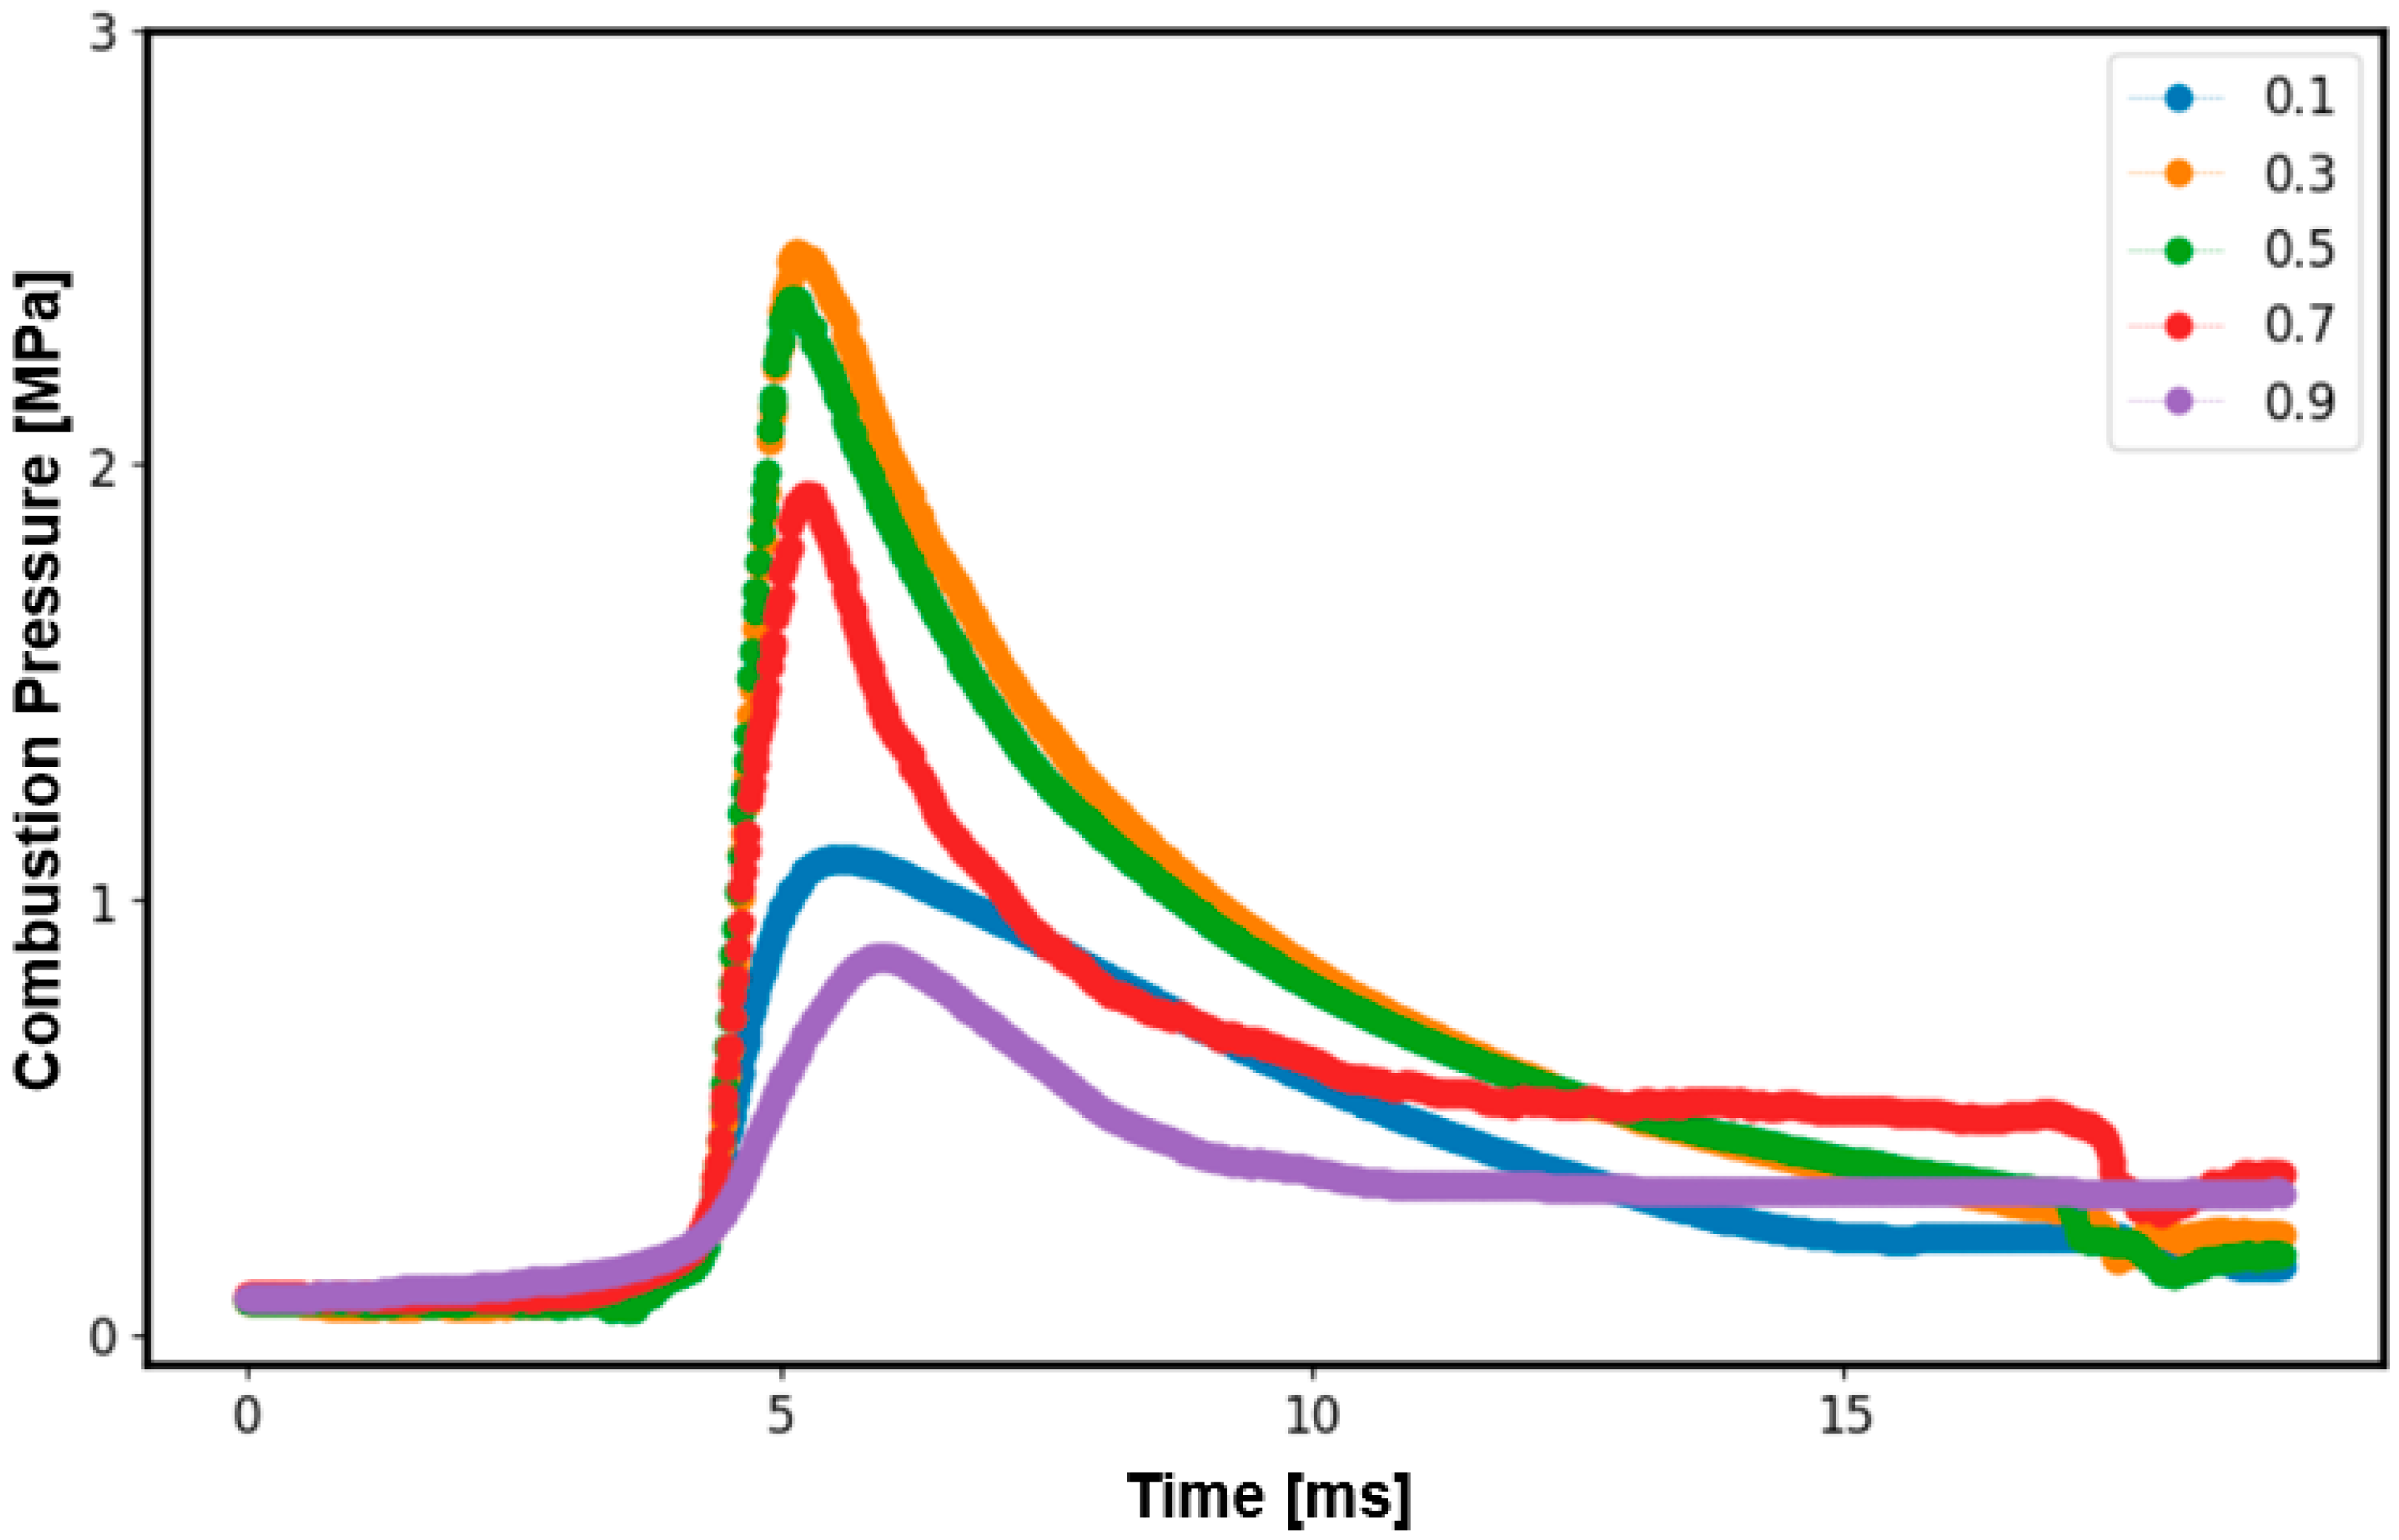
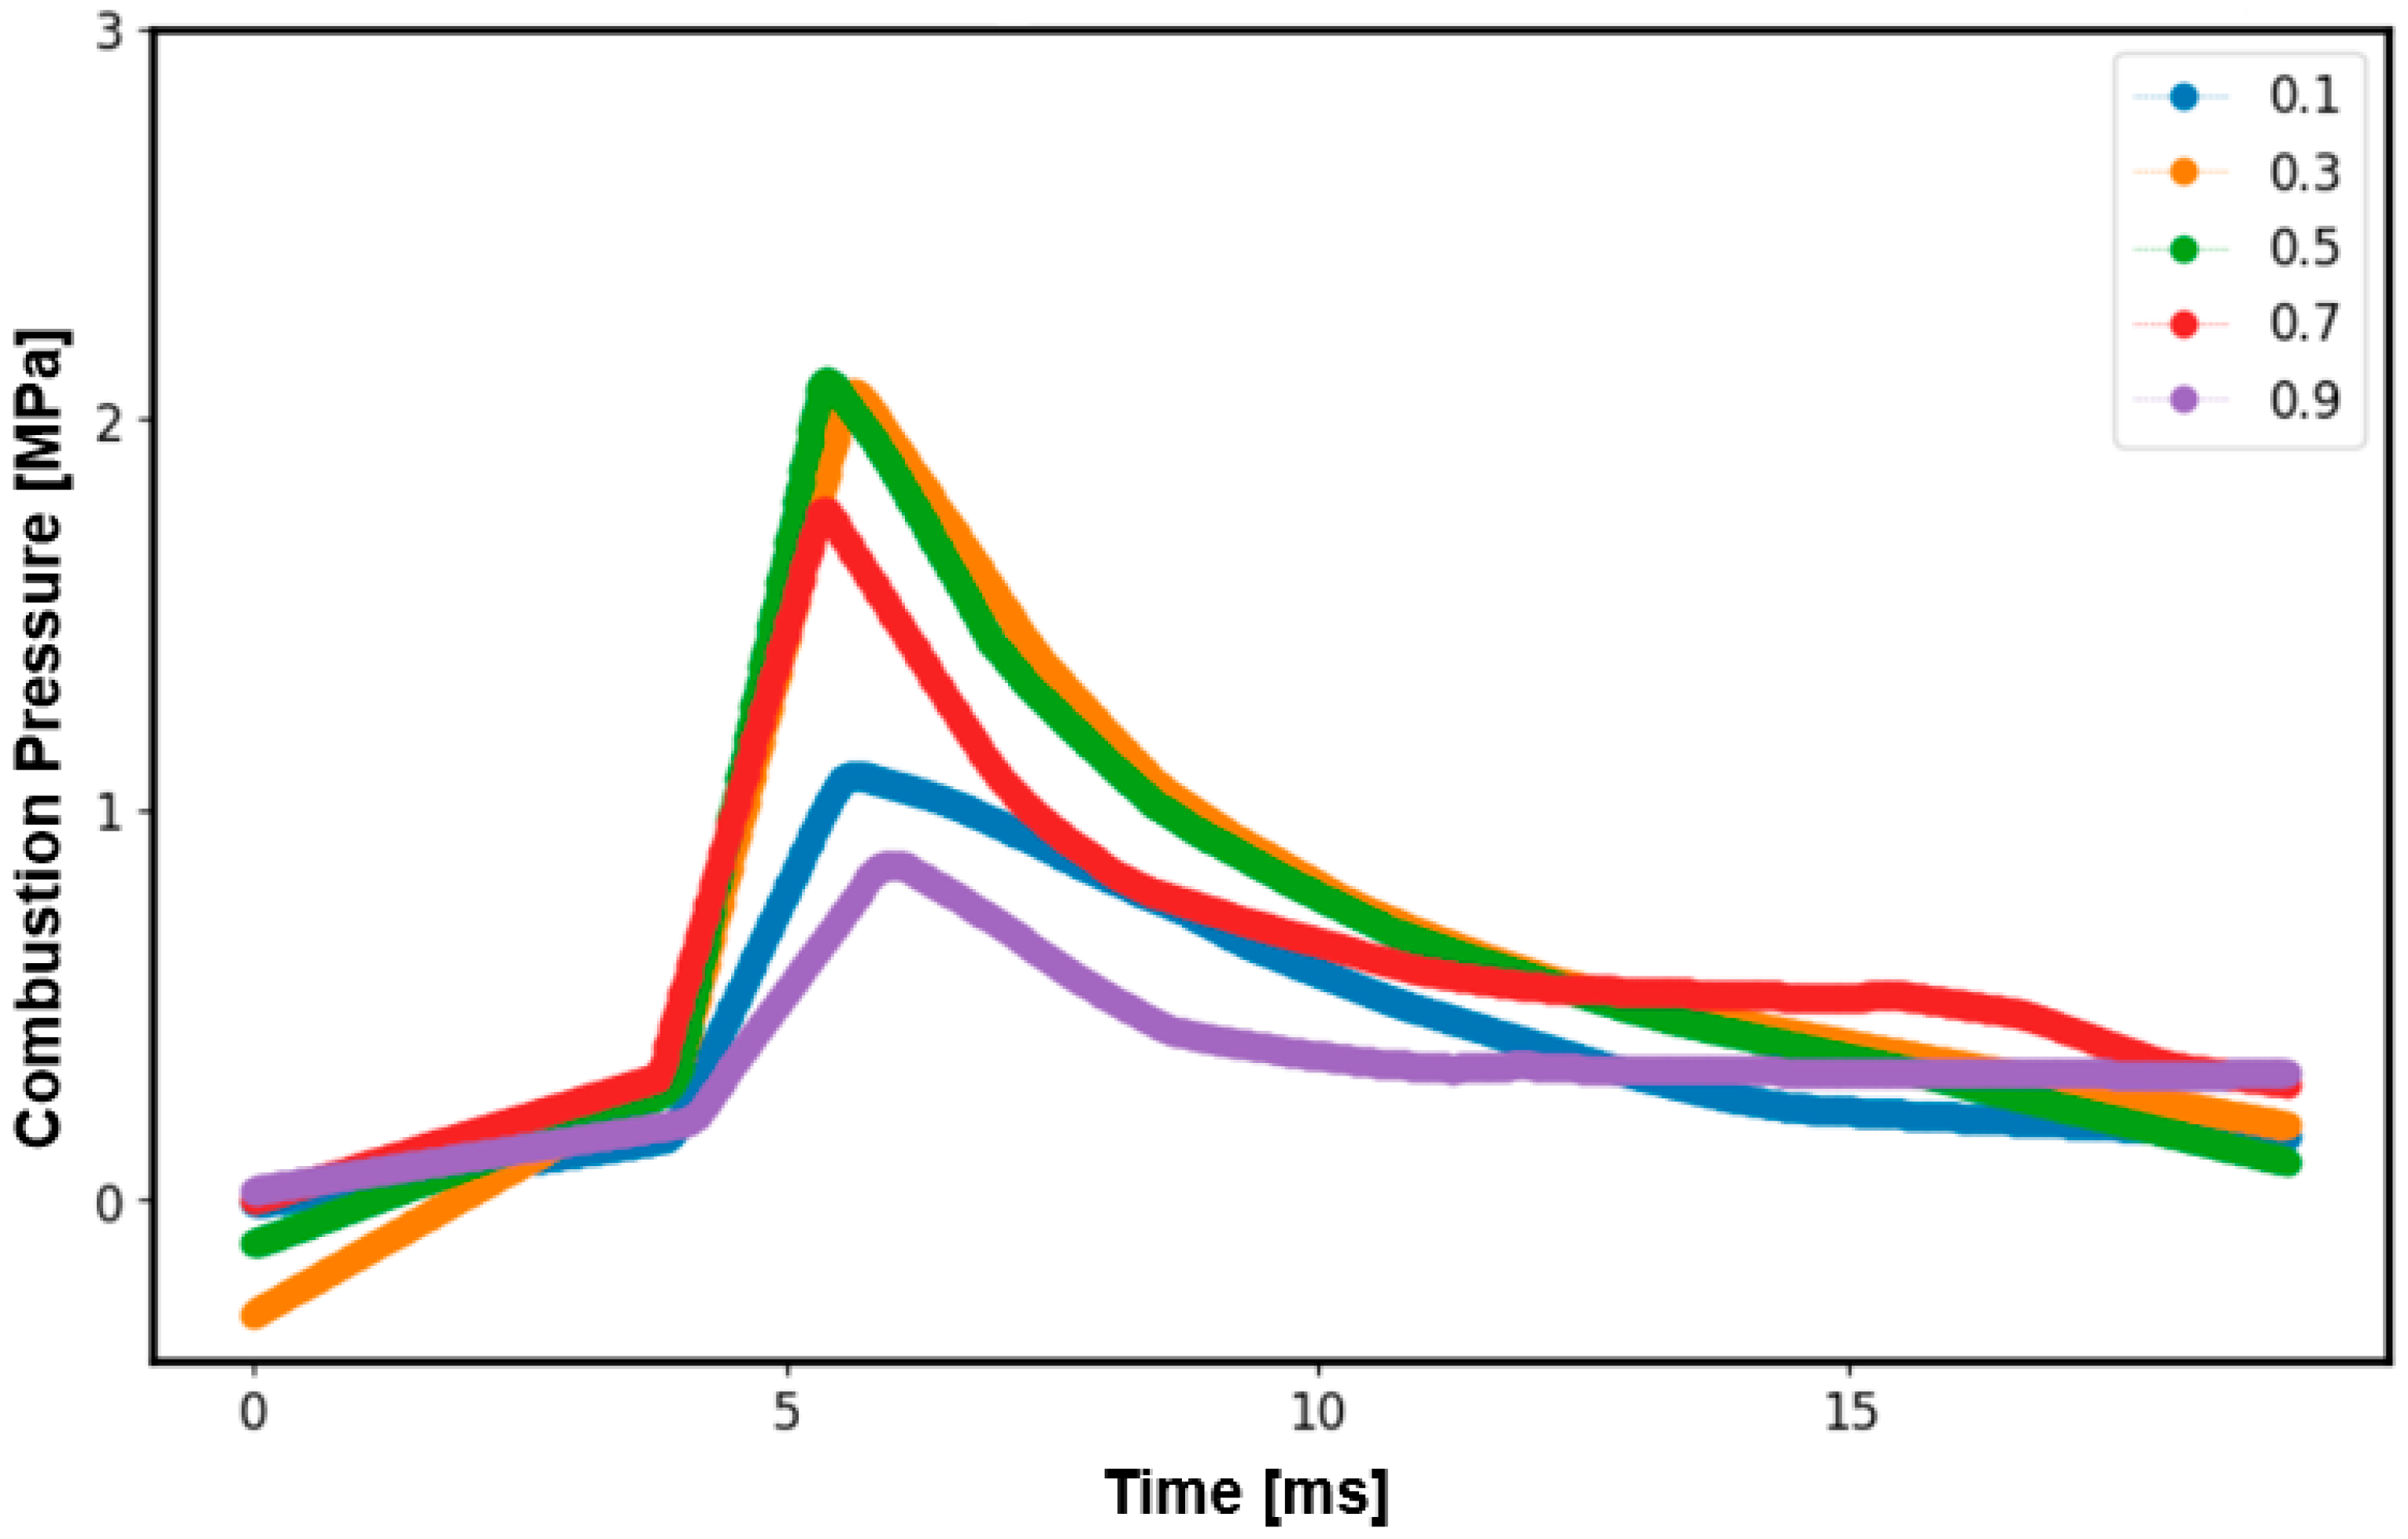
3.2. Predicted at Various Equivalence Ratios

The induced pressure within the CVCC was recorded at various equivalence ratios which were not evaluated during the experiments. These predicted results are crucial in understanding the combustion process. The predicted results revealed that a minimum pressure was generated at an equivalence ratio of 0.9 followed by 0.1, which is almost similar to the experimental results. From the predicted results, it is clear that the maximum pressure was generated at equivalence ratios of 0.3 and 0.5. In addition, equivalence ratios less than 0.3 and greater than 0.7 led to the poor generation of pressure, thus resulting in a minimum heat release rate from the ammonia combustion.
Therefore, the authors considered equivalence ratios from 0.1 to 1.0 not only for the experimental values but also for predicted values. The reason behind this is the reduced quantity of ammonia as fuel with an equivalence ratio of 0.2, resulting in a weakened combustion pressure. Furthermore, even at an equivalence ratio of 1, there was a reduction in the maximum combustion pressure, indicating enhanced combustion efficiency in scenarios where the oxygen content was higher. Figure 5 illustrates the relationship between pressure and time at various equivalence ratios for the machine learning algorithm without the ANN. Similarly, Figure 6 shows the relationship between induced pressure and time at various equivalence ratios for the ANN algorithm. Comparing Figure 5 and Figure 6, it is clear that the machine learning algorithm without the ANN had a better fit compared to the experiment (Figure 4).

3.3. Identification of the Overall Fit and Performance for Various Algorithms

In the second step of the analysis, various machine algorithms were used to identify the best algorithm that had the lower RMSE and the highest R2 values. Therefore, a total of five different algorithms, Random Forest, Gradient Boosting, Support Vector Machine, Linear Regression, and ANN algorithms, were utilized and compared between each other.
The results discovered from the algorithms including the artificial neural network are discussed and illustrated in Table 4. The comparison in Table 4 reveals that the ANN performs worse than Random Forest and Linear Regression, which is clear from Figure 6. Furthermore, it is clear from the table that Linear Regression exhibits the lowest RMSE and an impeccable R2 value of 1.0. This indicates that the Linear Regression model offers an outstanding fit to the data, accurately forecasting the dependent variable, followed by the Random Forest algorithm.

4. Conclusions

During the analysis, the experimental values were evaluated and further used for predicting the induced combustion pressure in a CVCC at various equivalence ratios. The prediction was achieved into two steps: in step-I, the Random Forest algorithm was used for evaluating the combustion pressure; however, in step-II, various machine algorithms were used to identify the best algorithm that had the lower RMSE. The conclusions are presented below.
(a)
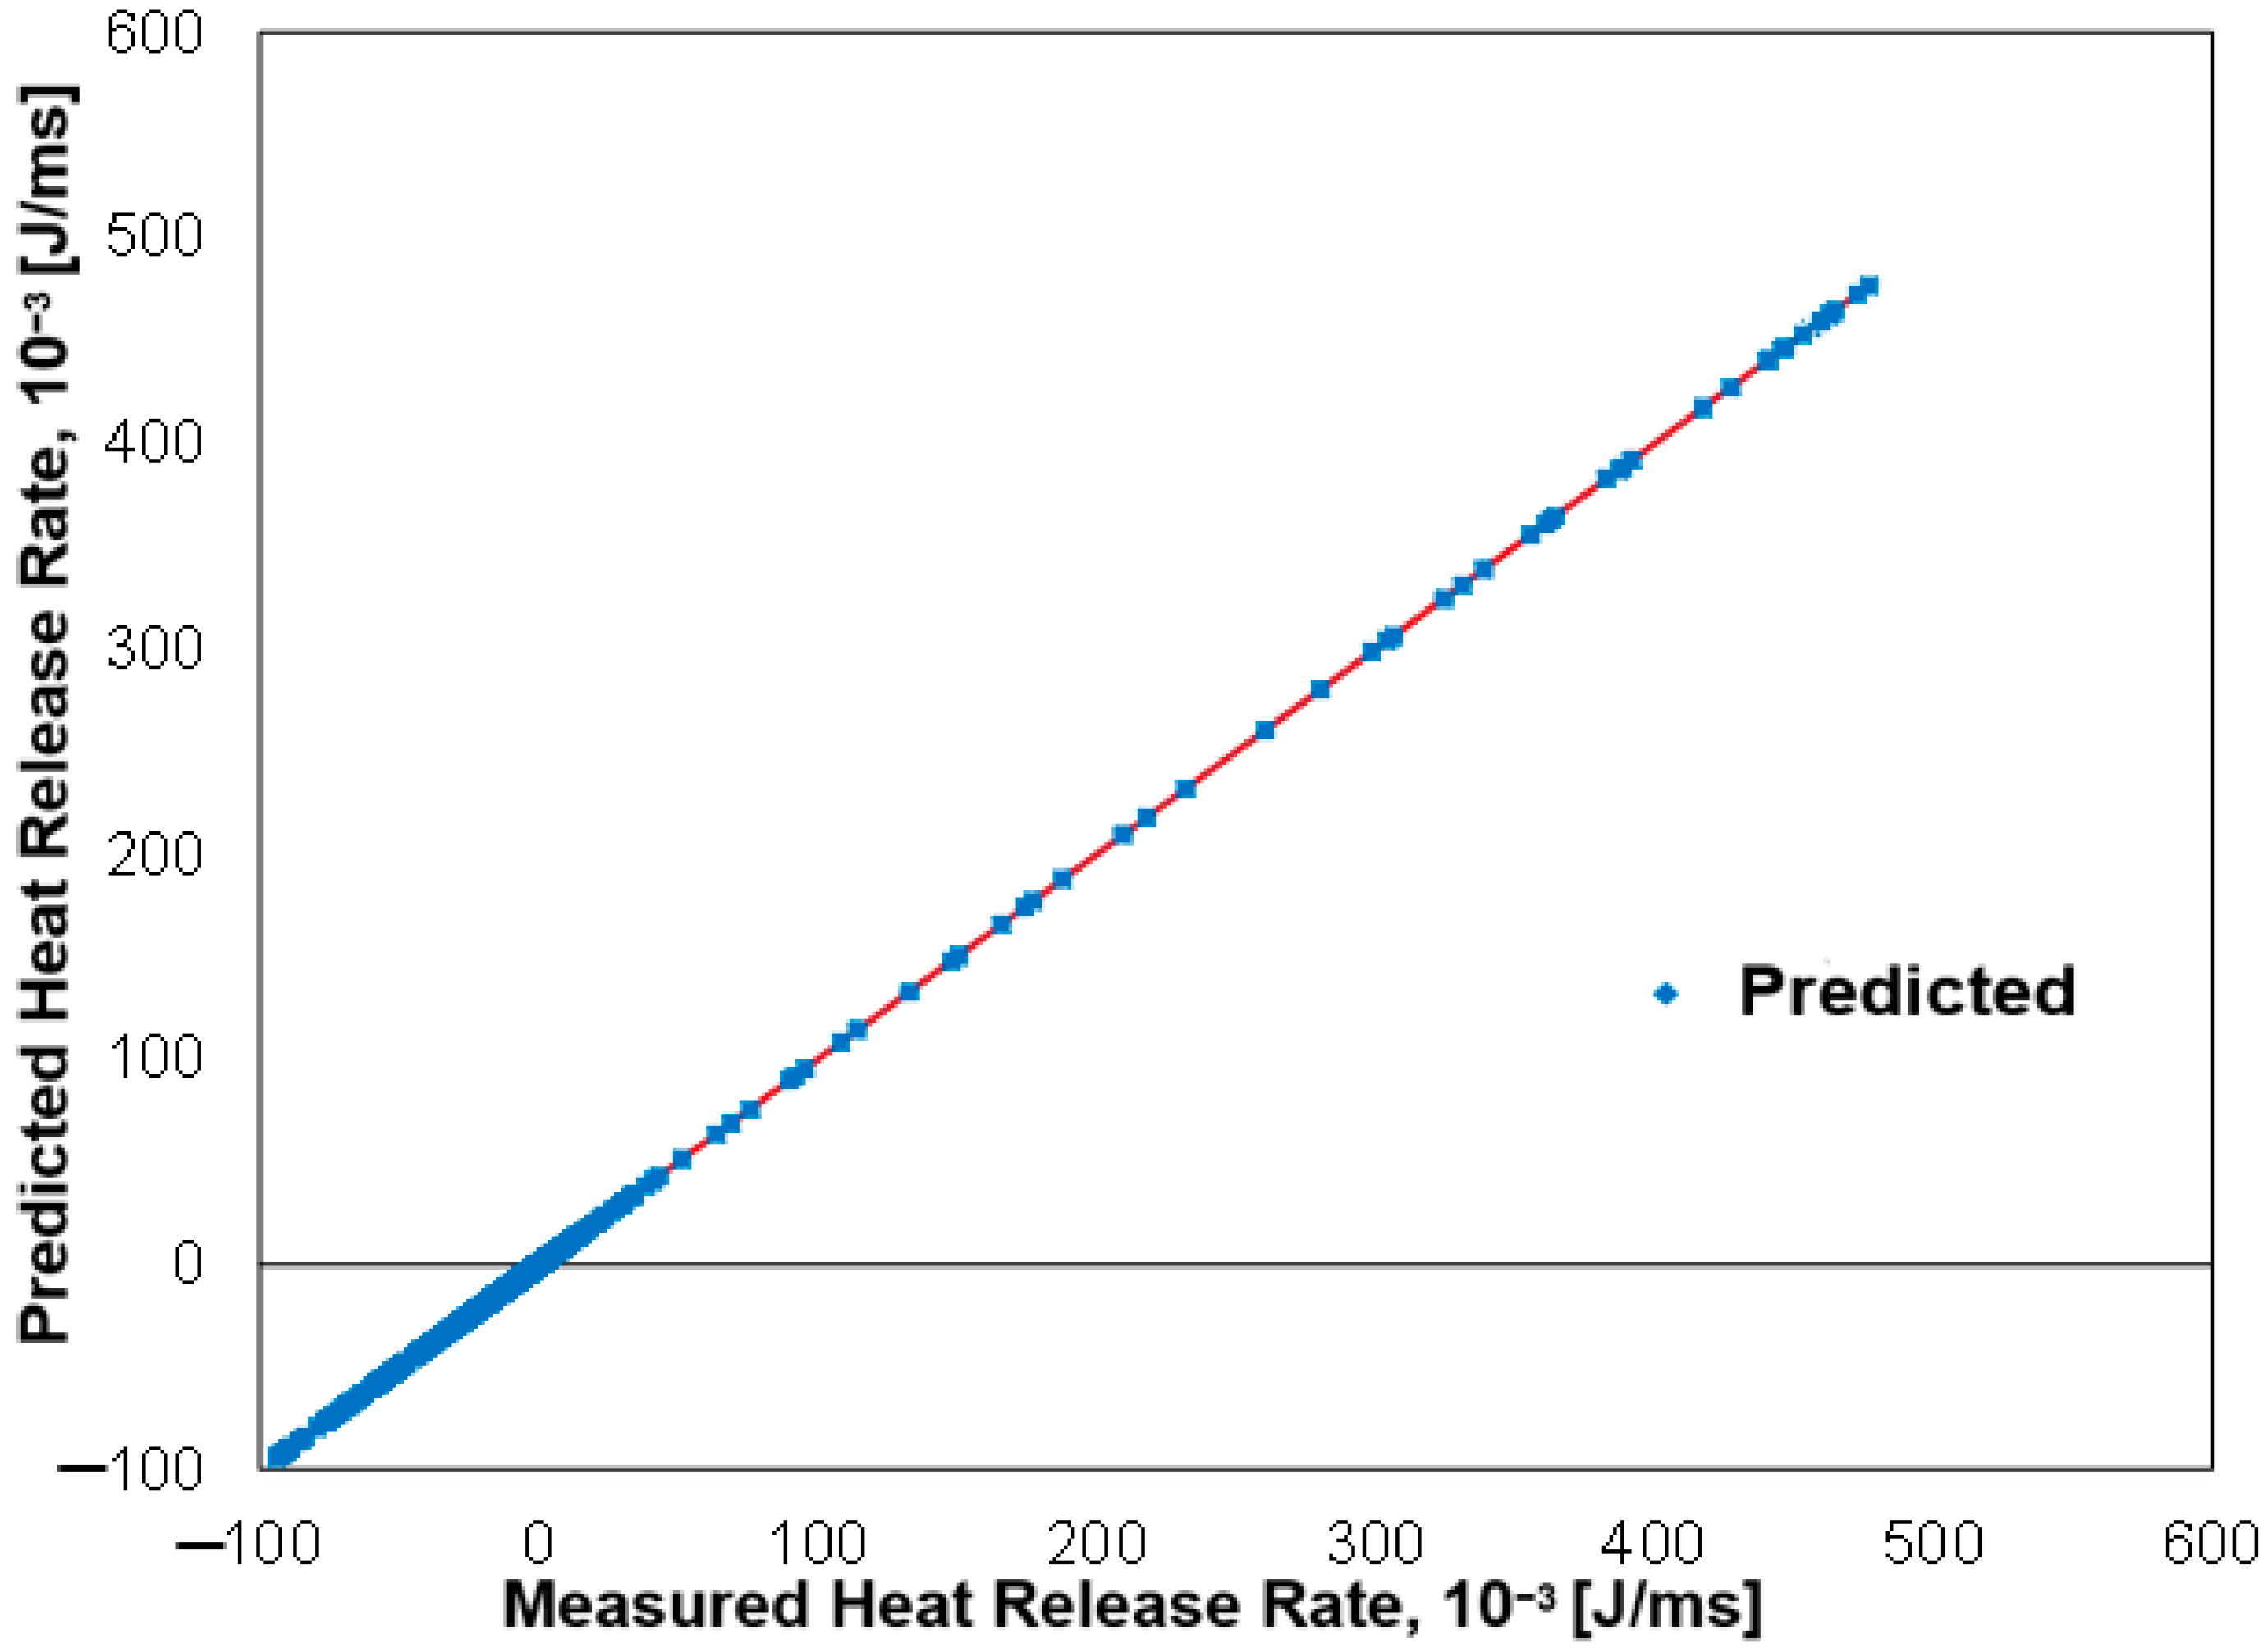
In order to have confidence in machine learning algorithms, the authors evaluated both experimental and predicted heat release rates at an equivalence ratio of 0.4 and then compared each for error analysis, which was negligible.
(b)
As equivalence ratio plays a crucial role in combustion pressure, the analysis was carried out for those equivalence ratios which were skipped during the experimental analysis.
(c)
The maximum pressure induced during experimentation at an equivalence ratio of 0.4 was 2.50 MPa. However, in machine learning prediction, the values were 2.37 MPa and 2.48 MPa at equivalence ratios of 0.5 and 0.3, respectively.
(d)
The combustion pressure was evaluated using Random Forest and artificial neural network algorithms. However, the ANN algorithm illustrated a poor fit.
(e)
Finally, based on the RMSE and R2 values, the Linear Regression model appeared to have the best performance in machine learning with the ANN. In both the cases, it had the lowest RMSE and a perfect R2 value of 1.0, followed by Random Forest.

Author Contributions

Writing—original draft preparation, L.F.; formal analysis, L.F., H.S. and E.Y.; data curation, T.O., M.S. and G.L.; writing—review and editing, M.I. and T.S.; supervision, M.I. and T.S. All authors have read and agreed to the published version of the manuscript.

Funding

This research was funded by the Japan Society for the Promotion of Science, Grants-in-Aid for Scientific Research (No. 19K04244).

Data Availability Statement

Data will be available from the corresponding author upon reasonable request. All other data supporting this study are available within the article.

Conflicts of Interest

The authors declare no conflicts of interest.

References

  1. Ministry of Land, Infrastructure, Transport and Tourism, Japan. Available online: https://theicct.org/chart-gfe-nedc-standards-aug20/ (accessed on 9 August 2021).
  2. Buruiana, D.L.; Sachelarie, A.; Butnaru, C.; Ghisman, V. Important Contributions to Reducing Nitrogen Oxide Emissions from Internal Combustion Engines. Int. J. Environ. Res. Public Health 2021, 18, 9075. [Google Scholar] [CrossRef] [PubMed]
  3. Xu, H.; Lee, U.; Wang, M. Life-cycle energy use and greenhouse gas emissions of palm fatty acid distillate derived renewable diesel. Renew. Sustain. Energy Rev. 2020, 134, 110144. [Google Scholar] [CrossRef]
  4. Agency for Natural Resources and Energy, Japan. Available online: https://www.enecho.meti.go.jp/statistics/electric_power/ep002/pdf/2020/0-2020.pdf (accessed on 10 August 2021).
  5. Koike, M.; Miyagawa, H.; Suzuoki, T.; Ogasawara, K. Ammonia as a Hydrogen Energy Carrier and Its Application to Internal Combustion Engines. J. Combust. Soc. Jpn. 2016, 58, 99–106. [Google Scholar] [CrossRef]
  6. Obreja, C.D.; Buruiana, D.L.; Mereuta, E.; Muresan, A.; Ceoromila, A.M.; Ghisman, V.; Axente, R.E. Detection of reed using cnn method and analysis of the dry reed (Phragmites australis) for a sustainable lake area. Plant Methods 2023, 19, 61. [Google Scholar] [CrossRef] [PubMed]
  7. Zou, H.; Chen, C.; Zha, M.; Zhou, K.; Xiao, R.; Feng, Y.; Qiu, L.; Zhang, X. A Neural Regression Model for Predicting Thermal Conductivity of CNT Nanofluids with Multiple Base Fluids. J. Therm. Sci. 2021, 30, 1908–1916. [Google Scholar] [CrossRef]
  8. Fang, X.; Papaioannou, N.; Leach, F.; Davy, M.H. On the application of artificial neural networks for the prediction of NOx emissions from a high-speed direct injection diesel engine. Int. J. Engine Res. 2021, 22, 1808–1824. [Google Scholar] [CrossRef]
  9. Mauro, A.D.; Chen, H.; Sick, V. Neural network prediction of cycle-to-cycle power variability in a spark-ignited internal combustion engine. Proc. Combust. Inst. 2019, 37, 4937–4944. [Google Scholar] [CrossRef]
  10. Hlaing, P.; Marquez, M.E.; Singh, E.; Almatrafi, F.; Houidi, M.B.; Johansson, B. Effect of Pre-Chamber Enrichment on Lean Burn Pre-Chamber Spark Ignition Combustion Concept with a Narrow-Throat Geometry. SAE Tech. Pap. 2020. [Google Scholar] [CrossRef]
  11. Jafarzadeh, H.; Karaman, C.; Güngör, A.; Karaman, O.; Show, P.; Sami, P.; Mehrizi, A.A. Hydrogen production via sodium borohydride hydrolysis catalyzed by cobalt ferrite anchored nitrogen-and sulfur co-doped graphene hybrid nano catalyst. Artificial neural network modeling approach. Chem. Eng. Res. Des. 2022, 183, 557–566. [Google Scholar] [CrossRef]
  12. Papaioannou, N.; Fang, X.; Leach, F.; Lewis, A.; Akehurst, S.; Turne, J.A. Random Forest Algorithmic Approach to Predicting Particulate Emissions from a Highly Boosted GDI Engine. SAE Tech. Pap. 2021. [Google Scholar] [CrossRef]
  13. Fang, L.; Singh, H.; Ichiyanagi, M.; Suzuki, T.; Raboaca, M.S.; Filote, C.; Verma, C. Prediction of Heat Energy Release Rate for Ammonia Combustion in a Constant Volume Combustion Chamber: A Machine Learning Approach. In Proceedings of the 2023 15th International Conference on Electronics, Computers and Artificial Intelligence (ECAI), Bucharest, Romania, 29–30 June 2023; pp. 1–4. [Google Scholar] [CrossRef]
  14. Smola, A.; Olkopf, B. A tutorial on support vector regression. Stat. Comput. 2004, 14, 199–222. [Google Scholar] [CrossRef]
  15. Duda, R.O.; Hart, P.E.; Stork, G.S. Stork Pattern Classification; John Wiley & Sons: Hoboken, NJ, USA, 2000. [Google Scholar]
  16. Chung, W.T.; Mishra, A.A.; Perakis, N.; Ihme, M. Data-assisted combustion simulations with dynamic sub model assignment using random forests. Combust. Flame 2021, 227, 172–185. [Google Scholar] [CrossRef]
  17. Chayalakshmi, C.L.; Jangamshetti, D.S.; Savita, S. Multiple Linear Regression Analysis for Prediction of Boiler Losses and Boiler Efficiency. Int. J. Instrum. Control. Syst. (IJICS) 2018, 8, 1–9. [Google Scholar] [CrossRef]
  18. Yao, S.; Kronenburg, A.; Shamooni, A.; Stein, O.T.; Zhang, W. Gradient boosted decision trees for combustion chemistry integration. Appl. Energy Combust. Sci. 2022, 11, 100077. [Google Scholar] [CrossRef]
Figure 1. Schematic diagram of (a) experimental setup and (b) pre-combustion chamber [13].
Energies 17 00746 g001
Figure 2. Overall architecture of machine learning process.
Energies 17 00746 g002
Figure 3. Heat release rate comparison between the experimental and predicted values at equivalence ratio of 0.4.
Energies 17 00746 g003
Figure 4. Measured combustion pressure inside constant-volume chamber at various equivalence ratios [13].
Energies 17 00746 g004
Figure 5. Predicted combustion pressure at various equivalence ratios, 0.1 to 0.9, for machine learning algorithm without ANN.
Energies 17 00746 g005
Figure 6. Predicted combustion pressure at various equivalence ratios, 0.1 to 0.9, for machine learning algorithm with ANN.
Energies 17 00746 g006
Table 1. Experimental conditions.
Initial Pressure [MPa]Initial Temperature [K]Equivalence Ratio [-]
0.22980.2, 0.4, 0.6, 0.8, 1.0
Table 2. Working pressure (absolute pressure) of ammonia and oxygen.
Equivalence Ratio
[-]
Ammonia Pressure [MPa]Oxygen Pressure
[MPa]
0.10.02350.129
0.20.04210.111
0.40.06960.083
0.60.08890.064
0.80.10320.050
1.00.11430.039
1.20.12310.030
1.40.13020.023
Table 3. Predicted equivalence ratio boundary conditions.
Initial Pressure [MPa]Initial Temperature [K]Equivalence Ratio [-]
0.22980.3, 0.5, 0.7, 0.9
Table 4. Comparison results of different algorithm learning methods including ANN.
AlgorithmR2RMSE
Random Forest0.99999470.0001636
Gradient Boosting0.99991860.0025123
Support Vector Machine0.99975300.0076229
Linear Regression1.01.337 × 10−30
Artificial Neural Network0.9995888280.012686911
Disclaimer/Publisher’s Note: The statements, opinions and data contained in all publications are solely those of the individual author(s) and contributor(s) and not of MDPI and/or the editor(s). MDPI and/or the editor(s) disclaim responsibility for any injury to people or property resulting from any ideas, methods, instructions or products referred to in the content.

