Article

Impact of Electrode Distance in a Quasi-Uniform Model Electrode System on Lightning Impulse Breakdown Voltage in Various Insulating Liquids

1
Institute of Electrical Power Engineering, Lodz University of Technology, 90-537 Lodz, Poland
2
Institute of Electrical Engineering Systems, Lodz University of Technology, 90-537 Lodz, Poland
*
Author to whom correspondence should be addressed.
Energies 2024, 17(4), 782; https://doi.org/10.3390/en17040782
Submission received: 30 December 2023 / Revised: 22 January 2024 / Accepted: 24 January 2024 / Published: 6 February 2024
(This article belongs to the Special Issue Design and Optimization of Power Transformer Diagnostics II)

Abstract

:
This study presents findings on the influence of gap length distance on the lightning impulse breakdown voltage of three dielectric liquids of different chemical origins. The liquids were tested in a model electrode system with a quasi-uniform electric field distribution and a pressboard plate placed on the grounded electrode. The experimental studies were supported using calculations and simulations to show the individual relationships between the lightning impulse breakdown voltage and gap distance, which represent the so-called volume effect of the most stressed liquid. The results of the experiment, which involved four considered gap distances of 2, 4, 6, and 8 mm, show that a dynamic increase in lightning impulse breakdown voltage with an increase in gap distance is associated with mineral oil and bio-based hydrocarbons. However, similar trends were not observed for synthetic ester. Calculations that allowed us to assess the impact of gap length distance on lightning impulse breakdown voltage support the observations from the experimental studies. The curves obtained in this field can be considered in the process of designing insulating systems for transformers.

1. Introduction

The reliability of devices intended for the generation and distribution of electricity is a priority for each national grid operator, not only due to the comfort of consumers but also due to the huge costs of unforeseen interruptions in the supply of electricity. The nodes in this system are all types of power stations equipped primarily with transformers [1,2]. Transformers are the most important elements in the energy supply chain and are required to be as reliable and operational as possible. Ensuring that their proper operation is based primarily on the selection of an appropriate insulation level for the active parts in the internal structure. An additional difficulty in implementing appropriate insulation inside transformers (especially of distribution type) is the limited amount of space resulting from the requirements regarding their dimensions, which have to enable the installation of the unit in accordance with their intended use in the power grid. A similar problem concerns transformers installed in windmills, where space for transformers is also very limited [3,4,5].
The insulating media used inside the transformer can be divided into the so-called dry and oil transformers. Transformers filled with insulating gasses are also used, but they are used in a very limited area. Dry transformers are structures in which internal insulation is created by filling the windings with an appropriate resin, and cooling is performed using air. They are characterized by relatively low power and rated voltages up to 72.5 kV [6]. For distribution and power transformers, the problem of ensuring adequate protection against internal short circuits increases with the rated voltage. In the case of high electrical stresses inside the transformer tank, air is no longer a sufficient medium to ensure proper insulation of the active parts. In such cases, the best insulating medium to be used in transformers is a dielectric liquid [7,8]. It provides much better insulation than air and ensures adequate cooling of the windings and core. This is a convenient solution due to the operation of the transformer, which does not have to be as tight as in the case of structures filled with insulating gasses, where high pressure is required for proper operation [9,10].
Dielectric liquids in power transformers must fulfill the requirements described in adequate standards. For more than 100 years, the main insulating liquid applied in transformer insulation structures has been mineral oil. This liquid has very well-recognized properties, both in terms of dielectric and cooling parameters [11]. However, with the introduction of new liquids, mainly of biodegradable nature, tests of comparable kind have been performed to understand the mechanisms determining the changes in dielectric properties of these liquids [12,13,14], as well as the behavior of the liquids in the condition of aging or other chemical and physical properties [15,16].
An important property in terms of dielectric properties is the assessment of the resistance of a given liquid to lightning impulse stress. Studies in this field, performed mainly in point-to-sphere or point-to-plane electrode systems, have indicated that mineral oils are the best solutions, especially when we consider the acceleration voltage [17]. However, equally good alternatives are new solutions of dielectric liquids, such as bio-based hydrocarbons [18] or GTL-based biodegradable dielectric fluids [19]. The latest trends in understanding the lightning impulse-based dielectric properties of alternative biodegradable liquids have proposed that tests use structures that are as close as possible to the actual insulating structures of power transformers. Therefore, systems with quasi-uniform fields are preferable to electrode systems with highly nonuniform fields [20,21].
Based on the above, the subject of this work was the critical evaluation of the lightning impulse breakdown voltage (LIBV) in an original model system with a quasi-uniform electric field distribution equipped with an impregnated pressboard plate placed on the surface of the grounded electrode. LIBV measurements were performed for three chemically different dielectric liquids at a standard lightning impulse voltage of negative polarity. The following insulating liquids were considered:
-
Inhibited mineral oil (MO),
-
Bio-based hydrocarbon (BIO),
-
Synthetic ester (SE).
The LIBV for each liquid was measured for four interelectrode gap distances (the so-called free liquid gap): 2 mm, 4 mm, 6 mm, and 8 mm. This approach allowed us to determine the influence of the volume of oil in the interelectrode space on the dielectric strength of a given liquid under the applied testing conditions. Using the measurement data and exponential approximation, the curves representing the influence of volume on the dielectric strength of a given liquid were plotted. In addition, simulations of the electric field distribution for two selected cases with gap distances of 2 mm and 6 mm, based on real experimental data, were conducted. This was performed to express the results in the category of electric field stress, which is commonly used in industry practice when designing and verifying the insulating structure of a real power transformer.
The results were critically reviewed, showing the relationship between the liquids for the electrode system reflecting the field distribution closer to the insulating systems of power transformers.

2. The Influence of Gap Distance on Liquid Breakdown at Lightning Impulse Voltage

The electric strength of the oil gap depends not only on the interelectrode distance but also on the volume of oil located between the electrodes, and more precisely on the volume of oil under a high electric field of more than 90% of its maximum value [22,23]. It has been proved that, assuming a constant distance between the electrodes, the maximum electric field intensity strongly depends on the size of the electrodes used, and more specifically on their surface. As it increases, the electric strength of the considered gap decreases. There is another view on this issue, which states that increasing the liquid volume occurs when increasing the gap between the electrodes while maintaining a constant electrode surface. Both observations are valid for alternating voltage and impulse voltage and are known as the oil gap length effect, most stressed electrode area, or most stressed oil volume [24,25]. Due to the problematic determination of the most stressed volume/area, these two theories are rarely used in common design practice in the transformer industry. However, the effect of dielectric liquid gap length is implicitly considered in transformer design principles using safety factors or stress curves. As an example, we can give the “Kappeler” or “Weidman” curves, which are commonly used in the transformer industry [25,26].
In general, the volume effect is explained by an increasing number of the so-called “weak points” in the dielectric liquid, which may be attributed to contamination, moisture, or gas bubbles that can constitute the weak points and may initiate a discharge leading to breakdown. The change in the liquid volume between the electrodes, as quoted above, can be modeled in the easiest way by increasing the electrode spacing in the specially designed and prepared tested model.
The breakdown voltage Vb may be correlated with the electrode gap using the following Formula (1):
V b = A d n ,
where d is the gap distance between the electrodes and A and n are constants. The method for determining the aforementioned relationship for the tested liquids will be described later in this study. What is important here is that for large electrode spacing, and therefore for large volumes of dielectric liquid between the electrodes, the increase in dielectric strength is no longer relatively proportional to that for gap distances of a few millimeters. The curve changes its slope and does not increase at the same rate as that for smaller distances.

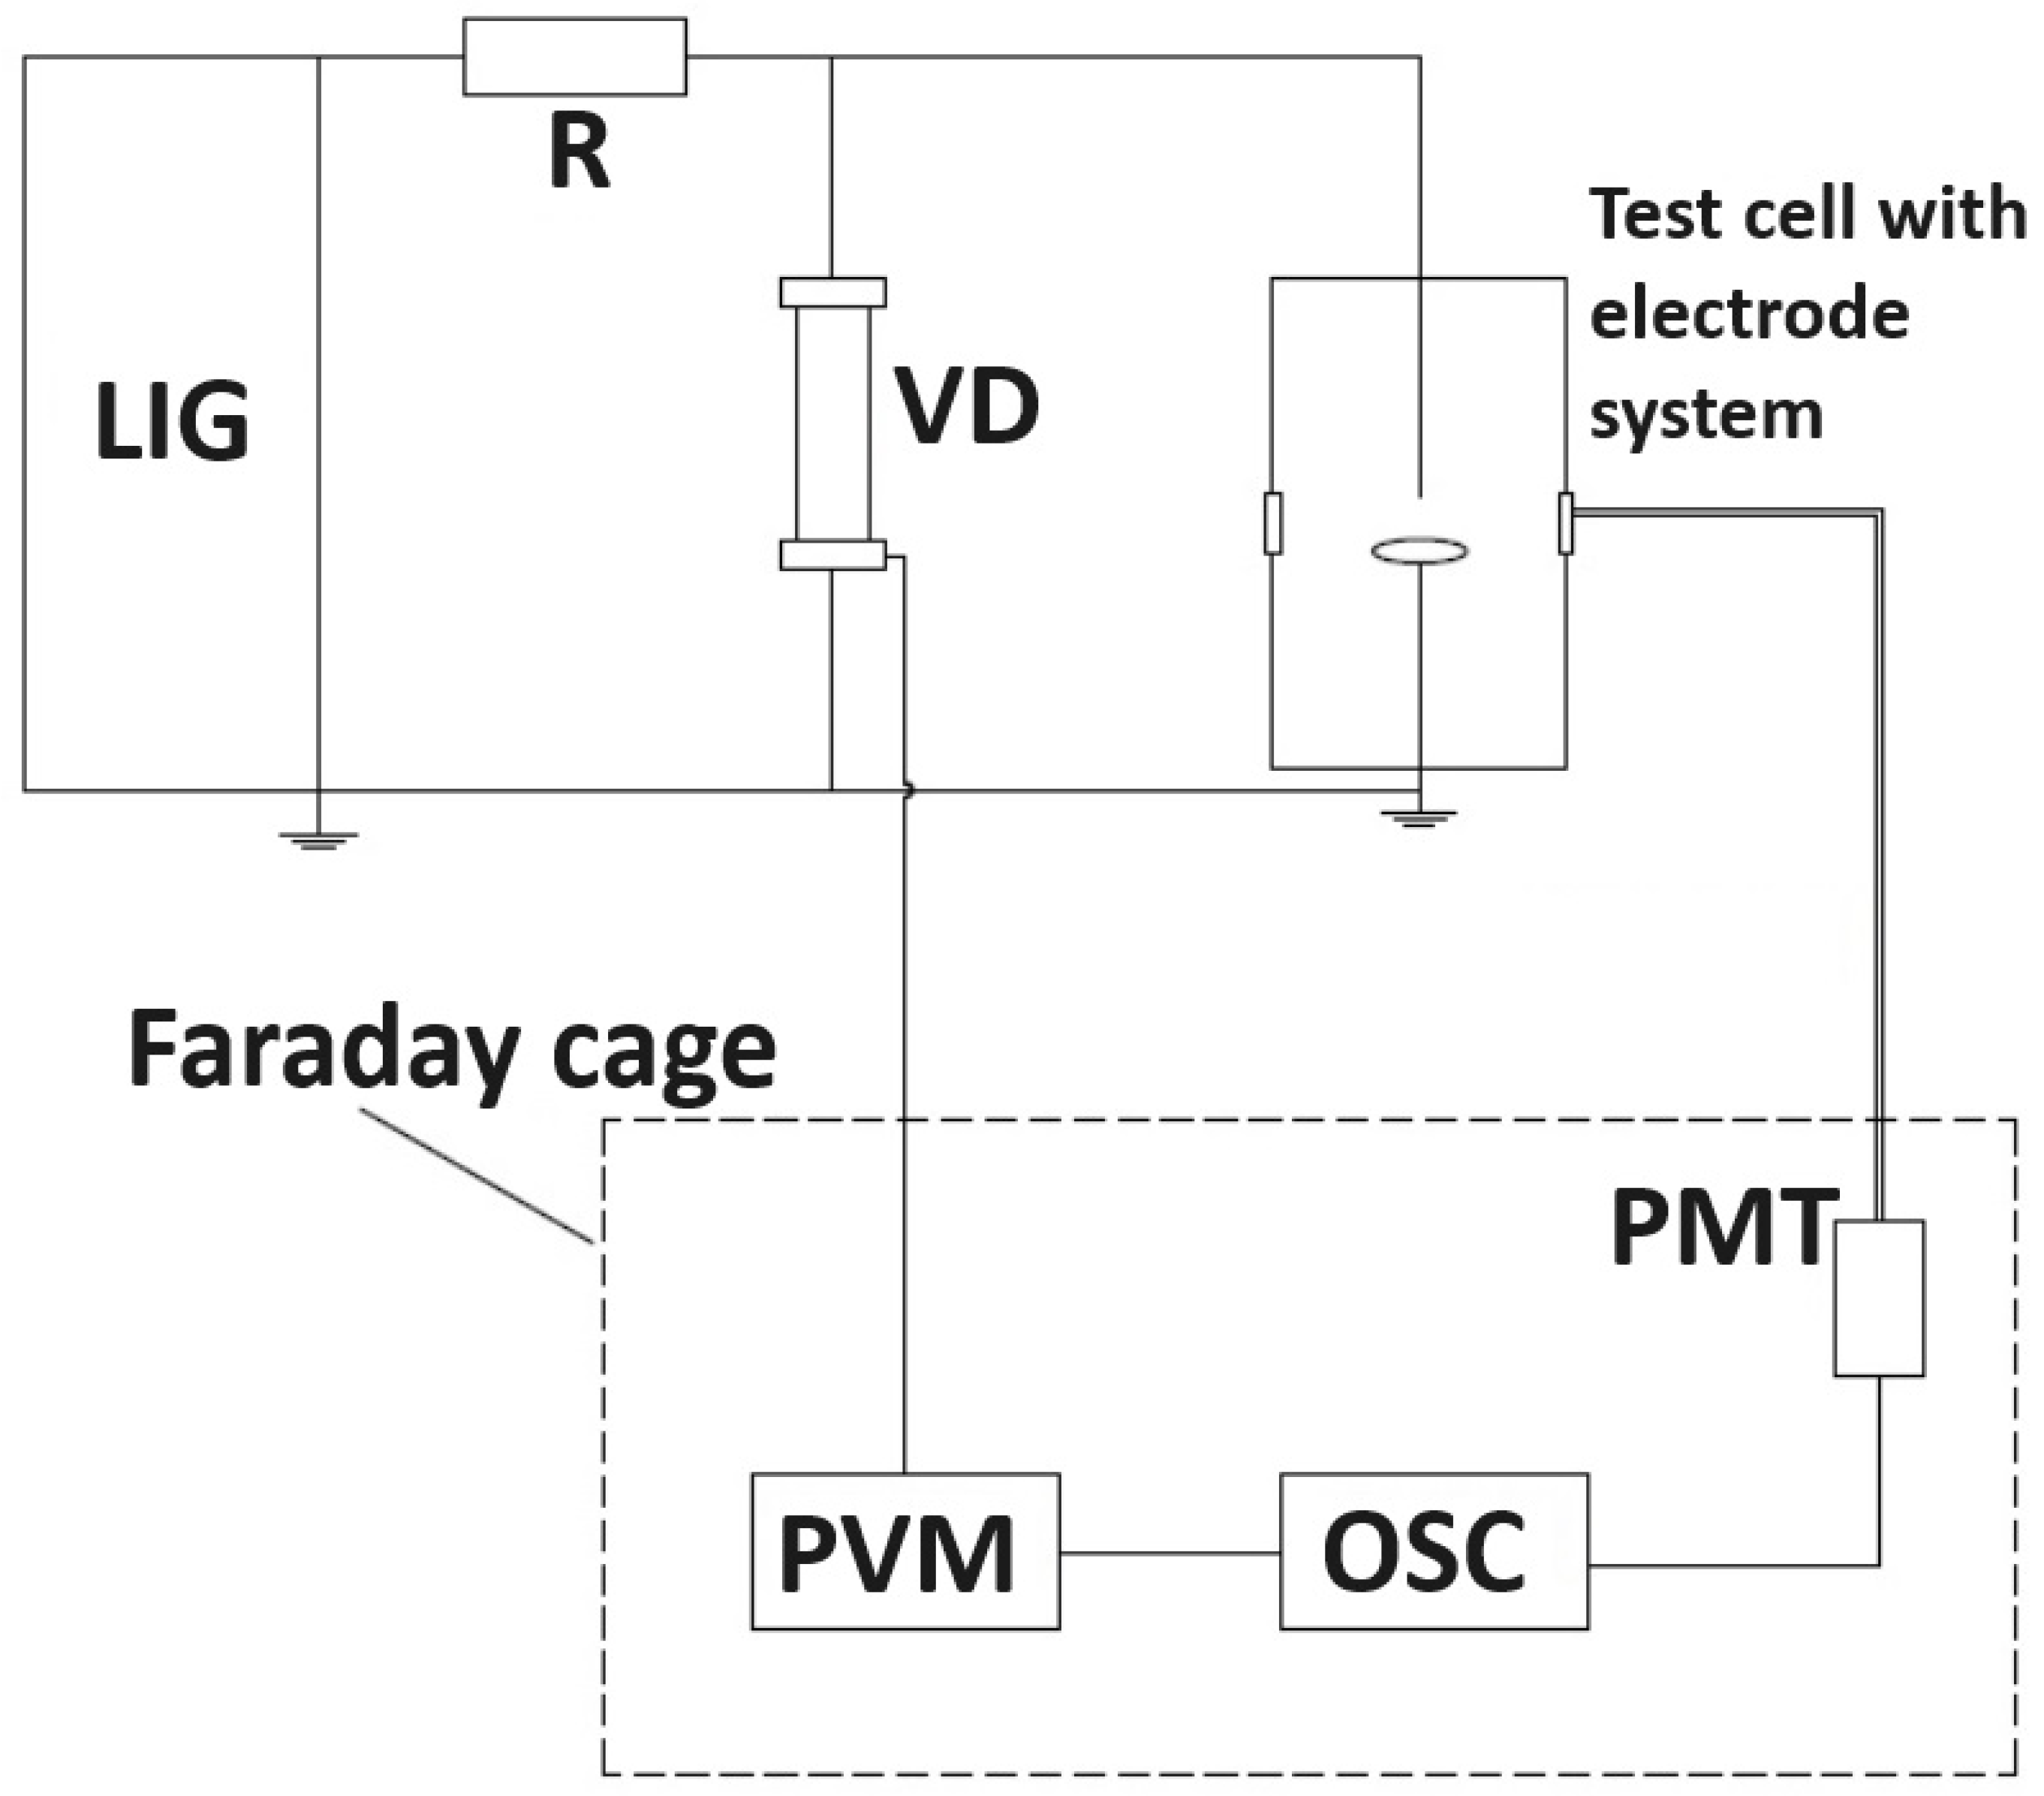
3. Methodology of the Studies

The measurements were performed with the use of the measurement setup presented schematically in Figure 1.
To conduct the measurements, a six-stage high-voltage Marx generator (LIG from Figure 1) with a rated voltage of 450 kV and stored energy of 2.2 kJ was used, supplying a normalized negative lightning impulse 1.2/50 µs to the electrode system. This was achieved through the limiting resistor (R from Figure 1) to limit the current flowing in the high-voltage circuit when a breakdown occurs. The peak voltage value was typically measured using a peak value meter connected to the voltage divider (VD from Figure 1), which was placed parallel to the tested object and voltage source. Simultaneously, the voltage waveform was recorded on the screen of a 4-channel digital Tektronix, Beaverton, OR, USA, TDS3052 oscilloscope with a sampling rate of up to 5 Gs/s. The electrode system and the considered dielectric liquid were placed in a cylinder test cell made of transparent Perspex, which allowed the observation of predischarge phenomena in the form of light emitted by the discharges. The light was collected through an optical fiber placed on the side wall of the test cell and then converted via a Hamamatsu, Shizuoka, Japan, R1925 photomultiplier tube (PMT) with a spectral response from 300 to 850 nm into an electrical signal fed to an oscilloscope.
The electrode system, representing quasi-uniform electric field distribution, was chosen to imitate the electrical stress occurring at the corner of the winding wire in the oil channel, located in the main slot of the transformer. The fragment of the main insulation of the transformer, which constitutes the modeled problem, is presented schematically in Figure 2.
Thus, it was decided, on the basis of our own experience and data from the transformer manufacturer, that the indicated part may be modeled using an electrode system that included a U-shaped high voltage (HV) electrode with a flattened end made of 4 mm brass wire and a grounded electrode, which was an aluminum plate with a diameter of 150 mm. In addition, a 1 mm-thick pressboard plate of the same diameter as the grounded plate was installed on the system. The scheme of the electrode system with its fundamental dimensions and two profiles is shown in Figure 3.
Because the breakdown caused the destruction of the pressboard plate, it had to be changed after each measurement series. Therefore, a set of pressboards was prepared before the experiment in terms of drying and impregnation. Drying was performed under vacuum conditions at 105 °C for 48 h, while impregnation lasted 24 h and was realized at 80 °C. The pressboard plates were successively impregnated with the liquid used in the measurements.
Before filling the test cell with the tested liquid, it was thoroughly cleaned with extraction gasoline and dried. Measurements started at least 15 min after pouring the tested liquid into the test cell to avoid disturbing the measurements with gas inclusions formed when the liquid was poured from the container into the test cell.
The method of LIBV determination was borrowed from the IEC 897 Standard and based on the authors’ own experience from previous studies [13,17,18,19,27,28]. Hence, a step method was applied, in which the peak value of the lightning impulse voltage was increased at 2 kV voltage increments, starting in each case from the assumed voltage level of 80 kV. Figure 4 shows an example of a measurement series with selected oscillograms registered for subsequent voltage levels. The x-axis represents the time base with 4 µs/div. In turn, the y-axis is voltage (for blue course) with 100 kV/div or light intensity (red course) with arbitrary units. Because light emission was not a clue in the tests, it was not examined further in this paper.
Five LIBVs were experimentally determined for each gap distance. When a breakdown occurred, the pressboard plate was changed to a new one, and before starting a new series, a 15 min break was applied. As mentioned previously, four gap distances between the HV electrode and the surface of the insulating pressboard plate, namely 2, 4, 6, and 8 mm, were tested; therefore, 20 pressboard plates were needed for the entire testing procedure.
The liquids considered in the studies were inhibited mineral oil (MO), bio-based hydrocarbon (BIO), and synthetic ester (SE). BIO and SE were chosen for the tests as MO alternatives with biodegradable characteristics. SE is a quite well-known biodegradable liquid that has been the subject of much research [7,11,12,13,14,15,17,29,30]. In turn, studies on BIO are very limited, mainly due to its novel character and very short time of availability in the dielectric liquid market [18,21,31]. MO was chosen as a reference liquid to which the results concerning environmentally friendly liquids will be referred. Such an approach, with MO as a reference, is a typical approach in comparative studies that provides the opportunity to place the considered parameter of a new liquid in a hierarchy [12,13,14,15,18,21,29,30,31,32].
Thus, the MO tested was the classic naphthenic oil with a standard content of naphthenic hydrocarbons (approximately 65%), approximately 20% paraffinic hydrocarbon content, and approximately 15% aromatic hydrocarbon content. The SE was a commercial pentaerythritol ester consisting of four ester groups (COOR) arising at the end of the cross structure of the compound. The R groups are either the same or different, and the acids in the SE considered are saturated without C–C double bonds. BIO is a fully bio-based and biodegradable liquid that is produced using severe hydroprocessing combined with isomerization. BIO is based on biobased residues and byproducts. Table 1 summarizes the fundamental parameters of the three liquids considered in this research, while Table 2 juxtaposes some characteristic parameters that were measured before the beginning of the tests.

4. Results

4.1. LIBV of Considered Cases

Although only five breakdown voltages were collected for each gap distance, the results were analyzed using the Weibull distribution function of the two-parameter form. This function was chosen due to its good fit to the issues of electrical or mechanical strength of materials and the possibility of applying it to small vectors of random variables [12,13,14,17,18,19,21,23]. In the form used, the Weibull distribution is characterized by two coefficients—the scale parameter Xm and the shape parameter k. The probability function for a random variable x is provided in Formula (2):
F x = 1 e x X m k .
The random variable in the conducted research was the LIBV value of the liquid in the considered electrode model. The shape parameter k describes how the probability of an event (in this case, breakdown) behaves as the applied voltage increases. For the conducted analyses, it is expected that the probability of a discharge occurring will increase with the applied voltage, so it is expected that the value of k > 1. In the case of a model in which the probability decreases with an increase in stress, smaller-scale parameter values are obtained. The scale parameter Xm also has a practical interpretation in the context of the conducted research. It represents the voltage supplied to the system, below which 63% of the samples break down.
Figure 5 shows the results of the statistical analysis for the four considered gap distances. Each subfigure represents Weibull plots for the three liquids tested and the same gap. On the basis of the data, the values of 5% breakdown probability were read and set in Figure 6 in the form of the relationship between 5% LIBV and gap distance.
Figure 5 and Figure 6 demonstrate that at a distance of 2 mm, the differences between the tested liquids are relatively small (at the level of individual kilovolts). However, this is not a surprise due to the relatively small gap, for which the differences at lightning impulse voltage are not typically visible, even at nonuniform electric field stress. Additionally, it is important to note that the value of 5% LIBV of mineral oil is the highest compared with the other two liquids. As the distance between the electrodes increases, the bio-based hydrocarbon shows increasingly better insulating properties and dynamics of improvement, achieving better results than mineral oil. The increase in the LIBV of synthetic ester with the electrode gap is also noticeable, but it is not as intense as in the case of hydrocarbon-based liquids; it is the smallest without a doubt. The results are certainly surprising when we compare the hydrocarbon-based liquids. The new bio-based hydrocarbon shows interesting benefits in terms of lightning performance when analyzing the electrode model with a pressboard plate placed on the surface of the grounded electrode. Its LIBV is higher than that of mineral oil with increasing gap distance. However, this fact should be viewed with caution. It may be supposed that this results from better impregnation of pressboard by BIO due to lower kinematic viscosity, which influences the impregnation efficiency, as proved in [29]. Hence, the pressboard impregnated with BIO could withstand more intense discharges before breakdown occurred. Therefore, such an assumption must be verified in detail in future studies, especially when testing the systems of insulated electrodes.

4.2. Prediction of the Influence of Gap Distance on LIBV

As mentioned above, one of the goals of this study was to extend the experimental data on higher gap distances for which laboratory validation is hardly probable. For this task, the average values of LIBV for a given gap distance and liquid dielectric were considered. These are set together in Table 3.
In the next step, the values from Table 3 were transformed using natural logarithm to the form presented in Table 4.
Determination of the predicted LIBV for each liquid for gap distances above 8 mm was performed using a function in which the variable is the distance between the electrodes, which is described in Formula (1). The least squares approximation implemented in Microsoft® Excel® for Microsoft 365 MSO (“LINEST” function) was used to estimate the distinctive curves. In this way, the values of the constants n and A were determined. The values of the constants for the individual liquids are listed in Table 5.
Based on the data from Table 5, the curves Vb(d) representing individual relationships between LIBV and gap distance for the three considered liquid dielectrics are presented in Figure 7, Figure 8 and Figure 9.
As expected, it was observed that for small interelectrode distances, the LIBV of each liquid increases relatively linearly, whereas for larger gap distances, the curve decreases in inclination with respect to the abscissa axis and begins to asymptotically approach a certain limiting value. This observation is quite a normal situation, which equally concerns all types of dielectrics (gaseous, liquid, and solid). However, the dynamics of the changes in breakdown voltage with dielectric thickness are different.
Compared with the results obtained herein, BIO is characterized by the greatest LIBV and the greatest increase within this parameter for large electrode distances. In the case of synthetic ester, these values are much smaller and do not change dynamically above 20 mm, as in the case of MO and BIO. Thus, the data confirm better resistance of hydrocarbon-based liquids to lightning impulse stress than biodegradable synthetic esters.

4.3. Finite Element Method Simulations

Two selected cases were chosen to analyze the electric field distribution in the model electrode system: 2 and 6 mm gap distances using the finite element method. The analysis was conducted using FEMM 4.2 software. For each gap distance case, all three liquids were validated. The electric field distribution along the oil gap and inside the pressboard barrier with simultaneous assessment of the maximum electric field at the HV point for the experimental conditions was determined numerically. The created model representing the electrode system used during the experiment was based on the actual geometry of this system, as presented in Figure 3. In the simulator, the dimensions of the high-voltage electrode were designed based on its side cross-section because the tip of the electrode in this case has a smaller radius, thus reflecting a better actual model (worse field conditions understood as higher nonuniformity of electric field).
The input data for the numerical simulations are shown in Table 6. These include the electrical permittivity values of the liquids, electrical permittivity values of the pressboard used as an insulating plate, values assigned to the HV electrode (grounded electrode had a potential equal to 0 V), and the number of mesh nodes. The latter was fixed automatically by the software and was practically the same for all analyzed cases. Additionally, please note that although the same type of pressboard was used in each case, its electrical permittivity changed due to the influence of the electrical permittivity of the liquid with which it was impregnated. It is also important to note that the simulations were made using 2D space and the side profile of the model electrode system, representing a more nonuniform electric field distribution and thus a more unfavorable case.
Figure 10 shows an example of the model created using the applied software.
In Figure 11, Figure 12 and Figure 13, the simulation results are presented separately for the three liquids. Please note that for better comparison, the electric field stress color scale is the same on all graphs.
Figure 14 and Figure 15 show the changes in the values of the electric field stress along the oil channels and inside the pressboard barrier for all three liquids under consideration. These figures confirm the strict relationship between the LIBV value and the distribution of electric field stress and its maximum values at the tip of the HV electrode. A higher LIBV generates a higher electric field in the vicinity of the HV electrode, maintaining the relationship between electric field stress in the liquid volume and the pressboard barrier. Because the tested electrode configuration has some level of field nonuniformity, no high influence of pressboard plate is noticed, which was also partially expected. However, equalization of the electric field stress values was achieved in the pressboard. This is mainly due to the long distance from the HV electrode as the place of the highest electric field stress and the simultaneous impact of electrical permittivity change between pressboards impregnated with different dielectric liquids.

5. Discussion

The aim of this study was to assess the influence of the interelectrode gap distance on the lightning impulse breakdown voltage of three selected dielectric liquids in a specific model electrode configuration with quasi-uniform electric field distribution and a pressboard barrier placed on the grounded plate. During the experiment, the following dielectric liquids were considered: inhibited mineral oil, bio-based hydrocarbon, and synthetic ester.
When assessing the results, the influence of the most stressed oil volume in the form of the dielectric liquid gap length was taken into account. Based on the research conducted and considering the specificity of the experimental approach, it may be stated that:
-
At most of the analyzed electrode gap distances and under the conditions of the experiment, the best insulating properties expressed through the LIBV were obtained for the bio-based hydrocarbon; only in the case of a gap distance of 2 mm, BIO had a lower LIBV than MO;
-
For the tested electrode gaps, when filled with MO and BIO, a dynamic increase in LIBV with an increase in the gap distance was observed; however, a similar dynamic trend was not observed for the SE tested, for which the lowest trend of LIBV was observed;
-
Considering the influence of oil volume, which was expressed by the dielectric liquid gap length, the best results at lightning voltage stress for larger gap distances calculated using Formula (1) were also achieved with bio-based hydrocarbon and, next, with mineral oil, whereas synthetic ester demonstrated the worst behavior in this field; the calculations confirmed observations from experiments performed on smaller gaps;
-
Based on the finite element method analysis of the electric field distribution in the model electrode system, it was found that the distribution of the electric field stress for the voltages leading to breakdown and, in particular, the maximum values of this field stress are lower for an electrode gap equal to 6 mm than for a 2 mm gap distance; this is caused by the volume effect—the maximum electric field stress corresponding with LIBV decreases with the dielectric liquid gap length. Therefore, the assumption resulting from theoretical speculations was proved experimentally;
-
From the point of view of the operation of power transformers, it can be said that within the conditions of the experiment, the new alternative dielectric liquid, namely bio-based hydrocarbon, is at least equally good in terms of lightning performance assessed using the considered electrode model of quasi-uniform electric field distribution. Because this is a biodegradable liquid with a very low viscosity that may improve the cooling conditions in the transformer, it may be truly considered to be applied in power transformers as a dielectric liquid medium. However, to fully assess this liquid, a wide range of studies should be performed, including all dielectric and cooling properties, as well as aspects connected with aging;
-
The LIBV curves determined on the basis of Formula (1) for the analyzed liquids can be considered in the processes of designing the insulating systems of transformers.

6. Conclusions

The studies showed the need of extension of the laboratory tests on new dielectric liquids at lightning impulse voltage beyond the commonly used electrode system of non-uniform electric field distribution; especially the electrode models closer to the real insulating structures of power transformers are desirable.
Hence, it seems that the challenge for future studies in this area is to develop such electrode models, for which both HV and grounded electrode are insulated and the values of electric field stress generated in such the systems reflect fully the values resulting from electric field distribution in transformer.
This is the topic currently being developed by the authors of this paper and the results are planned to be published soon.

Author Contributions

Conceptualization, P.R. and B.P.; methodology, P.R. and B.P.; software, W.K. and J.S.; validation, P.R., B.P. and F.S.; formal analysis, W.K., P.R. and B.P.; investigation, W.K., J.S., F.S. and K.S.; data curation, W.K. and P.R.; writing—original draft preparation, W.K., P.R. and B.P.; writing—review and editing, W.K. and P.R.; visualization, W.K., P.R., B.P. and K.S.; supervision, P.R. and B.P.; project administration, P.R. All authors have read and agreed to the published version of the manuscript.

Funding

This research received no external funding.

Data Availability Statement

The data presented in this study are available on request from the corresponding author.

Conflicts of Interest

The authors declare no conflict of interest.

References

  1. Aththanayake, L.; Hosseinzadeh, N.; Gargoom, A.; Alhelou, H.H. Power system reduction techniques for planning and stability studies: A review. Electr. Power Syst. Res. 2024, 227 Pt A, 109917. [Google Scholar] [CrossRef]
  2. Li, Y.; Ge, Y.; Xu, T.; Zhu, M.; He, Z. Controllability evaluation of complex networks in cyber–physical power systems via critical nodes and edges. Int. J. Electr. Power Energy Syst. 2024, 155 Pt B, 109625. [Google Scholar] [CrossRef]
  3. Doukas, H.; Xidonas, P.; Angelopoulos, D.; Askounis, D.; Psarras, J. Distribution Transformers Failures: How does it cost? Evidence from Greece. Energy Syst. 2016, 7, 601–613. [Google Scholar] [CrossRef]
  4. Thiviyanathan, V.A.; Ker, P.J.; Leong, Y.S.; Abdullah, F.; Ismail, A.; Jamaludin, M.Z. Power transformer insulation system: A review on the reactions, fault detection, challenges and future prospects. Alex. Eng. J. 2022, 61, 7697–7713. [Google Scholar] [CrossRef]
  5. Xiao, J.; Liu, R.; She, B.; He, G.; Liang, Z.; Cai, Z. The influence mechanism of substation transformer on total supply capability (TSC) of distribution networks. Electr. Power Syst. Res. 2024, 228, 110092. [Google Scholar] [CrossRef]
  6. Meng, T.; Li, Y.; Li, P.; Wang, X.; Hou, B.; Yu, Z. Research on distribution of winding leakage magnetic field of three-phase dry type transformer under short-circuit condition. Energy Rep. 2023, 9, 1108–1115. [Google Scholar] [CrossRef]
  7. Rao, U.M.; Fofana, I.; Rozga, P.; Beroual, A.; Malde, J.; Martin, R.; Wang, F.; Casserly, E.; Pompili, M.; Calcara, L. Next Generation Insulating Liquids Prepared by the International working Group of IEEE DEIS Technical Committee on Liquid Dielectrics. In Proceedings of the 2022 IEEE 21st International Conference on Dielectric Liquids (ICDL), Sevilla, Spain, 29 May–2 June 2022; pp. 1–4. [Google Scholar]
  8. Sanz, J.; Renedo, C.J.; Ortiz, A.; Quintanilla, P.J.; Ortiz, F.; García, D.F. A Brief Review of the Impregnation Process with Dielectric Fluids of Cellulosic Materials Used in Electric Power Transformers. Energies 2023, 16, 3673. [Google Scholar] [CrossRef]
  9. Rozga, P.; Kraslawski, A.; Klarecki, A.; Romanowski, A.; Krysiak, W. A New Approach for Decision Support of the Selection of Construction Technology of High-Voltage Substations Based on AHP Method. IEEE Access 2021, 9, 73413–73423. [Google Scholar] [CrossRef]
  10. Wang, Y.; Peng, M.; Jin, W.; Liu, T.; Wang, Y. Feasibility study on substitution of SF6 insulated current transformer with environment-friendly natural gas. Energy Rep. 2023, 9, 1784–1792. [Google Scholar] [CrossRef]
  11. Fofana, I. 50 years in the development of insulating liquids. IEEE Electr. Insul. Mag. 2013, 29, 13–25. [Google Scholar] [CrossRef]
  12. Liu, Q.; Wang, Z.D. Breakdown and withstand strengths of ester transformer liquids in a quasi-uniform field under impulse voltages. IEEE Trans. Dielectr. Electr. Insul. 2013, 20, 571–579. [Google Scholar] [CrossRef]
  13. Ab Ghani, S.; Muhamad, N.A.; Noorden, Z.A.; Zainuddin, H.; Abu Bakar, N.; Talib, M.A. Methods for improving the workability of natural ester insulating oils in power transformer applications: A review. Electr. Power Syst. Res. 2018, 163, 655–667. [Google Scholar] [CrossRef]
  14. Reffas, A.; Moulai, H.; Béroual, A. Comparison of dielectric properties of olive oil, mineral oil, and other natural and synthetic ester liquids under AC and lightning impulse stresses. IEEE Trans. Dielectr. Electr. Insul. 2018, 25, 1822–1830. [Google Scholar] [CrossRef]
  15. Loiselle, L.; Rao, U.M.; Fofana, I. Influence of Aging on Oil Degradation and Gassing Tendency for Mineral oil and Synthetic Ester under Low Energy Discharge Electrical Faults. Energies 2020, 13, 595. [Google Scholar] [CrossRef]
  16. Gautam, L.; Vinu, R.; Gardas, R.L.; Sarathi, R.; Fofana, I.; Rao, U.M. Rheological Analysis of Thermally Aged Natural Ester Fluid Using Nonlinear Least Square Technique. IEEE Trans. Dielectr. Electr. Insul. 2023, 30, 1632–1640. [Google Scholar] [CrossRef]
  17. Rao, U.M.; Fofana, I.; Beroual, A.; Rozga, P.; Pompili, M.; Calcara, L.; Rapp, K.J. A review on pre-breakdown phenomena in ester fluids: Prepared by the international study group of IEEE DEIS liquid dielectrics technical committee. IEEE Trans. Dielectr. Electr. Insul. 2020, 27, 1546–1560. [Google Scholar] [CrossRef]
  18. Rozga, P.; Stuchala, F.; Pahlanvapour, B.; Wolmarans, C. Lightning Impulse Breakdown Characteristics of a Bio-Based Hydrocarbon and Other Insulating Liquids under Positive Polarity. In Proceedings of the 2022 IEEE 21st International Conference on Dielectric Liquids (ICDL), Sevilla, Spain, 29 May–2 June 2022; pp. 1–4. [Google Scholar]
  19. Stuchala, F.; Rozga, P. Breakdown and Acceleration Voltage of Selected GTL based Dielectric Liquids under Negative Lightning Impulse. In Proceedings of the 2023 IEEE 22nd International Conference on Dielectric Liquids (ICDL), Worcester, MA, USA, 25–28 June 2023; pp. 1–4. [Google Scholar]
  20. Haegele, S.; Vahidi, F.; Tenbohlen, S.; Rapp, K.J.; Sbravati, A. Lightning Impulse Withstand of Natural Ester Liquid. Energies 2018, 11, 1964. [Google Scholar] [CrossRef]
  21. Rozga, P.; Stuchala, F.; Wolmarans, C.; Milone, M. Inception and Breakdown Voltage of the Oil-Wedge Type Electrode Model Insulated with Bio-based Hydrocarbon and Mineral Oil. In Proceedings of the 2023 IEEE 22nd International Conference on Dielectric Liquids (ICDL), Worcester, MA, USA, 25–28 June 2023; pp. 1–4. [Google Scholar]
  22. Sbravati, A.; Rapp, K.J.; Schmitt, P.; Krause, C. Transformer insulation structure for dielectric liquids with higher permittivity. In Proceedings of the 2017 IEEE 19th International Conference on Dielectric Liquids (ICDL), Manchester, UK, 25–29 June 2017; pp. 1–4. [Google Scholar]
  23. Rozga, P.; Hantsz, D. Influence of volume effect on electrical discharge initiation in mineral oil in the setup of insulated electrodes. Electr. Eng. 2017, 99, 179–186. [Google Scholar] [CrossRef]
  24. Wilson, W.R. A Fundamental Factor Controlling the Unit Dielectric Strength of Oil. AIEE Trans. 1953, 72, 68–74. [Google Scholar]
  25. Gabrić, P.; Orešković, A.; Kuprešanin, V.; Mikulecky, A.; Podobnik, V. Stressed Oil Volume Theory in Transformer Winding Corner Stress Analysis. In 5th International Colloquium on Transformer Research and Asset Management; Lecture Notes in Electrical Engineering; Trkulja, B., Štih, Ž., Janić, Ž., Eds.; Springer: Berlin/Heidelberg, Germany, 2020; Volume 671. [Google Scholar]
  26. Umemoto, T.; Kainaga, S.; Tsurimoto, T.; Muto, H.; Ishikura, T.; Sugitani, N.; Morita, N.; Kozako, M.; Hikita, M. Oil Gap Dependence of Partial Discharge Starting Point in the Oil/Pressboard Composite Insulation System. In Proceedings of the 2012 15th International Conference on Electrical Machines and Systems (ICEMS), Sapporo, Japan, 21–24 October 2012; pp. 1–5. [Google Scholar]
  27. IEC 60897:1987; Methods for the Determination of the Lightning Breakdown Voltage of Insulating Liquids. International Electrotechnical Commission: Geneva, Switzerland, 2018.
  28. Chen, G.; Li, J.; Wang, F.; Huang, Z.; Dan, L.; Duan, Y. Branching Initial Streamers to Inhibit the Streamer Propagation in Natural Ester-based Nanofluid. IEEE Trans. Dielectr. Electr. Insul. 2021, 28, 116–123. [Google Scholar] [CrossRef]
  29. Sanz, P.J.; Sancibrián, O.; Olmo, C.; Méndez, C.; Ortiz, A.; Renedo, C.J. Study of the Impregnation of Power-Transformer Cellulosic Materials with Dielectric Ester Oils. IEEE Access 2021, 9, 124023–124032. [Google Scholar] [CrossRef]
  30. Zukowski, P.; Rogalski, P.; Kołtunowicz, T.N.; Kierczynski, K.; Zenker, M.; Pogrebnjak, A.D.; Kucera, M. DC and AC Tests of Moisture Electrical Pressboard Impregnated with Mineral Oil or Synthetic Ester—Determination of Water Status in Power Transformer Insulation. Energies 2022, 15, 2859. [Google Scholar] [CrossRef]
  31. Zukowski, P.; Kierczynski, K.; Okal, P.; Rogalski, P.; Zenker, M.; Pajak, R.; Molenda, P.; Szrot, M.; Koltunowicz, T.N. Research on Changes in the Phase Shift Angle and Admittance of the Cellulose–Bio-Oil Composite under the Influence of Increasing Moisture during the Long-Term Operation of Power Transformers. Energies 2023, 16, 7880. [Google Scholar] [CrossRef]
  32. Goscinski, P.; Nadolny, Z.; Tomczewski, A.; Nawrowski, R.; Boczar, T. The Influence of Heat Transfer Coefficient α of Insulating Liquids on Power Transformer Cooling Systems. Energies 2023, 16, 2627. [Google Scholar] [CrossRef]
Figure 1. Measurement setup used during the tests: LIG—lightning impulse Marx generator, R—limiting resistor, VD—voltage divider, PMT—photomultiplier, OSC—digital oscilloscope, PVM—peak value meter.
Energies 17 00782 g001
Figure 2. A schematic view on a fragment of the main insulation of the transformer with the indicated, by red arrow, place modeled by the electrode system selected for testing.
Energies 17 00782 g002
Figure 3. The scheme of electrode system used in the measurements; values are given in mm: (a) front profile, (b) side profile.
Energies 17 00782 g003
Figure 4. Selected examples of the registered oscillogram for distinctive voltage levels up to breakdown from one measurement series; blue course—voltage (100 kV/div.), red course—light (arb. units), t = 4 µs/div., tb—time to breakdown: (a) 102 kV, (b) 104 kV, (c) 108 kV, (d) 112 kV.
Energies 17 00782 g004
Figure 5. Weibull plots for LIBV; blue color—synthetic ester, green color—bio-based hydrocarbon, red color—inhibited mineral oil; (a) 2 mm, (b) 4 mm, (c) 6 mm, (d) 8 mm.
Energies 17 00782 g005
Figure 6. Relationship between 5% LIBV and gap distance with calculated regression lines; points means the values obtained from experiment.
Energies 17 00782 g006
Figure 7. Relationship between average LIBV (Vb) and gap distance (d) based on real measurement data and calculation using Formula (1)—mineral oil; points mean selected gap distances used for calculation of fitting curve represented by line.
Energies 17 00782 g007
Figure 8. Relationship between average LIBV (Vb) and gap distance (d) based on real measurement data and calculation using Formula (1)—bio-based hydrocarbon; points mean selected gap distances used for calculation of fitting curve represented by line.
Energies 17 00782 g008
Figure 9. Relationship between average LIBV (Vb) and gap distance (d) based on real measurement data and calculation using Formula (1)—synthetic ester; points mean selected gap distances used for calculation of fitting curve represented by line.
Energies 17 00782 g009
Figure 10. The model prepared for the numerical simulations with assigned mesh (yellow background); “no mesh” means the parts (HV electrode and grounded electrode) that were not calculated in terms of electric field distribution, “preszpan” means insulating pressboard used in experiment.
Energies 17 00782 g010
Figure 11. Results of the electric field distribution for the model with mineral oil as dielectric liquid: (a) 2 mm, (b) 6 mm.
Energies 17 00782 g011
Figure 12. Results of the electric field distribution for the model with bio-based hydrocarbon as dielectric liquid: (a) 2 mm, (b) 6 mm.
Energies 17 00782 g012
Figure 13. Results of the electric field distribution for the model with synthetic ester as dielectric liquid: (a) 2 mm, (b) 6 mm.
Energies 17 00782 g013
Figure 14. Electric field distribution along the axis marked by the center of the HV electrode for a 2 mm gap distance.
Energies 17 00782 g014
Figure 15. Electric field distribution along the axis marked by the center of the HV electrode for a 6 mm gap distance.
Energies 17 00782 g015
Table 1. Selected fundamental parameters of the tested liquids based on their datasheets.
ParameterMOBIOSE
Chemical classificationComplex Mixture of HydrocarbonsHydrocarbons
(Iso-Alkanes)
Ester
(Pentaerythritol
Based)
Density at 20 °C
(kg/dm3)
0.870.780.97
Kinematic viscosity at 40 °C
(mm2/s)
9.13.729
Flash point
(°C)
146145260
Pour point
(°C)
−54−63−56
Biodegradability
(-)
I—Inherently
biodegradable
I—Inherently
biodegradable
R—Readily
biodegradable
Bio-based carbon
content
(%)
0≈99≈50
Table 2. Selected fundamental parameters of the liquids tested measured before beginning of the experiment.
ParameterMOBIOSE
AC BDV
(kV)
78.980.482.9
Moisture content
(ppm)
4.95.062.1
DDF at 90 °C
(-)
0.00050.00040.026
Electrical permittivity
(-)
2.22.03.2
Table 3. Average values of LIBV for the liquids under test and considered gap distances.
Gap Distance (d)
(mm)
LIBV (kV)
MOBIOSE
2132.72118.44102.30
4156.94156.46108.52
6165.26189.64113.92
8180.56219.88122.06
Table 4. Data from Table 3 transformed using natural logarithm.
ln(d)
(mm)
ln (LIBV) (kV)
MOBIOSE
0.634.894.774.63
1.395.065.054.69
1.795.115.254.74
2.085.205.394.80
Table 5. Calculated values of constants n and A for determining the Vb(d) curves.
Constant TypeLiquid Type
MOBIOSE
A116.00287.7995.474
n0.2040.4260.097
Table 6. Input data used in simulations.
Liquid TypeElectrical
Permittivity
of the Liquid
Electrical
Permittivity
of the Pressboard
Gap Distance (mm)HV Electrode
Potential
(kV)
Number of Mesh Nodes
MO2.24.42132.72155,444
6165.26155,196
BIO2.04.12118.4155,444
6189.64155,196
SE3.24.62102.30155,444
6113.92155,196
Disclaimer/Publisher’s Note: The statements, opinions and data contained in all publications are solely those of the individual author(s) and contributor(s) and not of MDPI and/or the editor(s). MDPI and/or the editor(s) disclaim responsibility for any injury to people or property resulting from any ideas, methods, instructions or products referred to in the content.

