
Experimental and Modeling Analysis of Thermal Runaway for LiNi0.5Mn0.3Co0.2O2/Graphite Pouch Cell Triggered by Surface Heating


Abstract
1. Introduction
2. Experiment
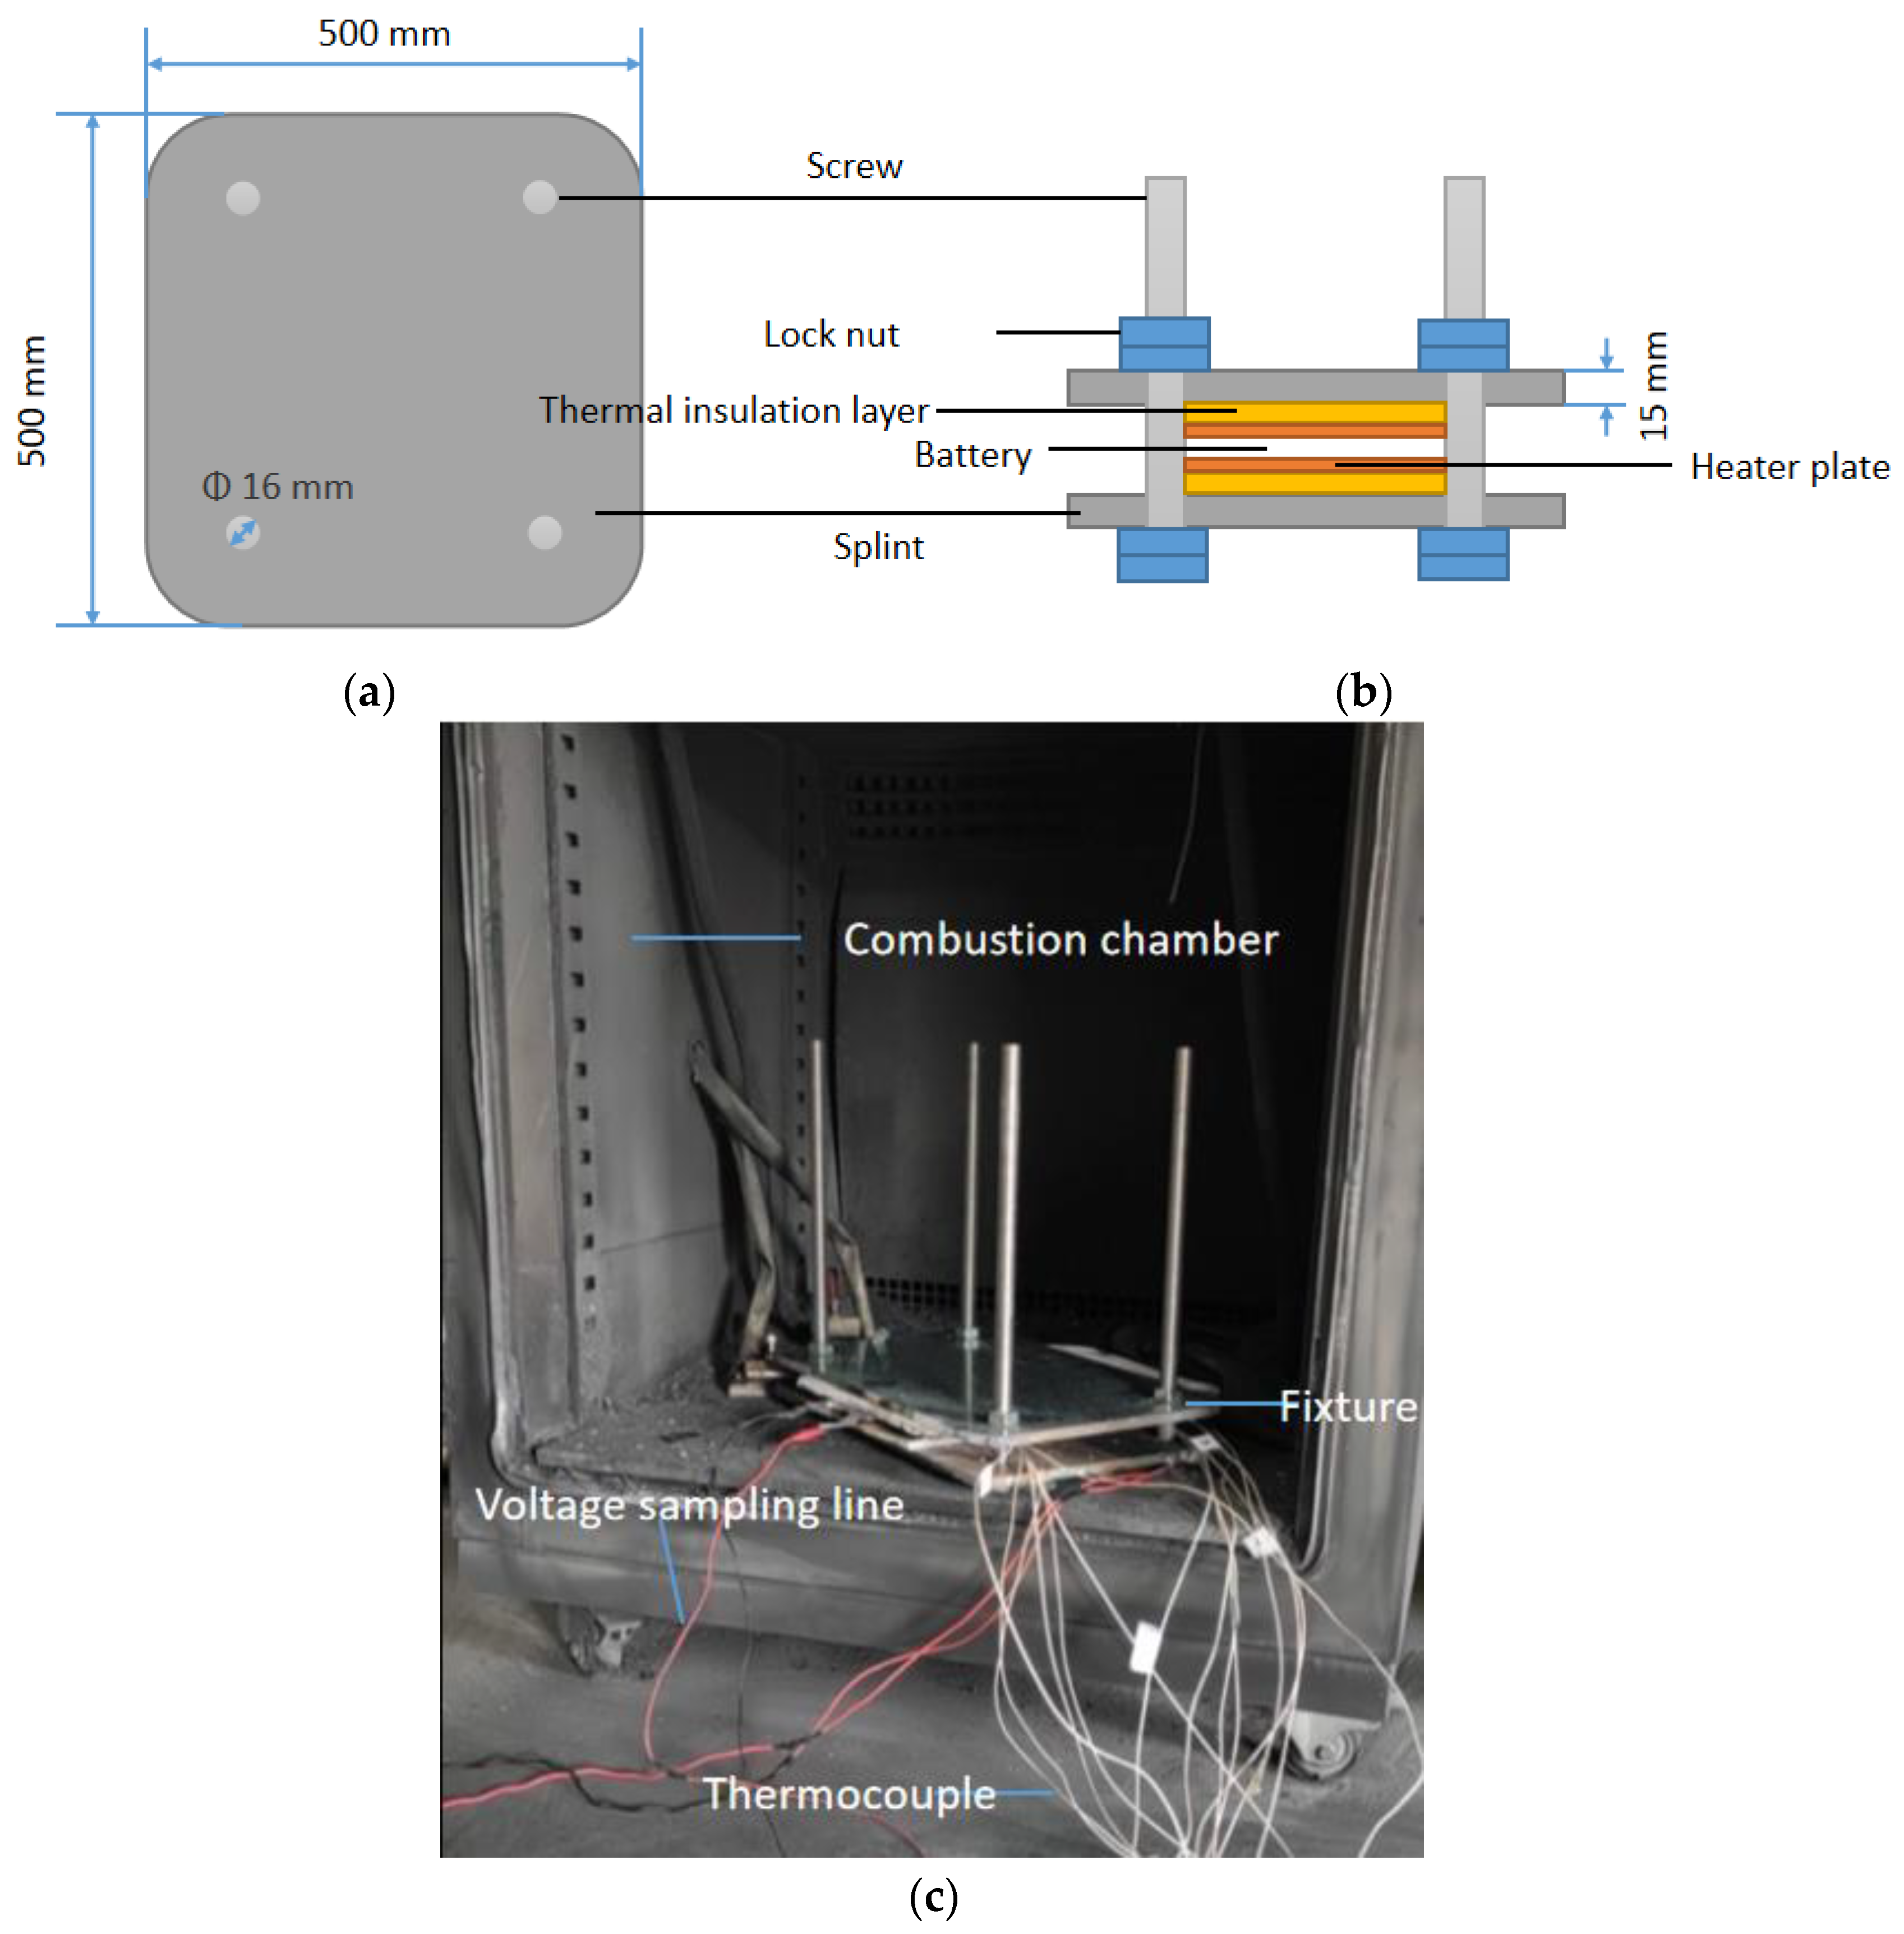
2.1. Fixture Design
2.2. Experimental Setup
2.3. Experimental Results and Analysis
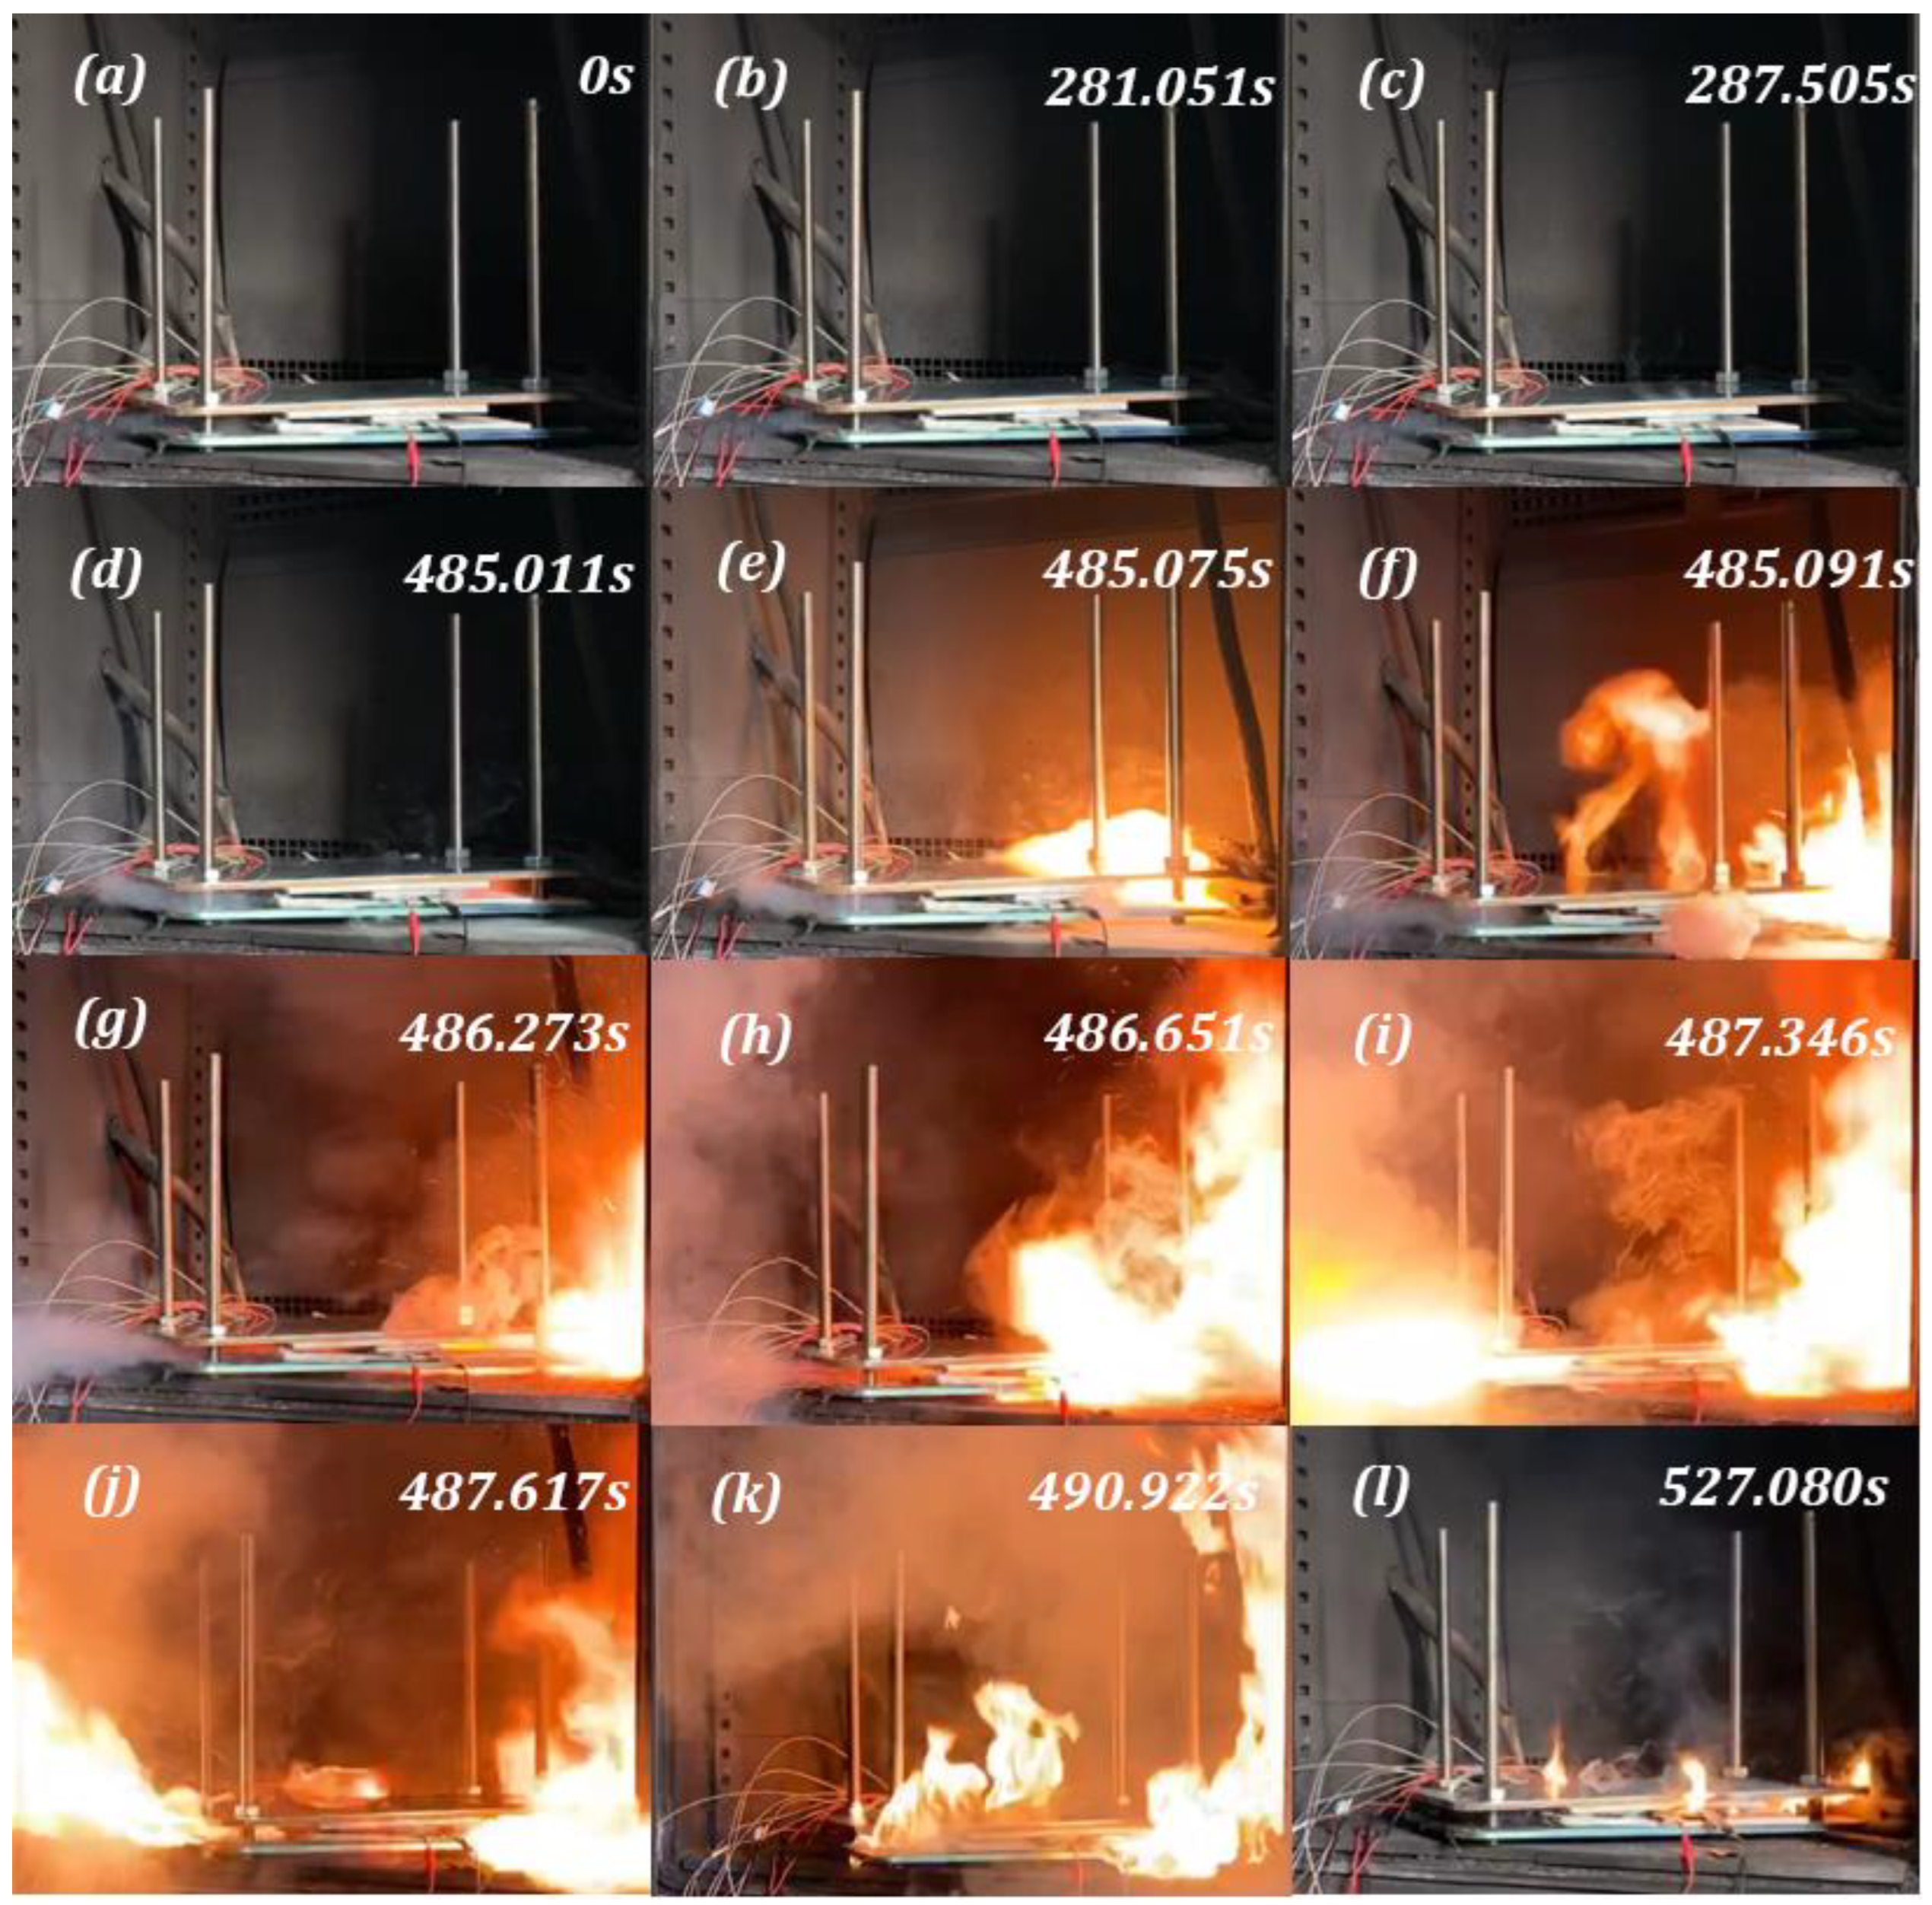
2.3.1. Combustion Behavior
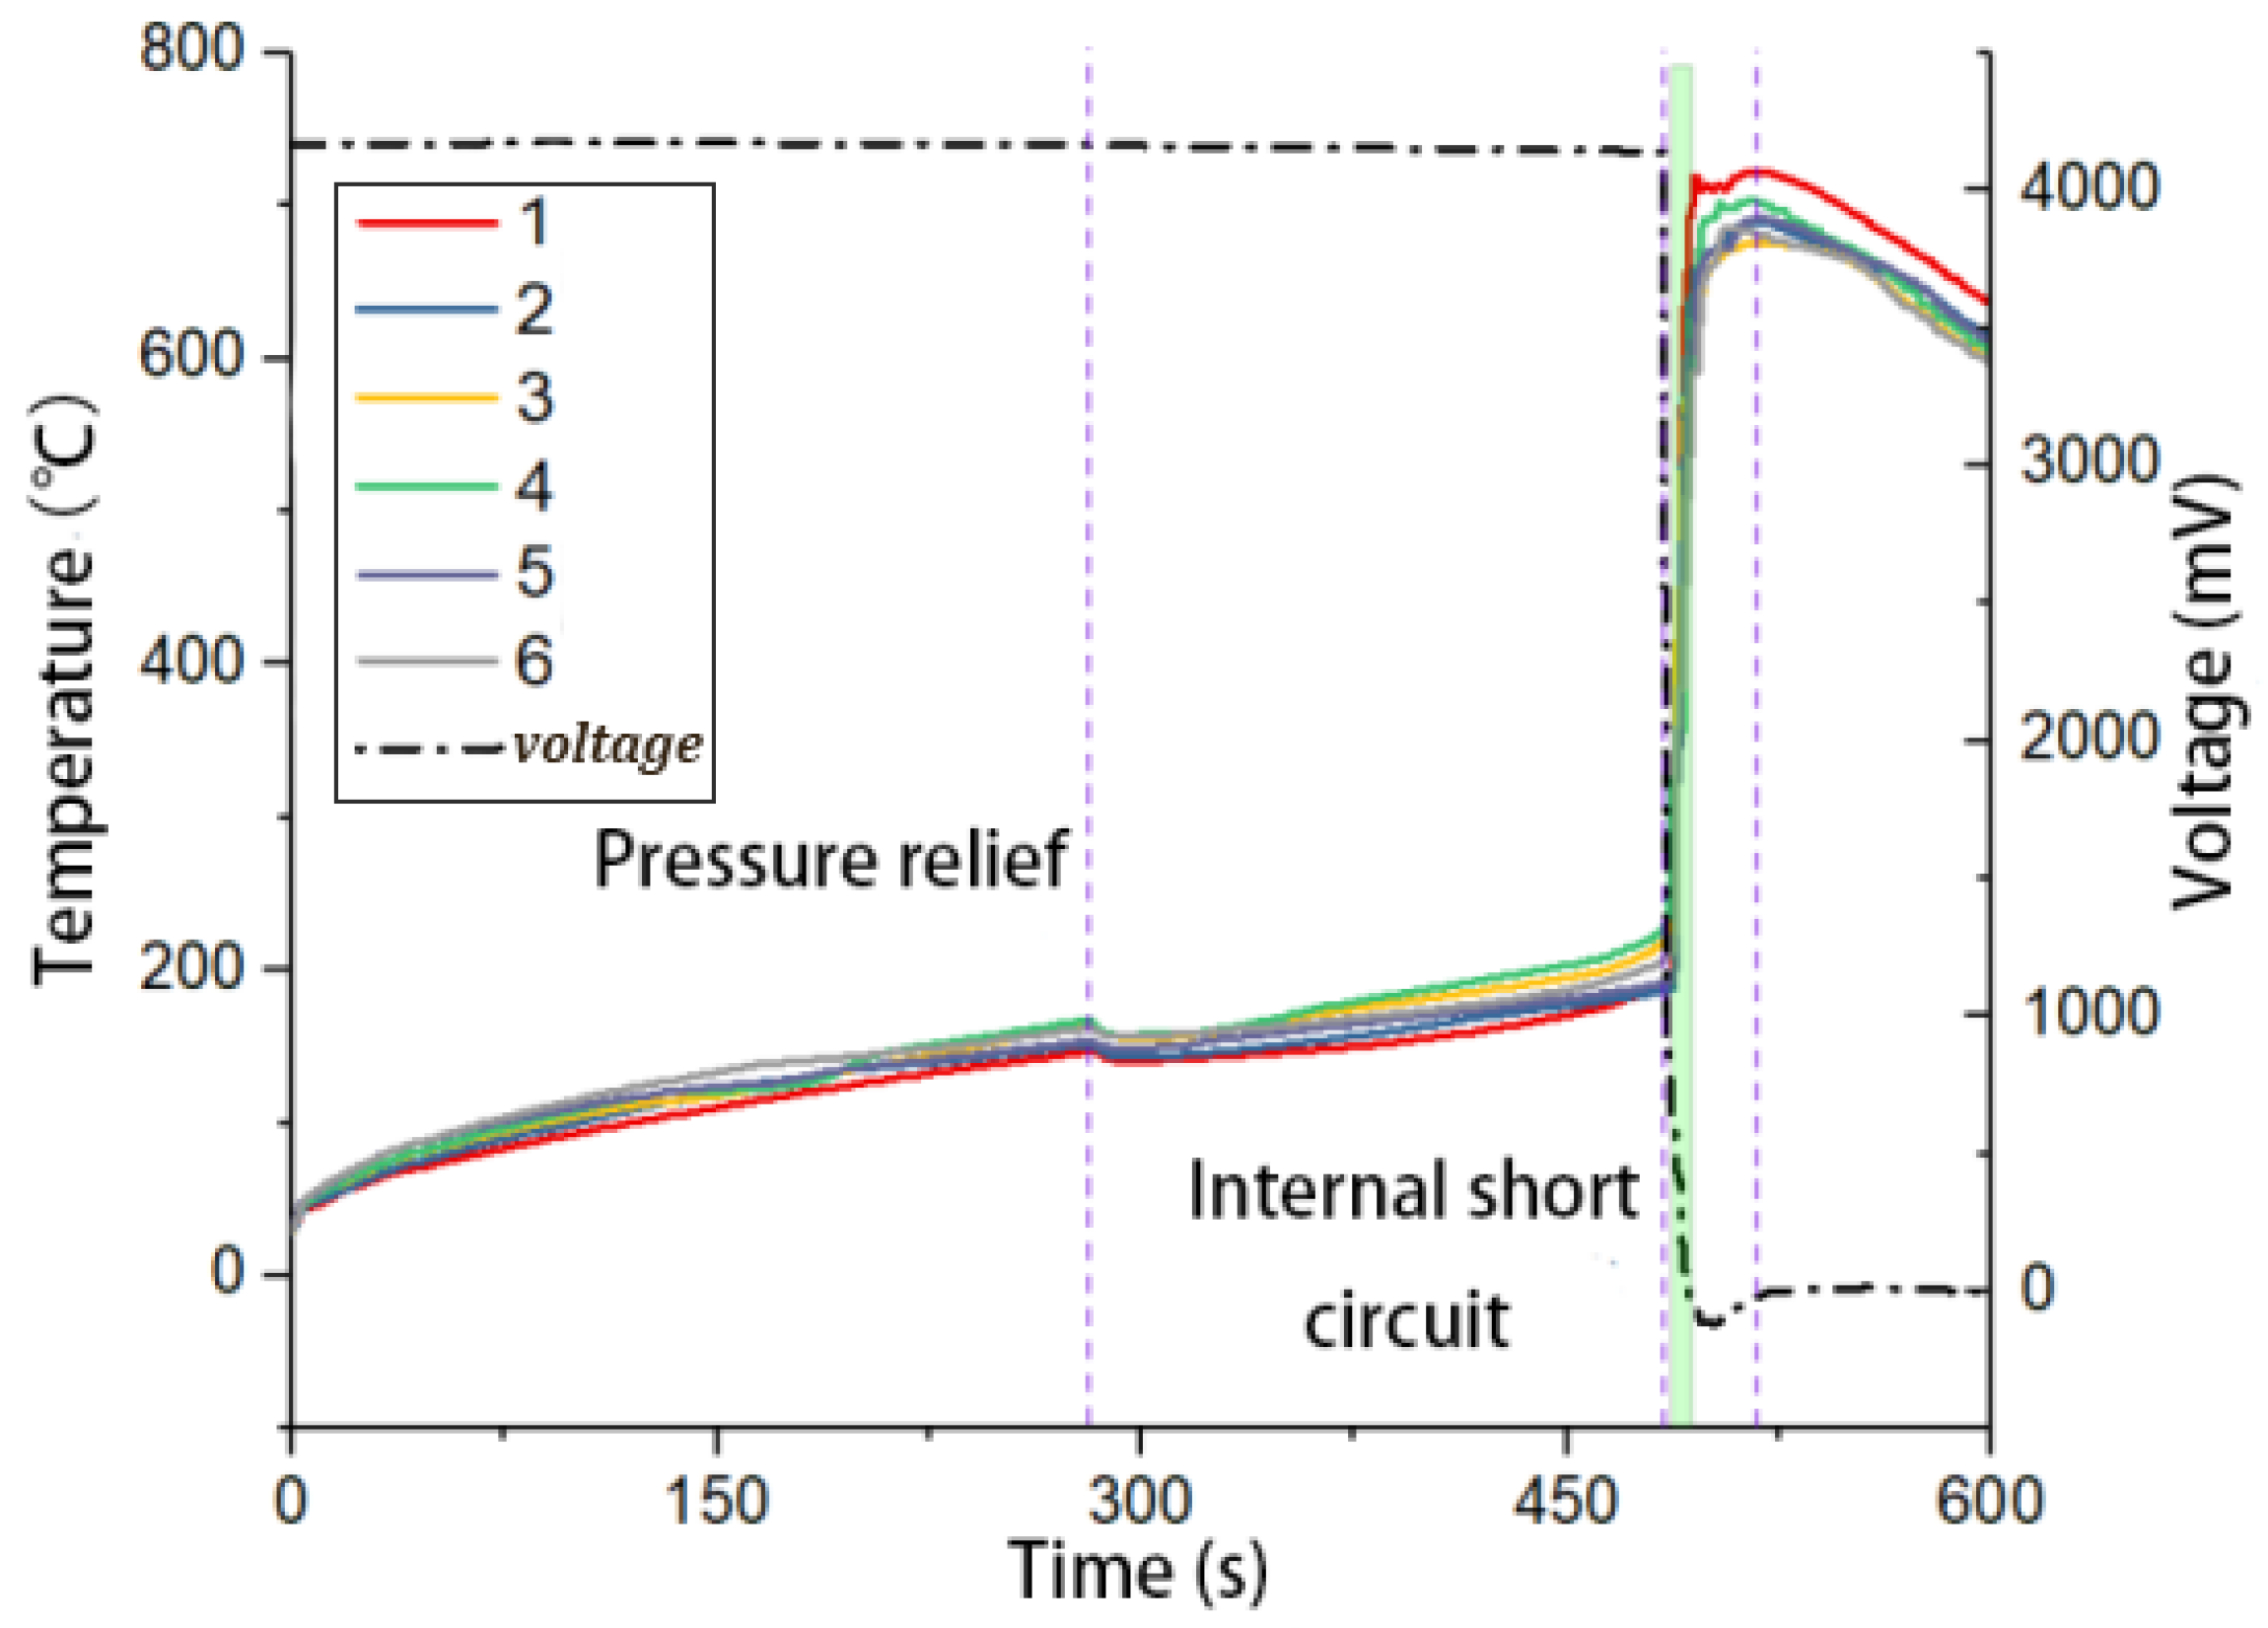
2.3.2. Temperature and Voltage Characteristics
3. Analysis of TR Model Triggered by Surface Heating
3.1. Thermal Model
3.1.1. Side Reaction
3.1.2. Electrical Energy Release
3.1.3. The Rate of Heat Transfer
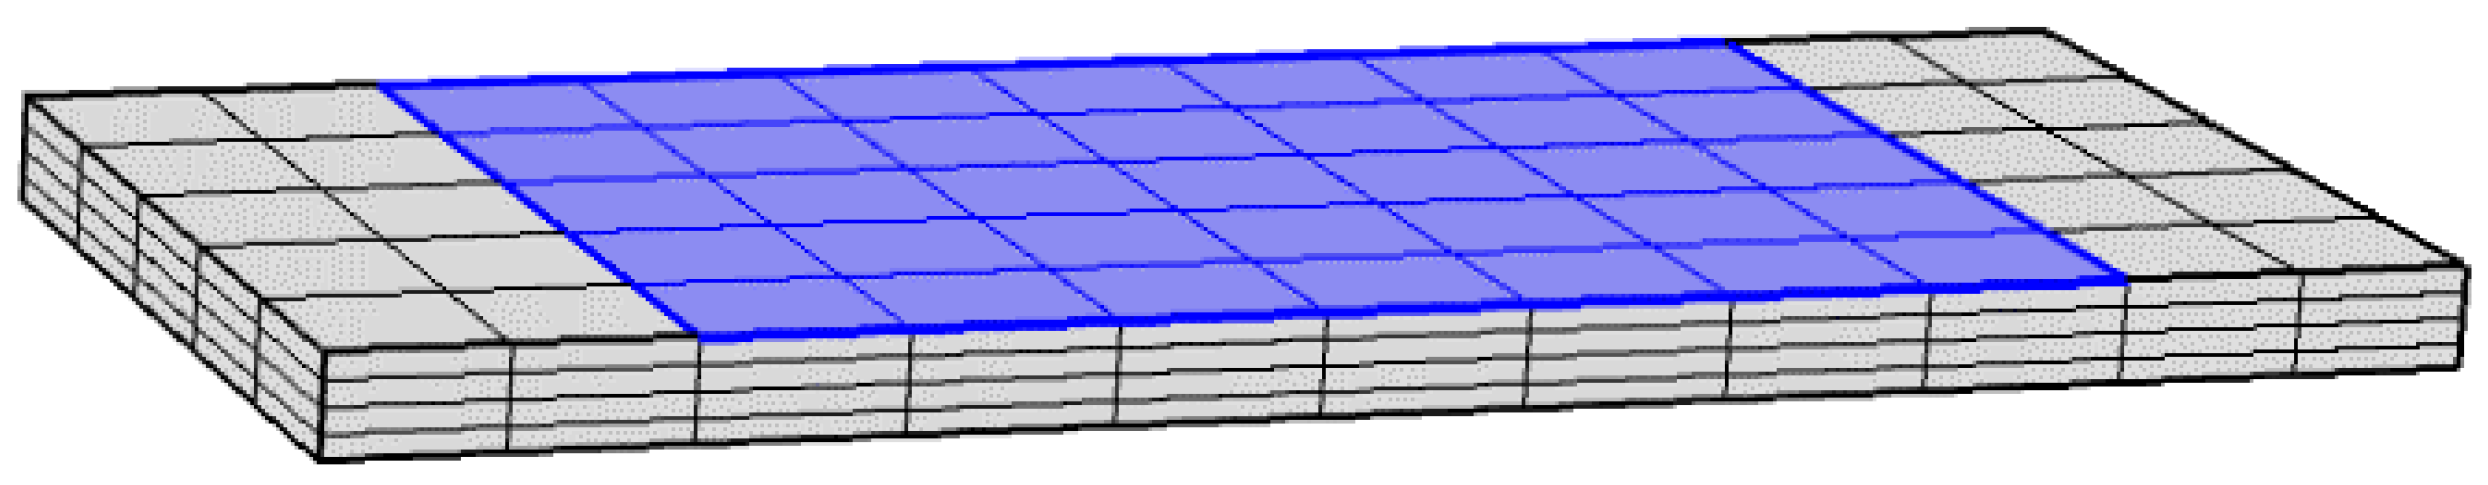
3.2. The Simplification and Configuration of the Model
- The battery is simplified as a homogeneous body.
- The thermal physical properties inside the battery do not change with temperature.
- The model does not consider the influence of active substances and smoke ejection on battery temperature during TR processes.
- The insulating surfaces wrapped with asbestos on the top and bottom of the battery are considered to have no heat exchange.
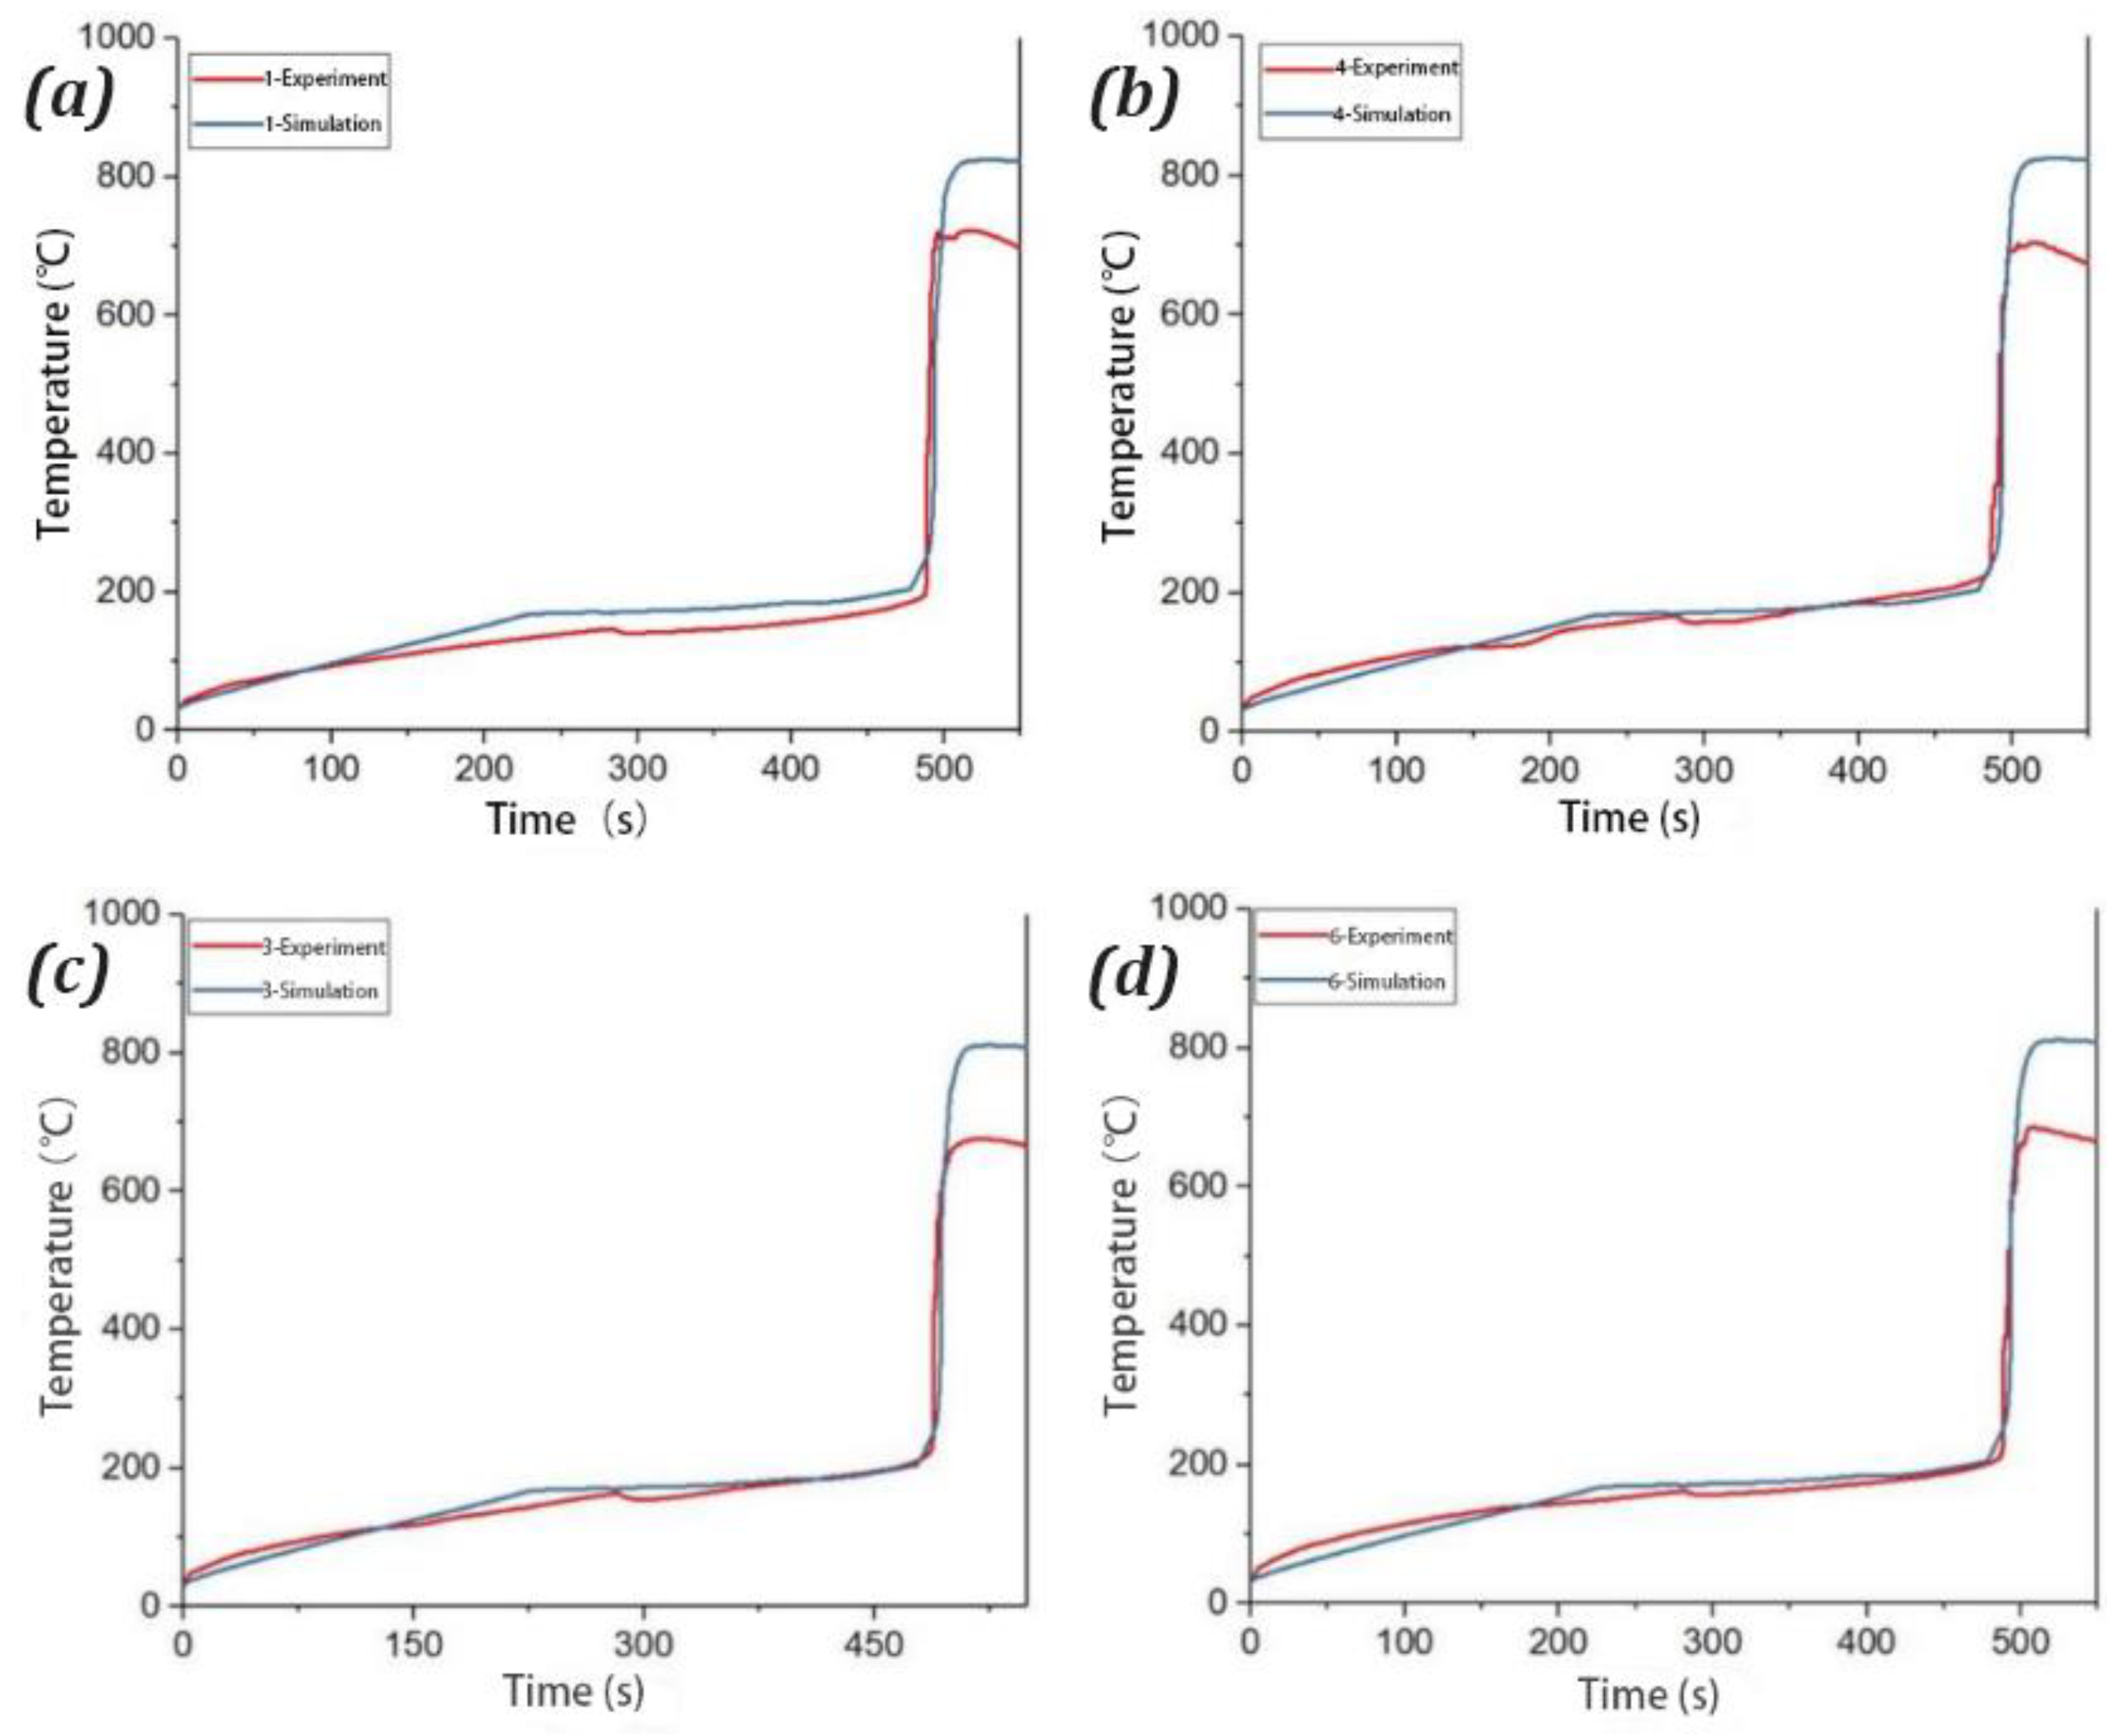
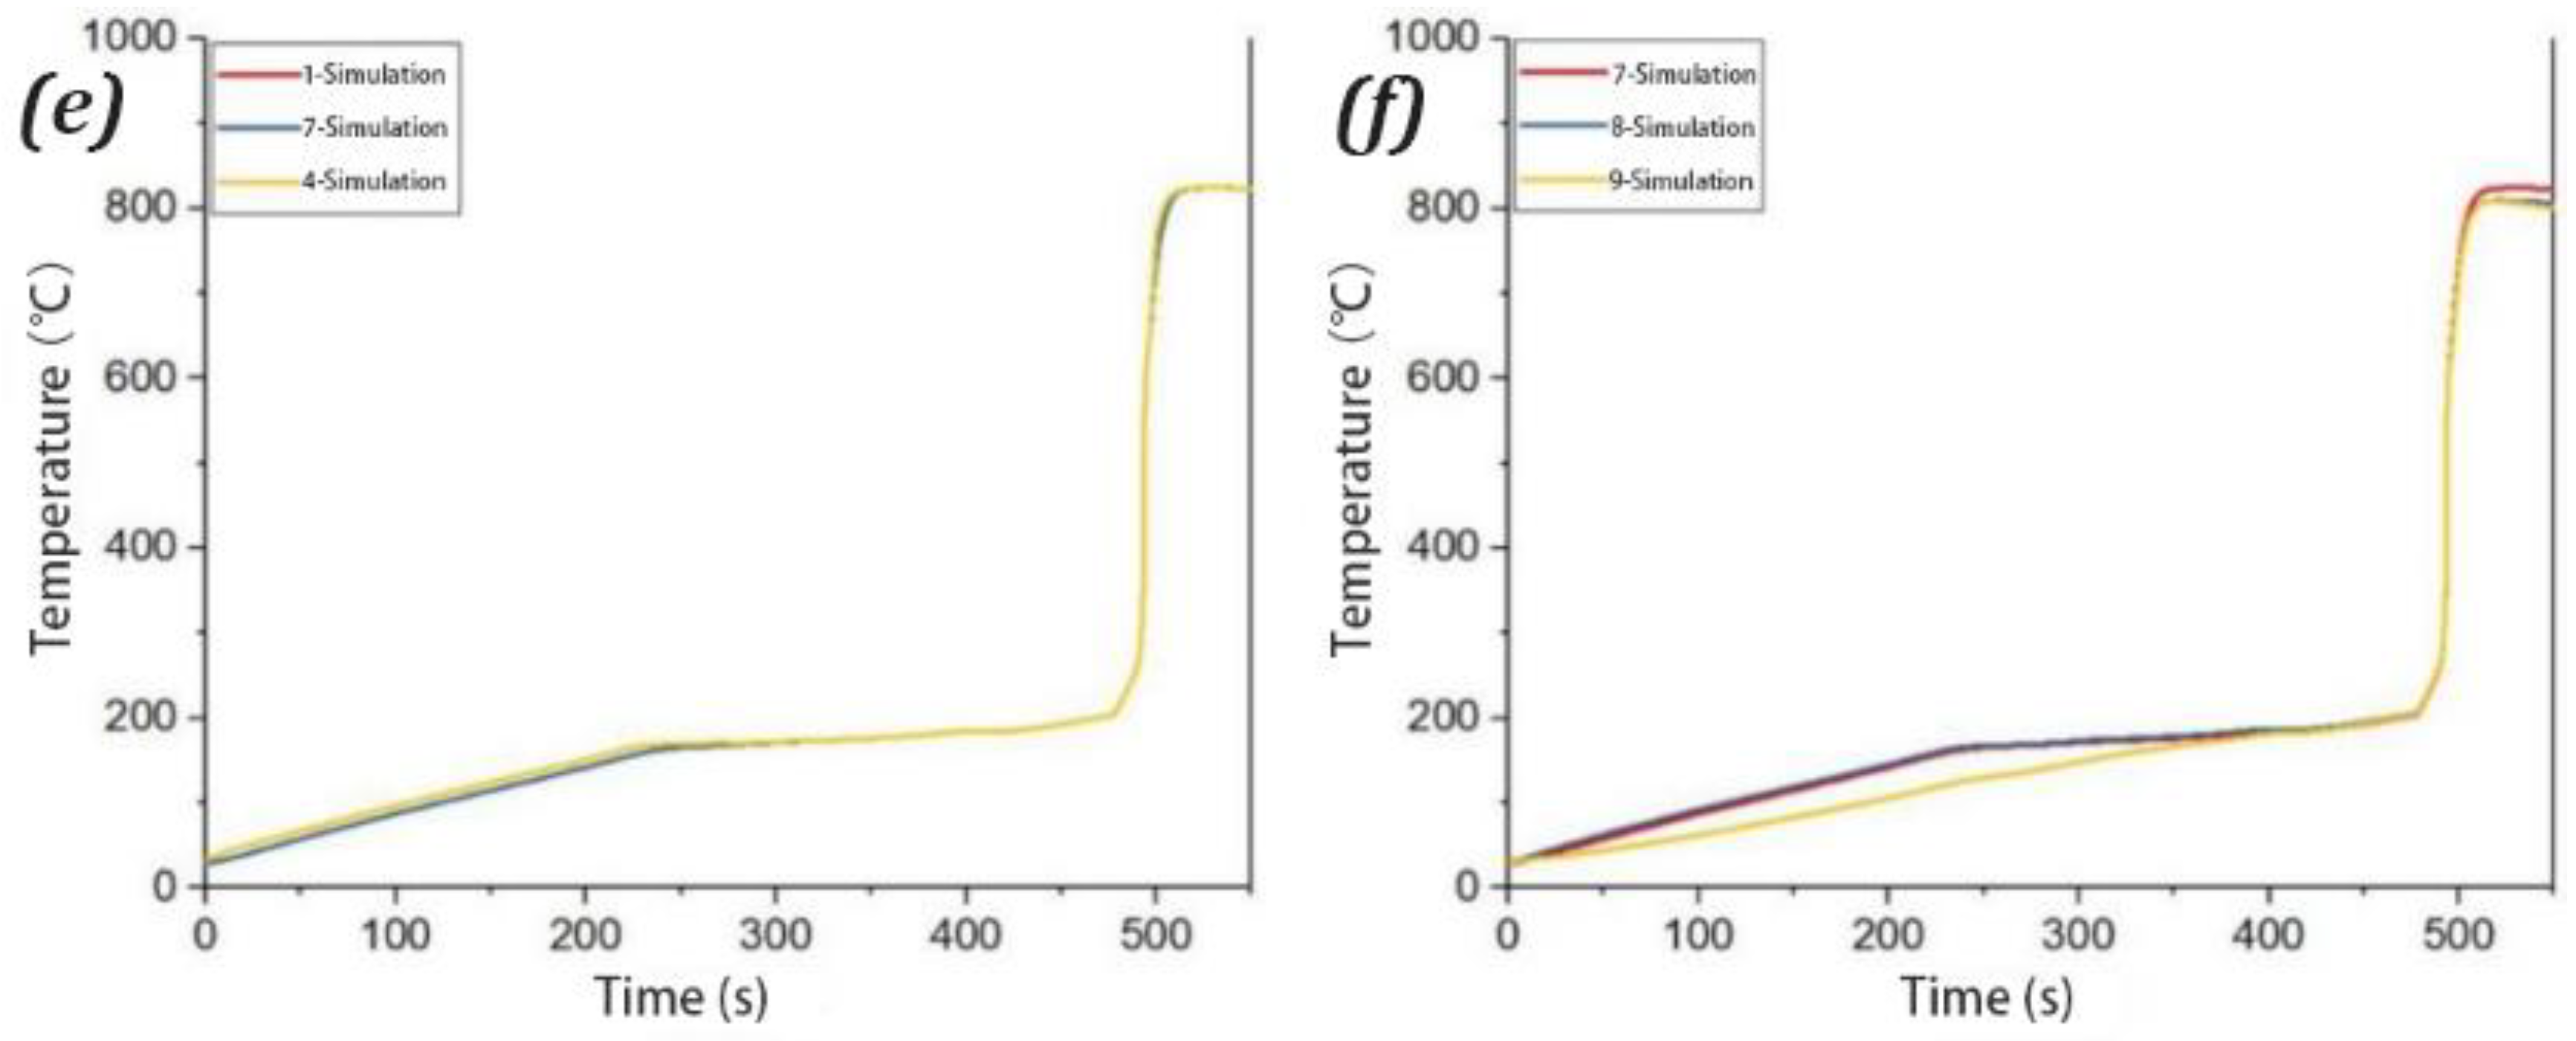
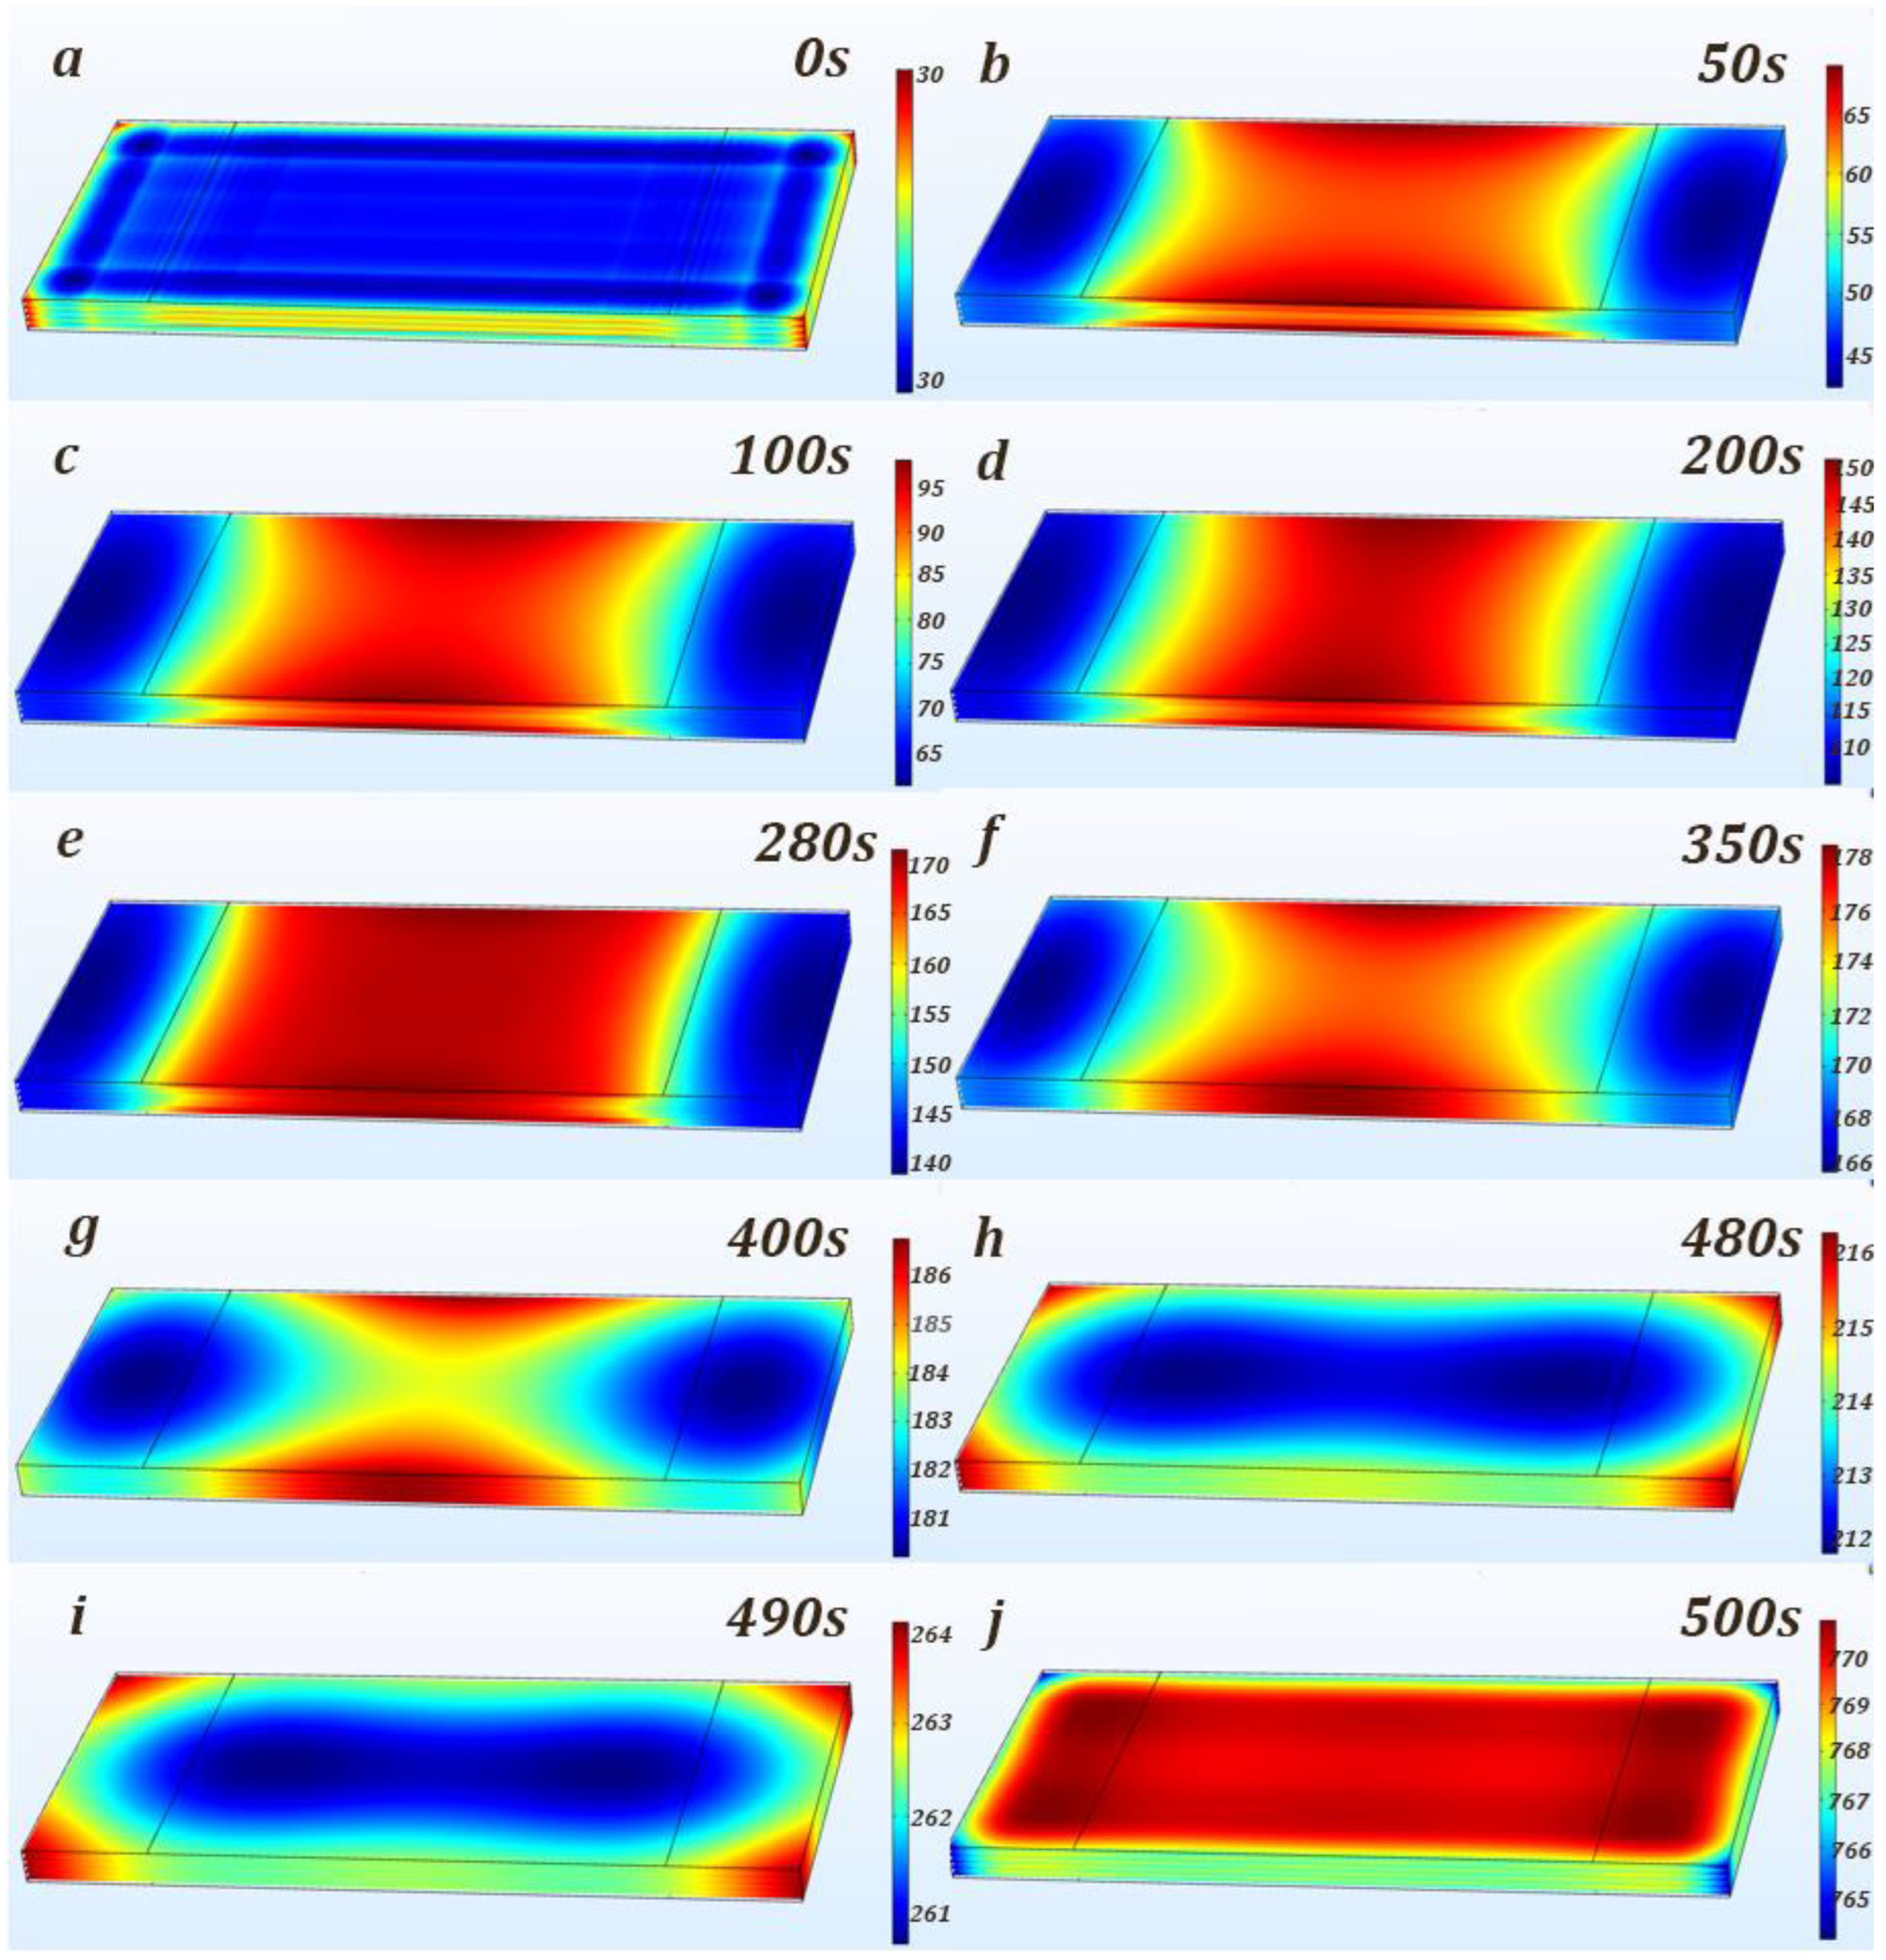
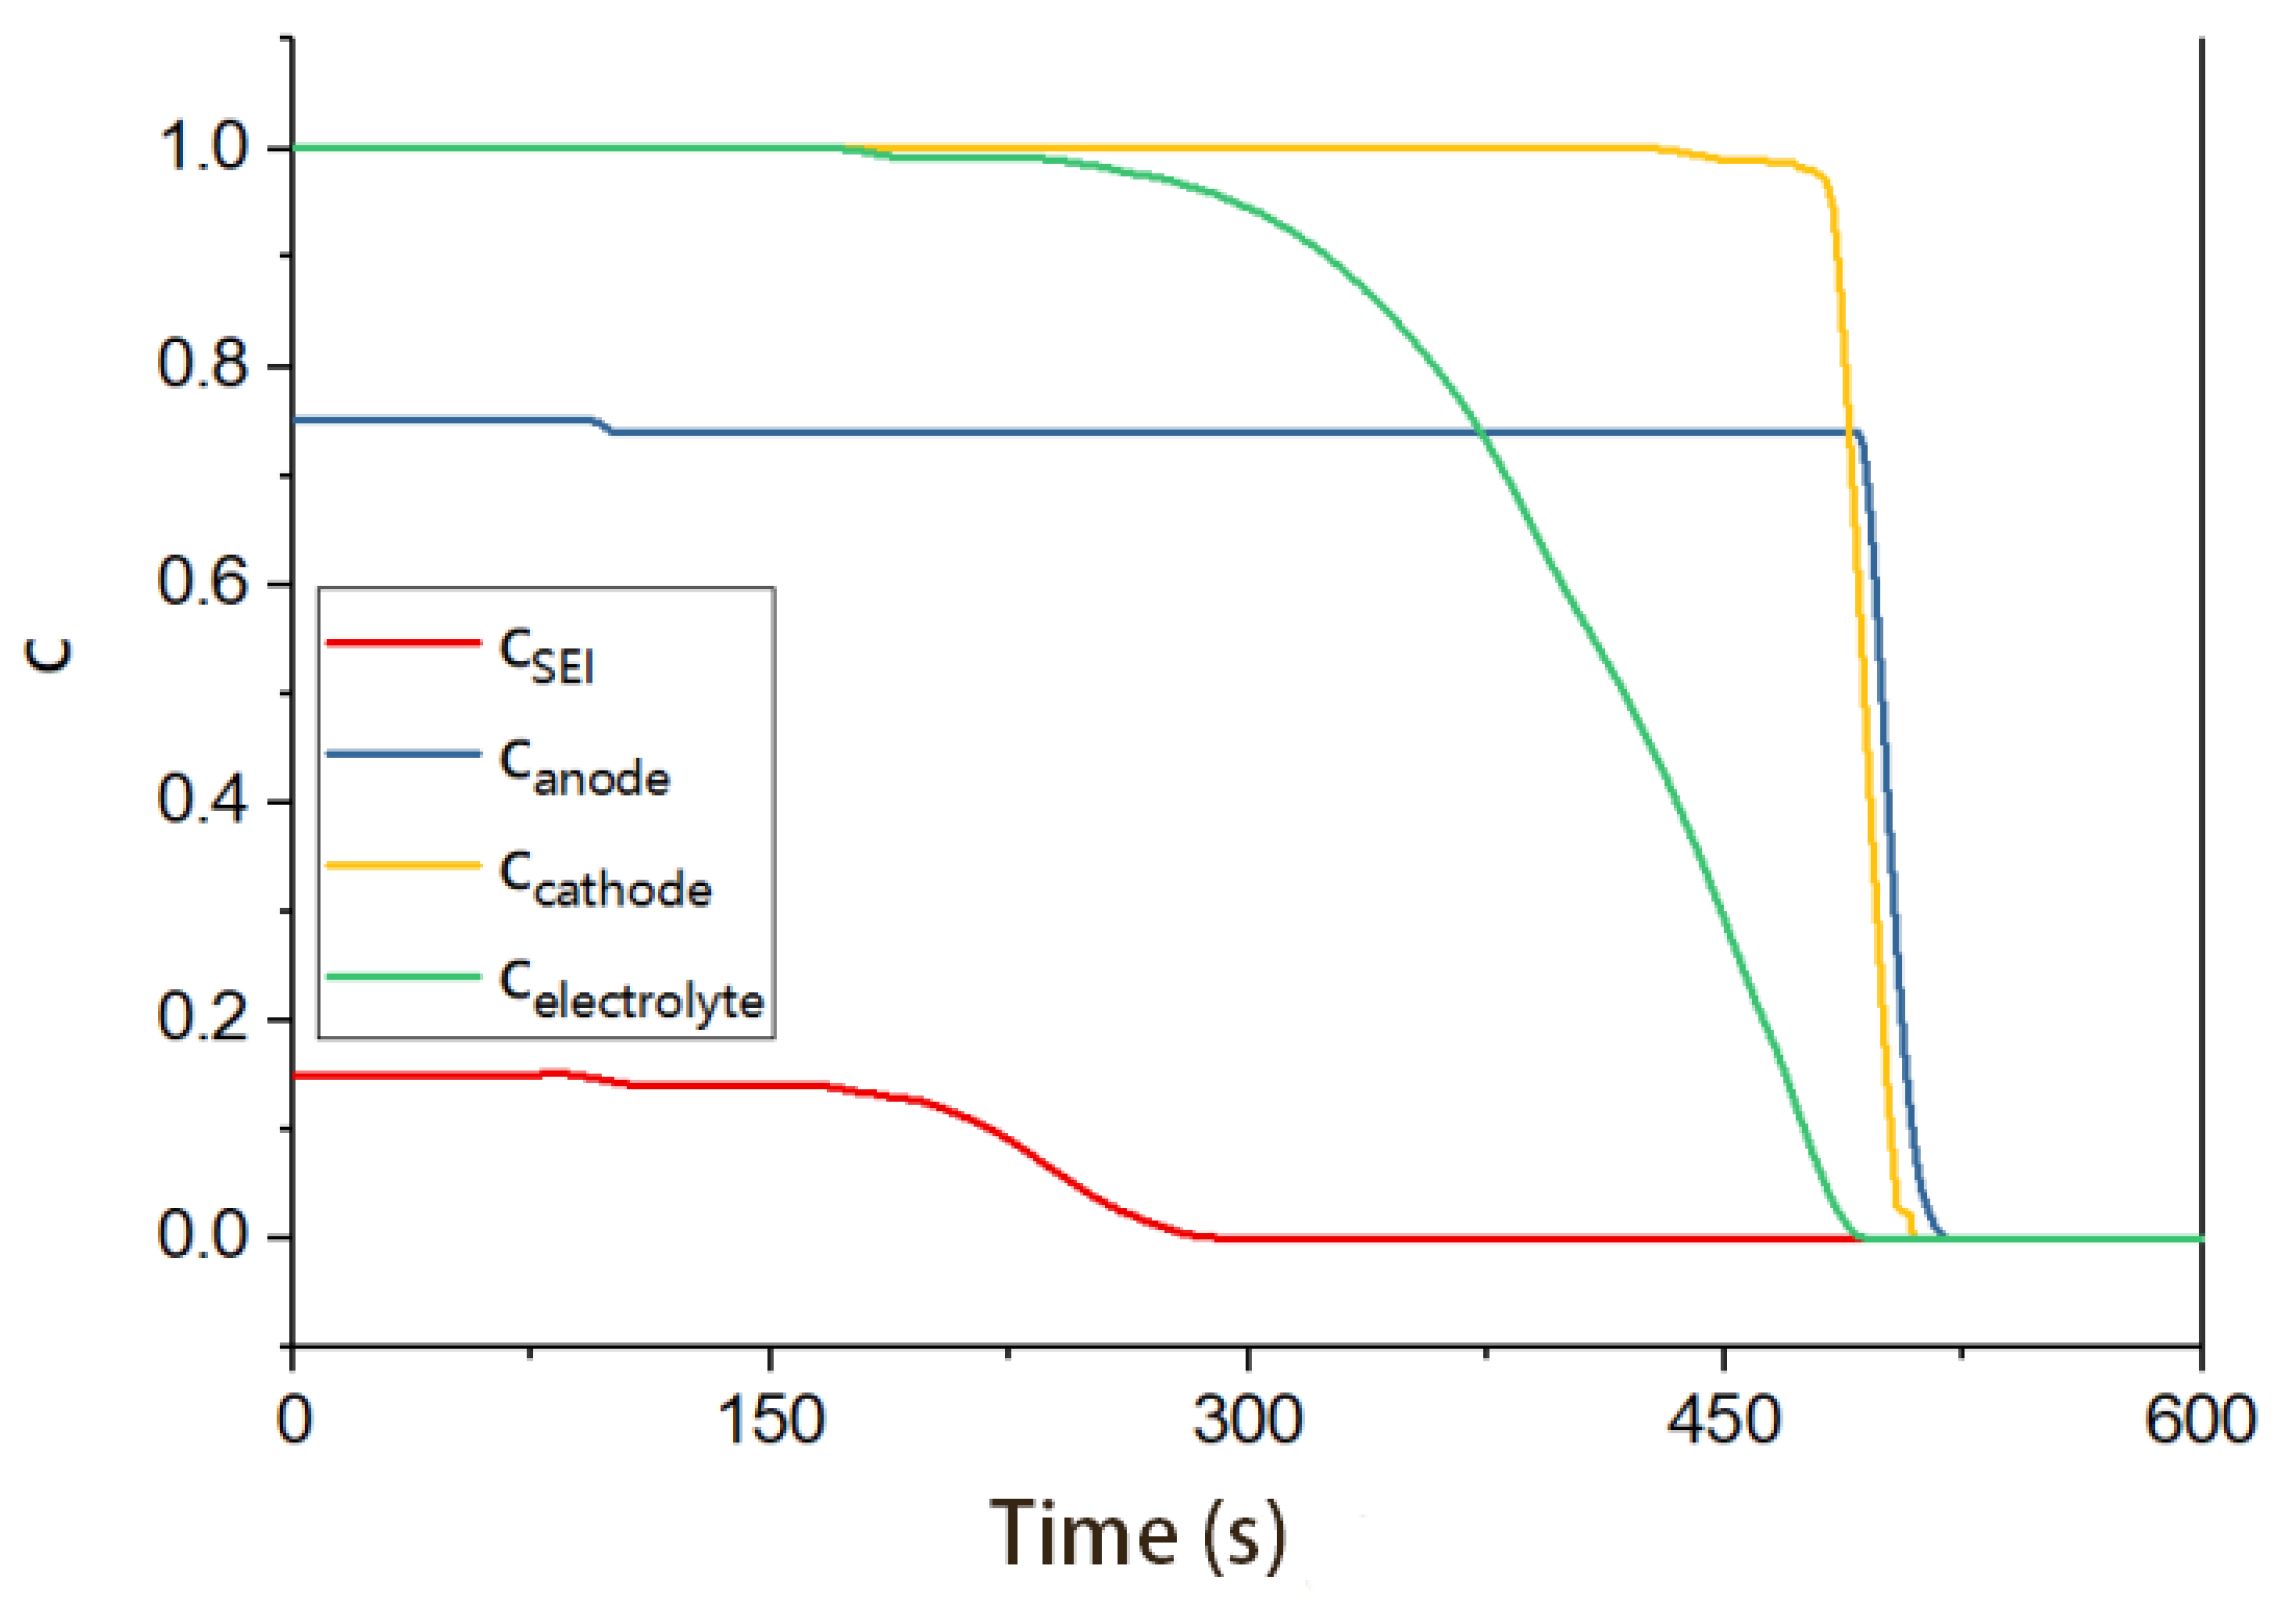
3.3. Analysis of the Simulation Results
4. Conclusions
Author Contributions
Funding
Data Availability Statement
Conflicts of Interest
References
- Feng, X.; Ouyang, M.; Liu, X.; Lu, L.; Xia, Y.; He, X. Thermal runaway mechanism of lithium ion battery for electric vehicles: A review. Energy Storage Mater. 2018, 10, 246–267. [Google Scholar] [CrossRef]
- Spielbauer, M.; Berg, P.; Ringat, M.; Bohlen, O.; Jossen, A. Experimental study of the impedance behavior of 18650 lithium-ion battery cells under deforming mechanical abuse. J. Energy Storage 2019, 26, 101039. [Google Scholar] [CrossRef]
- Yiding, L.; Wenwei, W.; Cheng, L.; Xiaoguang, Y.; Fenghao, Z. Multi-physics safety model based on structure damage for lithium-ion battery under mechanical abuse. J. Clean. Prod. 2020, 277, 124094. [Google Scholar] [CrossRef]
- Wu, H.; Chen, S.; Hong, Y.; Xu, C.; Zheng, Y.; Jin, C.; Chen, K.; He, Y.; Feng, X.; Wei, X.; et al. Thermal safety boundary of lithium-ion battery at different state of charge. J. Energy Chem. 2024, 91, 59–72. [Google Scholar] [CrossRef]
- Lin, C.-K.; Ren, Y.; Amine, K.; Qin, Y.; Chen, Z. In situ high-energy X-ray diffraction to study overcharge abuse of 18650-size lithium-ion battery. J. Power Sources 2013, 230, 32–37. [Google Scholar] [CrossRef]
- Liu, Z.; Guo, X.; Meng, N.; Yu, Z.; Yang, H. Study of thermal runaway and the combustion behavior of lithium-ion batteries overcharged with high current rates. Thermochim. Acta 2022, 715, 179276. [Google Scholar] [CrossRef]
- Guo, R.; Lu, L.; Ouyang, M.; Feng, X. Mechanism of the entire overdischarge process and overdischarge-induced internal short circuit in lithium-ion batteries. Sci. Rep. 2016, 6, 30248. [Google Scholar] [CrossRef] [PubMed]
- Zhang, G.; Wei, X.; Chen, S.; Zhu, J.; Han, G.; Tang, X.; Hua, W.; Dai, H.; Ye, J. Comprehensive Investigation of a Slight Overcharge on Degradation and Thermal Runaway Behavior of Lithium-Ion Batteries. ACS Appl. Mater. Interfaces 2021, 13, 35054–35068. [Google Scholar] [CrossRef] [PubMed]
- Ren, D.; Feng, X.; Liu, L.; Hsu, H.; Lu, L.; Wang, L.; He, X.; Ouyang, M. Investigating the relationship between internal short circuit and thermal runaway of lithium-ion batteries under thermal abuse condition. Energy Storage Mater. 2021, 34, 563–573. [Google Scholar] [CrossRef]
- Shelkea, A.V.; Buston, J.E.H.; Gill, J.; Howard, D.; Williams, R.C.E.; Read, E.; Abaza, A.; Cooper, B.; Richards, P.; Wen, J.X. Combined numerical and experimental studies of 21,700 lithium-ion battery thermal runaway induced by different thermal abuse. Int. J. Heat Mass Transf. 2022, 194, 123099. [Google Scholar] [CrossRef]
- Zhou, H.; Parmananda, M.; Crompton, K.R.; Hladky, M.P.; Dann, M.A.; Ostanek, J.K.; Mukherjee, P.P. Effect of electrode crosstalk on heat release in lithium-ion batteries under thermal abuse scenarios. Energy Storage Mater. 2022, 44, 326–341. [Google Scholar] [CrossRef]
- Liu, L.; Lin, C.; Fan, B.; Wang, F.; Lao, L.; Yang, P. A new method to determine the heating power of ternary cylindrical lithium ion batteries with highly repeatable thermal runaway test characteristics. J. Power Sources 2020, 472, 228503. [Google Scholar] [CrossRef]
- Tang, X.; Wei, X.; Zhang, H.; Li, D.; Zhang, G.; Wang, X.; Zhu, J.; Dai, H. Experimental and modeling analysis of thermal runaway for LiNi0.5Mn0.3Co0.2O2/graphite pouch cell under adiabatic condition. Int. J. Energy Res. 2021, 45, 10667–10681. [Google Scholar] [CrossRef]
- Lei, Z.; Maotao, Z.; Xiaoming, X.; Junkui, G. Thermal runaway characteristics on NCM lithium-ion batteries triggered by local heating under different heat dissipation conditions. Appl. Therm. Eng. 2019, 159, 113847. [Google Scholar] [CrossRef]
- Feng, X.; Zheng, S.; Ren, D.; He, X.; Wang, L.; Cui, H.; Liu, X.; Jin, C.; Zhang, F.; Xu, C.; et al. Investigating the thermal runaway mechanisms of lithium-ion batteries based on thermal analysis database. Appl. Energy 2019, 246, 53–64. [Google Scholar] [CrossRef]
- Wang, Q.; Huang, P.; Ping, P.; Du, Y.; Li, K.; Sun, J. Combustion behavior of lithium iron phosphate battery induced by external heat radiation. J. Loss Prev. Process Ind. 2017, 49, 961–969. [Google Scholar] [CrossRef]
- Jin, C.; Sun, Y.; Wang, H.; Lai, X.; Wang, S.; Chen, S.; Rui, X.; Zheng, Y.; Feng, X.; Wang, H.; et al. Model and experiments to investigate thermal runaway characterization of lithium-ion batteries induced by external heating method. J. Power Sources 2021, 504, 230065. [Google Scholar] [CrossRef]
- Feng, X.; Zheng, S.; He, X.; Wang, L.; Wang, Y.; Ren, D.; Ouyang, M. Time Sequence Map for Interpreting the Thermal Runaway Mechanism of Lithium-Ion Batteries with LiNixCoyMnzO2 Cathode. Front. Energy Res. 2018, 6, 126. [Google Scholar] [CrossRef]
- Xu, X.; Sun, X.; Zhao, L.; Li, R.; Tang, W. Research on thermal runaway characteristics of NCM lithium-ion battery under thermal-electrical coupling abuse. Ionics 2022, 28, 5449–5467. [Google Scholar] [CrossRef]
- Liu, X.; Ren, D.; Hsu, H.; Feng, X.; Xu, G.-L.; Zhuang, M.; Gao, H.; Lu, L.; Han, X.; Chu, Z.; et al. Thermal Runaway of Lithium-Ion Batteries without Internal Short Circuit. Joule 2018, 2, 2047–2064. [Google Scholar] [CrossRef]
- Zhang, Q.; Liu, T.; Wang, Q. Experimental study on the influence of different heating methods on thermal runaway of lithium-ion battery. J. Energy Storage 2021, 42, 103063. [Google Scholar] [CrossRef]
- Kim, G.-H.; Pesaran, A.; Spotnitz, R. A three-dimensional thermal abuse model for lithium-ion cells. J. Power Sources 2007, 170, 476–489. [Google Scholar] [CrossRef]
- Nyman, A.; Behm, M.; Lindbergh, G. Electrochemical characterisation and modelling of the mass transport phenomena in LiPF6–EC–EMC electrolyte. Electrochim. Acta 2008, 53, 6356–6365. [Google Scholar] [CrossRef]
- Zavalis, T.G.; Behm, M.; Lindbergh, G. Investigation of Short-Circuit Scenarios in a Lithium-Ion Battery Cell. J. Electrochem. Soc. 2012, 159, A848–A859. [Google Scholar] [CrossRef]
- Feng, X.; Lu, L.; Ouyang, M.; Li, J.; He, X. A 3D thermal runaway propagation model for a large format lithium ion battery module. Energy 2016, 115, 194–208. [Google Scholar] [CrossRef]
- Zhang, C.; Santhanagopalan, S.; Sprague, M.A.; Pesaran, A.A. Coupled mechanical-electrical-thermal modeling for short-circuit prediction in a lithium-ion cell under mechanical abuse. J. Power Sources 2015, 290, 102–113. [Google Scholar] [CrossRef]
- Yin, H.; Ma, S.; Li, H.; Wen, G.; Santhanagopalan, S.; Zhang, C. Modeling strategy for progressive failure prediction in lithium-ion batteries under mechanical abuse. eTransportation 2021, 7, 100098. [Google Scholar] [CrossRef]
- Guo, G.; Long, B.; Cheng, B.; Zhou, S.; Xu, P.; Cao, B. Three-dimensional thermal finite element modeling of lithium-ion battery in thermal abuse application. J. Power Sources 2010, 195, 2393–2398. [Google Scholar] [CrossRef]
- Gümüşsu, E.; Ekici, Ö.; Köksal, M. 3-D CFD modeling and experimental testing of thermal behavior of a Li-Ion battery. Appl. Therm. Eng. 2017, 120, 484–495. [Google Scholar] [CrossRef]
- Li, K.; Xu, C.; Wang, H.; Jin, C.; Rui, X.; Chen, S.; Feng, X.; Fan, L.; Ouyang, M. Investigation for the effect of side plates on thermal runaway propagation characteristics in battery modules. Appl. Therm. Eng. 2022, 201, 117774. [Google Scholar] [CrossRef]


| Parameter | Value |
|---|---|
| Standard discharge capacity | 17.5 Ah |
| Nominal voltage | 3.65 V |
| Charge voltage | 4.2 V |
| Discharge cut-off voltage | 3.0 V |
| Impedance | <3.5 mΩ (25 ± 2 °C, 1 kHz) |
| Battery mass | 293 g |
| Specific heat capacity | 952.5 J/kg∙K |
| Cell thickness | 8.5 mm |
| Cell width | 91 mm |
| Cell height | 194 mm |
| x | ∆H (J/g) | m (g) | c | A (1/s) | Ea (J/mol) | Tonset (°C) |
|---|---|---|---|---|---|---|
| SEI | 257 | 67.988 | 0.15 | 1.6670 × 10¹⁵ | 1.3508 × 10⁵ | 70 |
| Anode | 1714 | 67.988 | 0.75 | 0.1369 (T ≤ 260) 9 (T > 260) | 3.8162 × 10⁴ | 70 |
| Separator | 233.2 | 11.061 | 1 | 1.5000 × 1050 | 4.2000 × 10⁵ | 164 |
| Cathode1 | 605.7 | 121.542 | 1 | 1.7500 × 10⁹ | 1.1495 × 10⁵ | 160 |
| Cathode2 | 605.7 | 1.077 × 1050 | 1.5888 × 10⁵ | 260 | ||
| Electrolyte | 155 | 53.500 | 1 | 8.9948 × 10¹⁶ | 1.6564 × 10⁵ | 120 |
| Parameter | Value |
|---|---|
| Mass (kg) | 0.293 |
| Density (kg/m3) | 2393.79 |
| Specific heat (J/kg·K) | 952 |
| Coefficient of heat transfer (W/m2·K) | 17 |
| Heat conductivity coefficient (W/m·K) | λx = λy = 18.03, λz = 1.09 |
| Position | Maximum Measured Temperature (°C) | Simulated Maximum Temperature (°C)/Time | Error Temperature (°C)/Time |
|---|---|---|---|
| 1 | 722.2/518 | 824.3/530 | 102.1/12 |
| 2 | 675.0/524 | 810.9/525 | 135.9/1 |
| 3 | 703.7/515 | 824.3/524 | 120.6/9 |
| 4 | 685.8/509 | 810.9/525 | 125./16 |
Disclaimer/Publisher’s Note: The statements, opinions and data contained in all publications are solely those of the individual author(s) and contributor(s) and not of MDPI and/or the editor(s). MDPI and/or the editor(s) disclaim responsibility for any injury to people or property resulting from any ideas, methods, instructions or products referred to in the content. |
© 2024 by the authors. Licensee MDPI, Basel, Switzerland. This article is an open access article distributed under the terms and conditions of the Creative Commons Attribution (CC BY) license (https://creativecommons.org/licenses/by/4.0/).
Share and Cite
Wang, Z.; Tang, X.; Zhou, Y.; Huang, H.; Dai, H. Experimental and Modeling Analysis of Thermal Runaway for LiNi0.5Mn0.3Co0.2O2/Graphite Pouch Cell Triggered by Surface Heating. Energies 2024, 17, 826. https://doi.org/10.3390/en17040826
Wang Z, Tang X, Zhou Y, Huang H, Dai H. Experimental and Modeling Analysis of Thermal Runaway for LiNi0.5Mn0.3Co0.2O2/Graphite Pouch Cell Triggered by Surface Heating. Energies. 2024; 17(4):826. https://doi.org/10.3390/en17040826
Chicago/Turabian StyleWang, Zhihao, Xuan Tang, Youhang Zhou, Hai Huang, and Haifeng Dai. 2024. "Experimental and Modeling Analysis of Thermal Runaway for LiNi0.5Mn0.3Co0.2O2/Graphite Pouch Cell Triggered by Surface Heating" Energies 17, no. 4: 826. https://doi.org/10.3390/en17040826
APA StyleWang, Z., Tang, X., Zhou, Y., Huang, H., & Dai, H. (2024). Experimental and Modeling Analysis of Thermal Runaway for LiNi0.5Mn0.3Co0.2O2/Graphite Pouch Cell Triggered by Surface Heating. Energies, 17(4), 826. https://doi.org/10.3390/en17040826