Review

A Survey of Photovoltaic Panel Overlay and Fault Detection Methods †

by
Cheng Yang
1,*,
Fuhao Sun
1,
Yujie Zou
2,
Zhipeng Lv
3,
Liang Xue
1,
Chao Jiang
1,
Shuangyu Liu
4,
Bochao Zhao
5 and
Haoyang Cui
1,*
1
College of Electronics and Information Engineering, Shanghai University of Electric Power, Shanghai 201306, China
2
Shanghai Zhabei Power Plant of State Grid Corporation of China, Shanghai 200432, China
3
Energy Internet Research Institute Co., Ltd., State Grid Corporation of China, Shanghai 200437, China
4
Shanghai Guoyun Information Technology Co., Ltd., Shanghai 201210, China
5
School of Electrical and Information Engineering, Tianjin University, Tianjin 300072, China
*
Authors to whom correspondence should be addressed.
The preliminary version of this work have been published in Sun, F.; Yang, C.; Cui, H.; Lv, Z.; Shao, J.; Zhao, B.; He, K. Dust Detection Techniques for Photovoltaic Panels from a Machine Vision Perspective: A Review. In Proceedings of the 2023 8th Asia Conference on Power and Electrical Engineering (ACPEE), Tianjin, China, 14–16 April 2023.
Energies 2024, 17(4), 837; https://doi.org/10.3390/en17040837
Submission received: 7 January 2024 / Revised: 5 February 2024 / Accepted: 6 February 2024 / Published: 9 February 2024
(This article belongs to the Section A2: Solar Energy and Photovoltaic Systems)

Abstract

:
Photovoltaic (PV) panels are prone to experiencing various overlays and faults that can affect their performance and efficiency. The detection of photovoltaic panel overlays and faults is crucial for enhancing the performance and durability of photovoltaic power generation systems. It can minimize energy losses, increase system reliability and lifetime, and lower maintenance costs. Furthermore, it can contribute to the sustainable development of photovoltaic power generation systems, which can reduce our reliance on conventional energy sources and mitigate environmental pollution and greenhouse gas emissions in line with the goals of sustainable energy and environmental protection. In this paper, we provide a comprehensive survey of the existing detection techniques for PV panel overlays and faults from two main aspects. The first aspect is the detection of PV panel overlays, which are mainly caused by dust, snow, or shading. We classify the existing PV panel overlay detection methods into two categories, including image processing and deep learning methods, and analyze their advantages, disadvantages, and influencing factors. We also discuss some other methods for overlay detection that do not process images to detect PV panel overlays. The second aspect is the detection of PV panel faults, which are mainly caused by cracks, hot spots, or partial shading. We categorize existing PV panel fault detection methods into three categories, including electrical parameter detection methods, detection methods based on image processing, and detection methods based on data mining and artificial intelligence, and discusses their advantages and disadvantages.

1. Introduction

Over the past few centuries, human economic and industrial development has largely relied on traditional energy sources, such as oil, natural gas, and coal [1]. As the world’s population and energy demands increase, the reserves of oil, natural gas, and coal are depleting [2]. Also, these sources have many limitations that pose serious challenges to the environment and human security [3,4,5,6]. Therefore, there is a need for alternative energy sources that are cleaner, safer, and more sustainable than conventional energy sources [7].
PV power generation systems are a clean and renewable energy solution that have many benefits over traditional energy sources [8,9,10]. One benefit is that PV power generation systems do not emit greenhouse gases and air pollutants that harm the environment and ecosystems [11]. Another benefit is that PV power generation systems use solar energy, which is an abundant resource. PV power generation systems also have the potential to create distributed energy production. They can produce electricity locally in both urban and rural areas, as PV panels can be installed on rooftops, in solar farms, or in various locations such as solar PV power plants. The maintenance cost of PV power generation system is relatively low, requiring only regular cleaning and inspection [12,13,14].
However, PV power generation systems face many challenges in natural environments, such as weather conditions, shading effects, and surface contamination [15]. Among these factors, dust accumulation on PV panels is one of the most significant causes of efficiency loss [16]. Dust and other overlays have a major impact on PV power generation systems. One impact is that the buildup of overlays reduces the efficiency of solar panels [17]. When the surface of the solar panel is covered by the overlays, it reduces the transmittance of sunlight, lowering the efficiency of converting light energy into electrical energy [18]. This is because the overlays block and absorb some of the sunlight, decreasing the interaction between photons and electrons. This leads to a reduction in the current and power generated by the solar panels, affecting the output of the whole PV power generation system. Another impact is that the buildup of overlays can cause heating issues [19]. When the overlays cover the solar panel, it traps the heat from the sun’s rays, increasing the panel’s temperature. High temperatures can cause the panels to degrade and their performance to deteriorate, reducing the power generation capacity of the system. Solar panels also become less efficient at high temperatures, further lowering the efficiency of energy conversion [20]. Additionally, the overlays will increase the maintenance cost of the PV power generation system [21]. Regular cleaning of solar panels to remove dust and dirt is necessary, requiring an investment of manpower and resources. If cleaning is neglected, the buildup of overlays can damage the surface of the panel, reducing its lifespan and adding to the cost of more frequent repairs and replacements. Finally, the impact of overlays is not only limited to solar panels, but also affects other PV system components. For instance, dust accumulation on the inverter or connecting wires may cause overheating, short circuits, or the failure of the equipment, affecting the operational stability and safety of the entire system [22].
To reduce the impact of dust and other overlays on PV power generation systems, regular cleaning of solar panels is essential. This can be carried out by washing with water. Alternatively, sloped solar panels can be installed to use rainwater to wash away dust [23]. Moreover, regular inspection and maintenance of other components in the PV power generation system is also important to ensure the system’s normal operation and power generation efficiency. However, manual cleaning methods are expensive, labor intensive, and time consuming. They also use water resources that may be scarce in some areas [24]. Therefore, researchers have been investigating various machine vision techniques to automatically and efficiently detect overlays on PV panels. These technologies can help lower maintenance costs and effort, optimize energy production, and prevent long-term degradation of PV panels.
One of the main methods of overlay detection is based on image processing technology. This method uses computer vision and image processing techniques to detect and analyze the overlays on the surface of solar PV panels [25]. The method uses drones, satellites, or other high-resolution camera equipment to capture images of PV panels. This method has the advantages of high efficiency, accuracy, and automation, and can improve the efficiency and accuracy of PV panel overlay detection [26]. It can help the maintenance staff of the PV power generation system to find and remove the overlays in time to ensure the normal operation of the PV panels and maximize the power generation efficiency [27].
Another emerging approach to overlay detection is based on deep learning techniques [28]. This method uses deep neural networks to automatically detect and identify surface overlays on solar PV panels [29]. The method performs model training and learning based on a large set of labeled training data. The main benefits of this technique are its high accuracy and automatic nature. Deep learning models can more accurately detect and identify overlays on PV panels by learning patterns and features in large datasets [30]. Compared with traditional methods, deep learning-based technology enables faster and more reliable overlay detection, improves the efficiency of PV panel maintenance, and ensures the optimal performance and power generation efficiency of PV systems [31].
There are also some other methods for overlay detection. These methods provide more reliable tools for the maintenance and management of PV power generation systems, helping to maximize the performance and lifetime of PV panels.
The accumulation of overlays can lead to malfunctions in photovoltaic panels; therefore, it is necessary to conduct photovoltaic panel fault detection. The purpose of PV panel fault detection is to ensure the stable operation of PV system and maximize the power generation efficiency [32]. Faulty and damaged PV panels can cause energy loss, system downtime, and increased costs [33]. Therefore, fault detection and repair is essential for the reliability and economy of PV systems. Fault detection can help detect PV panel damage and problems such as hot spots, cracks, partial shading, and electrical failures. These issues can lead to a decrease in panel output power and imbalances in current and voltage, lowering overall system power generation efficiency [34]. Through fault detection, problems can be quickly identified and faulty panels can be located for timely repair or replacement. This helps lower maintenance time and costs, and increase system availability and productivity.
This paper provides a comprehensive review of various methods for PV panel overlay and fault detection. Ref. [35] introduces and analyzes the characteristics, advantages, disadvantages and applications of image processing and deep learning technology to detect overlays.On the basis of [35], this paper also specifically discusses the factors that affect overlay detection and the future research directions and challenges in this field. Some other methods for PV panel overlay detection are also introduced and analyzed. Since the accumulation of overlay detection and cleaning is not timely and will lead to the failure of PV panels, this paper also comprehensively reviews the electrical parameter detection methods, detection methods based on image processing, and detection methods based on data mining and artificial intelligence for fault detection on the basis of [35]. It also introduces and analyzes the features, advantages, disadvantages, and applications of these methods. The relationship between this article and reference [35] is shown in Figure 1.
The rest of this paper is structured as follows. Section 2 introduces the research status of PV panel overlay detection technology. Section 3 explains the research status of PV panel fault detection technology. Section 4 discusses the opportunities and challenges facing overlay and fault detection technologies for PV panels. Section 5 concludes this paper. The structure diagram of this paper is shown in Figure 2.

2. PV Panel Overlay Detection

Mulches such as dust, bird droppings, and leaves block direct sunlight and adversely affect the efficiency of PV panels. Therefore, it is necessary to detect overlays on a PV panel, which is more conducive to the cleaning of the PV panel. A schematic diagram of PV panel overlay detection is shown in Figure 3.
Many factors affect the accuracy and effectiveness of PV panel overlay detection. Factors such as weather conditions, types of overlays, geographical location, and shooting points can influence the detection of PV panel overlays.
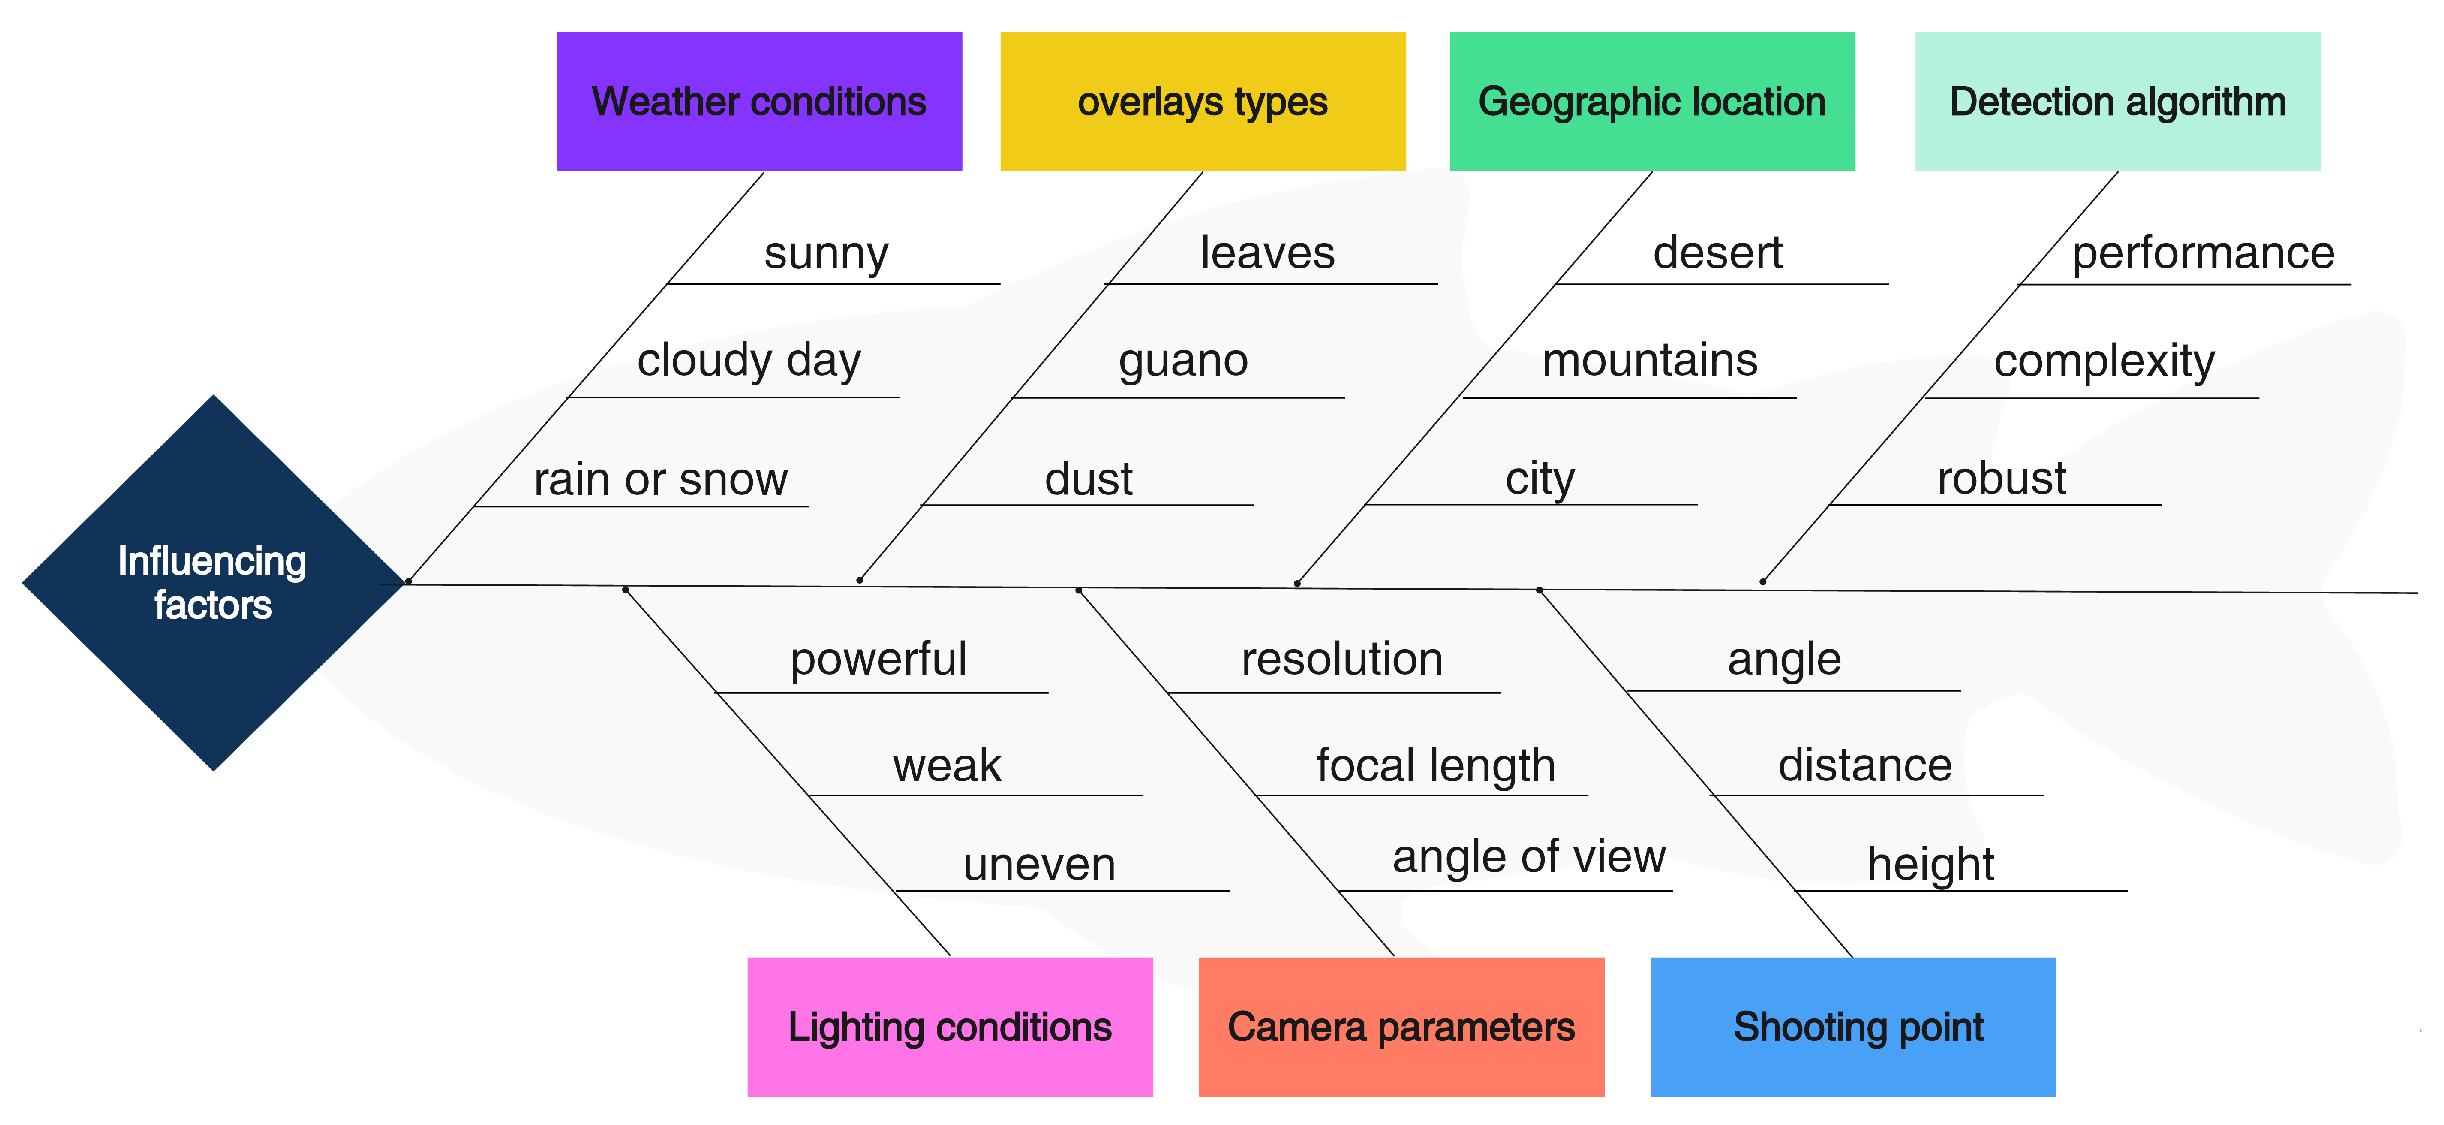
  • Weather conditions: Weather conditions have a significant impact on PV panel overlay detection. In clear weather, the surfaces of PV panels can be photographed and inspected relatively clearly. However, in severe weather conditions, such as cloudy, rainy or snowy days, clouds, precipitation or snow accumulation may reduce the sharpness and contrast of the image, affecting the accuracy of overlay detection [36].
  • Lighting conditions: Lighting conditions can affect the reflection and scattering of the photovoltaic panel surface, thereby affecting the quality and contrast of the image. If the lighting conditions are uneven or too strong or too weak, it will lead to errors in overlay detection [37].
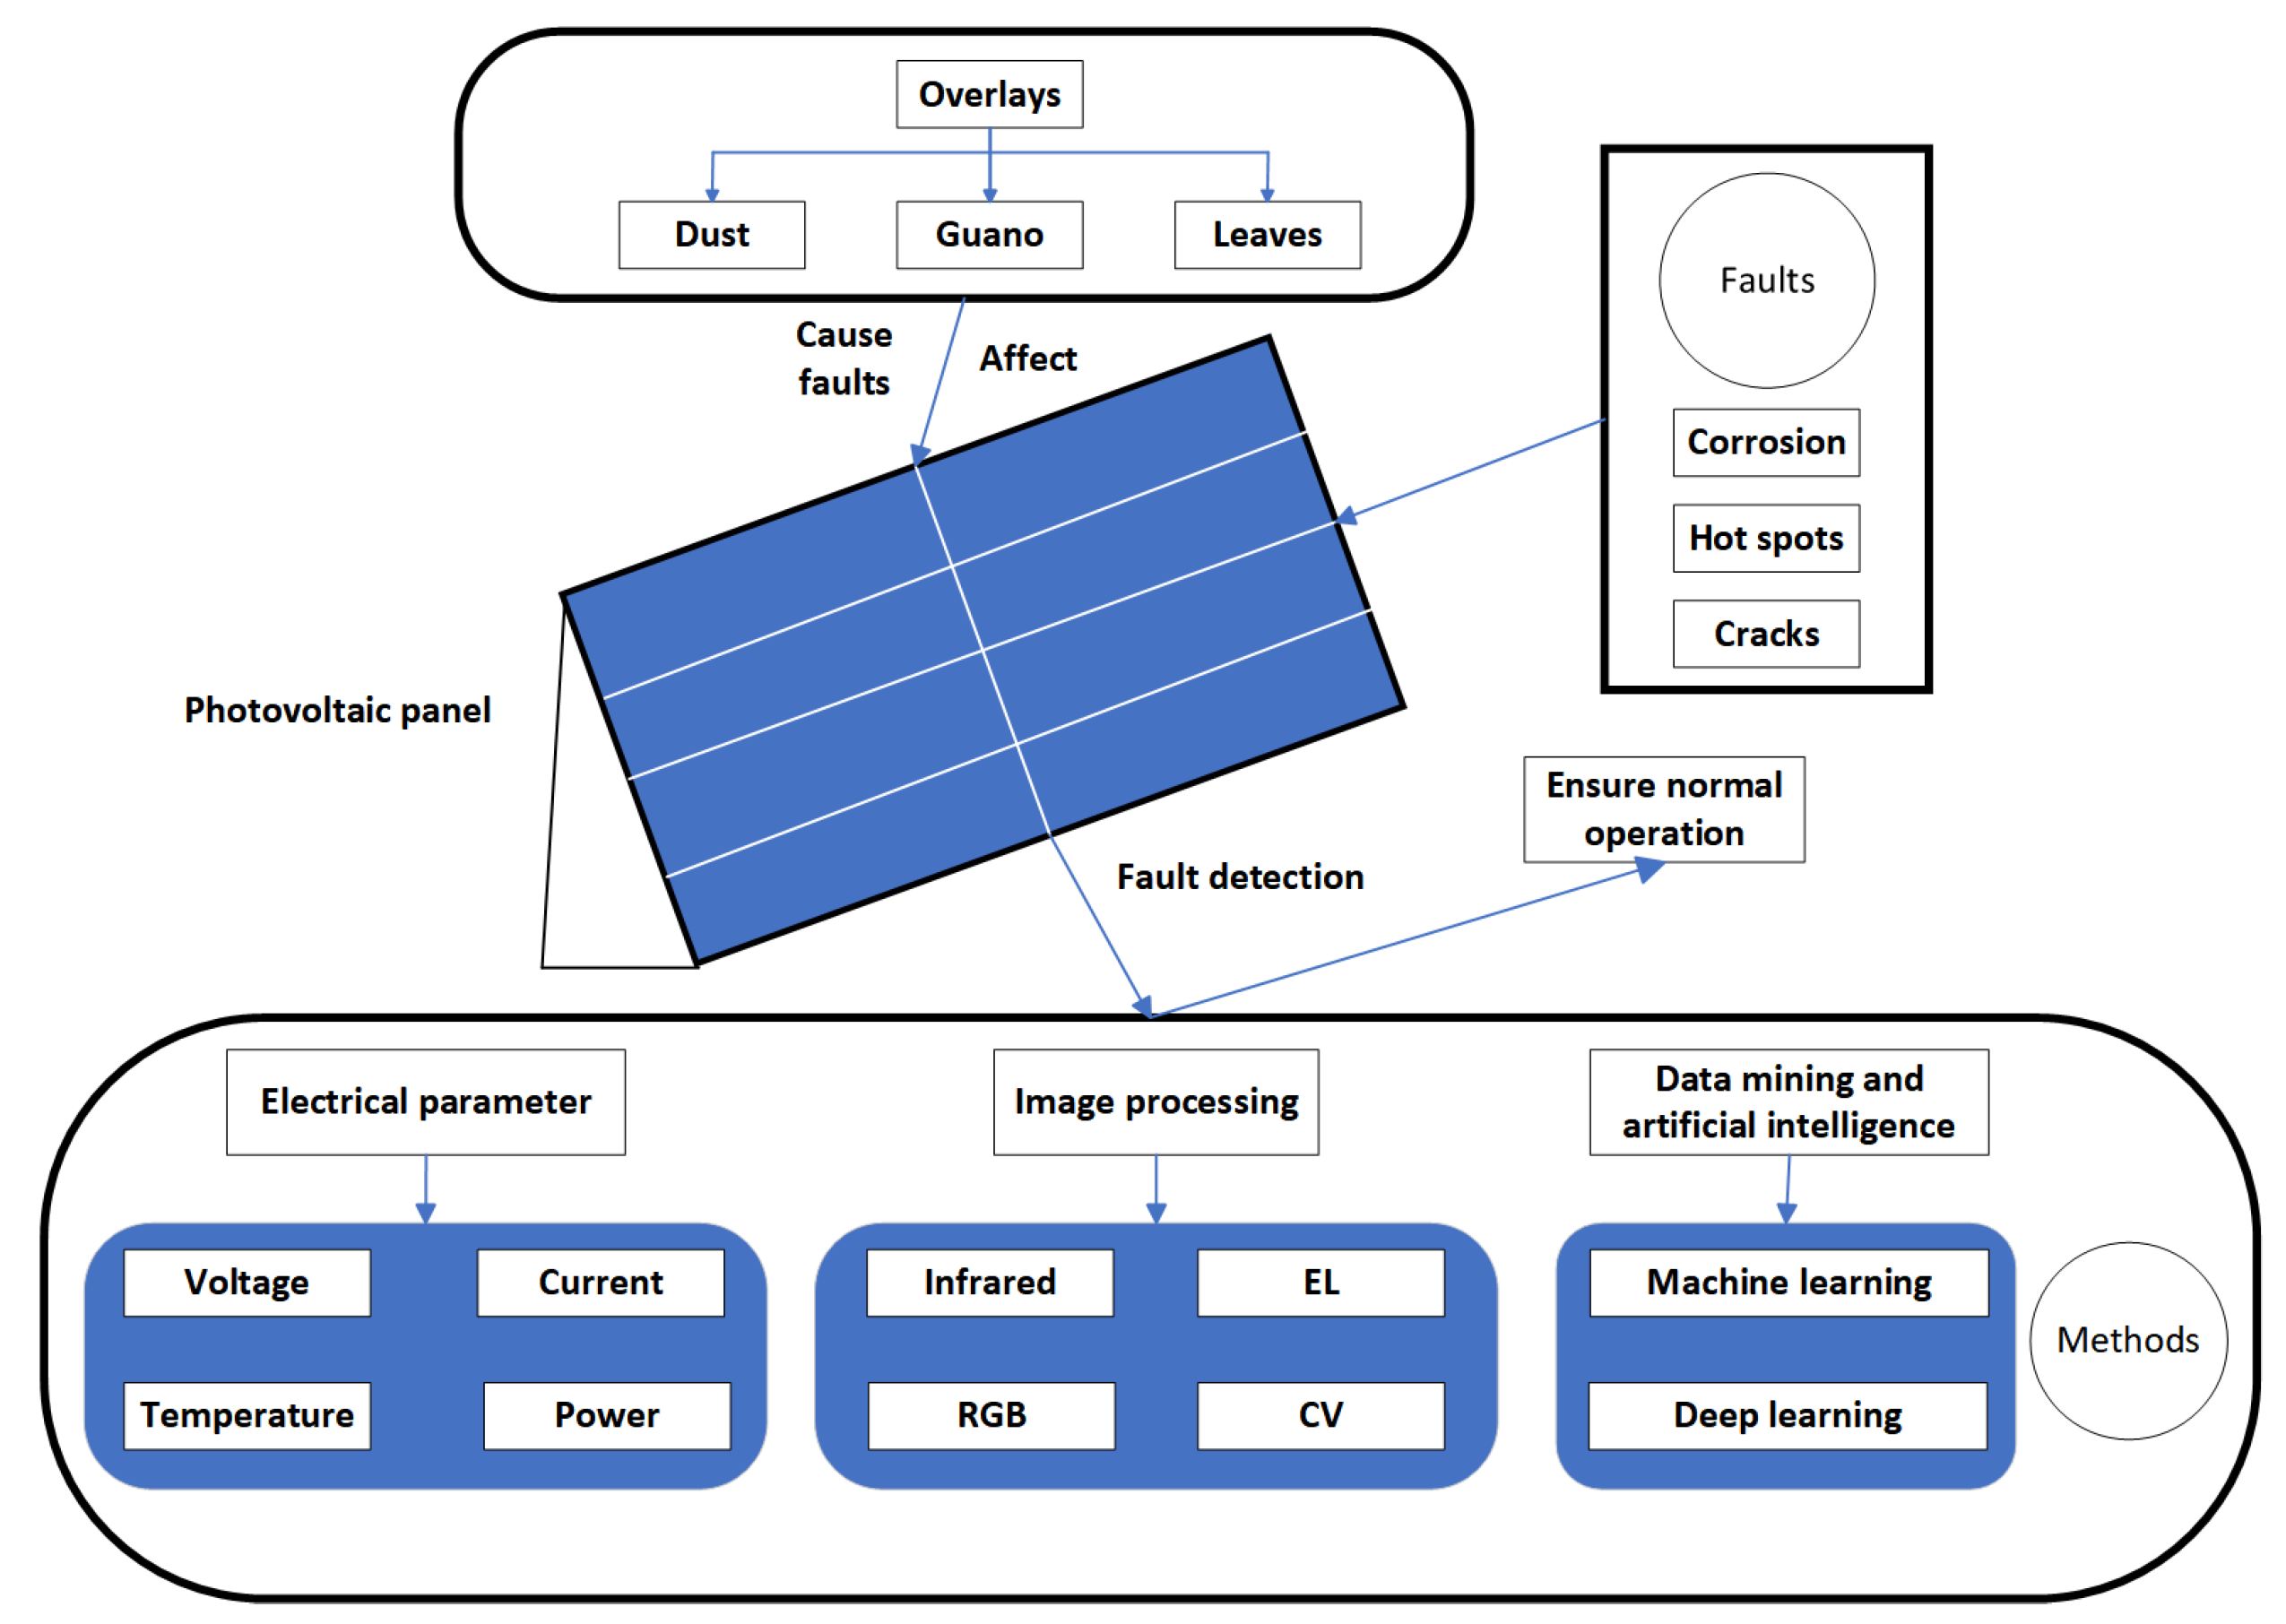
  • Types of overlays: Different types of overlays have different effects on PV panel detection. For example, vegetation overlays such as leaves, branches, shrubs, etc., can produce complex textures and color variations in the image, which may interfere with the identification of PV panels. Other possible types of overlays include buildings, utility poles, signal lights, etc. [38].
  • Geographic location: Geographic location will affect the accuracy and effectiveness of PV panel overlay detection, mainly because different geographical locations will have different climate conditions, environmental factors, and PV panel distribution. The light conditions in desert areas are better, but wind and sand pollute and wear away the surface of PV panels more, which may lead to errors in overlay detection. The light conditions in mountainous areas are poor, and the environmental factors in mountainous areas are also relatively complex, such as rain, snow, smog, leaves, etc., which may cause interference and changes on the surface of PV panels, increasing the difficulty and uncertainty of overlay detection. The lighting conditions in the city are relatively uniform, but there may be phenomena such as occlusion or reflection, which affect the clarity of and details in the image [39].
  • Camera parameters: Camera parameters include resolution, focal length, viewing angle, exposure time, etc., which will affect the clarity of and details in the image. Inappropriate or unstable camera parameters may result in blurred or distorted overlay detection [40].
  • Detection algorithm: A detection algorithm refers to a computational method for identifying and segmenting PV panel overlays, usually based on techniques such as image processing or deep learning. The performance and complexity of the detection algorithm will affect the accuracy and speed of overlay detection. If the detection algorithm is not robust or efficient, it may lead to errors or delays in overlay detection [41].
  • Shooting point: The selection and angle of the shooting point will also affect the outcome of overlay detection. Different shooting points may result in different lighting conditions, viewing angles, and image distortions, which may complicate the detection of overlays. Moreover, the distance and height between the shooting point and the PV panel will also affect overlay detection within the image [42]. If the distance between the shooting point and the PV panel is too far or the height angle is too low, it may cause an insufficient image resolution, making it impossible to accurately identify the overlays [43].
In conclusion, factors such as weather conditions, lighting conditions, types of overlays, geographical location, camera parameters, detection algorithm, and shooting points will all influence the detection of PV panel overlays. To improve the accuracy and effectiveness of detection, it may be necessary to consider adjusting the detection algorithm, collecting more sample data, selecting appropriate shooting timing and angles, and conducting comprehensive analysis in combination with geographic information and other factors. As shown in Figure 4, seven factors that affect the detection of photovoltaic panel overlays are summarized.

2.1. Overlay Detection Technology Based on Image Processing

To detect dust on PV panels based on image processing we must consider many factors [44] such as image data acquisition, image preprocessing, feature extraction and identification, and positioning. These attention points can help improve the accuracy, stability and practicality of the PV panel dust detection system.
The acquisition of image data is a key step in PV panel overlay detection technology based on image processing [45]. One method is to use a PV panel-monitoring camera to collect PV panel images, including non-pollutant PV panel images and various types of pollutant PV panel images. The resolution of the PV panel surveillance camera should be higher than that of ordinary network cameras to ensure the clarity and detail of the image [46]. Their resolution is generally between 2 million pixels and 5 million pixels. The collection method using a PV panel-monitoring camera is generally carried out by timing or triggering. The timing method refers to automatically collecting images of PV panels according to z set time interval; for example, every 10 min or every 1 h. The trigger mode refers to triggering the collection of PV panel images according to the set conditions or events; for example, when the PV panel fails, the temperature is too high, or the power drops, etc.
Another method is to use drones equipped with high-definition cameras to inspect PV power plants, take high-definition images, and use image processing technology to identify stains, damage, and tilting on PV panels [47]. The resolution of visible light cameras is higher than that of ordinary network cameras to ensure the clarity and details of images, and their resolutions are generally between 2 million pixels and 48 million pixels. The resolution of infrared thermal imaging cameras is generally between 160 × 120 and 640 × 512. Unmanned aerial vehicles (UAVs) equipped with high-definition cameras to inspect PV power plants generally use automatic flight systems or manual remote controls to control UAVs to fly along preset or real-time planned routes, and take blanket or key shots of PV panels. And the captured images are transmitted to the background system or mobile terminal in real time or offline, so as to detect and identify the PV panels [48].
Image preprocessing methods can be divided into two types: global preprocessing and local preprocessing [49]. Global preprocessing refers to a unified transformation of the entire image, such as grayscale transformation, histogram equalization, gamma correction, etc. These methods can change the brightness, contrast, or color distribution of the image, enhance the visual effect of the image, or highlight certain features [50]. Local preprocessing refers to a method that uses a small neighborhood of pixels in the input image to generate new brightness values in the output image, such as smoothing filtering, sharpening filtering, edge detection, etc. [51]. These methods can remove noise or other small fluctuations, or enhance detail or edge information in an image.
In PV panel overlay detection technology based on image processing, image preprocessing is mainly used to improve the accuracy and efficiency of occlusion recognition. Depending on the type of occlusion (shadow or attachment), different preprocessing methods can be used. For example: for shadow occlusion, guided filtering operations and gamma transformation can be used as a preprocessing step, which can increase the detail in the highlighted areas of the image, eliminate interference items, and improve recognition accuracy. For occlusion due to attachments (such as leaves), you can use the selective enhancement method to enhance the image in the hue saturation value (HSV) color space to obtain a “moss-coated image” to achieve the effect of occlusion and discoloration, and improve the contrast between the occluded and unoccluded parts [52].
Image feature extraction can be divided into two types: global features and local features [53]. Global features refer to features that describe the entire image, such as histograms, Fourier transforms, wavelet transforms, etc. [54]. These methods can capture the overall statistical information or frequency domain information within the image, but ignore the spatial structure and detailed information from the image. Local features refer to features that describe certain areas or points of interest in the image, such as SIFT, SURF, HOG, etc. [55]. These methods can capture local structure and detailed information from images and have strong robustness and invariance, but require high computational complexity and storage space [56].
In PV panel overlay detection technology based on image processing, feature extraction from images is mainly to distinguish normal and faulty PV panels, and to locate the location and type of faults [57]. Depending on the type of overlay (shadow or attachment), different feature extraction methods can be used. For example: for shadow coverage, you can use the grayscale histogram as a global feature to reflect the brightness distribution within the image, and then use a threshold segmentation or clustering algorithm to divide between shadow areas and non-shadow areas. For attachment covers (such as leaves), the HSV color space can be used as a global feature to reflect the color distribution in the image, and then a region growing algorithm based on color similarity can be used to divide between attachment areas and non-attachment areas. For the identification of fault types, local features such as edge detection, texture features, and shape features can be used to describe defects such as cracks, broken grids, and hot spots on photovoltaic panels, and classifiers such as support vector machine (SVM) and K-Nearest Neighbor (KNN) can be used to determine the defect type [58].
In the PV panel overlay detection technology based on image processing, the recognition and positioning processing of the image is mainly performed to determine the position and size of the overlay area, as well as the category of the overlay type [59]. Depending on the type of overlay (shading or attachment), different identification and positioning methods can be used. For example: for shadow coverage, methods based on traditional algorithms, such as threshold segmentation or clustering algorithms, can be used to divide between shadow areas and non-shadow areas based on grayscale histogram features, and use connected domain analysis or contour extraction within the shadow area., etc., to determine the position and size of each shadow overlay. For attachment covers (such as leaves), methods based on deep learning algorithms, such as neural network models such as YOLO or Solid State Drive (SSD), can be used to detect and identify attachment areas based on HSV color space features, and use bounding boxes within the attachment area, or masking, to determine the location, size, and category of each attachment cover [60].
The PV panel dust detection method based on image processing has the advantages of non-contact, high efficiency, high precision, analysis visualization and quantification, etc. [61]. Non-contact is a method of image processing that does not require direct contact with the object to be detected or analyzed, and only needs to collect image data through a camera or other equipment, and then it can be processed and analyzed [62]. This avoids damaging or disturbing objects, and also improves safety and convenience. High efficiency is achieved by utilizing the high-speed computing power of computers and various algorithms and techniques, such as image transformation, compression, enhancement, restoration, segmentation, description, recognition, etc. The realization of high precision requires extreme sensors to detect small changes implied by dust, and various filters, edge detectors, feature extractors, etc., can also be used to extract useful information and features in the image, thereby improving the accuracy of recognition. Analytical visualization and quantification is to use the display capability of the computer to present the results of processing and analysis in the form of graphics or images, which is convenient for people to observe and understand.
Ayyagari et al. [63] developed a novel image classification method that used a deep learning framework to detect and classify dust and soil on PV arrays. The method combined PV array images captured by high-resolution cameras and industrial meteorological data. The authors collected a year’s worth of meteorological data, combined power plant efficiency data, and PV array image data for different types of dust as training and testing data. They designed a deep learning model that consisted of a convolutional neural networks (CNN) and a long short-term memory (LSTM) network, which processed the image data and the meteorological data separately, and then fused the outputs of the two to classify the dust and soil. The authors’ proposed method achieves 50.91%, 94.09%, and 96.54% accuracy for CNN (image data only), LSTM (meteorological data only), and CNN-LSTM (combining image and meteorological data), respectively. The experimental results from this method showed that it was more accurate than methods using only CNN or LSTM. Abuqaaud et al. [64] proposed a novel technique for detecting and monitoring dust and soil on solar PV panels using computer vision. The authors performed image preprocessing, such as histogram equalization and high-pass filtering, and then cropped and transformed the image to extract the hue layer in the HSV color space of the image. The technique also used the gray level co-occurrence matrix (GLCM) method to extract texture features from the hue layer, and then used a linear classifier to classify the PV panels as clean or dirty. Czarnecki et al. [65] proposed several different algorithms to classify PV panels as clean or dirty using the k-nearest neighbor classifier, naive Bayesian classifier, and Fisher linear discriminator, respectively. The authors explained the principle, steps, and parameters of each algorithm, and provided a flow chart for the algorithm. They also tested and analyzed the algorithm using the classic binary classification metrics to evaluate the performance of the algorithm, and compared the advantages and disadvantages of different algorithms. The authors concluded that the naive Bayesian classifier was the optimal classifier with the highest detection accuracy.
The method in [63] can improve the efficiency of PV arrays, determine the optimal cleaning scheme through image classification and meteorological data analysis, prevent the accumulation of dust and soil from affecting power generation performance, adapt to different environments and seasons, and adapt to different types of dust and soil conditions, cleaning frequency, and methods. Compared with on-site observation and regular cleaning, this method can scientifically calculate the effects of dust reduction on the amount of PV panel power generation by measuring the light transmittance, dust thickness, and pollution rate on the surface of the PV panel, thus providing a basis for cleaning cycles and plans. The method in [64] does not require any additional sensors or equipment and both the images of PV panels taken with existing cameras used in [64] and the images taken by drones used in [65] can be adapted to different lighting conditions and angles, which improves recognition accuracy. The methods in [63,64] can only detect and monitor dust and soil on the surface of PV panels and cannot handle other types of pollution, such as rain, snow, bird droppings, etc. The PV array in [63] needs to be installed on a flat roof or on the ground to avoid shading and shadowing, which is a challenge in areas with limited space. The technique in [64] also uses linear classifiers, which may not be suitable for nonlinearly separable data, requiring more complex classifiers or transformation methods.
H. Supe et al. [66] used the Google Earth Engine (GEE) to search for dust on PV panels. The authors used Landsat 8 and Sentinel-2 satellite data to calculate different dust indices, such as the Normalized Difference Dust Index (NDSI), the Ratio Normalized Difference Soil Index (RNDSI), and the Dry Bare Soil Index (DBSI), and land surface temperature (LST) to identify and monitor dust deposition on solar panels. The authors compared the effectiveness of different indices in detecting dust deposition and found that the DBSI method had a higher accuracy (89.6%) and Kappa coefficient (0.77). Fan et al. [67] proposed a new method to evaluate the degree of dust accumulation on photovoltaic panels based on an image enhancement algorithm. They used an atmospheric scattering model to analyze the image characteristics of clean and dust-covered photovoltaic panels and established the relationship between model coefficients and dust levels. The authors verified the applicability and accuracy of the model through experiments under different indoor and outdoor irradiation conditions. The results showed that the model can estimate the dust level on photovoltaic panels with an accuracy of 83.78%. This method provides a method for the intelligent cleaning of photovoltaic panels. A simple and reliable method. Zhou et al. [68] developed a method for the automatic segmentation and classification of polluted PV panels using visible spectrum images captured by drones. The method used a flexible threshold segmentation scheme that combined grayscale color space and S component. It also integrated the texture and pixel features of PV panels for automatic detection. For the automatic classification stage, several neural networks were evaluated using transfer learning as a precondition. During the classification process, the accuracy rate was 86.8% and the recall rate was 76.2%.
The advantage of the method in [66] compared to other methods is that it uses the GEE platform. GEE is an open-source cloud geospatial data processing platform that can quickly analyze and visualize multi-temporal satellite image data to monitor and manage solar panels, providing an effective tool. The method in [67] can make use of existing image acquisition equipment without additional sensors or instruments. The method can also adapt to different environmental conditions and dust characteristics by adjusting algorithm parameters and thresholds. However, when the algorithm parameters and thresholds are not selected, It will overfit or underfit when appropriate. The method in [68] can not only identify the photovoltaic panels in the floating photovoltaic power station, but can also give their location and pollution status, providing intuitive support for daily maintenance.
Future directions for the improvement of the method in [66] include using remote sensing data with a higher resolution and more time phases, combining them with ground observation data for verification and correction, developing a more accurate and applicable dust index, and considering other effects on solar cells such as factors affecting board performance such as temperature, humidity, and rain. The method in [67] assumes that the dust layer has a uniform surface, but in fact the dust particle size and distribution uniformity affect the attenuation and scattering of light. Therefore, future improvements can consider introducing particle size analyzers or image processing technology to obtain information on dust particle size and distribution uniformity and incorporate it into the model. The method in [68] uses VGG16 as a classifier. Although it achieves high accuracy and recall on the test set, VGG16 is a more complex and redundant model that requires more parameters and computing resources. In the future, we can consider using some more lightweight and efficient models, such as EfficientNet, ResNeXt, etc., to reduce the complexity and running time of the model while maintaining or improving classification performance.
Tommaso et al. [69] applied the Yolov3 network and computer vision technology to design an automatic multi-level detection model for panel defects based on drone aerial images. The model can detect panel shadows, delamination, and puddles including those caused by dirt and birdfall. The author verified the effectiveness and robustness of the model on two data sets, achieving average accuracy of more than 98% and about 70%, respectively. The authors also designed a false positive filter that can reject false defect detection results based on the area of the photovoltaic panel. Saquib et al. [70] used artificial neural networks (ANN) to predict the power output of solar panels based on dust and solar radiation as input parameters. The author designed a three-layer ANN model, using forward and backpropagation algorithms for training and optimization. The author verified the effectiveness and accuracy of the ANN model through experimental data.
The method in [69] can adopt more complex post-processing methods in the future, such as semantic segmentation or instance segmentation, to improve the accuracy of defect location and classification and avoid false positives or negatives. It can also use data fusion methods from more sources, such as multi-sensor or multi-modal data fusion, to increase the richness and reliability of detection information. The method in [70] uses a three-layer artificial neural network (ANN) model to predict the power output of the PV system, but this model may not be sufficient to capture the nonlinear relationship between the input and output. Future improvements can use more complex neural network models, such as CNN or LSTM, to improve prediction accuracy and generalization capabilities.
The above-mentioned methods for detecting PV panel overlays based on image processing also have some shortcomings. Ref. [66] does not support the processing of high-resolution images (such as drone images), which may affect the detection accuracy. The satellite data available in [66] may also have cloud occlusions or other quality issues that [67] requires preprocessing or filtering. Measuring dust needs to consider the influence of light, angle, color, and other factors on image quality, as well as differences in the shape, size, and distribution of dust particles. Ref. [67] also needs to pre-process and enhance the image to improve contrast and clarity, and remove noise and interference. Ref. [68] uses visible light images to detect contaminated PV panels in floating PV power plants. Texture features and pixel features also need to be considered, as well the as evaluation and transfer learning of various network models, and it may also be affected by factors such as camera quality, module angle, and site terrain. Ref. [69] needs to consider the influence of environmental factors, such as temperature, wind speed, cloud overlays, etc., to reduce errors and noise. Ref. [69] also requires high-resolution images to efficiently detect subtle defects such as microcracks. Ref. [70] requires a lot of computing resources and time to process images, which may cause delays.
Overlay detection techniques based on image processing are affected by weather conditions. Ref. [66] needs to be performed under clear weather conditions, as clouds affect the intensity and spectral distribution of solar radiation. The detection of dirt is affected by meteorological factors such as wind speed, rainfall, temperature, etc., because these factors affect the transportation, deposition, and washing off of sand and dust. Similarly, the method for identifying pollutants in floating PV power plants in [68] needs to be carried out at around 10 AM on a sunny day, because the angle and intensity of sunlight during this time period are more suitable for taking visible light images. This method will be affected by weather conditions, such as cloudy, rainy, foggy, etc., because these types of weather will reduce the sharpness and contrast of the image, making it difficult to distinguish the edges of PV modules and contaminants. The weather conditions required for detecting PV panel defects in [69] are also sunny. The ambient temperature is higher than 15 degrees Celsius, the wind speed is not too high, and the solar radiation intensity is moderate, which can ensure the stable flight of the drone, the clarity of the infrared image, and the brightness of the visible light image. If the weather is too dark or the wind speed is too high, it may cause blurred images or increased noise; if the light is too strong or too weak, it may cause the overexposure or underexposure of the image; if there is rain, snow, or haze, it may cause image distortion or interference. The method in [70] for detecting dust in PV systems also needs to be carried out under weather conditions with sufficient solar radiation, because the image processing needs to capture the reflection of sunlight on PV panels. The PV panel image in [67] is obtained through an indoor image acquisition experiment; whether it is sunny or cloudy, rainy or foggy, it will not be affected by the weather conditions.
The method in [66] for detecting dirt on PV solar panels in an arid environment can detect sandy, dry, and bare soil, while [66,70] cannot detect gaseous or particulate pollutants from air pollution. The effect of air pollution on PV panels is soft shading; that is, it will not be directly deposited on the surface of PV panels, but will change the intensity and spectral distribution of solar radiation. Feces, fungi, lichens, pollen, etc., are some biological sources of dirt, which are difficult to identify from satellite images in [66] due to their small amount, uneven distribution, or light color. These types of dirt may require higher-resolution imagery or photos taken by drones to be detected. The method in [67] for evaluating dust levels on PV panels can detect five typical dust pollutants, which are sand, ash, laterite, coal dust, and cement. Overlays that are similar in color to PV panels or transparent, such as water droplets, ice and snow, glass shards, etc., or overlays with too small or large particle sizes, such as bacteria, pollen, leaves, bird droppings, etc., will not be included in the detection method in [67]. The method for identifying pollutants in floating PV power plants in [68] can identify mainly bird droppings, because bird droppings are the most common and most performance-affecting pollutants in floating PV power stations. Pollutants such as dust and water droplets that overlay a small area or are similar in color to PV modules, or pollutants such as leaves and weeds that overlay the edges or corners of PV modules [68], cannot be detected. The method of detecting dust in PV systems in [70] can identify the types of overlays such as dust, bird droppings, leaves, etc., which will form a film or plaque on the PV panel to block the incidence of sunlight.
Refs. [66,68,69,70] are all influenced by geographic location. Refs. [66,68,69] have different types of overlay features and climatic conditions in different regions, thus the accuracy of different soil indices used to detect pollution in [66] will be affected, and the image processing effect in [68,69] will be affected. The method in [70] was designed for the desert climate of the UAE and thus may not be applicable in other regions. The indoor image acquisition experiment in [67] is carried out indoors and will not be affected by the geographical location.
Refs. [66,67,69,70] are all affected by the shooting angle. The method in [66], using remote sensing data to detect solar panel pollution in arid environments, is affected by the viewing angle of satellite sensors, which affects the spatial resolution of satellite images, which in turn affects the level of detail in and clarity of images. In [67,70], the shooting angle will affect the distribution and shape of dust in the image, thus affecting the accuracy of image processing. The method of detecting PV panel defects in [69] is based on a vertical overlooking image taken by a drone. This shooting angle can minimize the distortion and perspective effect within the image, and improve the accuracy and consistency of detection. If the shooting angle is not vertical, the shape of the PV panel in the image will change, which will affect the effect of edge detection and image rotation. The method in [68] is aimed at hydro-PV power plants, not PV solar panels in arid environments, and will not be affected by the camera angle.
Table 1 shows a summary of the advantages and disadvantages of image processing methods for detecting PV panel overlays.

2.2. Overlay Detection Technology Based on Deep Learning

PV panel overlay detection technology based on deep learning is a technology that uses artificial intelligence algorithms to identify and locate foreign objects on PV panels to evaluate their impact on PV power generation efficiency [71,72]. PV panel overlay detection technology based on deep learning needs to consider many factors such as the type and structure of the photovoltaic panel and the selection and optimization of the deep learning model.
PV panel overlay detection technology based on deep learning needs to consider the type and structure of PV panels [73] as well as appearance characteristics and defect patterns of the PV panels. Different types of PV panels, such as crystalline silicon, thin film, heterojunction, etc., have different colors, textures, shapes, reflectivity, and other characteristics, as well as different defect types and distributions, such as cracks, stains, hot spots, PID, etc. These characteristics and defects will affect the quality and information content of the input image in the deep learning model, and require corresponding preprocessing and enhancement, such as denoising, contrast enhancement, normalization, etc. At the same time, it is also necessary to choose an appropriate deep learning model to extract and identify these features and defects. For example, CNN can effectively process local features in images, and generative adversarial networks (GANs) can generate clearer and more realistic images.
The selection and optimization of deep learning models are factors that need to be considered in PV panel overlay detection technology based on deep learning [74]. First, we must preprocess the data, including data cleaning, normalization, standardization, and other operations to reduce noise and redundant information in the data and improve the training effect of the model. Secondly, we must choose a deep learning model suitable for the task, and select the appropriate model structure and number of layers based on the complexity of the problem and the characteristics of the data set. Then we must choose an optimization algorithm suitable for the task, such as stochastic gradient descent (SGD), Adam, RMSprop, etc. In addition, hyperparameters need to be considered, and these hyperparameters need to be adjusted through experiments or a grid search to achieve optimal model performance [75]. It is also necessary to use the training data set to train the model and update the parameters of the model through the back propagation algorithm. Finally, the test data set is used to evaluate the trained model, and the accuracy, precision, recall, and other indicators of the model are calculated.
Deep learning models can handle large-scale datasets and are highly scalable. Therefore, the dust detection technique can be applied in various scenarios. The deep learning model can extract high-level features, which have a better abstraction capability for dust detection. Compared with traditional feature extraction methods, deep learning models can better represent image information, thereby improving the accuracy of dust detection [76].
However, it should be noted that the PV panel dust detection method based on deep learning also has some challenges, such as the need for a large amount of labeled data, and the high time cost of model training and tuning. Deep learning models also consume a lot of computing resources for training and inference, which may limit their applicability in real-world scenarios [77]. Additionally, the deep learning model has many hyperparameters that need to be tuned carefully to obtain the optimal dust detection performance, which requires a lot of time and expertise [78]. Moreover, in practical applications, it is also necessary to consider the impact of factors such as the position of PV panels, camera installation, and lighting conditions on the detection results, and to comprehensively consider other environmental monitoring indicators for comprehensive evaluation and decision-making. Many scholars have conducted in-depth research on photovoltaic panel overlay detection technology based on image processing methods.
M. S. H. Onim et al. [79] introduce a novel dataset of images of solar panels in clean and dusty conditions and use it to benchmark several state-of-the-art (SOTA) discriminant analysis algorithms. The authors also propose a new CNN architecture, SOLNET, which outperforms the existing SOTA algorithms in terms of accuracy and efficiency. The authors demonstrate that SOLNET can achieve an accuracy rate of 98.2% in detecting the level of dust on solar panels. S. P. Pathak et al. [80] employ two advanced convolutional neural network architectures for solar panel fault detection and localization. The first model, based on Resnet-50 transfer learning, classifies the images of solar panels into different fault categories and achieves an F1 score of 85.37%. The second model, based on Faster region-convolutional neural networks (R-CNN), detects the regions of interest for faulty panels and achieves an average precision of 67%. Authors compare their models with other existing methods and show their superior performance and efficiency. Qi Li et al. [81] present SolardiAgnostics, a cost-effective system that automatically detects and describes damage on rooftop solar PV arrays using roof images. SolardiAgnostics overcomes the limitations of existing machine learning methods that fail to distinguish damage from other solar degradations, such as shading, dust, and snow. SolardiAgnostics first applies the K-means algorithm to segment roof objects and extract the contours of the solar panels. Then, it uses a convolutional neural network to classify and characterize the damage on each solar panel profile.
The model used in the approach in [79] has a lower computational complexity and trainable parameters while achieving an accuracy of 98.2% on the test set, surpassing the current state-of-the-art models. The categories within the dataset could be expanded in the future to include different degrees and types of dust accumulation and to collect more diverse and larger-scale image data under different environmental conditions. SolNet can also be fine-tuned in the future to optimize hyperparameters and network structure. The method in [80] uses a data set of only 837 thermal images and only contains five fault types. This may limit the generalization ability and robustness of the model. In the future, more data can be collected, including different photovoltaic panel models, different environmental conditions, different failure modes, etc., so that the model can have better performance and adaptability. The method in [81] requires first obtaining images of rooftop solar panels from the Internet, and then segmenting, preprocessing, detecting, and analyzing the images. These steps may consume a large amount of time and computing resources. Future improvements can use faster and more efficient methods such as drones or satellites to collect and process image data, which can adapt to more scenarios and needs.
M. E. Ydrissi et al. [82] analyze the impact of dust on solar systems using the GEP research platform. They propose a dust-detection system that combines a convolutional neural network classification method with an image processing algorithm. The authors use an advanced deep learning method to classify different degrees of dust, and achieved an accuracy rate as high as 96%, demonstrating the application potential of deep learning in the field of solar energy. They also use GPS coordinates to record the location of each measurement in order to map the dust distribution within the solar field. Fan et al. [83] developed a novel deep residual neural network (DRNN) for estimating regional dust concentration. The DRNN used skip connections to reduce the dimensionality of the weight matrices, enhancing the network’s flexibility and feature extraction capability. Moreover, the authors proposed an image preprocessing method for dust detection, which involved several steps such as silver mesh removal, nonlinear interpolation, equivalence partitioning, and clustering. To evaluate the performance of the DRNN, they introduced a new error metric, called the error circle, which measured the consistency between the predicted and observed results. The electroluminescence (EL) method, which uses an infrared camera, enables the detection and classification of defects in solar PV cells. Tella et al. [84] demonstrated the effectiveness of deep learning networks, such as AlexNet and Senet, for this task.
The advantage of the method in [82] compared to other methods is that, by using a black background, the impact of changes in sky color on the image can be eliminated and the accuracy of classification can be improved. The method in [83] designed an image preprocessing method, including image transformation and correction, silver screen removal, nonlinear interpolation, equivalent segmentation and clustering steps, for classifying dust accumulation in photovoltaic panel images. detection. This method can effectively eliminate image distortion and silver screen interference, and obtain dust distribution information. Compared to the methods in [82,83], the method in [84] can adapt to different image resolutions, formats, and defect types without requiring specific adjustments or optimizations for each case.
The data set used by the method in [82] only contains 2000 Fresnel mirror RGB images collected at the Moroccan GEP research platform. The data set used by the method in [3] mainly comes from existing public data sets. These data sets may not cover all defect types and scenarios. The direction of future improvements in [82,84] is to collect more images and increase the diversity and richness of data, thereby increasing the coverage and practicality of the model. Although the DRNN model proposed by the method in [83] has a high prediction accuracy, it also has certain limitations, such as the selection of the number of network layers and neurons, the design of activation functions and loss functions, etc. In the future, we can try to use other deep learning models or improve the structure and parameters of the DRNN model to improve the generalization ability and efficiency of the model.
Khilar et al. [85] proposed a deep belief network model for dust detection in large-scale solar panel systems. The model used multiple features, such as solar irradiance, temperature, and dust accumulation on the panels, to estimate the atmospheric dust concentration and to determine the optimal cleaning schedule. The authors evaluated the performance of the model through simulation and reported the accuracy, precision, recall, and F-measure of the results. Prabhakaran et al. [86] presented a real-time multivariate deep learning model (RMVDM) for detecting and localizing various defects on solar panels, such as spotlights, cracks, dust, and micro-cracks. The authors used a region-based histogram approximation (RHA) algorithm and a gray scale quantization algorithm (GSQA) to preprocess the image dataset and to extract image features. These features were then fed into a multivariate deep learning model, which consisted of multiple layers of neurons, each assigned to a different defect class. Each neuron was trained to compute the deficiency class support (DCS) for its corresponding class. During the testing phase, the input image was processed by the same preprocessing steps and the trained model. Hanafy et al. [87] developed a method that combined machine learning and image processing techniques for detecting the cleanliness of solar panels. The method used ground and aerial images and performed background subtraction and complex feature extraction to estimate the amount of dust on the panels. The method addressed the limitations of previous works, such as relying on raw features, fixed camera position, fixed background, and manually cropped images. The authors demonstrated the high efficiency and robustness of the method under different classification algorithms.
The method in [85] is able to consider multiple input metrics, including solar radiation, ambient temperature, and dust levels on the panels, resulting in a more accurate estimate of the dust content in the atmosphere and panel cleaning frequency. The method in [87] does not rely on fixed backgrounds, fixed cameras, or manually edited images, but uses ground and aerial images and applies automatic background removal and complex feature extraction. Compared with the methods in [85,87], the model used in the method in [86] uses some novel algorithms for preprocessing and feature extraction, such as the regional histogram approximation algorithm and gray quantization algorithm. These algorithms can effectively remove noise from images, enhance image quality, and extract features that aid in defect detection and localization. This model is also the first time that deep learning and high-order texture localization technology have been combined to be applied to photovoltaic panel defect detection and localization problems.
The methods in [85,86,87] can all increase the diversity of data sets in the future and use photovoltaic image data sets from more sources and scenes to improve the generalization ability and robustness of the model. In the future, the method in [85] can also use more hidden layers or different types of neurons to build deep belief network models, increase the nonlinearity and expressiveness of the model, and improve the fitting effect and classification performance of the model. The method in [87] can explore more deep learning network structures and parameters in the future, such as convolutional neural networks, residual networks, attention mechanisms, etc., to improve the expression ability and efficiency of the model.
The above methods for detecting PV panel overlays based on deep learning also have some shortcomings. Ref. [79] require a lot of computing resources and time to train and test the model, and cannot distinguish between different degrees or types of dust. Refs. [80,83,85,87] require a large amount of labeled data to train deep learning models. High-quality roof images are required in [81] to accurately detect and localize damage on solar panels, and only three types of damage can be identified: cracks, breaks, and burns. The monitoring system in [82] needs to operate under severe weather conditions, which will affect its stability and accuracy. The system in [84] cannot recognize some complex defect types and does not classify some defects accurately enough. The model in [85] makes it difficult to tune the parameters and optimize the objective function. The experiments in [87] also suffer from the temporal metric instabilities of the method.
Deep learning-based overlay detection technology is affected by weather conditions. The methods in Refs. [79,80,81,82,83] need to be carried out under weather conditions with sufficient light and clear vision, because this can guarantee the image quality and the effect of feature extraction. The damaged solar cell in [80] is most obvious on the infrared image, the dust particles on the mirror surface in [82] are easier to capture and distinguish in the RGB image, and the accuracy of image analysis in [81,83] is higher. The methods in Refs. [84,85,86] do not need to be carried out under specific weather conditions, because it does not depend on the exposure of sunlight and is not limited by the weather. In [85], only data such as light intensity, temperature, and dust level need to be collected. The method in Ref. [87] needs to be carried out under dry and dusty weather conditions, because these conditions will lead to more dust and dirt deposition on the PV panels.
The method in Ref. [79] can detect different types of particulate matter such as ash, cement, sand, and soil, and liquid or gaseous substances such as rain, dew, and fog [79,82] are difficult to detect. The method in Ref. [80] can detect single-battery hotspots, multi-battery hotspots, diode failures, and other types of overlays and the method in Ref. [84] can detect overlays that affect the luminous intensity of the battery board, such as dust and other types of overlays [80,84] is not detectable. The method in [81] can detect snow, hail, dust and other types of overlays, but cannot detect some transparent or translucent overlays such as plastics and glass. The method in Ref. [82] can detect dust, sand, pollen, bird droppings and other types of overlays. The methods in Refs. [83,85] are mainly used for the recognition of overlays of dust, such as water droplets, snowflakes, etc., which will not have a significant impact on the color of the image, which is difficult to recognize. The method in Ref. [86] can detect hot spots, erosion, dust, etc., but cannot detect snow layers and micro cracks. The method in Ref. [87] can detect many types of mulch such as bird droppings, snow, water stains, microorganisms and fungi.
The methods in Refs. [79,80,81,86,87] will all be affected by the shooting angle. In [79], the shooting angle will affect the characteristics of the image such as illumination, shadow, contrast, and sharpness, thus affecting the analysis and recognition of the image by the CNN. The shooting angle in [80] will affect the quality and accuracy of thermal imaging. Different shooting angles in [86] will lead to changes in the viewing angle of the PV panel image, which will affect the size, shape, proportion, etc., of the image, thereby affecting the effect of image segmentation and feature extraction. The shooting angle in [87] will affect the reflection and scattering on the surface of the PV panel, thereby affecting the color, texture, and spectral characteristics of the PV panel. The methods in Refs. [83,84] may be affected by camera angle. The shooting angle in [83] may affect the geometry of the image and the visual effect of dust. In [84], the shooting angle will affect the quality and quantity of the panel luminescence captured by the infrared camera. If the shooting angle is too large or too small, it may cause partial areas of the panel to be obscured or distorted, thereby affecting the identification and classification of defects. The method in Refs. [82,85] will not be affected by the shooting angle. A black background is used in [82] to block out the color variations in the sky, thus avoiding the interference of the shooting angle on the dust detection. Ref. [82] also uses a residual neural network to classify images, which has strong feature extraction and recognition capabilities and can adapt to different shooting angles. The method in [85] is not based on image recognition but on data analysis.
Table 2 shows a summary of the advantages and disadvantages of deep learning methods for detecting PV panel overlays.

2.3. Overlay Detection Technology Based Non-Image Methods

In addition to the overlay detection technology based on image processing and deep learning, there are some other methods. These methods do not process images and do not use computer vision, but they can also detect overlays such as dust on PV panels.

2.3.1. Gray Box Model Method

Gray box modeling is a method that combines theoretical models and empirical data, and can be used to describe the performance of PV panels under various environmental and voltage conditions. Castellà Rodil et al. [88] developed a new method based on data analysis, which used the information collected by the existing sensor equipment in the PV power station to generate a gray box model for each PV panel, and to evaluate the occurrence and impact of dust with fitting coefficients. This method leveraged the data provided by the existing supervisory control and data acquisition (SCADA) system, and followed the steps of parameter selection, state matrix construction and update, similarity operator design, etc., to achieve high-accuracy and fast-response dust monitoring.

2.3.2. Data-Driven Method

Shaaban et al. [89] developed a novel data-driven method based on machine learning, which used experimental data and regression tree models to estimate the amount of dust accumulated on PV panels according to factors such as solar radiation, ambient temperature, and the output power of PV panels. The authors used a regression tree algorithm to predict the amount of dust by partitioning the prediction space and finding the function that best fits the data. Through different case studies, the authors validated the accuracy and advantages of the regression tree model and compared it with other regression models.

2.3.3. Dust Concentration and Photoelectric Conversion Efficiency (DC-PCE) Model

Fan et al. [90] developed a novel method for analyzing the energy efficiency loss in a PV systems, which was used to evaluate the impact of dust accumulation on the energy efficiency loss in PV systems, and to quantify the relationship between the degree of dust accumulation and power generation performance. The authors investigated the effects of six representative dust pollutants on PV module performance. They considered the performance degradation law of PV modules under different irradiances, and proposed the concept of saturation irradiance point. Based on the relationship between the output power of PV modules and dust concentration, they established a theoretical model of DC-PCE to evaluate the quantification of dust accumulation effect.

2.3.4. Condition Monitoring System

García Márquez et al. [91] proposed a novel condition monitoring system for detecting dust on solar PV panels. The system used a radiometer and a thermal imaging sensor mounted on a drone to detect dust by analyzing the emissivity of the object surface. The authors conducted experiments in various scenarios in the laboratory and outdoors, considering different distances and angles between the sensor and PV panels, as well as different levels of dust coverage. The authors used thermal imaging sensors to validate the reliability of radiometer data and an IoT platform to transmit and analyze radiometer data. For example, in scenarios 1.1 and 1.2 in the paper, the temperature in Z3 is lower than that in Z1 and Z2, but they differ from the radiometer sensor by 2 ºC. The temperature analysis obtained by the radiometer sensor in Z4 of Scenario 1.3 is lower than Z3 in Scenarios 1.1 and 1.2 because the area with dust is larger. The authors showed that the system could effectively detect dust on PV panels and improve the efficiency and reliability of PV panels, reducing maintenance costs and time.

2.3.5. Arduino-Based Dust Removal System

Arduino is an open-source platform that enables the development of various microcontroller-based projects. Malik et al. [92] proposed an Arduino-based system that can automatically estimate the dust deposition on solar panels and report it to the cloud. The system can measure the open circuit voltage and ambient brightness of the solar panel to determine the need for cleaning, and send an email notification to the maintenance staff. The aim of this system is to use the IoT framework to intelligently monitor the status of each solar panel and transmit the data to a specially developed automatic maintenance decision algorithm through an embedded controller. The authors validated the functionality and performance of the system through experiments, demonstrating that the system can effectively enhance the power generation efficiency and lifespan of solar PV systems.
The advantage of the method in [88] is that it does not require any additional equipment or human intervention, and it can utilize the existing data acquisition system from the PV power plant. In addition, it can analyze each PV panel individually to determine dust distribution and trends. The advantage of the method in [89] is that it can use actual measurement data, and does not depend on theoretical models or assumptions, which is more realistic and reliable. It can also be updated and optimized with new data without rebuilding the model, making it more adaptable and robust. The method in [90] considers the nonlinear power generation characteristics of PV modules under low irradiance, and introduces the concept of the saturated irradiance point, so that the model can better adapt to the actual operation under different irradiance conditions. It adopts the soft measurement method, uses the weight difference of the glass sheet to calculate the dust concentration, avoids the dust loss and measurement error caused by the traditional wiping method, and ensures the accuracy of the experimental data. The system in [91] can verify the reliability of the radiometer data through the thermal imaging sensor, which enhances the robustness and stability of the system. It can also assist solar PV panel maintenance personnel to find and remove dust in time, thereby improving the power generation efficiency and service life of solar PV panels, and reducing energy loss and maintenance costs. The advantage of the system in [92] is that it can improve the power generation efficiency and service life of solar panels, and reduce the energy loss caused by dust. Moreover, the Arduino platform can be used to facilitate development and expansion.
The limitation of the approach in [88] is the need to adapt the theoretical model of PV panels to different types and sizes of panels. It is also affected by the quality and completeness of the PV plant data. If data are missing or abnormal, it may affect the accuracy of the model. The training and testing of the model in [89] requires a large amount of data, and the quality and completeness of the data will affect the performance and accuracy of the model. They also need to pay attention to the generalization ability and stability of the model, some models may be sensitive to changes or noise in the data. The limitation of the method in [90] is that its model needs to use the weight difference of the glass pieces to calculate the dust concentration, which requires additional equipment and operations, which may increase the cost and complexity of the measurement. The system in [91] needs to consider the flight safety, stability, and regulations of UAVs, as well as the weight, size, and power consumption of radiometers and thermal imaging sensors, which may limit the application range and performance of the system. Its system also needs to consider the distance and angle between the sensor and the object surface, as well as the sensor’s field of view angle, which may affect the shape and area of the target area measured by the sensor, as well as the sensor’s measurement accuracy and reliability. The system in [92] requires additional hardware and software costs, such as Arduino controllers, sensors, batteries, cloud services, etc.
These dust and other overlay detection technologies that do not process images and do not use computer vision have the advantages of high efficiency, high precision, and a high degree of automation. They greatly reduce the need for human resources and increase the speed and accuracy of overlay detection. Table 3 shows a summary of the advantages and disadvantages of non-image methods for detecting photovoltaic panel overlays.
PV panels are susceptible to the accumulation of various types of overlays on their surface [93,94]. These include snow, dust, leaves, and other debris that can obstruct direct sunlight and impair the solar energy harvesting capacity of PV panels, leading to reduced power output. Moreover, the overlays can increase the surface temperature of PV panels by absorbing solar radiation and converting it into heat. Elevated temperatures can adversely affect the efficiency of PV panels by lowering their energy conversion rate. Additionally, the overlays can contain dust, dirt, and other contaminants that can form a film on the PV panel surface, interfering with light transmission and absorption, and further degrading the PV panel performance [95]. The overlays can also contain corrosive substances that can deteriorate the surface material of PV panels, and even harm the battery and other components, affecting their functionality and lifespan. Therefore, the timely removal of the overlays and maintaining the cleanliness of PV panels are essential to ensure the normal operation of the PV system and prevent these failures. It is also imperative to conduct PV panel fault detection along with PV panel overlay detection [96,97].

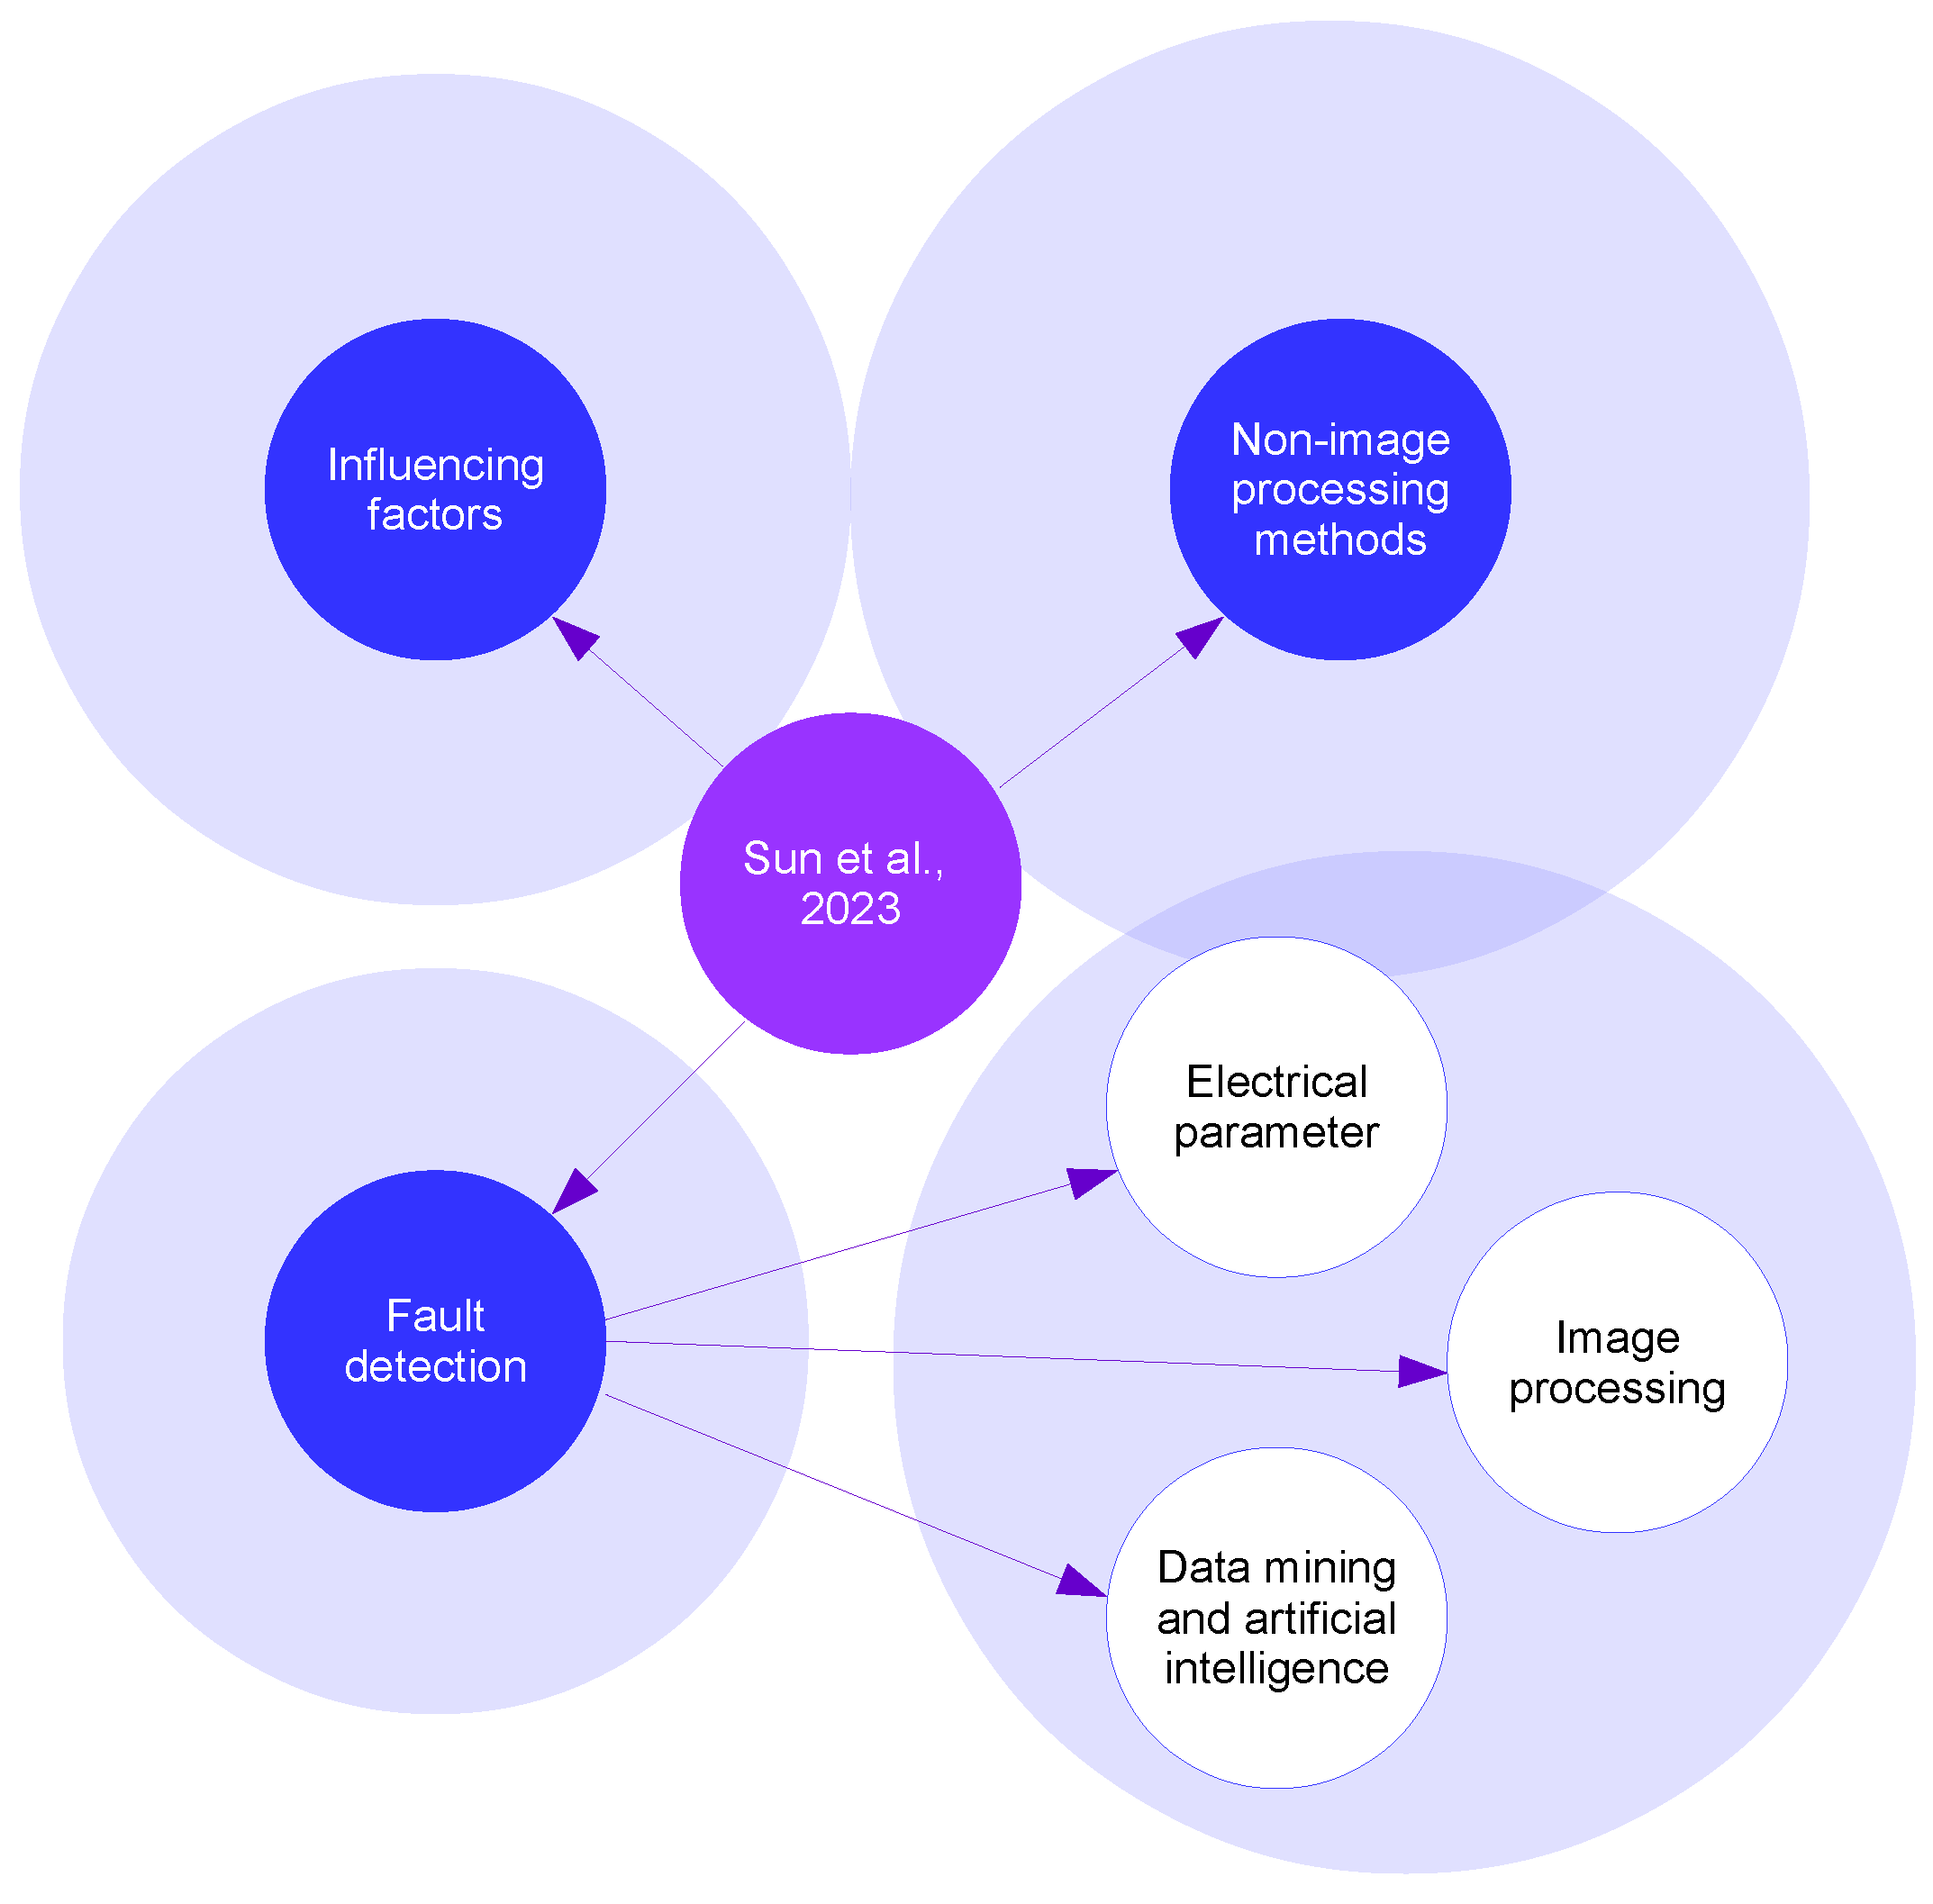
3. PV Panel Fault Detection

PV panel fault detection is a technique that detects and diagnoses the failure of PV panels in solar PV systems. PV modules can suffer from common quality issues such as hot spots, cracks, and power degradation. These issues can impair the performance and lifespan of the components, and even pose safety risks [98]. Therefore, the timely detection and resolution of PV panel failures are crucial. The objective of fault detection is to accurately identify and locate faults on PV panels, so that corrective actions can be taken to ensure the normal operation of PV systems and optimal power generation efficiency. A schematic diagram of PV panel fault detection is shown in Figure 5.
The fault detection methods used for PV panels mainly include intelligent methods, analytical methods, hybrid methods, and metaheuristic methods [99,100,101,102,103].
The intelligent method of detecting photovoltaic panel faults uses artificial intelligence and machine learning technology, and uses a large amount of data to train algorithms to identify and locate photovoltaic panel faults. This method can use the model to perform fault diagnosis by monitoring the performance parameters, temperature, voltage and other data of photovoltaic panels. Common intelligent methods include neural networks, support vector machines, decision trees, etc.
The principle of using an analytical method to detect photovoltaic panel faults is to model and analyze the photovoltaic panel system through theoretical models, mathematical analysis, and other means to identify potential faults. By analyzing the current–voltage curve, power curve, and other characteristics of the photovoltaic panel, signs of failure can be found. Common analysis methods include equivalent circuit models, maximum power point tracking algorithms, etc.
The principle of using the hybrid method to detect photovoltaic panel faults is to combine the advantages of intelligent method and analytical method, aiming to improve the accuracy and robustness of photovoltaic panel fault detection. This method can use the actual data measured by the sensor and combine them with mathematical models and machine learning algorithms for a comprehensive analysis to improve detection accuracy.
The principle of the metaheuristic method to detect photovoltaic panel faults is to use a heuristic search algorithm to find the optimal solution or a solution space close to the optimal solution by simulating the optimization process in nature. This method can be used to optimize the performance of photovoltaic panel systems, find the optimal operating point, and make optimal adjustments when the system fails. Typical metaheuristic methods include genetic algorithms, particle swarm optimization, etc.

3.1. Intelligent Method

The basic principle of the intelligent method is to use drones, cameras, and other equipment [104,105,106] to collect visible light and infrared images of photovoltaic panels, and then use artificial intelligence technologies such as neural networks [107,108,109,110,111], fuzzy logic [112,113,114], and expert systems [115,116,117] to analyze and process the images to identify defects and failures in photovoltaic panels, such as hot spots, weed obstruction, stains, bird droppings, breakage, etc.
Wang et al. [118] developed an intelligent monitoring system for PV panels based on infrared detection, using infrared thermal imaging cameras to acquire heat maps of PV panels under different health conditions, such as normal, cell defects, glass cracks, and surface contamination. The authors proposed four feature criteria to characterize the contour patterns in the mask image, and then applied three classifiers to diagnose different types of PV panel faults based on the values of these criteria. The study’s results demonstrate that the combination of a trained U-Net neural network and a decision tree can achieve 99.8% accuracy in fault diagnosis.
The method in [118] utilized drones or other remotely operated equipment to obtain infrared thermal images of photovoltaic panels, thereby quickly and easily obtaining temperature distribution and fault information. The U-Net network it uses can effectively extract target areas from images and generate high-precision segmentation results. U-Net does not require any fully connected layers, only uses convolution of the effective part, and predicts pixels in the boundary region by mirroring the input image. This reduces network parameters and computational effort while improving resolution and accuracy. This method also has limitations, as it can be affected by environmental factors that can reduce the quality of the infrared heat map or increase error rates. The method in [118] uses three data augmentation methods (mirror, flip, and cropping) to expand image samples, but these methods will cause the loss or distortion of some information. In the future, other data enhancement methods can be tried, such as rotation, scaling, translation, noise addition, etc., to improve the diversity and quality of image samples. Decision trees are used as classifiers for fault diagnosis in this article, but decision trees may have some shortcomings, such as being sensitive to noise and prone to overfitting, and not being suitable for processing continuous variables. In the future, other fault diagnosis algorithms can be considered, such as random forest, neural network, Bayesian network, etc., to improve the efficiency and sensitivity of fault diagnosis.
Siya Yao et al. [119] propose an intelligence-based and data-driven fault detection method for PV power plants, which enables performance evaluation, fault identification, and operation and maintenance recommendations for PV systems. The author first preprocessed the historical monitoring data, including outlier detection, feature analysis, and data pre-classification, and divided the data into three subsets: ideal period, transition period, and recession period. Secondly, based on the data in the ideal period and the recession period, the author, respectively, constructs the regression prediction model of the upper bound and the lower bound, adopts an XGBoost algorithm based on tree integration, and considers the discontinuous characteristics of PV power generation data through clustering and the correction of weather factors, improving the accuracy and stability of the forecast. Finally, the author divides the operating state of the PV system into five stages by comparing the real-time measured power with the upper and lower reference values, and gives corresponding fault types and operation and maintenance suggestions according to the different stages. The authors performed experimental validation on a 6.95 MW PV power plant, and the results show that the method can effectively detect direct and indirect faults and improve the reliability and efficiency of PV systems.
Peijie Lin et al. [120] proposed a photovoltaic array fault diagnosis scheme based on a multi-scale SE-ResNet network, which can automatically extract multi-scale fault features from current–voltage curve data and environmental parameters, and weight and fuse the features of different channels to improve the effect of feature expression. The author designed a multi-scale receptive field fusion (MRFF) module to expand and fuse receptive fields of different scales to extract more detailed fault features. This module achieves different scales of receptive field expansion by stacking multiple shared convolutions, and fuses features of different scales. In 20 simulations, the model achieved an average classification accuracy of 100% on both the training and test sets. Correspondingly, the average classification accuracies on the actual training and testing datasets are 99.99% and 99.84%, respectively. In addition, compared with ResNet18 and 1D ResNet, the FD model proposed by this author has better diagnostic performance and stability.
Xiaoqi Chen et al. [121] proposed a photovoltaic system fault detection method based on a multi-input convolutional neural network, which introduces the Inception network structure with a space scaling function and the SE network structure with a channel attention mechanism, and optimizes the feature extraction and recalibration capability. In this method, the Hankel-SVD method is used to denoise the original current signal, which effectively avoids the influence of the switching frequency of the inverter on the subsequent diagnosis accuracy. The results show that after adding the SE module, the shadowing accuracy is improved to 93.33%. Experimental results show that the model can not only effectively resist dynamic fast shadows, MPPT, and strong wind interference, but also can identify long-line faults, single-string systems, and array or module aging with 100% accuracy, further verifying the strong adaptability of the model.
The method in [119] constructs a discontinuous regression prediction model, and uses the tree integration algorithm, clustering results, and weather factors to correct the predicted value to adapt to the characteristics of PV power generation data. This method is divided into five operation stages by comparing real-time measured power with upper and lower reference values, and gives corresponding fault type and operation and maintenance suggestions, which can effectively detect direct and indirect faults. However, this method needs to adjust the parameters of the division stage according to the actual situation, which may have certain subjectivity and instability. The method in [120] can diagnose single faults, partial occlusion conditions, and compound faults under different degrees of dust coverage, and can simultaneously estimate the degree of dust coverage, providing a basis for making cleaning plans. Its limitation is that a large amount of labeled data are required to train a deep neural network, which increases the cost and time of data acquisition and processing. The method in [121] can utilize the signal characteristics of time domain and frequency domain at the same time, which improves the accuracy of fault detection. But this method does not consider other types of arc faults, such as parallel arc faults and ground arc faults.
The method in [119] uses two reference curves to evaluate the operating status of the PV system, which requires setting some threshold parameters, which may affect the sensitivity and accuracy of fault detection. In the future, more reference indicators, such as performance ratio or efficiency loss, can be considered to evaluate the performance of PV systems in more detail. The method in [120] is based on the multi-scale SE-ResNet network to diagnose faults and dust coverage affecting PV arrays. In the future, more efficient feature extraction and fusion modules can be explored, such as using attention mechanisms, multi-branch structures, and spatial pyramids, Pooling, etc., to enhance the model’s capture and integration of fault characteristics at different scales and details. The experimental data used in the method in [121] were simulated in a laboratory environment and may be somewhat different from arc faults in actual PV systems. In the future, we can try to collect more arc-fault data in real PV systems to improve the generalization ability and robustness of the model.
The advantage of the intelligent method is that it can handle nonlinear, uncertain, and complex problems, does not require prior knowledge of the mathematical model of the photovoltaic panel, and has the ability to self-learn and adapt. The intelligent method can realize high-efficiency, high-precision, and fully-automatic photovoltaic panel fault detection, which greatly improves the operation and maintenance efficiency and power generation of photovoltaic power stations. The disadvantage of the smart method is that it requires a large amount of training data and is difficult to explain its inner workings. Smart methods also require adjusting multiple parameters to adapt to different scenarios and needs.
Generally speaking, the performance of intelligent methods is better than traditional analytical methods because it can handle nonlinear, uncertain, and complex problems, and has self-learning and adaptive capabilities. However, intelligent methods also have certain limitations, such as requiring a large amount of training data and making it difficult to explain their internal working principles.
Currently, there are already some data sets and standards for photovoltaic panel fault detection that can be used to train and test artificial intelligence models. At the same time, there are also some artificial intelligence technologies, such as intelligent IV diagnosis, which have been applied in actual photovoltaic power plants and have shown good results and performance. Therefore, the ability of the intelligent method is relatively high. As long as there are appropriate data and technology, intelligent photovoltaic panel fault detection can be realized.
Generally speaking, the intelligent method is faster than the traditional analysis method because it can use parallel computing and optimization algorithms to improve the efficiency and accuracy of photovoltaic panel fault detection. However, the speed of intelligent methods is also affected by factors such as data transmission and processing time, and AI model training and update time. Therefore, the speed of intelligent methods also needs to be reasonably evaluated and optimized based on specific circumstances and needs.

3.2. Analytical Method

The analytical method is a method to detect photovoltaic panel failures based on the the physical characteristics of photovoltaic panels and mathematical models. The basic principle of this analysis method is to determine whether there is a fault in the photovoltaic panel, as well as the type and location of the fault, by measuring and analyzing the voltage, current, temperature, and other parameters of the photovoltaic panel. These parameters can reflect the output characteristics and working status of photovoltaic panels, and can also be compared with theoretical values or standard values to find abnormalities or deviations.
Commonly used methods of analysis include the following:
  • I-V curve method: This method analyzes the output power, conversion efficiency, series resistance, parallel resistance, and other parameters of the photovoltaic panel by measuring the current–voltage (I-V) curve of the photovoltaic panel, thereby determining whether the photovoltaic panel has hot spots, short circuits, Open circuit, aging, and other faults.
  • P-V curve method: This method analyzes the maximum power point, maximum power tracking (MPPT) effect, array mismatch, and other parameters of the photovoltaic panel by measuring the power–voltage (P-V) curve of the photovoltaic panel to determine whether the photovoltaic panel exists. Shadows, contamination, hidden cracks, and other faults.
  • Temperature method: This method analyzes the thermal characteristics, heat loss, thermal stress, and other parameters of the photovoltaic panel by measuring the surface temperature of the photovoltaic panel to determine whether the photovoltaic panel has hot spots, damage, aging, and other faults.
S. Sarikh et al. [122] proposed a fault detection and diagnosis method based on I-V curve analysis. The I-V curve can reflect the operating characteristics of the PV system, such as open circuit voltage, short circuit current, maximum power point, fill factor, series resistance and parallel resistance, etc. The authors mainly studied four types of faults: uniform dust faults, partial occlusion faults, short-circuit faults, and aging faults. These faults have different effects on the shape of the I-V curve, which can be identified by comparing the I-V curves under normal conditions and under fault conditions.
Abid et al. [123] developed a wireless sensor network-based method for detecting and controlling power loss in PV solar farms due to pollution and faults. Their method consists of a novel circuit attached to each solar panel that can monitor and regulate the panel’s output voltage, current and power, and transmit the data wirelessly to the main control and monitoring unit. Moreover, their method incorporates a maximum power point tracking sub-circuit on each panel to optimize its performance. There are currently some optimizers on the market with wireless sensor network-based methods for detecting and controlling power loss due to pollution and faults in PV solar farms. For example:
  • SolarEdge’s P-Series optimizers can achieve maximum power point tracking (MPPT) at the component level, and transmit the performance data of each component to the monitoring platform through wireless communication for fault diagnosis and maintenance [124].
  • Tigo Energy’s TS4-A-O optimizer can be connected to a cloud server through a wireless bridge to realize component-level intelligent monitoring and fast shutdown functions to improve power generation efficiency and safety.
  • SolarPoint’s SP-1 photovoltaic power optimizer can realize MPPT optimization, intelligent monitoring, and fast shutdown functions, and upload the power generation data (such as power, voltage, current, temperature) from each component to the server through the wireless sensor network, so that it can perform data analysis and exception handling.
Mohammadali et al. [125] investigate the impact of partial shading conditions (PSC) on hot spot formation in PV systems. They introduce two indicators for detecting PSC based on the shape of the power–voltage (P-V) curves, which are derived from the single diode circuit model with parameters updated by the measured irradiance and temperature of the PV modules. Real system P-V curves are obtained by measuring PV output current and voltage values from zero to open circuit conditions. The numerical P-V curves of the reference model were obtained from the main I-V characteristic formulation of the single diode circuit model, where the values of the electrical parameters were updated by the measured values of irradiance and PV temperature. They compared performance indicators such as maximum power point, fill factor, mismatch loss, and voltage drop in PV arrays under different shading modes. They found improvements in these performance metrics across all occlusion modes. For example, the maximum power point increases from 0.67 W to 1.23 W, the fill factor increases from 0.28 to 0.51, the mismatch loss increases from 0.33 W to 0.02 W, and the voltage drop increases from 0.36 V to 0.01 V. The authors compared different occlusion modes in Figure 8 in their article; they compared the P-V curves of the PV array under different shading modes, and the difference between the numerical reference model and the actual shading model. The experimental results show that their method can detect the occurrence and intensity of partial shading in real time, and can reduce the impact of shading and improve the output power and efficiency of PV systems.
Labar Hocine et al. [126] propose a fault detection method based on observing degradation indicators, which exploits the current–voltage characteristics of PV modules and newly introduced parameters such as triangle angle and current ratio. The method can identify different types of degradation such as glass scratches, EVA yellowing, wire oxidation, etc. The author introduces the structure and degradation phenomena of PV modules, and gives the corresponding mathematical models. The authors then design an observed degradation system (ODS) program and detail the degradation type identification method based on modeling and checklists for each identified degradation. The innovation of this paper is that some new parameters of triangle angle and current ratio are introduced to improve the detection of fault types and improve the sensitivity and accuracy of fault detection.
The method in [122] can determine the existence and type of fault by comparing the I-V curve under normal conditions and fault conditions without first understanding the historical data or model of the system. Advantages of the [123] approach include reduced wiring complexity and cost, as well as enhanced system flexibility and scalability. The method in [125] can differentiate between temporary and permanent partial shading conditions and estimate the intensity of shading and the timing of hotspot occurrence, thus protecting the PV system from damage. Also, there is no need for additional physical units/modules as a reference model, but a numerical method is used to generate the reference P-V curve, which can avoid possible physical damage and failure or partial occlusion of the reference model. The advantage of the method in [126] is that it does not require the shutdown of or intervention in the photovoltaic power plant, does not affect its normal operation, and can utilize existing data acquisition systems and cloud platforms to achieve remote and real-time detection.
The fault diagnosis method proposed in [122] is mainly based on the overall change in the I-V curve, but does not give specific fault location and quantitative methods, such as which module or battery the fault occurs in, and the severity of the fault, etc. In the future, other monitoring methods can be combined, such as voltage, current, temperature, power, etc., or machine learning, image processing, and other technologies can be used to achieve precise location and quantification of faults, providing more information for troubleshooting and maintenance. The method in [123] only provides an experimental verification of 12 photovoltaic modules, and does not provide experimental results and comparative analysis of different scales, different environments, and different fault types, nor does it provide an evaluation of the system’s error and accuracy. Experimental data and analysis can be added in the future. The method in [125] uses a parameter estimation method based on data table information, but this method is affected by data table quality and environmental changes, resulting in errors and uncertainties in parameter estimation. In the future, other parameter estimation methods can be considered, such as those based on the least squares method, a genetic algorithm, or a neural network, to improve the accuracy and stability of parameter estimation. The fault diagnosis system proposed by the method in [126] is based on a portable device that realizes online monitoring and evaluation of photovoltaic modules by controlling the duty cycle signal of the boost chopper. This system has some shortcomings. For example, the control of the chopper may affect the normal operation of the photovoltaic module, the maintenance and update of the equipment require additional costs, and the adaptability to photovoltaic modules from different manufacturers and models is limited. In the future, we can consider developing a wireless sensor network system that uses distributed sensors and communication technologies to realize remote monitoring and evaluation of photovoltaic modules and improve the flexibility and scalability of the system.
The advantage of the analytical method is that it can provide accurate and reliable results and has a strong theoretical basis. The analytical method can utilize existing measurement equipment and methods and does not require additional hardware or software, nor does it require intervention in the photovoltaic panels or changes to their operating conditions. The disadvantage of the analytical method is that it requires a deep understanding of the structure and working principles of photovoltaic panels, and has higher requirements for measurement equipment and environmental conditions. The analytical method also requires the establishment of appropriate mathematical models, the consideration of various influencing factors, and complex calculations and analysis, which may increase the time and difficulty of detection.
Generally speaking, the performance of analytical methods is higher because they are based on the physical properties of photovoltaic panels and mathematical models, can provide accurate and reliable results, and have a strong theoretical basis. However, the analytical method also has certain limitations. For example, it requires a deep understanding of the structure and working principles of photovoltaic panels, and has higher requirements for measurement equipment and environmental conditions. Some commonly used analysis methods, such as the I-V curve method, P-V curve method, temperature method, etc., already have relatively complete theories and tools and can be relatively easily applied to photovoltaic panel fault detection. However, some emerging analysis methods, such as those based on mathematical models or intelligent algorithms, require more research and development to effectively solve the problem of photovoltaic panel fault detection.
Currently, there are already some data sets and standards for photovoltaic panel fault detection that can be used to verify and evaluate the effectiveness and performance of analytical methods. At the same time, there are also some analysis methods, such as methods based on infrared image detection, which have been applied in actual photovoltaic power plants and have shown good results and performance. Therefore, the feasibility of the analysis method is relatively high. As long as there are suitable data and methods, the analysis of photovoltaic panel fault detection can be realized.
Generally speaking, the analytical method is faster than traditional manual inspection because it can use computers and instruments to improve the efficiency and accuracy of photovoltaic panel fault detection. However, the speed of analytics is also affected by factors such as data transmission and processing time, as well as the time taken up by training and updating analytics. Therefore, the speed of analytical methods also needs to be reasonably evaluated and optimized based on specific circumstances and needs.

3.3. Hybrid Method

The hybrid method is a method that combines the advantages of intelligent methods and analytical methods to improve the efficiency and accuracy of photovoltaic panel fault detection by combining artificial intelligence technology with mathematical models. The basic principle of the hybrid method is to collect visible light and infrared images of photovoltaic panels by using equipment such as drones and cameras, and then use artificial intelligence technologies such as neural networks, fuzzy logic, and expert systems to analyze and process the images to identify defects and failures on photovoltaic panels, such as hot spots, weed obstruction, stains, bird droppings, damage, etc. At the same time, the voltage, current, temperature, and other parameters of the photovoltaic panel are also measured and analyzed to determine whether there is a fault in the photovoltaic panel, as well as the type and location of the fault, such as short circuit, open circuit, aging, etc. Finally, the extent and status of the failure in the photovoltaic panel are determined by comprehensively considering the image and parameter information, as well as the physical characteristics and mathematical model of the photovoltaic panel.
Commonly used methods of mixing methods include the following:
  • Method based on image processing and neural networks: This method collects visible light and infrared images of photovoltaic panels by using equipment such as drones and cameras, and then uses image processing technologies such as filtering, segmentation, feature extraction, etc., to pre-process the images, thereby, removing noise and background and highlighting the features of the photovoltaic panels. Then they use neural network technology, such as convolutional neural network, recurrent neural network, deep neural network, etc., to classify and identify the image to determine whether there is a fault in the photovoltaic panel, as well as the type and location of the fault.
  • Method based on parameter measurement and fuzzy logic: This method determines whether there is a fault in the photovoltaic panel by measuring and analyzing the voltage, current, temperature, and other parameters of the photovoltaic panel, as well as the type and location of the fault. Then fuzzy logic techniques, such as fuzzy sets, fuzzy relationships, fuzzy reasoning, etc., are used to fuzzify and comprehensively evaluate the parameters to determine the status and extent of the fault in the photovoltaic panel.
  • Image- and parameter-based fusion method: This method improves the efficiency and accuracy of photovoltaic panel fault detection by combining image processing and neural network methods, as well as parameter measurement and fuzzy logic methods. This method can utilize the complementarity of images and parameters, as well as the synergy of artificial intelligence technology and mathematical models, to achieve optimization and improvement of photovoltaic panel fault detection.
S. Sarikh et al. [127] proposed a characteristic curve diagnostic algorithm based on fuzzy classification to detect and identify common faults in PV systems. They first extracted the electrical parameters of crystalline silicon components from experimentally measured I-V curves, and then calculated the deviation index of the curves for detecting bypass diode activation caused by partial shading using polynomial regression. Next, they generated fuzzy sets and rules for classifying faults based on a range of electrical parameters that varied under different fault conditions. Finally, they verified the accuracy and reliability of the algorithm by conducting a field test on an actual PV system. Experimental data from 27 conducted test scenarios show that the output of the fuzzy logic is more accurate when failures do not occur. The detection rate of detecting clean modules is 90.01%, the detection rate of detecting no shadow modules is 84.18%, and the detection rate of detecting no PID modules is 95.24%. However, the detection rates were 50% for detecting dust, 70.25% for detecting partial shadows, and 90.14% for detecting PID. Their study provides a simple and effective method for PV fault monitoring.
The advantage of the method in [127] is that it can identify different types of faults based on the variation in and range of electrical parameters, such as uniform dust, local shadowing, and potential-induced degradation. The method in [127] only considers three common fault types, namely uniform dust, local shadowing, and PID, but does not involve other faults that may affect the performance of the photovoltaic system, such as open circuits, short circuits, hot spots, cracks, etc. The range of fault types can be expanded in the future to accommodate more complex and diverse fault scenarios. In addition, quantitative indicators of fault severity, such as fault severity or fault impact factors, can be introduced in the future to more carefully evaluate the impact of faults on photovoltaic system performance.
Saliha Sebbane et al. [128] used artificial intelligence methods, including machine learning (K-nearest neighbor (k-NN), decision tree (DT), support vector machine (SVM), and artificial neural network (ANN)) to evaluate photovoltaic faults, and the results showed that ANN outperforms the other machine learning methods in classifying photovoltaic field defects. Due to the slow convergence speed of the learning phase of artificial neural networks, the author proposed a hybrid diagnosis method based on particle swarm optimization and a neural network (PSO-ANN) to improve the accuracy and convergence speed of ANN. The performance of the ANN and PSO-ANN methods was compared by using the current Ipv and voltage Vpv characteristics of the photovoltaic generator as identification parameters.
The advantage of the method in [35] is that, by using the PSO algorithm to optimize the weights and biases of the ANN, the method can achieve a lower mean square error (MSE) with a smaller number of iterations, and can achieve a classification accuracy of 99.94%, outperforming other machine learning methods. This method uses the current Ipv and voltage Vpv of the photovoltaic power generation system as identification parameters, which can be obtained by simple measurement equipment without complex data processing or feature extraction. The method in [35] also has some possible shortcomings. The performance of this method depends on the parameter selection of particle swarm optimization, such as population size, maximum number of iterations, cognitive factors, and social factors. The selection of these parameters needs to be based on the specific problem. Make adjustments, otherwise it may lead to overfitting or underfitting.
The advantage of the hybrid method is that it can make full use of various types of information and knowledge and can be adapted to different scenarios and needs. The hybrid method can handle nonlinear, uncertain, and complex problems, does not require prior knowledge of the mathematical model of the photovoltaic panel, and has self-learning and adaptive capabilities. Hybrid methods can also provide accurate and reliable results and have a strong theoretical basis. The hybrid method can achieve high efficiency, high precision, and fully automatic photovoltaic panel fault detection, which greatly improves the operation and maintenance efficiency and power generation of photovoltaic power stations. The disadvantage of the hybrid method is that it requires a comprehensive consideration of multiple factors and is more difficult to design and implement. The hybrid method also requires adjusting multiple parameters to adapt to different data and techniques, and may have certain errors and instability.
Generally speaking, the performance of the hybrid method is better than that of a single intelligent method or analytical method, because it can make full use of various types of information and knowledge, and can adapt to different scenarios and needs. The hybrid method can handle nonlinear, uncertain, and complex problems, does not require prior knowledge of the mathematical model of the photovoltaic panel, and has self-learning and adaptive capabilities. Hybrid methods can also provide accurate and reliable results and have a strong theoretical basis.
Currently, there are already some data sets and standards for photovoltaic panel fault detection, which can be used to train and test artificial intelligence models and mathematical models. At the same time, there are also some application cases of hybrid methods, such as the automatic detection of multiple types of defects in photovoltaic modules based on deep learning, which have shown good results and performance. Therefore, the ability of the hybrid method is relatively high. As long as there are appropriate data and technology, hybrid photovoltaic panel fault detection can be achieved.
Generally speaking, the hybrid method is faster than a single intelligent method or analytical method because it can utilize parallel computing and optimization algorithms to improve the efficiency and accuracy of photovoltaic panel fault detection. However, the speed of hybrid methods is also affected by factors such as data transmission and processing time, as well as time taken up by training and updating artificial intelligence models and mathematical models. Therefore, the speed of the hybrid method also needs to be reasonably evaluated and optimized based on specific circumstances and needs.

3.4. Metaheuristic Method

The metaheuristic method is a method that draws on some phenomena and laws of nature to find the optimal solution or near-optimal solution for photovoltaic panel fault detection. The basic principle of the metaheuristic method is to evaluate the effect and performance of photovoltaic panel fault detection by defining an objective function, and then use some heuristic algorithms, such as genetic algorithm, particle swarm algorithm, ant colony algorithm, etc., to simulate the natural environment. Some evolution, optimization, and collaboration processes are used to search for the optimal solution or near-optimal solution for photovoltaic panel fault detection in a feasible solution space.
Commonly used methods in metaheuristics include the following:
  • Genetic algorithm: This method optimizes photovoltaic panel fault detection by simulating the process of biological evolution, such as selection, crossover, mutation, etc. Genetic algorithms can use diverse populations to avoid falling into local optimality and can handle multi-objective problems.
  • Particle swarm algorithm: This method optimizes photovoltaic panel fault detection by simulating the behavior of a flock of birds or a school of fish, such as following, chasing, exploring, etc. The particle swarm algorithm can use individual and group information to balance global search and local search, and can handle nonlinear problems.
  • Ant colony algorithm: This method optimizes photovoltaic panel fault detection by simulating the behavior of ants, such as information exchange, path selection, information update, etc. The ant colony algorithm can use the positive feedback mechanism to enhance the probability of excellent solutions and can handle discrete problems.
El-Sayed M. El-kenawy et al. [129] proposed a transformer fault diagnosis model based on the GSDTO algorithm and long short-term memory (LSTM) neural network. They used the GSDTO algorithm for feature selection and LSTM network parameter optimization to improve the accuracy of diagnosing transformer faults. The author conducted experimental verification using 460 samples from the literature and the Central Chemical Laboratory of the Egyptian Electricity Holding Company. Comparative analysis was conducted with several other optimization algorithms and classifiers. The results showed that the proposed model has a high stability and robustness.
The advantage of the method in [35] is that it uses a new metaheuristic algorithm (GSDTO) based on gravity search and the waterbird optimization algorithm to improve the accuracy of transformer fault diagnosis and reduce the misjudgment of faults. The author used the Wilcoxon rank sum test and analysis of variance (ANOVA) to verify the robustness of the constructed GSDTO model. The results show that the model has strong anti-interference ability on the uncertainty in the input data. Although the transformer fault diagnosis model based on GSDTO and LSTM proposed by the method in [35] can provide a high diagnostic accuracy, its internal working mechanism and decision-making basis are not clear or intuitive enough. Because the GSDTO algorithm is a heuristic metaheuristic algorithm, and the LSTM algorithm is a deep learning algorithm based on neural networks, they are both black box models, and it is difficult to explain the reasons and logic behind their output results. Therefore, in the future, we may can consider using some interpretability analysis methods, such as sensitivity analysis, importance ranking, visualization, etc., to improve the interpretability and credibility of the model.
The advantage of the metaheuristic method is that it is a general heuristic method that does not depend on the specificity of the problem but can be applied to a wider range of problems. Metaheuristics can handle complex and multi-objective problems and have strong global search capabilities and robustness. Metaheuristics can also make use of parallel computing and distributed computing to improve the efficiency and accuracy of photovoltaic panel fault detection. The disadvantage of metaheuristics is that it requires adjusting multiple parameters to adapt to different data and techniques, and there may be certain errors and instability. Metaheuristics also makes it difficult to guarantee to find the global optimal solution, and may fall into local optimality or converge prematurely.
Generally speaking, the performance of metaheuristics is better because it can handle complex and multi-objective problems and has strong global search capabilities and robustness. However, metaheuristics also has certain limitations, such as the need to adjust multiple parameters, and there may be certain errors and instability.
Some commonly used metaheuristics, such as the genetic algorithm, particle swarm algorithm, ant colony algorithm, etc., already have relatively complete theories and tools and can be relatively easily applied to photovoltaic panel fault detection. However, some emerging metaheuristics, such as artificial bee colony algorithm, differential evolution algorithm, simulated annealing algorithm, etc., still require more research and development to effectively solve the problem of photovoltaic panel fault detection.
Currently, there are already some data sets and standards for photovoltaic panel fault detection, which can be used to verify and evaluate the effect and performance of metaheuristics. At the same time, there are also some application cases of metaheuristics, such as photovoltaic array fault diagnosis based on genetic algorithms, which show good results and performance. Therefore, the achievability of the metaheuristic method is relatively high. As long as there are suitable data and algorithms, the optimization of photovoltaic panel fault detection can be achieved.
Generally speaking, the metaheuristic method is faster than the traditional analysis method because it can utilize parallel computing and distributed computing to improve the efficiency and accuracy of photovoltaic panel fault detection. However, the speed of metaheuristics is also affected by some factors, such as data transmission and processing time, as well as the number of iterations and convergence conditions of the algorithm. Therefore, the speed of metaheuristics also needs to be reasonably evaluated and optimized based on specific situations and needs.

4. Discussion

Overlay and fault detection techniques for PV panels have shown great potential, but several opportunities and challenges remain. Below, we discuss the future prospects and problems encountered in detail.

4.1. Opportunities and Challenges of Overlay Detection

PV panel overlay detection offers a huge commercial opportunity [130]. As the global demand for clean energy continues to increase, the installation scale of PV power generation systems is also growing rapidly [131]. Hence, the demand for PV panel overlay inspection technology has also increased. Advances in inspection technology will provide PV panel manufacturers, installers, and operators with better inspection solutions, thereby improving maintenance efficiency and the energy output of PV systems. PV panel overlay detection faces technical challenges [132]. PV panels are generally installed in outdoor environments and exposed to various weather conditions, such as sunlight, rain, wind, and sand. These environmental factors put forward higher requirements for the detection technology, which needs to be able to detect accurately and stably under different light, temperature, and humidity conditions. In addition, the surface characteristics of the PV panel will also affect the inspection results, such as reflectivity, texture, and other factors that need to be considered [133]. Another challenge is the diversity of types of overlay [134]. Objects or impurities covering PV panels can be in the form of dust, leaves, bird droppings, etc. The size, shape, and location of these overlays can make detection difficult, especially in large-scale PV plants. Therefore, developing detection algorithms and sensor technologies which are applicable to various overlays is a challenging task. In addition, PV panel overlay detection also needs to consider implementation cost and efficiency [135]. For large PV plants, system testing cost and time are important considerations.

4.2. Opportunities and Challenges of Fault Detection

PV panel fault detection faces technical challenges [136]. PV panels are usually left in an outdoor environment and exposed to various weather conditions, such as sunlight, rain, wind, and sand. These environmental factors put forward higher requirements for the detection technology, which needs to be able to perform accurate and stable detection under different light, temperature, and humidity conditions. Furthermore, the complex construction of PV panels involving multiple components and materials requires the development of detection algorithms and sensor technologies suitable for various fault types. PV panel fault detection also needs to consider implementation cost and efficiency. For large PV plants, system testing cost and time are important considerations. In addition, the fault detection system also needs to be able to realize accurate remote monitoring and data analysis to improve detection efficiency and accuracy of fault diagnosis. Fault detection also faces the challenge of large-scale application [137]. As PV power plants continue to grow in size and number of panels, fault detection requires efficient and scalable solutions. Therefore, it is necessary to develop an intelligent detection system that can automatically detect and identify faults in panels and optimize data management and maintenance planning. This will help to reduce maintenance costs and improve the overall performance of the system.

4.3. Connection between PV Panel Coverlay Detection Fault Detection

4.3.1. Commonly Used in Solar Power Generation System

PV panel overlay detection and PV panel fault detection are both directly related to the performance and efficiency of solar power generation systems. PV panel overlay detection aims to detect whether there are shelters or pollutants on the surface of PV panels. These factors will affect the absorption of sunlight and reduce the efficiency of power generation. PV panel fault detection is aimed at the early detection of damage, defects, or failures inside the PV panel to ensure the reliability and long-term stability of the system. The goal of both is to improve the performance and longevity of solar power systems.

4.3.2. Based on Image Processing and Machine Learning Technology

In practical applications, both PV panel overlay detection and PV panel fault detection require the use of image processing and machine learning technologies to achieve automated and accurate detection. The overlays on the surface of PV panels can be identified and located by image processing techniques, such as image segmentation and feature extraction. Faults inside PV panels can be detected by I-V characteristic curve analysis, infrared thermal imaging, and other technologies, and these data can be used to train machine learning models to achieve fault classification and prediction.

4.3.3. Data Acquisition and Monitoring System

Both PV panel overlay and fault detection require the establishment of data acquisition and monitoring systems. These systems can obtain the operating data, temperature, voltage, and other information of PV panels in real time, and transmit them to the central control system for analysis and processing. These data are not only useful for mulch and fault detection itself, but also can help optimize the operation strategy and maintenance plan of the PV power generation system.

4.3.4. Part of Maintenance and Administration

PV panel overlay detection and PV panel fault detection belong to the field of maintenance and management of PV power generation systems. Through regular overlay detection and fault detection, operators can identify problems early and take steps to fix them, thereby avoiding system degradation or damage. Therefore, both are key to ensuring the reliable operation of PV power generation systems.

5. Conclusions

This paper provides a comprehensive review of the current state-of-the-art techniques for detecting overlays and faults in PV panels. We summarize the existing methods and some novel approaches based on image processing and deep learning for overlay detection, which is a challenging task due to the variety of panel surface materials and types of overlays. We also discuss the difficulties of real-time monitoring and data processing and analysis for overlay detection, and suggest that future research should integrate sensor technology, computer vision technology, data analysis technology, and other fields to optimize the performance and reliability of overlay detection techniques. Moreover, we emphasize the importance of establishing industry standards and norms, and unifying testing standards and procedures for overlay detection. For fault detection, we review the existing methods based on the I-V curve method, infrared thermal imaging technology, the and computer vision network, and outline the future directions of fault detection based on innovative technologies such as high-resolution imaging, non-destructive testing and machine learning. We propose that big data analysis and artificial intelligence algorithms can enable automatic fault diagnosis, the prediction and optimization of maintenance plans, and improve the reliability and power generation efficiency of PV systems. Furthermore, we suggest that the combination of the Internet of Things and remote monitoring technology can facilitate real-time fault monitoring and remote management, and reduce maintenance costs and manual intervention. We conclude that these advances in overlays and fault detection techniques will contribute to the development of the PV industry and the widespread application and sustainable development of clean energy.

Author Contributions

Conceptualization, C.Y. and F.S.; methodology, C.Y. and F.S.; formal analysis, C.Y. and F.S.; investigation, C.Y., Y.Z., Z.L., L.X. and B.Z.; resources, C.J.; writing—original draft preparation, C.Y. and F.S.; writing—review and editing, C.Y., Z.L., L.X., S.L. and B.Z.; visualization, F.S.; supervision, C.Y. and H.C.; project administration, C.Y. and H.C.; funding acquisition, C.Y. and H.C. All authors have read and agreed to the published version of the manuscript.

Funding

This work was supported in part by the National Natural Science Foundation of China under Grant 62202286.

Data Availability Statement

No new data were created.

Conflicts of Interest

Author Yujie Zou was employed by the company Shanghai Zhabei Power Plant of State Grid Corporation of China; author Zhipeng Lv was employed by the company Energy Internet Research Institute Co., Ltd.; author Shuangyu Liu was employed by the company Shanghai Guoyun Information Technology Co., Ltd. The remaining authors declare that the research was conducted in the absence of any commercial or financial relationships that could be construed as a potential conflict of interest.

Abbreviations

The following abbreviations are used in this manuscript:
PVPhotovoltaic
UAVs      unmanned aerial vehicles
SVMsupport vector machine
KNNK-Nearest Neighbor
SSDSolid State Drive
CNNconvolutional neural networks
LSTMlong short-term memory
GLCMgray level co-occurrence matrix
GEEGoogle Earth Engine
NDSInormalized difference sand index
RNDSIratio normalized difference soil index
DBSIDry Bare Soil Index
LSTland surface temperature
GANgenerative adversarial network
SGDstochastic gradient descent
SOATstate-of-the-art
R-CNNregion-convolutional neural networks
DRNNdeep residual neural network
ELelectroluminescence
RMVDMreal-time multivariate deep learning model
RHAregion-based histogram approximation
GSQAgray scale quantization algorithm
DCSdeficiency class support
DBNdeep belief networks
SCADAsupervisory control and data acquisition
DC-PCEdust concentration and photoelectric conversion efficiency
I-Vcurrent-voltage
MPPTmaximum power point tracking
PSCpartial shading conditions
P-Vpower-voltage
ODSobserved degradation system
RCNNregion-based convolutional neural network
DNNdeep neural network
PVMsphotovoltaic modules
DWTdiscrete wavelet transform
FFTfast Fourier transform
GLDMgray level difference method
CBAMConvolutional Block Attention Module
AUCarea under the curve
MRFFmulti-scale receptive field fusion

References

  1. Yadav, A.; Pillai, S.R.; Singh, N.; Philip, S.A.; Mohanan, V. Preliminary investigation of dust deposition on solar cells. Mater. Today: Proc. 2021, 46, 6812–6815. [Google Scholar] [CrossRef]
  2. Zhao, J.; Dong, K.; Dong, X.; Shahbaz, M. How renewable energy alleviate energy poverty? A global analysis. Renew. Energy 2022, 186, 299–311. [Google Scholar] [CrossRef]
  3. Gielen, D.; Gorini, R.; Leme, R.; Prakash, G.; Wagner, N.; Janeiro, L.; Collins, S.; Kadir, M.; Asmelash, E.; Ferroukhi, R.; et al. World Energy Transitions Outlook: 1.5° C Pathway; International Renewable Energy Agency (IRENA): Masdar City, United Arab Emirates, 2021. [Google Scholar]
  4. Chiteka, K.; Arora, R.; Sridhara, S.; Enweremadu, C. Influence of irradiance incidence angle and installation configuration on the deposition of dust and dust-shading of a photovoltaic array. Energy 2021, 216, 119289. [Google Scholar] [CrossRef]
  5. Yoro, K.O.; Daramola, M.O. CO2 emission sources, greenhouse gases, and the GW effect. In ACC; Elsevier: Amsterdam, The Netherlands, 2020; pp. 3–28. [Google Scholar]
  6. Ostergaard, P.A.; Duic, N.; Noorollahi, Y.; Mikulcic, H.; Kalogirou, S. Sustainable development using renewable energy technology. Renew. Energy 2020, 146, 2430–2437. [Google Scholar] [CrossRef]
  7. Aldalbahi, A.; El-Naggar, M.E.; El-Newehy, M.H.; Rahaman, M.; Hatshan, M.R.; Khattab, T.A. Effects of technical textiles and synthetic nanofibers on environmental pollution. Polymers 2021, 13, 155. [Google Scholar] [CrossRef] [PubMed]
  8. Mohammed, H.A.; Baha’a, A.; Al-Mejibli, I.S. Smart system for dust detecting and removing from solar cells. J. Physics: Conf. Ser. 2018, 1032, 012055. [Google Scholar] [CrossRef]
  9. Raina, G.; Sinha, S. Outlook on the Indian scenario of solar energy strategies: Policies and challenges. Energy Strategy Rev. 2019, 24, 331–341. [Google Scholar] [CrossRef]
  10. Zhang, H.; Yu, Z.; Zhu, C.; Yang, R.; Yan, B.; Jiang, G. Green or not? Environmental challenges from photovoltaic technology. Environ. Pollut. 2023, 320, 121066. [Google Scholar] [CrossRef] [PubMed]
  11. Priyadharsini, K.; JR, D.K.; Srikanth, A.; Sounddar, V.; Senthamilselvan, M. Elegant method to improve the efficiency of remotely located solar panels using IoT. Mater. Today: Proc. 2021, 45, 8094–8104. [Google Scholar]
  12. Derakhshandeh, J.F.; AlLuqman, R.; Mohammad, S.; AlHussain, H.; AlHendi, G.; AlEid, D.; Ahmad, Z. A comprehensive review of automatic cleaning systems of solar panels. Sustain. Energy Technol. Assessments 2021, 47, 101518. [Google Scholar] [CrossRef]
  13. Thomas, S.K.; Joseph, S.; Sarrop, T.; Haris, S.B.; Roopak, R. Solar Panel Automated Cleaning (SPAC) System. In Proceedings of the 2018 International Conference on Emerging Trends and Innovations in Engineering and Technological Research (ICETIETR), Arakunnam, India, 11–13 July 2018; pp. 1–3. [Google Scholar]
  14. Zainuddin, N.F.; Mohammed, M.; Al-Zubaidi, S.; Khogali, S.I. Design and development of smart self-cleaning solar panel system. In Proceedings of the 2019 IEEE International Conference on Automatic Control and Intelligent Systems (I2CACIS), Shah Alam, Malaysia, 29 June 2019; pp. 40–43. [Google Scholar]
  15. Rahman, A.; Farrok, O.; Haque, M.M. Environmental impact of renewable energy source based electrical power plants: Solar, wind, hydroelectric, biomass, geothermal, tidal, ocean, and osmotic. Renew. Sustain. Energy Rev. 2022, 161, 112279. [Google Scholar] [CrossRef]
  16. Chanchangi, Y.N.; Ghosh, A.; Sundaram, S.; Mallick, T.K. Dust and PV Performance in Nigeria: A review. Renew. Sustain. Energy Rev. 2020, 121, 109704. [Google Scholar] [CrossRef]
  17. Salamah, T.; Ramahi, A.; Alamara, K.; Juaidi, A.; Abdallah, R.; Abdelkareem, M.A.; Amer, E.C.; Olabi, A.G. Effect of dust and methods of cleaning on the performance of solar PV module for different climate regions: Comprehensive review. Sci. Total. Environ. 2022, 827, 154050. [Google Scholar] [CrossRef] [PubMed]
  18. Dantas, G.M.; Mendes, O.L.C.; Maia, S.M.; de Alexandria, A.R. Dust detection in solar panel using image processing techniques: A review. Res. Soc. Dev. 2020, 9, e321985107. [Google Scholar] [CrossRef]
  19. Akram, M.W.; Li, G.; Jin, Y.; Chen, X. Failures of Photovoltaic modules and their Detection: A Review. Appl. Energy 2022, 313, 118822. [Google Scholar] [CrossRef]
  20. Hasan, D.S.; Farhan, M.S.; ALRikabi, H.T. Impact of temperature and dust deposition on PV panel performance. In Proceedings of the AIP Conference Proceedings; AIP Publishing: Melville, NY, USA, 2022; Volume 2394. [Google Scholar]
  21. Al Dahoud, A.; Fezari, M.; Al Dahoud, A. Automatic solar panel cleaning system Design. In Proceedings of the 2021 29th Telecommunications Forum (TELFOR), Belgrade, Serbia, 23–24 November 2021; pp. 1–4. [Google Scholar]
  22. Shairi, N.A.S.; Ghoni, R.; Ali, K. Solar panel dust monitoring system. Eng. Herit. J. 2020, 4, 44–45. [Google Scholar] [CrossRef]
  23. Kumar, S.S.; Murthy, K. Solar Powered PV Panel Cleaning Robot. In Proceedings of the 2020 International Conference on Recent Trends on Electronics, Information, Communication & Technology (RTEICT), Bangalore, India, 12–13 November 2020; pp. 169–172. [Google Scholar]
  24. Dhaouadi, R.; Al-Othman, A.; Aidan, A.A.; Tawalbeh, M.; Zannerni, R. A characterization study for the properties of dust particles collected on photovoltaic (PV) panels in Sharjah, United Arab Emirates. Renew. Energy 2021, 171, 133–140. [Google Scholar] [CrossRef]
  25. Brownlee, J. Deep Learning for Computer Vision: Image Classification, Object Detection, and Face Recognition in Python; Machine Learning Mastery: Vermont, Australia, 2019. [Google Scholar]
  26. Bhuyan, M.K. Computer Vision and Image Processing: Fundamentals and Applications; CRC Press: Boca Raton, FL, USA, 2019. [Google Scholar]
  27. Nixon, M.; Aguado, A. Feature Extraction and Image Processing for Computer Vision; Academic Press: Cambridge, MA, USA, 2019. [Google Scholar]
  28. Hassaballah, M.; Awad, A.I. Deep Learning in Computer Vision: PRINCIPLES and Applications; CRC Press: Boca Raton, FL, USA, 2020. [Google Scholar]
  29. Dong, S.; Wang, P.; Abbas, K. A survey on deep learning and its applications. Comput. Sci. Rev. 2021, 40, 100379. [Google Scholar] [CrossRef]
  30. Janiesch, C.; Zschech, P.; Heinrich, K. Machine learning and deep learning. Electron. Mark. 2021, 31, 685–695. [Google Scholar] [CrossRef]
  31. Paul, M.M.R.; Kannan, R.; Moses, M.L.; Bhuvanesh, A. Fault identification in a grid connected solar PV system using Back propagation Neural Network. Proc. Iop Conf. Ser. Mater. Sci. Eng. 2021, 1084, 012109. [Google Scholar] [CrossRef]
  32. Dhanraj, J.A.; Mostafaeipour, A.; Velmurugan, K.; Techato, K.; Chaurasiya, P.K.; Solomon, J.M.; Gopalan, A.; Phoungthong, K. An effective evaluation on fault detection in solar panels. Energies 2021, 14, 7770. [Google Scholar] [CrossRef]
  33. Belik, M. Detection and prediction of photovoltaic panels malfunctions. Renew. Energy Power Qual. J. 2018, 16, 544–548. [Google Scholar] [CrossRef]
  34. Kellil, N.; Aissat, A.; Mellit, A. Fault diagnosis of photovoltaic modules using deep neural networks and infrared images under Algerian climatic conditions. Energy 2023, 263, 125902. [Google Scholar] [CrossRef]
  35. Sun, F.; Yang, C.; Cui, H.; Lv, Z.; Shao, J.; Zhao, B.; He, K. Dust Detection Techniques for Photovoltaic Panels from a Machine Vision Perspective: A Review. In Proceedings of the 2023 8th Asia Conference on Power and Electrical Engineering (ACPEE), Tianjin, China, 14–16 April 2023; pp. 1413–1418. [Google Scholar] [CrossRef]
  36. Hachicha, A.A.; Al-Sawafta, I.; Said, Z. Impact of dust on the performance of solar photovoltaic (PV) systems under United Arab Emirates weather conditions. Renew. Energy 2019, 141, 287–297. [Google Scholar] [CrossRef]
  37. Sun, C.; Zou, Y.; Qin, C.; Zhang, B.; Wu, X. Temperature effect of photovoltaic cells: A review. Adv. Compos. Hybrid Mater. 2022, 5, 2675–2699. [Google Scholar] [CrossRef]
  38. Darwish, Z.A.; Sopian, K.; Fudholi, A. Reduced output of photovoltaic modules due to different types of dust particles. J. Clean. Prod. 2021, 280, 124317. [Google Scholar] [CrossRef]
  39. Tanesab, J.; Parlevliet, D.; Whale, J.; Urmee, T. The effect of dust with different morphologies on the performance degradation of photovoltaic modules. Sustain. Energy Technol. Assessments 2019, 31, 347–354. [Google Scholar] [CrossRef]
  40. Ren, J.; Guan, F.; Wang, T.; Qian, B.; Luo, C.; Cai, G.; Kan, C.; Li, X. High precision calibration algorithm for binocular stereo vision camera using deep reinforcement learning. Comput. Intell. Neurosci. 2022, 2022. [Google Scholar] [CrossRef]
  41. Villegas-Mier, C.G.; Rodriguez-Resendiz, J.; Álvarez-Alvarado, J.M.; Rodriguez-Resendiz, H.; Herrera-Navarro, A.M.; Rodríguez-Abreo, O. Artificial neural networks in MPPT algorithms for optimization of photovoltaic power systems: A review. Micromachines 2021, 12, 1260. [Google Scholar] [CrossRef]
  42. Vergura, S. Criticalities of the Outdoor Infrared Inspection of Photovoltaic Modules by Means of Drones. Energies 2022, 15, 5086. [Google Scholar] [CrossRef]
  43. Khalid, H.M.; Rafique, Z.; Muyeen, S.; Raqeeb, A.; Said, Z.; Saidur, R.; Sopian, K. Dust accumulation and aggregation on PV panels: An integrated survey on impacts, mathematical models, cleaning mechanisms, and possible sustainable solution. Sol. Energy 2023, 251, 261–285. [Google Scholar] [CrossRef]
  44. Sriram, A.; Sudhakar, T. Photovoltaic Cell Panels Soiling Inspection Using Principal Component Thermal Image Processing. Comput. Syst. Sci. Eng. 2023, 45, 2761–2772. [Google Scholar] [CrossRef]
  45. Yahya, Z.; Imane, S.; Hicham, H.; Ghassane, A.; Safia, E.B.I. Applied imagery pattern recognition for photovoltaic modules’ inspection: A review on methods, challenges and future development. Sustain. Energy Technol. Assessments 2022, 52, 102071. [Google Scholar] [CrossRef]
  46. de Oliveira, A.K.V.; Aghaei, M.; Rüther, R. Automatic inspection of photovoltaic power plants using aerial infrared thermography: A review. Energies 2022, 15, 2055. [Google Scholar] [CrossRef]
  47. Høiaas, I.; Grujic, K.; Imenes, A.G.; Burud, I.; Olsen, E.; Belbachir, N. Inspection and condition monitoring of large-scale photovoltaic power plants: A review of imaging technologies. Renew. Sustain. Energy Rev. 2022, 161, 112353. [Google Scholar] [CrossRef]
  48. Zhao, R. Photovoltaic (PV) Solar Panel Identification and Fault Detection Using Unmanned Aerial Vehicles (UAVs): A Case Study of a 0.5 MW PV System. Ph.D. Thesis, Department of Earth and Planetary Sciences, Yale University, New Haven, CT, USA, 2022. [Google Scholar]
  49. Monicka, S.G.; Manimegalai, D.; Karthikeyan, M.; Gunasekari, R. Image Processing Based Hot-Spot Detection on Photovoltaic Panels. Int. J. Intell. Syst. Appl. Eng. 2023, 11, 510–518. [Google Scholar]
  50. Arnaudo, E.; Blanco, G.; Monti, A.; Bianco, G.; Monaco, C.; Pasquali, P.; Dominici, F. A Comparative Evaluation of Deep Learning Techniques for Photovoltaic Panel Detection from Aerial Images. IEEE Access 2023, 11, 47579–47594. [Google Scholar] [CrossRef]
  51. Pathak, S.P.; Patil, S.A. Analysis and Evaluation of Pre-processing Techniques for Fault Detection in Thermal Images of Solar Panels. In Emerging Research in Computing, Information, Communication and Applications: Proceedings of ERCICA 2022; Springer: Berlin, Germany, 2022; pp. 673–690. [Google Scholar]
  52. Maithreyan, G.; Gumaste, V.V. Comparison of Various Machine Learning and Deep Learning Classifiers for the Classification of Defective Photovoltaic Cells. In Proceedings of the Intelligent Control, Robotics, and Industrial Automation: Proceedings of International Conference, Dongguan, China, 16–18 December 2022; Association for Computing Machinery: New York, NY, USA, 2023; Volume 1066, p. 471. [Google Scholar]
  53. Zhao, X.; Song, C.; Zhang, H.; Sun, X.; Zhao, J. HRNet-based automatic identification of photovoltaic module defects using electroluminescence images. Energy 2023, 267, 126605. [Google Scholar] [CrossRef]
  54. Wang, S.; Han, K.; Jin, J. Review of image low-level feature extraction methods for content-based image retrieval. Sens. Rev. 2019, 39, 783–809. [Google Scholar] [CrossRef]
  55. Wang, Y.; Wei, X.; Ding, L.; Tang, X.; Zhang, H. A robust visual tracking method via local feature extraction and saliency detection. Vis. Comput. 2020, 36, 683–700. [Google Scholar] [CrossRef]
  56. Herraiz, Á.H.; Marugán, A.P.; Márquez, F.P.G. Photovoltaic plant condition monitoring using thermal images analysis by convolutional neural network-based structure. Renew. Energy 2020, 153, 334–348. [Google Scholar] [CrossRef]
  57. Prabhakaran, S.; Uthra, R.A.; Preetharoselyn, J. Feature Extraction and Classification of Photovoltaic Panels Based on Convolutional Neural Network. Comput. Mater. Contin. 2023, 74, 1437–1455. [Google Scholar] [CrossRef]
  58. Humeau-Heurtier, A. Texture feature extraction methods: A survey. IEEE Access 2019, 7, 8975–9000. [Google Scholar] [CrossRef]
  59. Kuo, C.F.J.; Chen, S.H.; Huang, C.Y. Automatic detection, classification and localization of defects in large photovoltaic plants using unmanned aerial vehicles (UAV) based infrared (IR) and RGB imaging. Energy Convers. Manag. 2023, 276, 116495. [Google Scholar]
  60. Tang, Y.; Chen, M.; Wang, C.; Luo, L.; Li, J.; Lian, G.; Zou, X. Recognition and localization methods for vision-based fruit picking robots: A review. Front. Plant Sci. 2020, 11, 510. [Google Scholar] [CrossRef] [PubMed]
  61. Liu, J.; Ji, N. A bright spot detection and analysis method for infrared photovoltaic panels based on image processing. Front. Energy Res. 2023, 10, 978247. [Google Scholar] [CrossRef]
  62. Junchao, W.; Chang, Z. Defect detection on solar cells using mathematical morphology and fuzzy logic techniques. J. Opt. 2023, 1–11. [Google Scholar] [CrossRef]
  63. Ayyagari, K.S.; Munian, Y.; Inupakutika, D.; Reddy, B.K.; Gonzalez, R.; Alamaniotis, M. Simultaneous Detection and Classification of Dust and Soil on Solar PhotoVoltaic Arrays Connected to A Large-Scale Industry: A Case Study. In Proceedings of the 2022 18th International Conference on the European Energy Market (EEM), Ljubljana, Slovenia, 13–15 September 2022; pp. 1–6. [Google Scholar]
  64. Abuqaaud, K.A.; Ferrah, A. A novel technique for detecting and monitoring dust and soil on solar photovoltaic panel. In Proceedings of the 2020 Advances in Science and Engineering Technology International Conferences (ASET), Dubai, United Arab Emirates, 4 February–9 April 2020; pp. 1–6. [Google Scholar]
  65. Czarnecki, T.; Bloch, K. The use of drone photo material to classify the purity of photovoltaic panels based on statistical classifiers. Sensors 2022, 22, 483. [Google Scholar] [CrossRef]
  66. Supe, H.; Avtar, R.; Singh, D.; Gupta, A.; Yunus, A.P.; Dou, J.; A. Ravankar, A.; Mohan, G.; Chapagain, S.K.; Sharma, V.; et al. Google earth engine for the detection of soiling on photovoltaic solar panels in arid environments. Remote Sens. 2020, 12, 1466. [Google Scholar] [CrossRef]
  67. Fan, S.; Wang, X.; Wang, Z.; Sun, B.; Zhang, Z.; Cao, S.; Zhao, B.; Wang, Y. A novel image enhancement algorithm to determine the dust level on photovoltaic (PV) panels. Renew. Energy 2022, 201, 172–180. [Google Scholar] [CrossRef]
  68. Zhou, Y.J.; Sun, H.R. Water photovoltaic plant contaminant identification using visible light images. Sustain. Energy Technol. Assessments 2022, 53, 102476. [Google Scholar] [CrossRef]
  69. Di Tommaso, A.; Betti, A.; Fontanelli, G.; Michelozzi, B. A Multi-Stage model based on YOLOv3 for defect detection in PV panels based on IR and Visible Imaging by Unmanned Aerial Vehicle. Renew. Energy 2022, 193, 941–962. [Google Scholar] [CrossRef]
  70. Saquib, D.; Nasser, M.N.; Ramaswamy, S. Image Processing Based Dust Detection and prediction of Power using ANN in PV systems. In Proceedings of the 2020 Third International Conference on Smart Systems and Inventive Technology (ICSSIT), Tirunelveli, India, 20–22 August 2020; pp. 1286–1292. [Google Scholar]
  71. Mathew, A.; Amudha, P.; Sivakumari, S. Deep learning techniques: An overview. Advanced Machine Learning Technologies and Applications: Proceedings of AMLTA 2020; Springer: Berlin, Germany, 2021; pp. 599–608. [Google Scholar]
  72. Bengio, Y.; Lecun, Y.; Hinton, G. Deep learning for AI. Commun. ACM 2021, 64, 58–65. [Google Scholar] [CrossRef]
  73. Muteri, V.; Cellura, M.; Curto, D.; Franzitta, V.; Longo, S.; Mistretta, M.; Parisi, M.L. Review on life cycle assessment of solar photovoltaic panels. Energies 2020, 13, 252. [Google Scholar] [CrossRef]
  74. Su, D.; Batzelis, E.; Pal, B. Machine learning algorithms in forecasting of photovoltaic power generation. In Proceedings of the 2019 International Conference on Smart Energy Systems and Technologies (SEST), Porto, Portugal, 9–11 September 2019; pp. 1–6. [Google Scholar]
  75. Bischl, B.; Binder, M.; Lang, M.; Pielok, T.; Richter, J.; Coors, S.; Thomas, J.; Ullmann, T.; Becker, M.; Boulesteix, A.L.; et al. Hyperparameter optimization: Foundations, algorithms, best practices, and open challenges. Wiley Interdiscip. Rev. Data Min. Knowl. Discov. 2023, 13, e1484. [Google Scholar] [CrossRef]
  76. Ganaie, M.A.; Hu, M.; Malik, A.; Tanveer, M.; Suganthan, P. Ensemble deep learning: A review. Eng. Appl. Artif. Intell. 2022, 115, 105151. [Google Scholar] [CrossRef]
  77. Agrawal, T. Hyperparameter Optimization in Machine Learning: Make Your Machine Learning and Deep Learning Models More Efficient; Springer: Berlin, Germany, 2021. [Google Scholar]
  78. Shihavuddin, A.; Rashid, M.R.A.; Maruf, M.H.; Hasan, M.A.; ul Haq, M.A.; Ashique, R.H.; Al Mansur, A. Image based surface damage detection of renewable energy installations using a unified deep learning approach. Energy Rep. 2021, 7, 4566–4576. [Google Scholar] [CrossRef]
  79. Onim, M.S.H.; Sakif, Z.M.M.; Ahnaf, A.; Kabir, A.; Azad, A.K.; Oo, A.M.T.; Afreen, R.; Hridy, S.T.; Hossain, M.; Jabid, T.; et al. SolNet: A Convolutional Neural Network for Detecting Dust on Solar Panels. Energies 2022, 16, 155. [Google Scholar] [CrossRef]
  80. Pathak, S.P.; Patil, S.; Patel, S. Solar panel hotspot localization and fault classification using deep learning approach. Procedia Comput. Sci. 2022, 204, 698–705. [Google Scholar] [CrossRef]
  81. Li, Q.; Yu, K.; Chen, D. SolarDiagnostics: Automatic damage detection on rooftop solar photovoltaic arrays. Sustain. Comput. Inform. Syst. 2021, 32, 100595. [Google Scholar] [CrossRef]
  82. El Ydrissi, M.; Ghennioui, H.; Alae, A.; Abraim, M.; Taabane, I.; Farid, A. Dust InSMS: Intelligent soiling measurement system for dust detection on solar mirrors using computer vision methods. Expert Syst. Appl. 2023, 211, 118646. [Google Scholar] [CrossRef]
  83. Fan, S.; Wang, Y.; Cao, S.; Zhao, B.; Sun, T.; Liu, P. A deep residual neural network identification method for uneven dust accumulation on photovoltaic (PV) panels. Energy 2022, 239, 122302. [Google Scholar] [CrossRef]
  84. Tella, H.; Mohandes, M.; Liu, B.; Rehman, S.; Al-Shaikhi, A. Deep Learning System for Defect Classification of Solar Panel Cells. In Proceedings of the 2022 14th International Conference on Computational Intelligence and Communication Networks (CICN), Al-Khobar, Saudi Arabia, 4–6 December 2022; pp. 448–453. [Google Scholar]
  85. Khilar, R.; Suba, G.M.; Kumar, T.S.; Samson Isaac, J.; Shinde, S.K.; Ramya, S.; Prabhu, V.; Erko, K.G. Improving the efficiency of photovoltaic panels using machine learning approach. Int. J. Photoenergy 2022, 2022. [Google Scholar] [CrossRef]
  86. Prabhakaran, S.; Uthra, R.A.; Preetharoselyn, J. Deep Learning-Based Model for Defect Detection and Localization on Photovoltaic Panels. Comput. Syst. Sci. Eng. 2023, 44. [Google Scholar] [CrossRef]
  87. Hanafy, W.A.; Pina, A.; Salem, S.A. Machine learning approach for photovoltaic panels cleanliness detection. In Proceedings of the 2019 15th International Computer Engineering Conference (ICENCO), Giza, Egypt, 29–30 December 2019; pp. 72–77. [Google Scholar]
  88. Rodil, M.C.; Montenegro, J.P.; Kampouropoulos, K.; Andrade, F.; Romeral, L. A novel methodology for determination of soiling on PV panels by means of grey box modelling. In Proceedings of the IECON 2019—45th Annual Conference of the IEEE Industrial Electronics Society, Lisbon, Portugal, 14–17 October 2019; Volume 1, pp. 2271–2276. [Google Scholar]
  89. Shaaban, M.F.; Alarif, A.; Mokhtar, M.; Tariq, U.; Osman, A.H.; Al-Ali, A. A New Data-Based Dust Estimation Unit for PV Panels. Energies 2020, 13, 3601. [Google Scholar] [CrossRef]
  90. Fan, S.; Wang, Y.; Cao, S.; Sun, T.; Liu, P. A novel method for analyzing the effect of dust accumulation on energy efficiency loss in photovoltaic (PV) system. Energy 2021, 234, 121112. [Google Scholar] [CrossRef]
  91. Márquez, F.P.G.; Ramírez, I.S. Condition monitoring system for solar power plants with radiometric and thermographic sensors embedded in unmanned aerial vehicles. Measurement 2019, 139, 152–162. [Google Scholar] [CrossRef]
  92. Malik, H.; Alsabban, M.; Qaisar, S.M. Arduino Based Automatic Solar Panel Dust Disposition Estimation and Cloud Based Reporting. Procedia Comput. Sci. 2021, 194, 102–113. [Google Scholar] [CrossRef]
  93. Bodnár, I.; Matusz-Kalász, D.; Boros, R.R. Exploration of Solar Panel Damage and Service Life Reduction Using Condition Assessment, Dust Accumulation, and Material Testing. Sustainability 2023, 15, 9615. [Google Scholar] [CrossRef]
  94. He, B.; Lu, H.; Zheng, C.; Wang, Y. Characteristics and cleaning methods of dust deposition on solar photovoltaic modules—A review. Energy 2023, 263, 126083. [Google Scholar] [CrossRef]
  95. Li, X.; Mauzerall, D.L.; Bergin, M.H. Global reduction of solar power generation efficiency due to aerosols and panel soiling. Nat. Sustain. 2020, 3, 720–727. [Google Scholar] [CrossRef]
  96. Li, X.; Wagner, F.; Peng, W.; Yang, J.; Mauzerall, D.L. Reduction of solar photovoltaic resources due to air pollution in China. Proc. Natl. Acad. Sci. USA 2017, 114, 11867–11872. [Google Scholar] [CrossRef] [PubMed]
  97. El-Banby, G.M.; Moawad, N.M.; Abouzalm, B.A.; Abouzaid, W.F.; Ramadan, E. Photovoltaic system fault detection techniques: A review. Neural Comput. Appl. 2023, 35, 1–14. [Google Scholar] [CrossRef]
  98. Chaichan, M.T.; Kazem, H.A.; Ibrahim, S.I.; Radhi, A.A.; Mahmoud, B.K.; Ali, A.J. Photovoltaic panel type influence on the performance degradation due dust accumulation. Proc. Iop Conf. Ser. Mater. Sci. Eng. 2020, 928, 022092. [Google Scholar] [CrossRef]
  99. Jamuna, V.; Muniraj, C.; Periasamy, P. Fault detection for photovoltaic panels in solar power plants by using linear iterative fault diagnosis (LIFD) technique based on thermal imaging system. J. Electr. Eng. Technol. 2023, 18, 1–13. [Google Scholar] [CrossRef]
  100. Li, L.; Wang, Z.; Zhang, T. Gbh-yolov5: Ghost convolution with bottleneckcsp and tiny target prediction head incorporating yolov5 for pv panel defect detection. Electronics 2023, 12, 561. [Google Scholar] [CrossRef]
  101. Kayci, B.; Demír, B.E.; Demír, F. Deep learning based fault detection and diagnosis in photovoltaic system using thermal images acquired by UAV. Politeknik Dergisi 2023, 1. [Google Scholar] [CrossRef]
  102. Liu, J.; Jiao, Z.; Chen, C.; Duan, C.; Pang, C. Advanced data-driven methods and applications for smart power and energy systems. Front. Energy Res. 2023, 10, 1064305. [Google Scholar] [CrossRef]
  103. Wang, J.; Gao, D.; Zhu, S.; Wang, S.; Liu, H. Fault diagnosis method of photovoltaic array based on support vector machine. Energy Sources, Part A Recover. Util. Environ. Eff. 2023, 45, 5380–5395. [Google Scholar] [CrossRef]
  104. Et-taleby, A.; Chaibi, Y.; Allouhi, A.; Boussetta, M.; Benslimane, M. A combined convolutional neural network model and support vector machine technique for fault detection and classification based on electroluminescence images of photovoltaic modules. Sustain. Energy Grids Netw. 2022, 32, 100946. [Google Scholar] [CrossRef]
  105. Balasubramani, G.; Thangavelu, V. Thermal Image Analysis of Photovoltaic Panel for Condition Monitoring Using Hybrid Thermal Pixel Counting Algorithm and XGBoost Classifier. Electr. Power Components Syst. 2023, 1–14. [Google Scholar] [CrossRef]
  106. Espinosa, A.R.; Bressan, M.; Giraldo, L.F. Failure signature classification in solar photovoltaic plants using RGB images and convolutional neural networks. Renew. Energy 2020, 162, 249–256. [Google Scholar] [CrossRef]
  107. Cavieres, R.; Barraza, R.; Estay, D.; Bilbao, J.; Valdivia-Lefort, P. Automatic soiling and partial shading assessment on PV modules through RGB images analysis. Appl. Energy 2022, 306, 117964. [Google Scholar] [CrossRef]
  108. Venkatesh, S.N.; Jeyavadhanam, B.R.; Sizkouhi, A.M.; Esmailifar, S.M.; Aghaei, M.; Sugumaran, V. Automatic detection of visual faults on photovoltaic modules using deep ensemble learning network. Energy Rep. 2022, 8, 14382–14395. [Google Scholar] [CrossRef]
  109. Sharifani, K.; Amini, M. Machine Learning and Deep Learning: A Review of Methods and Applications. World Inf. Technol. Eng. J. 2023, 10, 3897–3904. [Google Scholar]
  110. Bhatti, U.A.; Tang, H.; Wu, G.; Marjan, S.; Hussain, A. Deep learning with graph convolutional networks: An overview and latest applications in computational intelligence. Int. J. Intell. Syst. 2023, 2023, 1–28. [Google Scholar] [CrossRef]
  111. Prabhakaran, S.; Uthra, R.A.; Roselyn, J.P. Defect analysis of faulty regions in photovoltaic panels using deep learning method. In Security, Privacy and Data Analytics: Select Proceedings of ISPDA 2021; Springer: Berlin, Germany, 2022; pp. 63–78. [Google Scholar]
  112. Alves, R.H.F.; de Deus Junior, G.A.; Marra, E.G.; Lemos, R.P. Automatic fault classification in photovoltaic modules using Convolutional Neural Networks. Renew. Energy 2021, 179, 502–516. [Google Scholar] [CrossRef]
  113. Korkmaz, D.; Acikgoz, H. An efficient fault classification method in solar photovoltaic modules using transfer learning and multi-scale convolutional neural network. Eng. Appl. Artif. Intell. 2022, 113, 104959. [Google Scholar] [CrossRef]
  114. Lu, F.; Niu, R.; Zhang, Z.; Guo, L.; Chen, J. A generative adversarial network-based fault detection approach for photovoltaic panel. Appl. Sci. 2022, 12, 1789. [Google Scholar] [CrossRef]
  115. Seghiour, A.; Abbas, H.A.; Chouder, A.; Rabhi, A. Deep learning method based on autoencoder neural network applied to faults detection and diagnosis of photovoltaic system. Simul. Model. Pract. Theory 2023, 123, 102704. [Google Scholar] [CrossRef]
  116. Et-taleby, A.; Chaibi, Y.; Benslimane, M.; Boussetta, M. Applications of Machine Learning Algorithms for Photovoltaic Fault Detection: A Review. Stat. Optim. Inf. Comput. 2023, 11, 168–177. [Google Scholar] [CrossRef]
  117. Abubakar, A.; Jibril, M.M.; Almeida, C.F.; Gemignani, M.; Yahya, M.N.; Abba, S.I. A Novel Hybrid Optimization Approach for Fault Detection in Photovoltaic Arrays and Inverters Using AI and Statistical Learning Techniques: A Focus on Sustainable Environment. Processes 2023, 11, 2549. [Google Scholar] [CrossRef]
  118. Wang, X.; Yang, W.; Qin, B.; Wei, K.; Ma, Y.; Zhang, D. Intelligent monitoring of photovoltaic panels based on infrared detection. Energy Rep. 2022, 8, 5005–5015. [Google Scholar] [CrossRef]
  119. Yao, S.; Kang, Q.; Zhou, M.; Abusorrah, A.; Al-Turki, Y. Intelligent and data-driven fault detection of photovoltaic plants. Processes 2021, 9, 1711. [Google Scholar] [CrossRef]
  120. Lin, P.; Qian, Z.; Lu, X.; Lin, Y.; Lai, Y.; Cheng, S.; Chen, Z.; Wu, L. Compound fault diagnosis model for Photovoltaic array using multi-scale SE-ResNet. Sustain. Energy Technol. Assessments 2022, 50, 101785. [Google Scholar] [CrossRef]
  121. Chen, X.; Gao, W.; Hong, C.; Tu, Y. A novel series arc fault detection method for photovoltaic system based on multi-input neural network. Int. J. Electr. Power Energy Syst. 2022, 140, 108018. [Google Scholar] [CrossRef]
  122. Sarikh, S.; Raoufi, M.; Bennouna, A.; Benlarabi, A.; Ikken, B. Fault diagnosis in a photovoltaic system through IV characteristics analysis. In Proceedings of the 2018 9th International Renewable Energy Congress (IREC), Hammamet, Tunisia, 20–22 March 2018; pp. 1–6. [Google Scholar]
  123. Abid, A.J.; Obed, A.; Al-Naima, F.M. Detection and control of power loss due to soiling and faults in photovoltaic solar farms via wireless sensor network. Int. J. Eng. Technol. 2018, 7, 718–724. [Google Scholar] [CrossRef]
  124. Schmid, F.; Behrendt, F. Genetic sizing optimization of residential multi-carrier energy systems: The aim of energy autarky and its cost. Energy 2023, 262, 125421. [Google Scholar] [CrossRef]
  125. Khodapanah, M.; Ghanbari, T.; Moshksar, E.; Hosseini, Z. Partial shading detection and hotspot prediction in photovoltaic systems based on numerical differentiation and integration of the P- V curves. IET Renew. Power Gener. 2023, 17, 279–295. [Google Scholar] [CrossRef]
  126. Hocine, L.; Samira, K.M.; Tarek, M.; Salah, N.; Samia, K. Automatic detection of faults in a photovoltaic power plant based on the observation of degradation indicators. Renew. Energy 2021, 164, 603–617. [Google Scholar] [CrossRef]
  127. Sarikh, S.; Raoufi, M.; Bennouna, A.; Ikken, B. Characteristic curve diagnosis based on fuzzy classification for a reliable photovoltaic fault monitoring. Sustain. Energy Technol. Assessments 2021, 43, 100958. [Google Scholar] [CrossRef]
  128. Sebbane, S.; Akchioui, N.E. Artificial neural network optimized by whale optimization algorithm for partial shading fault detection. AIP Conference Proceedings 2023, 2814, 040013. [Google Scholar]
  129. El-kenawy, E.M.; Albalawi, F.; Ward, S.A.; Ghoneim, S.S.M.; Eid, M.M.; Abdelhamid, A.A.; Bailek, N.; Ibrahim, A. Feature selection and classification of transformer faults based on novel meta-heuristic algorithm. Mathematics 2022, 10, 3144. [Google Scholar] [CrossRef]
  130. Meribout, M.; Tiwari, V.K.; Herrera, J.P.P.; Baobaid, A.N.M.A. Solar panel inspection techniques and prospects. Measurement 2023, 209, 112466. [Google Scholar] [CrossRef]
  131. Artaş, S.B.; Kocaman, E.; Bilgiç, H.H.; Tutumlu, H.; Yağlı, H.; Yumrutaş, R. Why PV panels must be recycled at the end of their economic life span? A case study on recycling together with the global situation. Process. Saf. Environ. Prot. 2023, 174, 63–78. [Google Scholar] [CrossRef]
  132. Abuzaid, H.; Awad, M.; Shamayleh, A. Impact of dust accumulation on photovoltaic panels: A review paper. Int. J. Sustain. Eng. 2022, 15, 264–285. [Google Scholar] [CrossRef]
  133. Jathar, L.D.; Ganesan, S.; Awasarmol, U.; Nikam, K.; Shahapurkar, K.; Soudagar, M.E.M.; Fayaz, H.; El-Shafay, A.; Kalam, M.; Boudila, S.; et al. Comprehensive review of environmental factors influencing the performance of photovoltaic panels: Concern over emissions at various phases throughout the lifecycle. Environ. Pollut. 2023, 326, 121474. [Google Scholar] [CrossRef]
  134. Fan, Z.; Wang, M.; Mu, J.; Yi, J. Alternative cleaning and dust detection method for PV modules and its application. J. Renew. Sustain. Energy 2020, 12, 053503. [Google Scholar] [CrossRef]
  135. Kavya, V.; Keshav, R.M. Solar dust detection system. In Proceedings of the 2018 International Conference on Power Energy, Environment and Intelligent Control (PEEIC), Greater Noida, India, 13–14 April 2018; pp. 138–140. [Google Scholar]
  136. Lazzaretti, A.E.; Costa, C.H.d.; Rodrigues, M.P.; Yamada, G.D.; Lexinoski, G.; Moritz, G.L.; Oroski, E.; Goes, R.E.d.; Linhares, R.R.; Stadzisz, P.C.; et al. A monitoring system for online fault detection and classification in photovoltaic plants. Sensors 2020, 20, 4688. [Google Scholar] [CrossRef]
  137. Hong, Y.Y.; Pula, R.A. Methods of photovoltaic fault detection and classification: A review. Energy Rep. 2022, 8, 5898–5929. [Google Scholar] [CrossRef]
Figure 1. The relationship between this paper and reference [35].
Energies 17 00837 g001
Figure 2. Diagram of the structure of this article.
Energies 17 00837 g002
Figure 3. PV panel overlay detection schematic diagram.
Energies 17 00837 g003
Figure 4. Seven factors affecting PV panel overlays detection.
Energies 17 00837 g004
Figure 5. PV panel fault detection diagram.
Energies 17 00837 g005
Table 1. Summary of advantages and disadvantages of image processing methods.
ReferencesYearAdvantagesDisadvantages
 [63]2022Determine the optimal cleaning solution based on image classification, and adjust the cleaning frequency according to the dustUnable to generate electricity on rainy days; takes up a lot of space
 [64]2020Does not require any sensorsCan only detect overlays such as dust or soil
 [65]2022Use drones to capture images from different angles and heightsImages captured by drones require preprocessing
 [66]2020GEE provides free satellite data and semi-automated processingGEE does not currently support the processing of high-resolution imagery (such as drone imagery)
 [67]2022The distribution and concentration of dust on photovoltaic panels can be obtained in real time without dismantling or moving the panelsIt is necessary to consider the influence of light, angle, color and other factors on image quality
 [68]2022Extracting complete edge information of PV Panels by dynamic thresholding segmentation and shape featuresThis method does not consider the influence of lighting conditions, shooting angles, image quality, and other factors on image segmentation and classification.
 [69]2022Simultaneous acquisition of infrared and visible light imagesThe influence of environmental factors needs to be considered to reduce errors and noise
 [70]2020Cleaning signals can be triggered based on predicted resultsRequires significant computing resources and time to process images
Table 2. Summary of advantages and disadvantages of deep learning methods.
ReferencesYearAdvantagesDisadvantages
 [79]2022Uses electrostatic repulsion to dislodge dust particles without the need for water or brushesRequires an additional power supply and controller to generate and regulate the electrostatic field
 [80]2022Efficient image segmentation and classification tasks using different deep learning modelsDeep learning models can be affected by noise, bias, outliers, etc.
 [81]2021An unsupervised segmentation algorithm is used to avoid interference from other factors (such as shadows, dust, snow, etc.)Requires a lot of computing resources and time to train and test the model
 [82]2023Able to adapt to different lighting conditions and sky changesLarge-scale field testing and validation has not yet been carried out
 [83]2022DRNN can solve deep neural network training difficulties and degradation problemsExperimental conditions need to be strictly controlled to increase the diversity of image types
 [84]2022Solve the problem of data imbalance through data enhancement and other methodsAppropriate network structure and hyperparameter selection are required
 [85]2022Deep belief networks (DBN) can effectively use hidden layers to improve performanceThe training process of DBN is more complicated
 [86]2023The area histogram approximation algorithm and the gray quantization algorithm are used to preprocess and feature extract the photovoltaic imageNeed to test and verify in more PV panel types and scenarios
 [87]2019Apply automatic background removal and extraction of complex featuresNo consideration is given to images of other types or conditions
Table 3. Summary of advantages and disadvantages of non-image methods.
ReferencesYearAdvantagesDisadvantages
 [88]2019Does not require any additional equipment or human interventionNeed to adapt theoretical models of photovoltaic panels to different types and sizes of panels
 [89]2020Does not rely on theoretical models or assumptions, more realistic and reliableModel training and testing requires a lot of data
 [90]2021Considering the nonlinear power generation characteristics of photovoltaic modules under low irradiance, and introducing the concept of saturated irradiance pointNeed to use the weight difference of the glass pieces to calculate the dust concentration, which requires additional equipment and operation
 [91]2019Verifying the reliability of radiometer data with thermal imaging sensorsConsider drone flight safety, stability, and regulations
 [92]2021Improve the power generation efficiency and service life of solar panelsSystem requires additional hardware and software costs
Disclaimer/Publisher’s Note: The statements, opinions and data contained in all publications are solely those of the individual author(s) and contributor(s) and not of MDPI and/or the editor(s). MDPI and/or the editor(s) disclaim responsibility for any injury to people or property resulting from any ideas, methods, instructions or products referred to in the content.

