Article

Improving the Indoor Air Quality of Office Buildings in the Post-Pandemic Era—Impact on Energy Consumption and Costs

by
Diana D’Agostino
1,*,
Federico Minelli
1,
Francesco Minichiello
1 and
Maddalena Musella
2
1
Department of Industrial Engineering, University of Naples Federico II, 80125 Naples, Italy
2
Polytechnic and Basic Sciences School, University of Naples Federico II, 80125 Naples, Italy
*
Author to whom correspondence should be addressed.
Energies 2024, 17(4), 855; https://doi.org/10.3390/en17040855
Submission received: 10 January 2024 / Revised: 5 February 2024 / Accepted: 6 February 2024 / Published: 12 February 2024
(This article belongs to the Section G: Energy and Buildings)

Abstract

:
Before the COVID-19 pandemic, ventilation in buildings was not always given its due importance. The World Health Organization has highlighted the important role of air exchange with the outdoors in improving the air quality in buildings; buildings should, therefore, be equipped with mechanical ventilation or adequate air conditioning systems. This paper aims to investigate different retrofit solutions for air conditioning, evaluating them in terms of energy consumption and cost and the impact of increased outdoor air exchange rates on countering the propagation of COVID-19; the latter is the main novelty of the paper. As a case study, we take an existing office building located in Central Italy that was previously not equipped with a mechanical ventilation system (a system with primary air was introduced during the study). The energy analysis was conducted using dynamic simulation software after validation through energy bills; energy and economic analyses were conducted considering different external-air exchange rates. An optimal number of outdoor air changes was found to mitigate the risk of COVID-19 infection, a finding in line with the international literature. The increase in air changes with outdoor air leads to a rise in energy consumption and costs. These values were evaluated for different air conditioning systems and operational schedules. These drawbacks can be made less significant by combining interventions in the system with energy-efficiency measures applied to the building envelope.

1. Introduction

In 2020, the SARS-CoV-2 virus appeared on Earth, generating a disastrous pandemic. This virus belongs to the coronavirus family and mainly affects the respiratory tract, causing an infectious disease called COVID-19 [1]. Compared to the infections caused by other coronaviruses, this disease is characterized by a high level of contagiousness and a moderate level of mortality, with a variable incubation time (4–11 days) [2,3]. Some uncertainties regarding its transmission routes remain to be resolved by the scientific community [4]. Its speed of propagation and the absence of specific treatments meant that on 11 March 2020, the World Health Organization (WHO) declared a pandemic. Numerous variants of this virus have been discovered, and in 2021, a vaccine was produced and administered to most of the population. To date, the primary treatment for the disease is still to manage symptoms and isolate the patient [5]. The correct use of facial masks has also been found to be an effective means of defence against documented and undocumented infections [6,7]. Furthermore, containment and social-distancing measures have been implemented around the world to avoid health-systems, economic, and social collapse [8,9]. COVID-19 infection spreads in three main ways [10]:
  • direct contact with an infected person;
  • contact with infected surfaces;
  • inhalation of respiratory droplets produced by an infected person.
Respiratory droplets produced by an infected person vary in size. Some of them are so small (<5 μm) that they are not affected by gravitational forces and remain in suspension, forming a bio-aerosol [11,12]. For this reason, Luongo et al., in their review paper, [13] highlight the importance of re-designing the heating, ventilation, and air conditioning (HVAC) systems and characterizing and improving their behaviour through quantitative meta-analyses. Several studies strongly advise ventilating rooms via air conditioning and ventilation systems, as ventilation significantly contributes to the dilution of the contaminants [14,15]. However, when natural ventilation is not possible, mechanical ventilation or air treatment can be a vehicle for the spread of infection due to recirculation of indoor air [16,17]. In fact, for this reason, there is a need for an adequate filtration system with absolute filters in HVAC systems [18]. Energy analyses that include CFD simulations of the building-plants system have been used to investigate these aspects [19].
The use of mechanical ventilation coupled with local in-room filtration or in-room germicidal air disinfection can increase medical safety. When mechanical ventilation is provided, the ability of an outdoor air exchange system to counteract the spread of COVID-19 often cannot be guaranteed merely by settings the hourly volumes of outdoor air according to national or international standards, such as the Italian UNI 10339 [20]. Indeed, ventilation rates calculated using UNI 10339 usually yield values less than 1.0 air changes per hour (ACH). From a literature analysis, some rules can be extrapolated that support preventing the risk of infection through air conditioning systems. For example, when fan-coil units are present in a room, the air velocity should be less than 0.5 m/s; this velocity can be obtained by minimizing flow rates and operating the terminal units in continuous mode [21]. When the air conditioning is guaranteed by an air handling unit (AHU), recirculation is not recommended and the system should switch on at least two hours before and switch off at least two hours after occupation of the room; furthermore, HEPA (High-Efficiency Particulate Air) filters and ultraviolet (UV) or “far UV” sterilizing technology for the entire room are strongly recommended [22,23]. Moreover, close attention must be paid not only to the type of HVAC system, but also to the types of air terminals in the room and above all to their position (i.e., supply diffusers at the top and extraction vents at the bottom). Finally, heat recovery is possible but must be done with a non-rotary type of recuperator, as recommended in the literature [24] and by international and national guidelines [25,26].
The problem of establishing a minimum number of hourly changes of outdoor air that would be needed to significantly counter the spread of the infection in existing buildings is highly relevant and poorly investigated. Some studies have been performed to calculate hourly volumes of outdoor air on generic control volumes, but they did not consider real building structures and spaces [27,28]. In [29], the indoor air quality (IAQ) was modelled within a studio apartment with a mechanical exhaust system that was manually controlled by the building occupants. In [30], the effectiveness of an air terminal device with a changing geometry was verified in terms of improvement in indoor air quality. Other studies have addressed the effects of occupancy rate and volumetric air flow by computational fluid dynamics (CFD), applying this method to a university room [31], an operating room [32], and a passive house [33].
Mathematical models for the evaluation of airborne infection risk are also widely used in the literature. The Wells-Riley Model (WRM), devised by E.C. Riley, G. Murphy, and R.L. Riley in 1978 [34] using data from a measles epidemic in 1974, is one of the most classic approaches for statistically assessing airborne infection risk. In [35], a study on ventilation rates and the assessment of COVID-19 infection risks in an outpatient building was performed using this model. In [36], the same approach was used together with the spatial flow impact factor (SFIF).
In [37,38], modified Wells-Riley models were used for the evaluation of airborne infection risk. Experiments also demonstrated that these methods effectively evaluate the airborne infection risk.
In [39], the authors assess the energy, economic, and environmental impacts of enhanced ventilation strategies in railway coaches using the Wells-Riley model on a real train as a case study. The work in [40] analyses optimization strategies to reduce energy consumption while meeting the demands of epidemic prevention, also using the Wells-Riley model, in several reference-building typologies.
Based on our analysis of the current international literature, many studies have focused on the evaluation of the spread of COVID-19 using the Wells-Riley model or the CFD approach and some papers have evaluated the effect of increased outdoor ACH on the mitigation of COVID-19 risk infection. However, to the best of the authors’ knowledge, there are no studies examining the direct correlation between the analysis of external air change volumes and what happens in a real case study, especially for an existing highly crowded building, such as one intended for offices. Moreover, no particular attention has been paid to the variability in the outdoor ACH of a real building, considering the increase in energy consumption and costs, different configurations of HVAC systems, and various operating schedules that could be implemented to mitigate the increase in energy expenditure.
To fill this gap, this paper has the aim of determining the optimal number of hourly changes of outdoor air, as well as investigating different types of HVAC systems with various operational schedules to determine the best solutions in terms of energy consumption, cost, and effectiveness in reducing the propagation of COVID-19. Based on the results, a minimum value of renewal air-flow rate consistent with the literature (5 ACH) is proposed as a measure for counteracting the spread of the infection in a real office building located in Central Italy. The American Centers for Disease Control and Prevention indeed recommends 5 ACH for buildings [41]; moreover, this value has also been reported in other studies about airborne virus transmission [42,43]. A simulation-based approach was used. The correlation between the outdoor ACH and the risk of propagation of COVID-19 was analysed by the Welles-Riley model (WRM).
Subsequently, a retrofit of the building envelope is proposed to mitigate the effects of the increased rate of outdoor air changes on the energy consumption and economic performance of the building. Envelope retrofit is, indeed, one of the most effective measures by which to reduce the energy consumption and operating costs of buildings [44,45].
Ultimately, this paper, after the calibration of the model for an existing public office building, conducts the following innovative investigations:
  • applies the Welles-Riley Model to determine the optimal number of outdoor air changes needed to significantly reduce the spread of COVID-19 in a real building;
  • investigates different HVAC solutions, i.e., systems with fan-coil units and primary air or radiant panels and primary air, in combination with various operational schedules, evaluating, in terms of energy consumption and cost, the effectiveness of increased outdoor air changes for reducing the propagation of COVID-19;
  • provides energy retrofit measures applied to the building envelope to mitigate the impact of the increased ventilation rates on energy and economic expenditures.

2. Methodology and Case Study

In Figure 1, the workflow of the research methodology is shown.
The research was conducted on an existing public office building located in central Italy. The building was chosen because it is representative of many historic buildings in Italy. The building was built in the fourteenth century and is made up of load-bearing walls. The colour, materials, and layout of the spaces make it representative of many historic buildings that were initially built for one intended use and subsequently adapted to a public function. Their use has changed over time, but there has been no adequate retrofit of the HVAC system to serve the new function. There are many historic buildings that house offices and in which there is no mechanical ventilation or HVAC system that guarantees appropriate outdoor air exchange. This shortcoming is a problem not only in terms of satisfactory indoor air quality, but also in terms of mitigating the COVID risk after the recent state of emergency.
The office building examined in this study is in Formia, in the Province of Latina (Central Italy). Climate data are reported in Table 1.
It must be noted that the proposed analysis focuses on Central Italy, which is characterized by temperate climatic conditions. The results would be different in localities with more extreme climatic conditions (very hot or very cold climates), where the increase in the number of hourly outdoor air changes therefore leads to a greater increase in the energy expenditure.
The characteristics of the building-plants system were evaluated through surveys of the building. The inspections revealed the actual geometrical and thermal characteristics of the building envelope and the type of HVAC systems in place. The building under study has a singular semicircular shape that is more regular to the south and more irregular in the rear part, to the north. It is regular in height, standing 3 floors above ground with an interior height of 3.20 m, and it has a flat roof with an area of approximately 300 m2. The total useful floor area of the building is 770 m2. Figure 2 shows the first-floor plan. The other two floors are very similar.
The building has a masonry structure made of mixed stones and bricks for the perimeter walls, with a plaster finish both internally and externally. The windows are characterized by wooden frames and double glazing, with external wooden shutters that guarantee shade in summer. The roof slab is made of concrete. Table 2 shows the thermal characteristics of the building envelope components, as evaluated based on ISO Standard 6946:2017 [48]. The stationary thermal transmittance, U, is defined as the heat flow, in steady-state conditions, that passes through a structural element with a 1 m2 surface area of the wall in a unit of time, given a temperature difference of 1 K degree between the indoor air and the outdoor air. The dynamic thermal transmittance Yie is also shown. Yie is a parameter that defines the ability of an opaque wall to phase shift and attenuate the periodic component of the thermal flow that passes through it over a 24-h period. Very high values of stationary transmittance can be noted for the opaque components. The main façade, which is semi-circular, faces to the south/south-east and has no buildings in front of it that could create shade. The only buildings obstructing direct radiation on the main facade are two buildings located on the side.
The existing HVAC system is characterized by a condensing boiler with an energy efficiency equal to 104%, with radiators for winter heating, and by 23 split systems (EER equal to 3.2) for summer air conditioning. The heating and cooling set points for indoor air temperature are set to 20 °C and 26 °C, respectively, and a basic on-off control system is present in the existing building. These set points have been reported in Italian decree DPR 74/2013 [49] and are also consistent with the recommendation of ASHRAE Fundamentals 2021 [50]. Domestic hot water (DHW) is provided by the same condensing boiler used for building heating. Settings assume a consumption of 10 L per person per day from Monday to Friday from 8:00 to 18:00 and on Saturday from 8:00 to 14:00 (the detailed scheduling program for DHW is the same as that for occupancy, reported in Table 3). Outdoor air changes are guaranteed only through natural ventilation (0.7 vol/h). This is the main factor limiting the achievement of adequate indoor air quality. For this reason, the first proposed intervention, after model calibration, was to insert an air handling unit for primary air in the building. The typical year is considered to include 10 days of holidays. On these days, the office and related systems are off.
The dynamic simulations were performed in DesignBuilder V.6, a parametric software of DesignBuilder Software Ltd., Gloucestershire, UK, that allows dynamic energy simulation of a building [51]. The main parameters used for the simulation process were as follows:
  • Surface convection algorithm inside TARP—variable natural convection based on temperature difference
  • Surface convection algorithm outside: DOE-2—correlation from measurements for rough surfaces
  • Heat balance algorithm conduction transfer function: 4 timesteps/hour (i.e., the time between two consecutive energy balances).
The number of timesteps per hour used in the zone heat-balance model calculation as the driving timestep for heat transfer and load calculations is 6. This means that the simulation was performed with a timestep of 10 min.
The weather file used for the simulation is a typical meteorological year (TMY) Energy Plus Weather File (EPW) for the location.
The analysis starts with the calibration of the model against measured real consumption data obtained from the bills for the year 2018. The energy bills used in this study were based on direct metering by the energy carriers. Smart meters are employed to perform the monthly data acquisition (Italy has one of the most advanced smart-metering systems in Europe. In 2011, Italy already had 90% electric-energy smart meters installed—second only to Sweden, with 99%. Moreover, currently, first-generation smart meters are installed at approximately 80% of points of delivery for gas).
The building is divided into 32 thermal zones (8 on the first floor, 12 on the second floor, and 12 on the third floor).
The occupancy schedules and internal gains reported in Table 3 were used as input data for the calibration process.
Table 3. Occupancy schedules of the existing building and input data for the calibration process.
Occupancy and DHW Schedules
From Monday to Friday8:00–18:00 (8–9 10%; 9–10 40%; 10–16 100%; 16–17 50%; 17–18 10%)
Saturday8:00–14:00 (8–9 10%; 9–10 30%; 10–13 50%; 13–14 10%)
SundayClosed
Input data for the calibration process
ActivityGeneric Office Area
Occupancy0.06 people/m2
Metabolic rate0.9 met
Lighting7 W/m2 (Lighting indoor parameters based on UNI 12464 [52])
Appliances3 W/m2
Infiltration rate0.7 vol/h
Calibration was performed in compliance with Guideline 14 of the American Society of Heating, Refrigerating, and Air-Conditioning Engineers (ASHRAE) [53]. Mean bias error (MBE) and coefficient of variation of the root mean square error (Cv(RMSE)) were used. Calibration of the model consists of verifying that MBE and Cv(RMSE) are within ±5% and less than 15%, respectively, for monthly data.
MBE and Cv(RMSE) are defined by the following equations:
M B E   [ % ] = i = 1 N d s d m i = 1 N d m
C v R M S E   [ % ] = i = 1 N d s d m 2 N m s
where
d s : simulated data;
d m : measured data;
N : number of time intervals in the monitoring period;
m s : average number of measured datapoints.
Measured and simulated values of the natural-gas and electrical energy consumption of the building are reported in Table 4 and Table 5, respectively. Natural-gas values are related to heating and DHW consumption. Electrical-energy values account for summer cooling, lighting, and running appliances. Reported simulated values are those obtained after a process of fine-tuning the building energy model, which required adjustments in the occupancy scheduling and internal heat gains.
Calibration outcomes provide values of MBE equal to −2.0% and cvRMSE of 13.9% for natural gas and values of MBE equal to −1.6% and cvRMSE equal to 10.6% for electrical energy. In both cases, the obtained values are acceptable.
After the calibration of the model, the procedure used to correlate the outdoor ACH and the risk of COVID-19 infection was described and then applied to the case-study building.
The analysis to determine the number of hourly changes of outdoor ACH needed to decrease the risk of COVID-19 infection was conducted using the Welles-Riley model (WRM) [54], whose adequacy to the study of these phenomena has been widely proven in several studies in which analyses of HVAC systems were performed [54,55]. The WRM is a simple and rapid method of assessing the risk of airborne infection because it uses the concept of quanta (a quantum is defined as the dose of airborne droplet nuclei needed to cause infection in 63% of susceptible people) to implicitly consider the infectivity, the strength of the infectious source, the biological decay of the pathogens, etc. As a result, the Wells-Riley model has been widely used in studies of infectious respiratory diseases. The WRM assumes steady-state conditions and perfect mixing of air (which would make the distribution of pathogen-laden aerosols spatially and temporally uniform), i.e., ideal conditions. Numerous studies [54,55] have demonstrated the suitability of this method for evaluating the effectiveness of natural and mechanical ventilation in reducing the risk of contagion. This model is the first one used to assess the risk of airborne disease transmission. Thus, the WRM is appropriate for use in this case. Before moving on to the equations, it is helpful to provide some definitions, as follows:
-
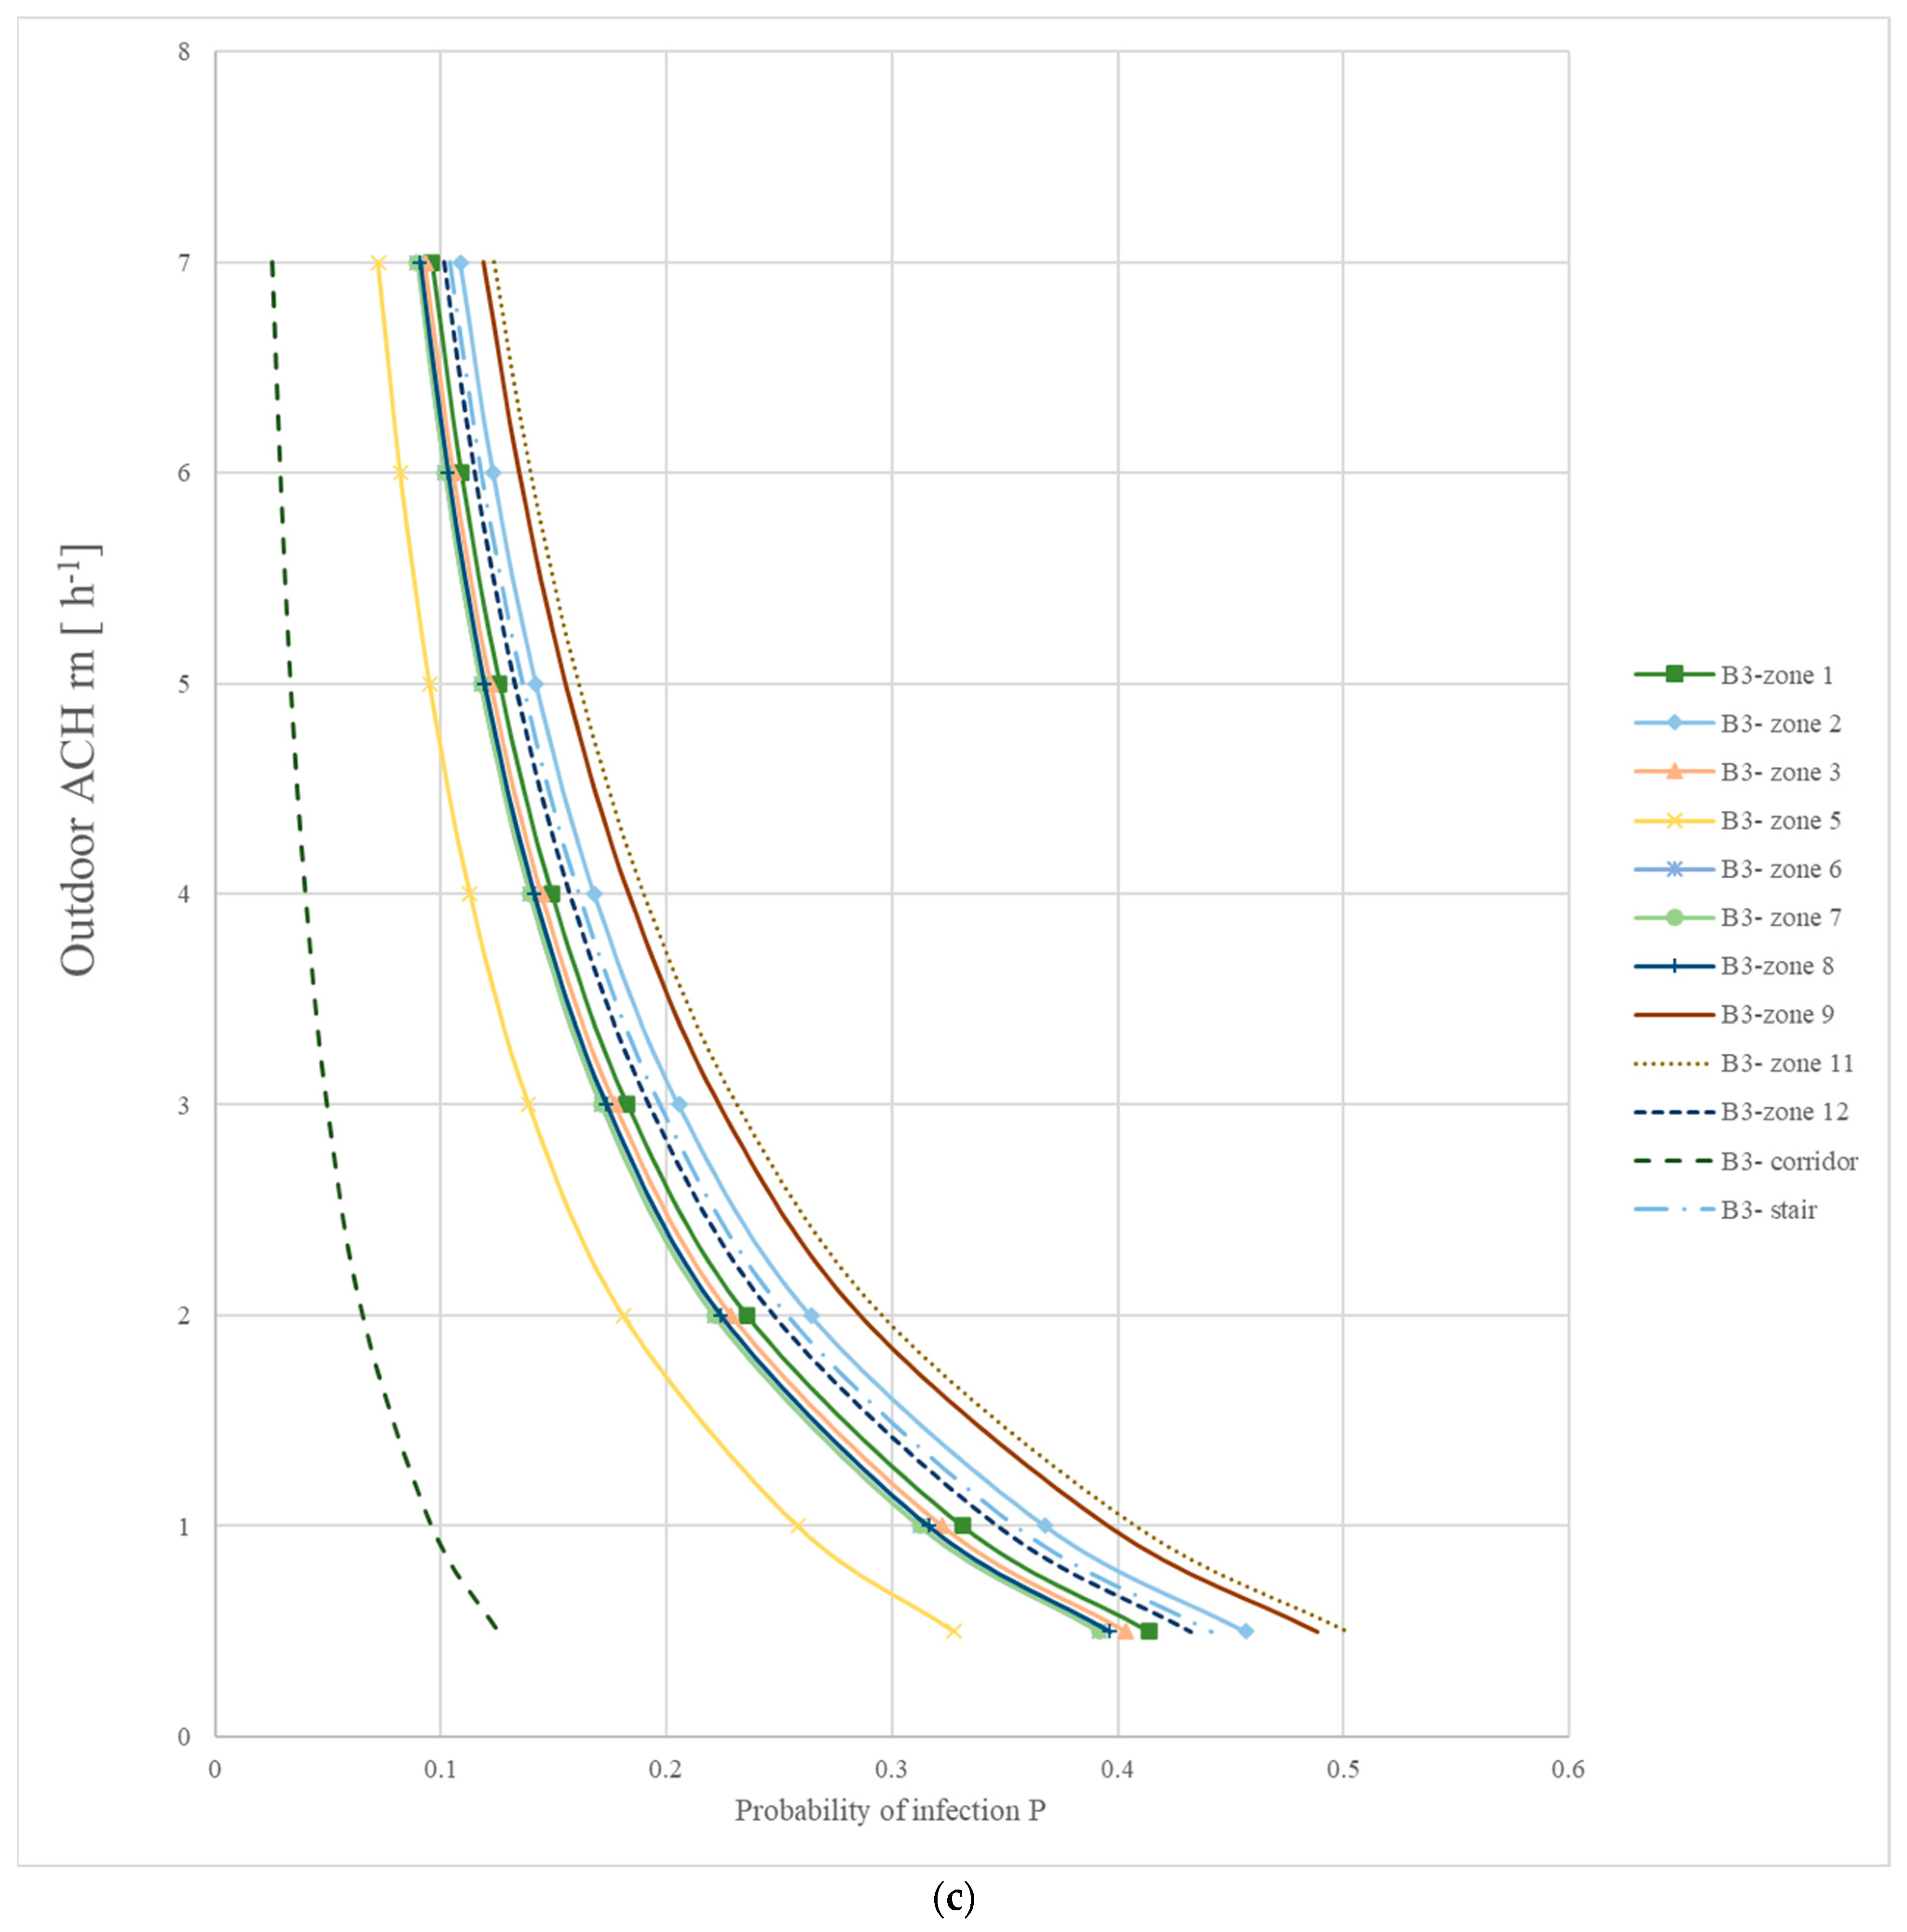
Probability of infection (P): probability of infection of a susceptible occupant exposed to a fixed number of quanta.
-
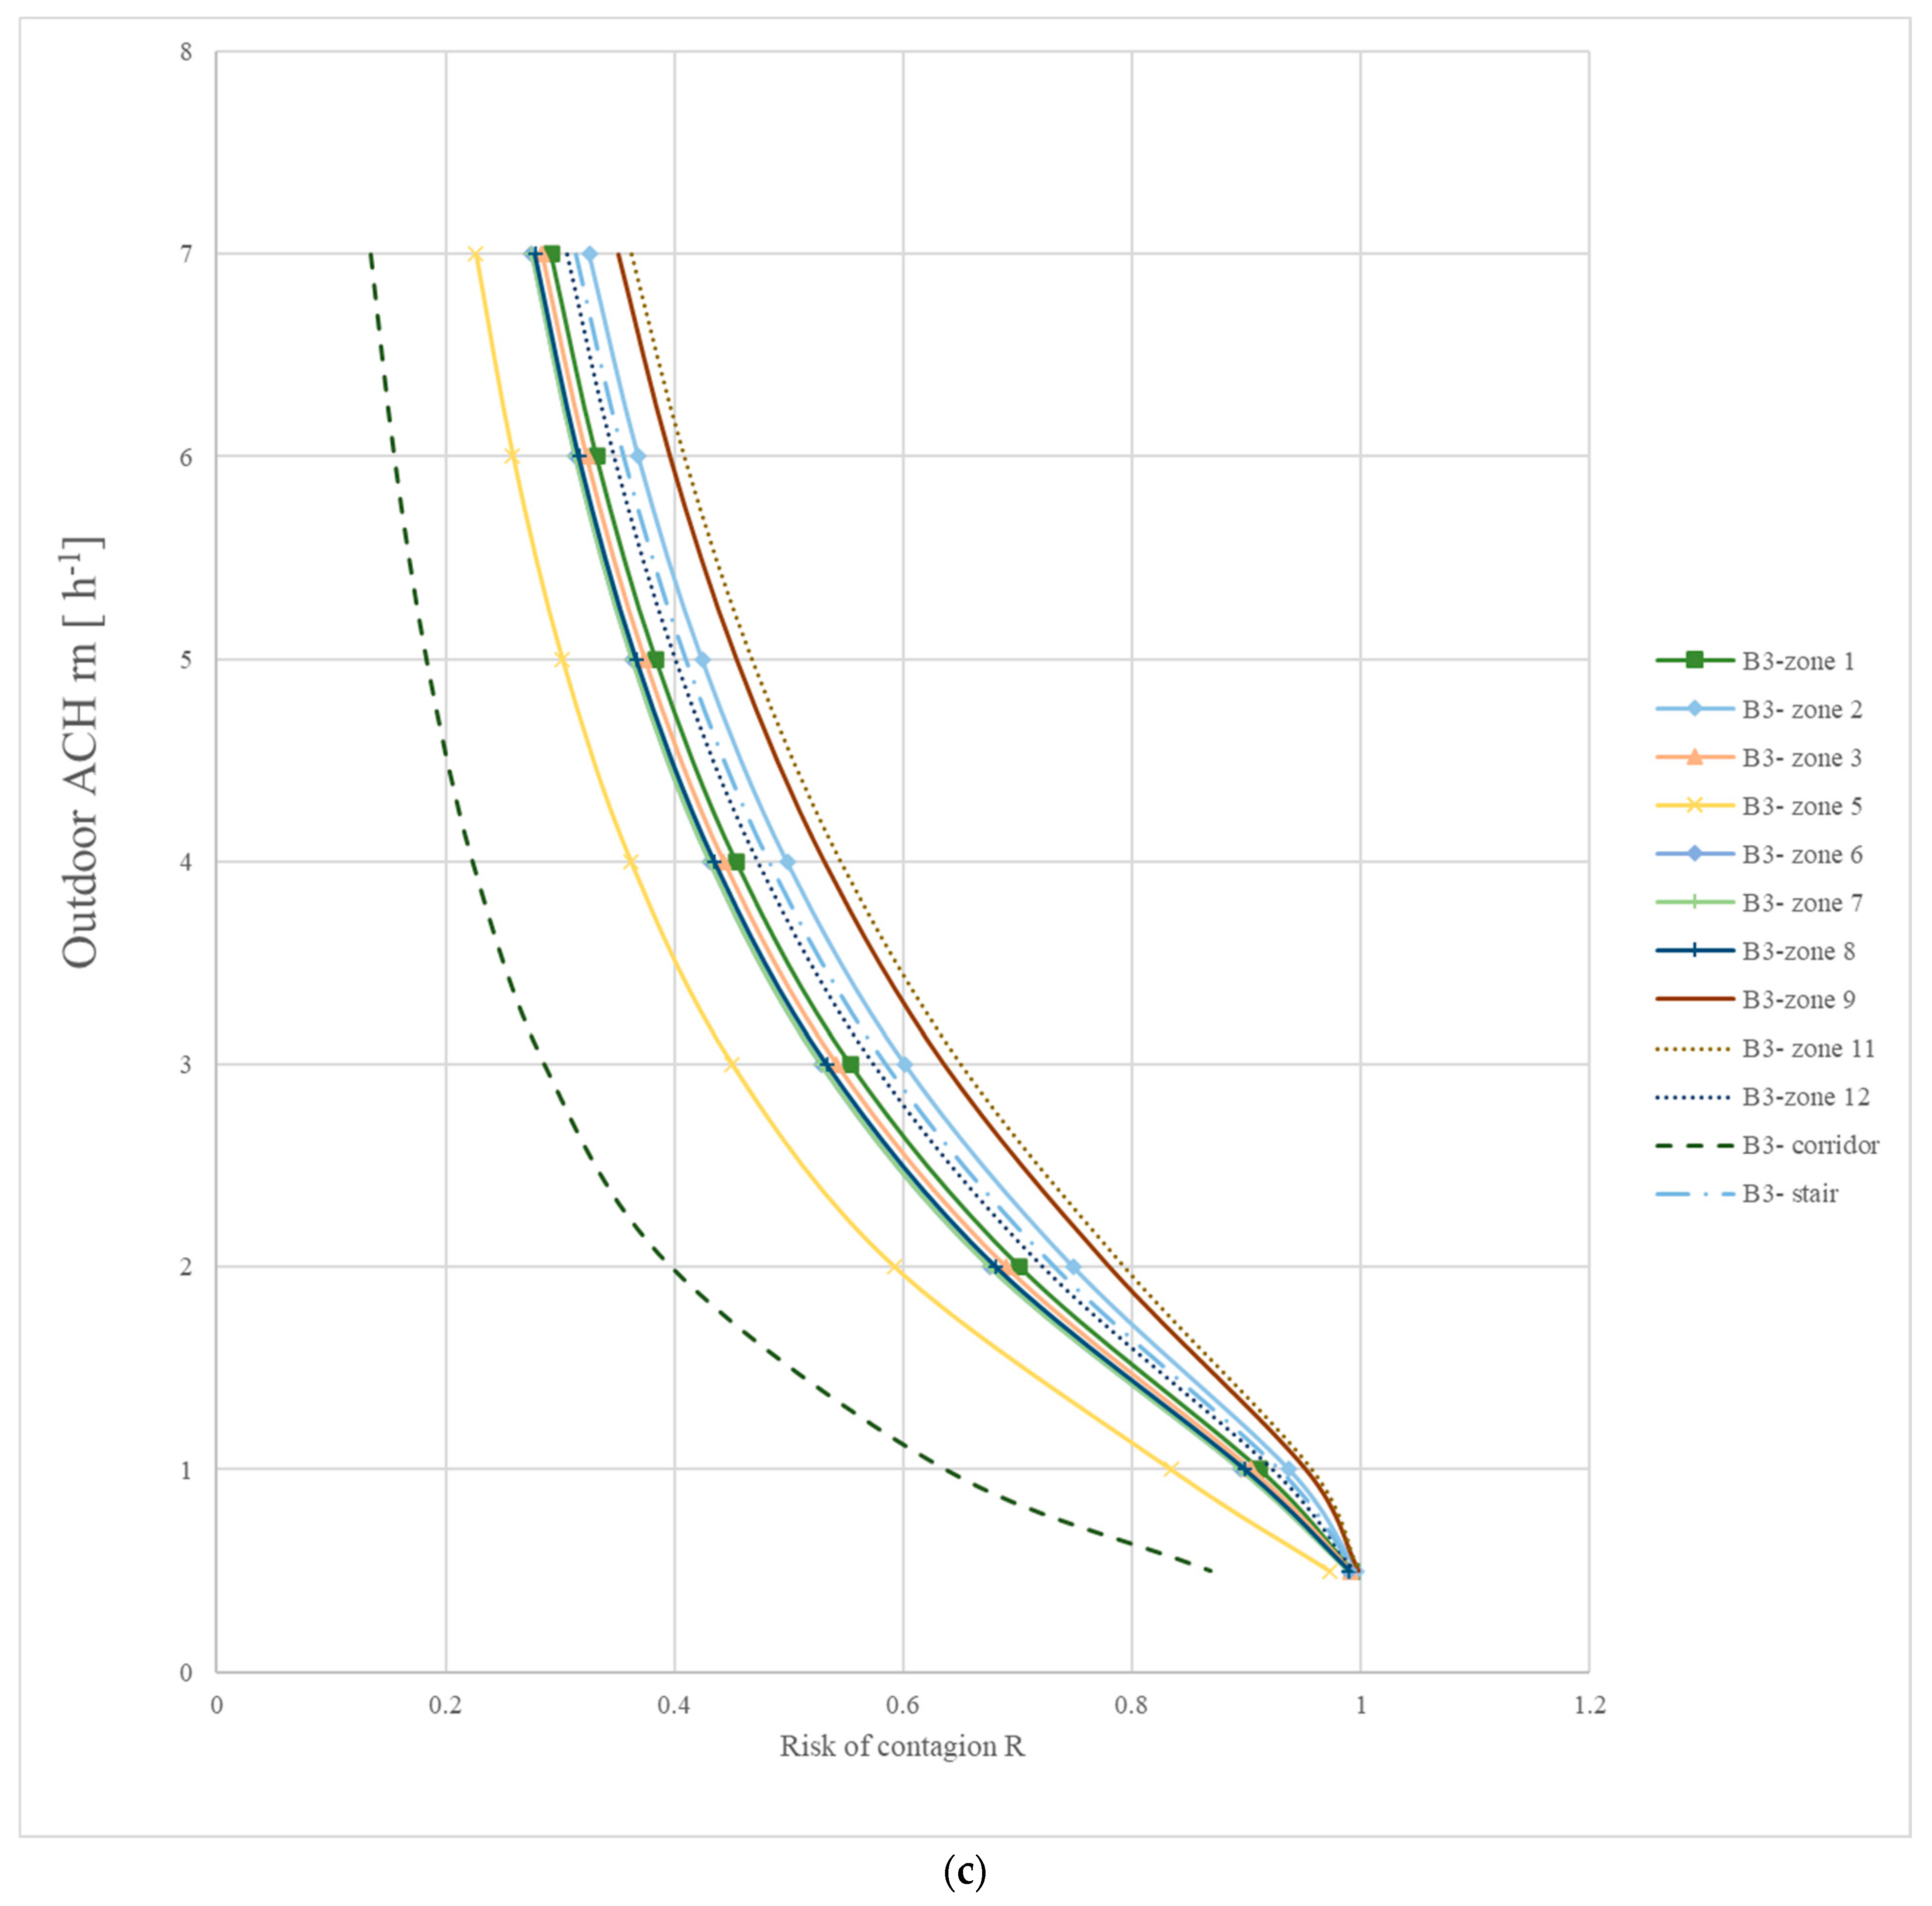
Risk of infection (R): defines how diseases are propagated by air. It represents the possibility of infection of a susceptible and exposed occupant, taking into account the possible values of the quanta emission rate, which are in turn determined by the type and levels of activity and respiratory parameters. The greater the risk of infection, the more likely an infection is to happen and the greater the extent of the damage. The risk of infection, R, considers both the probability of infection, P, and the damage caused.
According to this model [56,57], the risk of infection, R, can be expressed as follows:
R = 1 e I   q   p N   t Q
I = number of infected people;
q = number of quanta released by an infected person  [ h 1 ];
p N  = average breathing air flow per person [ m 3 h ];
t = exposure time [h];
Q = renewal air-flow rate [ m 3 h ].
This equation is then modified by introducing the renewal air-flow rate, n, [h−1] (V [m3] is the volume of the room):
R = 1 e I q p N t n V
By applying this equation to the case study, it is possible to calculate the risk of contagion linked to each evaluated ventilation rate n.
Further analysis is conducted by assessing the probability of infection P [56,57]:
P = 1 e x p q I p V 1 N t e N t N 2
q = emission of infectious doses emitted by an asymptomatic subject [quanta h−1]
I = number of asymptomatic infected individuals
p  = pulmonary breathing rate [m3/h]
V = room volume [m3]
N = overall removal factor in the environment  N = λ + k + r n   [ h 1 ]
λ = removal factor for virus inactivation in the environment  [ h 1 ]
k = removal factor for deposition in the environment  [ h 1 ]
rn = ventilation rate [h−1]
t = time [h]
The following parameters were obtained from several articles published by Buonanno et al. [56,57] on the spread of COVID-19 infection and by Cavallini et al. [58] on comparable indoor operating conditions.
I = 1
λ = 0.63  [ h 1 ]
k = 0.24  [ h 1 ]
q = 26.3 [quanta h−1]
t = 8 [h]
p  = 0.8 [m3/h]
For the people present in the building, low-intensity activity (metabolic rate equal to 0.9 met) was assumed, as the building is intended for office use. The analyses were carried out for all three levels of the building, considering each room individually. Bathrooms are not served by mechanical ventilation and, therefore, these locales were excluded from the analysis.
It is well known that other factors such as surface contamination and human behaviour may impact the spread of COVID-19. However, these other factors are not considered in this study, which aims only to analyse the effectiveness of outdoor ACH as a mitigation measure for COVID-19 and a mechanism by which to improve indoor air quality.
Similar considerations apply to the study of mitigation measures. This analysis focuses on the HVAC system, and sufficient outdoor ACH is examined as the only mitigation measure for COVID-19. Although other mitigation measures (such as face masks, surface cleaning, social distancing, etc.), are available, their use became voluntary rather than mandatory for the occupants after the end of the state of emergency. Furthermore, interventions on the air conditioning system are less invasive for users than personal protective equipment, which users may find more annoying or difficult to use. Therefore, mitigation measures based on personal protective equipment were not considered in this study.
The analyses were carried out after virtual replacement of the existing HVAC systems with two different types of plant configurations:
  • fan-coil system and primary air;
  • radiant panels and primary air.
In both cases, the primary air was supplied to each room by means of delivery vents arranged on the wall adjacent to the corridor (at the top, 20 cm away from the ceiling). Then, the air was extracted by means of transit grilles in the doors of the rooms and via intake grills placed in the false ceiling of the corridor.
The existing boiler was replaced by an air-to-water heat pump for heating and cooling and a dedicated heat pump for DHW. Moreover, the analysis examined an air handling unit for primary air and fan coils or radiant panels instead of the old radiators. No heat recovery was taken into account.
The analyses were performed first under standard conditions (without considering the spread of the virus) and then under conditions intended to prevent the spread of COVID-19 infection. This process was necessary because it allowed us to obtain the required comparisons in terms of energy consumption and costs. Standard (i.e., pre-COVID-19) conditions were defined as follows:
  • external air-flow rates calculated according to the Italian standard UNI 10339 [20]: 0.8 vol/h;
  • operating periods of the HVAC system: 8:00–18:00, i.e., as set in the real building.
Based on the Walles-Riley model [54], multiple possible operating periods for the HVAC system were tested. For all the proposed schedules, the flow rate of outdoor air and its relationship to the risk of COVID infection, as previously described by Equations (2) and (3), are kept unchanged (5 ACH), but the HVAC system type and the operating programs are varied as follows:
  • HP-1 Fan-coil system and primary air with operating program 6:00–20:00
  • Hp-1.1 Radiant panel system and primary air with operating program 6:00–20:00
  • HP-2 Fan-coil system and primary air with 24/24 h operating program for primary air and 6:00–20:00 for fan coils
  • Hp-2.1 Radiant panel system and primary air with 24/24 h operating program for primary air and 6:00–20:00 for radiant panels
  • Hp-3 Fan-coil system and primary air with 24/24 h operating program for the entire system
In all these proposed systems, the primary airflow is considered constant (always 100%).
Lastly, a retrofit measure of the building envelope is proposed to mitigate the effects of the increased air-change volumes on the energy use and economic performance of the building under both Hp-1 and Hp-1.1. A simple payback period and discounted payback period were calculated.

3. Results and Discussion

As mentioned above, the existing HVAC system was replaced in the analyses with two different types of systems, and the energy consumption and the dimensions of the air ducts were evaluated for both proposed systems to measure the architectonic impact of the HVAC system. Note that both types of systems were first analysed under standard conditions, i.e., as they would have operated pre-COVID-19, and then under conditions designed to lower the risk of infection. After the calibration process, the necessary outdoor ACH was examined through a parametric analysis based on the probability of infection (Figure 3) and the risk of contagion (Figure 4). This evaluation has been made for each thermal zone based on Equations (2) and (3), as in these equations, the risk of contagion and the probability of infection are expressed as functions of the external air changes (rn). The obtained optimal value for external ACH was then used in the building energy model to obtain the energy consumption for each proposed system.
In Figure 3 and Figure 4, the outdoor air changes per hours (ACH) are repored as function of the probability of infection for each building zone and the risk of contagion, respectively. Both parameters show asymptotic behaviour, but the main result is that, even though the cases are different, they all tend towards the same ACH value (5 vol/h). When ACH increases beyond this value, neither the probability of infection nor the risk of contagion decrease significantly. For this reason, the value of 5 vol/h was used as the input value for the simulations of different systems intended to mitigate the risk of COVID-19 infection, and this number is consistent with the literature findings. This result is also in line with the recommendations of the American Centers for Disease Control and Prevention (5 ACH for buildings [41]) and with the results of other studies about airborne virus transmission [42].
After the value was chosen for outdoor ACH, a comparison was made between a design of the ducts in the pre-COVID condition, i.e., with the outdoor ACH calculated through the Italian technical standard UNI 10339 (11 dm3/s per person, equivalent in this case to 0.8 vol/h), and the new cross-sections of the air ducts based on a value of ACH equal to 5 vol/h. The dimensions of the air ducts were calculated by considering the velocity of the air equal to 5 m/s in the main ducts and 2 m/s at the aeraulic terminals. As Table 6 shows, the cross-section of the air ducts greatly increases (+525%) under COVID conditions. Note that ACH values of 5 h−1 or higher are usual in some air conditioning systems (for example, up to 20 ACH is normal in hospital operating rooms) without any significant air draft and subsequent discomfort in the rooms served. It is sufficient to appropriately choose and size the supply air diffusers or vents to obtain an air speed in the room of approximately 0.15 m/s.
Moreover, the thermal comfort conditions were verified for each room in all the analysed cases (i.e., in the HP-1, HP-1.1, HP-2, HP-2,1, and HP-3, both with 0.8 ACH and with 5.0 ACH), through the building energy dynamic simulation software DesignBuilder.
Once the air-flow rate was set for both cases (pre-COVID ACH and post-COVID ACH), the energy performances of these two different systems were evaluated (See also Section 2—Methodology and case study). As shown in Table 7, in the post-COVID conditions, the lowest energy consumption occurs in the Hp-1 and Hp-1.1 systems, considering an outdoor ACH equal to 5 vol/h and operating programs of the HVAC systems from 6:00 to 20:00. Increases of 78% and 77%, respectively, were observed in the case of a system with a fan coil and primary air (Hp-1) and the case of the system with a radiant panel and primary air (Hp-1.1), compared with the pre-COVID-19 conditions.
Of course, the increase in energy consumption represents an increase in energy costs. Considering a tariff of electrical energy equal to 0.206 €/kWh, Table 8 shows an increase in yearly expenditure of about 12,000 €. This is a very remarkable result, considering the impact of these COVID-19 spread-mitigation strategies.
To cope with the significant energy expenditure associated with installing oversized HVAC systems to reduce the spread of viruses, an intervention on the building envelope has been proposed that would reduce the energy requirements of the building. Specifically, the simulated intervention consists of external coat insulation of the perimetral walls and thermal insulation of the roof slab. In this way, the thermal transmittance of the roof and walls is drastically reduced, as shown in the values reported in Table 9.
The analyses following the intervention on the building envelope were performed only for proposed systems Hp1 and Hp1.1, as they performed best in terms of both energy consumption (Table 10) and energy costs (Table 11). These proposed systems allow for higher energy savings and consequently for lower energy expenditures compared to the other systems tested.
There is a significant decrease in energy consumption and costs compared to the same system without the intervention on the building envelope. Figure 5 shows the comparisons between the pre-COVID system and the proposed building HVAC systems system with and without the changes to the envelope for both plant configurations: fan coils with primary air and radiant panels with primary air.
Figure 5a,b shows an increase in energy consumption and costs of about 77% in both cases (fan coils and radiant panels) compared to the pre-COVID system (0.8 vol/h). At the same time, when an intervention to improve the efficiency of the building envelope is added to the system that yields the increase in outdoor airflow, this increase in energy consumption and cost becomes 25–30%. Thus, although the increase in the outdoor airflow that is necessary to reduce the risk of COVID infection certainly leads to an increase in energy cost, this cost can be significantly reduced if this intervention on the HVAC system is accompanied by another to improve the building envelope from a thermal point of view.
Finally, an analysis to evaluate the payback period was performed. Thermal insulation requires a wall area of 1075 m2 and a roof area of 400 m2, with an economic expenditure of 164,775 €. The cost of external wall and roof insulation were assumed to be equal to 90.0 €/m2 and 75.0 €/m2, respectively, and the design costs and VAT were assumed to be equal to 30%. Both these values were retrieved from official Italian price lists for public works. A cost of electrical energy equal to 0.206 €/kWh and a discount rate of 4% were used for the calculations. Considering annual savings of 7662.0 €/year under Hp-1 and annual savings of 8284.0 €/year under Hp-1.1, the simple payback period and the discounted payback period of the two proposed systems are equal to about 21.5 and 50 years for Hp-1 and to 20 and 40 years for Hp-1.1 (Figure 6 and Figure 7).

4. Conclusions

In the post-COVID era, much importance must be given to mechanical ventilation and air conditioning systems; it is especially necessary to ensure greater flowrates of outdoor air to mitigate the risk of infection with COVID-19 and other viruses and to guarantee adequate air quality. However, a significant increase in outdoor airflow entails a significant rise in energy consumption and costs, which can vary depending on the type of system and the period of operation. The evaluation of the effect of a high value of outdoor air-flow rate (5 ACH, effective in reducing COVID-19 infection) on the increase in energy expenditure has been poorly analysed in the current international literature. Furthermore, this paper focuses on a real historic building whose initial intended use was different from the current use; therefore, the old HVAC system, as often happens in these cases, was not suitable for the new post-pandemic situation. These two aspects represent the main novelty of this research work.
In this paper, the HVAC system of an existing office building in Central Italy was subjected to an energy and economic evaluation in order to quantify the increase in energy consumption and cost when mitigation actions were taken to reduce the spread of viruses, especially that of Sars-CoV2. Values for each proposed system were calculated with different operational schedules. To reduce the concomitant increase in energy consumption, an intervention on the building envelope was also proposed, and energy and economic costs were evaluated. The following main conclusions can be drawn.
  • In line with the literature findings, the optimal number of hourly outdoor ACH to drastically reduce the risk of COVID-19 infection is 5 vol/h (vs. 0.8 vol/h of the pre-COVID situation, based on technical standards). When the outdoor ACH is increased over this value, risk and probability of infection show asymptotic trends. These two parameters are decreasingly affected as the number of outdoor air-flow rates increases above the optimal value.
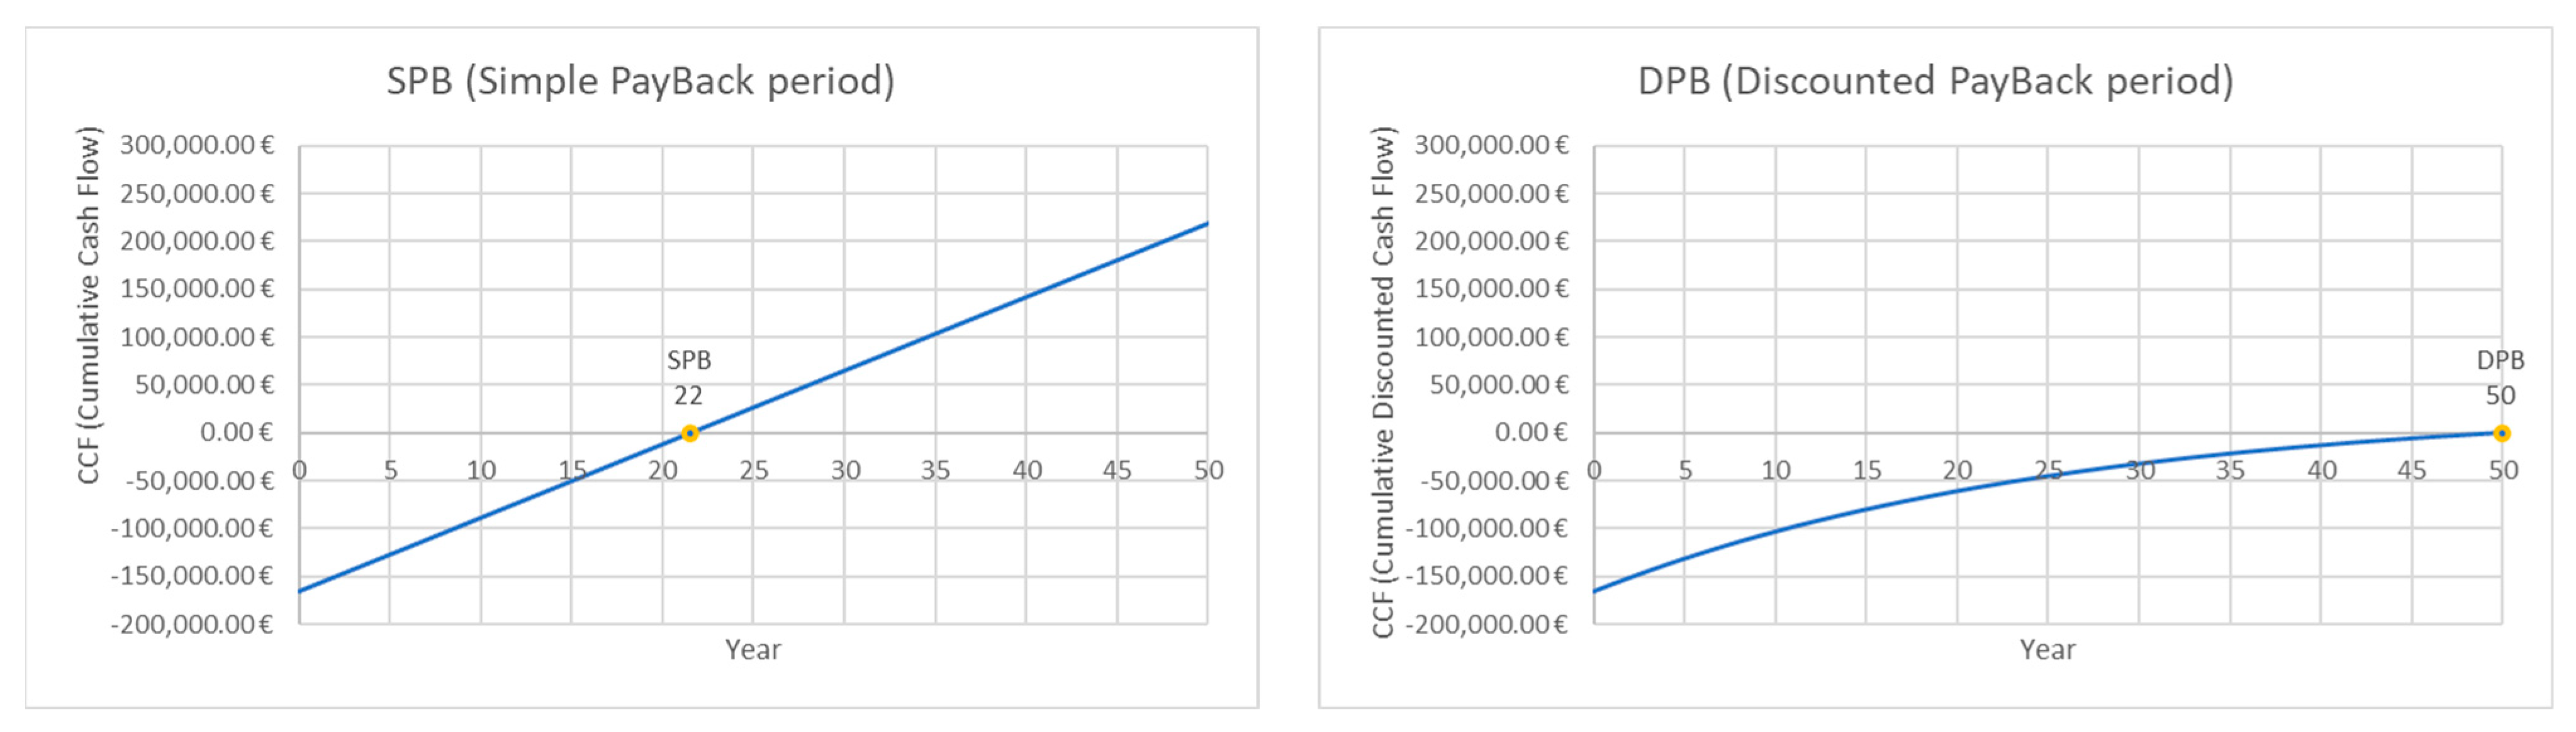
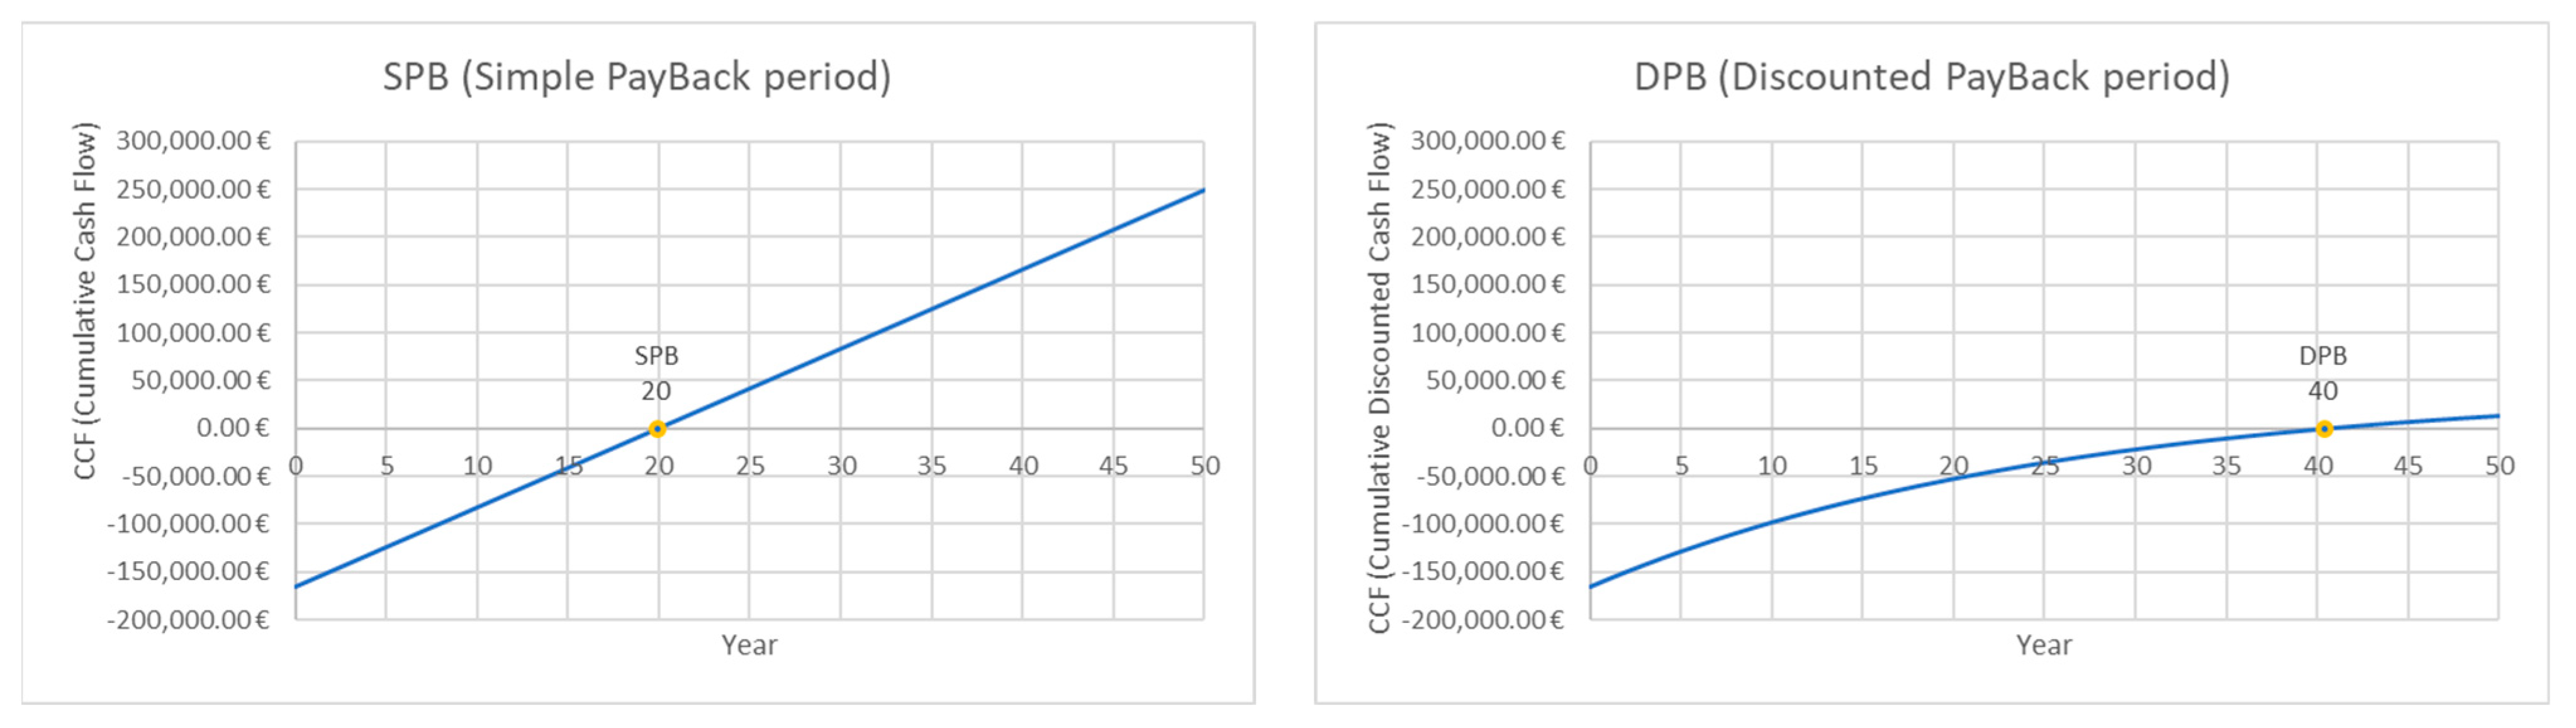
  • Among the various proposed COVID-prevention systems analysed, the best solutions from the energy and economic point of view are the Hp-1 (fan-coil units as terminals) and Hp-1.1 (radiant panel as terminals), both with an operating program of the HVAC system from 6:00 to 20:00 and a primary air-flow rate equal to 5 vol/h.
  • The significant increase in air duct sections (+525%) due to the increased air-flow rate highlights the necessity of considering architectural constraints that may be present in the existing building.
  • Interventions that focus only on the HVAC systems are useful for reducing the spread of COVID-19 but lead to a very high increase in energy consumption and related energy costs (up to 77%). A solution to this problem could be to couple the intervention on the air conditioning system with one or more interventions on the building envelope in order to lower the building’s energy requirements and, consequently, to lower energy consumption and costs. To this end, the incentives that the countries of the European Union offer for energy-efficiency interventions on building envelopes can be considered.

5. Main Limitations of the Study and Future Developments

Although the outcome of the present study has its theoretical basis in validated models, further research should provide field validation of the obtained results. Indeed, variations in real occupancy values, occupant behaviours, and outdoor air ventilation rates may alter the predictions.
Moreover, further investigations will be needed to determine an optimal value for different external air changes for each room for different values of q (emission of infectious doses by an asymptomatic subject).

Author Contributions

Conceptualization, D.D., F.M. (Federico Minelli), F.M. (Francesco Minichiello) and M.M.; Methodology, D.D., F.M. (Federico Minelli), F.M. (Francesco Minichiello) and M.M.; Software, D.D., F.M. (Federico Minelli), F.M. (Francesco Minichiello) and M.M.; Validation, D.D., F.M. (Federico Minelli), F.M. (Francesco Minichiello) and M.M.; Writing—original draft, D.D., F.M. (Federico Minelli), F.M. (Francesco Minichiello) and M.M. All authors have read and agreed to the published version of the manuscript.

Funding

This research received no external funding.

Data Availability Statement

The raw data supporting the conclusions of this article will be made available by the authors on request.

Acknowledgments

The authors gratefully acknowledge the support of the projects: Sustainable Energy Systems for High Efficiency Buildings, CUP E65F21003190003; PRIN 2020: OPTIMISM—Optimal refurbishment design and management of small energy micro-grids, funded by the Italian Ministry of University and Research (MUR)—CUP E69J2200110000.

Conflicts of Interest

The authors declare no conflict of interest.

References

  1. World Health Organization. Coronavirus Disease (COVID-2019) Situation Reports. 2020. Available online: https://www.who.int/emergencies/diseases/novel-coronavirus-2019/situation-reports/ (accessed on 26 February 2020).
  2. Wang, D.; Zhou, M.; Nie, X.; Qiu, W.; Yang, M.; Wang, X.; Xu, T.; Ye, Z.; Feng, X.; Xiao, Y.; et al. Epidemiological characteristics and transmission model of Corona Virus Disease 2019 in China. J. Infect. 2020, 80, e25–e27. [Google Scholar] [CrossRef]
  3. Shiu, E.Y.C.; Leung, N.H.L.; Cowling, B.J. Controversy around airborne versus droplet transmission of respiratory viruses: Implication for infection prevention. Curr. Opin. Infect. Dis. 2019, 32, 372–379. [Google Scholar] [CrossRef]
  4. Han, Q.; Lin, Q.; Ni, Z.; You, L. Uncertainties about the transmission routes of 2019 novel coronavirus. Influenza Other Respir. Viruses 2020, 14, 470–471. [Google Scholar] [CrossRef]
  5. Leung, C.C.; Lam, T.H.; Cheng, K.K. Mass masking in the COVID-19 epidemic: People need guidance. Lancet 2020, 395, 945. [Google Scholar] [CrossRef]
  6. Li, R.; Pei, S.; Chen, B.; Song, Y.; Zhang, T.; Yang, W.; Shaman, J. Substantial undocumented infection facilitates the rapid dissemination of novel coronavirus (SARS-CoV2). Science 2020, 368, 489–493. [Google Scholar] [CrossRef]
  7. World Health Organization. Advice on the Use of Masks in the Community, during Home Care and in Health Care Settings in the Context of the Novel Coronavirus (2019-nCoV) Outbreak. 2020. Available online: https://www.who.int/docs/default-source/documents/advice-on-the-use-of-masks-2019-ncov.pdf (accessed on 10 December 2023).
  8. Roy, C.J.; Milton, D.K. Airborne Transmission of Communicable Infection—The Elusive Pathway. N. Engl. J. Med. 2004, 350, 1710–1712. [Google Scholar] [CrossRef] [PubMed]
  9. Xiao, W.J.; Wang, M.L.; Wei, W.; Wang, J.; Zhao, J.J.; Yi, B. Detection of SARS-CoV and RNA on aerosol samples from SARS-patients admitted to hospital. Zhonghua Liu Xing Bing Xue Za Zhi 2004, 25, 882–885. Available online: http://ovidsp.ovid.com/ovidweb.cgi?T=JS&PAGE=reference&D=emed8&NEWS=N&AN=41513790 (accessed on 10 December 2023). [PubMed]
  10. World Health Organization. Modes of Transmission of Virus Causing COVID-19: Implications for IPC Precaution Recommendations; World Health Organization: Geneva, Switzerland, 2020. [Google Scholar]
  11. Judson, S.D.; Munster, V.J. Nosocomial transmission of emerging viruses via aerosol-generating medical procedures. Viruses 2019, 11, 940. [Google Scholar] [CrossRef] [PubMed]
  12. Li, Y.; Huang, X.; Yu, I.T.S.; Wong, T.W.; Qian, H. Role of air distribution in SARS transmission during the largest nosocomial outbreak in Hong Kong. Indoor Air 2004, 15, 83–95. [Google Scholar] [CrossRef] [PubMed]
  13. Luongo, J.C.; Fennelly, K.P.; Keen, J.A.; Zhai, Z.J.; Jones, B.W.; Miller, S.L. Role of mechanical ventilation in the airborne transmission of infectious agents in buildings. Indoor Air 2016, 26, 666–678. [Google Scholar] [CrossRef] [PubMed]
  14. Yu, I.T.S.; Li, Y.; Wong, T.W.; Tam, W.; Chan, A.T.; Lee, J.H.; Leung, D.Y.; Ho, T. Evidence of Airborne Transmission of the Severe Acute Respiratory Syndrome Virus. N. Engl. J. Med. 2004, 350, 1731–1739. [Google Scholar] [CrossRef]
  15. Andersen, K.G.; Rambaut, A.; Lipkin, W.I.; Holmes, E.C.; Garry, R.F. The proximal origin of SARS-CoV-2. Nat. Med. 2020, 26, 450–452. [Google Scholar] [CrossRef]
  16. AICARR. Posizione Di AiCARR Sul Funzionamento Degli Impianti Di Climatizzazione Durante L’emergenza SARS-CoV-2-19; AICARR: Milano, Italy, 2020. (In Italian) [Google Scholar]
  17. Knibbs, L.D.; Morawska, L.; Bell, S.C.; Grzybowski, P. Room ventilation and the risk of airborne infection transmission in 3 health care settings within a large teaching hospital. Am. J. Infect. Control. 2011, 39, 866–872. [Google Scholar] [CrossRef]
  18. Correia, G.; Rodrigues, L.; Gameiro da Silva, M.; Gonçalves, T. Airborne route and bad use of ventilation systems as non-negligible factors in SARS-CoV-2 transmission. Med. Hypotheses 2020, 141, 109781. [Google Scholar] [CrossRef] [PubMed]
  19. Ascione, F.; De Masi, R.F.; Mastellone, M.; Vanoli, G.P. The design of safe classrooms of educational buildings for facing contagions and transmission of diseases: A novel approach combining audits, calibrated energy models, building performance (BPS) and computational fluid dynamic (CFD) simulations. Energy Build. 2021, 230, 110533. [Google Scholar] [CrossRef]
  20. UNI-10339; Impianti Aeraulici ai Fini di Benessere. Generalità, Classificazione e Requisiti. Regole per la Richiesta D’offerta, L’offerta, L’ordine e la Fornitura. Italian Unification Body: Milan, Italy, 1995. (In Italian)
  21. Vio, M. Gli impianti di climatizzazione e il rischio di contagio. AiCARR J. 2020, 61, 34–40. (In Italian) [Google Scholar]
  22. Faulkner, C.A.; Castellini, J.E.; Zuo, W.; Lorenzetti, D.M.; Sohn, M.D. Investigation of HVAC operation strategies for office buildings during COVID-19 pandemic. Build. Environ. 2022, 207, 108519. [Google Scholar] [CrossRef] [PubMed]
  23. AICARR. Ruolo Degli Impianti di Climatizzazione Invernale ed Estiva Nella Riduzione Della Diffusione del COVID-19; AICARR: Milano, Italy, 2020. (In Italian) [Google Scholar]
  24. Pan, Y.; Du, C.; Fu, Z.; Fu, M. Re-thinking of engineering operation solutions to HVAC systems under the emerging COVID-19 pandemic. J. Build. Eng. 2021, 43, 102889. [Google Scholar] [CrossRef]
  25. REHVA. COVID-19 Guidance Document. How to Operate and Use Building Services to Prevent the Spread of the Coronavirus Disease (COVID-19) Virus (SARS-CoV-2) in Workplaces. 2020. Available online: https://www.rehva.eu/activities/covid-19-guidance (accessed on 10 December 2023).
  26. Bonadonna, L.; La Rosa, G.; Settimo, G.; Sorrentino, E.; Veschetti, E.; Bertinato, L. Rapporto ISS COVID-19 n.33/2020: Indicazioni Sugli Impianti di Ventilazione/Climatizzazione in Strutture Comunitarie Non Sanitarie e in Ambienti Domestici in Relazione Alla Diffusione del Virus SARS-CoV-2. 2020. Available online: https://www.iss.it/ (accessed on 10 December 2023). (In Italian).
  27. Aviv, D.; Chen, K.W.; Teitelbaum, E.; Sheppard, D.; Pantelic, J.; Rysanek, A.; Meggers, F. A fresh (air) look at ventilation for COVID-19: Estimating the global energy savings potential of coupling natural ventilation with novel radiant cooling strategies. Appl. Energy 2021, 292, 116848. [Google Scholar] [CrossRef] [PubMed]
  28. Guo, Y.; Zhang, N.; Hu, T.; Wang, Z.; Zhang, Y. Optimization of energy efficiency and COVID-19 pandemic control in different indoor environments. Energy Build. 2022, 261, 111954. [Google Scholar] [CrossRef] [PubMed]
  29. Szczepanik-Ścisło, N.; Flaga-Maryańczyk, A. Indoor air quality modeling and measurements of a studio apartment with a mechanical exhaust system. E3S Web Conf. 2018, 44, 00171. [Google Scholar] [CrossRef]
  30. Szczepanik-Scislo, N. Improving Household Safety via a Dynamic Air Terminal Device to Decrease Carbon Monoxide Migration from a Gas Furnace. Int. J. Environ. Res. Public Health 2022, 19, 1676. [Google Scholar] [CrossRef]
  31. D’Alicandro, A.C.; Capozzoli, A.; Mauro, A. Thermofluid dynamics and droplets transport inside a large university classroom: Effects of occupancy rate and volumetric airflow. J. Aerosol Sci. 2024, 175, 106285. [Google Scholar] [CrossRef]
  32. D’Alicandro, A.C.; Mauro, A. Air change per hour and inlet area: Effects on ultrafine particle concentration and thermal comfort in an operating room. J. Aerosol Sci. 2023, 171, 106183. [Google Scholar] [CrossRef]
  33. Szczepanik, N.; Schnotale, J. CFD Simulations and Measurements of Carbon Dioxide Transport in a Passive House. In Proceedings of the 24 Congress of Refrigerations: Improving Quality of Life, Preserving the Hear, Yokohama, Japan, 16–22 August 2015. [Google Scholar]
  34. Riley, E.C.; Murphy, G.; Riley, R.L. Airborne spread of measles in a suburban elementary school. Am. J. Epidemiol. 1978, 107, 421–432. [Google Scholar] [CrossRef] [PubMed]
  35. Li, C.; Tang, H. Study on ventilation rates and assessment of infection risks of COVID-19 in an outpatient building. J. Build. Eng. 2021, 42, 103090. [Google Scholar] [CrossRef]
  36. Guo, Y.; Qian, H.; Sun, Z.; Cao, J.; Liu, F.; Luo, X.; Ling, R.; Weschler, L.B.; Mo, J.; Zhang, Y. Assessing and controlling infection risk with Wells-Riley model and spatial flow impact factor (SFIF). Sustain. Cities Soc. 2021, 67, 102719. [Google Scholar] [CrossRef] [PubMed]
  37. Yan, Y.; Li, X.; Fang, X.; Tao, Y.; Tu, J. A spatiotemporal assessment of occupants’ infection risks in a multi-occupants space using modified Wells–Riley model. Build. Environ. 2023, 230, 110007. [Google Scholar] [CrossRef] [PubMed]
  38. Zhang, S.; Lin, Z. Dilution-based evaluation of airborne infection risk—Thorough expansion of Wells-Riley model. Build. Environ. 2021, 194, 107674. [Google Scholar] [CrossRef]
  39. Barone, G.; Buonomano, A.; Forzano, C.; Giuzio, G.F.; Palombo, A. Energy, economic, and environmental impacts of enhanced ventilation strategies on railway coaches to reduce COVID-19 contagion risks. Energy 2022, 256, 124466. [Google Scholar] [CrossRef]
  40. Hu, T.; Ji, Y.; Fei, F.; Zhu, M.; Jin, T.; Xue, P.; Zhang, N. Optimization of COVID-19 prevention and control with low building energy consumption. Build. Environ. 2022, 219, 109233. [Google Scholar] [CrossRef]
  41. Centers for Disease Control and Prevention. Improving Ventilation in Buildings. Available online: https://www.cdc.gov/coronavirus/2019-ncov/prevent-getting-sick/improving-ventilation-in-buildings.html (accessed on 22 November 2023).
  42. Buonanno, G.; Ricolfi, L.; Morawska, L.; Stabile, L. Increasing ventilation reduces SARS-CoV-2 airborne transmission in schools: A retrospective cohort study in Italy’s Marche region. Front. Public Health 2022, 10, 1087087. [Google Scholar] [CrossRef]
  43. McNeill, V.F.; Corsi, R.; Huffman, J.A.; King, C.; Klein, R.; Lamore, M.; Maeng, D.Y.; Miller, S.L.; Ng, N.L.; Olsiewski, P.; et al. Room-level ventilation in schools and universities. Atmos. Environ. X 2022, 13, 100152. [Google Scholar] [CrossRef] [PubMed]
  44. Meglio, E.; Longobardi, G.; Formisano, A. Integrated seismic-energy retrofit systems for preventing failure of a historical RC school building: Comparison among metal lightweight exoskeleton solutions. Eng. Fail. Anal. 2023, 154, 107663. [Google Scholar] [CrossRef]
  45. D’Agostino, D.; Minelli, F.; Minichiello, F. New genetic algorithm-based workflow for multi-objective optimization of Net Zero Energy Buildings integrating robustness assessment. Energy Build. 2023, 284, 112841. [Google Scholar] [CrossRef]
  46. President of the Italian Republic, D.P.R. 26 agosto 1993 n.412. Regolamento Recante Norme per la Progettazione, L’installazione, L’esercizio e la Manutenzione Degli Impianti Termici Degli Edifici ai fini del Contenimento dei Consumi di Energia. Gazzetta Ufficiale della Repubblica Italiana, 1993. Available online: https://www.gazzettaufficiale.it/eli/id/1993/10/14/093G0451/sg (accessed on 10 December 2023). (In Italian).
  47. President of the Italian Republic, D.P.R 28 giugno 1977, n. 1052. Regolamento di Esecuzione alla Legge 30 Aprile 1976, n. 373, Relativa al Consumo Energetico per usi Termici Negli Edifici. Gazzetta Ufficiale della Repubblica Italiana, 1977. Available online: https://www.gazzettaufficiale.it/eli/id/1978/02/06/077U1052/sg (accessed on 10 December 2023). (In Italian).
  48. ISO 6946:2017; Building Components and Building Elements—Thermal Resistance and Thermal Transmittance—Calculation Methods. International Organization for Standardization: Geneva, Switzerland, 2017; p. 40.
  49. President of the Italian Republic, D.P.R. 16 aprile 2013, n. 74. Regolamento Recante Definizione dei Criteri Generali in Materia di Esercizio, Conduzione, Controllo, Manutenzione e Ispezione Degli Impianti Termici per la Climatizzazione Invernale ed estiva. Gazzetta Ufficiale della Repubblica Italiana, 2013. Available online: https://www.gazzettaufficiale.it/eli/id/2013/06/27/13G00114/sg (accessed on 10 December 2023). (In Italian).
  50. ASHRAE. ASHRAE Handbook—Fundamentals; ASHRAE: New York, NY, USA, 2021. [Google Scholar]
  51. DesignBuilder. DesignBuilder Software. Limited Clarendon Court 1st Floor 54/56 London Rd Stroud, Gloucestershire GL5 2AD (UK). 2019. Available online: http://www.designbuilder.co.uk/i (accessed on 10 December 2023).
  52. UNI EN 12464-1:2021; Luce e Illuminazione—Illuminazione dei Posti di Lavoro—Parte 1: Posti di Lavoro in Interni. Italian Unification Body: Milan, Italy, 2021. (In Italian)
  53. ANSI/ASHRAE. ASHRAE Guideline 14-2002 Measurement of Energy and Demand Savings. ASHRAE 2002, 8400, 170. [Google Scholar]
  54. Gammaitoni, L.; Nucci, M.C. Using a Mathematical Model to Evaluate the Efficacy of TB Control Measures. Emerg. Infect. Dis. 1997, 3, 335–342. [Google Scholar] [CrossRef] [PubMed]
  55. To, G.N.S.; Chao, C.Y.H. Review and comparison between the Wells-Riley and dose-response approaches to risk assessment of infectious respiratory diseases. Indoor Air 2010, 20, 2–16. [Google Scholar] [CrossRef]
  56. Buonanno, G.; Stabile, L.; Morawska, L. Estimation of airborne viral emission: Quanta emission rate of SARS-CoV-2 for infection risk assessment. Environ. Int. 2020, 141, 105794. [Google Scholar] [CrossRef] [PubMed]
  57. Buonanno, G.; Morawska, L.; Stabile, L. Quantitative assessment of the risk of airborne transmission of SARS-CoV-2 infection: Prospective and retrospective applications. Environ. Int. 2020, 145, 106112. [Google Scholar] [CrossRef]
  58. Cavallini, A.; Busato, F.; Pregliasco, F. Remarks on the air recirculation in HVAC systems during the SARS-CoV-2 outbreak: The case of all-air ducted plants. AiCARR J. 2020, 63, 50–55. [Google Scholar]
Figure 1. Workflow of the research methodology.
Energies 17 00855 g001
Figure 2. First-floor plan of the case-study building.
Energies 17 00855 g002
Figure 3. Outdoor air changes per hour (ACH) as a function of the probability of infection for the first floor (a), second floor (b), and third floor (c).
Energies 17 00855 g003aEnergies 17 00855 g003bEnergies 17 00855 g003c
Figure 4. Outdoor air changes per hour (ACH) as a function of the risk of contagion for the first floor (a), second floor (b), and third floor (c).
Energies 17 00855 g004aEnergies 17 00855 g004bEnergies 17 00855 g004c
Figure 5. Comparisons in terms of energy consumption (a) and energy cost (b) between the pre-COVID system and the intervention systems analysed.
Energies 17 00855 g005
Figure 6. Simple payback period and discounted paymack period for the thermal insulation of the building envelope with HP-1.
Energies 17 00855 g006
Figure 7. Simple payback period and discounted payback period for the thermal insulation of the building envelope with HP-1.1.
Energies 17 00855 g007
Table 1. Climate data for Formia.
DataValue
CityFormia
ProvinceLatina
Climatic zone (DPR 412/93 [46])C
Heating degree days (DPR 412/93 [46])976
Winter design external temperature (DPR 1052/77 [47])2 °C
Monthly average winter temperature7.2 °C
Summer design external temperature33 °C
Average wind speed3.2 m/s
Yearly average solar irradiation1645 kWh/m2
Table 2. Thermal characteristics of the building envelope components.
Stationary Thermal Transmittance U-Value [W/(m2K)]Dynamic Thermal Transmittance YIE [W/(m2K)]
Walls (thermal mass = 634 kg/m2)1.800.20
Roof1.690.17
Windows (solar factor ggl value for glass = 0.4)2.50-
Table 4. Natural gas consumption.
Simulated Energy ConsumptionMeasured Energy Consumption
[kWh][kWh]
January17,27518,125.8
February15,16913,911.9
March13,12511,602.8
April15611183.2
May430709.9
June169322.7
July194243.8
August182215.1
September187251.0
October9112438.2
November87158605.7
December15,81514,700.8
Table 5. Electrical energy consumption.
Simulated Energy ConsumptionMeasured Energy Consumption
[kWh][kWh]
January29903312.0
February27392814.0
March29222556.0
April27392241.0
May29752478.0
June37534355.0
July67207211.0
August81757546.0
September46944854.0
October31162925.0
November29222544.0
December27392896.0
Table 6. Section of air ducts for the different system configurations.
CaseOutdoor ACH
(h−1)
Cross-Section
(m2)
Dimensions of the Main Air Duct
(mm)
Cross-Section Increment
(%)
Pre-COVID-190.80.0913400 × 250
COVID-1950.570850 × 700+525%
Table 7. Electrical energy consumption for different proposed systems and their differences in value compared to the standard pre-COVID-19 conditions.
Energy Consumption
HypothesisElectricity
kWh
Electricity kWh/m2Variation
%
Pre-COVID-19 conditions fan coils plus primary air78,13092.2-
Pre-COVID-19 conditions radiant panels plus primary air76,78990.6-
Hp-1 with 5 ACH138,920163.8+78%
Hp-1.1 with 5 ACH136,020160.4+77%
Hp-2 with 5 ACH176,990208.7+126%
Hp-2.1 with 5 ACH169,040199.3+116%
Hp-3 with 5 ACH209,410247+168%
Table 8. Energy costs for different proposed systems and their differences in value compared to standard pre-COVID-19 conditions.
Energy Costs
Proposed SystemYearly Energy Costs
€/Year
Increase Compared to
Pre-COVID-19 Conditions
€/Year
Increase
Compared to
Pre-COVID-19 Conditions
%
Pre-COVID-19, fan coils and primary air16,095--
Pre-COVID-19, radiant panels and primary air15,819--
Hp-1 with 5 ACH28,618+12,523+78%
Hp-1.1 with 5 ACH28,020+12,201+77%
Table 9. Improved thermal transmittance of the roof and walls of the building.
Thermal Transmittance [W/(m2K)]
Walls0.304
Roof0.31
Table 10. Comparisons of energy consumption after thermal insulation of the building envelope.
Energy Consumption
HypothesisElectrical Energy
kWh
Electrical Energy
kWh/m2
Change in Required Electrical Energy
%
Hp-1138,920163.8-
Hp-1.1136,020160.4-
Hp-1 After intervention on the envelope101,732118.6−27%
Hp-1.1 After intervention on the envelope95,808115.6−29%
Table 11. Comparisons of energy costs after thermal insulation of the building envelope.
Energy Costs
HypothesisTotal Yearly Cost
€/Year
Change in Energy Cost
€/Year
Change in Energy Cost
%
Hp-128,618--
Hp-1.128,020--
Hp-1 After intervention on the envelope20,956−7662−27%
Hp-1.1 After intervention on the envelope19,736−8284−29%
Disclaimer/Publisher’s Note: The statements, opinions and data contained in all publications are solely those of the individual author(s) and contributor(s) and not of MDPI and/or the editor(s). MDPI and/or the editor(s) disclaim responsibility for any injury to people or property resulting from any ideas, methods, instructions or products referred to in the content.

