Article

A Dual-Layer MPC of Coordinated Control of Battery Load Demand and Grid-Side Supply Matching at Electric Vehicle Swapping Stations

1
College of New Energy and Power Engineering, Lanzhou Jiaotong University, Lanzhou 730070, China
2
College of Electrical and Mechanical Engineering, Lanzhou Jiaotong University, Lanzhou 730070, China
*
Author to whom correspondence should be addressed.
Energies 2024, 17(4), 879; https://doi.org/10.3390/en17040879
Submission received: 12 January 2024 / Revised: 2 February 2024 / Accepted: 7 February 2024 / Published: 14 February 2024
(This article belongs to the Section E: Electric Vehicles)

Abstract

:
The uncontrolled charging of electric vehicles may cause damage to the electrical system as the number of electric vehicles continues to rise. This paper aims to construct a new model of the power system and investigates the rational regulation and efficient control of electric vehicle battery charging at electric vehicle exchange battery stations in response to the real-time grid-side supply situation. Firstly, a multi-objective optimization strategy is established to meet the day-ahead forecasted swap demand and grid-side supply with the maximization of day-ahead electric vehicle battery swapping station (BSS) revenue in the core. Secondly, considering the variable tariff strategy, a two-layer Model Predictive Control (MPC) coordinated control system under real-time conditions is constructed with the objective function of maximizing the revenue of BSS and smoothing the load fluctuation of the power system. Then, the day-ahead optimization results are adopted as the reference value for in-day rolling optimization, and the reference value for in-day optimization is dynamically adjusted according to the real-time number of electric car changes and power system demand. Finally, verified by experimental simulation, the results show that the day-ahead-intraday optimization model can increase the economic benefits of BSS and reduce the pressure on the grid to a certain extent, and it can ensure the fast, accurate, and reasonable allocation of batteries in BSS, and realize the flexible, efficient, and reasonable distribution of batteries in BSS.

Graphical Abstract

1. Introduction

With the gradual shortage of fossil energy sources such as oil, natural gas, and coal, as well as the impact of carbon dioxide emissions from automobiles on global climate change, many countries are looking for new energy sources to replace fossil fuels in order to cope with the new energy crisis, and many countries have formulated policies to promote the development of the new energy industry, of which the new energy vehicle is an important part.
Currently, the mainstream types of electric vehicle batteries are categorized into lithium iron phosphate (LFP) and ternary lithium-ion batteries. This can be attributed to the superior performance of lithium batteries, including high energy density, high voltage operation, wide temperature adaptability, and no memory effect [1]. The development of electric vehicle batteries still faces huge challenges in terms of environmental pollution, energy efficiency, and safety [2,3]. Lithium iron phosphate batteries traditionally have a low energy density, up to 200 Wh/kg. In contrast, ternary lithium batteries have a higher energy density, with energy densities ranging from 200 to 300 Wh/kg [4]. However, ternary lithium-ion batteries have a lower cycle life and inferior safety compared to lithium iron phosphate (LFP) batteries. LFP batteries, on the other hand, utilize a larger amount of iron (Fe) from the Earth’s crust, making them more cost-effective. As a result, LFP batteries find widespread use in China’s new energy public transportation, buses, taxis, and electric vehicles produced by companies such as BYD [5]. Ternary lithium-ion batteries dominate the new energy vehicle market in the United States, the European Union, and Japan [6]. Currently, the majority of electric vehicle charging in the United States occurs at home [7]. Real-world data from Ireland and Germany indicate that home charging is the preferred choice for electric vehicle users [8,9]. As the number of electric vehicles continues to rise globally, the unregulated charging of electric vehicles poses higher demands on the grid capacity. Shepero and Munkhamma, in their proposed model, take into account public charging facilities and estimate that the addition of each electric vehicle to the urban peak load is approximately 1.47 kW [10]. To address the research gap concerning the role of Battery Electric Vehicle (BEV) charging systems in the pathway of urban decarbonization, this study introduces an innovative modeling approach. The methodology employed in this research reflects the impact of home charging and battery swapping stations in urban environments, considering the stochastic nature of vehicle usage. The findings indicate that battery swapping stations have a lesser impact on the electrical grid compared to the charging of electric vehicles [11]. However, in major cities within China, there is a shortage of personal charging stations, leading to frequent queues for charging. Therefore, the importance of battery swapping stations becomes increasingly prominent in addressing this issue.
This study investigates the planning of battery swapping stations (BSS) for electric vehicles with a focus on centralized charging. Based on the road topology of the planning area, a road topology model, as well as models for electric vehicle travel energy consumption and range, are constructed. Taking into consideration the photovoltaic (PV) distribution system, a BSS planning model is developed with the objective of minimizing the annual comprehensive cost [12]. This study proposes a two-stage optimization framework for the charging infrastructure planning and charging scheduling of battery electric bus systems. Firstly, a comprehensive optimization model is developed to simultaneously optimize charger deployment, on-board battery capacity, and charging scheduling. Secondly, a charging scheduling model is introduced, and in the second stage, a rolling horizon approach is employed to optimize the real-time charging scheduling of electric buses. In comparison to existing electric bus system planning methods, the proposed integrated model can reduce the total system cost by approximately 19.5% [13]. This paper analyzes the robust strategic planning of Distributed Wireless Charging (DWC) and Battery Electric Bus (BEB) fleet scheduling based on a real bus network at Binghamton University. A deterministic mixed-integer linear programming model is established, integrating the optimization of both charging planning and fleet scheduling. To address the uncertainty in power demand and charging times, a robust counterpart model (RCM) is derived. Sensitivity analysis indicates that the joint planning of charging infrastructure and fleet scheduling can save a total cost of 19.2% compared to separate planning [14].
As shown in Figure 1, when an electric vehicle arrives at a battery swapping station, the BSS (battery swap station) staff first take over the vehicle from the owner and guide it into the swapping station. The vehicle then enters the swapping mode, and a robotic system inside the BSS retrieves the battery from the bottom of the electric car and replaces it with a fully charged one. The entire process takes approximately 5 min. As of 2023, NIO has successfully established its 2000th battery swapping station at the Baotji West Service Area on the G30 Lianhuo Expressway. This achievement extends coverage to 240 prefecture-level cities across China.The online service platform for NIO’s battery swapping stations is known as NIO Power [15].
However, there are some problems in the development of electric vehicles, and to cope with the serious shortage of charging piles for the surge in the number of electric vehicles, more battery charging stations (BCS) and battery swapping stations will be established in China [16]. Compared with BCS, the power swapping mode has been widely adopted due to its short recharging time and flexible scheduling [17,18]. Electric vehicle swapping technology is an effective electric energy recharge solution; however, the management strategy of BSS becomes more complex due to the large number of external factors to be considered [19,20]. Unscheduled charging of batteries within the BSS increases the peak load of the system, increasing the burden on the power system and affecting the safe operation of the power system [21]. Researchers can address these issues from both scheduling and charging aspects to charging strategies. Wang et al. designed a new two-stage charging mechanism and charging compressing algorithm to reduce the energy cost and peak-valley difference of the system [22]. Rao et al. showed that an optimized charging strategy at BSS can suppress power system fluctuations [23]; Analyzing the scheduling strategies, Ye et al. proposed a load-scheduling scheme for vehicle battery charging and discharging under a smart grid and demonstrated that the optimal scheduling strategies can also smooth the loads on the grid [24]. Ding et al. set up a mathematical model for multi-objective joint optimization of BSS based on using battery to grid (B2G) technology using BSS as an energy storage device for the grid. They compared the results of ordered optimization with B2G and disordered optimization without B2G, and verified that the model can reduce the peak-valley difference [25]. The aforementioned work indicates that optimized scheduling strategies at BSS can alleviate the burden on the power system, suggesting the potential for BSS to participate in the regulation of the power system. However, this approach oversimplifies the internal charging process at BSS, disregards battery aging, overlooks new requirements from emerging electricity markets for BSS services, and underestimates the challenges BSS face due to uncertainties in the external environment. The authors of [26] analyze the fact that the battery degradation cost has a certain impact on battery charging. The authors of [27] research the prediction of the disposable capacity of EV participation in frequency regulation auxiliary services, which effectively solves the problem of vehicle-to-grid aggregation and regulation, and this implies that BSS can participate in frequency regulation assistance tasks. The authors of [28] conduct a study on EV participation in frequency regulation auxiliary services, power allocation for links, and propose the corresponding model and control strategy to improve the economic returns. As BSS are designed to serve swapping customers, considering the satisfaction of these customers becomes a crucial factor. This consideration can significantly enhance the profitability of the BSS. Hence, it is a key factor that must be taken into account. Miao et al. constructed a model in which customer satisfaction and total service costs are optimized as objective functions and subsequently proposed an improved non-dominated nearest neighbor immune model algorithm to solve the problem [29]. The authors of [30] consider the uncertainty of tariffs and frequency regulation commands, and propose a model to evaluate EV robustness based on frequency regulation performance, which enhances the reliability of EVs as a demand-side resource. The internal battery charging and discharging management within BSS have a substantial impact on battery lifespan, their participation in power system regulation, and meeting the actual demands of swapping needs. In [31], the problem of prioritizing battery charging is investigated to not only optimize the charging of depleted batteries within a base station, but also to determine the best location for charging and discharging batteries between base stations on the grid. In [32], a new shared battery station business service model is proposed to solve the problem of rational distribution of large-scale batteries by performing divisional battery control and optimizing the process of battery charging, discharging, and battery exchange. In [33] Li et al. proposed a cloud-assisted online battery management method based on artificial intelligence and edge computing technology by building a new cloud-edge battery management system, combining cloud computing and big data into electric vehicle battery management, and proposing a deep learning algorithm-based cloud data mining and battery modeling method for estimating the voltage and energy state of batteries. In [34], an efficient algorithm is developed for the problem of optimizing the window fill rate in a multi-location, exchangeable item, maintenance system with a centralized warehouse that leads to a near-optimal solution, and finally an optimized battery allocation strategy is established. In [35,36], the BSS is considered as an energy storage station. However, to simultaneously maximize the profitability of the BSS, it is essential to consider local electric vehicle user numbers, commuting habits, the needs of the local power system, and the configuration of the BSS itself, including factors like batteries, chargers, and staff. So, the optimization of BSS constitutes a multi-objective optimization problem, and in [37,38], the future opportunities and challenges for battery swapping system (BSS) operations are summarized, encompassing dynamic service pricing, V2G processes, and the scheduling of battery exchange behaviors. These opportunities might impact the future coordinated development of vehicle–station–grid interactions. The impact of BSS location selection on the revenue of swapping is investigated in [39,40,41], and it is experimentally verified that the location selection of the BSS has a great impact on the revenue of the BSS. The cautions for BSS are described in [39,42]. A consolidated management strategy for ordered scheduling of EVs on BSS, which simultaneously considers wind power generation, has been proposed to accommodate wind energy in [40]. An aggregation management strategy for the orderly dispatch of EVs on BSS is proposed, which takes into account both the promotion of the peak shaving of the grid, releasing the peak shaving capacity, consuming the PV power generation, and lowering the cost to the users in [41].
The above studies analyze the impact of BSS participation in power system adjustment, battery management strategy, and battery degradation cost on the revenue of the swapping station from different dimensions. With the gradual construction of new power systems, which put forward new requirements on the ability of BSS to support the real-time balance of the power grid, BSS will be deeply involved in maintaining the balance of the power system. Since all the above studies are based on historical data for day-ahead battery swapping optimization and control, they cannot react quickly based on the actual situation during the actual day, i.e., the day-ahead optimization does not take into account the real-time vehicle queuing for battery swapping demand and power system demand response. With the gradual construction of the new power system, through active participation in power system stability adjustment, BBS can effectively reduce the grid load pressure. To this end, this paper proposes a BSS optimization and control strategy for collaborative participation in power trading, frequency regulation assistance, and multi-stage demand response. In order to comprehensively reflect the BSS participation in power system regulation, this paper proposes the swapping constraints that can accurately describe the battery switching between swapping the battery, discharging, and full power, establishing the day-ahead BSS optimal scheduling model based on multi-objective optimization, and the Intraday control model based on the model predictive control rolling optimization. The Intraday optimization is carried out on the basis of day-ahead optimization results. Under the consideration of the uncertainty of the power system demand, this paper establishes a two-stage optimal scheduling strategy, which gives full play to the profitability of the BSS and provides a more cost-effective and efficient model for the operation of the BSS under the power market. The rest of this paper is organized as follows: Section 2 describes the system model and configuration strategy, Section 3 gives the algorithms used in this paper, and Section 4 gives simulation results to validate the proposed model and strategy. The conclusions are summarized in Section 5.

2. System Model and Allocation Strategy

2.1. System Model

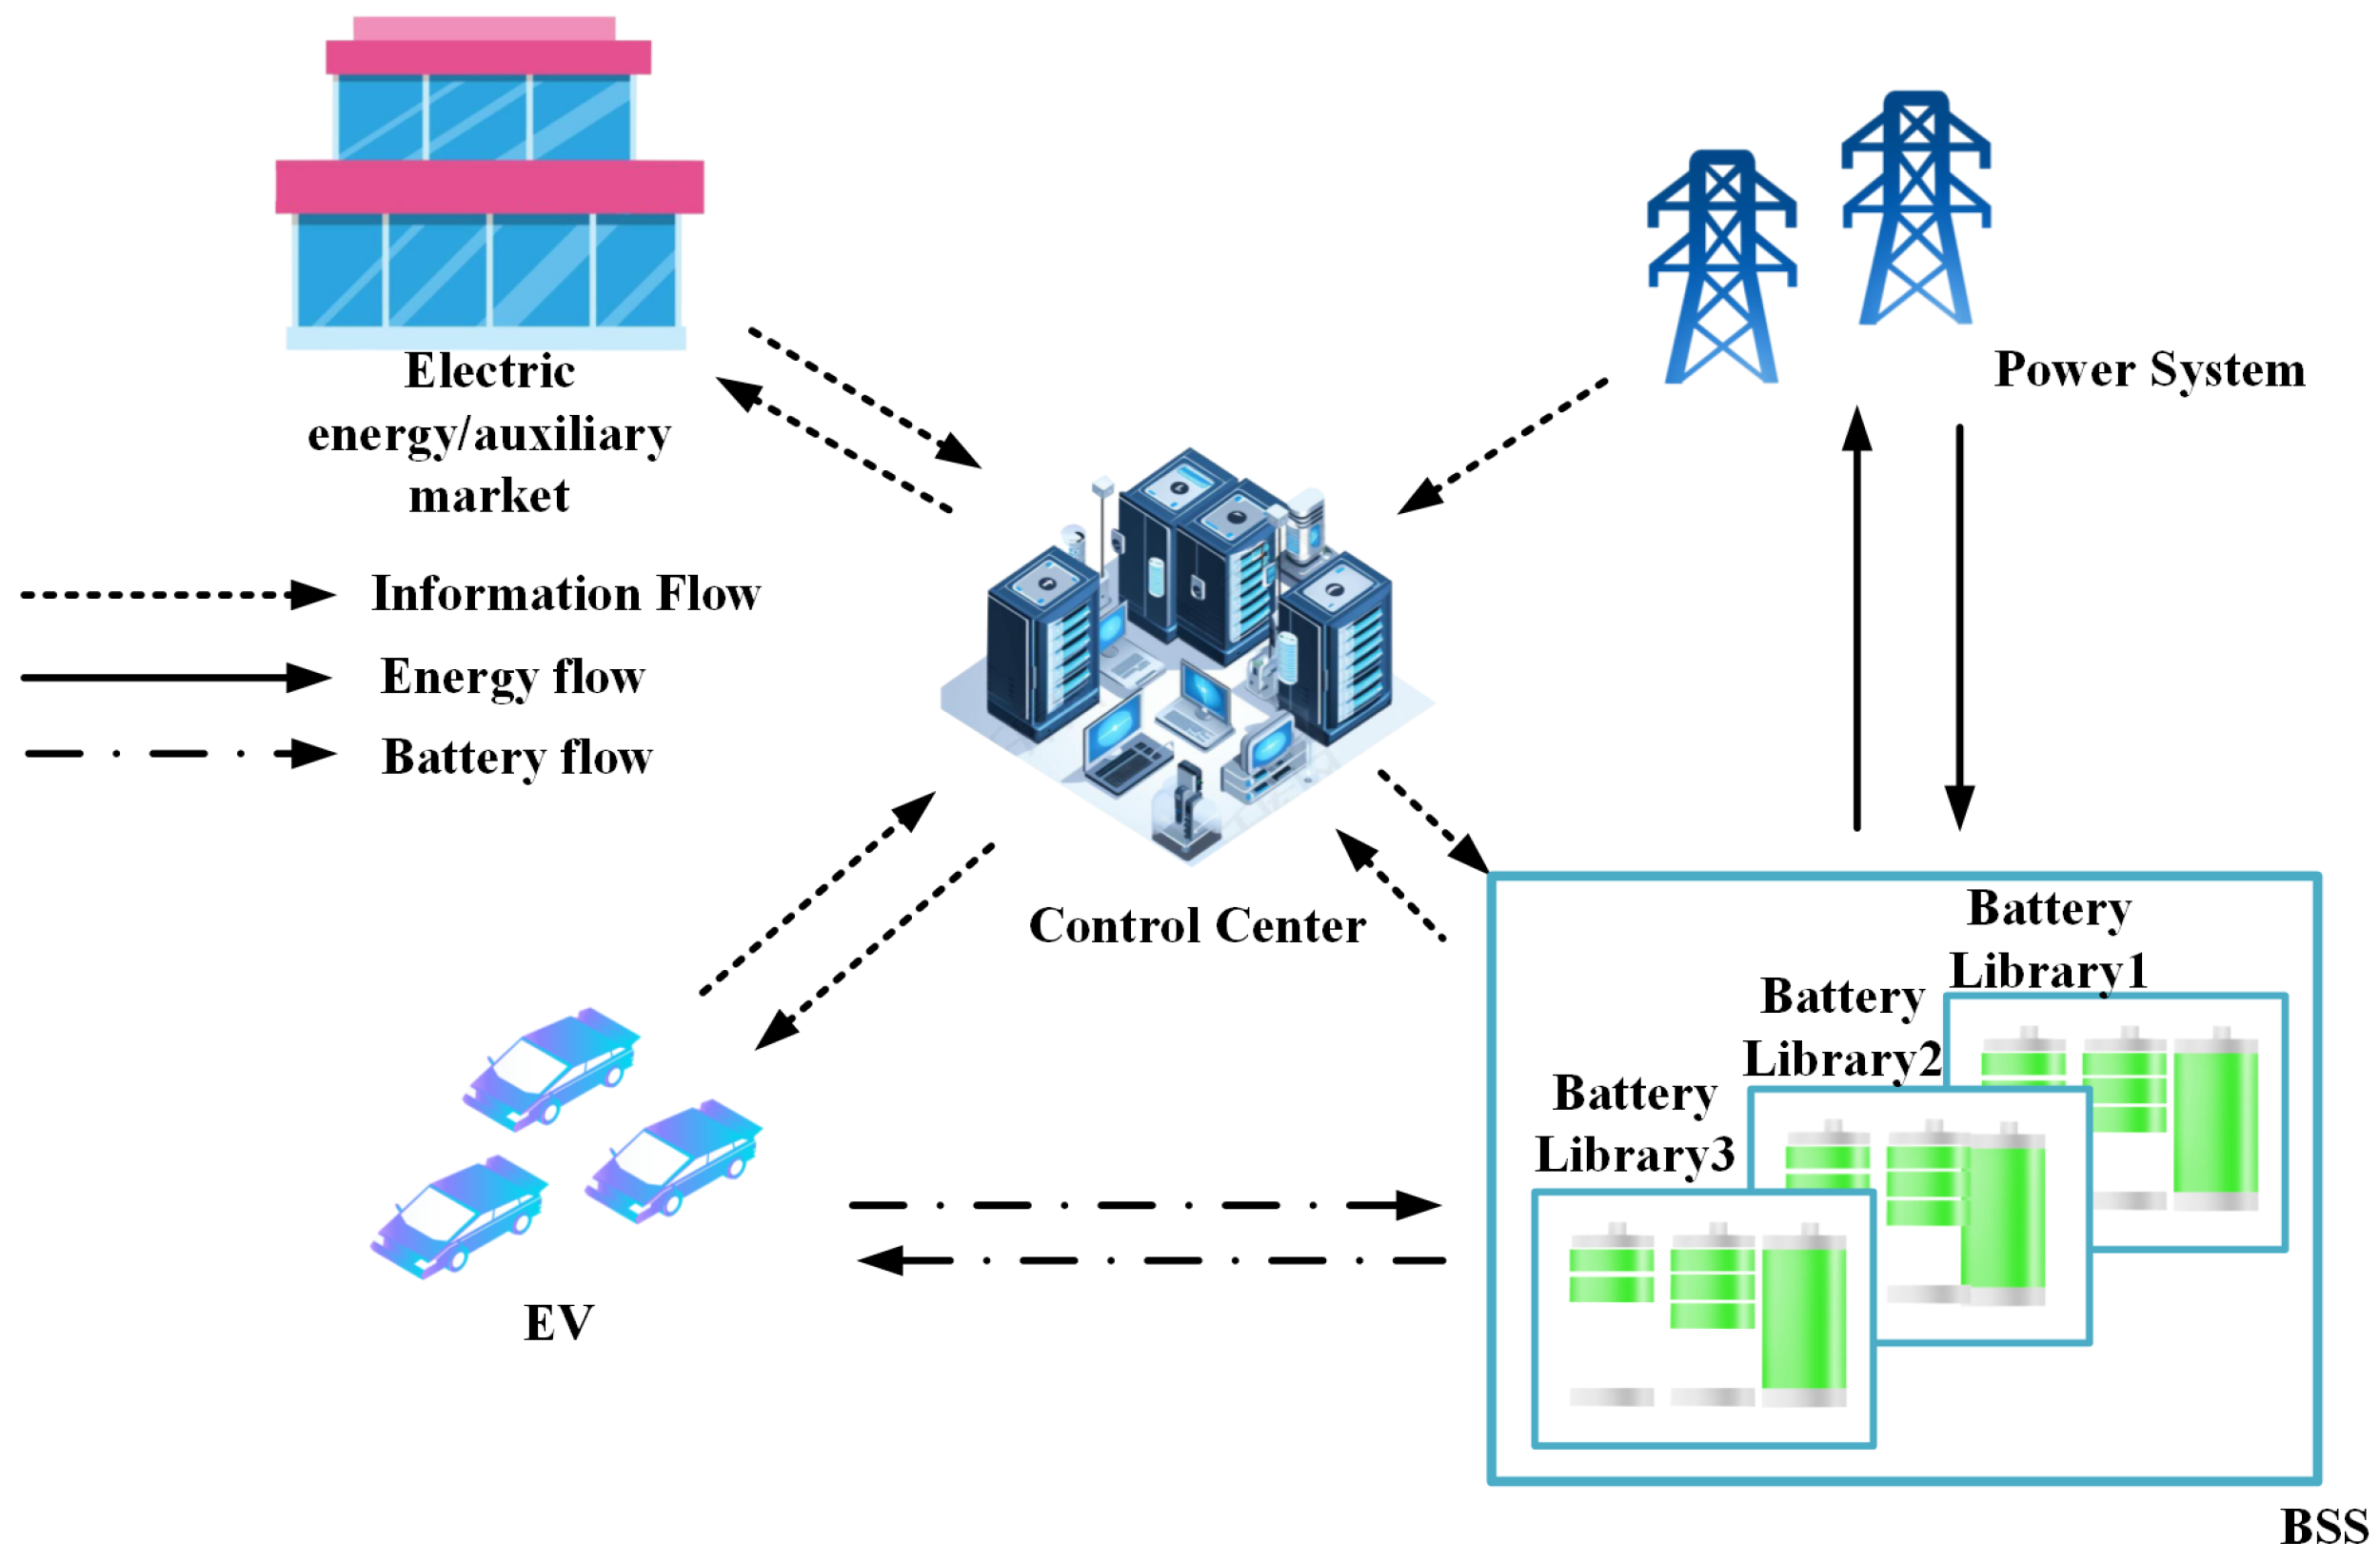
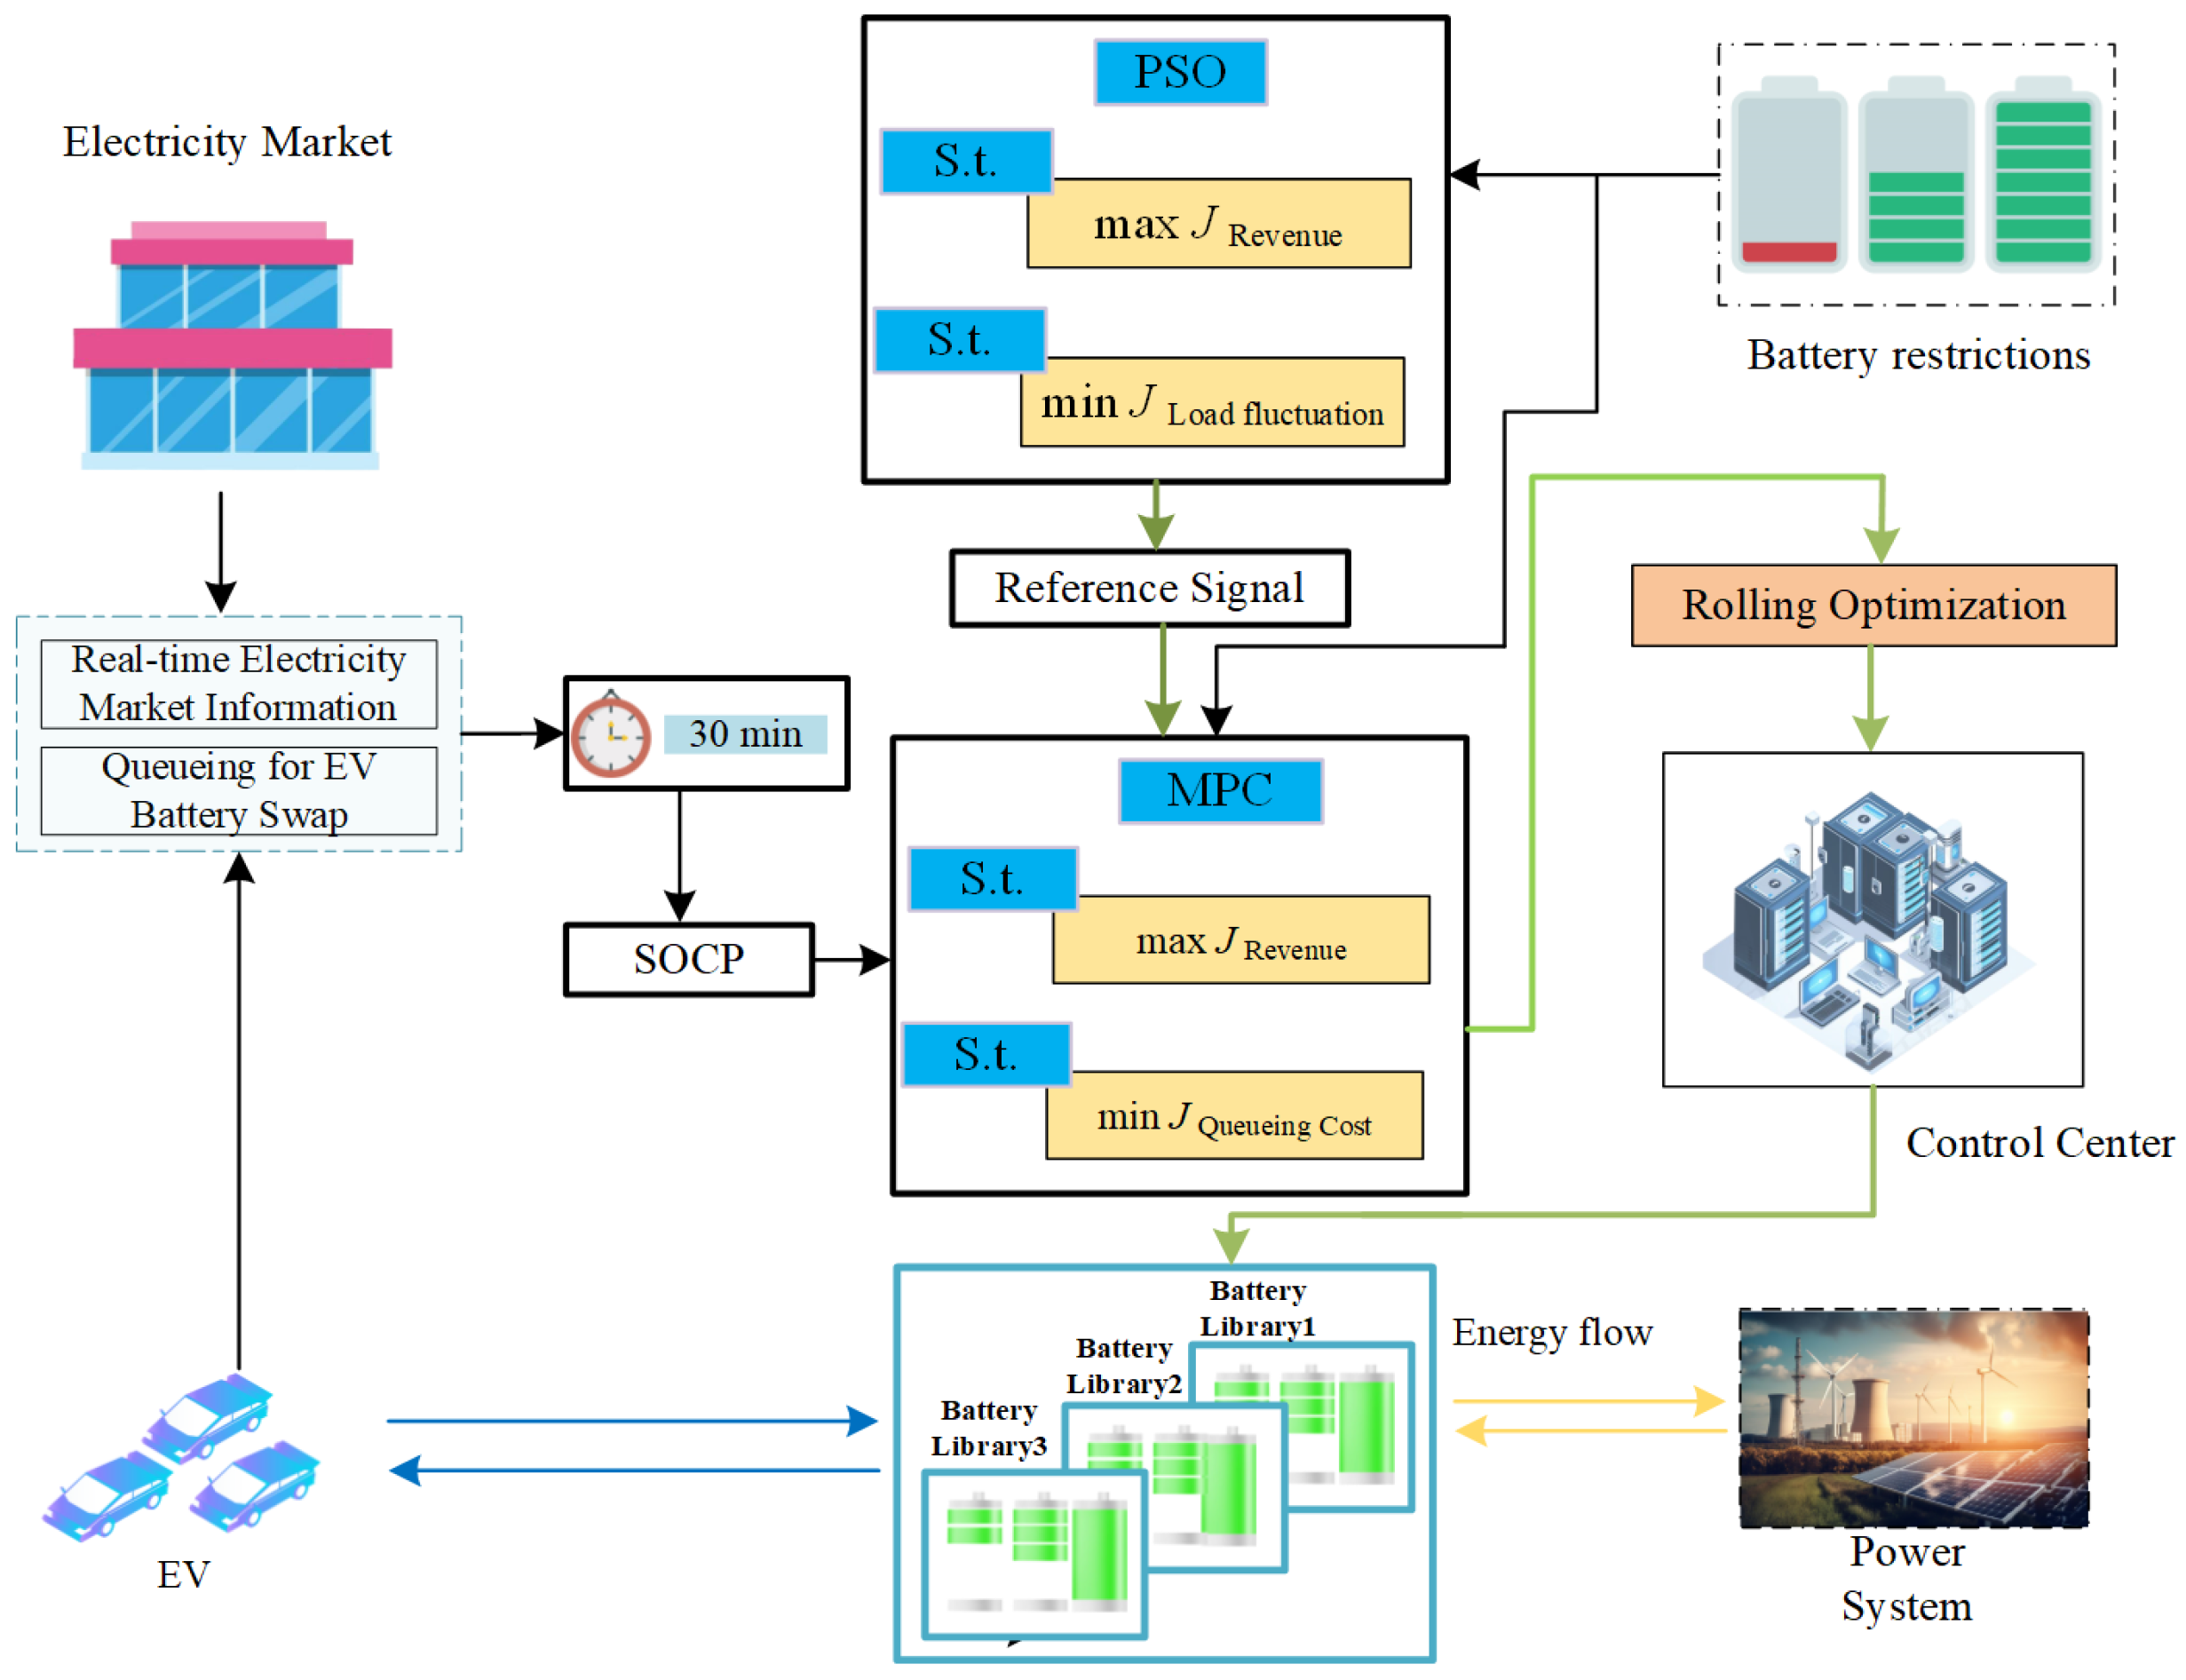
The system model of the BSS is shown in Figure 2, which mainly includes the Control Center (CC), BSS, EV, power system, and electric energy/auxiliary services market in five parts. The electric energy/auxiliary services market provides the charging and discharging price, the frequency regulation assistance capacity and its price, and the peak-shaving capacity and its price in each time period, and the Control Center is responsible for the control center is responsible for collecting relevant data and information and optimizing the scheduling of the BSS. A BSS’s main revenue comes from the electric vehicle swapping business. The BSS can meet the demand for swapping batteries and utilize the stored battery energy for power system regulation through B2G technology. When the electric vehicle arrives at the battery swapping station, the Control Center (CC) collects the State of Charge (SOC) information of the battery of the user’s vehicle and the time of its arrival, which is used to calculate the battery swapping cost, and analyzes the collected information to optimize the charging and discharging control of the battery power in the BSS station, so as to realize the accurate, economic, and rapid control of the BSS system, which is conducive to achieving the goal of stabilizing the electricity grid and increasing the revenue of the BSS.
S O C = Q r e m a i n Q r a t e d × 100 %
where Q r e m a i n represents the remaining charge of the battery, and Q r a t e d represents the rated charge capacity of the battery.
This article utilizes the Real-Time Digital Simulator (FX 2.0) real-time simulation software platform to monitor electric vehicle charging and peak power. It is specifically designed for interfacing with the hardware of the RTDS simulator. RSCAD (FX 2.0) is a comprehensive software package that provides users with all the functionalities needed for the entire simulation process, from preparation and execution to observation and analysis of simulation results. Simulation on RTDS is in real time and is continuous, allowing for the control of the simulated power system to closely mimic the control of a real power system.

2.2. Methods

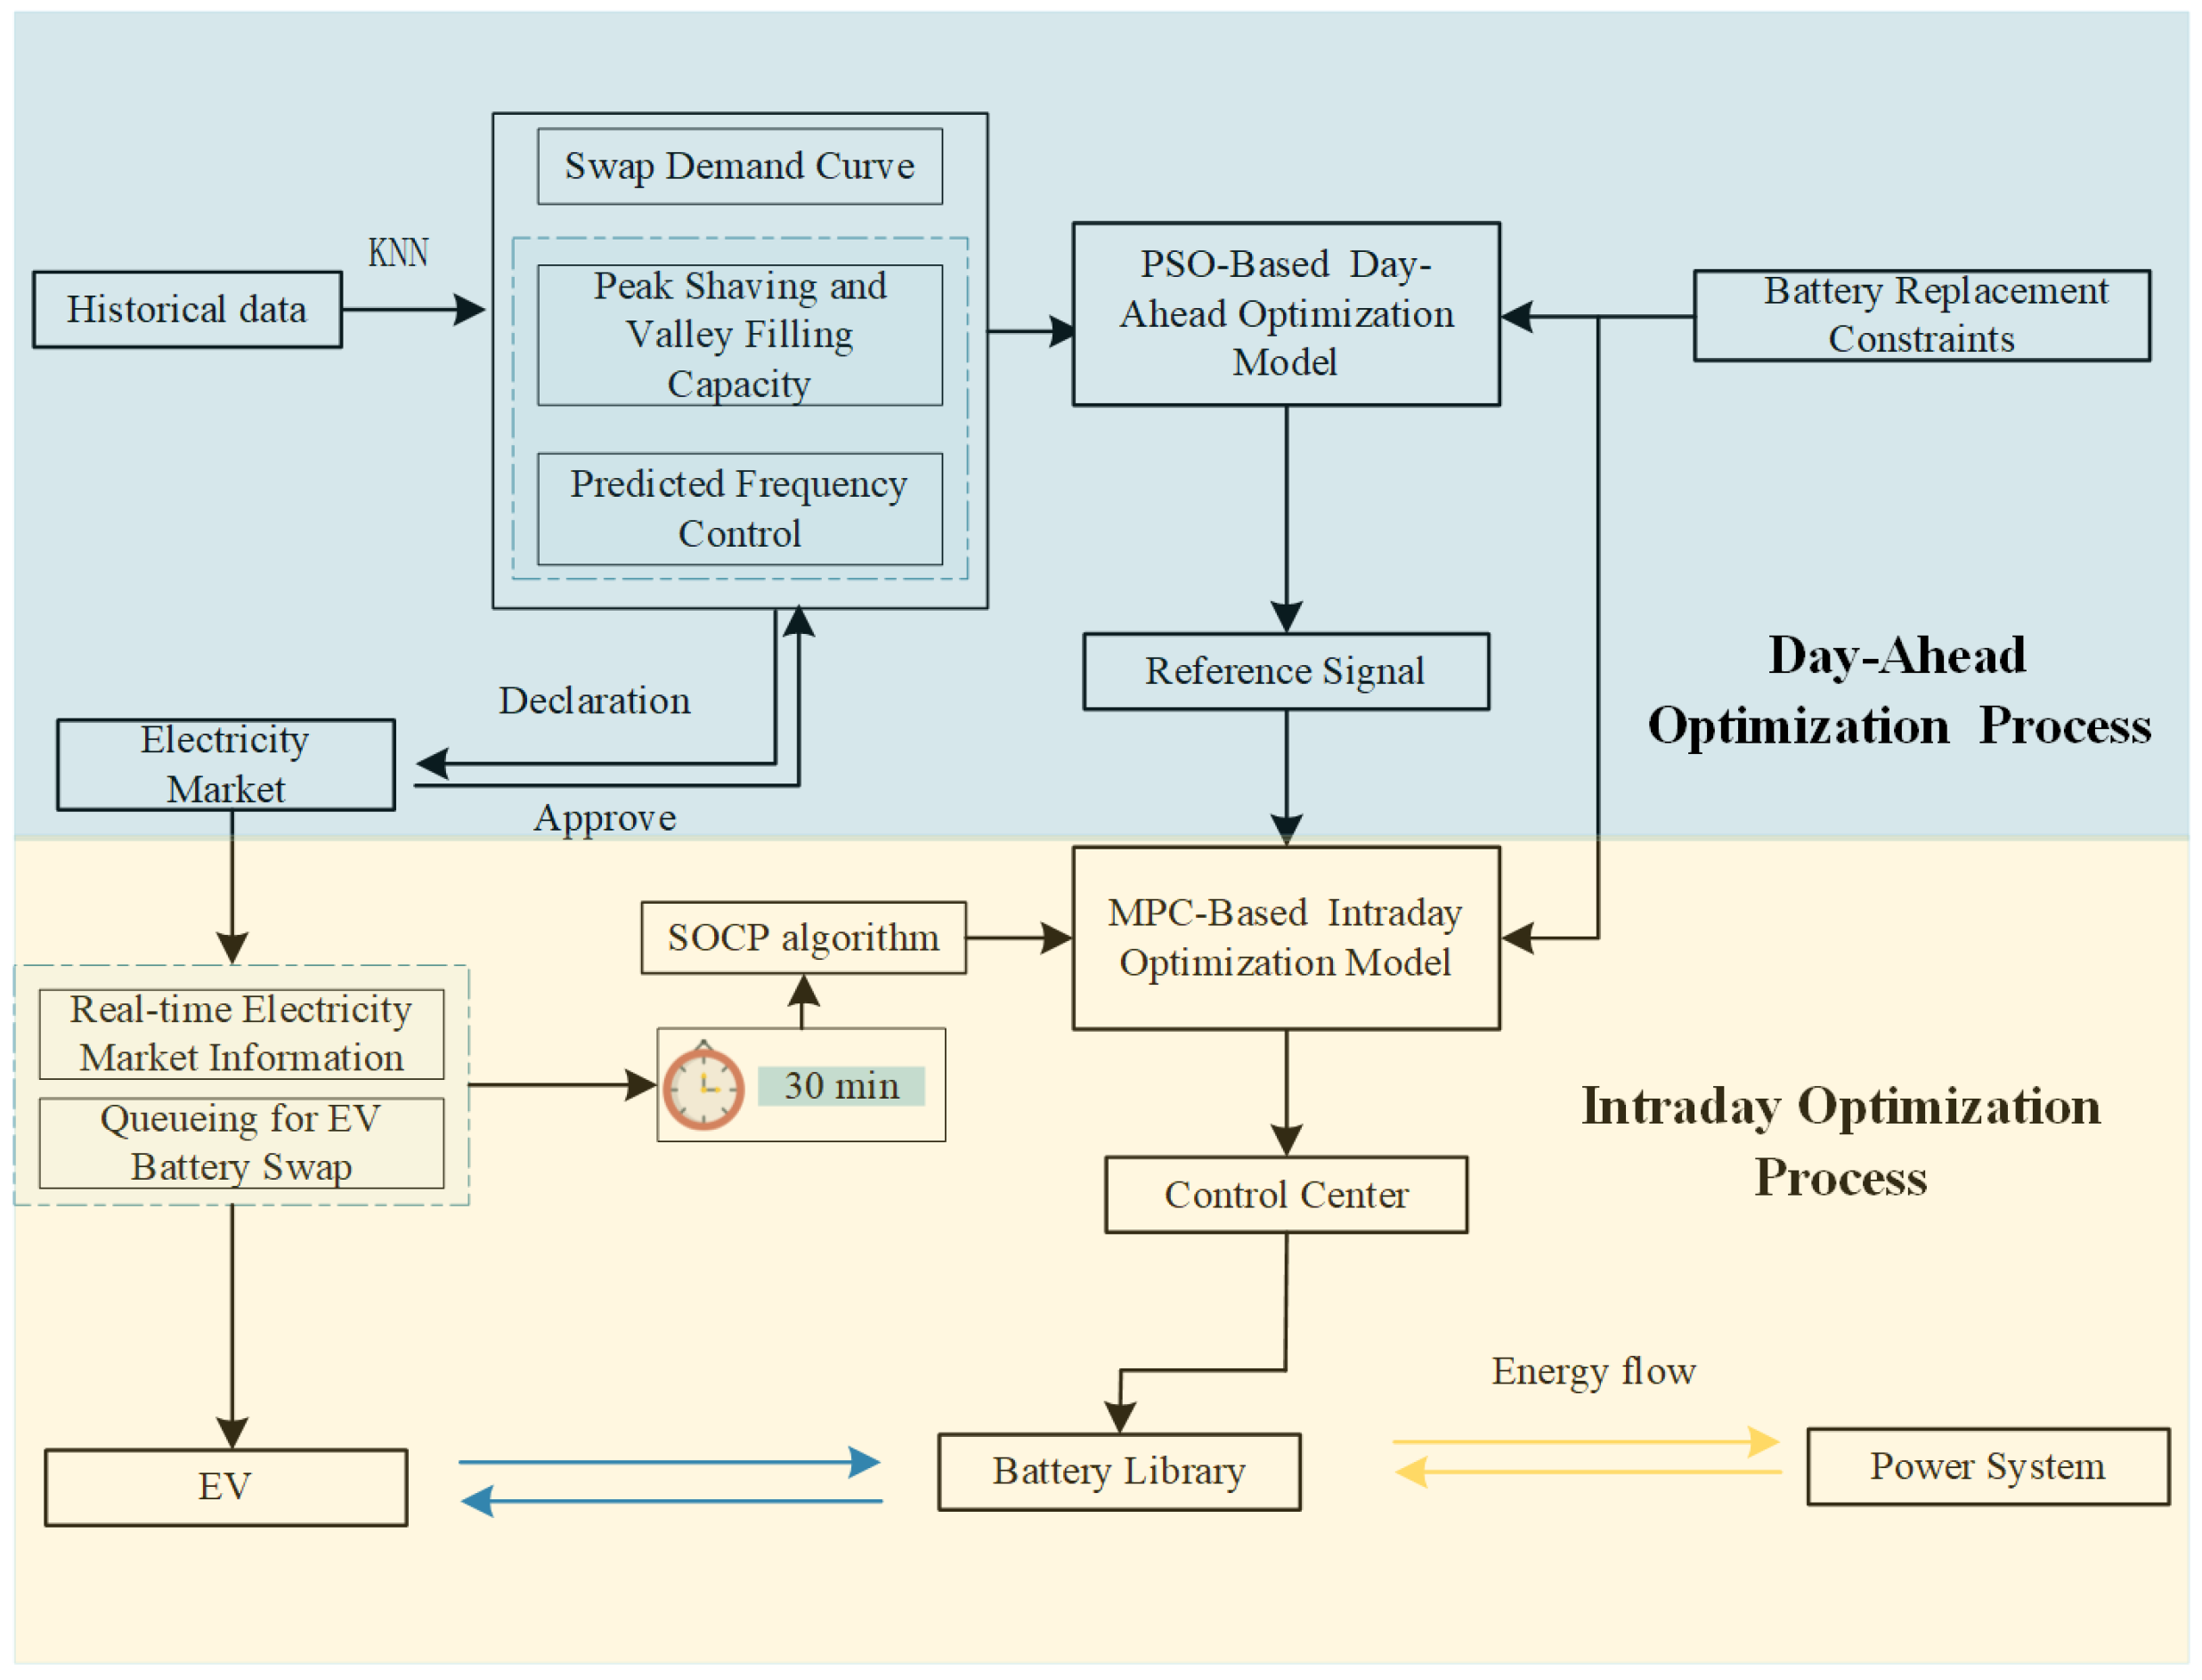
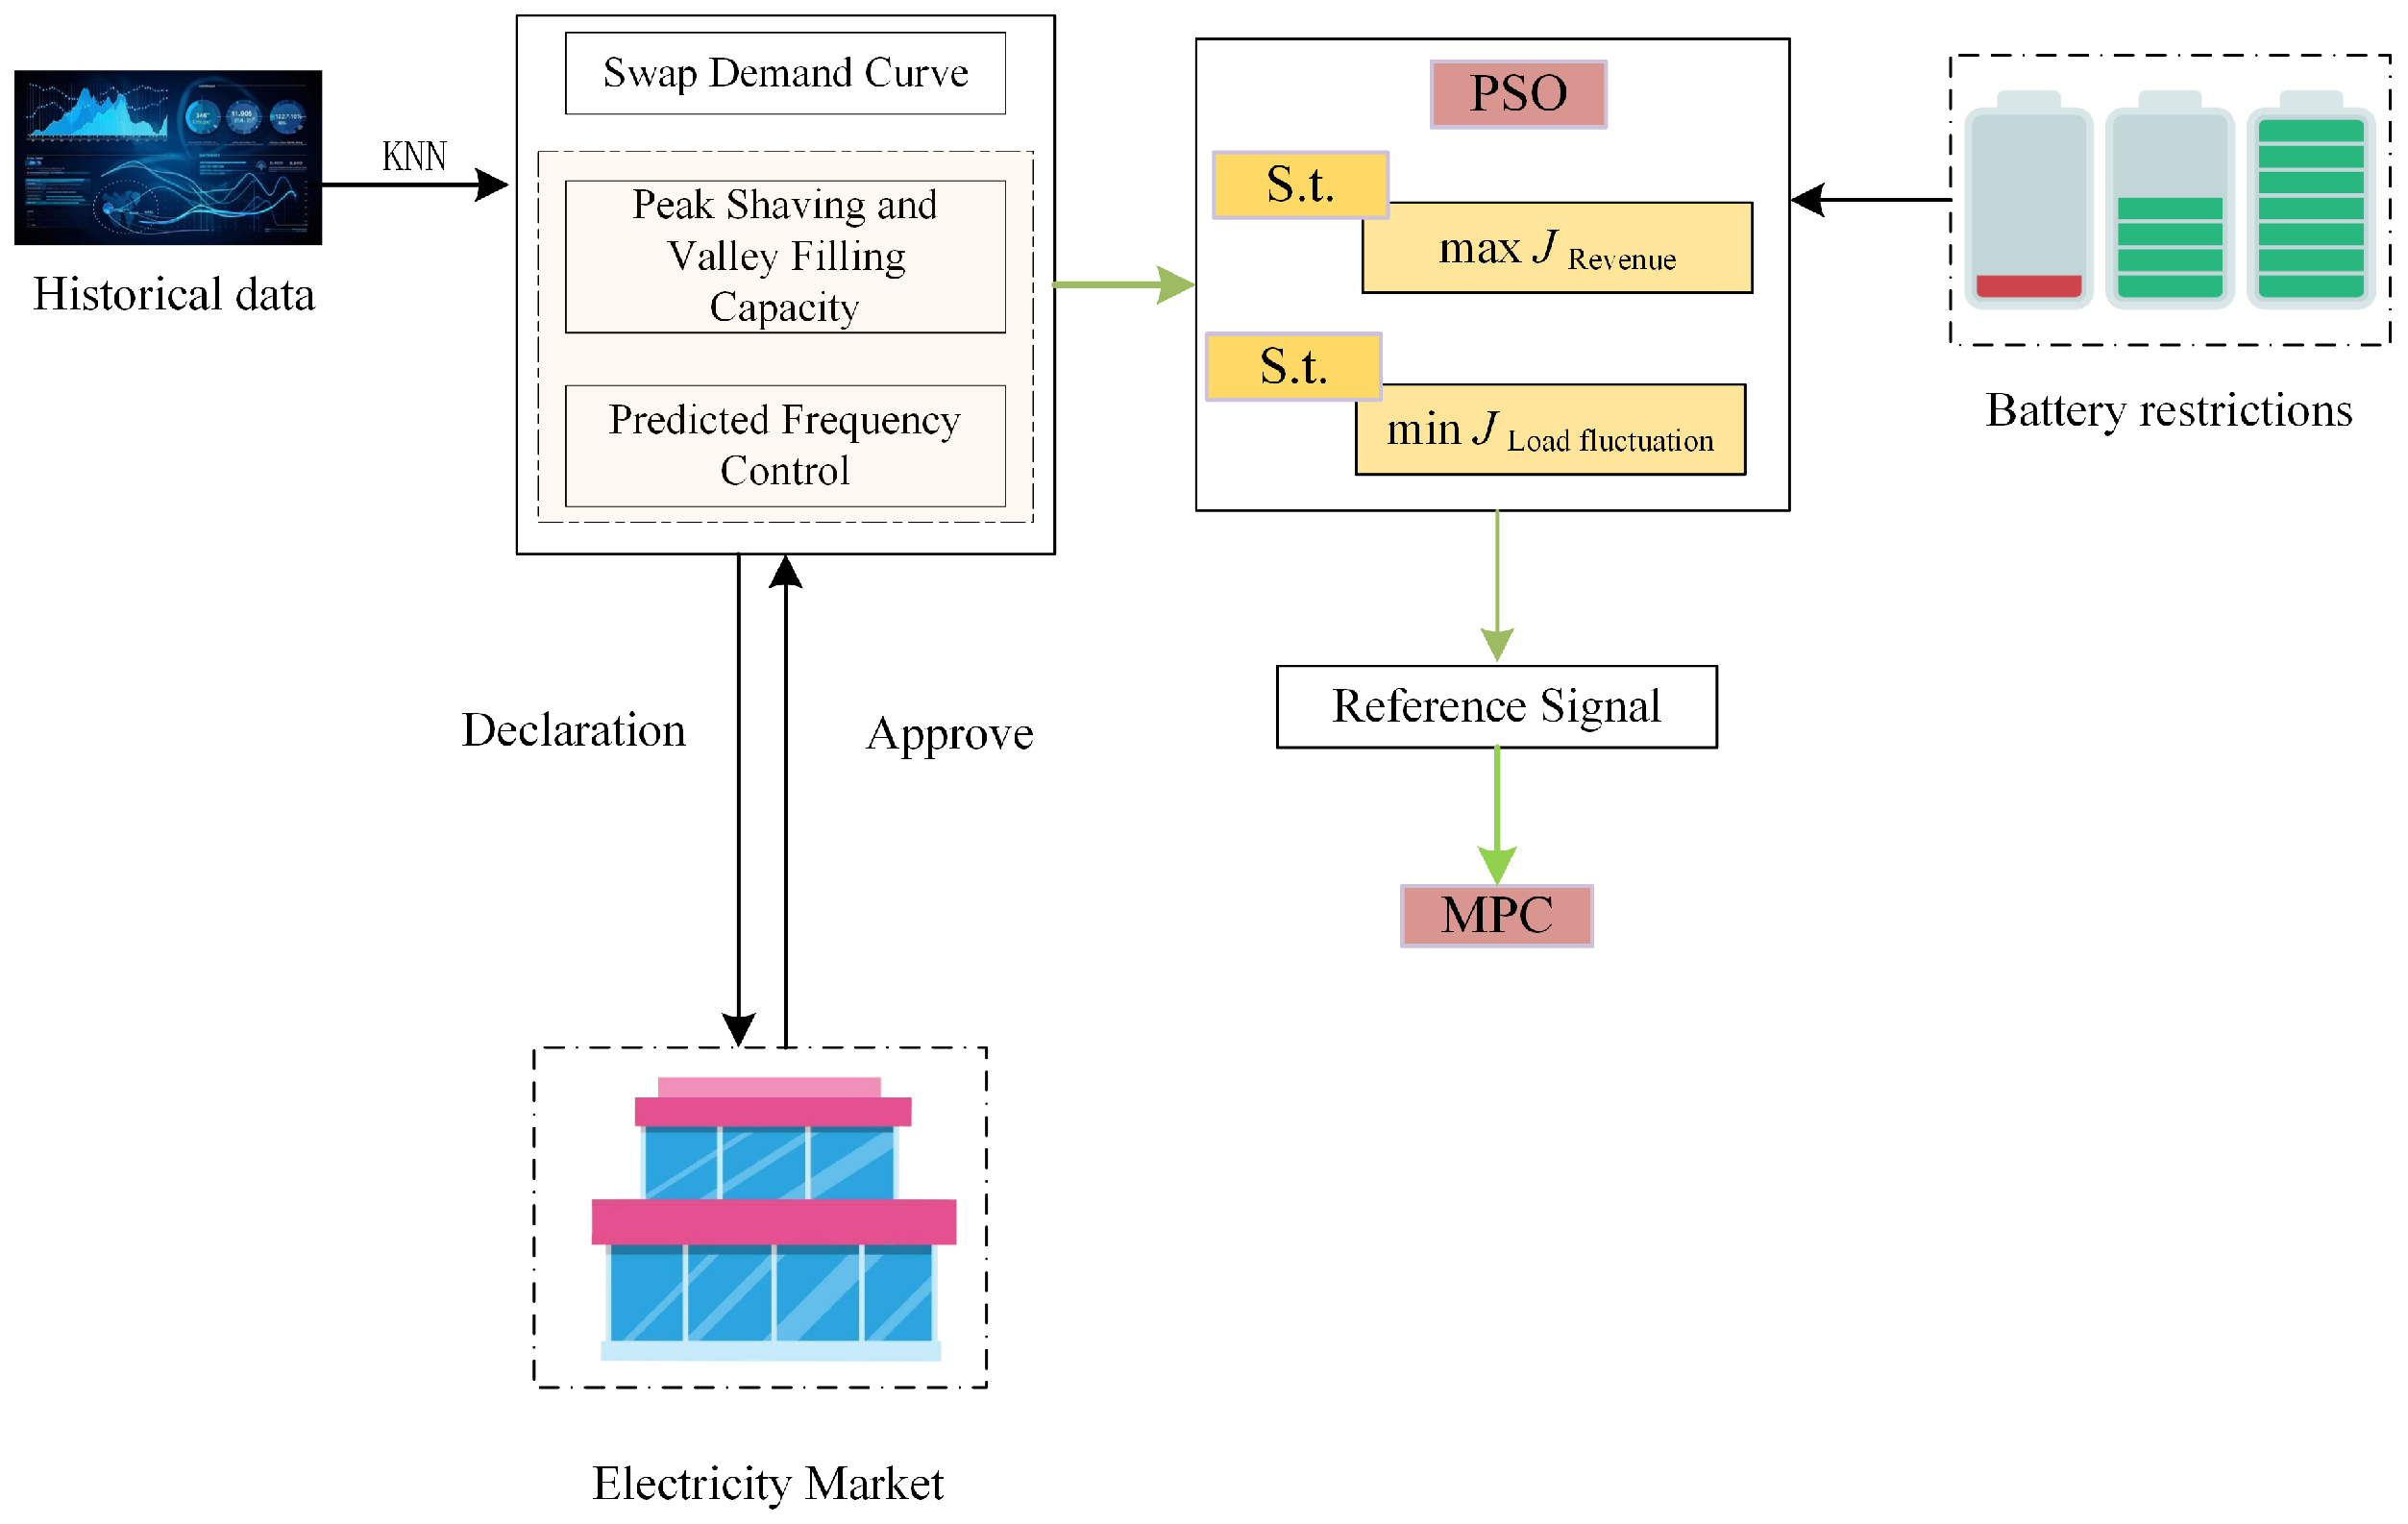
The prediction of the battery swapping demand and frequency regulation capacity in this article utilizes the KNN clustering algorithm. As shown in the following Figure 3, the clustering prediction is based on the battery swapping demand and frequency regulation capacity during the same time periods on different dates. The BSS scheduling model uses day-ahead-intraday multi-timescale optimal scheduling strategies, with the predictive optimization model for the day-ahead phase as the upper optimization model and the optimization model for the intraday phase as the lower optimization model. In the day-ahead period, the BSS operator receives demand response day-ahead invitations and frequency regulation market information, combines the next day’s battery swapping demand forecast with the next day’s forecasted frequency regulation capacity, and uses the PSO algorithm with multi-objective optimization, the optimization of the time interval of 30 min, to divide the 1 day into 48 time segments. The Intraday stage optimization model adopts the MPC algorithm, and the charge/discharge curves of the BSS optimized in the upper level are used as the reference curves for Intraday online optimization of the lower optimization model. The BSS is based on real-time power market information, real-time vehicle battery swapping information to utilize the SOCP algorithm to correct the charging and discharging reference curve optimized by day-ahead prediction, and the optimization of the time interval of 30 min. The MPC algorithm can be updated online according to the real-time battery swapping demand and the real-time demand of the power system, The MPC algorithm applies the optimized results to the control center, which then issues instructions to the BSS. The Battery Swapping System (BSS) interacts with the battery swapping customers and the power system.
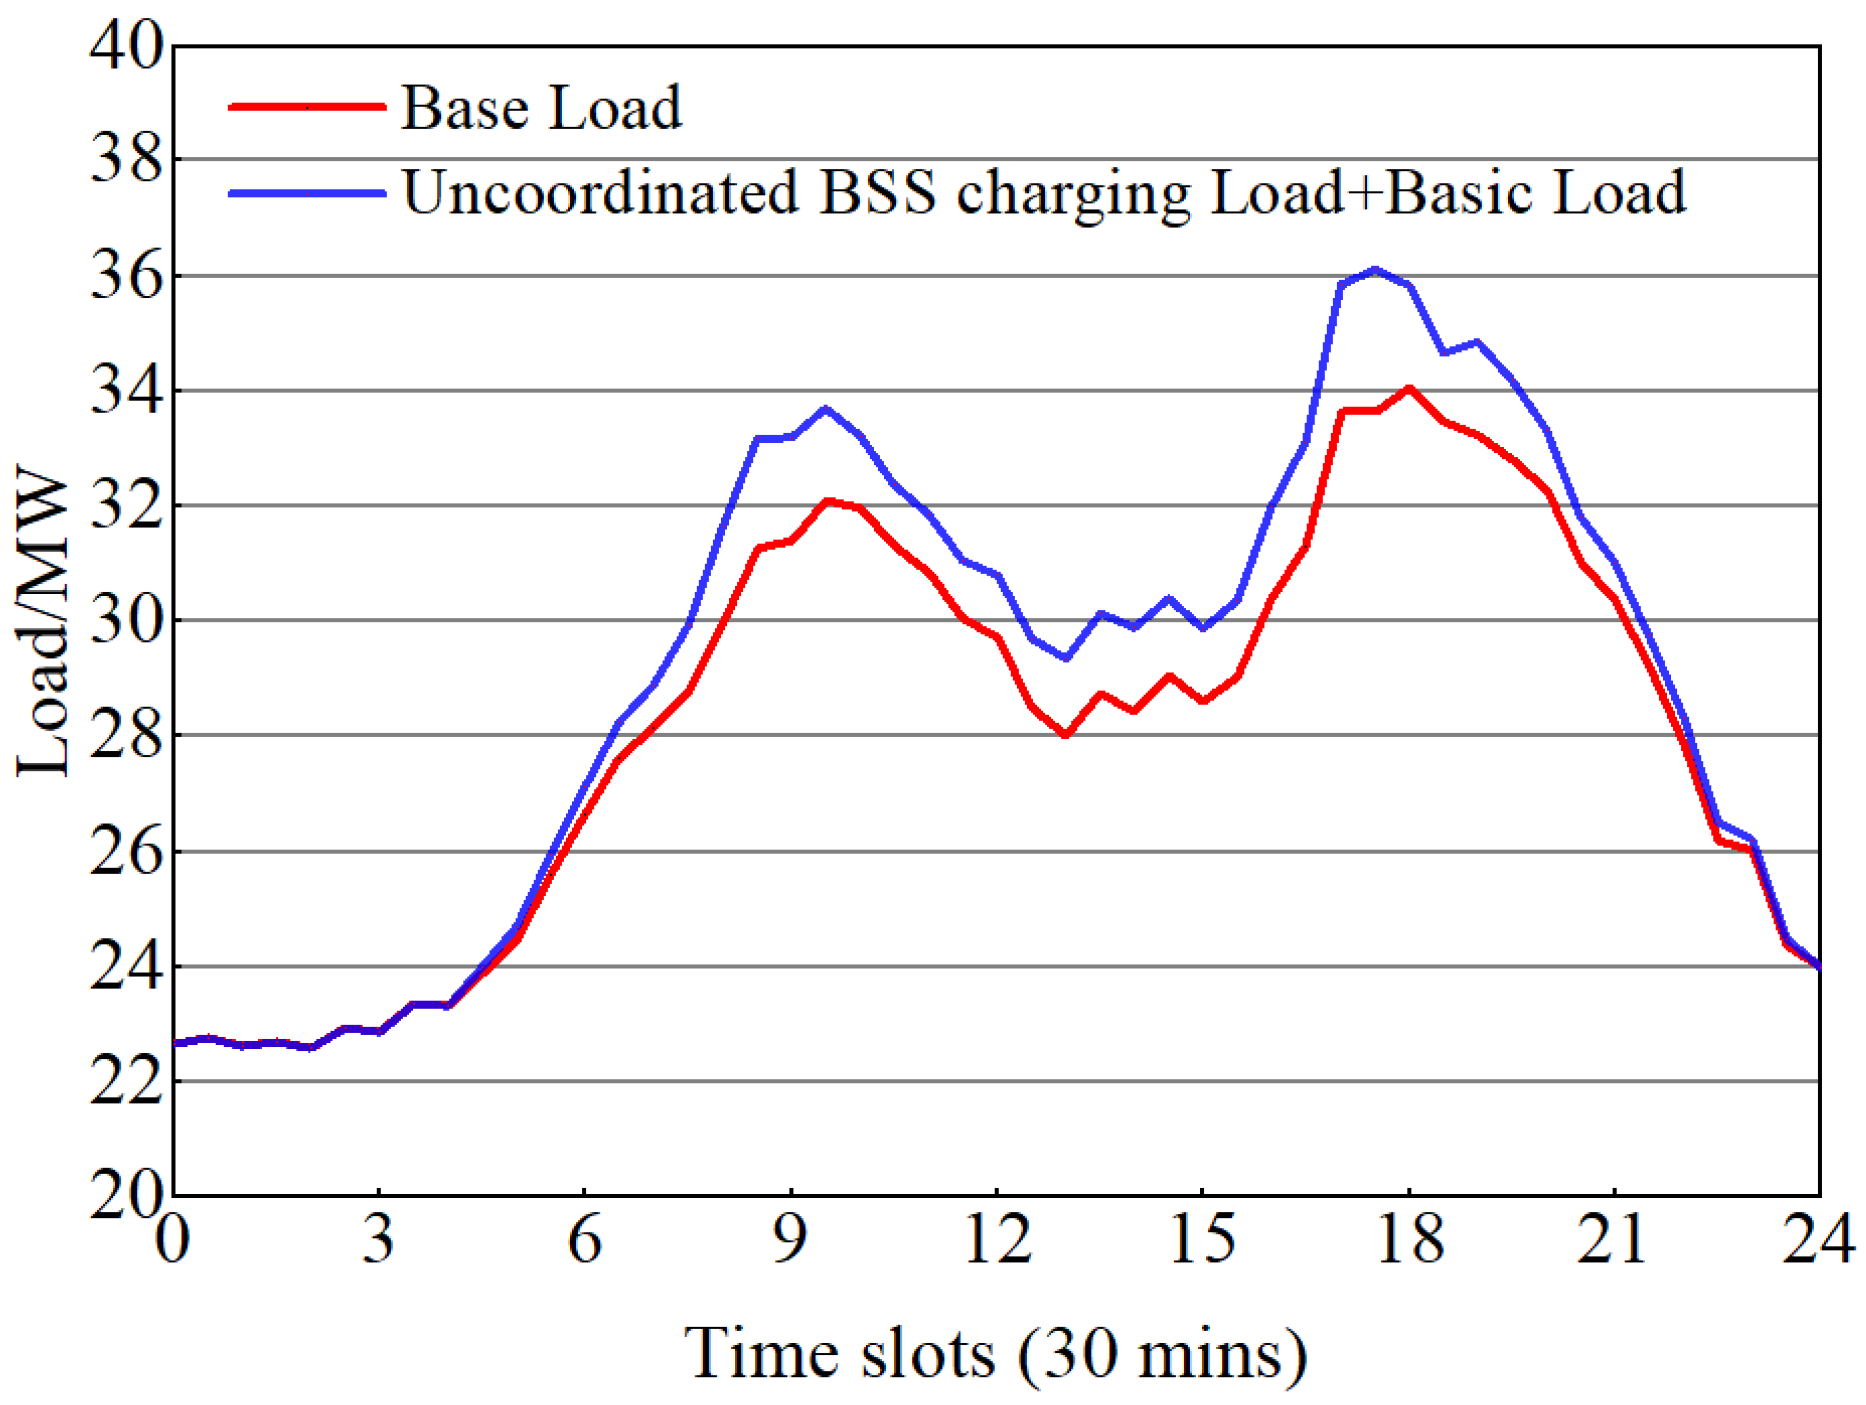
EV battery swapping income is the main source of revenue for BSS, but periods of high demand for battery swapping are usually also peak periods of electricity demand, so the stacking of uncontrolled BSS charging loads and local base will cause a great deal of impact on electric power facilities. As shown in Figure 4 and Figure 5, the periods of 8:30–11:00 hours and 16:30–20:30 hours are classified as the peak load of the power system in base load and the peak period of the BSS uncontrolled charging load of the stack. At 9:30, the base load is 32.1 MW, and, added to the charging load of the BSS at this time, the total load of the two reaches 33.72 MW. Similarly, the base load changes from 33.63 MW to a total load of 36.13 MW at 17:30 hours. So, the uncontrolled charging of BSS causes a shock to the electrical equipment.
In satisfying the battery swapping demand, the BBS can maximize the revenue of the BSS not only by responding to the peak shaving and valley filling demand of the power system in order to gain subsidies from the power market, but also through the strategy of selling power during the peak period of the electricity price and purchasing power during the low period of the electricity price. Similarly, BSS can also participate in the frequency regulation of the power system, according to its frequency regulation capacity to put forward the frequency regulation capacity declaration. If the declaration is approved, it can participate in the frequency regulation assistance work. So as to obtain the revenue of frequency regulation assistance, electric vehicle battery aging will have a significant impact on the revenue of the BSS; therefore, the aging problem of the battery power is to be included in the scope of consideration of the optimization and control of the BSS.

2.3. Day-Ahead Prediction-Based Optimal Scheduling Modeling

In the day-ahead stage, the BSS system has to accept the tariff information from the electric energy/auxiliary services market, the frequency regulation information and the forecast value of the next day’s battery swapping demand, the forecast value of the next day’s frequency regulation capacity, and the forecast curve of the next day’s base load, on the basis of which it carries out the optimization scheduling based on the forecast.
(1)
Battery aging modeling
The cost C c h a , which is the generated electric vehicle operating cost of the electric vehicle power batteries involved in charging and discharging, depends on the floating charge cost C f l o a t and cycle cost C c y c l e , as shown in Equations (2)–(4).
C b a t = max ( C f l o a t , C c y c l e )
C f l o a t = E b a t C c a p T f l o a t
C c y c l e t = 1 T ( P i , t d i s 1 η d i s + P i , t c h a η c h a ) k p E b a t C c a p k p 2 N 0
where E b a t is the investment cost per unit capacity, C c a p is the rated capacity, T f l o a t is the float life, P i , t c h a is the charging power of the ith charger at time t, P i , t d i s is the discharging power of the ith charger at time t, η c h a is the charging efficiency, η d i s is the discharging efficiency, N 0 is the the number of baseline cycles, and k p is the fitted characteristic parameter.
(2)
Frequency regulation assistance modeling
There is a certain regularity in the power use of frequency regulation assistance services. So, based on the historical frequency regulation assistance data, it is possible to predict the predicted value of frequency regulation power used in each interval of time, d t f , as well as to ensure that there is enough power, Q t f ± , to support the work of the frequency regulation assistance at the time of the declaration of the frequency regulation assistance, and that the value of d t f meets the constraints of Equation (5)
Q t f ± d t f 0 Q t f + i = 1 n ( P i , max c h a P i , t c h a B i , t + P i , t d i s ( 1 B i , t ) ) 0 Q t f i = 1 n ( P i , max d i s + P i , t c h a B i , t P i , t d i s ( 1 B i , t ) )
where Q t f + represents the declared capacity of downward power, and Q t f represents the declared capacity of upward power, and Equation (5) can to a certain extent ensure that the BSS has enough power to satisfy the frequency regulation capacity declared the day ahead. P i , m a x c h a represents the maximum of the charging power, P i , m a x d i s represents the maximum of the discharging electric power, and B i , t represents the binary variable of the charging and discharging state the battery in the BSS system, where the value of B i , t is 1 for the ith charger to perform the charging operation at t, and 0 for the stopping of the charging to discharging operation. The same battery cannot be swapping batteries, charging, and discharging at the same time, meaning that each battery can only be in one state of operation. The frequency regulation auxiliary benefit R t f can be expressed as Equation (6).
R t f = A c h t ( t ) × π R D ( t ) + A d i s t ( t ) × π R U ( t )
where the charging power A c h t can be used for frequency regulation at the moment t, the power A d i s t can be used for frequency discharge at the moment t, the power π R D can be used for downward frequency regulation at the moment t, and the power π R U can be used for downward frequency regulation at the moment t.
(3)
Modeling of peak shaving and valley-filling benefits
When the BSS participates in peak shaving and valley filling, it not only reduces the burden on the power system, but also can earn revenue R t r e s by responding to peak shaving and valley filling in the low valley of the grid load, as shown in Equation (7).
R t r e s = E t d a , r e s [ P t b a s e i = 1 n ( P i , t c h a B i , t P i , t d i s ( 1 B i , t ) ) ]
where E t d a , r e s is the price of responding to peak shaving and valley filling at time t. E t d a , r e s is positive in the case of participating in the peak shaving at time t and negative in the case of participating in the valley filling at time t; and P t b a s e is the load baseline at time t.
(4)
Swapping battery revenue modeling
The swapping revenue at time t, R t e v is the service provider’s revenue to swap batteries at time t. The sizes of the swapping revenues depend not only on the demand for swapping vehicles at time t, but also on the inventory of fully-charged batteries at time t, as shown in Equation (8).
R t e v = E t e v Q exp e v min ( d t n u m , n t 100 )
where d t n u m represents the predicted value of swapping the battery demand at time t; n t 100 represents the number of fully charged batteries in the BSS at time t; Q e x p e v represents the predicted value of the exchangeable electric quantity; and E t e v is the battery swapping service tariff at time t.
(5)
BSS charge cost modeling
Electric vehicle batteries generate a certain charging cost C t c h a when they are charged and discharged, as shown in Equation (9).
C t c h a = E t d a , b u y i = 1 n P i , t c h a B i , t E t d a , s e l l i = 1 n P i , t d i s ( 1 B i , t )
where E t d a , b u y is the purchased electricity price at time t and E t d a , s e l l is the sold electricity price at time t.
max F 1 da = t = 1 T ( R t e v + R t f + R t r e s C t c h a C t b a t )
min F 2 d a = t = 1 T P t b a s e P t b a s e 24 + i = 1 n ( P i , t c h a B i , t P i , t d i s ( 1 B i , t ) )
Equations (10) and (11) are the objective functions of the day-ahead optimization, where F 1 d a is aiming at maximizing the BSS gain, and F 2 d a is aiming at minimizing the average variance between the base load and the stacked loads.
In the multi-objective mathematical model, due to the different dimensions of multiple objective functions, the weighted summation cannot be performed directly, so the two objective functions optimized a day ahead are first normalized to make them comparable, as in Equations (12) and (13).
f 1 = f 1 f 1 , min f 1 , max f 1 , min
f 2 = f 2 f 2 , min f 2 , max f 2 , min
In order to comprehensively consider the influence of the objective functions f 1 and f 2 , the weighted method is applied to process the two objective functions to obtain the total objective function, as in Equations (14) and (15). λ 1 and λ 2 are the weight coefficients of each objective function.
F = λ 1 f 1 λ 2 f 2
λ 1 + λ 2 = 1 λ 1 0 , λ 2 0
During continuous charging and discharging, the SOC of each battery after each charging and discharging cycle satisfies the following constraints.
(6)
Constraints on charging power batteries
P i , t c h a B i , t P i , t d i s ( 1 B i , t ) + A i , t c h a P i , max c h a
P i , t c h a B i , t P i , t d i s ( 1 B i , t ) A i , t d i s P i , max d i s
S O C i min S O C i ( t ) S O C i max
A i , t c h a C i , t + A i , t d i s ( 1 C i , t ) + P t b a s e + P i , t c h a B i , t P i , t d i s ( 1 B i , t ) L c a p
S O C i m i n represents the lowest percentage of battery power that allows the charging and discharging operation. C i , t can only be 0 or 1. S O C i m a x represents the highest percentage of battery power that allows the discharging operation.
L c a p is the maximum capacity of the power equipment. Equations (16) and (17) are the constraints for battery power to participate in charging and discharging under frequency regulation assistance, respectively. Equation (18) indicates that the SOC of the EV battery has to be within a certain range, and Equation (19) indicates that the stack of base load and BSS charging power has to be limited to the capacity of the power equipment.
(7)
Strategies for battery power participation in peak shaving and frequency regulation assistance
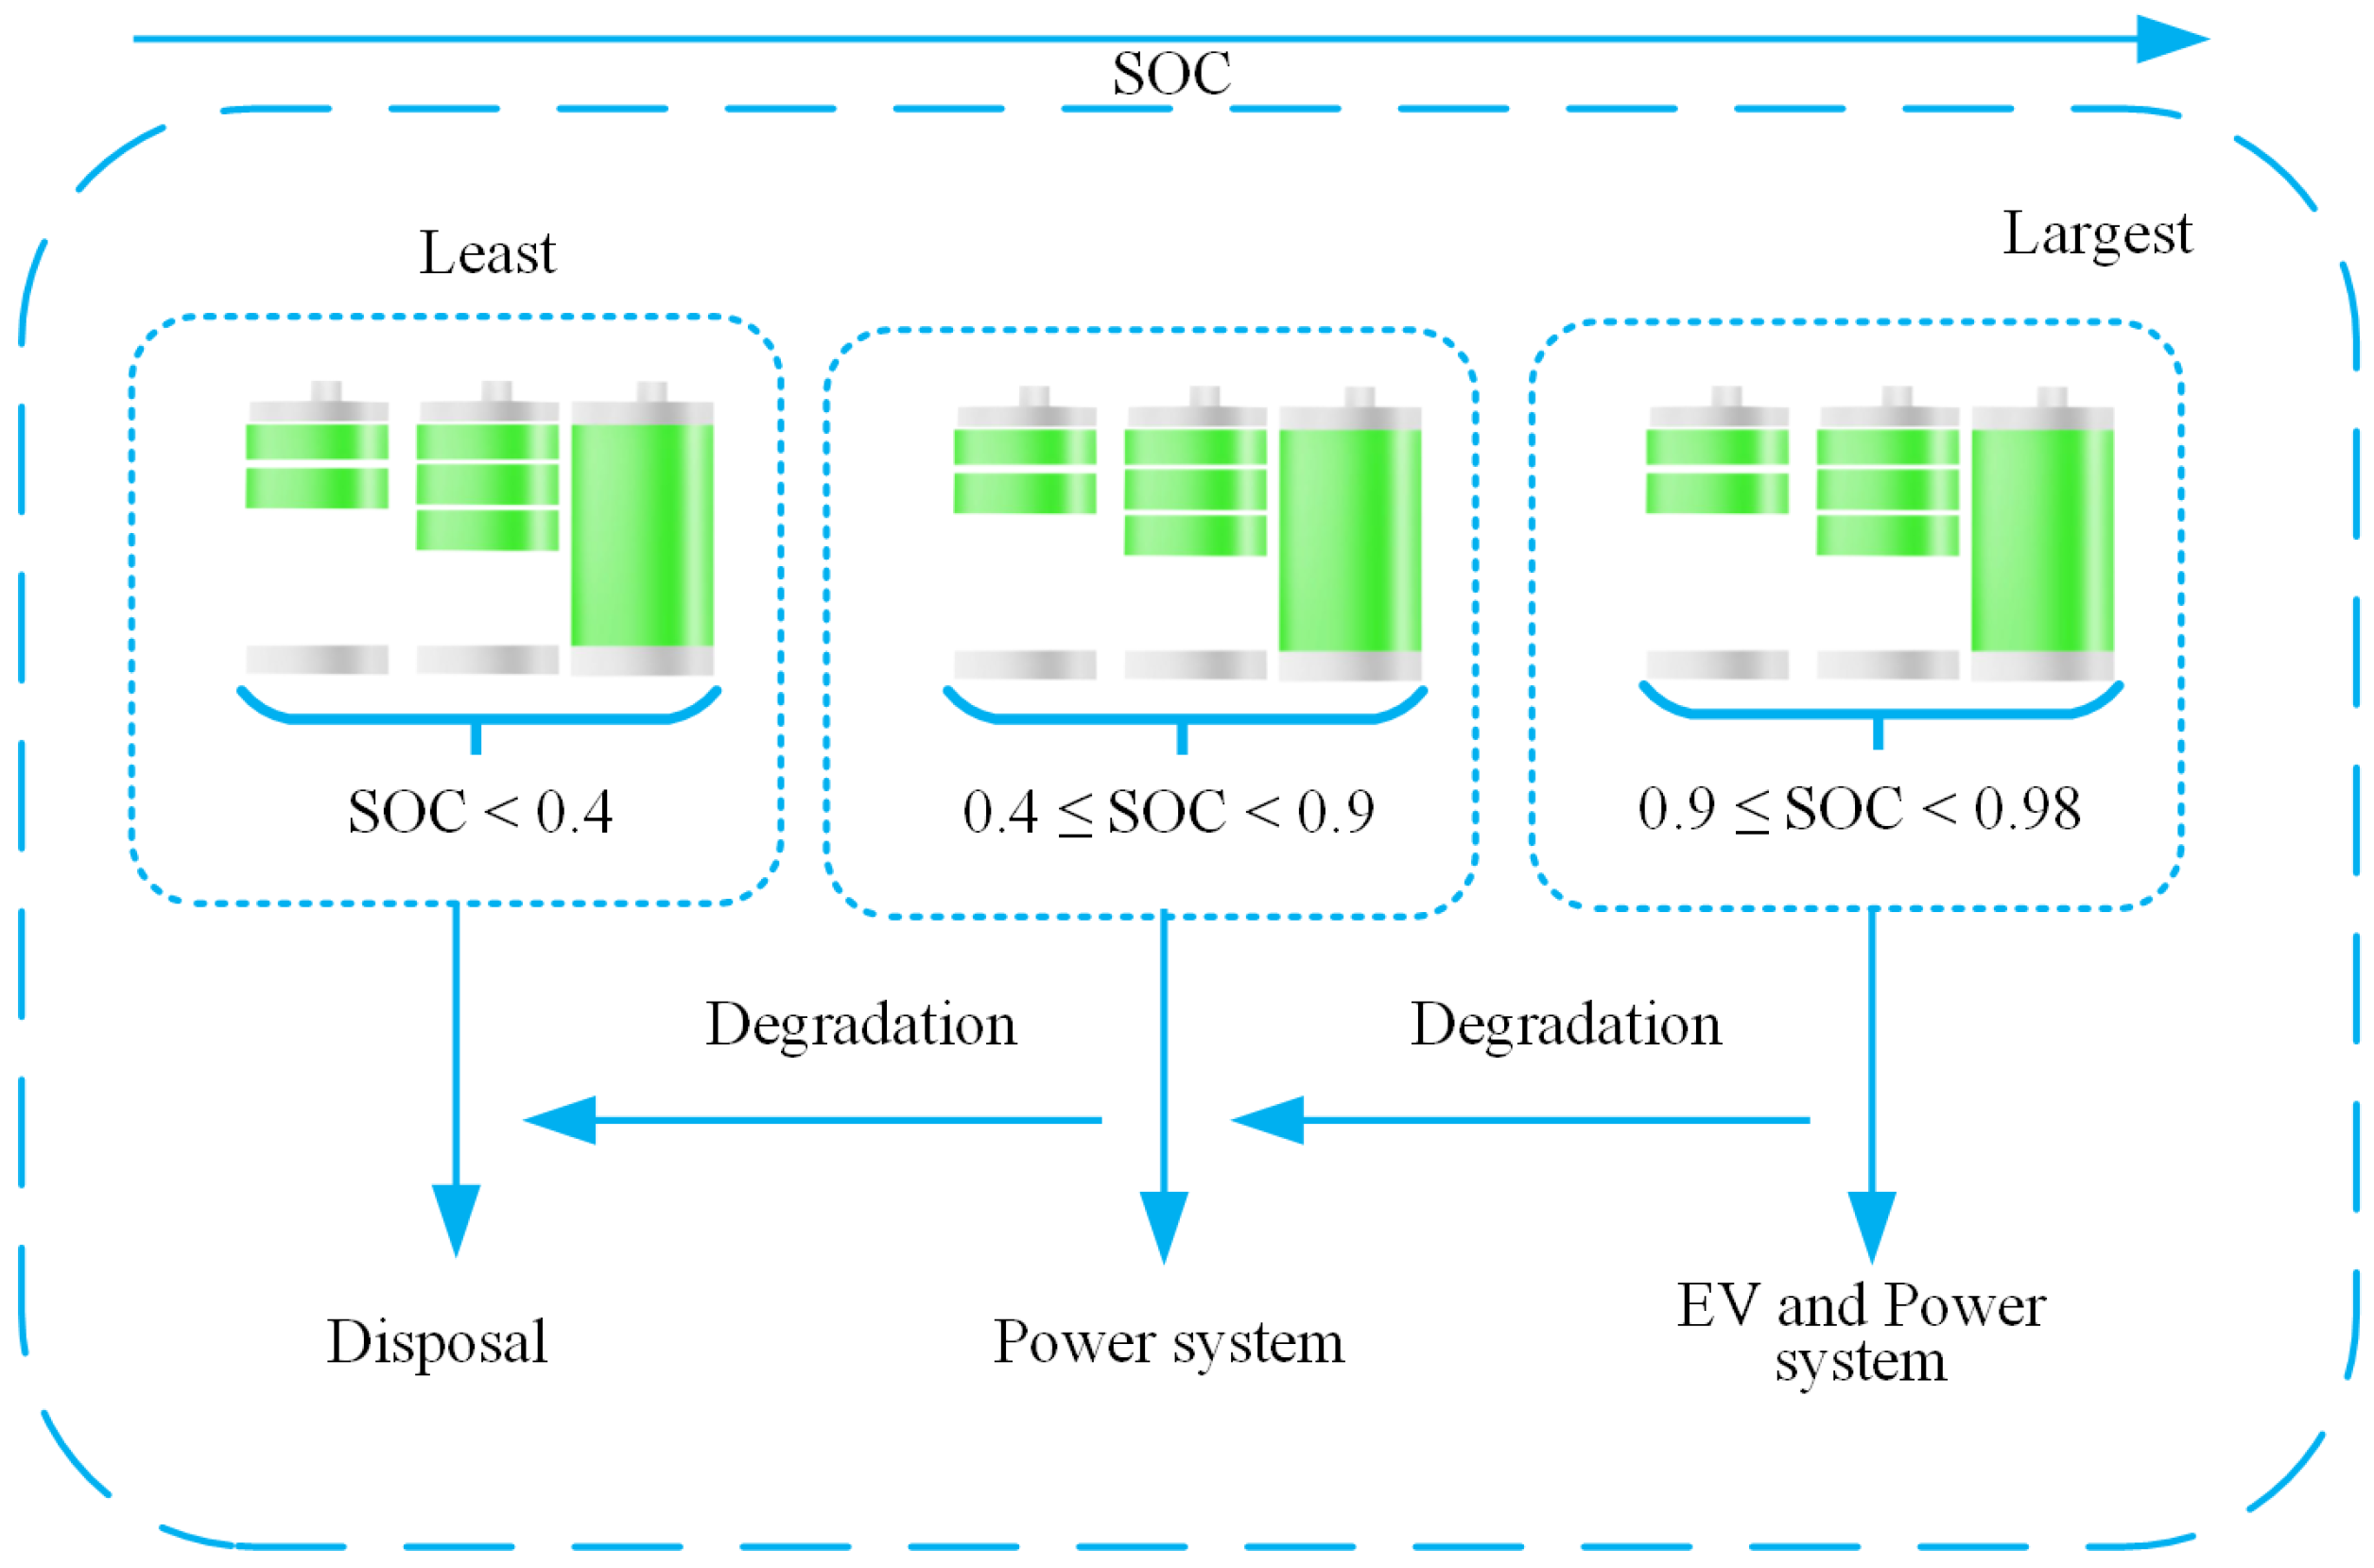
As can be seen in Figure 6, when the battery power’s SOC is less than 40%, it cannot participate in the process of upward frequency regulation of the power grid and peak shaving in peak shaving, because the electric battery is too low in power, and frequent charging and discharging will seriously battery loss; therefore, when the battery power SOC is between 40–90% to participate in the grid’s bidirectional frequency regulation and peak shaving of the whole process, and when the battery power’s power is more than 90%, the battery is considered to have been fully charged and stored in the warehouse for electric vehicle replacement. The battery is fully charged and stored in the warehouse for EV battery swapping. In the charging strategy of BSS, among the 100 batteries charged on the charger, the one with the larger SOC is prioritized for charging to meet the customer’s battery swapping demand.
For example, the S O C j , t 1 for the battery on the charger numbered j at hour t 1 is compared to the S O C k , t 1 for the battery on the charger numbered k at hour t 1 , and in Equation (20), if y j k t > 0 , it means that the charger numbered j is given the priority of charging at hour t.
y j k t = S O C j t 1 S O C k t 1
(8)
Constraints for battery power swapping
0 Q i , o + t = 1 k ( P i , t c h a η c h a Δ t P i , t d i s 1 η d i s Δ t ) Q i max S O C i , t + 1 = Q i , o + t = 1 k ( P i , t c h a η c h a Δ t P i , t d i s 1 η d i s Δ t ) Q i max if S O C i , t + 1 > 0.9 ; H i , t = 1 ; S O C i , t + 1 = 0.1 r a n d ( ) + 0.2 ; e l s e H i , t = 0 ; e n d
t = 1 T i = 1 n H i , t t = 1 T d t n u m t = 1 , 2 , , T
Q i , o represents the initial power of charging at charger i, Q i m a x represents the maximum capacity of battery charging at charger i, H i , t represents whether to replace the battery with a new one at the charger i. H i , t is 1, which means that the battery power can be removed and replaced with a new one for charging, and H i , t is 0, which means that, at this time, the battery power is not fully charged. Equation (21) indicates that the battery charged on charger i cannot exceed the capacity of the battery, and if the SOC of the battery is over 90%, the battery is considered to be fully charged, and it is necessary to replace the battery with a new one that is not fully charged. The constraint in Equation (22) indicates that the actual total number of fully charged batteries is more than the total battery swapping requirement.

2.4. Intraday Optimized Scheduling Model

As shown in the Figure 7, the Intraday stage optimization model adopts the MPC algorithm, and the charge/discharge curves of the BSS optimized the day ahead are used as the reference curves for Intraday online optimization of the lower optimization model. The algorithm (SOCP) is used to adjust the charging and discharging reference curve optimized through day-ahead prediction, based on real-time power market information and real-time vehicle battery swapping information and the optimization of the time interval of 30 min. Intraday optimization can more accurately determine power allocation strategies based on real-time invitation information, real-time tariff fluctuations, and real-time demand response status in order to better respond to external conditions. Based on the information and battery-swapping constraints, the MPC (Model Predictive Control) online optimization algorithm for multi-objective optimization is employed with the goals of maximizing BSS (Battery Swap Station) revenue and minimizing customer waiting time for battery replacement. Therefore, it is necessary to further optimize the Intraday optimal scheduling model according to the real-time situation to reduce the economic loss caused by vehicle queuing for battery swapping. The MPC algorithm can be updated online according to the real-time battery swapping demand and the real-time demand of the power system, which is more ideal for dealing with real-time problems. Therefore, the MPC algorithm is used in the Intraday phase to carry out Intraday rolling optimization control, with 30 min as the control time range and 4 h as the prediction time range.
(1)
The objective function
max F r t = t = 1 T ( R t r e s + R t f + R t e v C t l o s s , max )
C t l o s s , max = t = 1 T min ( 0 , c w ( n t 100 d t n u m ) )
In the Intraday phase, the loss function C t l o s s , m a x , which is not considered in the day-ahead phase for vehicle queuing battery switching, is incorporated into the objective function of the Intraday optimization in order to enhance the responding ability of the BSS to the uncertainty of the Intraday battery swapping times and to enhance the robustness of the system. The Intraday charging and discharging constraints are the same as the constraints of the day-ahead phase.
(1)
The day-ahead optimized charge/discharge curve is used as the reference curve for MPC for rolling optimization tracking.
(2)
Establish the control time interval and prediction time interval of the MPC algorithm. The shorter the time interval of the battery swapping demand, the more random and frequent regulation of the battery charging and discharging power will affect the battery lifespan. A longer the time interval leads to the control of the space being small, meaning it cannot respond to the real-time swapping demand, resulting in the vehicle not being able to carry out the orderly battery swapping. So, this paper takes 30 min as the control time interval and 4 h as the predictive.
(3)
Obtain the system state x t at the current time period t. Based on the battery swapping demand, the actual tariff, and the demand related Intraday invitations, track the reference curve in the prediction time domain. t + N P ( N P is the prediction step), obtain the predicted power through the online rolling optimization algorithm, and compute the control sequences in the respective control time domains t + N c ( N c is the control step), u ( t + ε | ε [ 0 , N c 1 ] ) .
(4)
Because the uncertainty of real-time tariffs and swapping batter vehicles can cause vehicle queuing, the second-order cone optimization algorithm is used in each time period t to update the reference curve after time period t to improve the real-time responsiveness of the MPC algorithm.
(5)
Apply the first result u ( t ) of the control sequence to the control object and produce the output vector y ( t ) .
(6)
To time period t + 1 , update the system state y ( t ) to feed back to the rolling optimization model to correct the prediction error.
The key link in the above MPC-based rolling optimization scheduling steps for rolling prediction link is established as follows, selecting the power of each charger charging as P c h a t = P 1 , t c h a , P 2 , t c h a , , P i , t c h a , the power of discharging as P d i s t = P 1 , t d i s , P 2 , t d i s , , P i , t d i s , the state of charge of each battery S O C t = S O C 1 , t , S O C 2 , t , , S O C i , t , the state of frequency regulation reserved power Q f ± t state vector x t , as in Equation (25).
x ( t ) = [ P c h a ( t ) , P d i s ( t ) , S O C ( t ) , Q f ± ] T
Each charger charging increment Δ P c h a ( t ) = [ Δ P 1 , t c h a , Δ P 2 , t c h a , , Δ P i , t c h a ] , discharging power Δ P d i s ( t ) = [ Δ P 1 , t d i s , Δ P 2 , t d i s , , Δ P i , t d i s ] , frequency regulation auxiliary increment Δ Q f ± , Δ S O C ( t ) = [ Δ S O C 1 , t , Δ S O C 2 , t , , Δ S O C n , t ] constructs control variables as shown in Equation (26).
u ( t ) = [ Δ P c h a ( t ) , Δ P d i s ( t ) , Δ S O C ( t ) , Δ Q f ± ] T
This further constitutes the MPC state space model, as shown in Equation (27).
x ( t + 1 ) = A x ( t ) + B u ( t ) A = I a 0 0 0 0 I a 0 0 I a E b a t I a E b a t I a 0 0 0 0 I 1 B = I a 0 0 0 0 I a 0 0 I a E b a t I a E b a t I a 0 0 0 0 I 1
where I a is the unit matrix of a × a and I 1 is the unit matrix of 1 × 1 and build a rolling optimization model, as shown in Equation (28).
min J = t = 0 N 1 ( x ( t ) x ( t ) r e f ) T Q ( x ( t ) x ( t ) r e f ) + u ( t ) T R u ( t ) + m t = 0 N 1 M x ( t )
where x ( t ) r e f is the tracking reference vector of x ( t ) , obtained from the day-ahead optimization; Q and R are the deviation weight matrices representing the penalties on the process state and the control quantity, respectively, and the more valued that item is, the larger the matrix is allowed to increase; m is the revenue weight coefficient; M is the price matrix, the objective function where the ( x ( t ) x ( t ) r e f ) T Q ( x ( t ) x ( t ) r e f ) term is the sum of the squares of the tracking errors, which indicates the tracking of the reference quantity, and m t = 0 N 1 M x ( t ) is the operating cost of regulation, which characterizes the economics of the control to a certain extent, and the gain weights m are adjustable to coordinate global control of the reference trajectory and local economic optimization.

3. Optimization Algorithms

At the day-ahead stage, traditional linear programming methods face greater challenges in dealing with multivariate optimization due to the numerous variables involved in each time interval. Notably, the optimization problem involved in this study is a multi-objective optimization, which further increases the complexity of the problem. Since the multi-objective particle swarm (PSO) algorithm can handle multivariate optimization problems and has both convergence and rapidity, the PSO algorithm is selected for the day-ahead optimization algorithm in this paper, and the algorithm is iterated for 100 times, which results in convergence and the BSS benefits reach the optimal value.
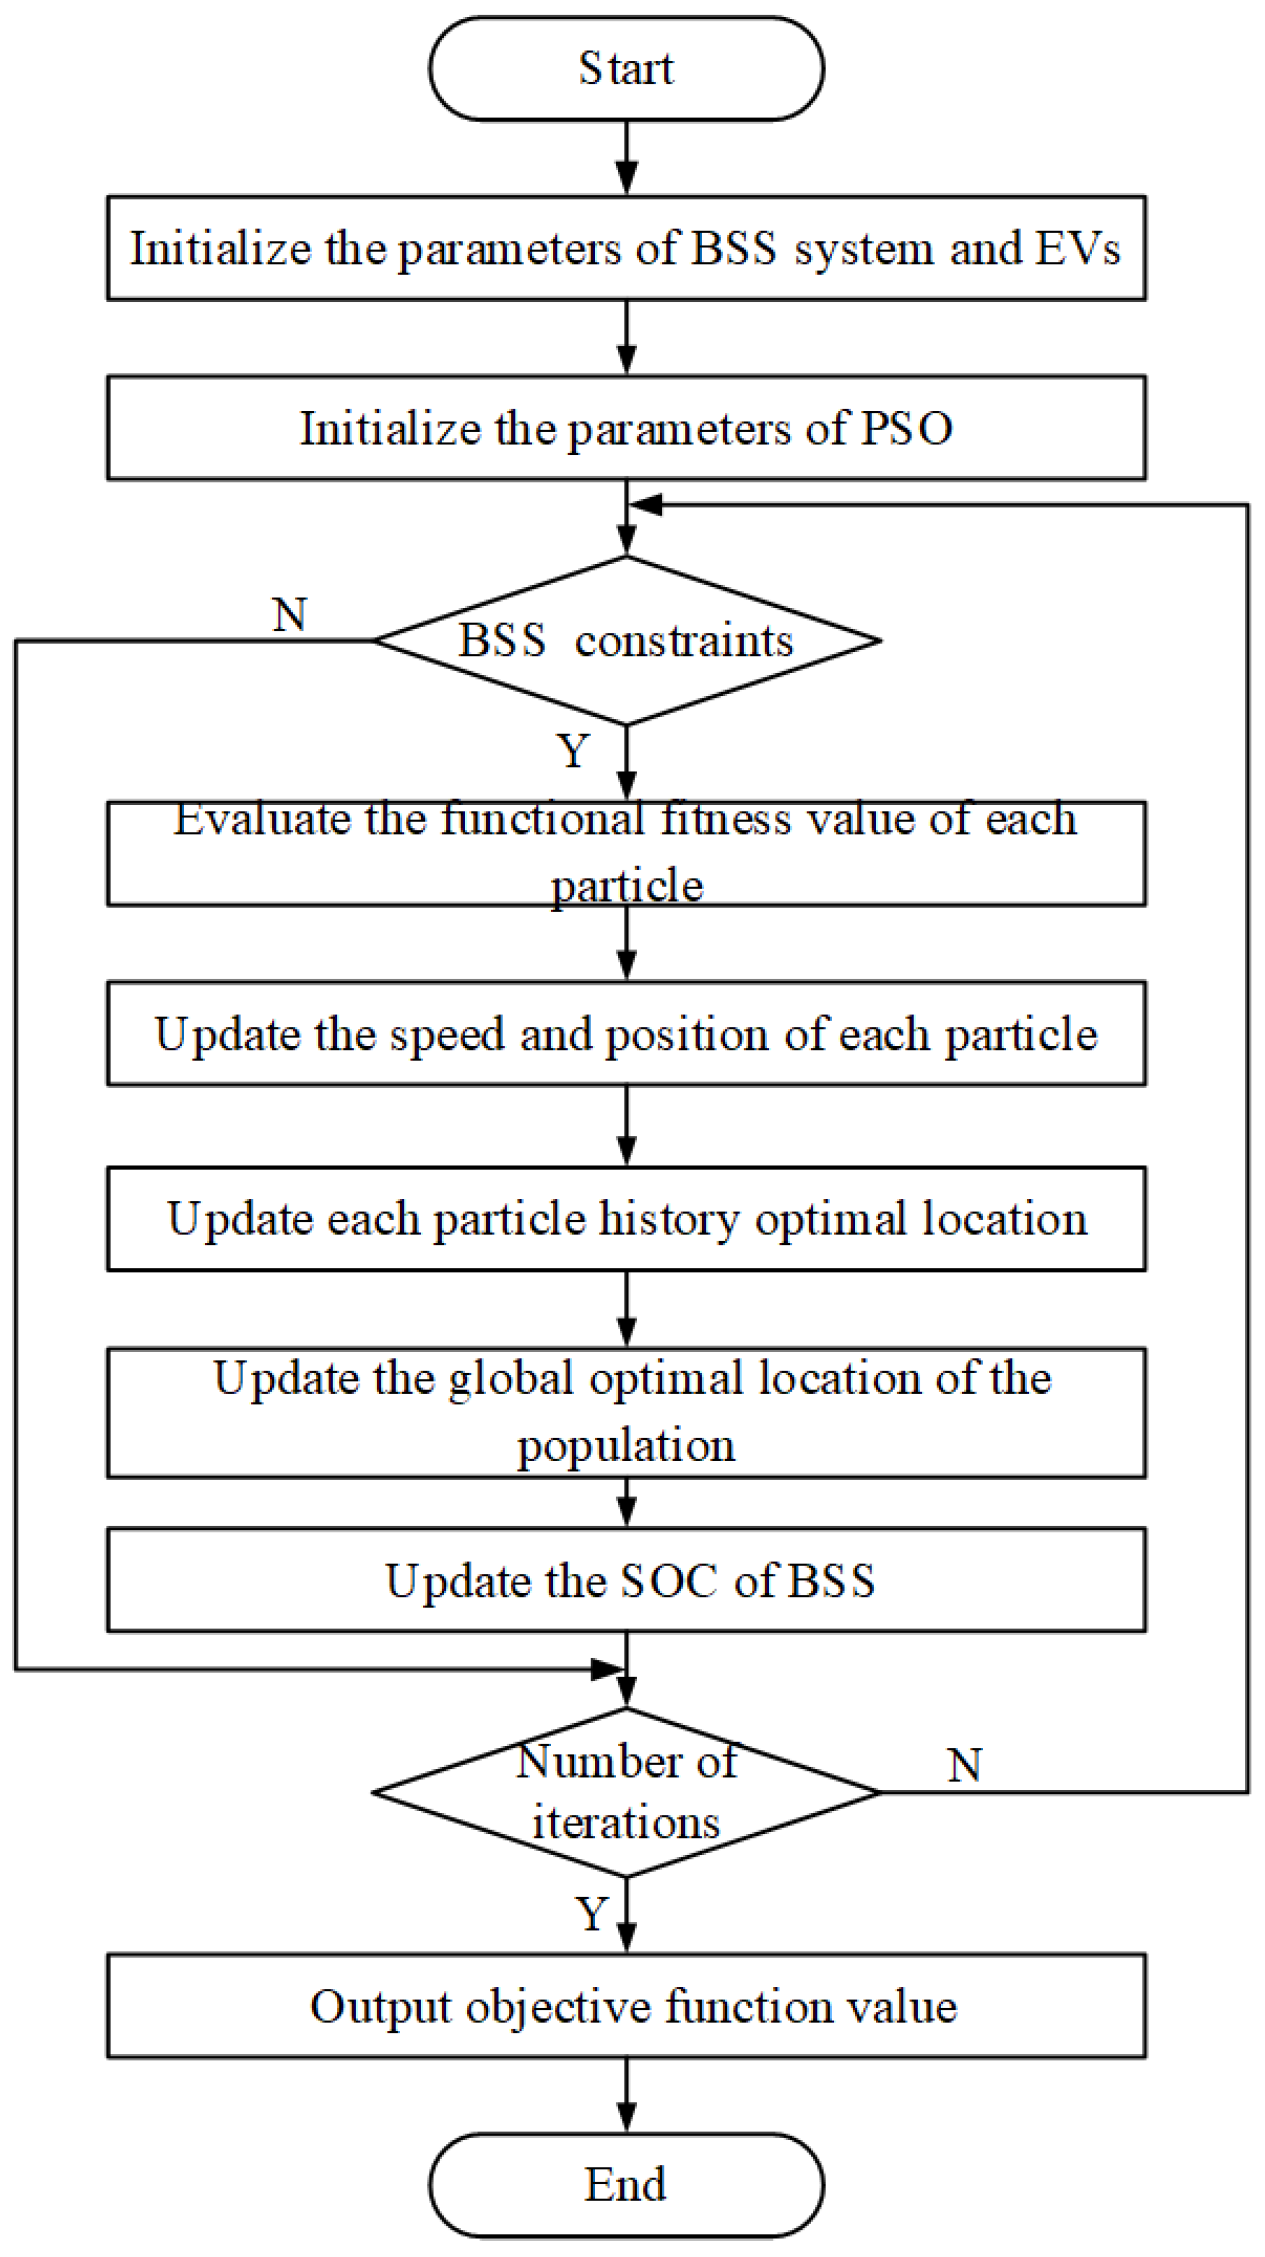
The solution process of the optimization model a day-ahead is shown in Figure 8, which firstly, initializes the parameters of BSS, EV and PSO, and then, judges whether the time constraints are satisfied or not. Under the premise of satisfying the constraints, the next step is to allocate the batteries according to the battery exchange priority function, and then the PSO algorithm is used to solve the model to realize the reasonable allocation of the batteries to serve the BSS efficiently, and finally, the optimization results are verified by iteration constraints, and the results are outputted after satisfying the conditions.
As show in the Figure 9, PSO conducts day-ahead optimization for the battery swapping station (BSS) based on battery swapping demand, frequency regulation assistance, and peak shaving and valley filling information, while adhering to constraints associated with battery swapping. The outcome of the PSO day-ahead optimization is the charging and discharging profile of electric vehicles, serving as a reference curve for intraday optimization.
In the Intraday phase, the Model Predictive Control (MPC) algorithm is used. The MPC algorithm, compared to traditional algorithms, has the ability of multi-objective optimization, the ability to perform online rolling optimization in real-time scenarios, and the flexibility to adjust according to the real-time scenarios, which significantly improves the dynamic responsiveness of the model.

4. Simulations and Analysis

4.1. Experimental Parameters and Environment

In this paper in order to verify the validity of the model, scenarios are set up for forecast-based optimal scheduling in the day-ahead phase of the BSS and intraday real-time scheduling optimization. In these two scenarios, the BSS gains, battery charging and discharging power are compared and analyzed for each time interval. During the optimization process, the power exchanged between BSS and the power system is unrestricted. When the batteries in the BSS can meet the demand for power exchange, the BSS can provide the remaining power to the power system in each time interval, so that the BSS system can maximize its adjustment capability. The relevant parameters of this paper are shown in Table 1, Table 2 and Table 3. The data in this paper are set in accordance with the current average electricity price, road traffic condition and EV ownership in China, and the scenarios are virtual ones. In order to facilitate reading and communication with foreign readers, the exchange rate of RMB to USD is given: RMB 1 ≈ $0.137, and the initial SOC values of the battery power model of the electric vehicle studied in this paper are randomly distributed between 0.2 and 0.3. The maximum power of the charger in this article is 20 kW, and the charging type is fast DC charging. The maximum charging power of a single battery pack for battery swapping is 35 kW. The overall maximum power consumption of the BSS, considering lighting and charging consumption, is 1950 kW.

4.2. Experimental Procedure and Analysis

In this paper, the simulation is divided into 5 scenarios according to the battery swapping times and charging/discharging prices. Scenario 1: the predicted charging and discharging prices in the day-ahead and the actual charging and discharging prices in the intraday are the same, and the day-ahead-intraday peak shaving and valley filling gain is unchanged; Scenario 2: the number of battery swapping times in the day-ahead decreases in 30%, and all other conditions are unchanged; Scenario 3: the battery swapping times in the Intraday grows in 30%, and all other conditions are unchanged; Scenario 4: the discharge prices in the Intraday increase in 25%, and all other conditions are unchanged; Scenario 5: the charging prices in the Intraday increase in 25%, and all other conditions are unchanged.
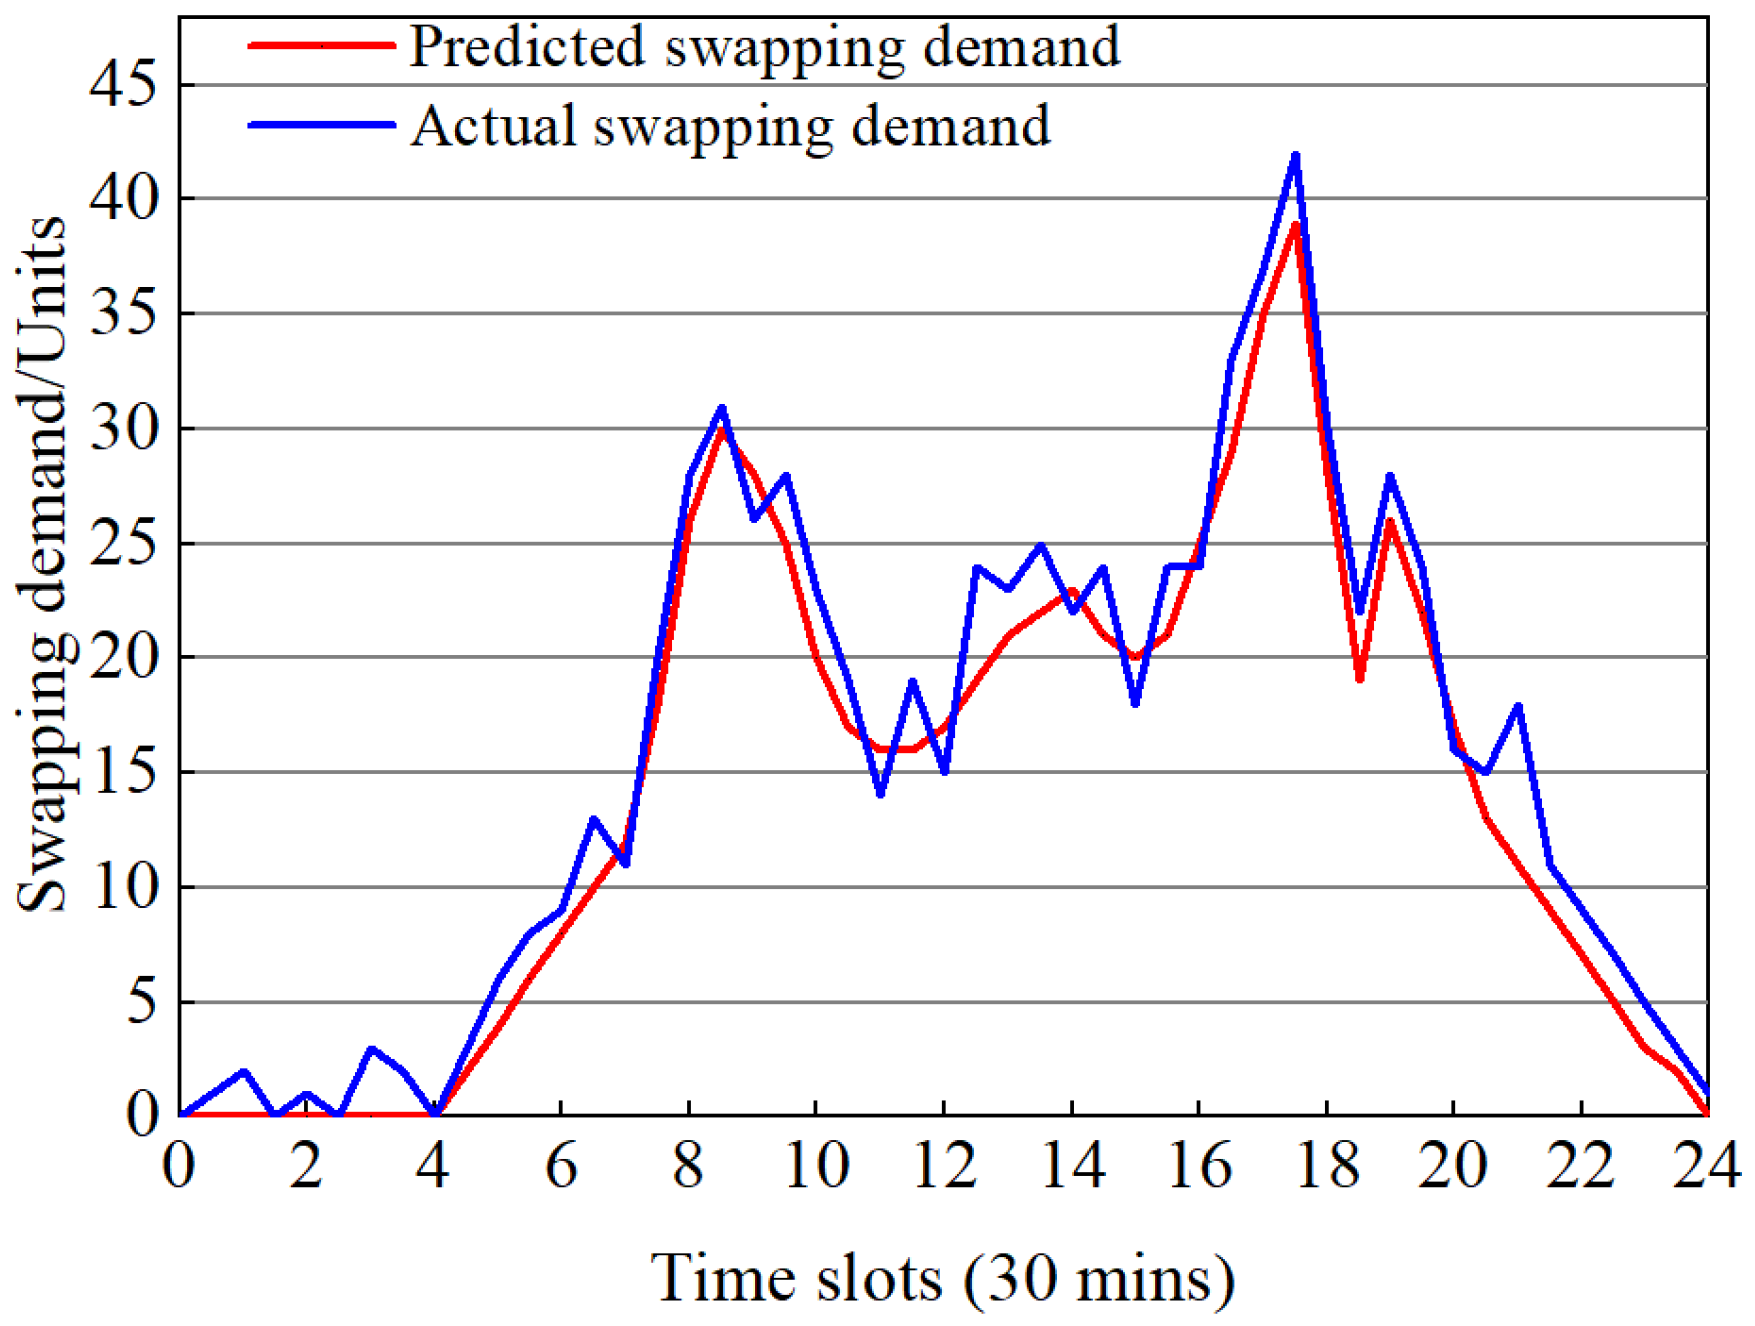
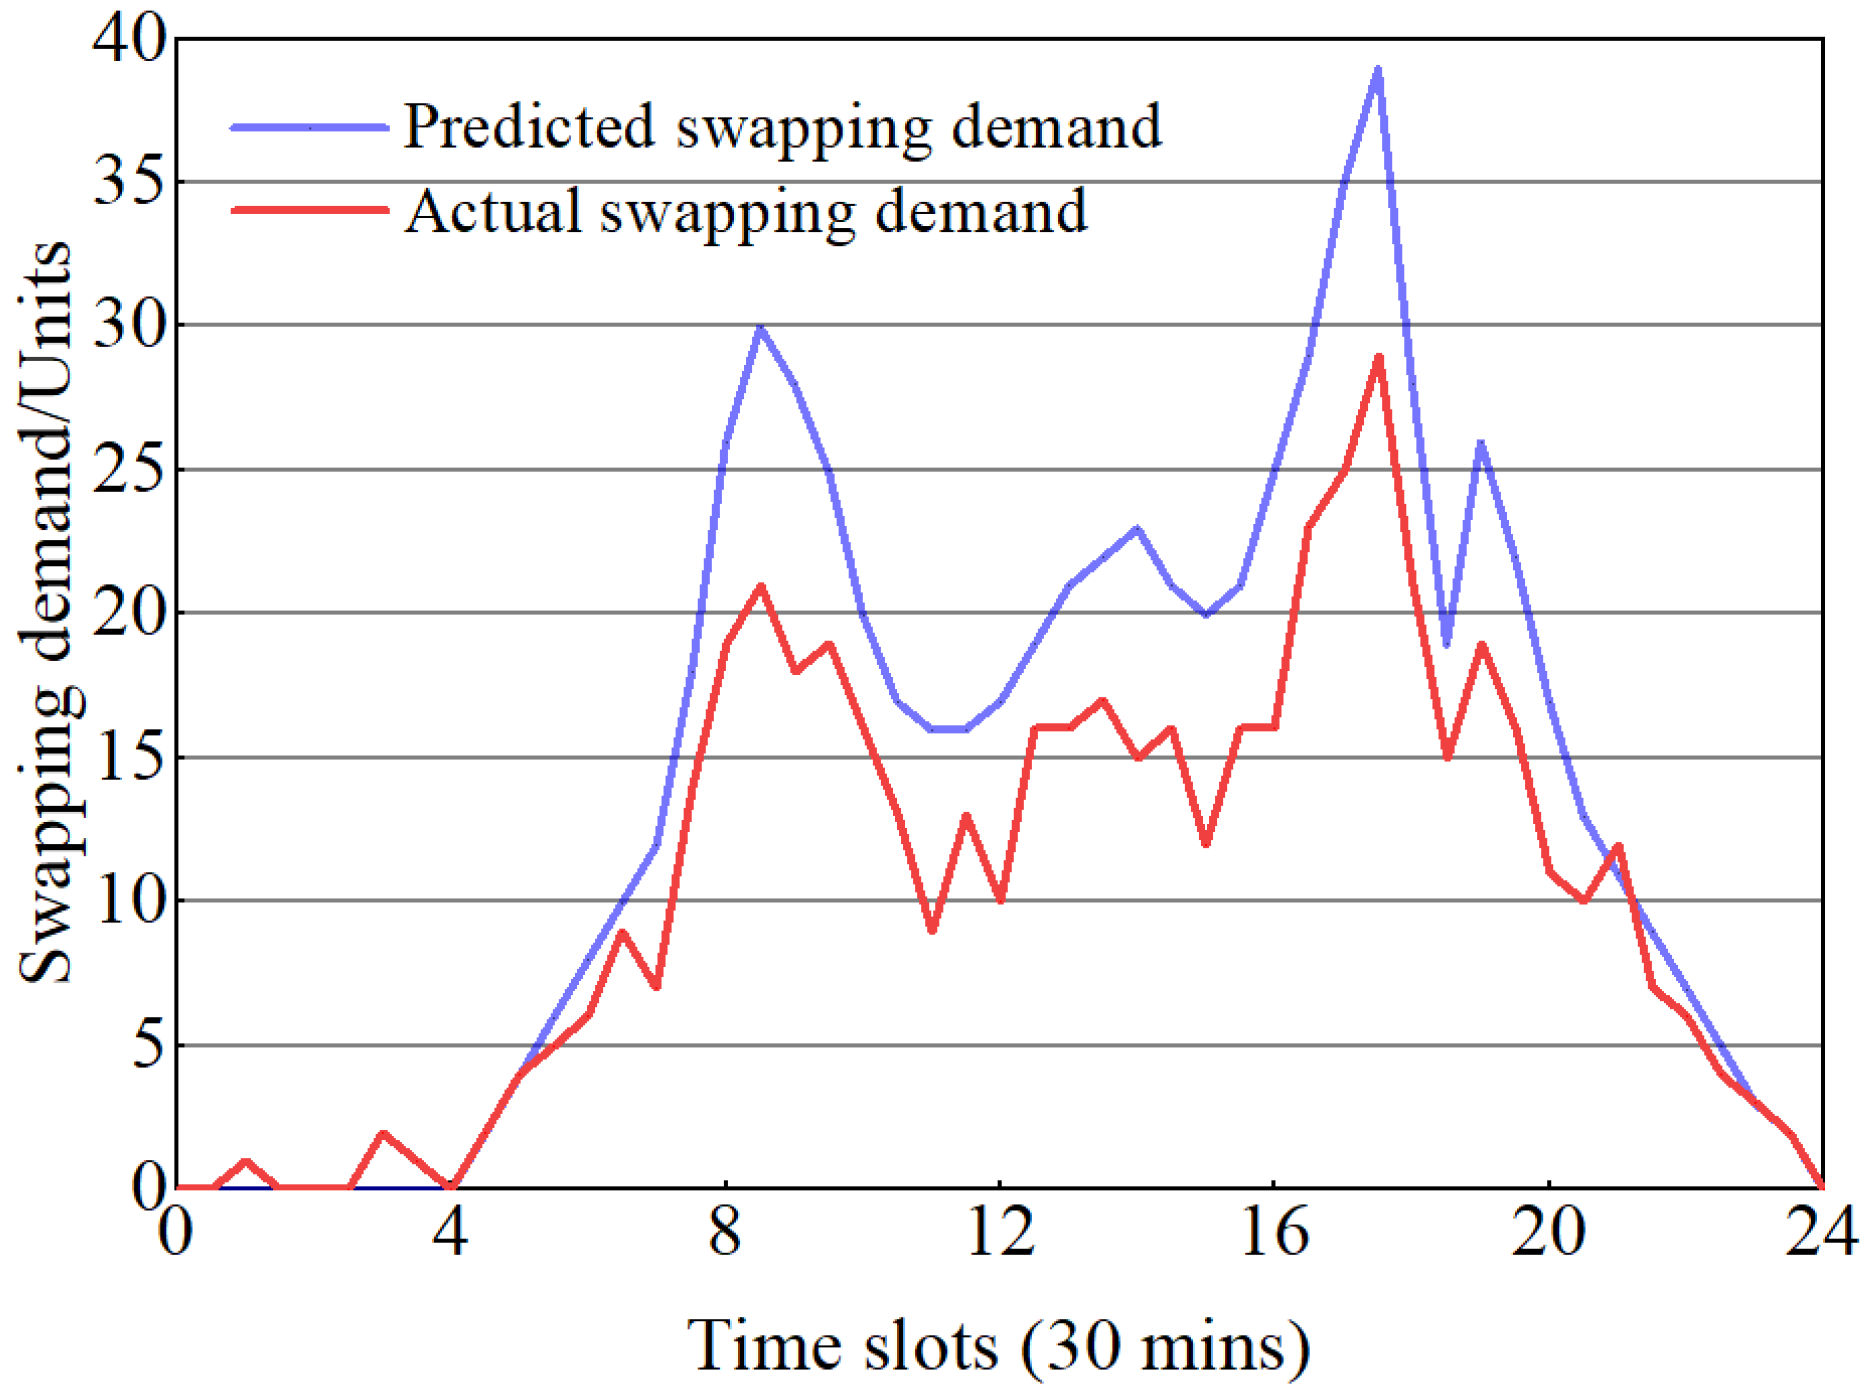
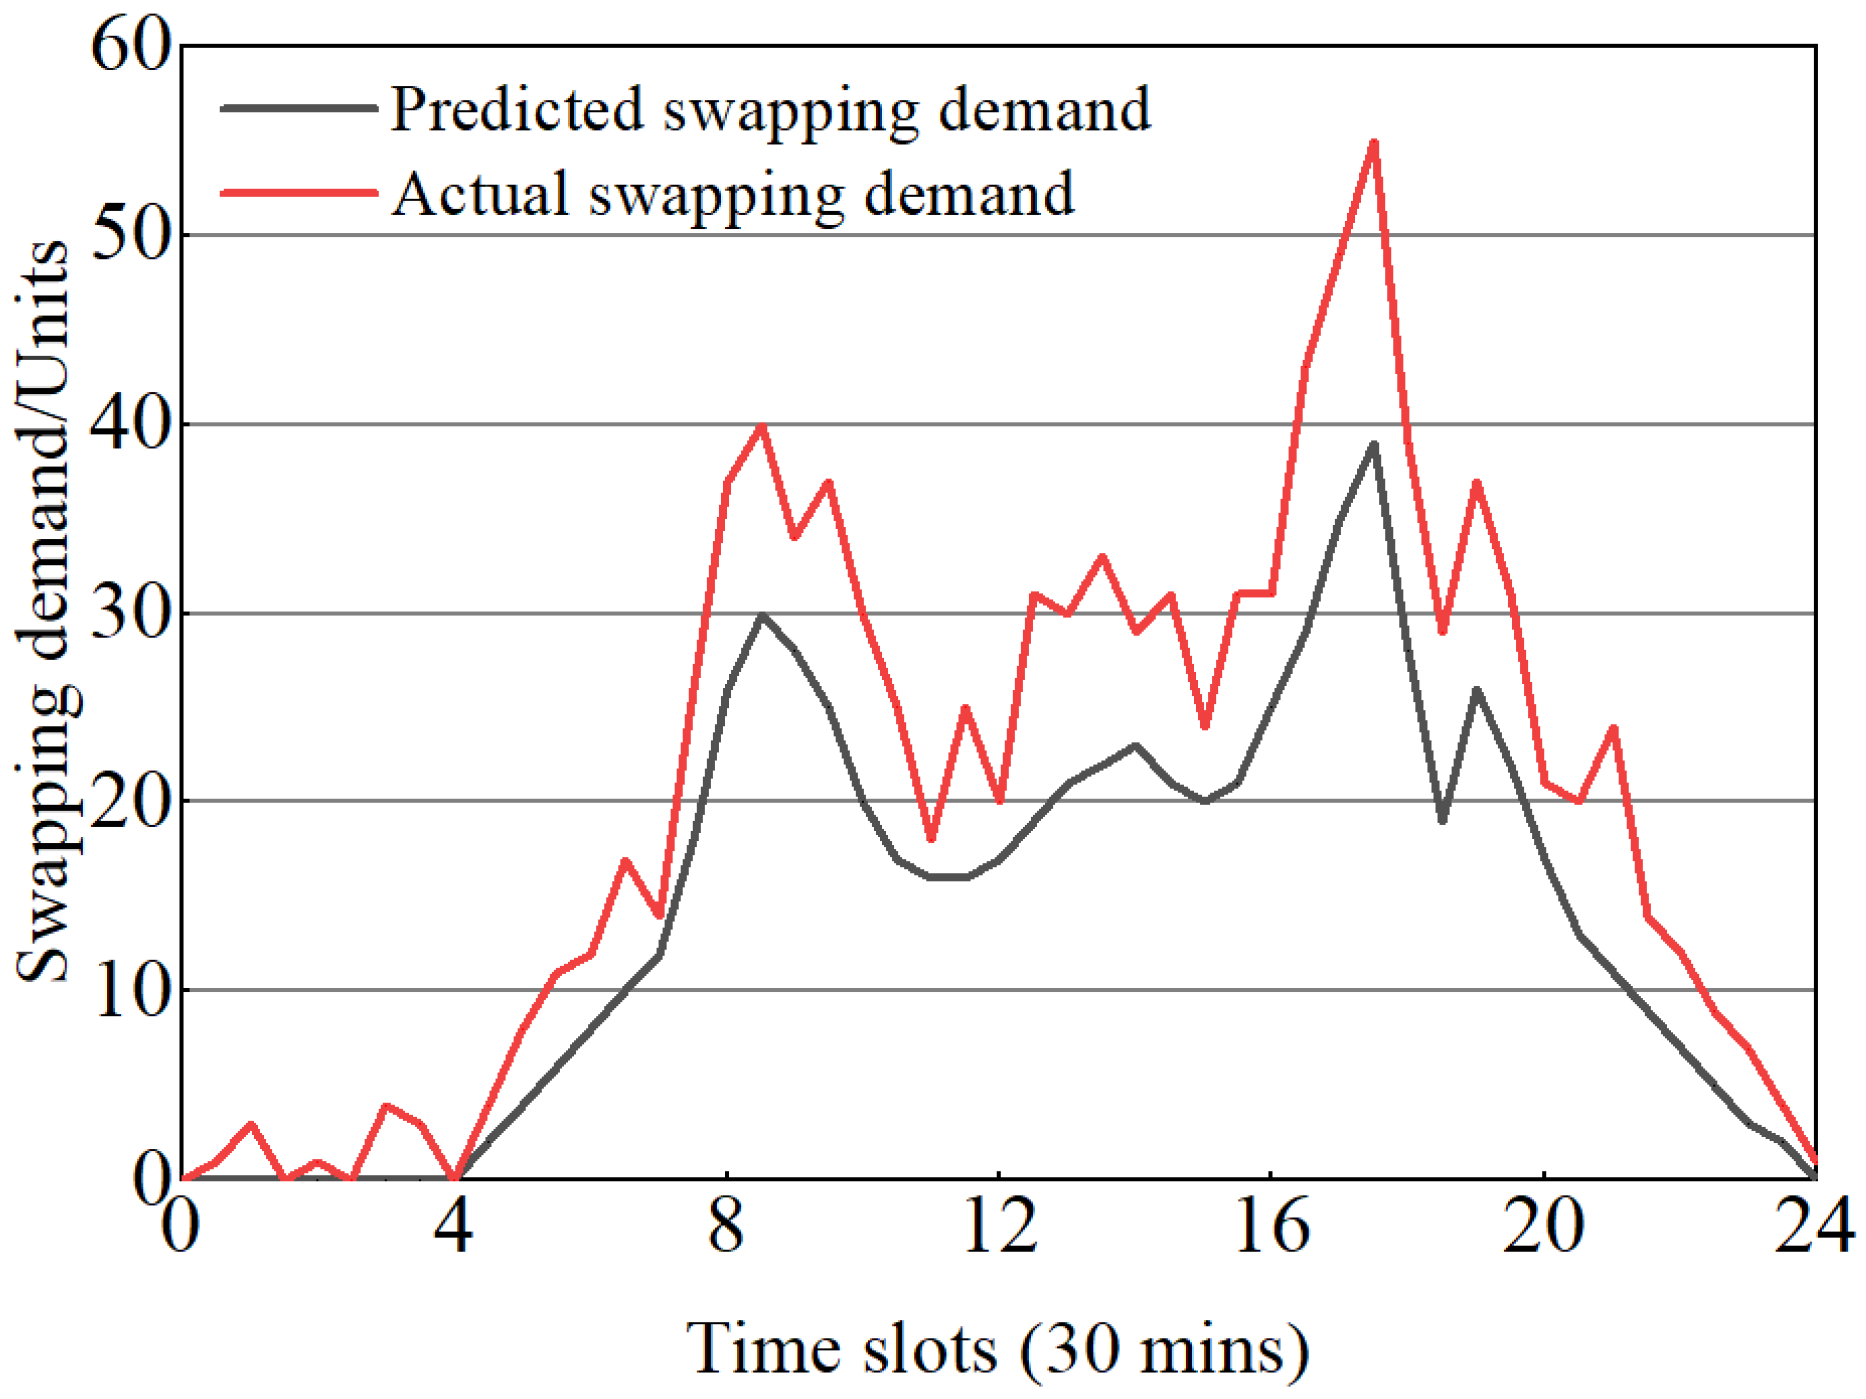
As can be seen from Figure 10, the connection between the two curves, that is, the forecast curve of the next day’s battery swapping times in the day-ahead and the curve of the actual battery swapping times in the Intraday, that is, the actual battery swapping times in the Intraday curve and the forecast curve of the day-ahead battery swapping times are found to be inconsistent at the time of 0:00–24:00, which highlights the uncertainty of the real-time battery swapping times and indirectly illustrates the importance of the Intraday optimization, and it is found that the actual battery swapping times within the Intraday time slots tends to change with the trend of the day-ahead battery swapping times prediction curve, indicating that the day-ahead battery swapping times prediction is quite referable.
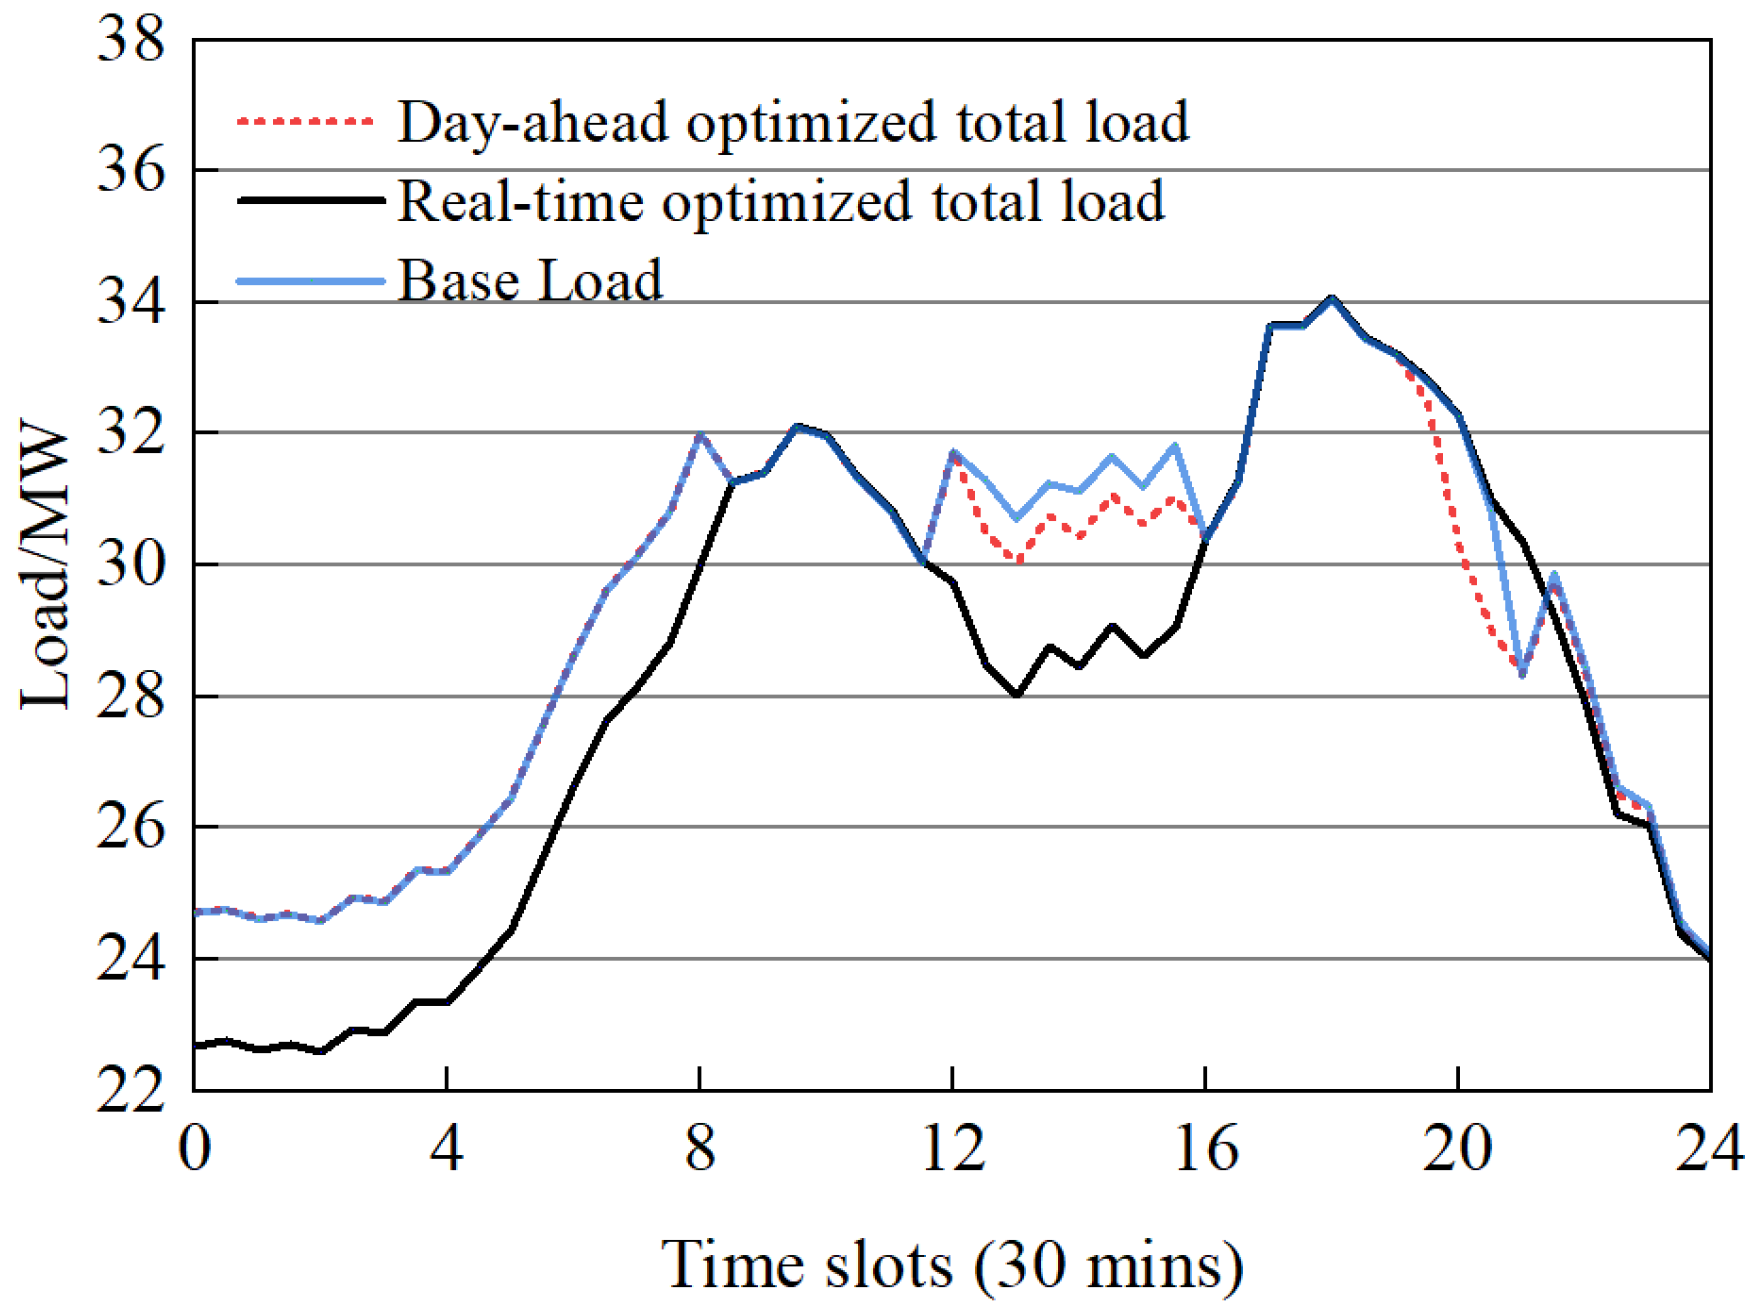
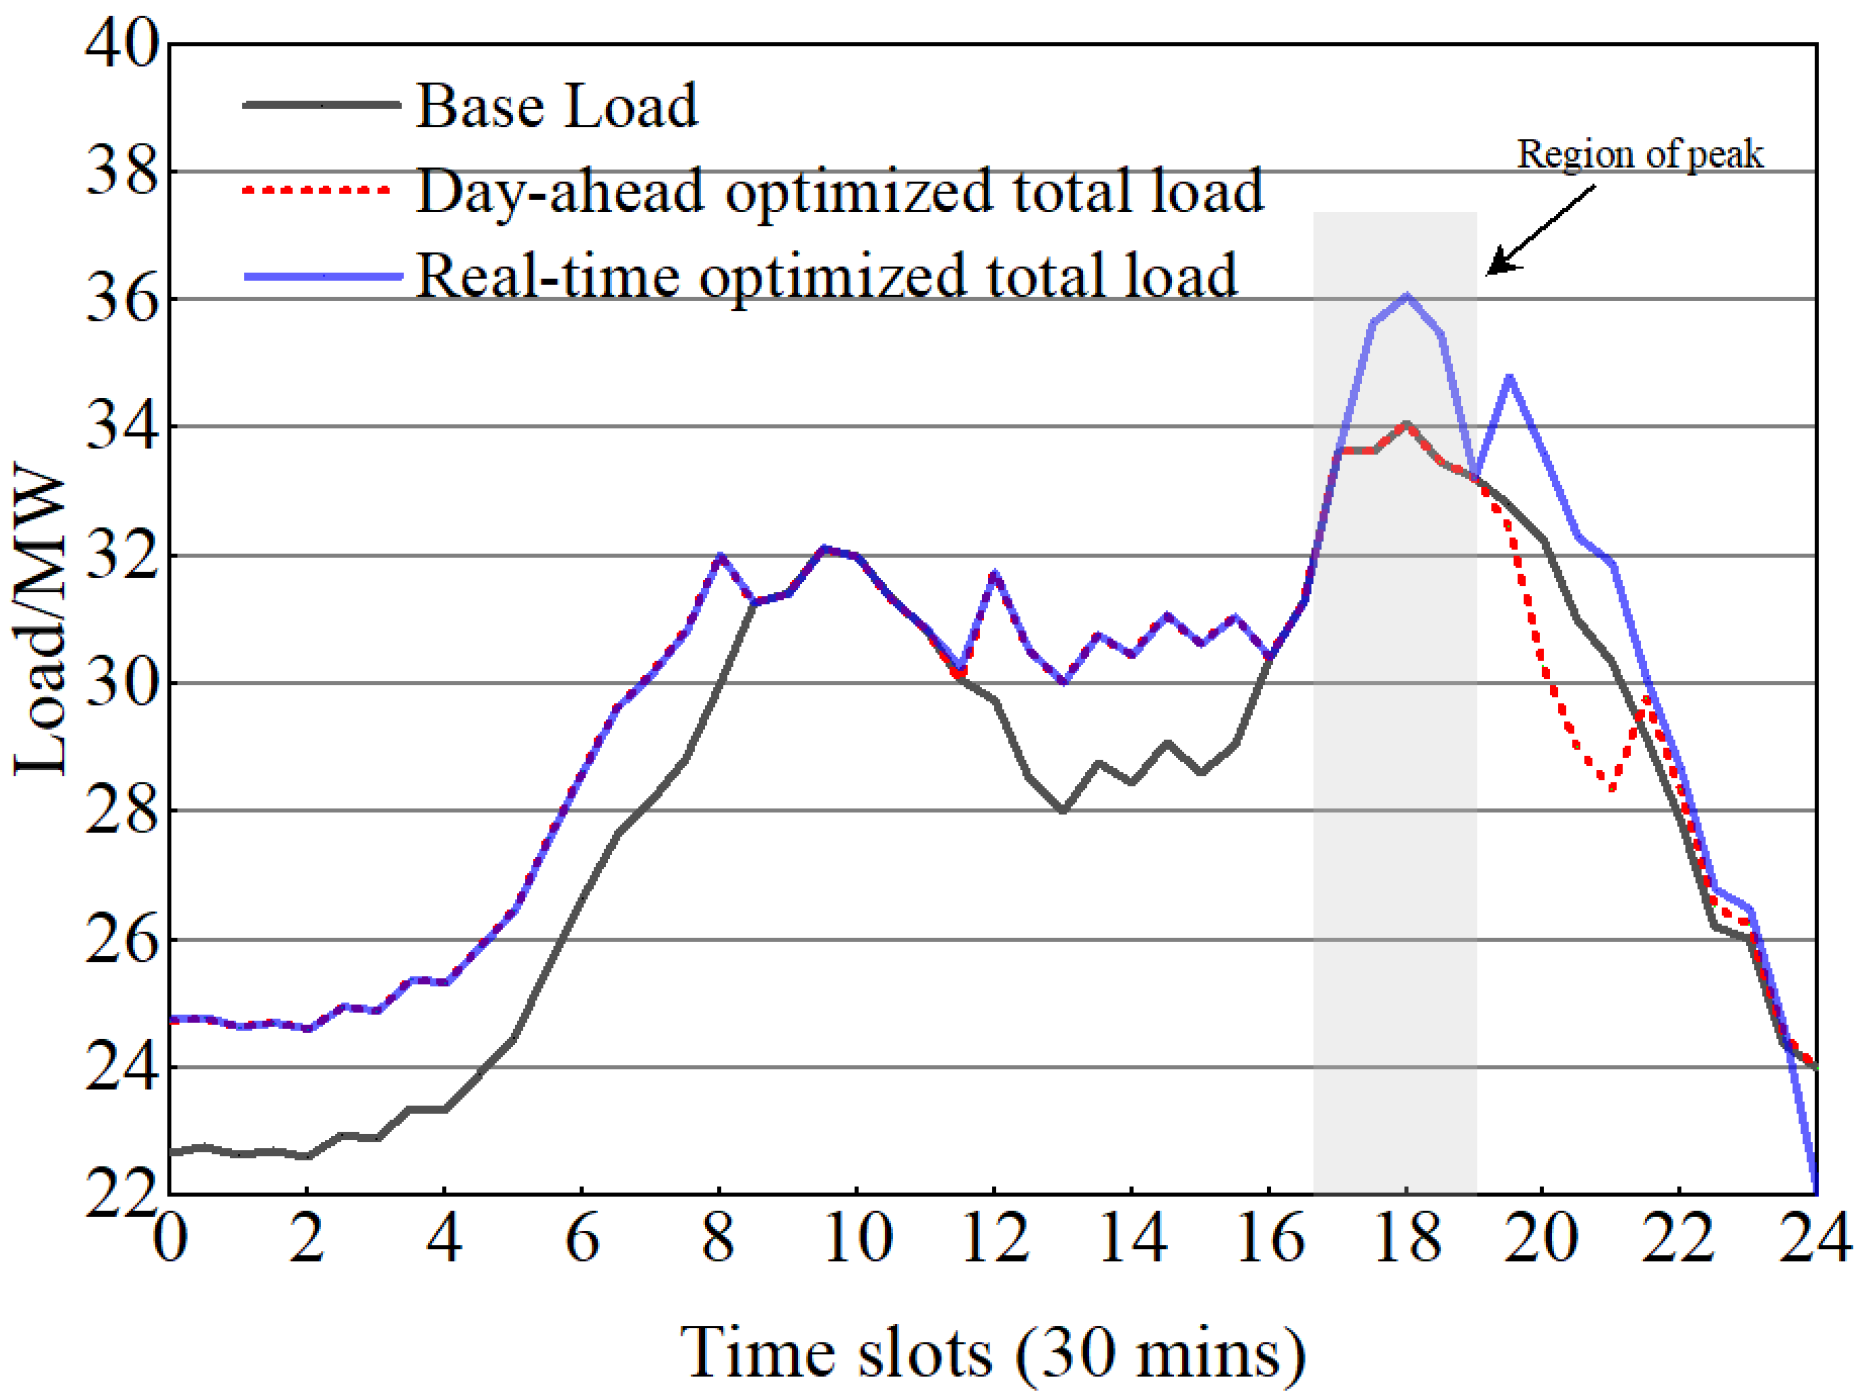
As can be seen in Figure 11, the comparison of day-ahead-intraday stacked load curves in 0:00–12:00 a.m., in which the day-ahead optimized and intraday real-time optimized load curves are the same, because the chargers are charging with the maximum power during the low tariff period of 0:00–8:00 a.m. The peak load of the stacked loads in 8:30–11:30 a.m., which is the high-price period of charging tariff, and because the Intraday-optimized BSS model can meet the real-time swapping demand, so both Intraday and day-ahead optimized BSS models choose to resting charging and discharging.
From 12:00–16:00 hours, the Intraday optimization curve is significantly higher than the day-ahead optimization curve, which is due to the factor of real-time vehicle queuing taken into account in Intraday optimization, and higher power charging is performed in this period; from 16:00–19:00 hours, no charging and discharging operations are performed in this period, as Intraday optimization scheduling of the BSS can meet the actual demand; from 19:00–21:00 hours, the Considering that the actual number of swapping batteries is more than the day-ahead, the Intraday real-time optimization only carries out peak shaving and valley filling operations between 20:30 and 21:00 hours; at 21:00–24:00 hours, since the difference in the number of vehicles swapping batteries is not large, the stacked load curves of the day-ahead optimization and Intraday optimization at this time are roughly the same.
Comparison between the stacked load curves of day-ahead optimization and Intraday optimization shows that Intraday online optimization can take into account the impact of real-time battery swapping times on the load balance of the grid, and it can solve the impact of charging loads generated by day-ahead optimization on the power system, thus reducing the pressure on the power system.
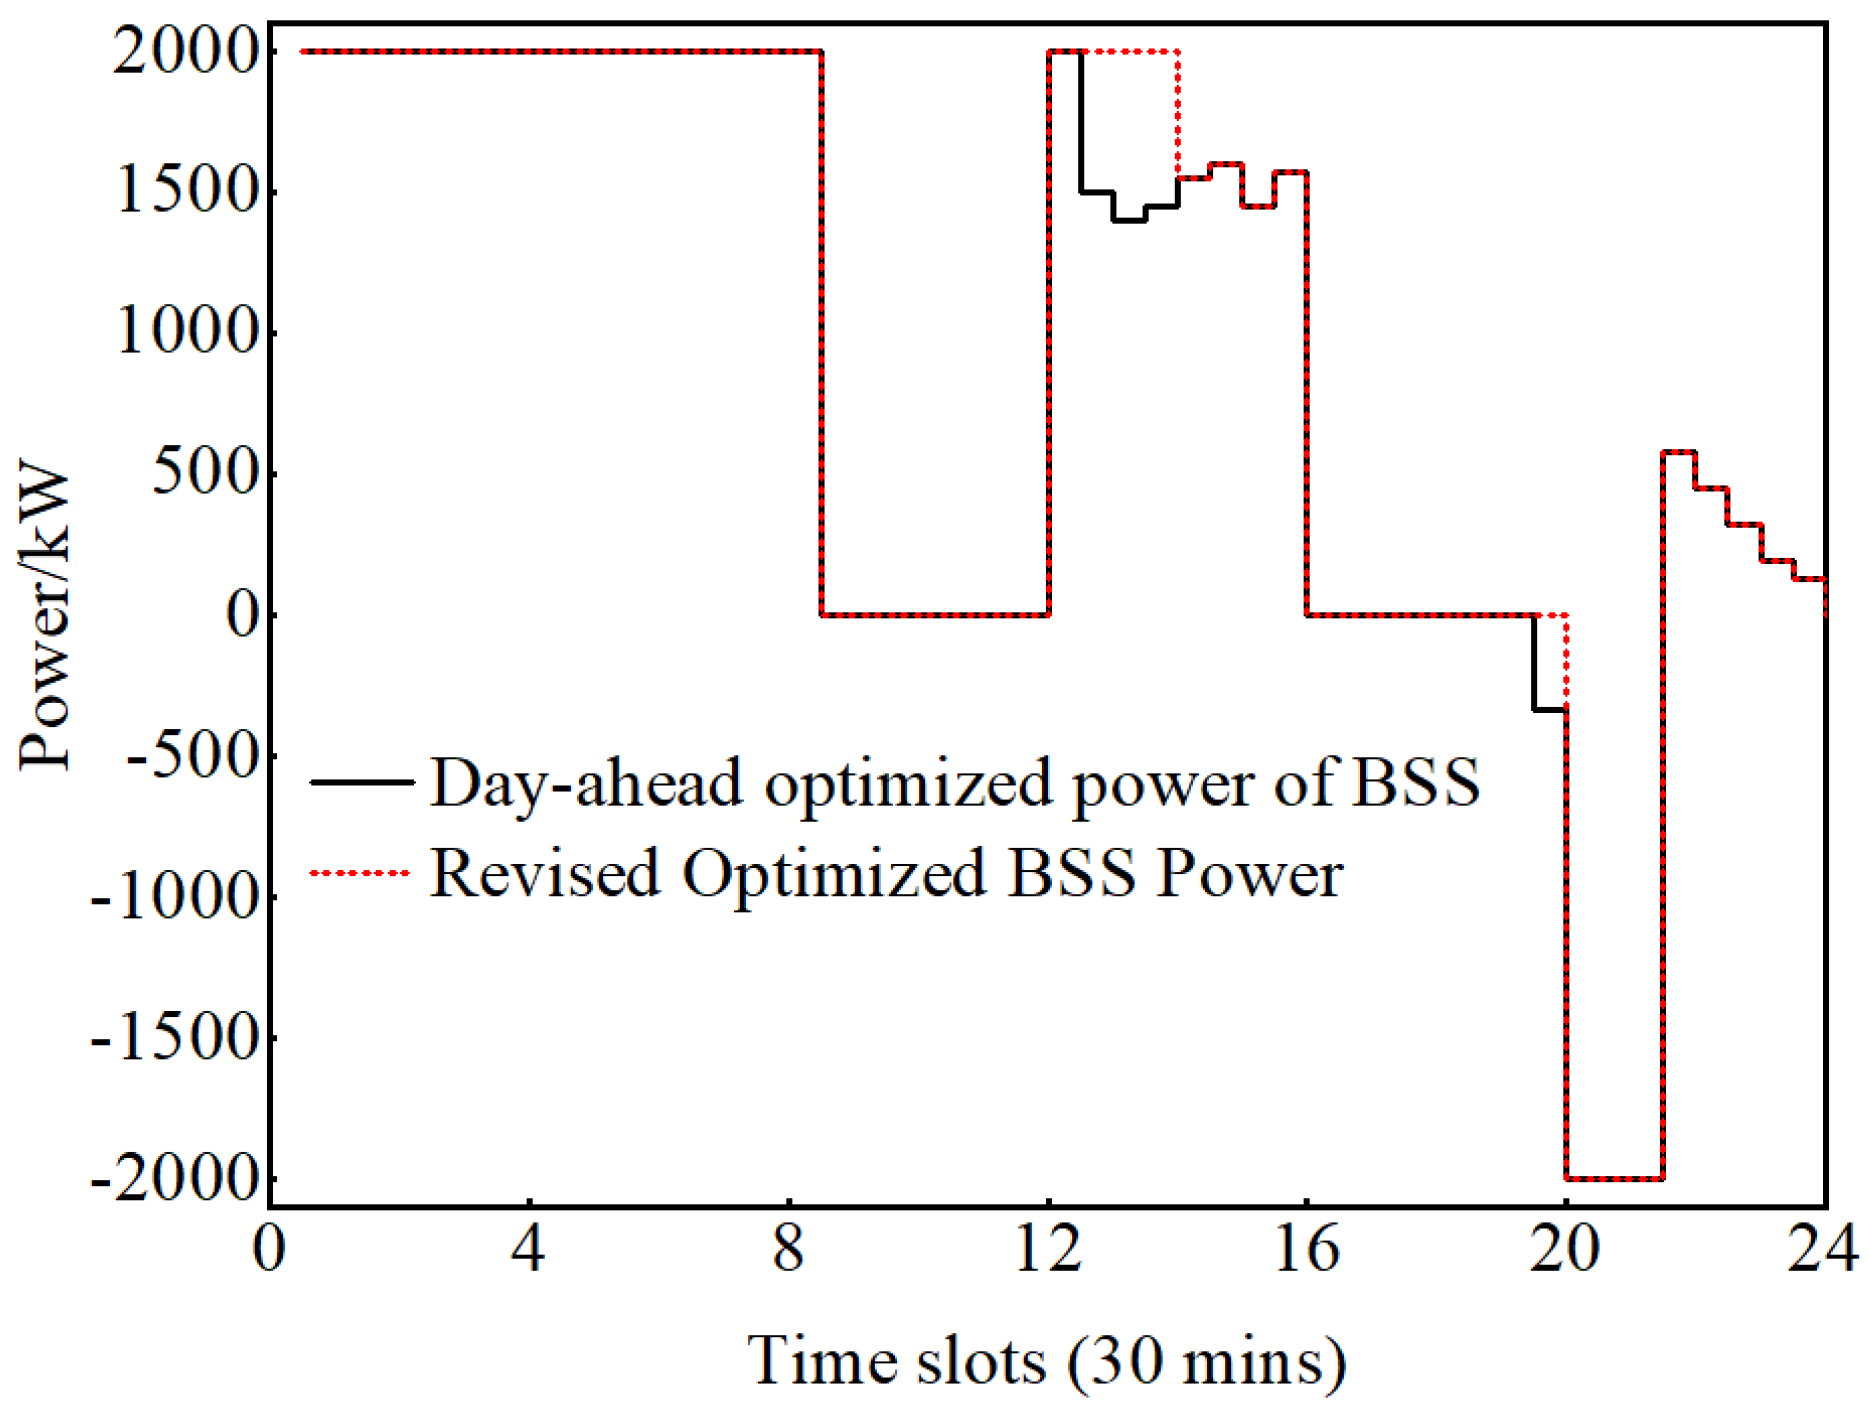
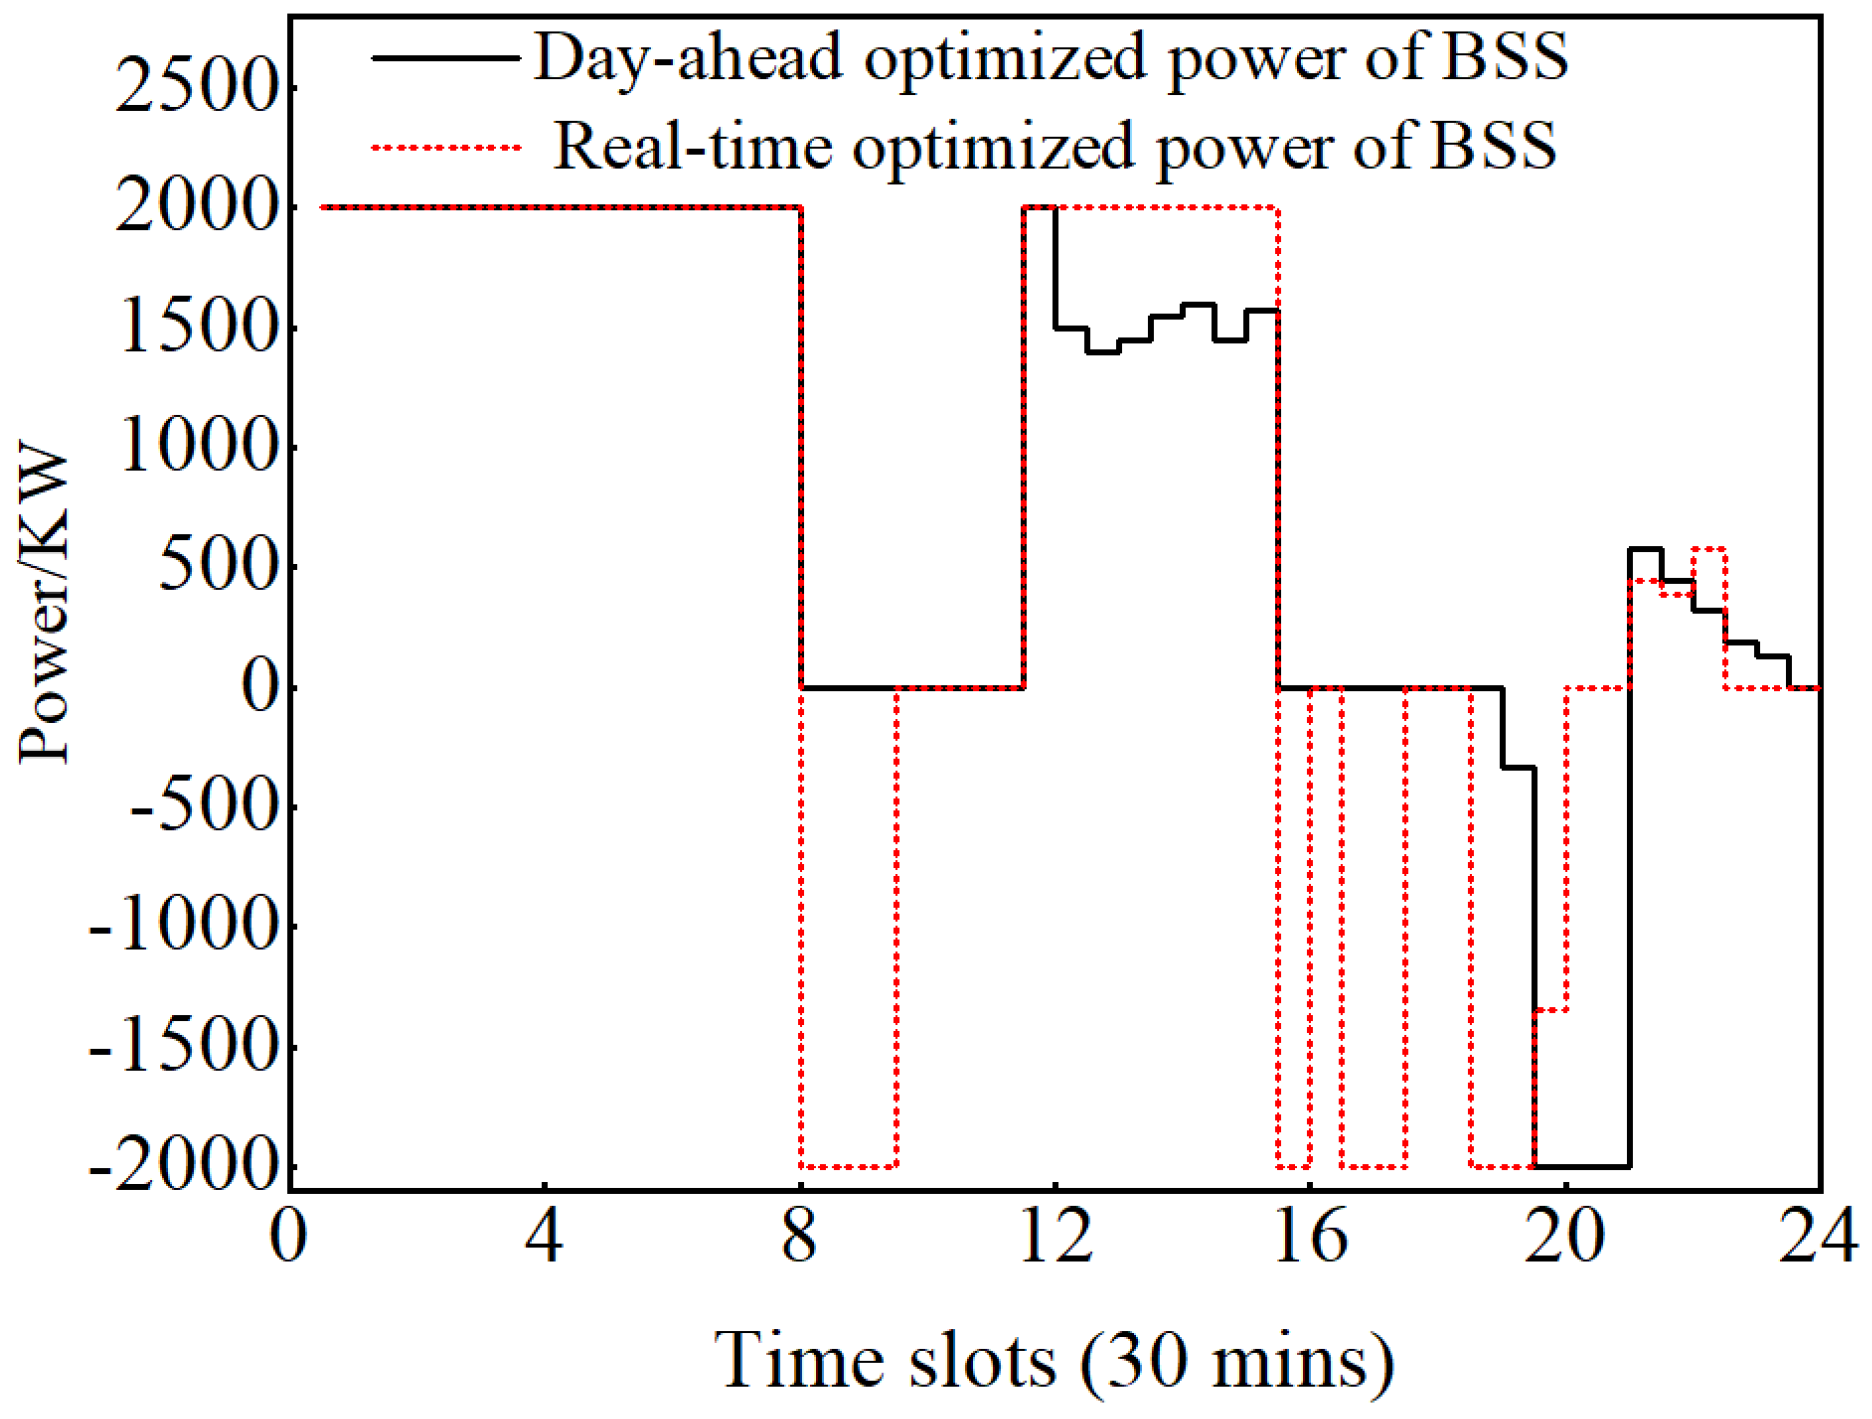
Figure 12 and Figure 13 show the power comparison between the day-ahead optimization and the Intraday optimization of BSS, it is found that the power cost is lower within 0:00–8:00 hours, both day-ahead optimization and Intraday optimization perform maximum power charging in this time period; within 8:00–12:00 hours, although the actual intraday battery swapping times are more than the day-ahead in this time period, through the online updating of MPC algorithm based on the BSS real-time battery swapping times to update the charging and discharging reference curve at 12:00–24:00 hours, it can move the load of 29 extra swapping batteries in the 0:00–12:00 time period for Intraday real-time optimization to the charging and discharging curve at 12:00–24:00 hours.
During 12:00–15:30, the Intraday optimization uses maximum power charging compared to the Day-ahead optimization to cope with the queuing swapping cost during 0:00–15:30 and the peak load of the power system during 16:00–21:00; during 16:00–19:00, both the Day-ahead and Intraday optimizations choose to stop charging and discharging because of the higher charging cost and the peak of the base load at this time; Within 19:00–21:00 hours, since the actual battery swapping demand of the day-ahead optimization is smaller, the BSS of the day-ahead optimization keeps discharging from 19:00–21:00 hours, and the Intraday real-time optimization is much smaller than the day-ahead optimization in terms of discharging time and power because its actual swapping demand is larger than the day-ahead predicted value; at 21:00–24:00 hours, the BSS charging and discharging power curve in the Intraday real-time period is higher than the day-ahead charging and discharging power curve because the number of swapping trips in the Intraday real-time period is larger than the day-ahead predicted value. The BSS charging and discharging curves in the Intraday real-time period are higher than the day-ahead charging and discharging power curves because the Intraday real-time battery swapping times are more than the day-ahead predicted battery swapping times.
Figure 14 shows the reference curve of MPC optimized charging and discharging power at 12:30 using second-order cone programming (SOCP) algorithm. After 12:30 hours, the Intraday real-time battery swapping times are 27 more than the day-ahead battery swapping needs, so the BSS power allocation at 12:30–13:30 hours is obviously different, because the charging tariff within the 12:30–13:30 hours is RMB 1.07/kWh, and in order to satisfy the actual Intraday battery swapping times, the MPC on-line optimization chooses to charge at full power, even though this time is not a low valley tariff. During the 19:30–20:00 time period, in order to meet the actual battery swapping demand during the Intraday, the BSS chooses to stop discharging.
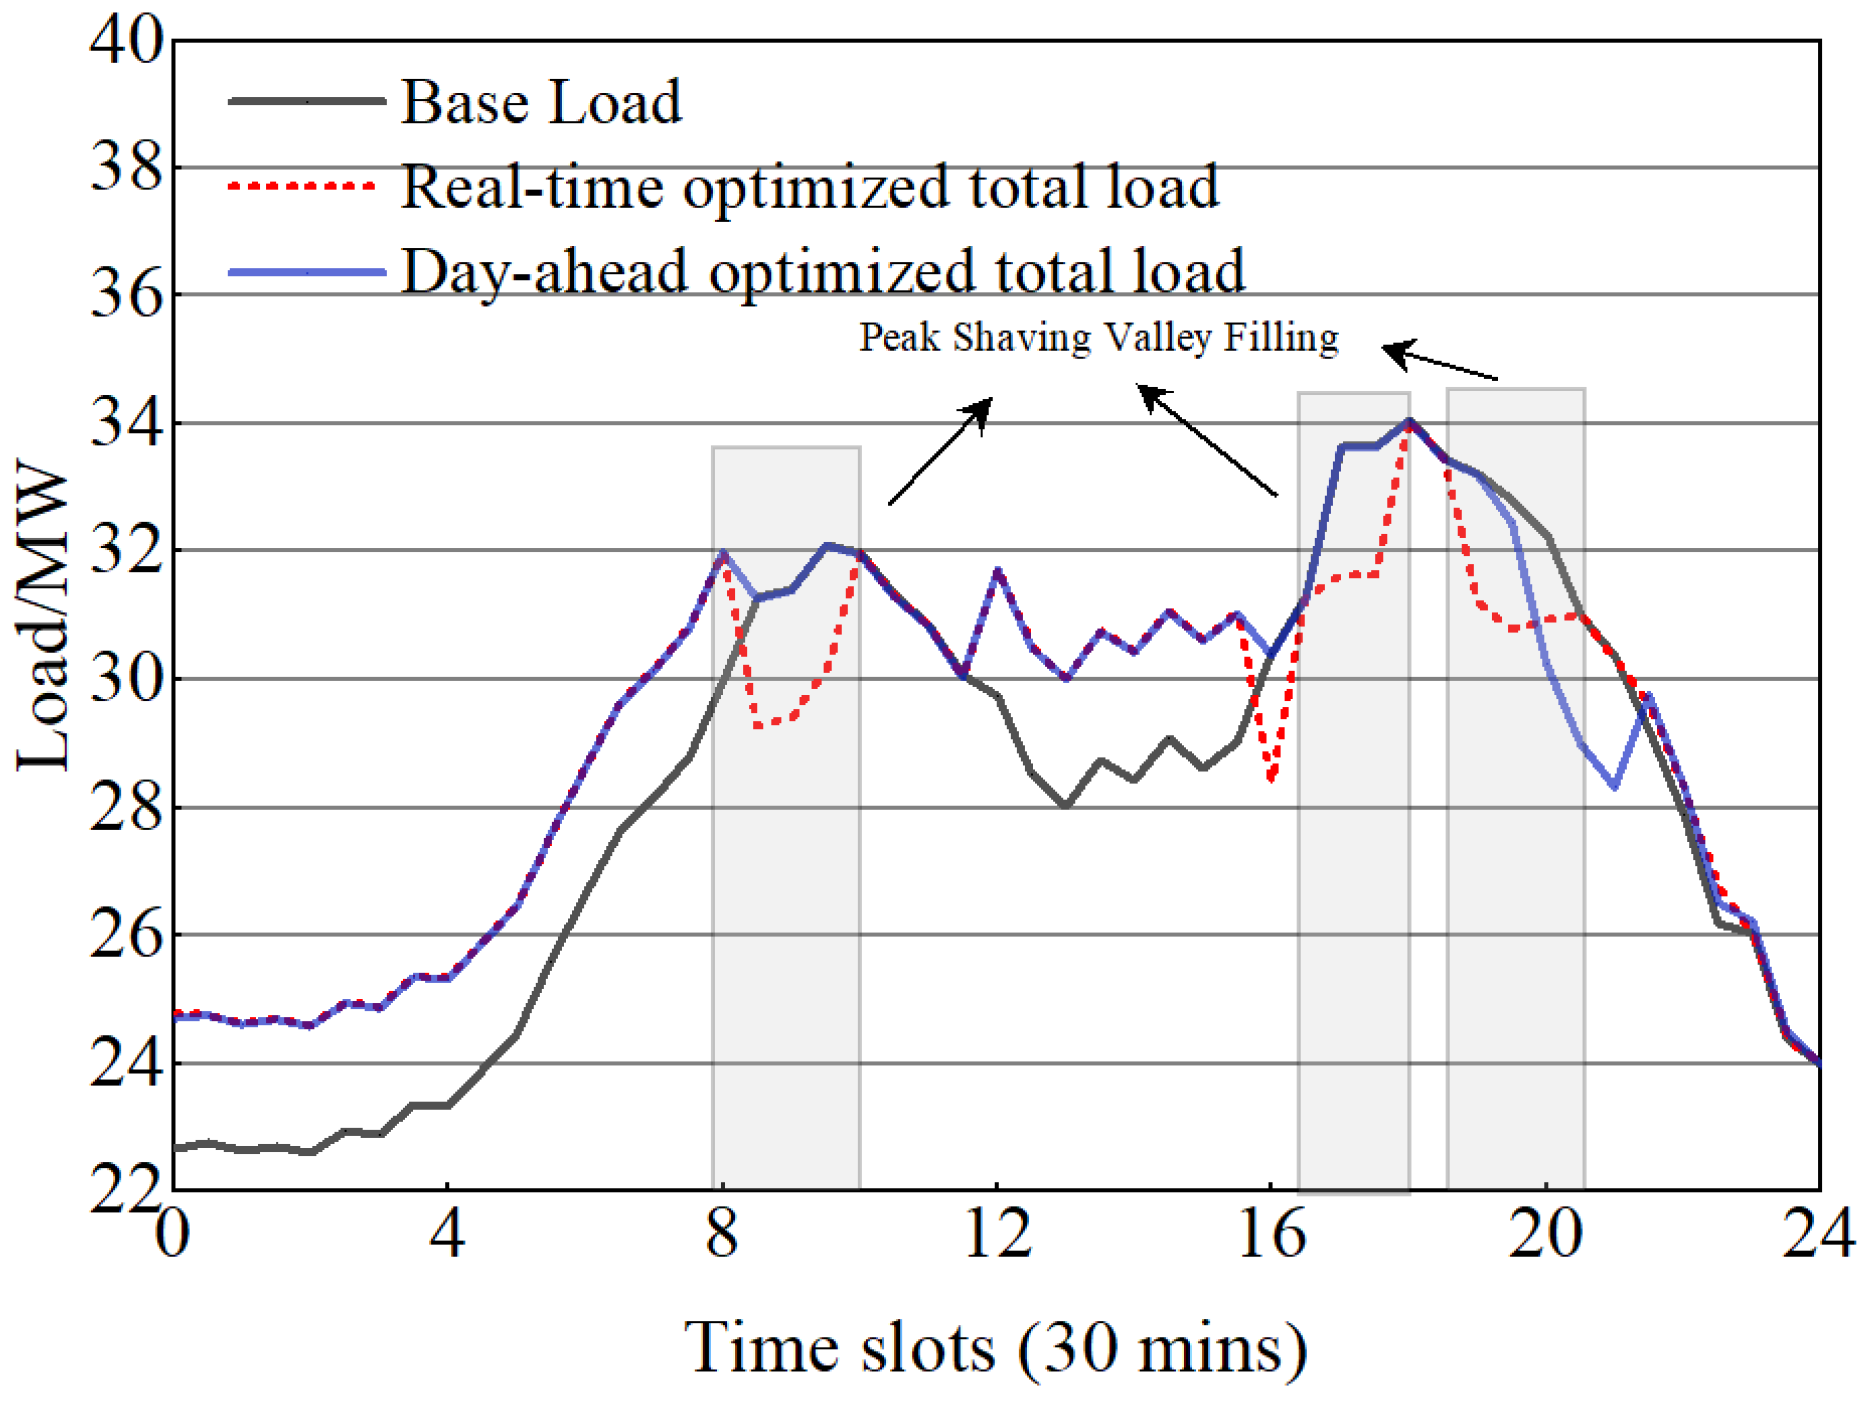
Figure 15 shows the Intraday real-time battery swapping times decreasing in 30%, and Figure 16 and Figure 17 show the Intraday real-time power and battery swapping times of the MPC online optimization algorithm in the case of total Intraday battery swapping times decreasing in 30%, and it can be seen from Figure 16 and Figure 17 that within the hours of 0:00–8:00, the Intraday and day-ahead optimization selects high power charging due to the low charging tariffs in this time. Peak shaving and valley filling operations were performed during 8:30–10:00 hours due to the reduced demand for swapping, and the actual battery reserves were able to meet the actual swapping demand, which significantly reduced the peak load of the peak load of the power system overload from 8:00–10:00 hours and alleviated the potential risk of overloading the power system. Similarly, peak shaving and valley filling operations were performed during 16:30–18:00 hours and 18:30–21:30 hours. It is shown that the online updated day-ahead-intraday two-layer optimization model has the ability to make corresponding adjustments according to the actual situation, and has a certain extent of flexibility to complete the regulation of the power system balance under the condition of meeting the real-time swapping demand.
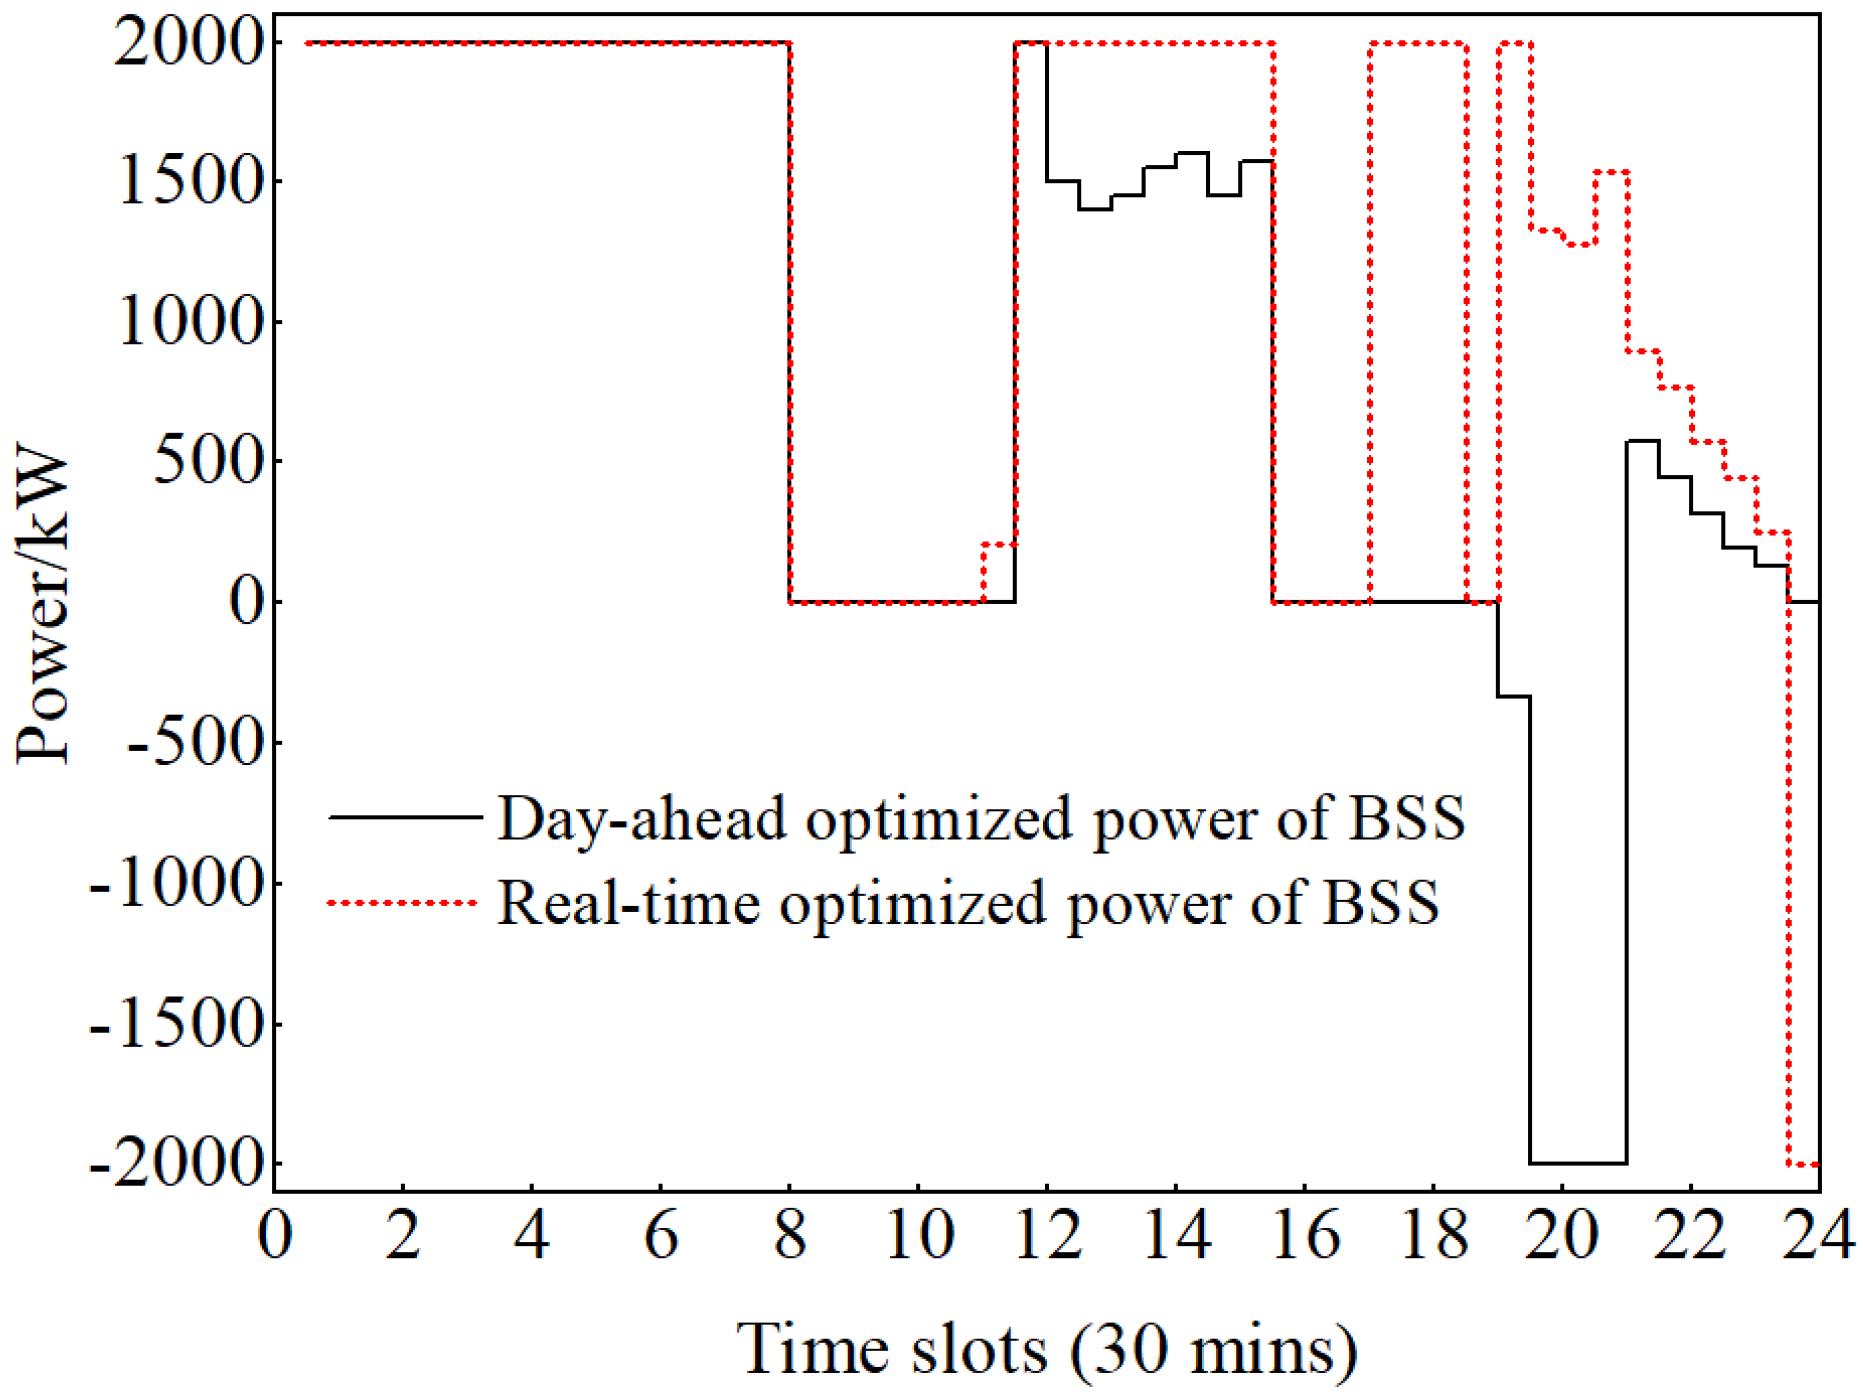
Figure 18 shows a comparison of the day-ahead-intraday battery swapping times graph for a 30% increase in Intraday battery swapping times. As can be seen in Figure 19 and Figure 20, within 8:00–12:00 hours when the actual battery swapping times during the Intraday increase up to 30%, because the price of charging electricity is higher at this time and the vehicle queuing for battery swapping incurs a punishment cost, the Intraday optimization aims to satisfy the demand of the vehicle for battery swapping times, and the BSS stops charging and discharging the batteries. Similarly, within 17:00–21:30 hours, to meet the real-time battery swapping demand, the stacked load for intraday optimization increases, which can adversely affect the load balance of the power system, indicating that the BSS can only achieve real-time response to the power system if the real-time intraday battery swapping times do not exceed the corresponding range, and also indicating that the BSS in simultaneous response to the demand for the load balance of the power system and real-time vehicle battery swapping demand have Some limitations.
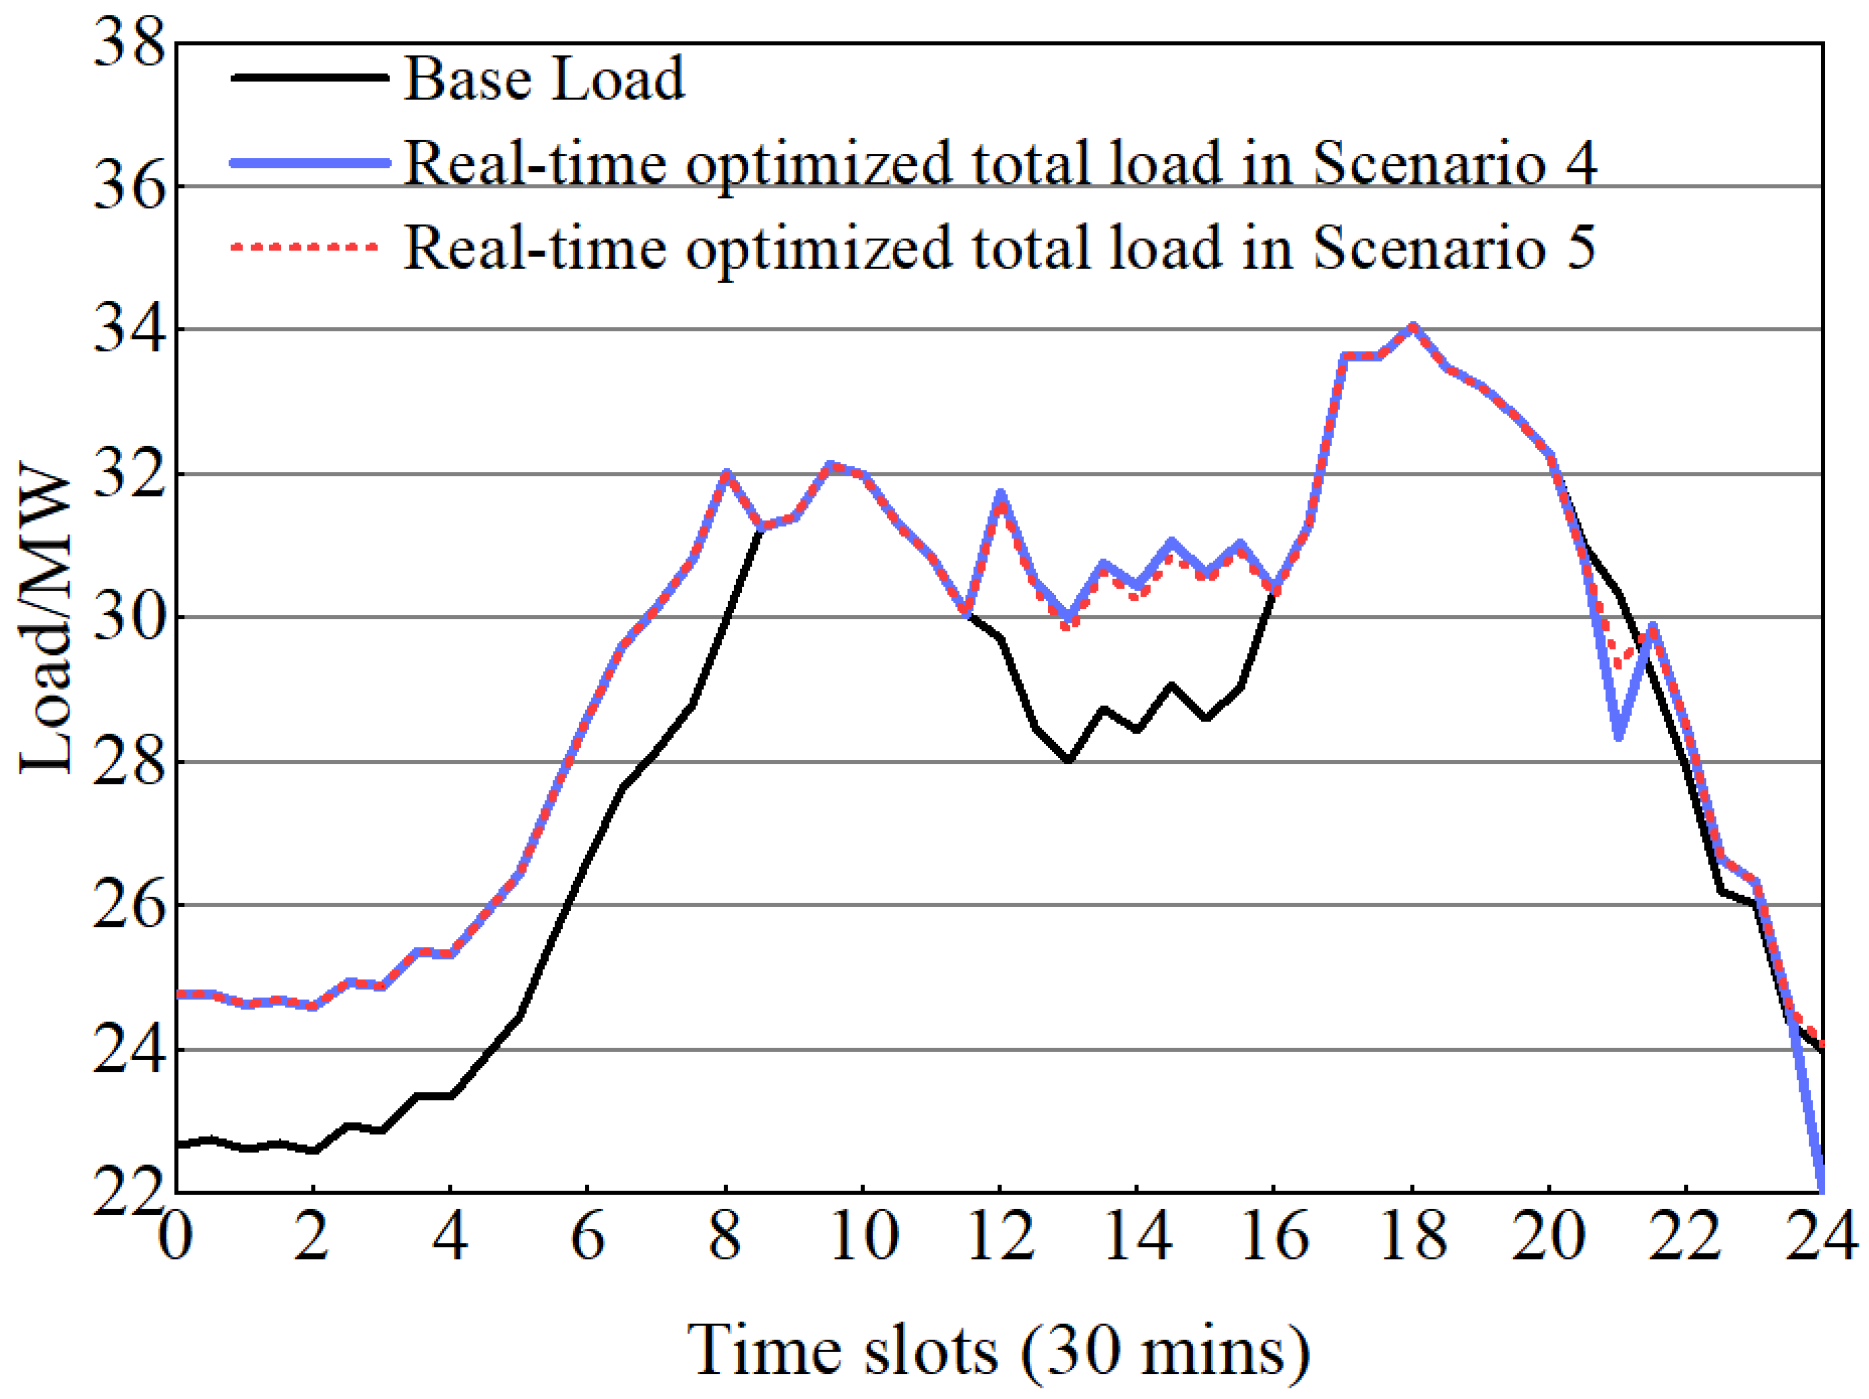
Figure 21 shows the comparison of the results, and it is found that the Intraday charging and discharging prices fluctuate in a certain range, which has little effect on the BSS in regulating the load balance of the power system. The charging and discharging price is not a decisive condition for determining the charging and discharging power of BSS, which can only have a corresponding effect on the charging and discharging power of BSS to a certain extent.
Table 4 shows that the optimal control of the BSS in the double layers tends to optimize the control with the goal of maximizing the swapping benefit based on the real-time battery swapping times and power demand.
The scenario 1 in this context represents the day-ahead-intraday dual-layer optimization of BSS (Battery Swapping System) under normal conditions. Due to a 10% increase in the intraday battery swapping demand compared to the total battery swapping demand from the previous day, the correlation coefficient between the day-ahead and intraday battery swapping demands is 0.97314. This indicates that the day-ahead charge and discharge reference curves based on the PSO (Particle Swarm Optimization) algorithm possess a certain representativeness, making them suitable as reference curves for intraday optimization. Comparing the results of the PSO algorithm-based day-ahead optimization with real-time intraday optimization, the standard deviation of the load curve for day-ahead optimization is 0.79173, while for intraday optimization, it is 0.786049. This indicates that the intraday optimization of the BBS (Battery Swapping System) exhibits smaller load fluctuations. It suggests that the intraday optimization algorithm is more capable of making reasonable responses to the actual battery swapping demands, thereby alleviating pressure on the power grid. Moreover, the actual revenue from intraday optimization has increased by 5% compared to day-ahead optimization. This indicates that day-ahead-intraday dual-layer optimization control of the Battery Swapping System (BSS) is capable of achieving the dual objectives of alleviating pressure on the power grid and maximizing revenue. Scenario 2 represents a special case where the intraday battery swapping demand is reduced by 30%. In this situation, the standard deviation of the load curve, optimized for intraday swapping, is 0.72273. The actual revenue from intraday optimization has decreased by 5.67% compared to day-ahead optimization, even in the scenario where the intraday battery swapping demand is reduced by 30%. This indicates that the day-ahead-intraday dual-layer optimization can achieve a good balance between the revenue of the battery swapping station and alleviating pressure on the power grid. Scenario 3 represents a special case where the intraday battery swapping demand increases by 30%. In this case, the standard deviation of the intraday optimized load curve is 0.87989, and the actual revenue from intraday optimization has increased by 13% compared to day-ahead optimization. This indicates that the day-ahead-intraday dual-layer optimization of the BSS (Battery Swapping System) prioritized reducing customer waiting time over stabilizing the local power system. However, this is entirely due to the smaller scale of the battery swapping station compared to the local customer demand. The issue can be resolved by expanding the scale of the battery swapping station. Scenario 4 represents a special case where the intraday selling electricity price increases by 25%. In this situation, the standard deviation of the intraday optimized load curve is 0.78212, and the actual revenue from intraday optimization has increased by 5.54% compared to day-ahead optimization. This indicates that the BBS (Battery Swapping System) optimized through intraday optimization is sensitive to real-time buying and selling electricity prices during the day. It is capable of achieving a good balance between the revenue of the battery swapping station and alleviating pressure on the power grid. The situation in scenario 5, being similar to the one described above, will not be discussed further.

5. Industrial Field Verification

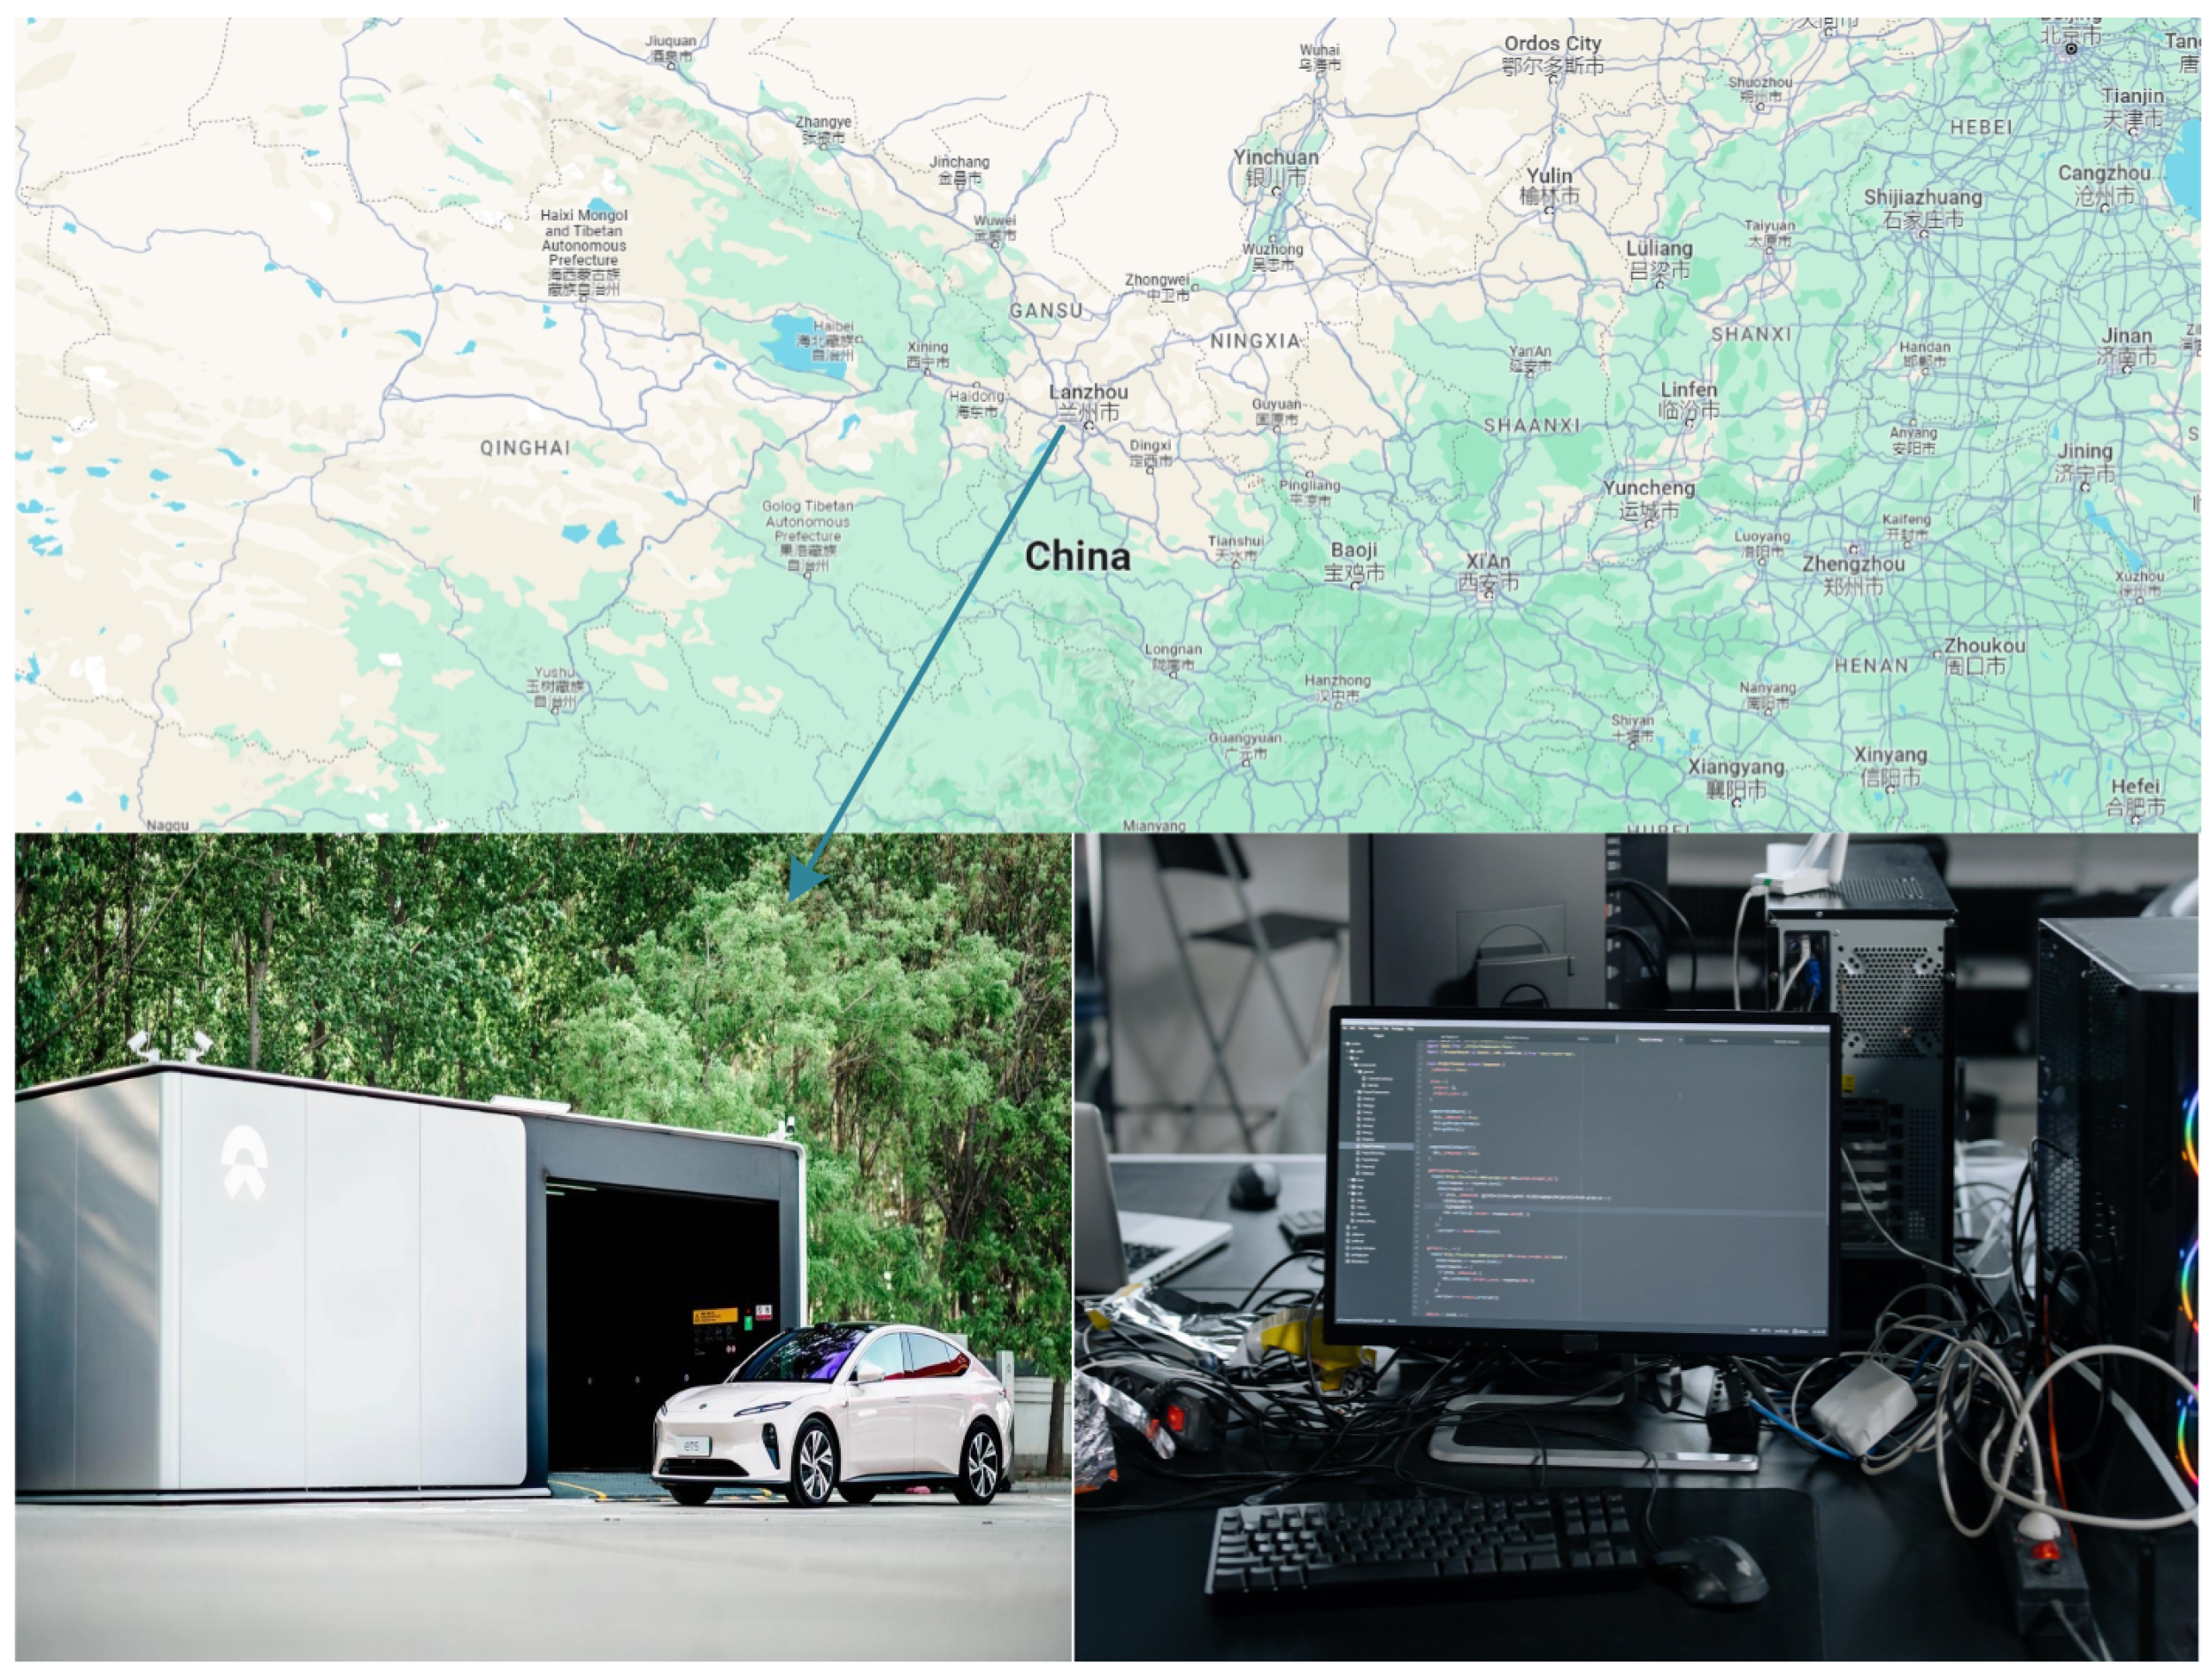
In order to further analyze the effectiveness of the dual-layer prediction and control method in mitigating load fluctuations in the power system through a battery swapping station, this study conducted practical industrial field verification at a specific swapping station in Lanzhou. The industrial field application is illustrated in the following Figure 22.
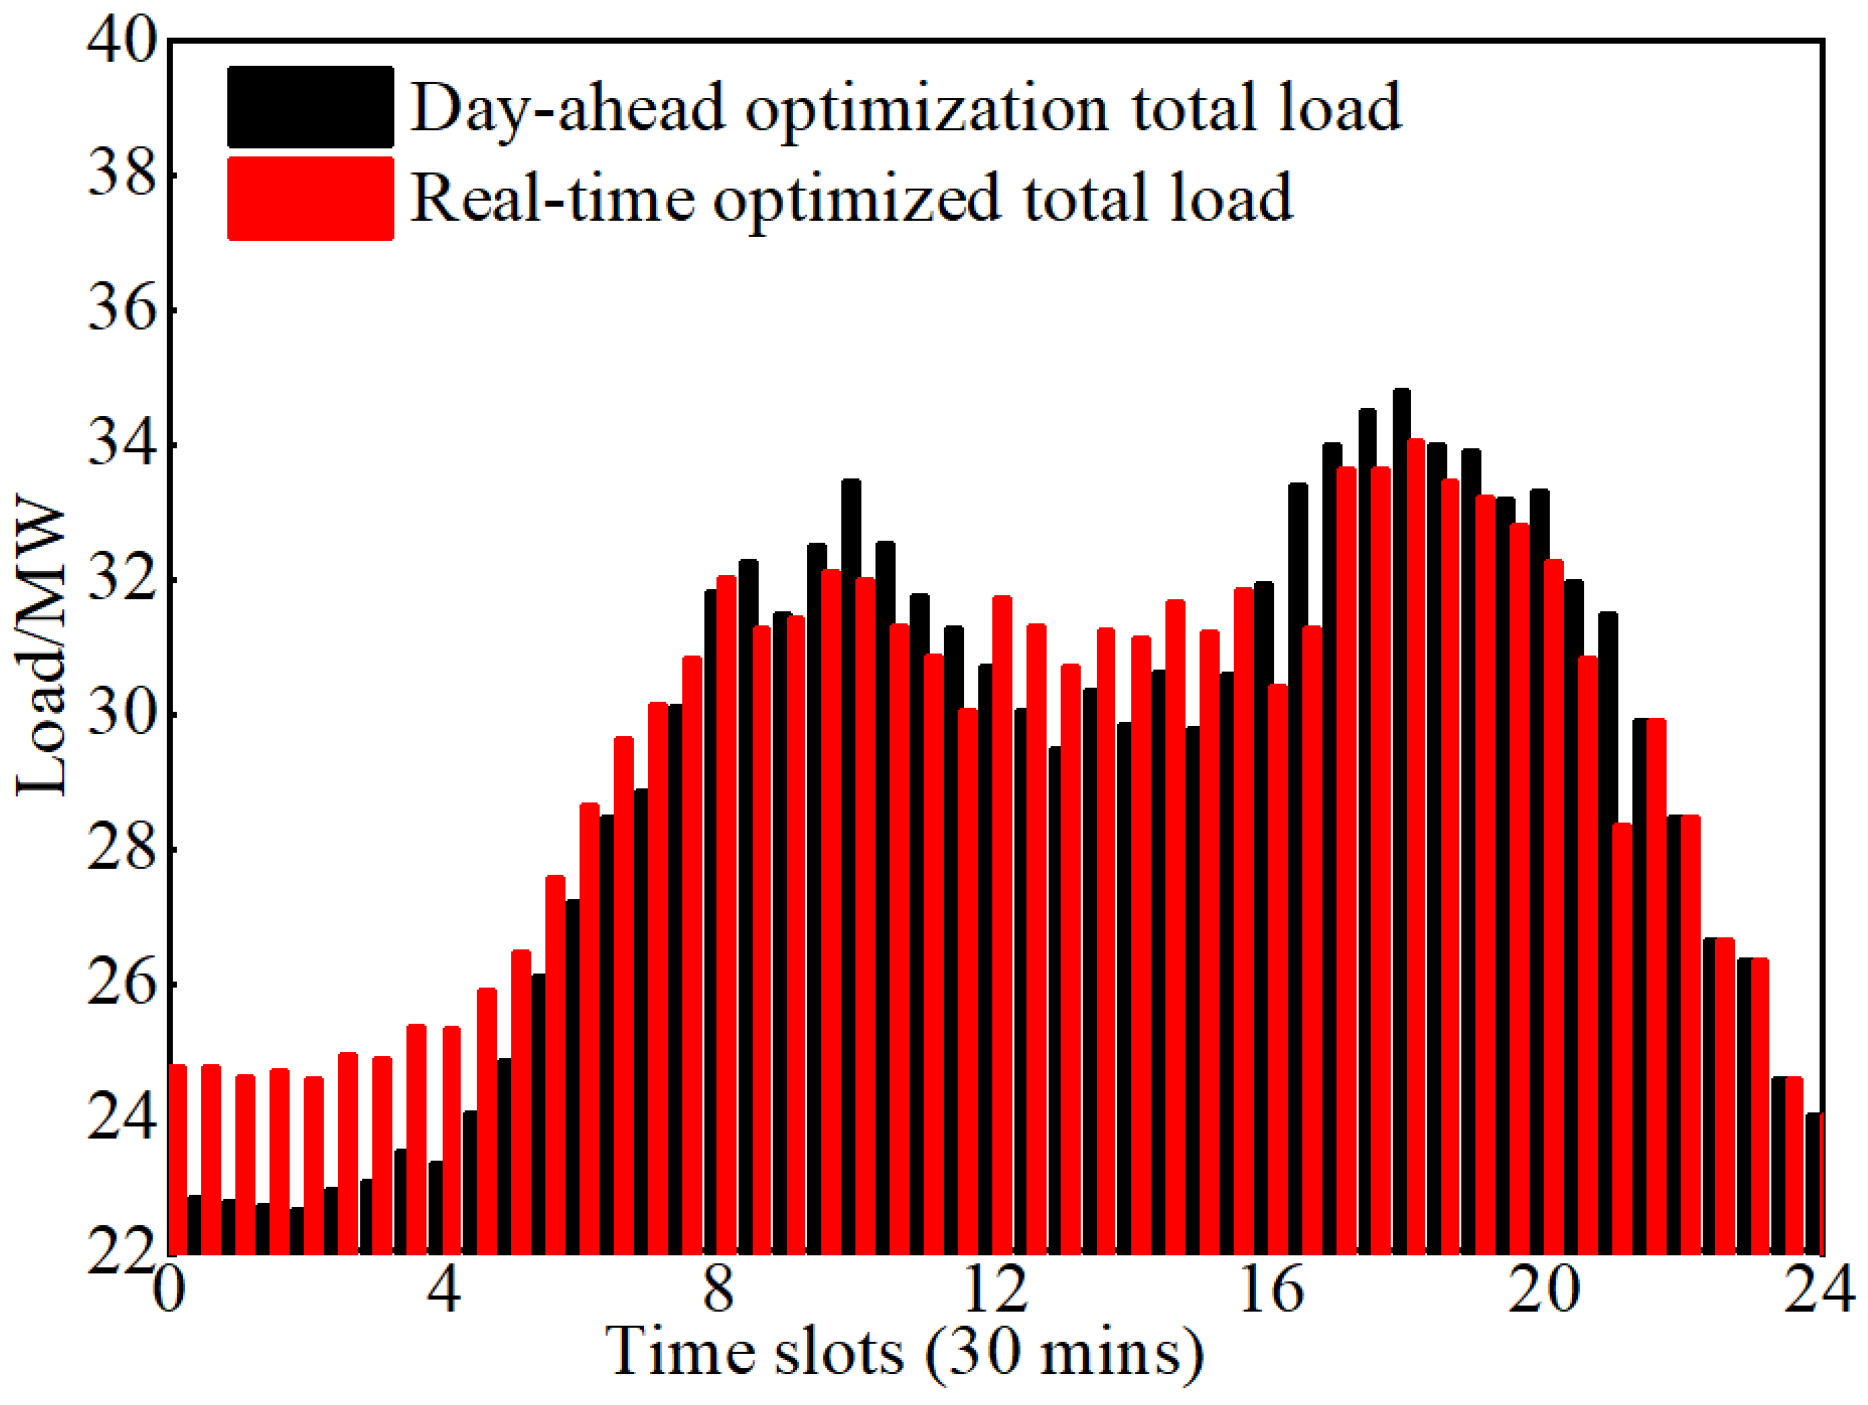
From the Figure 23, it can be observed that the dual-layer optimization algorithm proposed in this paper outperforms the day-ahead optimization algorithm. The on-site experiments validate the effectiveness of the day-ahead-intraday dual-layer optimization algorithm. It can make the most rational optimization control for the Battery Swapping Station (BSS) based on real-time information about swapping vehicles and the real-time electricity market, thereby reducing the actual pressure on the power grid.

6. Conclusions

This paper mainly focuses on the power allocation strategy of the battery power in the BSS system. A new model is proposed to solve the chaotic and unreasonable battery charging allocation in the BSS, which can respond to the real-time swapping demand and the demand of the power system. Firstly, a battery scheduling model based on two-layer optimization of electric vehicle battery swapping scheduling model is established, which can take the influence of the real-time battery swapping times change and the power system demand change into full consideration. Establish a prioritization function for battery swapping during the swapping process to achieve orderly swapping and reduce the impact on battery lifespan. Then, Intraday optimization performs optimal control on the basis of day-ahead optimization and responds to real-time battery swapping times and power system demand, improves the conservatism of the BSS system, and achieves that when the real-time battery swapping times are within a certain range, Intraday real-time battery swapping times are met by the BSS as well as responding to the real-time demand of the power system, so that the BSS regulation strategy is more in line with the actual operation status and power system demand.
It ensures that the BSS responds to the real-time demand of the power system on the basis of revenue maximization improves the revenue of the BSS. The battery swapping system based on two-layer optimization can meet the requirements of demand response rapidity, but the willingness to respond is more affected by the actual swapping demand, and the swapping station tends not to respond when the demand response revenue of the power system is lower than the corresponding battery depreciation cost, vehicle swapping queuing cost, and power purchase cost of the BSS; When the demand response period of the power system overlaps with the peak period of battery swapping, the BSS will prioritize to meet the demand of battery swapping, and the ability to respond to the power system is weak. Under this strategy, as the size of the BSS increases, the battery power in the battery swapping can maximize the energy storage characteristics and increase the ability to regulate the power system energy. However, there is still a lot of work to be done.Investigating the Power Prediction Capability of Battery Swapping Stations (BSS) by leveraging historical data and neural networks to achieve more accurate forecasts of electric vehicle charging demand in a specific region. A more in-depth investigation into the profit potential and grid-stabilizing capabilities of electric vehicle charging and swapping stations, particularly when considering uncertain market demands. This is exactly the next step in our research.

Author Contributions

Conceptualization, M.T.; methodology, M.T. and C.Z.; software, M.T. and C.Z.; validation, M.T. and C.Z.; formal analysis, M.T. and C.Z.; investigation, Y.Y., B.A., Y.Z. and W.W.; resources, M.T. and C.Z.; data curation, M.T. and C.Z.; writing—original draft preparation, M.T. and C.Z.; writing—review and editing, M.T. and C.Z.; visualization, M.T. and C.Z.; supervision, M.T. and C.Z.; project administration, M.T., C.Z., Y.Y., B.A., Y.Z. and W.W.; funding acquisition, M.T. All authors have read and agreed to the published version of the manuscript.

Funding

The first author is supported by the National Natural Science Foundation of China [grant numbers 62363022, 61663021, 71763025, and 61861025]; Natural Science Foundation of Gansu Province [grant number 23JRRA886]; Gansu Provincial Department of Education: Industrial Support Plan Project [grant number 2023CYZC-35].

Data Availability Statement

Under reasonable circumstances, the data is provided by the corresponding author.

Conflicts of Interest

The authors declare no conflicts of interest.

Abbreviations

The following abbreviations are used in this manuscript:
BSSElectric Vehicle Battery Swapping Station
MPCModel Predictive Control
PSOParticle Swarm Optimization
EVElectric Vehicle

References

  1. Malozyomov, B.; Kukartsev, V.; Martyushev, N. Improvement of Hybrid Electrode Material Synthesis for Energy Accumulators Based on Carbon Nanotubes and Porous Structures. Micromachines 2023, 14, 1288. [Google Scholar] [CrossRef] [PubMed]
  2. Tran, M.; Khang, T.; Panchal, K. Concept review of a cloud-based smart battery management system for lithium-ion batteries: Feasibility, logistics, and functionality. Batteries 2022, 8, 19. [Google Scholar] [CrossRef] [PubMed]
  3. Houache, M.; Yim, C.; Karkar, Z. On the Current and Future Outlook of Battery Chemistries for Electric Vehicles—Mini Review. Batteries 2022, 8, 70. [Google Scholar] [CrossRef]
  4. Molaiyan, P.; Dos Reis, G.; Karuppiah, D. Recent progress in biomass-derived carbon materials for Li-ion and Na-ion batteries—A review. Batteries 2023, 9, 116. [Google Scholar] [CrossRef]
  5. Örüm Aydin, A.; Zajonz, F.; Günther, T. Lithium-Ion Battery Manufacturing: Industrial View on Processing Challenges, Possible Solutions and Recent Advances. Batteries 2023, 9, 555. [Google Scholar] [CrossRef]
  6. Lipu, M.; Mamun, A.; Ansari, S.; Miah, M. Battery management, key technologies, methods, issues, and future trends of electric vehicles: A pathway toward achieving sustainable development goals. Batteries 2022, 8, 119. [Google Scholar] [CrossRef]
  7. Atawi, I.; Al-Shetwi, A.; Magableh, A. Recent advances in hybrid energy storage system integrated renewable power generation: Configuration, control, applications, and future directions. Batteries 2022, 9, 29. [Google Scholar] [CrossRef]
  8. Benmouna, A.; Borderiou, L.; Becherif, M. Charging Stations for Large-Scale Deployment of Electric Vehicles. Batteries 2024, 10, 33. [Google Scholar] [CrossRef]
  9. Fan, Y.; Li, Y.; Zhao, J. Online State-of-Health Estimation for Fast-Charging Lithium-Ion Batteries Based on a Transformer–Long Short-Term Memory Neural Network. Batteries 2023, 9, 539. [Google Scholar] [CrossRef]
  10. Powar, V.; Singh, R. End-to-End Direct-Current-Based Extreme Fast Electric Vehicle Charging Infrastructure Using Lithium-Ion Battery Storage. Batteries 2023, 9, 169. [Google Scholar] [CrossRef]
  11. Horak, D.; Hainoun, A.; Neugebauer, G. Battery electric vehicle energy demand in urban energy system modeling: A stochastic analysis of added flexibility for home charging and battery swapping stations. Sustain. Energy Grids Netw. 2024, 37, 101260. [Google Scholar] [CrossRef]
  12. He, C.; Zhu, J.; Lan, J.; Li, S. Optimal planning of electric vehicle battery centralized charging station based on EV load forecasting. IEEE Trans. Ind. Appl. 2022, 58, 6557–6575. [Google Scholar] [CrossRef]
  13. He, Y.; Liu, Z.; Song, Z. Integrated charging infrastructure planning and charging scheduling for battery electric bus systems. Elsevier 2022, 111, 103437. [Google Scholar] [CrossRef]
  14. Alwesabi, Y.; Avishan, F.; Liu, Z. Robust strategic planning of dynamic wireless charging infrastructure for electric buses. Appl. Energy 2022, 307, 118243. [Google Scholar] [CrossRef]
  15. Zhang, Y.; Wang, X.; Zhi, B. Strategic investment in electric vehicle charging service: Fast charging or battery swapping. Int. J. Prod. Econ. 2024, 268, 109136. [Google Scholar] [CrossRef]
  16. Tan, Y.; Fukuda, H.; Li, Z.; Wang, S.; Gao, W.; Liu, Z. Does the public support the construction of battery swapping station for battery electric vehicles?-Data from Hangzhou, China. Energy Policy 2022, 163, 33–74. [Google Scholar] [CrossRef]
  17. Moghaddam, Z.; Ahmad, I.; Habibi, D.; Phung, Q.V. Smart charging strategy for electric vehicle charging stations. IEEE Trans. Transp. Electrif. 2017, 4, 76–88. [Google Scholar] [CrossRef]
  18. Zhang, T.; Chen, X.; Yu, Z.; Zhu, X.Y.; Shi, D. A Monte Carlo simulation approach to evaluate service capacities of EV charging and battery swapping stations. IEEE Trans. Ind. Inform. 2018, 14, 3914–3923. [Google Scholar] [CrossRef]
  19. Wu, H. A survey of battery swapping stations for electric vehicles: Operation modes and decision scenarios. IEEE Trans. Intell. Transp. Syst. 2021, 23, 10163–10185. [Google Scholar] [CrossRef]
  20. Zhan, W.; Wang, Z.; Zhang, L.; Liu, P.; Cui, D.; Dorrell, D.G. A review of siting, sizing, optimal scheduling, and cost-benefit analysis for battery swapping stations. Energy 2022, 258, 124723. [Google Scholar] [CrossRef]
  21. Kang, Q.; Wang, J.B.; Zhou, M.C.; Ammari, A.C. Centralized charging strategy and scheduling algorithm for electric vehicles under a battery swapping scenario. IEEE Trans. Intell. Transp. Syst. 2015, 17, 659–669. [Google Scholar] [CrossRef]
  22. Wang, R.; Wang, P.; Xiao, G. Two-stage mechanism for massive electric vehicle charging involving renewable energy. IEEE Trans. Veh. Technol. 2016, 65, 4159–4171. [Google Scholar] [CrossRef]
  23. Rao, R.; Zhang, X.; Xie, J.; Ju, L. Optimizing electric vehicle users’ charging behavior in battery swapping mode. Appl. Energy 2015, 155, 547–559. [Google Scholar] [CrossRef]
  24. Ye, F.; Qian, Y.; Hu, R.Q. Incentive load scheduling schemes for PHEV battery exchange stations in smart grid. IEEE Syst. J. 2015, 11, 922–930. [Google Scholar] [CrossRef]
  25. Ding, R.; Liu, Z.; Li, X.; Hou, Y.; Sun, W.; Zhai, H.; Wei, X. Joint charging scheduling of electric vehicles with battery to grid technology in battery swapping station. Energy Rep. 2022, 8, 872–882. [Google Scholar] [CrossRef]
  26. Wu, H.; Pang, G.; Choy, K.; Lam, H. An optimization model for electric vehicle battery charging at a battery swapping station. IEEE Trans. Veh. Technol. 2018, 67, 881–895. [Google Scholar] [CrossRef]
  27. Han, S.; Han, S.; Sezaki, K. Development of an optimal vehicle-to-grid aggregator for frequency regulation. IEEE Trans. Smart Grid 2010, 1, 65–72. [Google Scholar]
  28. Scarabaggio, P.; Carli, R.; Cavone, G.; Dotoli, M. Smart control strategies for primary frequency regulation through electric vehicles: A battery degradation perspective. Energies 2020, 13, 4586. [Google Scholar] [CrossRef]
  29. Miao, B.; Deng, Q.; Zhang, L.; Huo, Z.; Liu, X. Collaborative scheduling of spare parts production and service workers driven by distributed maintenance demand. J. Manuf. Syst. 2022, 64, 261–274. [Google Scholar] [CrossRef]
  30. Al-Obaidi, A.; Khani, H.; Farag, H.E.Z.; Mohamed, M. Bidirectional smart charging of electric vehicles considering user preferences, peer to peer energy trade, and provision of grid ancillary services. Int. J. Electr. Power Energy Syst. 2021, 124, 106353. [Google Scholar] [CrossRef]
  31. Amiri, S.S.; Jadid, S.; Saboori, H. Multi-objective optimum charging management of electric vehicles through battery swapping stations. Energy 2018, 165, 549–562. [Google Scholar] [CrossRef]
  32. Yang, J.; Wang, W.; Ma, K. Optimal dispatching strategy for shared battery station of electric vehicle by divisional battery control. IEEE Access 2019, 7, 38224–38235. [Google Scholar] [CrossRef]
  33. Li, S.; He, H.; Wei, Z. Edge computing for vehicle battery management: Cloud-based online state estimation. J. Energy Storage 2022, 55, 105502. [Google Scholar] [CrossRef]
  34. Dreyfuss, M.; Giat, Y. Optimal allocation of spares to maximize the window fill rate in a two-echelon exchangeable-item repair system. Eur. J. Oper. Res. 2018, 270, 1053–1062. [Google Scholar] [CrossRef]
  35. Ahmad, F.; Saad, A.M.; Saad, A.I. Battery swapping station for electric vehicles: Opportunities and challenges. IET Smart Grid 2020, 3, 280–286. [Google Scholar] [CrossRef]
  36. Wu, C.; Lin, X.; Sui, Q. Two-stage self-scheduling of battery swapping station in day-ahead energy and frequency regulation markets. Appl. Energy 2021, 283, 116285. [Google Scholar] [CrossRef]
  37. Cui, D.; Wang, Z.; Liu, P.; Wang, S. Operation optimization approaches of electric vehicle battery swapping and charging station: A literature review. Energy 2023, 263, 126095. [Google Scholar] [CrossRef]
  38. Tarar, M.O.; Hassan, N.U.L.; Naqvi, I.H.; Pecht, M. Techno-Economic Framework for Electric Vehicle Battery Swapping Stations. IEEE Trans. Transp. Electrif. 2023, 9, 4458–4473. [Google Scholar] [CrossRef]
  39. Wu, X.; Feng, Q.; Bai, C.; Lai, C.S.; Jia, Y.; Lai, L.L. Flots d’Anosov a distributions stable et instable differentiables. Energy 2021, 224, 120106. [Google Scholar] [CrossRef]
  40. An, K. Battery electric bus infrastructure planning under demand uncertainty. Transp. Res. Part C Emerg. Technol. 2020, 111, 572–587. [Google Scholar] [CrossRef]
  41. Li, B.; Jing, D.; Zhong, H.; He, G.; Ma, Z.; Ruan, G. Centralized charging station planning for battery electric trucks considering the impacts on electricity distribution systems. Energy Rep. 2023, 9, 346–357. [Google Scholar] [CrossRef]
  42. Sindha, J.; Thakur, J.; Khalid, M. The economic value of hybrid battery swapping stations with second life of batteries. Clean. Energy Syst. 2023, 5, 33–74. [Google Scholar] [CrossRef]
Figure 1. Diagram of Electric Vehicle Battery Swap Station.
Energies 17 00879 g001
Figure 2. System model of BSS.
Energies 17 00879 g002
Figure 3. The dual-layer optimization structure diagram.
Energies 17 00879 g003
Figure 4. Unoptimized load curves.
Energies 17 00879 g004
Figure 5. Day-ahead forecast of BSS swapping demand.
Energies 17 00879 g005
Figure 6. Battery allocation strategy.
Energies 17 00879 g006
Figure 7. A structure diagram of the day-ahead optimization process.
Energies 17 00879 g007
Figure 8. Flowchart illustrating the PSO algorithm.
Energies 17 00879 g008
Figure 9. The optimization process of the PSO algorithm.
Energies 17 00879 g009
Figure 10. Day-ahead prediction and actual demand in Scenario 1.
Energies 17 00879 g010
Figure 11. Load distribution in Scenario 1.
Energies 17 00879 g011
Figure 12. BSS power of day-ahead versus real-time scheduling in Scenario 1.
Energies 17 00879 g012
Figure 13. The Real-time Intraday Online Optimization of Battery Charging and Discharging Power Variation Curve in Scenario 1.
Energies 17 00879 g013
Figure 14. Pre-prediction versus actual 12:30 Revised Prediction in Scenario 1.
Energies 17 00879 g014
Figure 15. Day-ahead prediction and actual demand in Scenario 2.
Energies 17 00879 g015
Figure 16. Load distribution in Scenario 2.
Energies 17 00879 g016
Figure 17. BSS power of day-ahead versus real-time scheduling in Scenario 2.
Energies 17 00879 g017
Figure 18. Day-ahead prediction and actual demand in Scenario 3.
Energies 17 00879 g018
Figure 19. Load distribution in Scenario 3.
Energies 17 00879 g019
Figure 20. BSS power of day-ahead versus real-time scheduling in Scenario 3.
Energies 17 00879 g020
Figure 21. Load distribution in Scenarios 4 & 5.
Energies 17 00879 g021
Figure 22. Industrial field applications.
Energies 17 00879 g022
Figure 23. Comparison of the results of day-ahead optimization and intraday optimization.
Energies 17 00879 g023
Table 1. Parameters of BSS.
Parameter TypeSet ValuesParameter TypeSet Values
Charging and discharging efficiency of the charger/%95Number of Batteries/Each100
Number of chargers/each100Battery load lower limit (SOC)20
Charging and discharging power limit/kW20Battery Investment Cost/[yuan(kW·h)]1309
Conversion cost of electricity exchange/[yuan(kW·h)]2.0Battery capacity/(kW·h)64
Table 2. Price of demand response.
Type of ResponsePrice/[yuan(kW·h)]
Day-Ahead
Price/[yuan(kW·h)]
Intraday
Peak shaving5 ± 0.57.5 ± 0.75
Valley filling2 ± 0.23 ± 0.3
Table 3. BSS charging tariff in each time interval.
IntervalSpecific IntervalsCharging Standard
Peak period8:30–12:00; 16:00–21:001.35/yuan(kW·h)
Mid-peak hours5:00–8:30; 21:00–24:001.07/yuan(kW·h)
Off-peak hours00:00–5:00; 12:00–16:000.36/yuan(kW·h)
Table 4. Comparison of day-ahead and intraday earnings across different scenarios.
ScenarioDay-Ahead Net Income/YuanDay-Ahead Cost/YuanIntraday Net Income/YuanIntraday Cost/Yuan
175,18316,17678,94224,348.5
275,18316,17670,92015,802
375,18316,17684,97049,043
475,18316,17679,35122,140
575,18316,17671,491.830,435.6
Disclaimer/Publisher’s Note: The statements, opinions and data contained in all publications are solely those of the individual author(s) and contributor(s) and not of MDPI and/or the editor(s). MDPI and/or the editor(s) disclaim responsibility for any injury to people or property resulting from any ideas, methods, instructions or products referred to in the content.