
A Numerical Investigation of the Hydrodynamic Performance of a Pitch-Type Wave Energy Converter Using Weakly and Fully Nonlinear Models


Abstract
1. Introduction
2. Numerical Modeling
2.1. Computational Fluid Dynamics
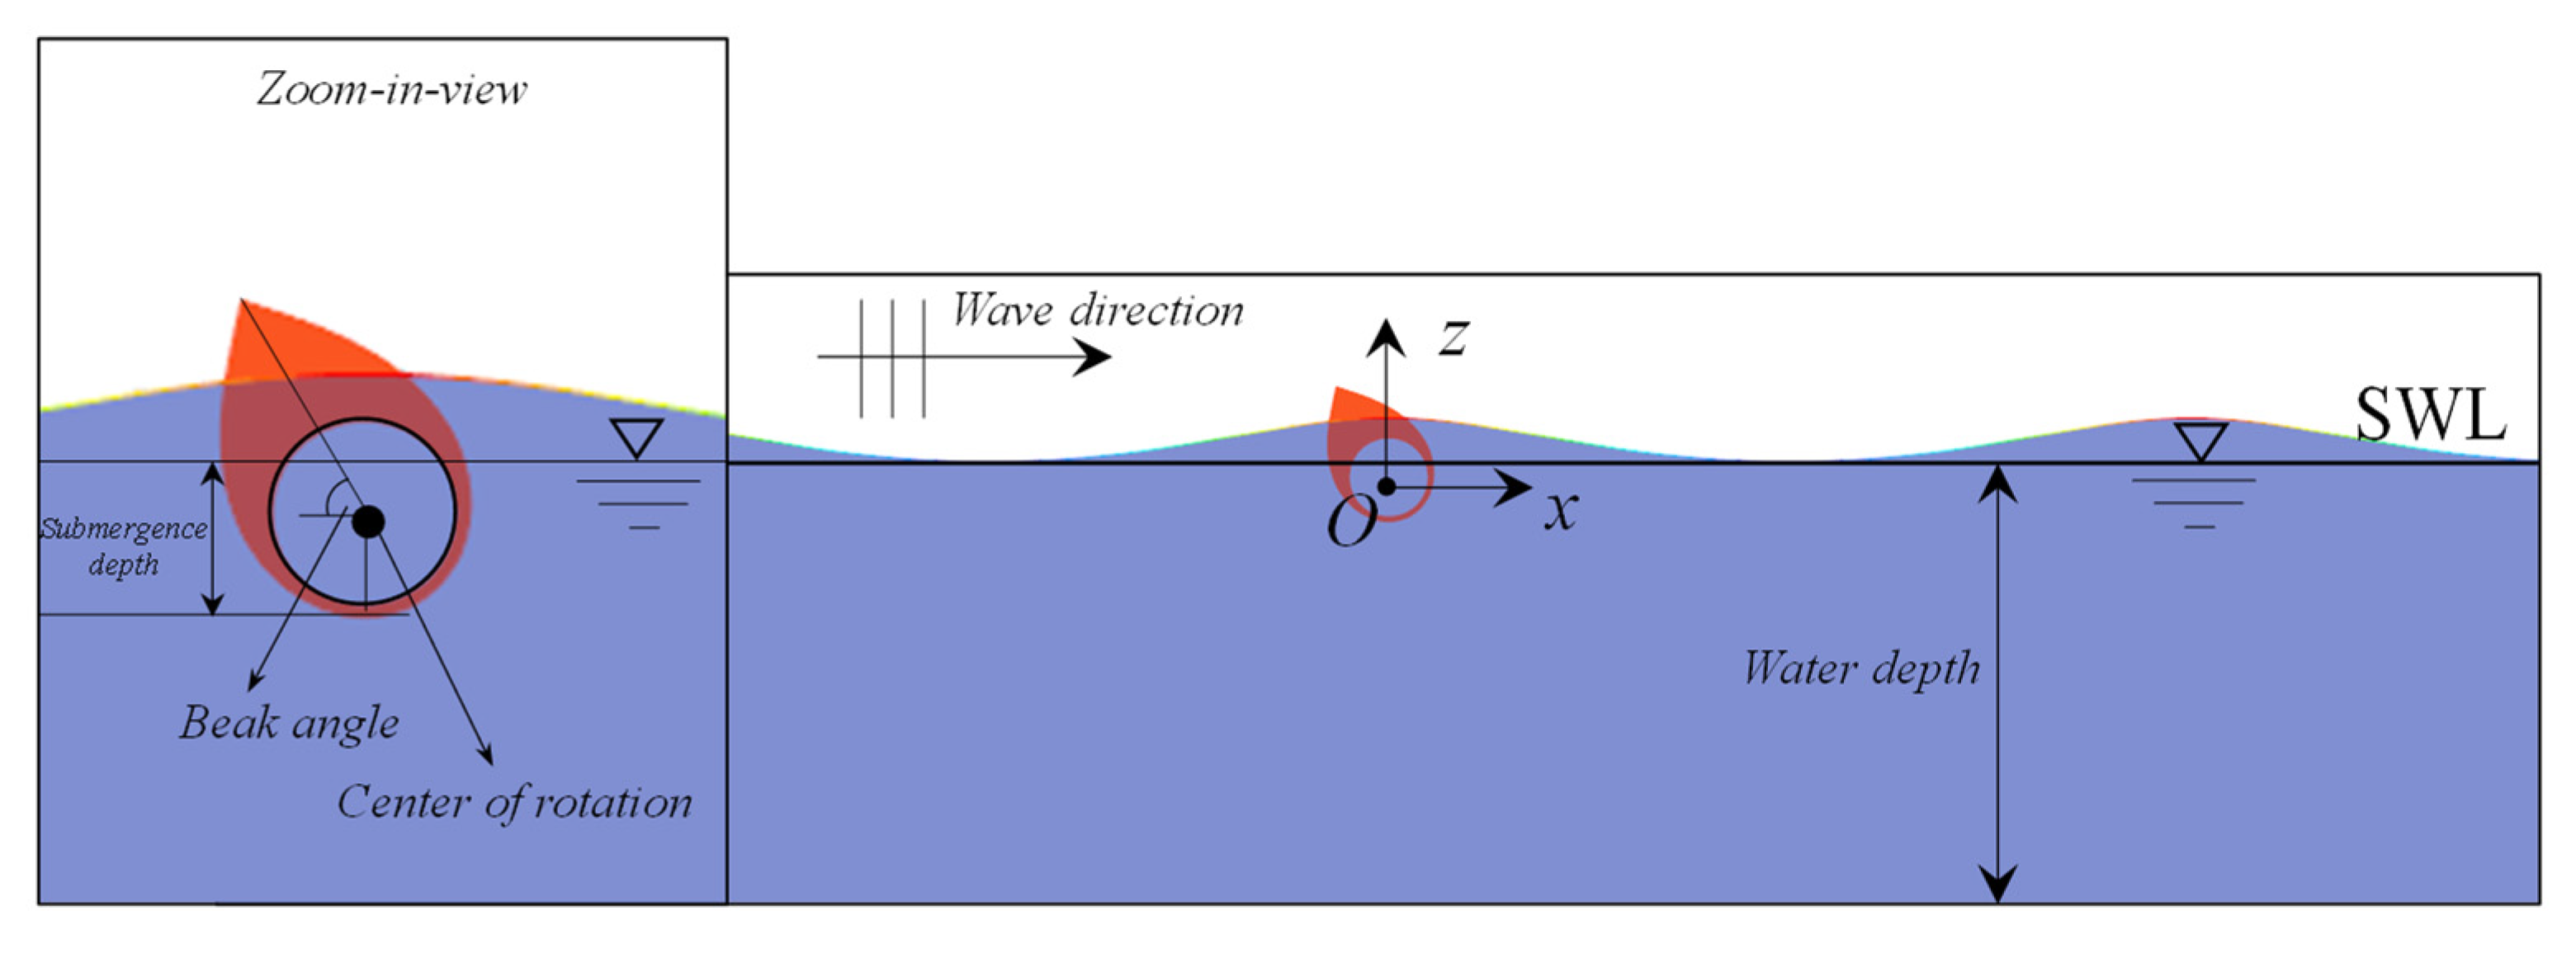
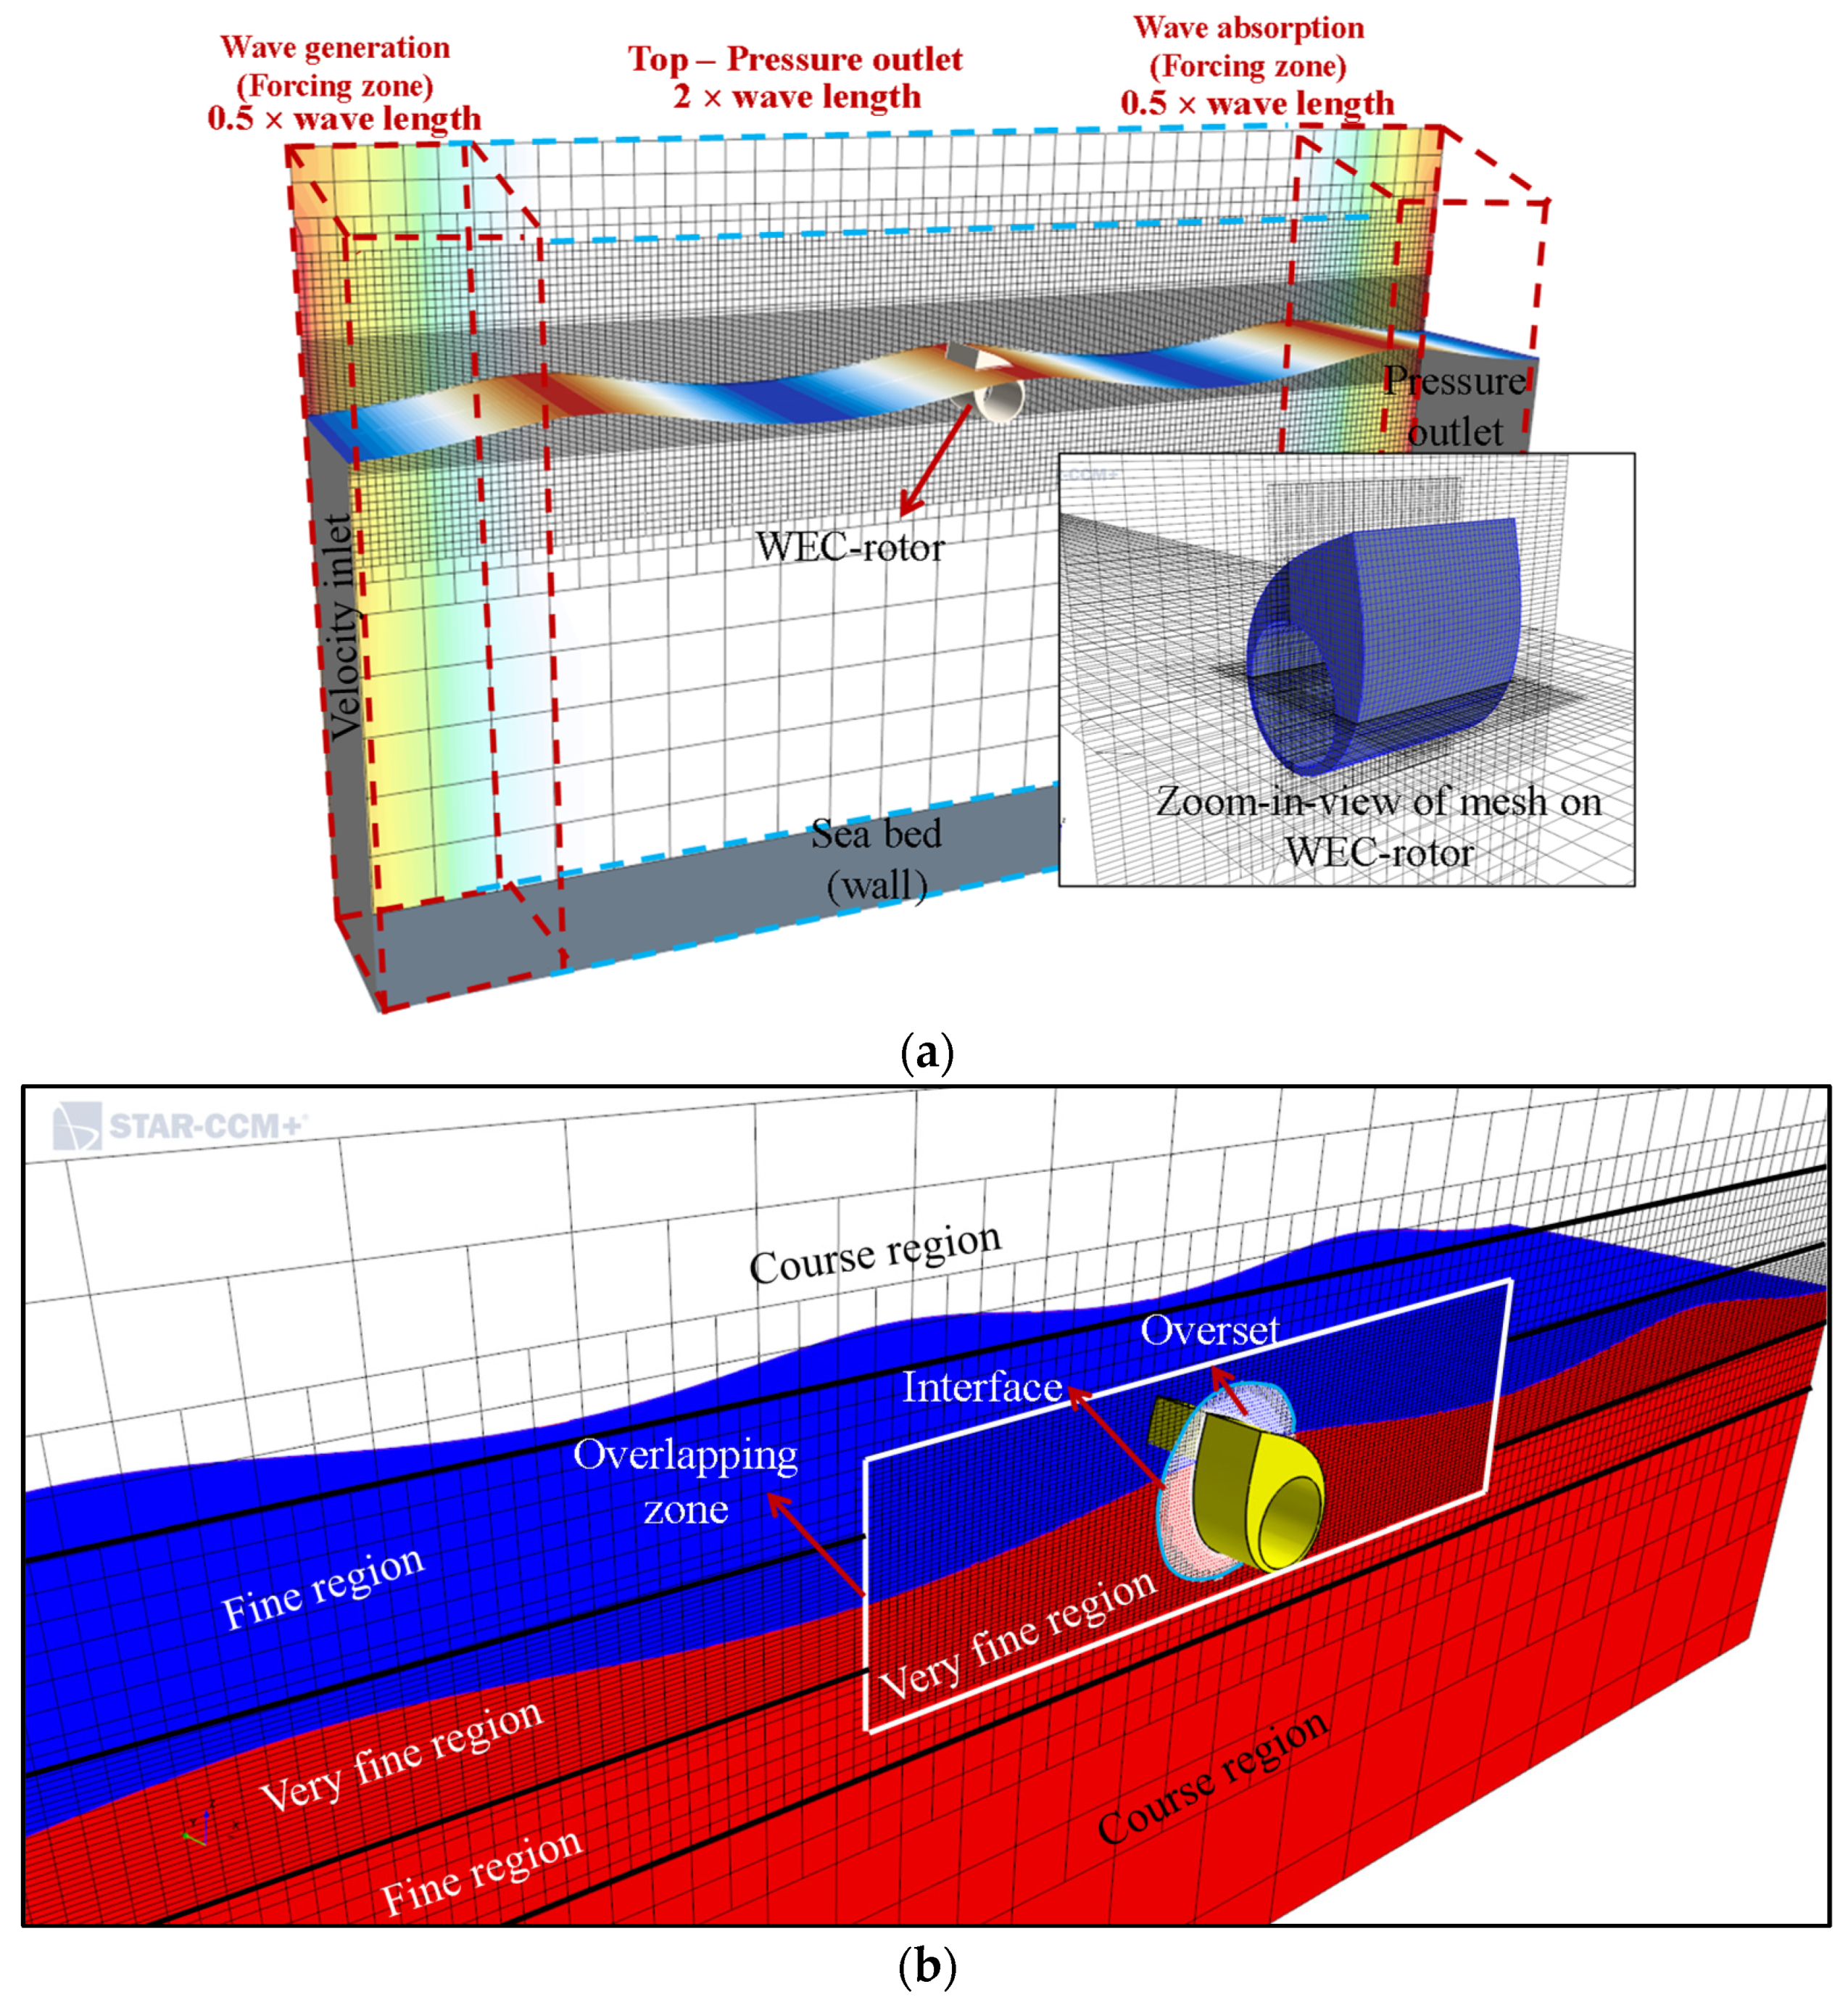
2.2. Numerical Wave Tank
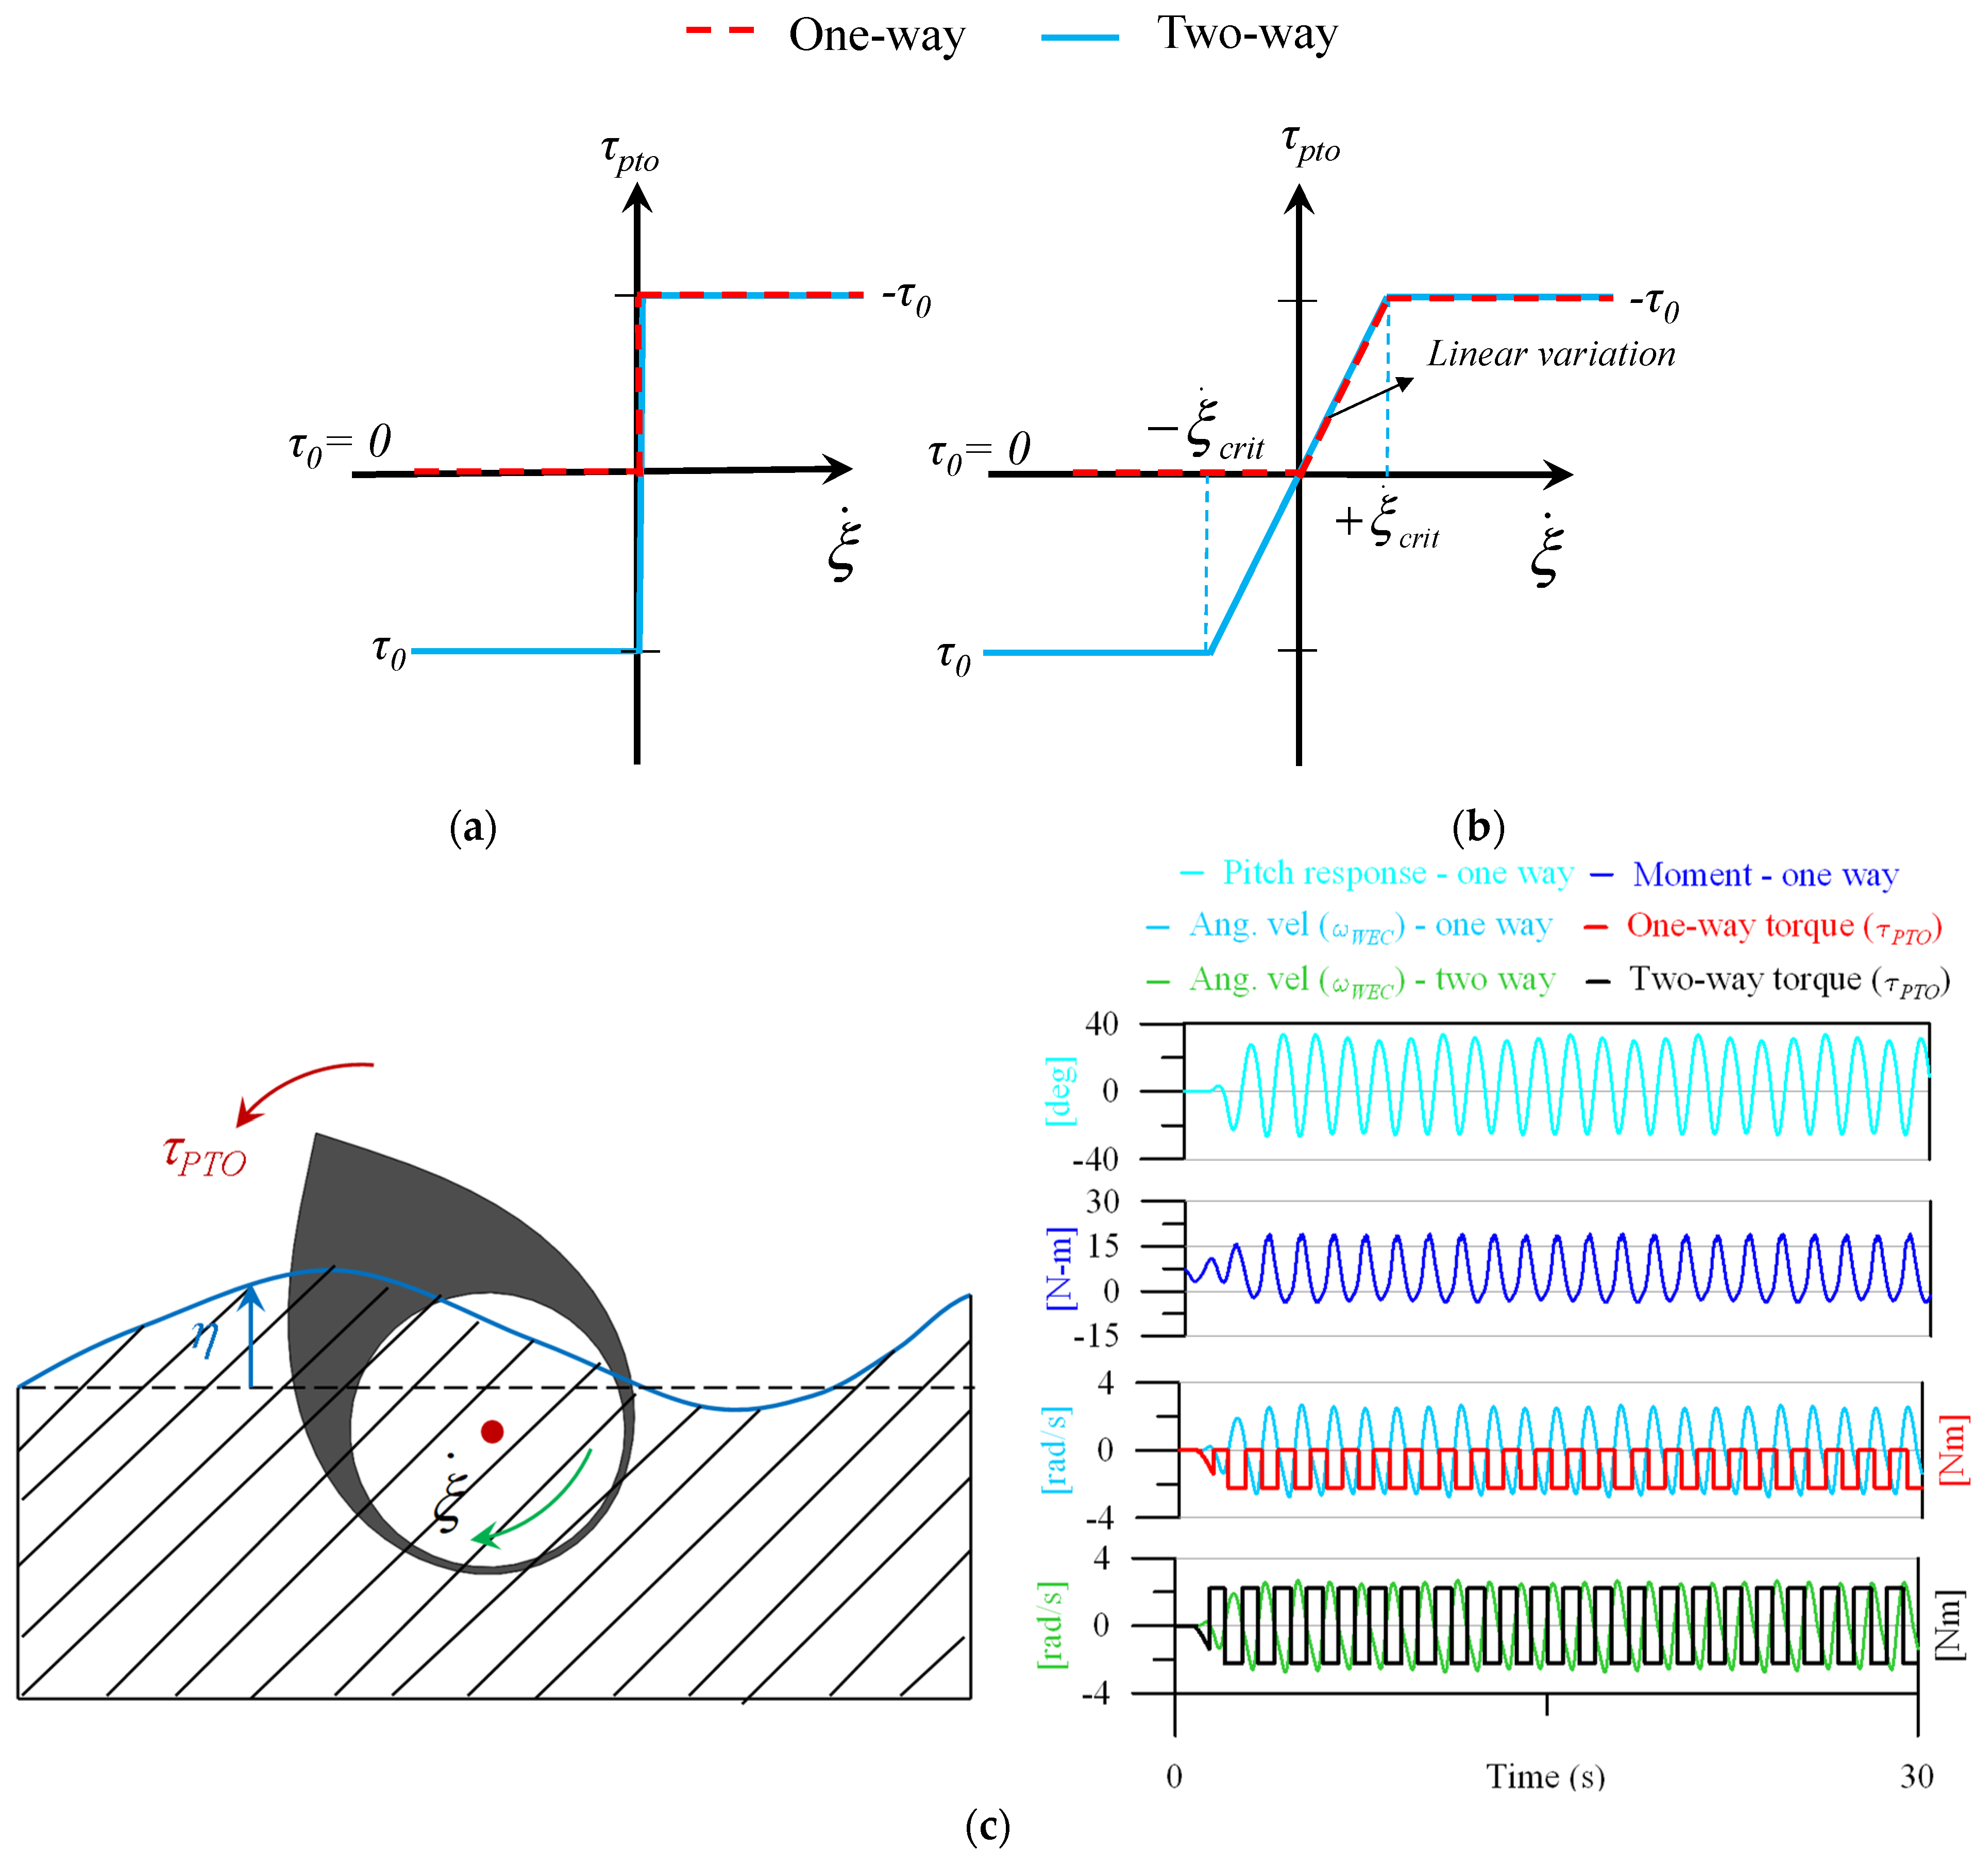
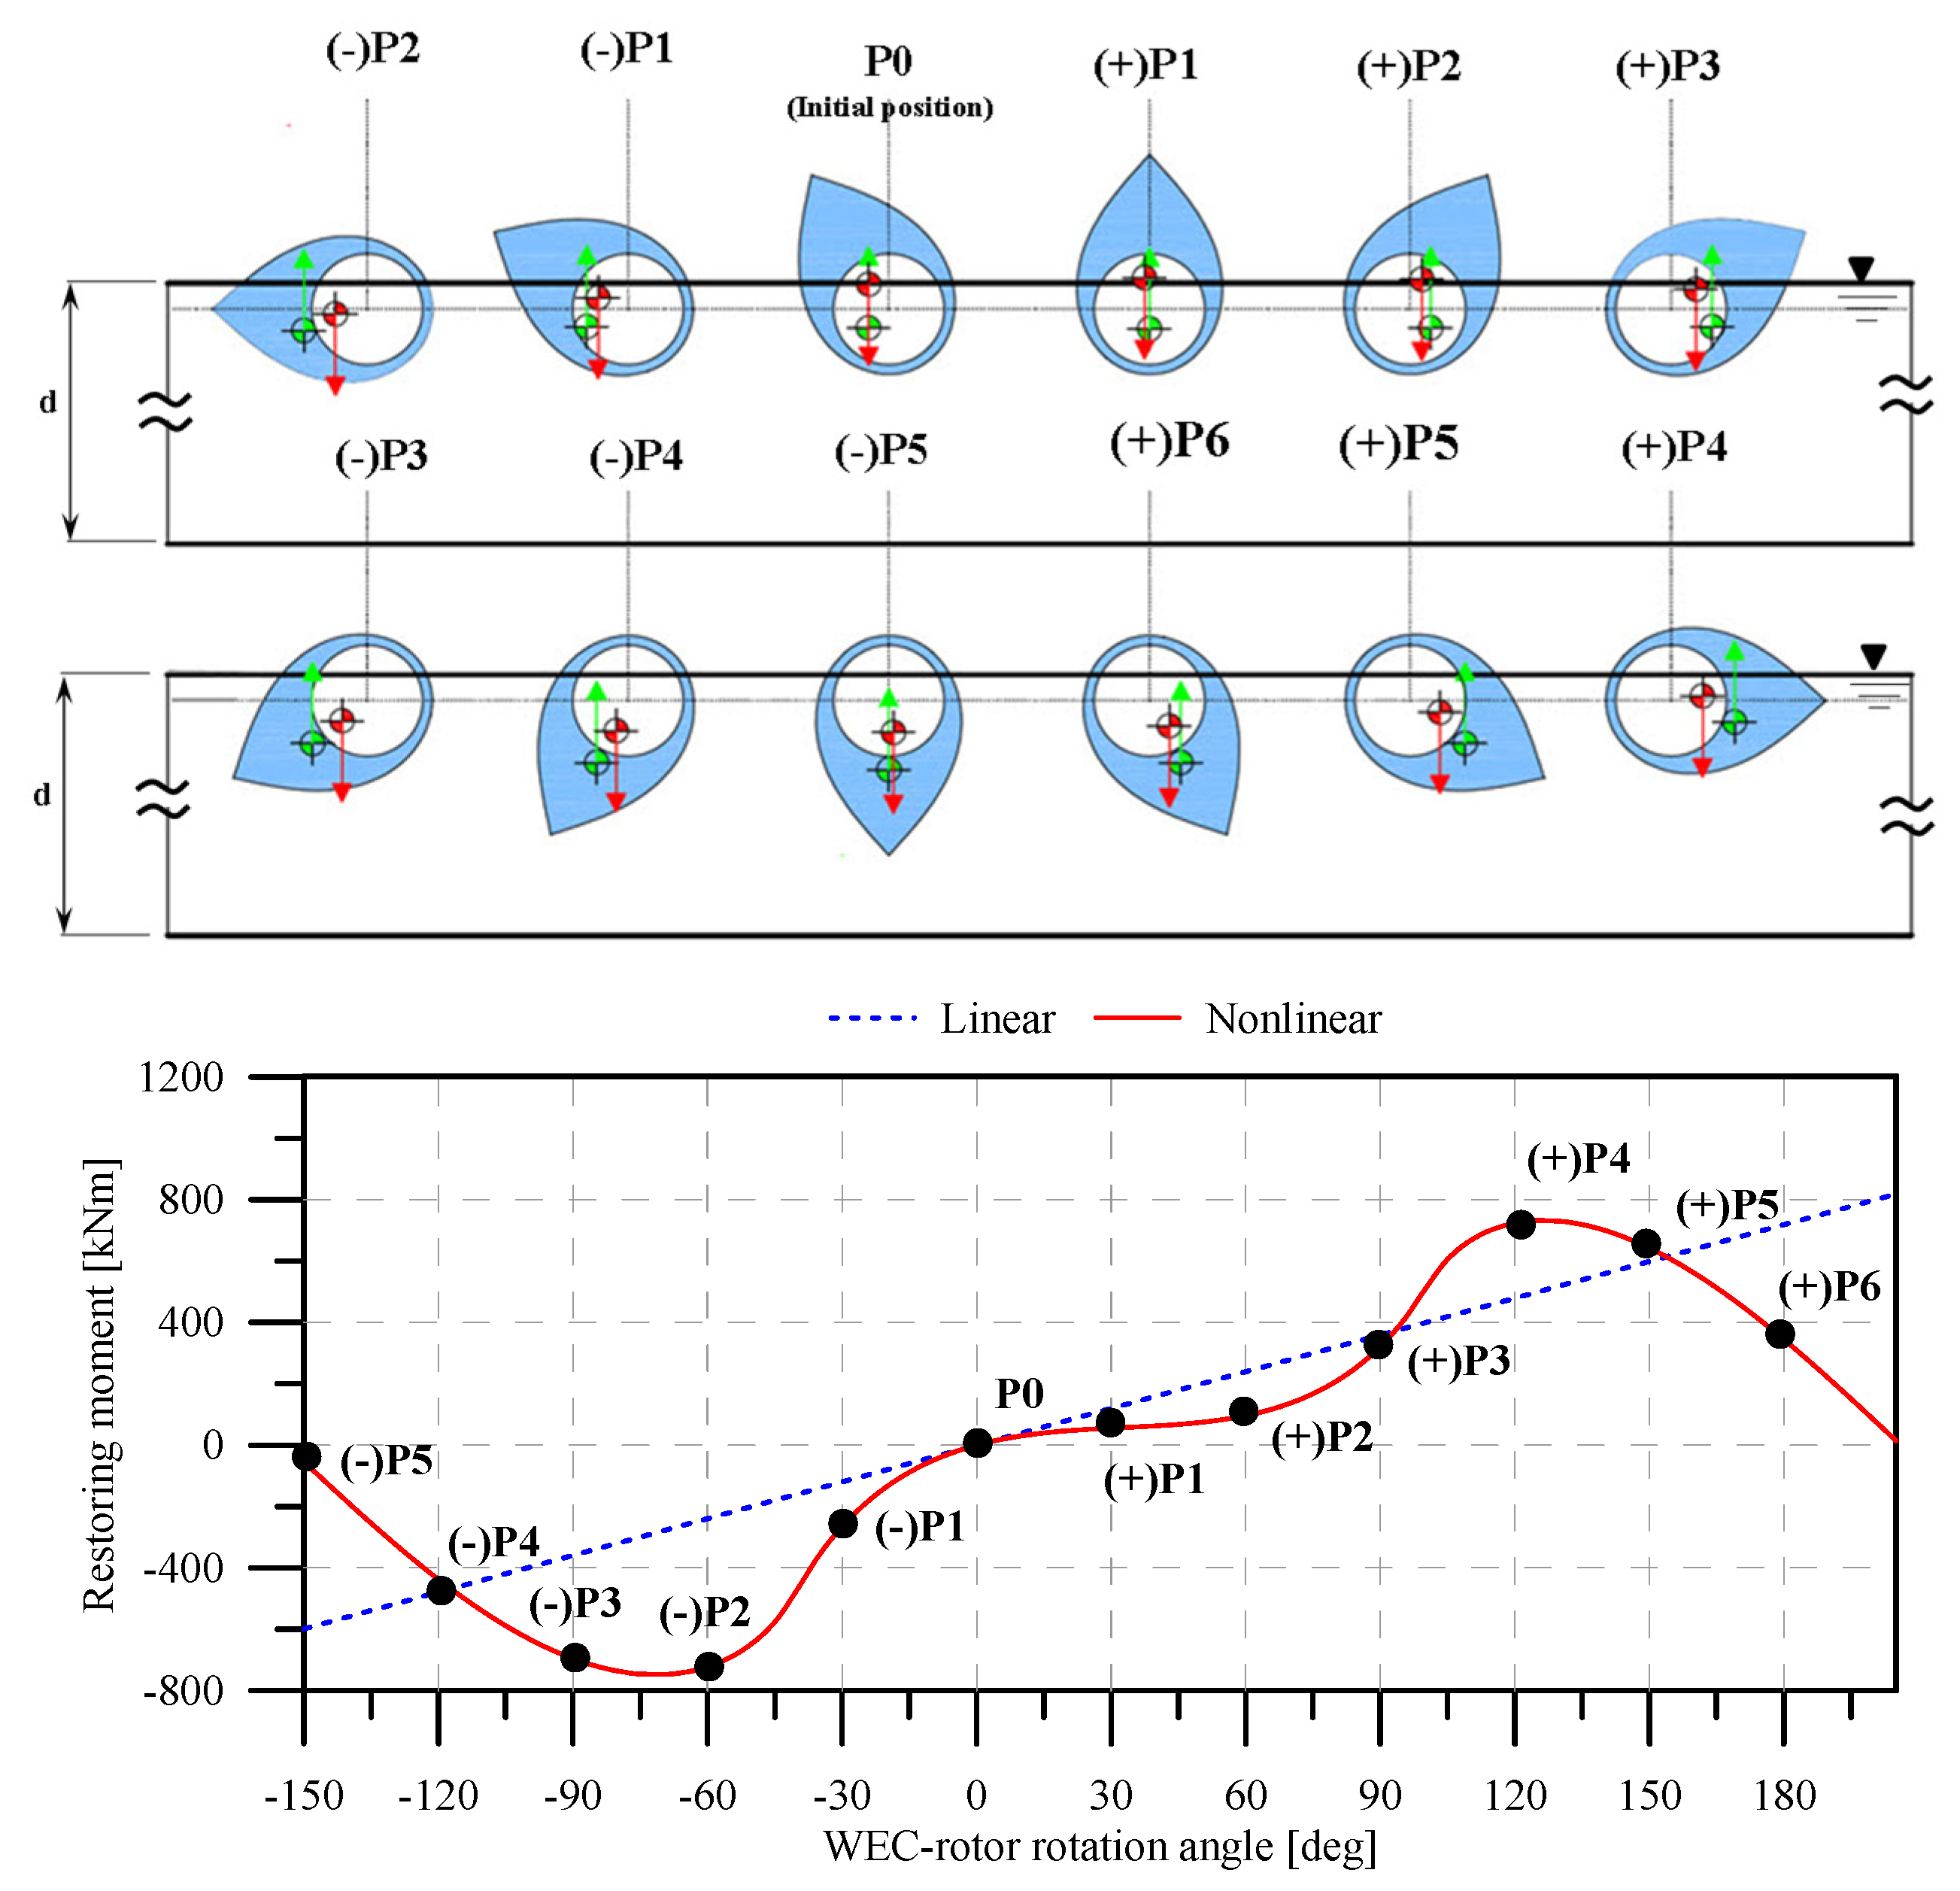
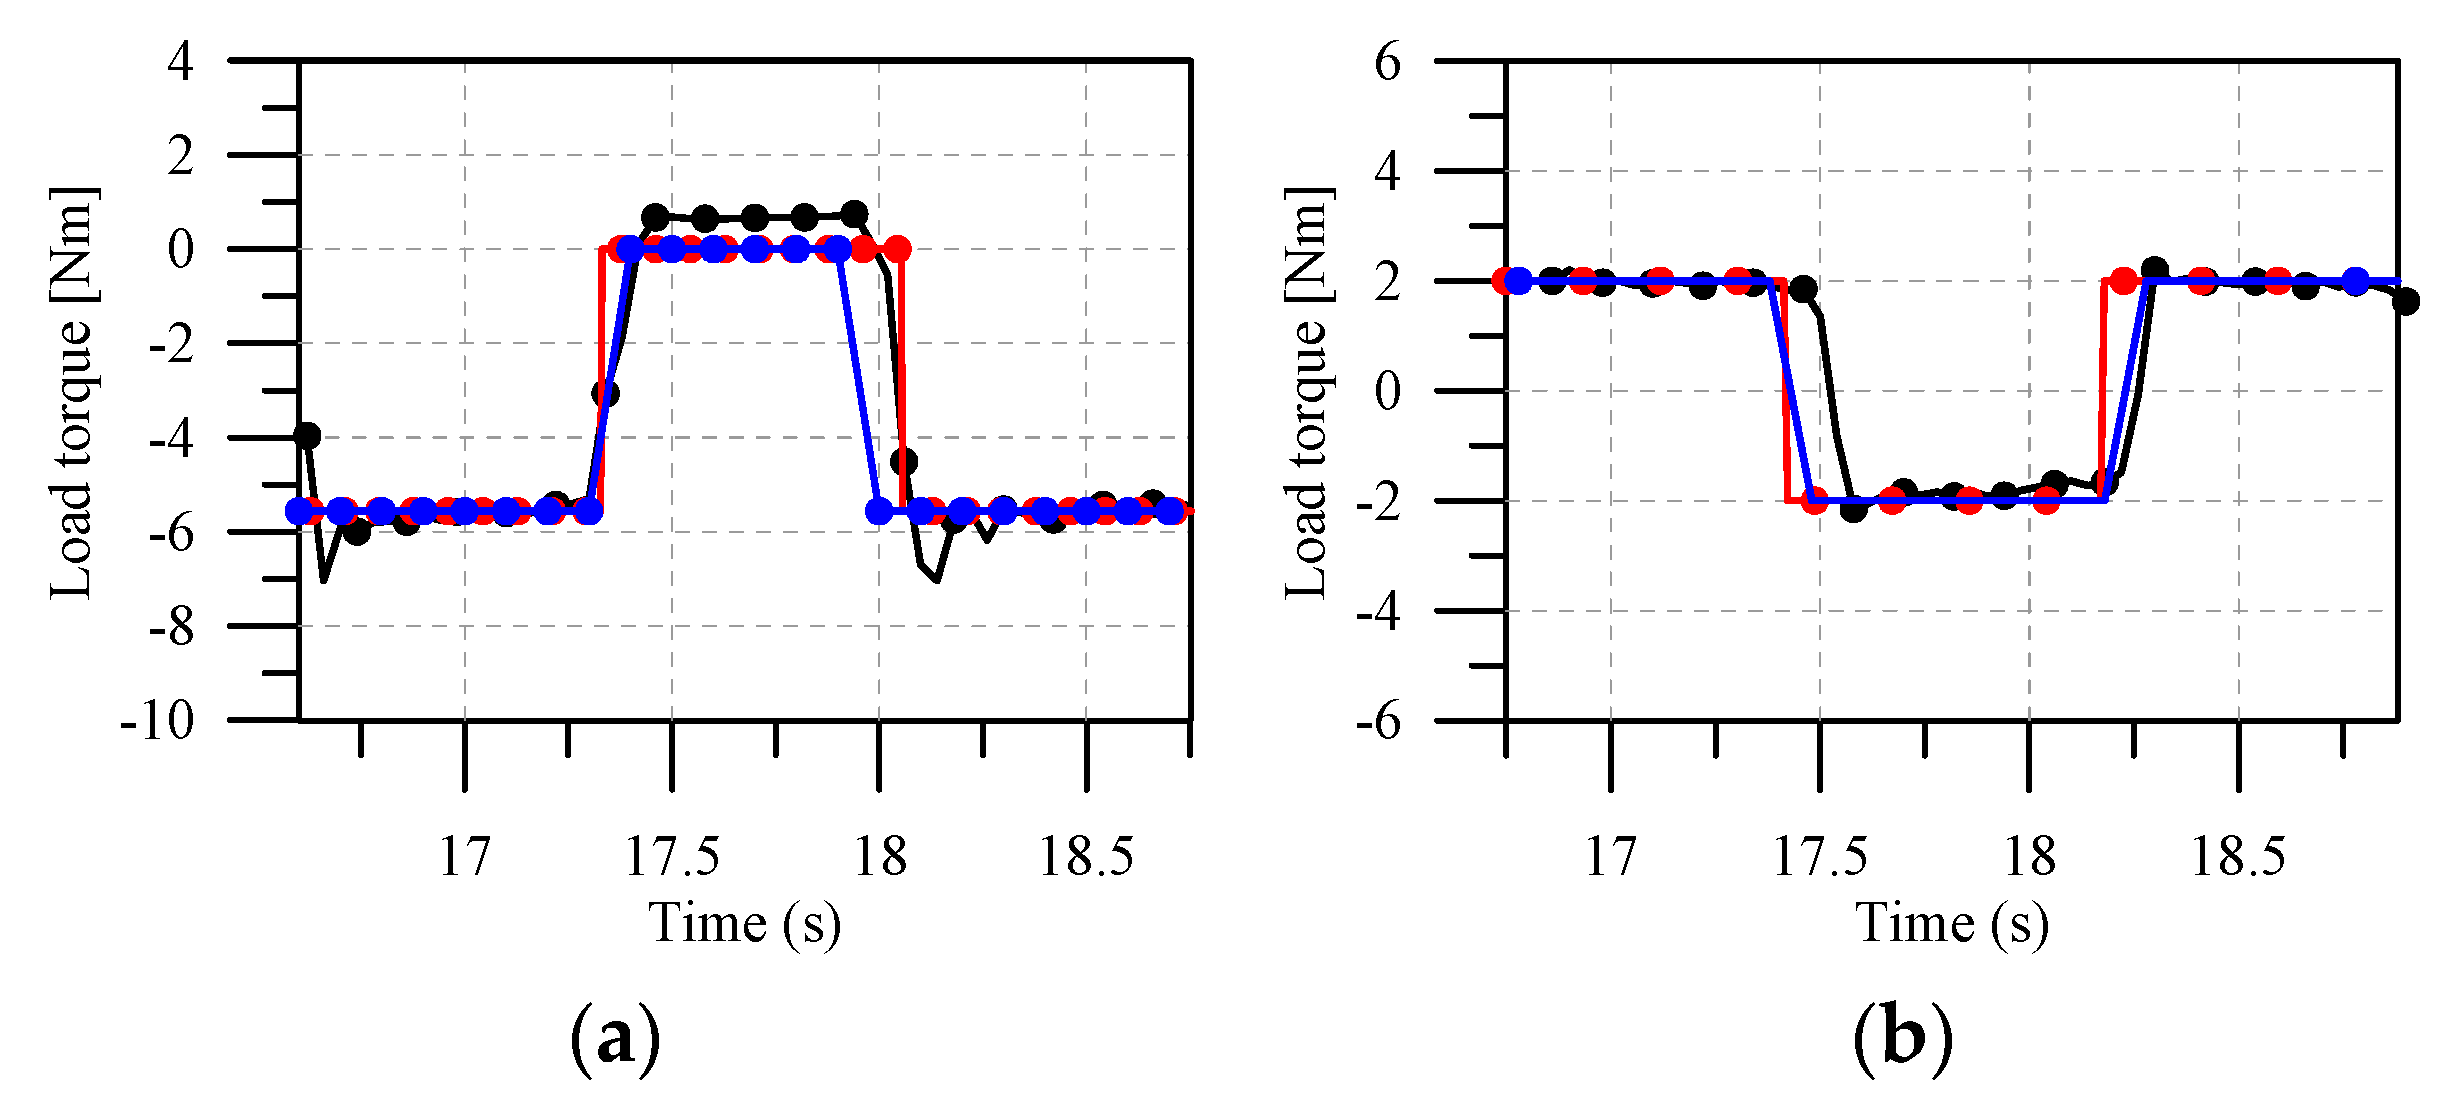
3. Implementation of PTO Load Torque and Nonlinear Restoring Moment
4. Verification of Numerical Models
4.1. Convergence Test
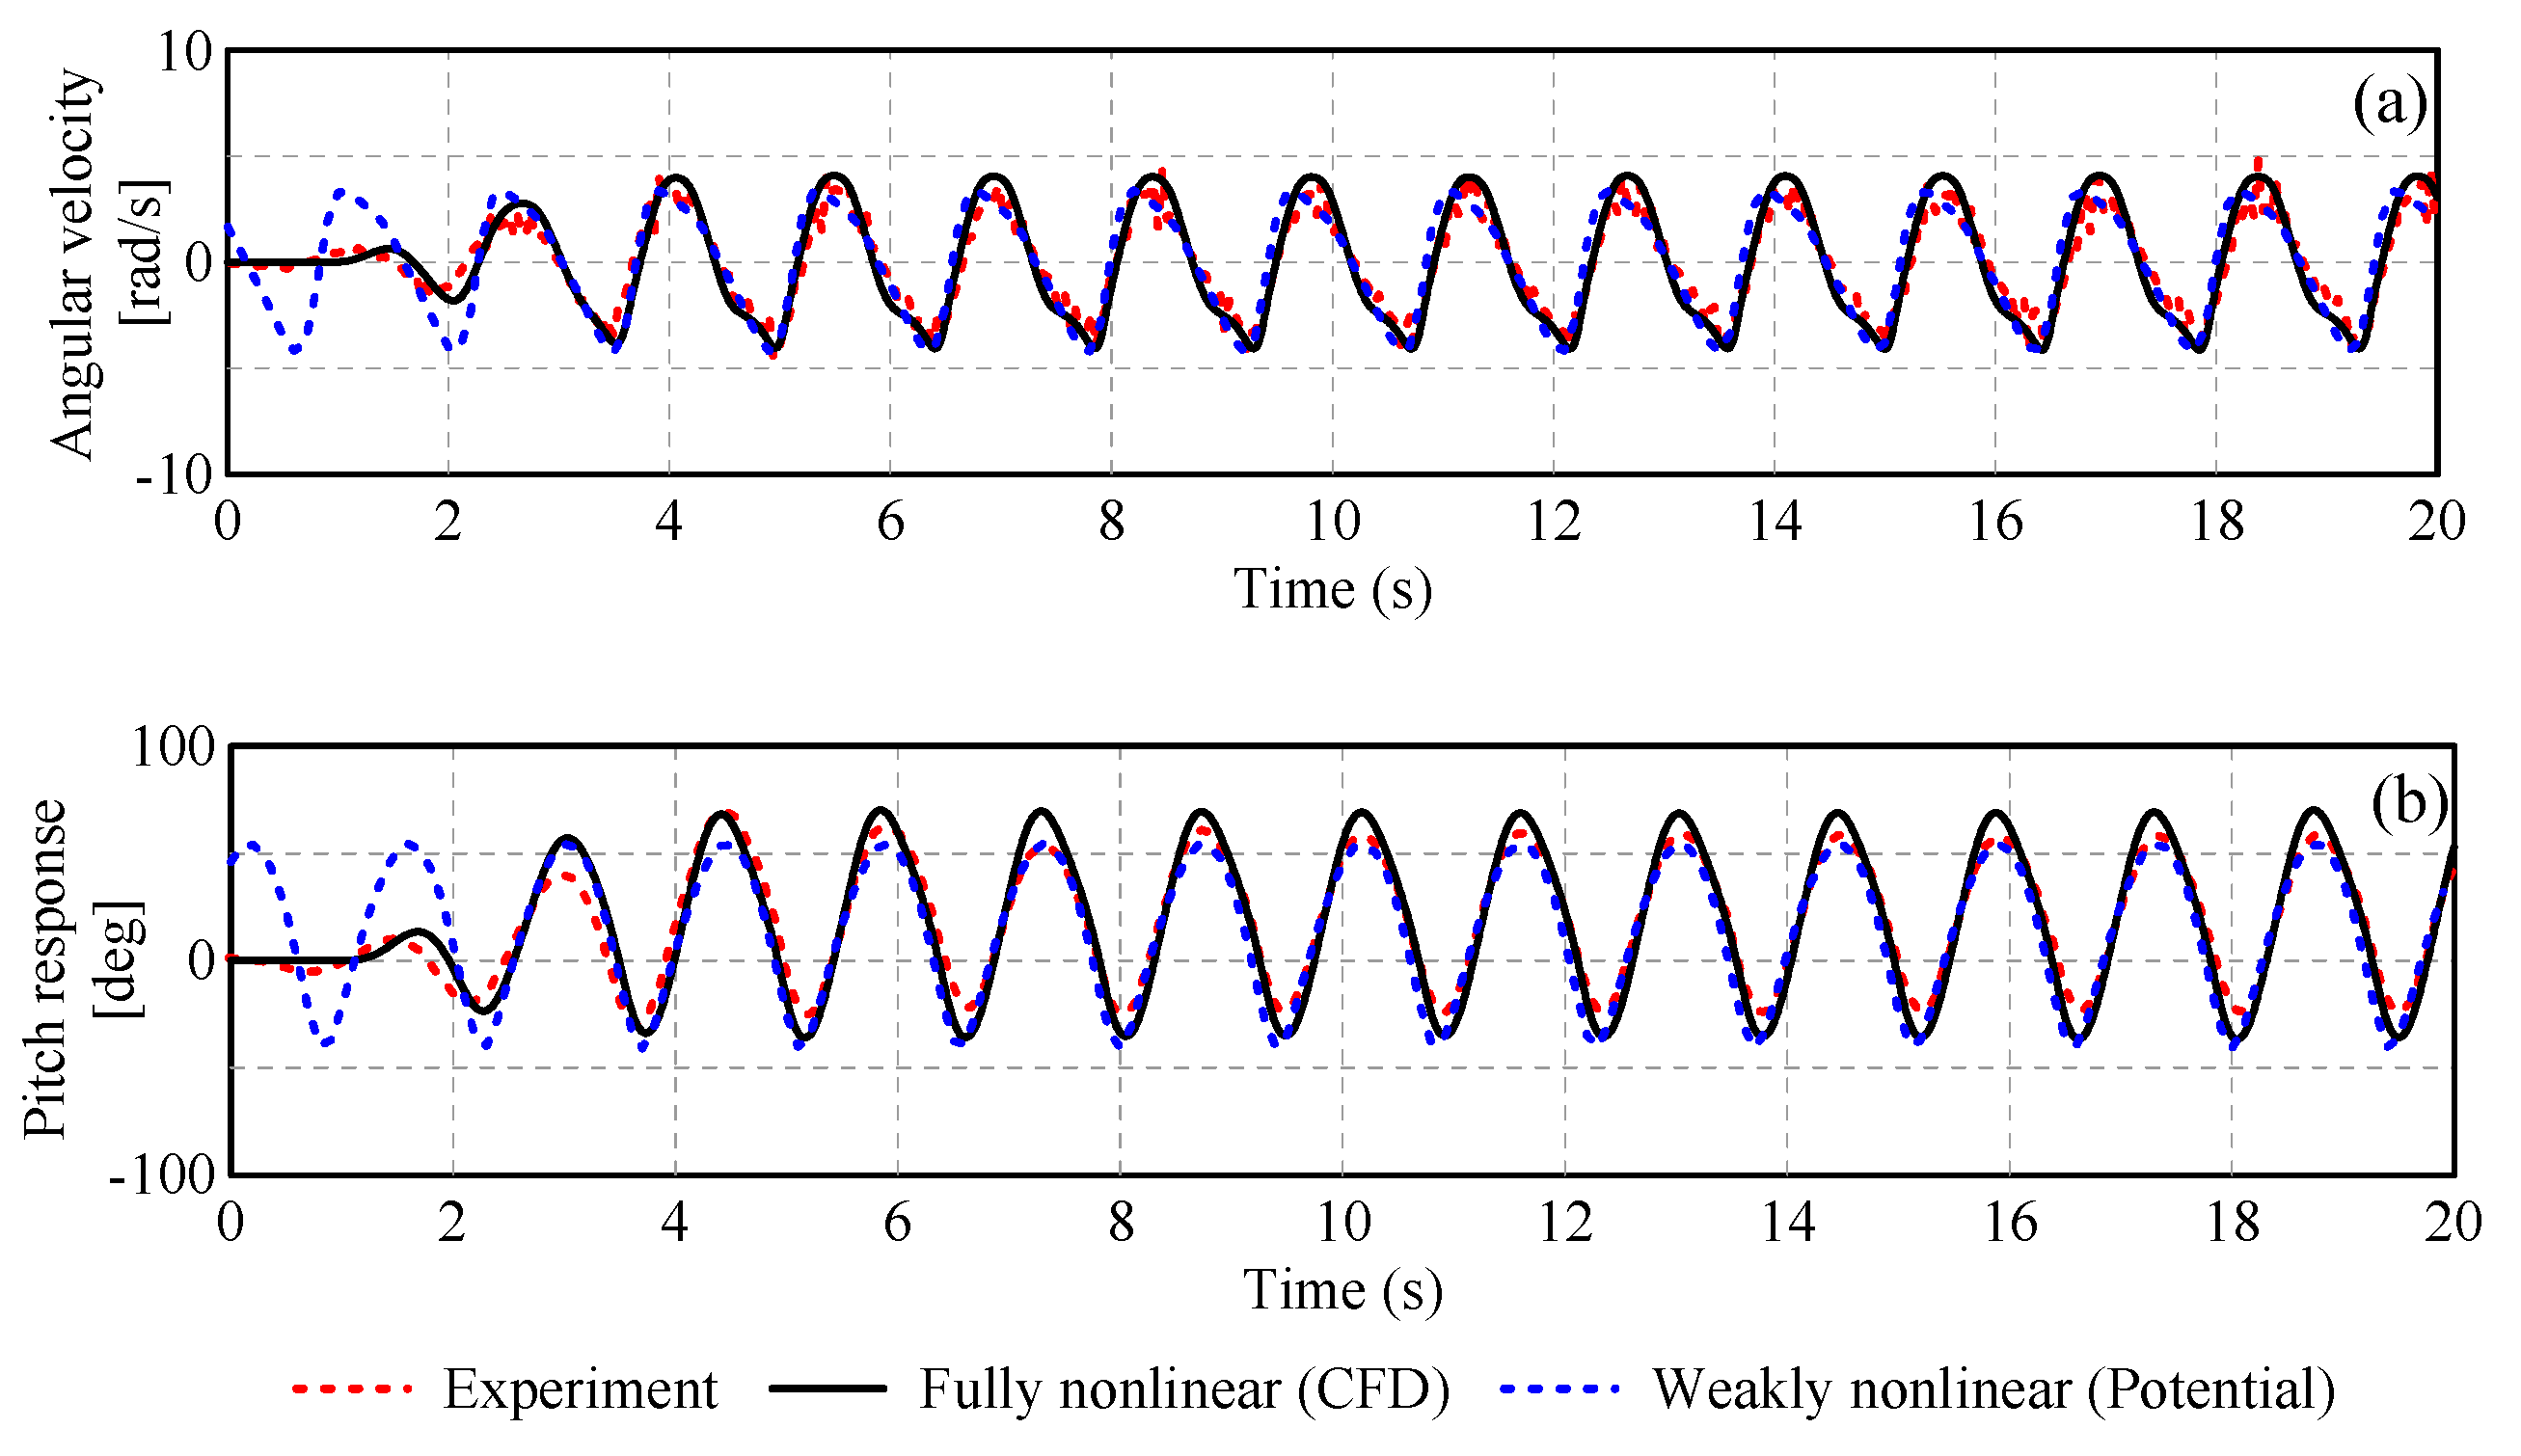
4.2. Numerical Validation
5. Results and Discussion
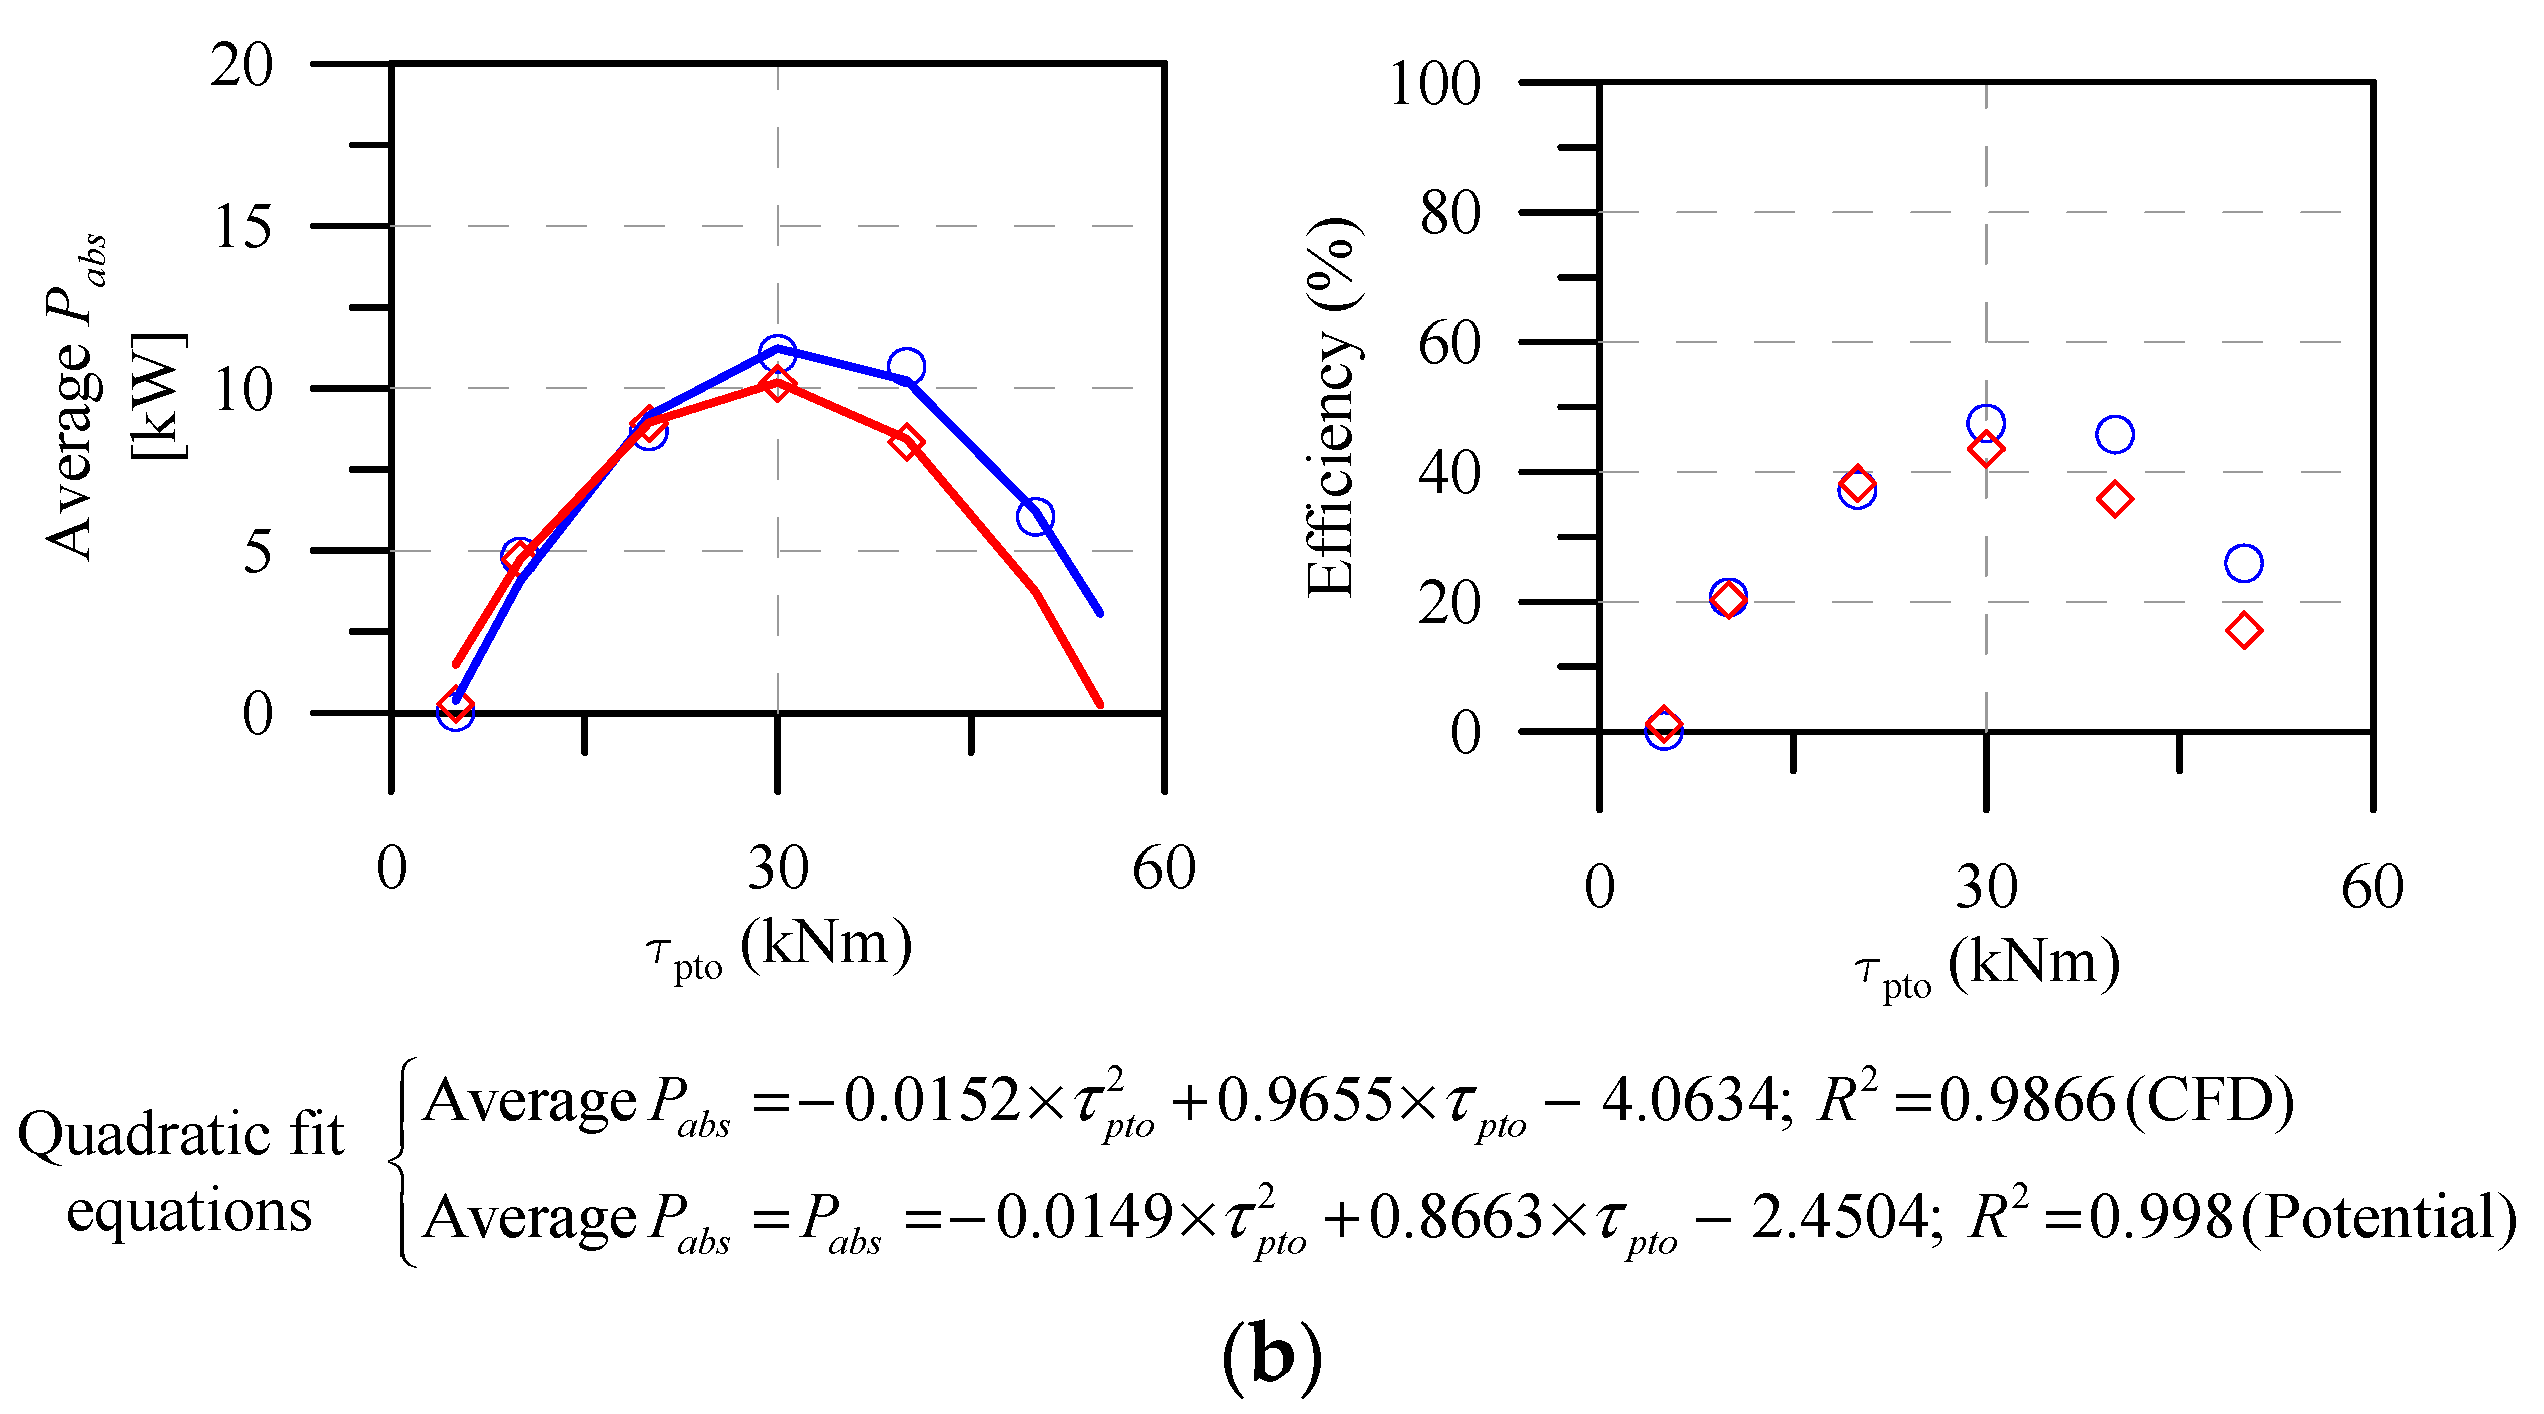
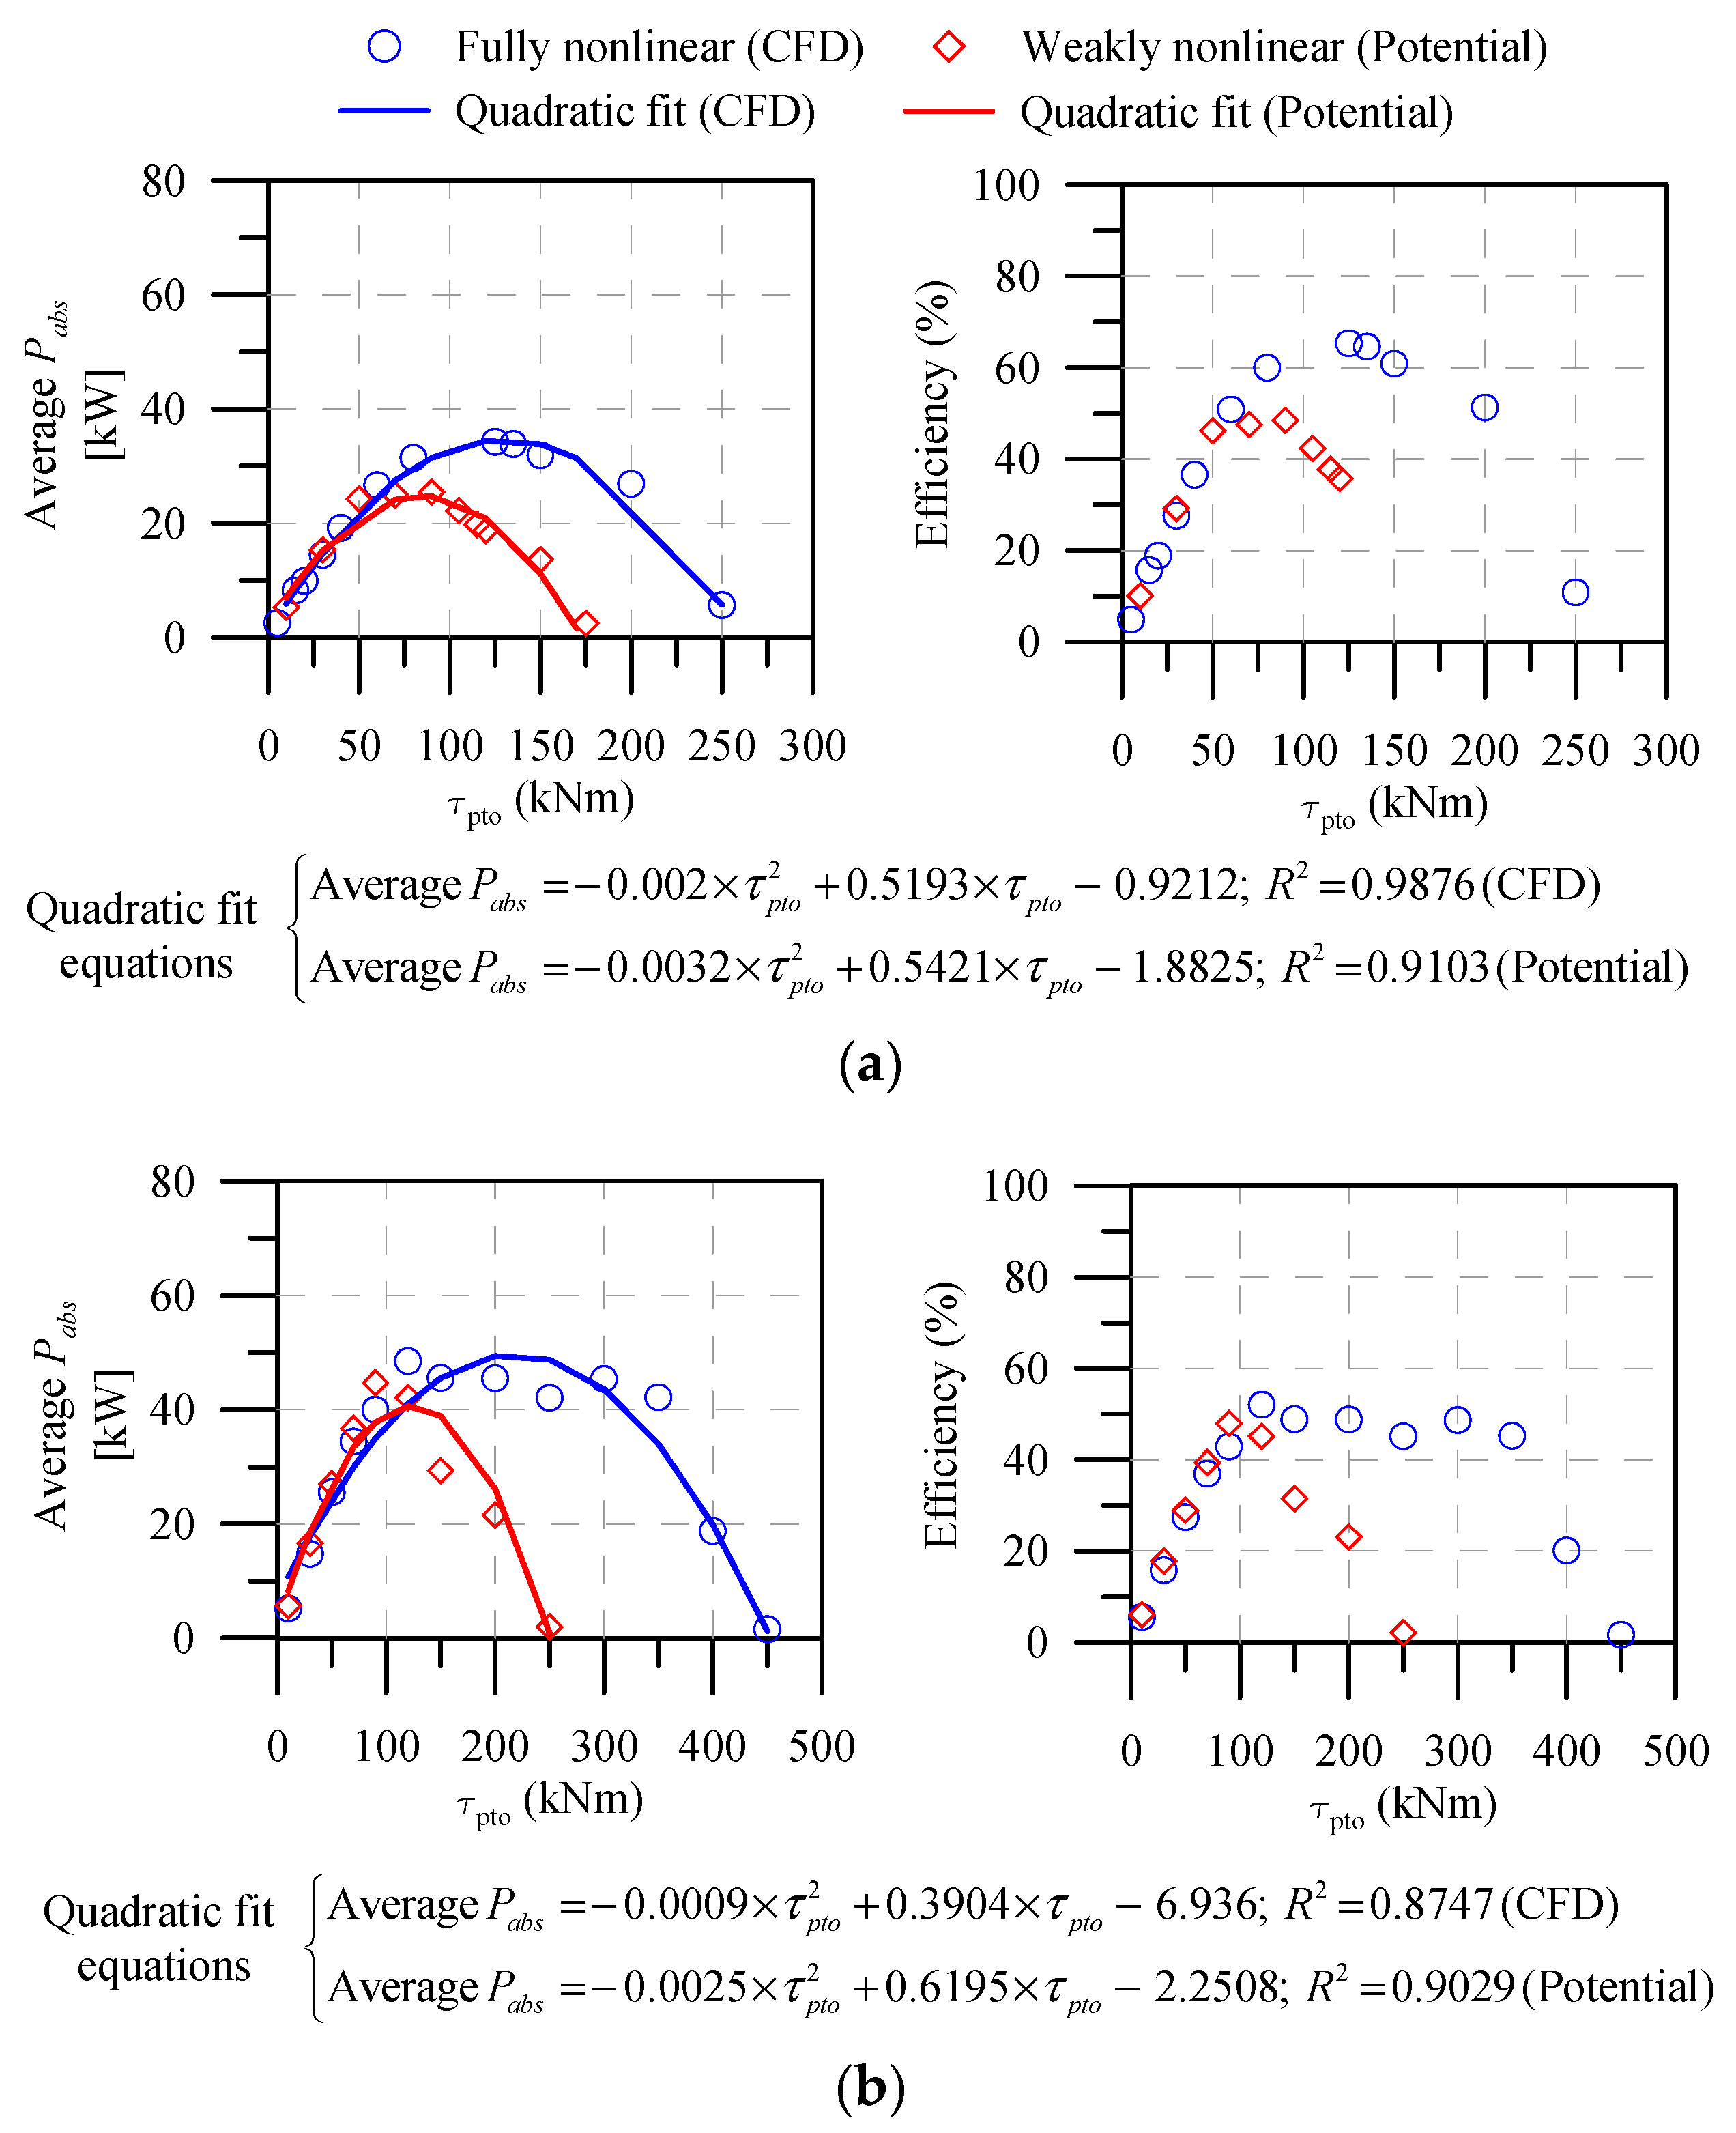
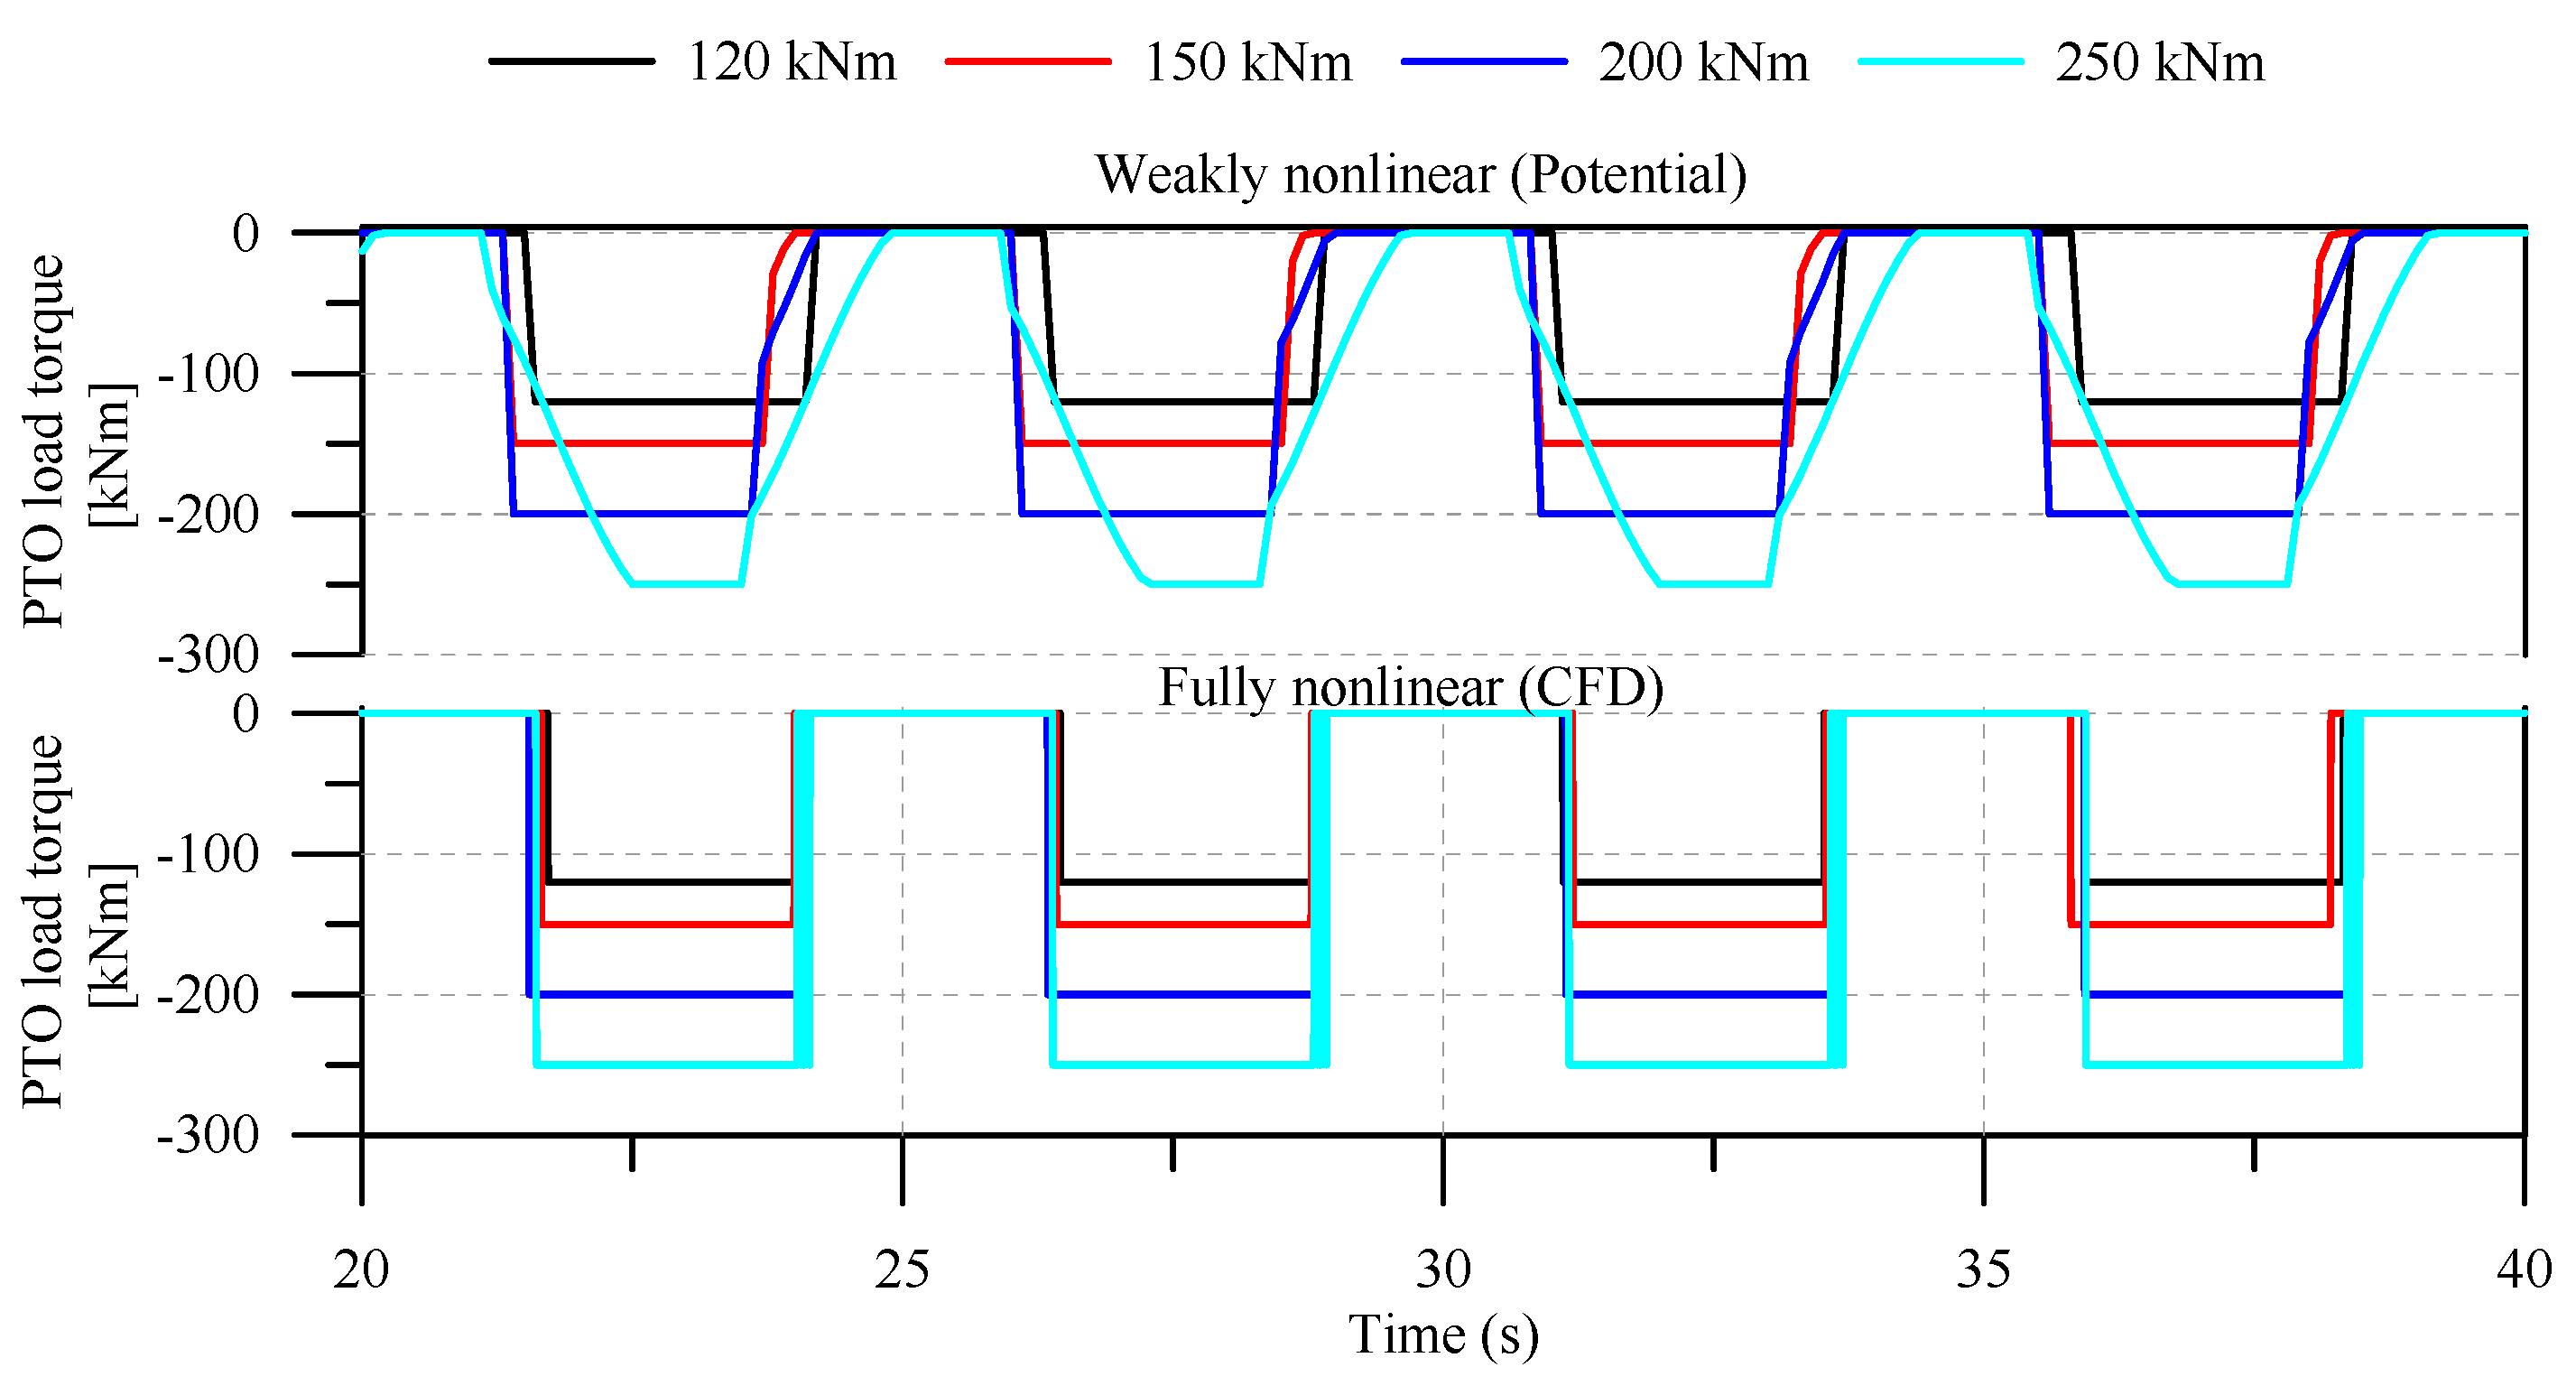
5.1. Effect of PTO Load Torque
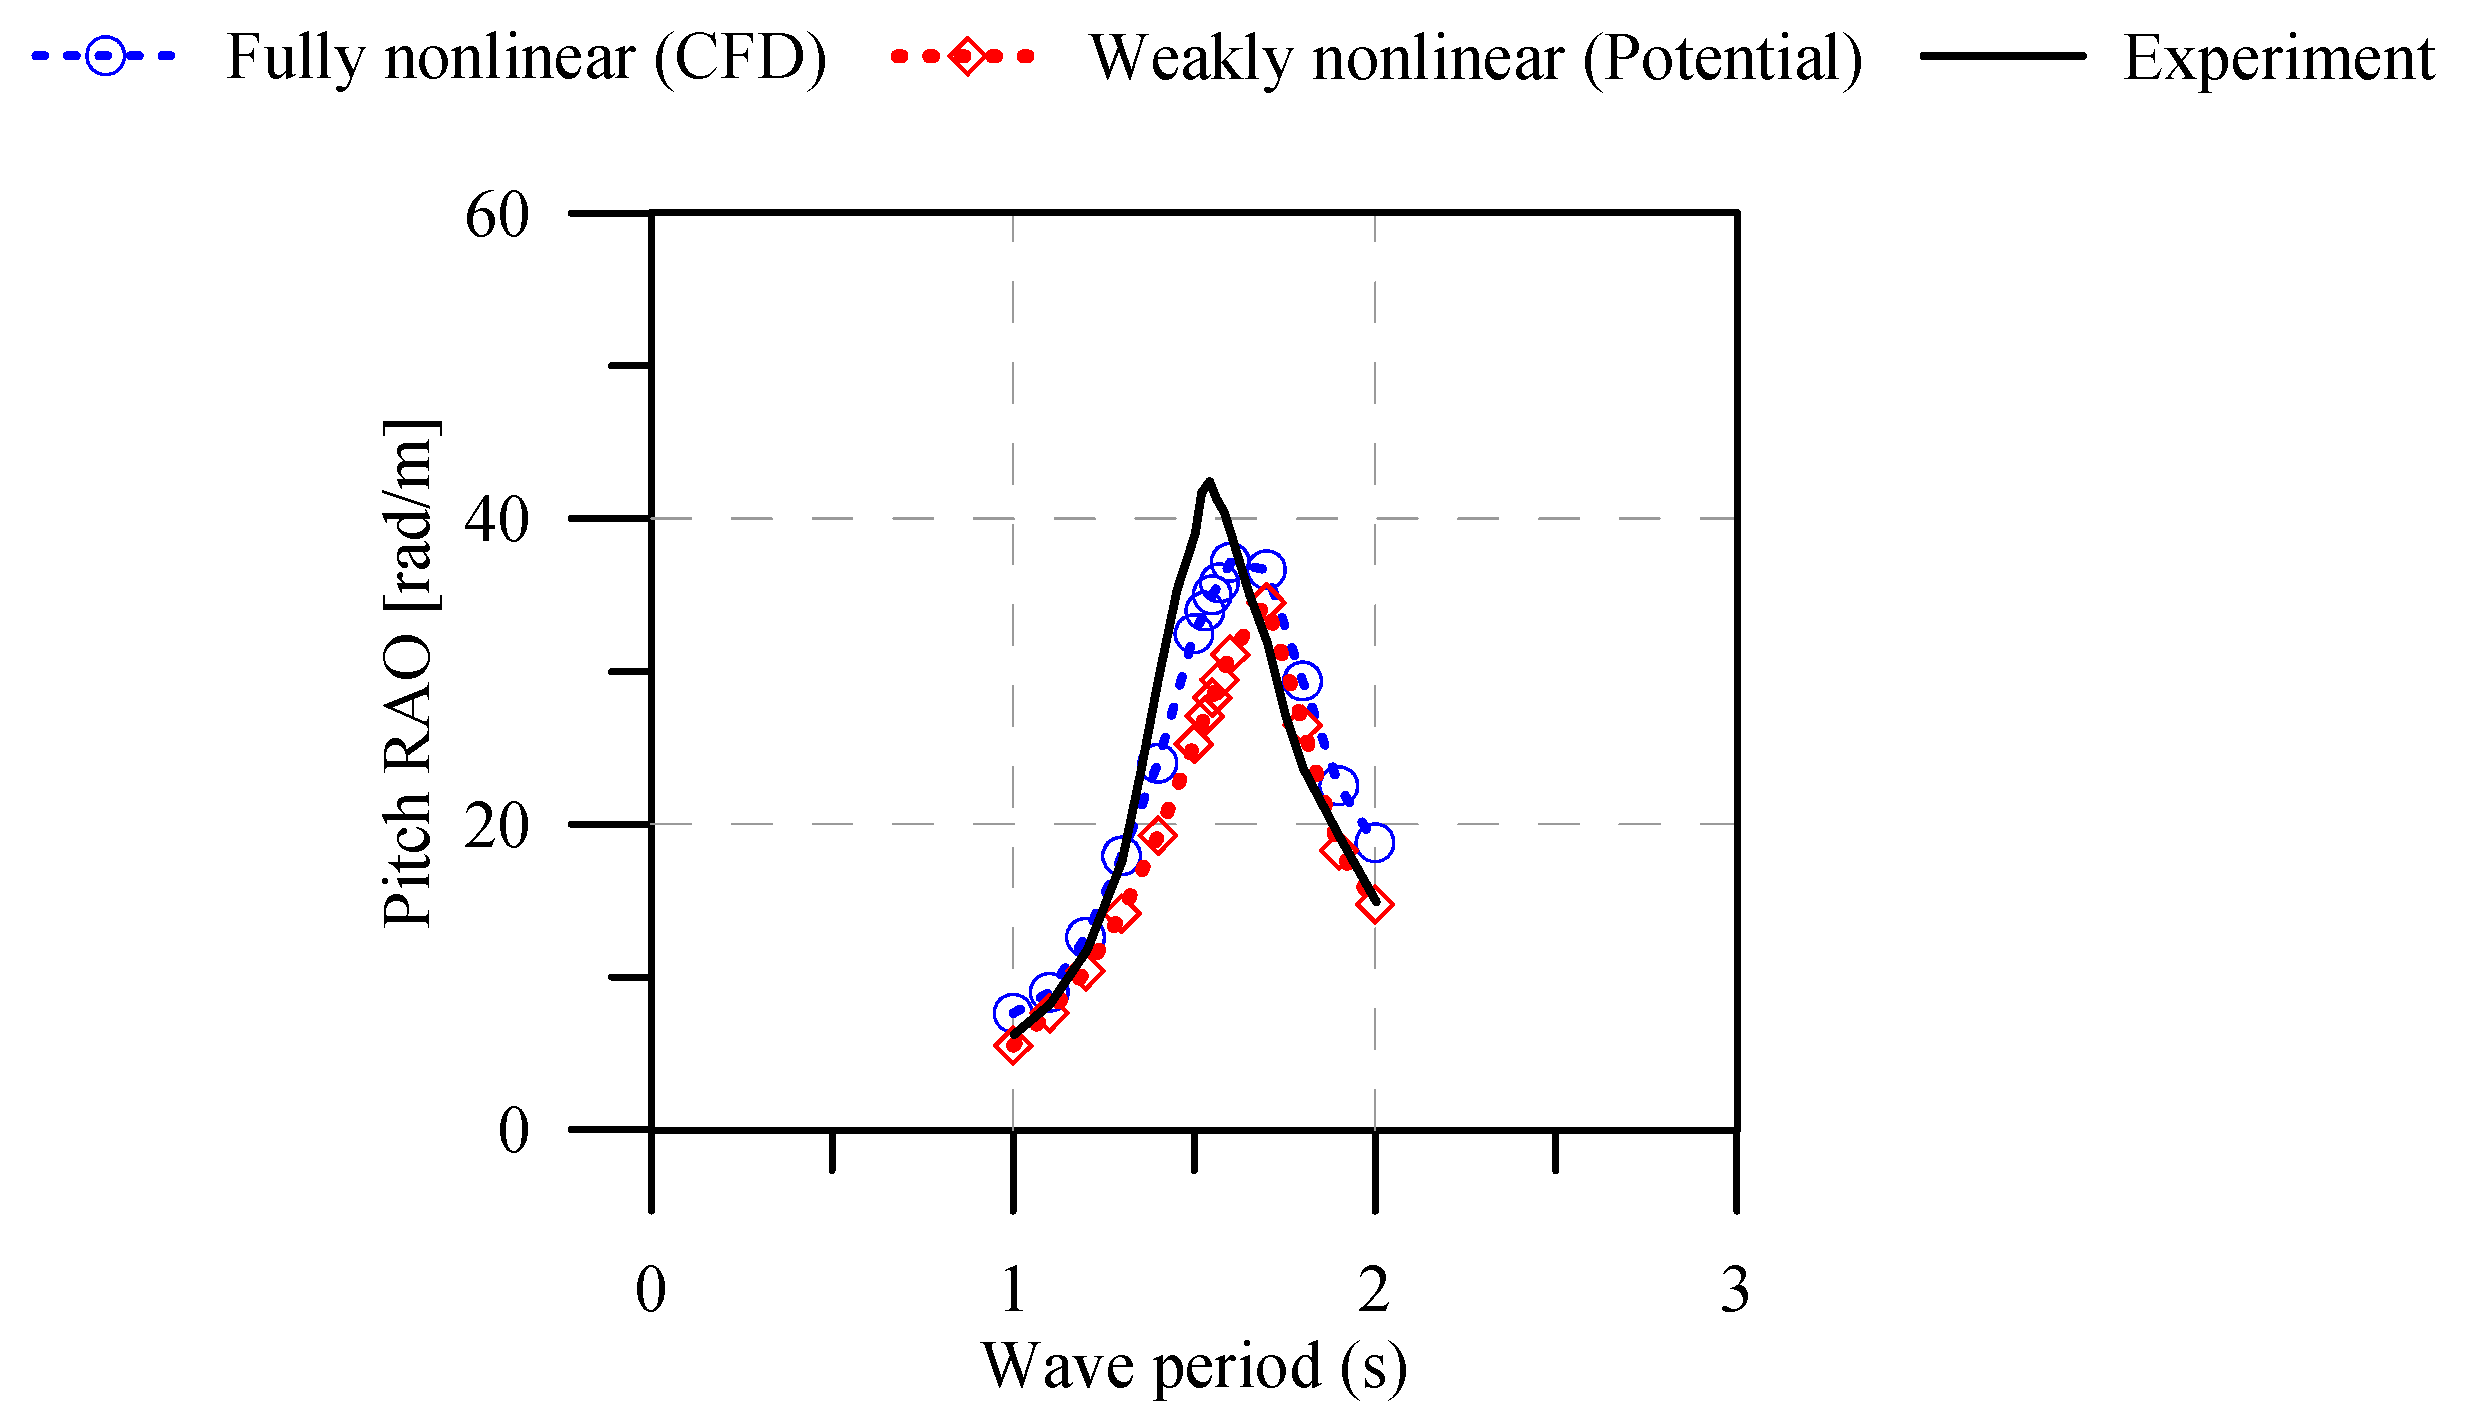
5.2. Effect of the Wave Period
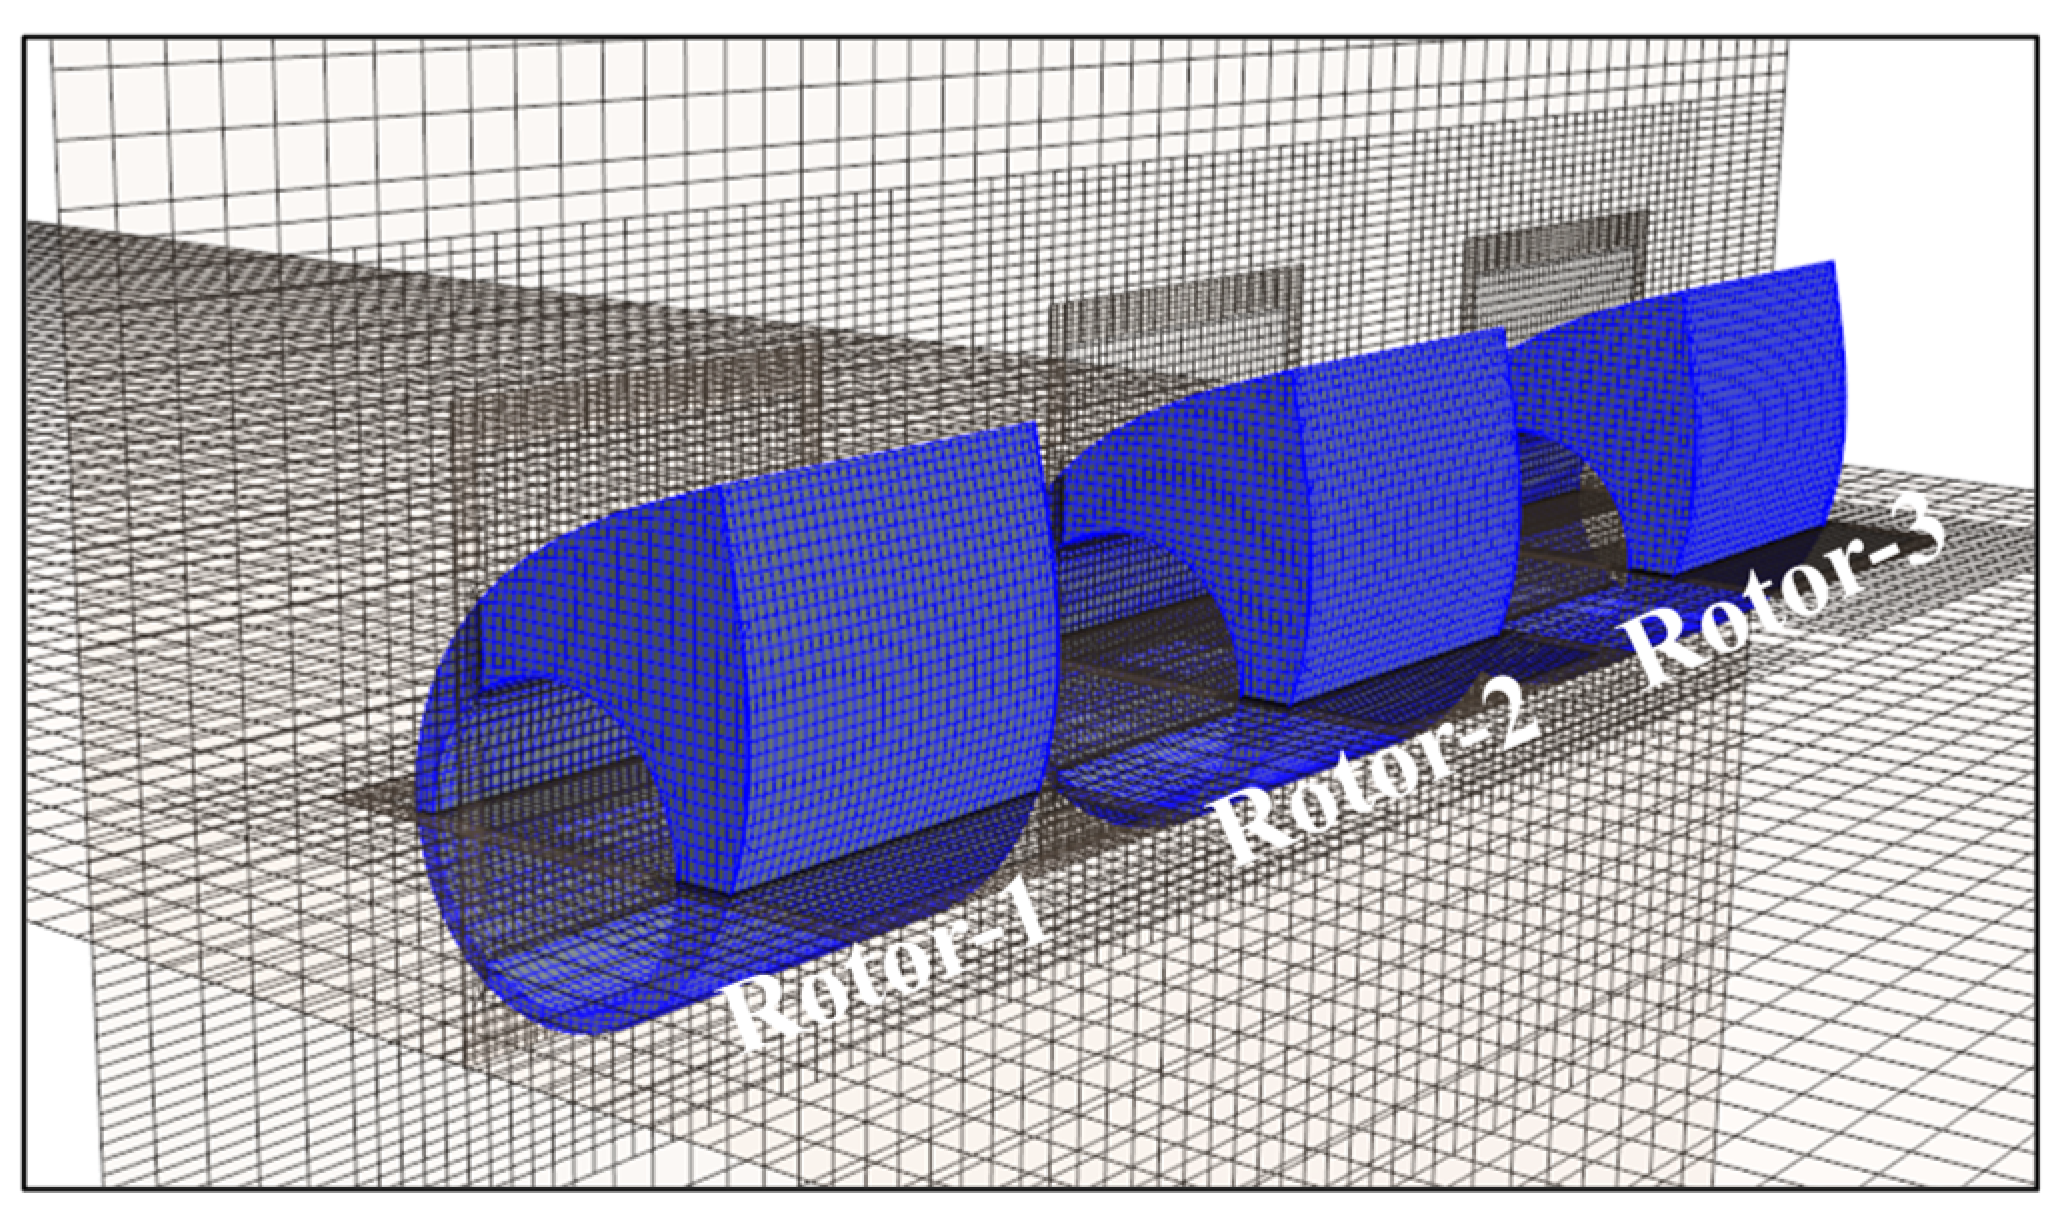
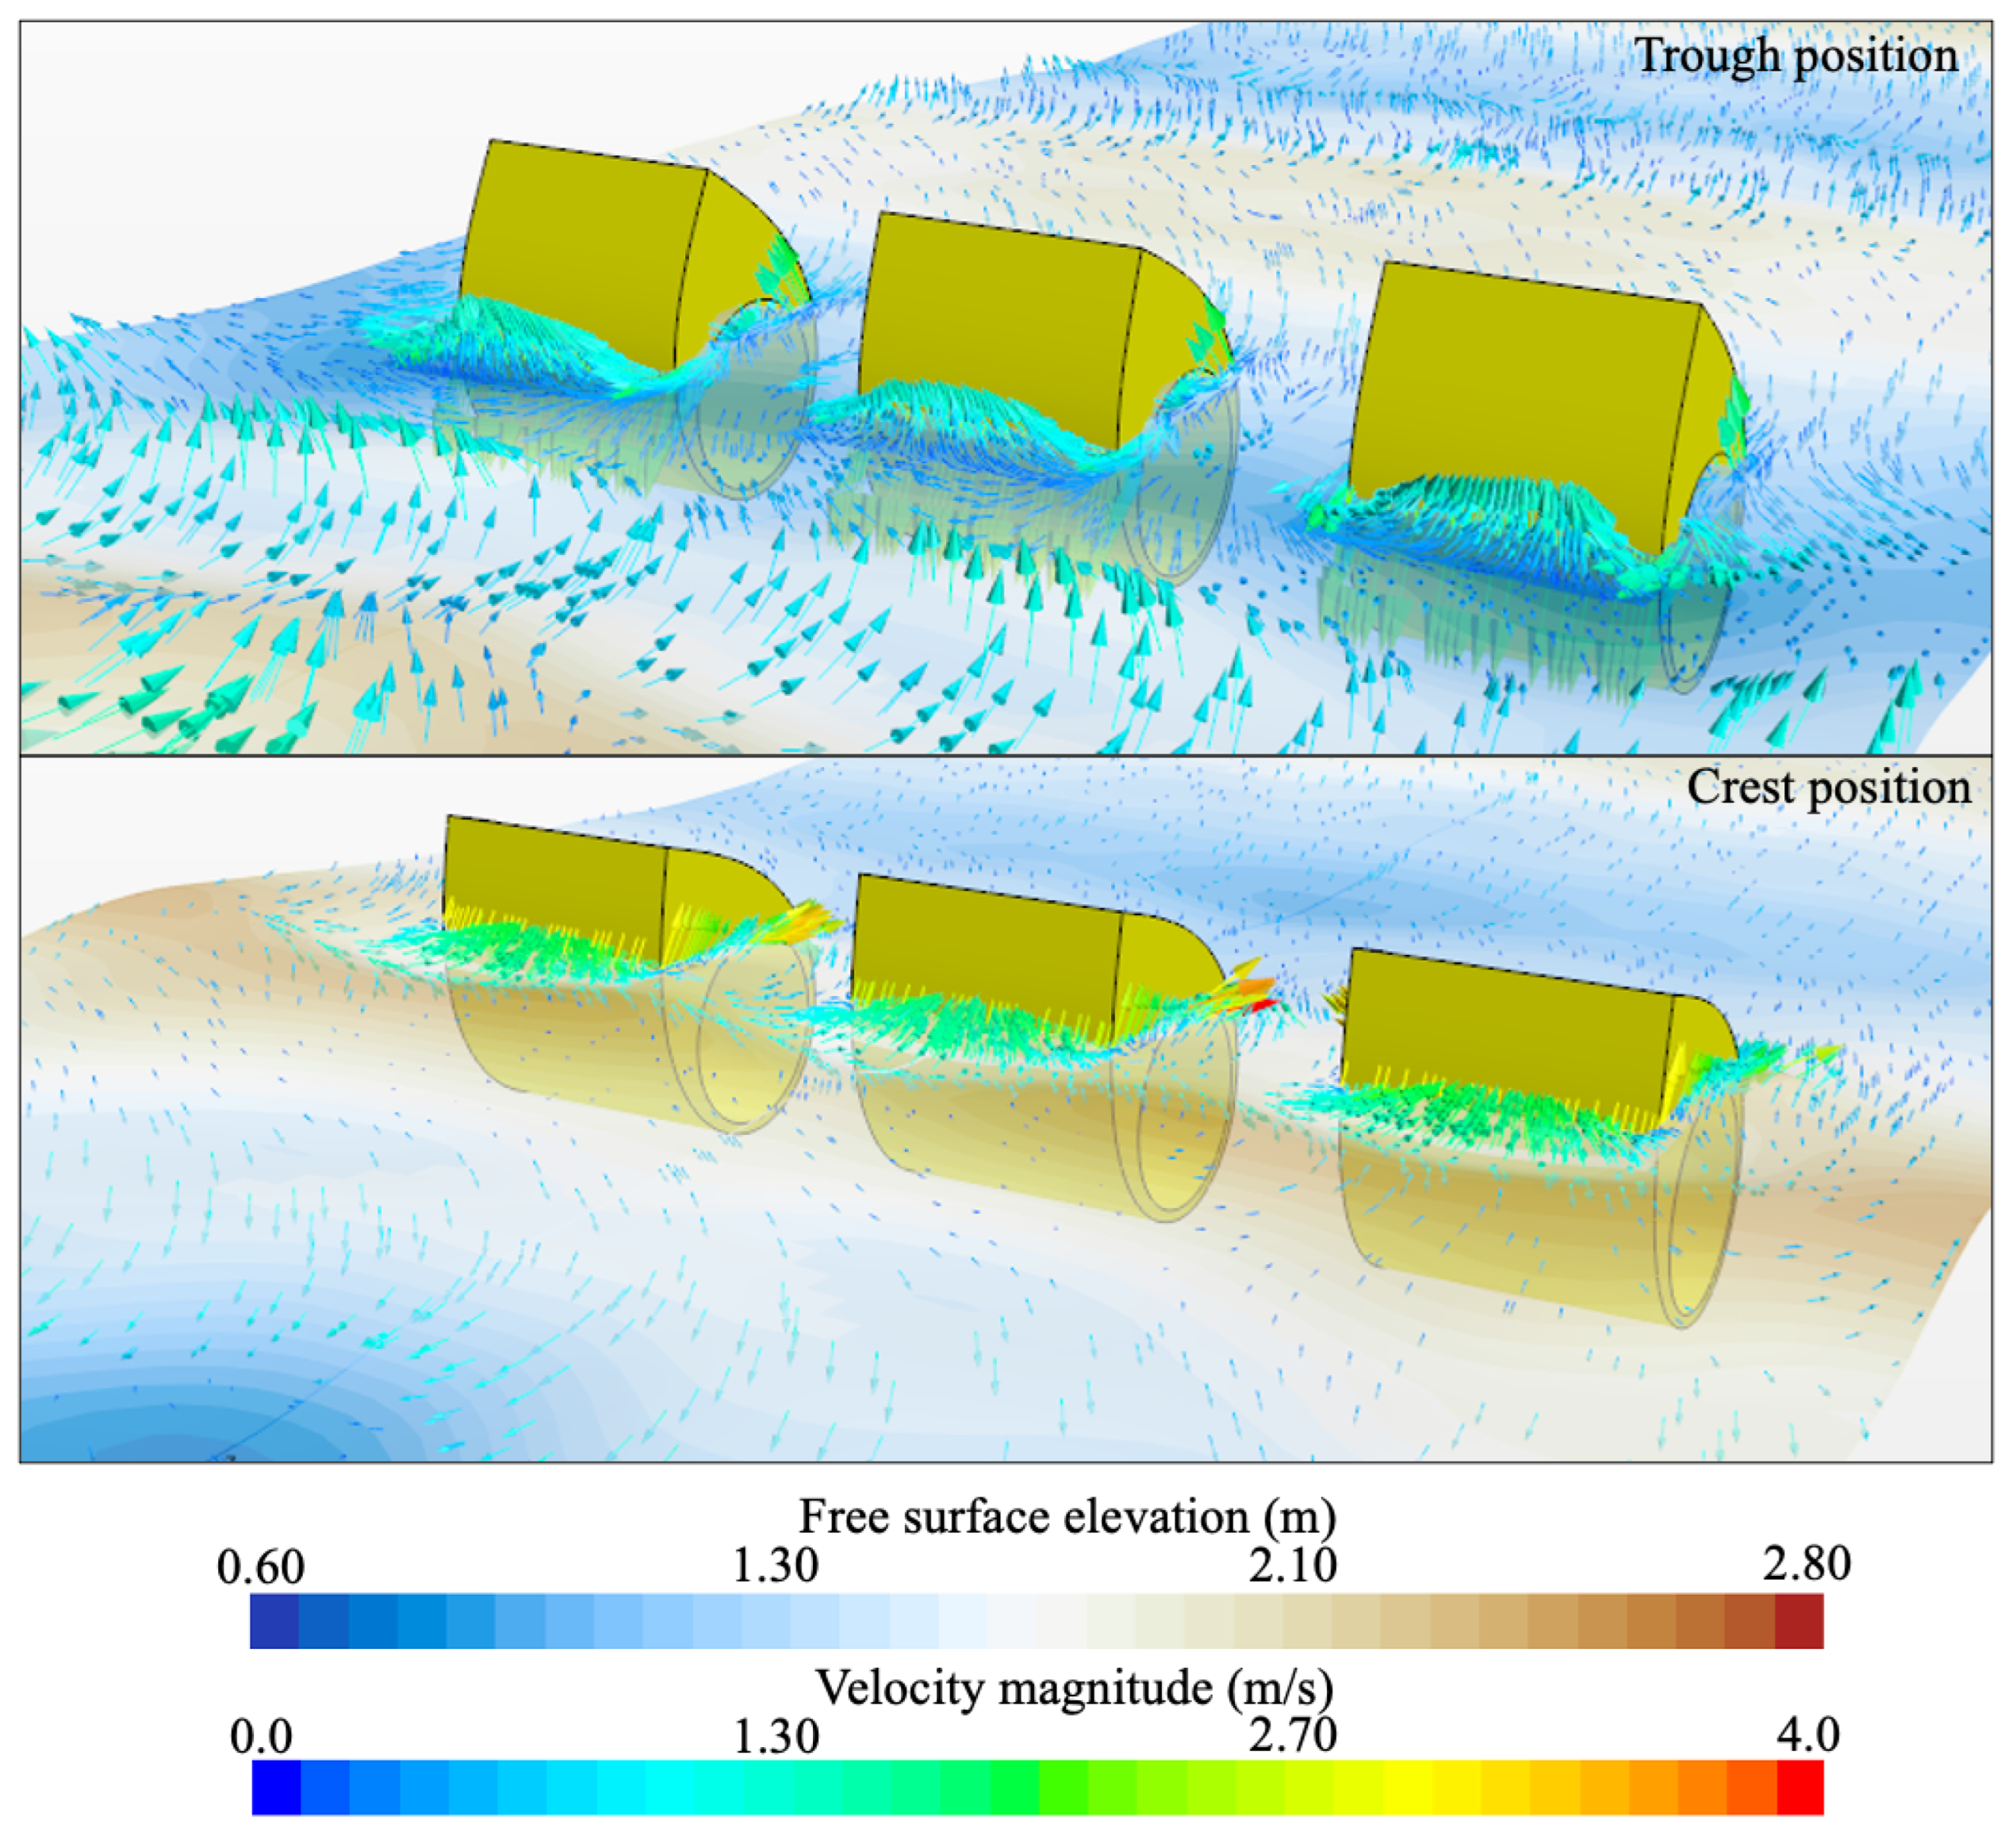
5.3. Effect of the Number of WEC Rotors
5.4. Effect of Wave Steepness
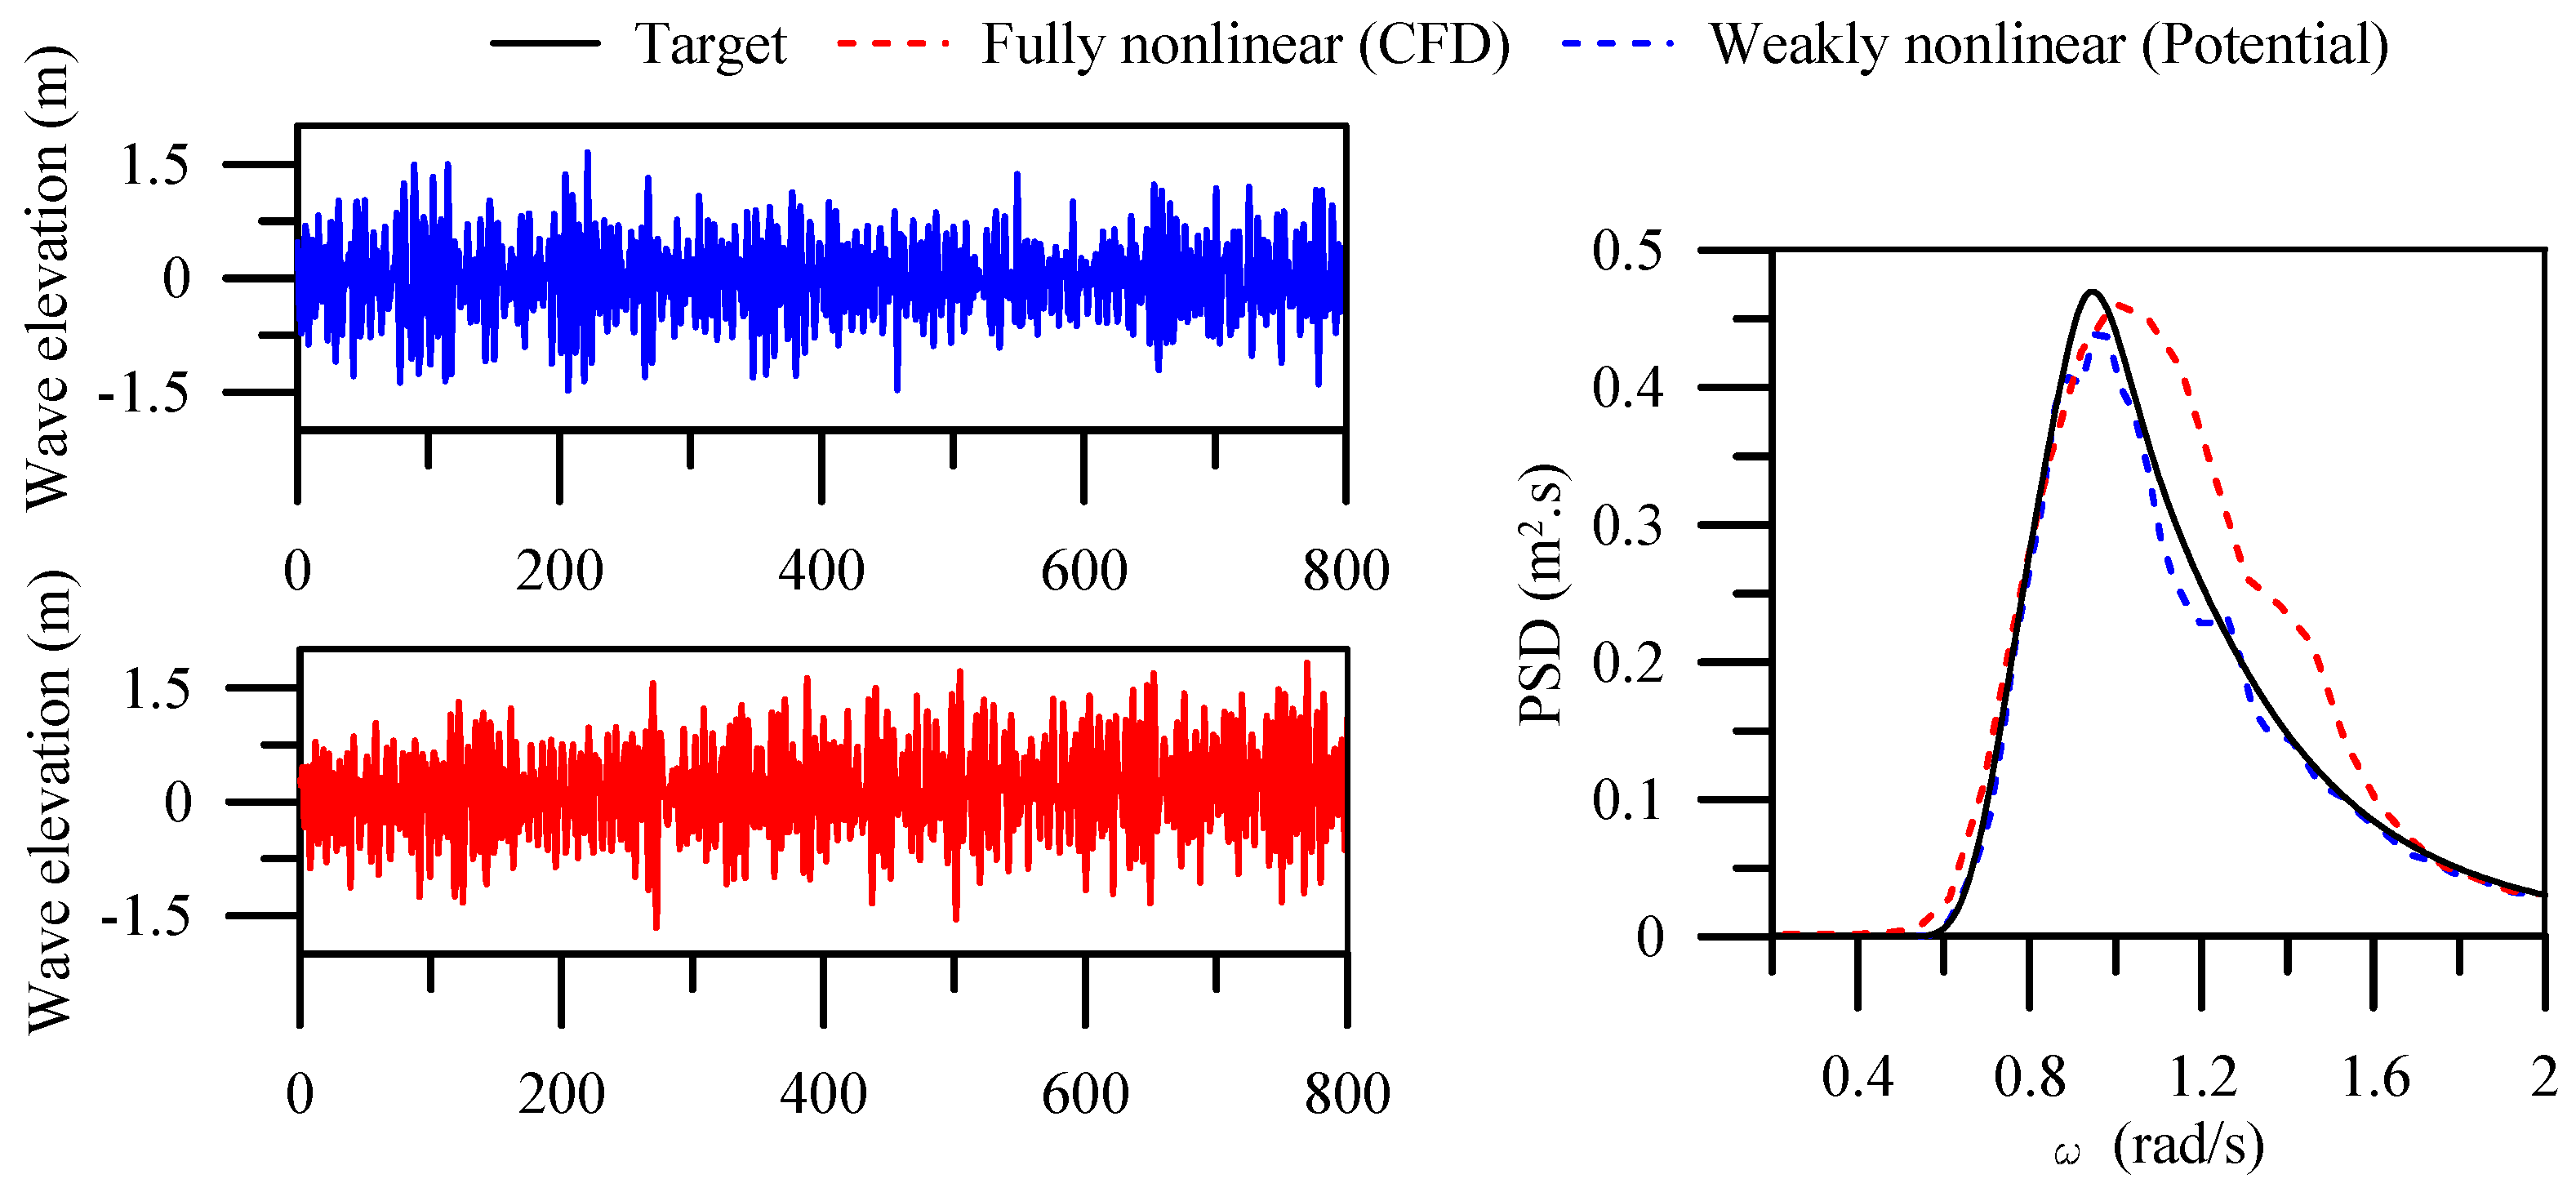
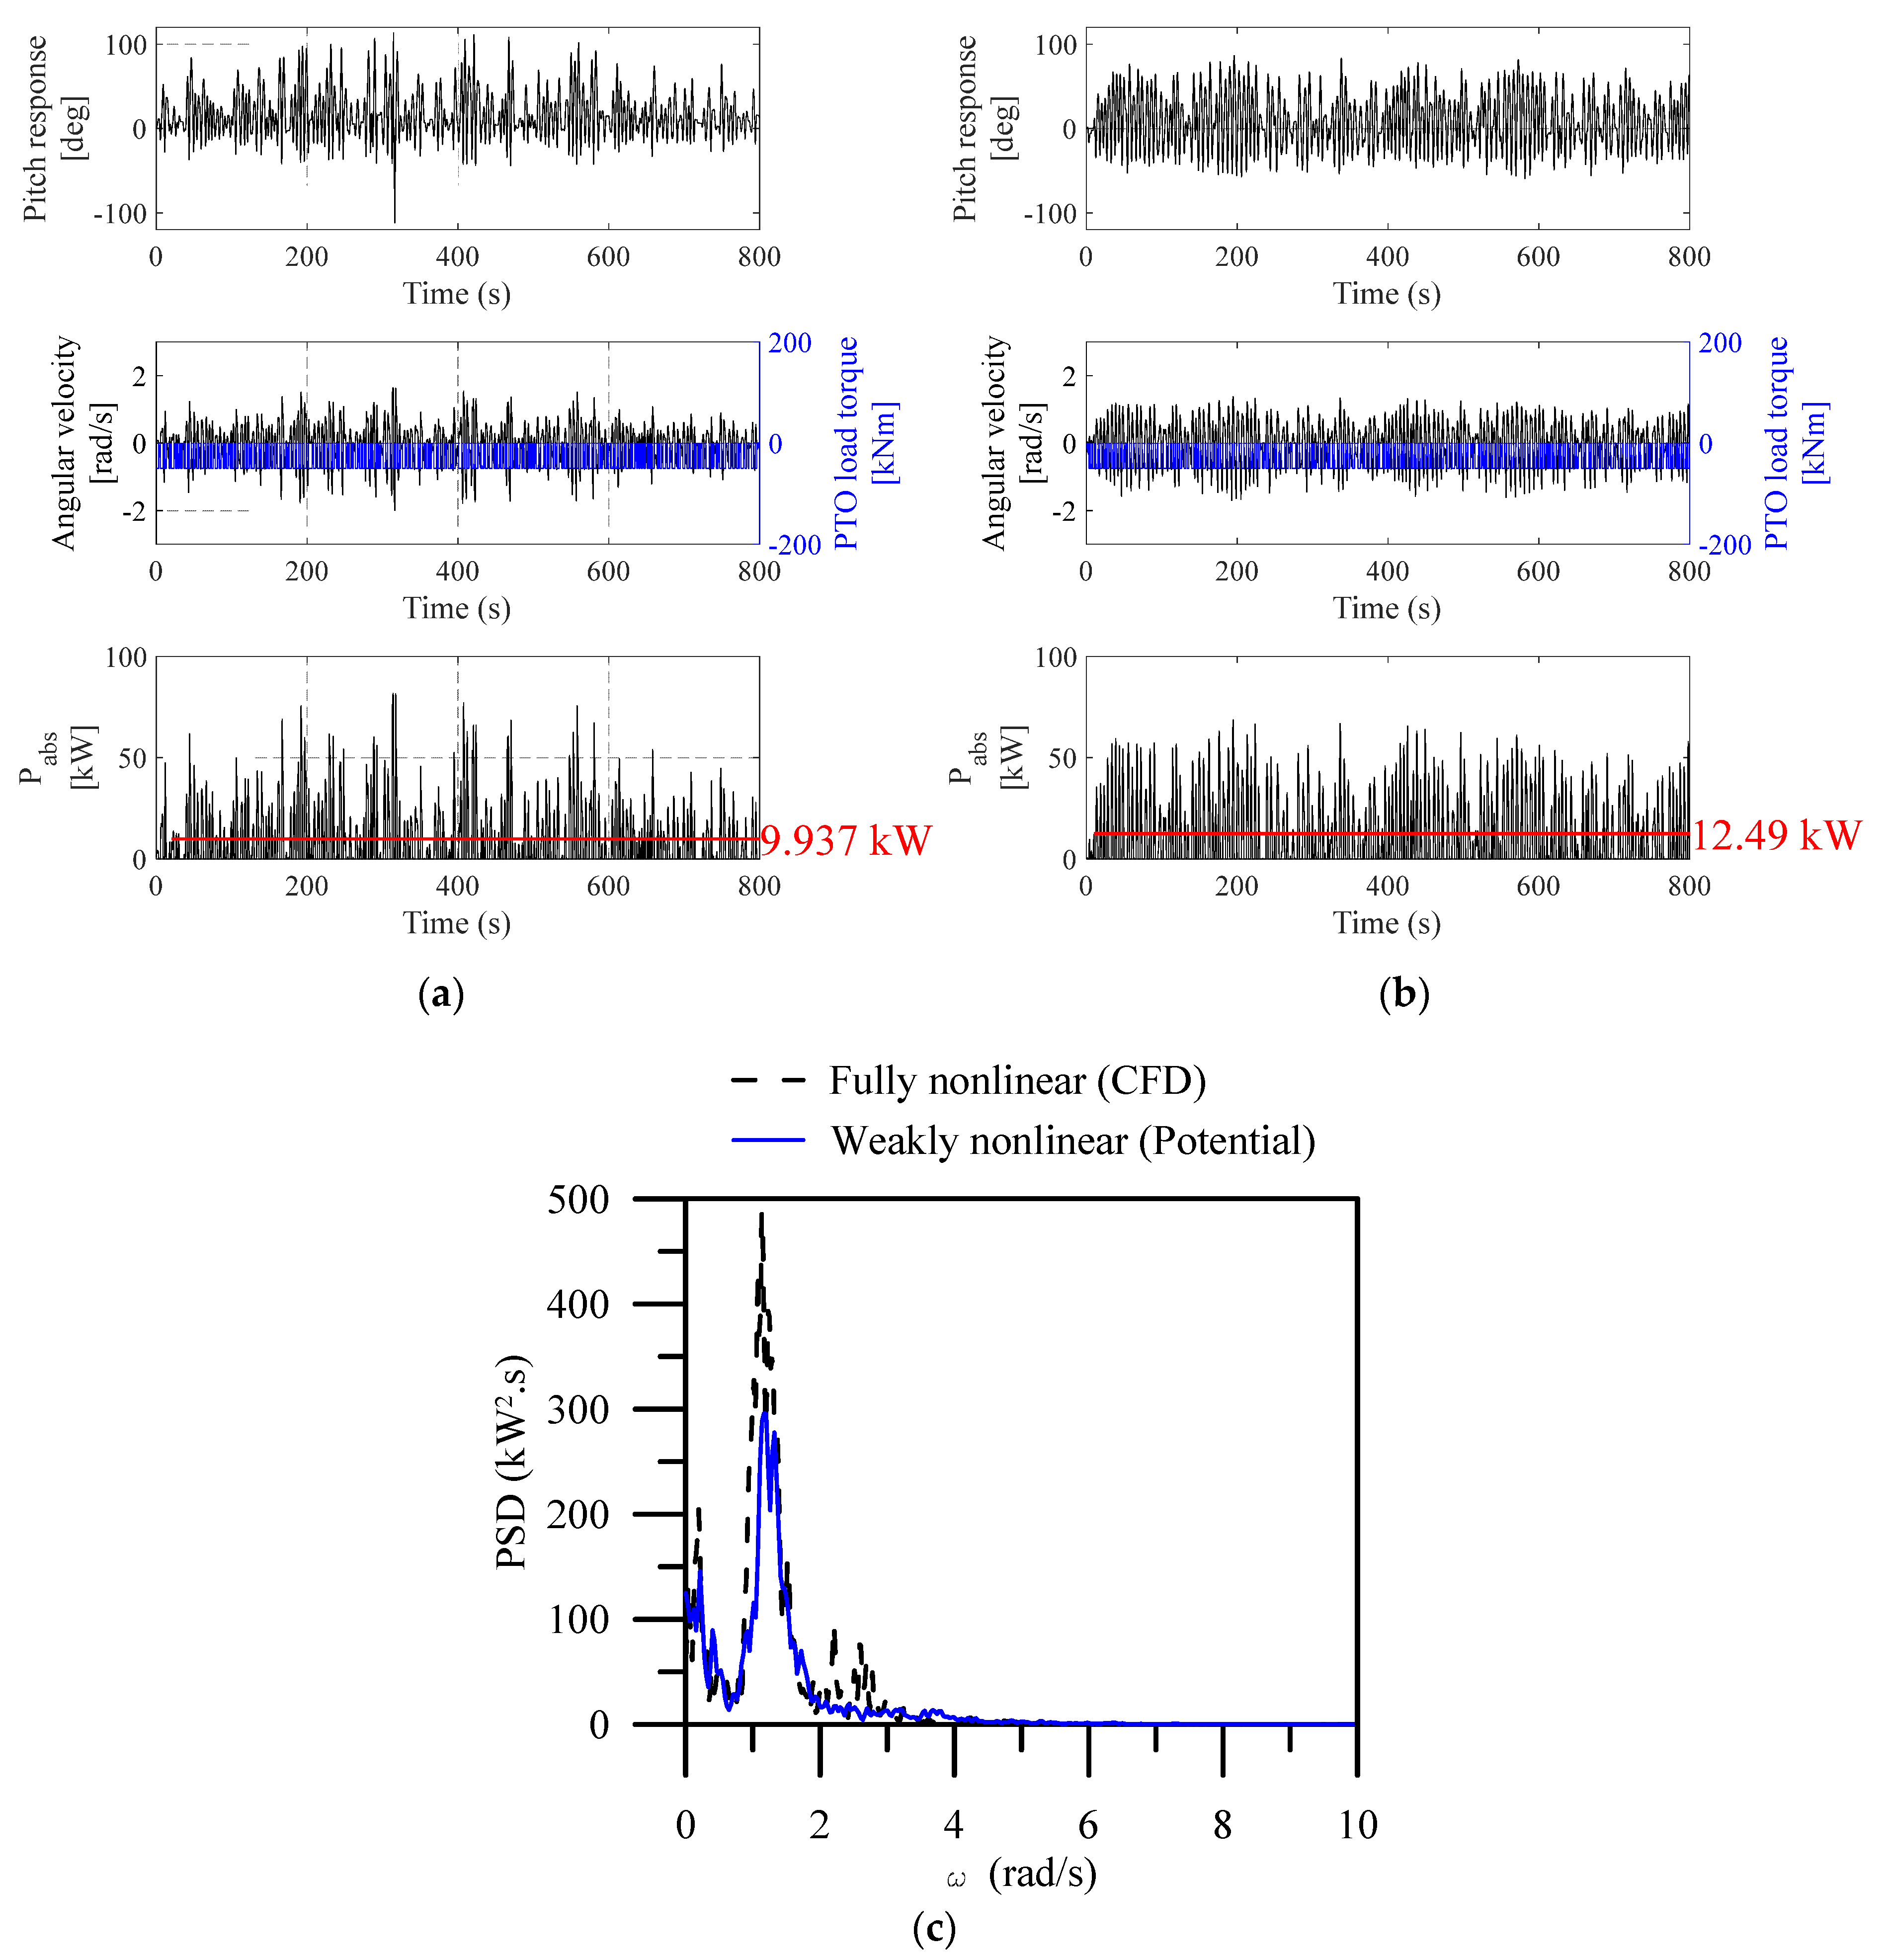
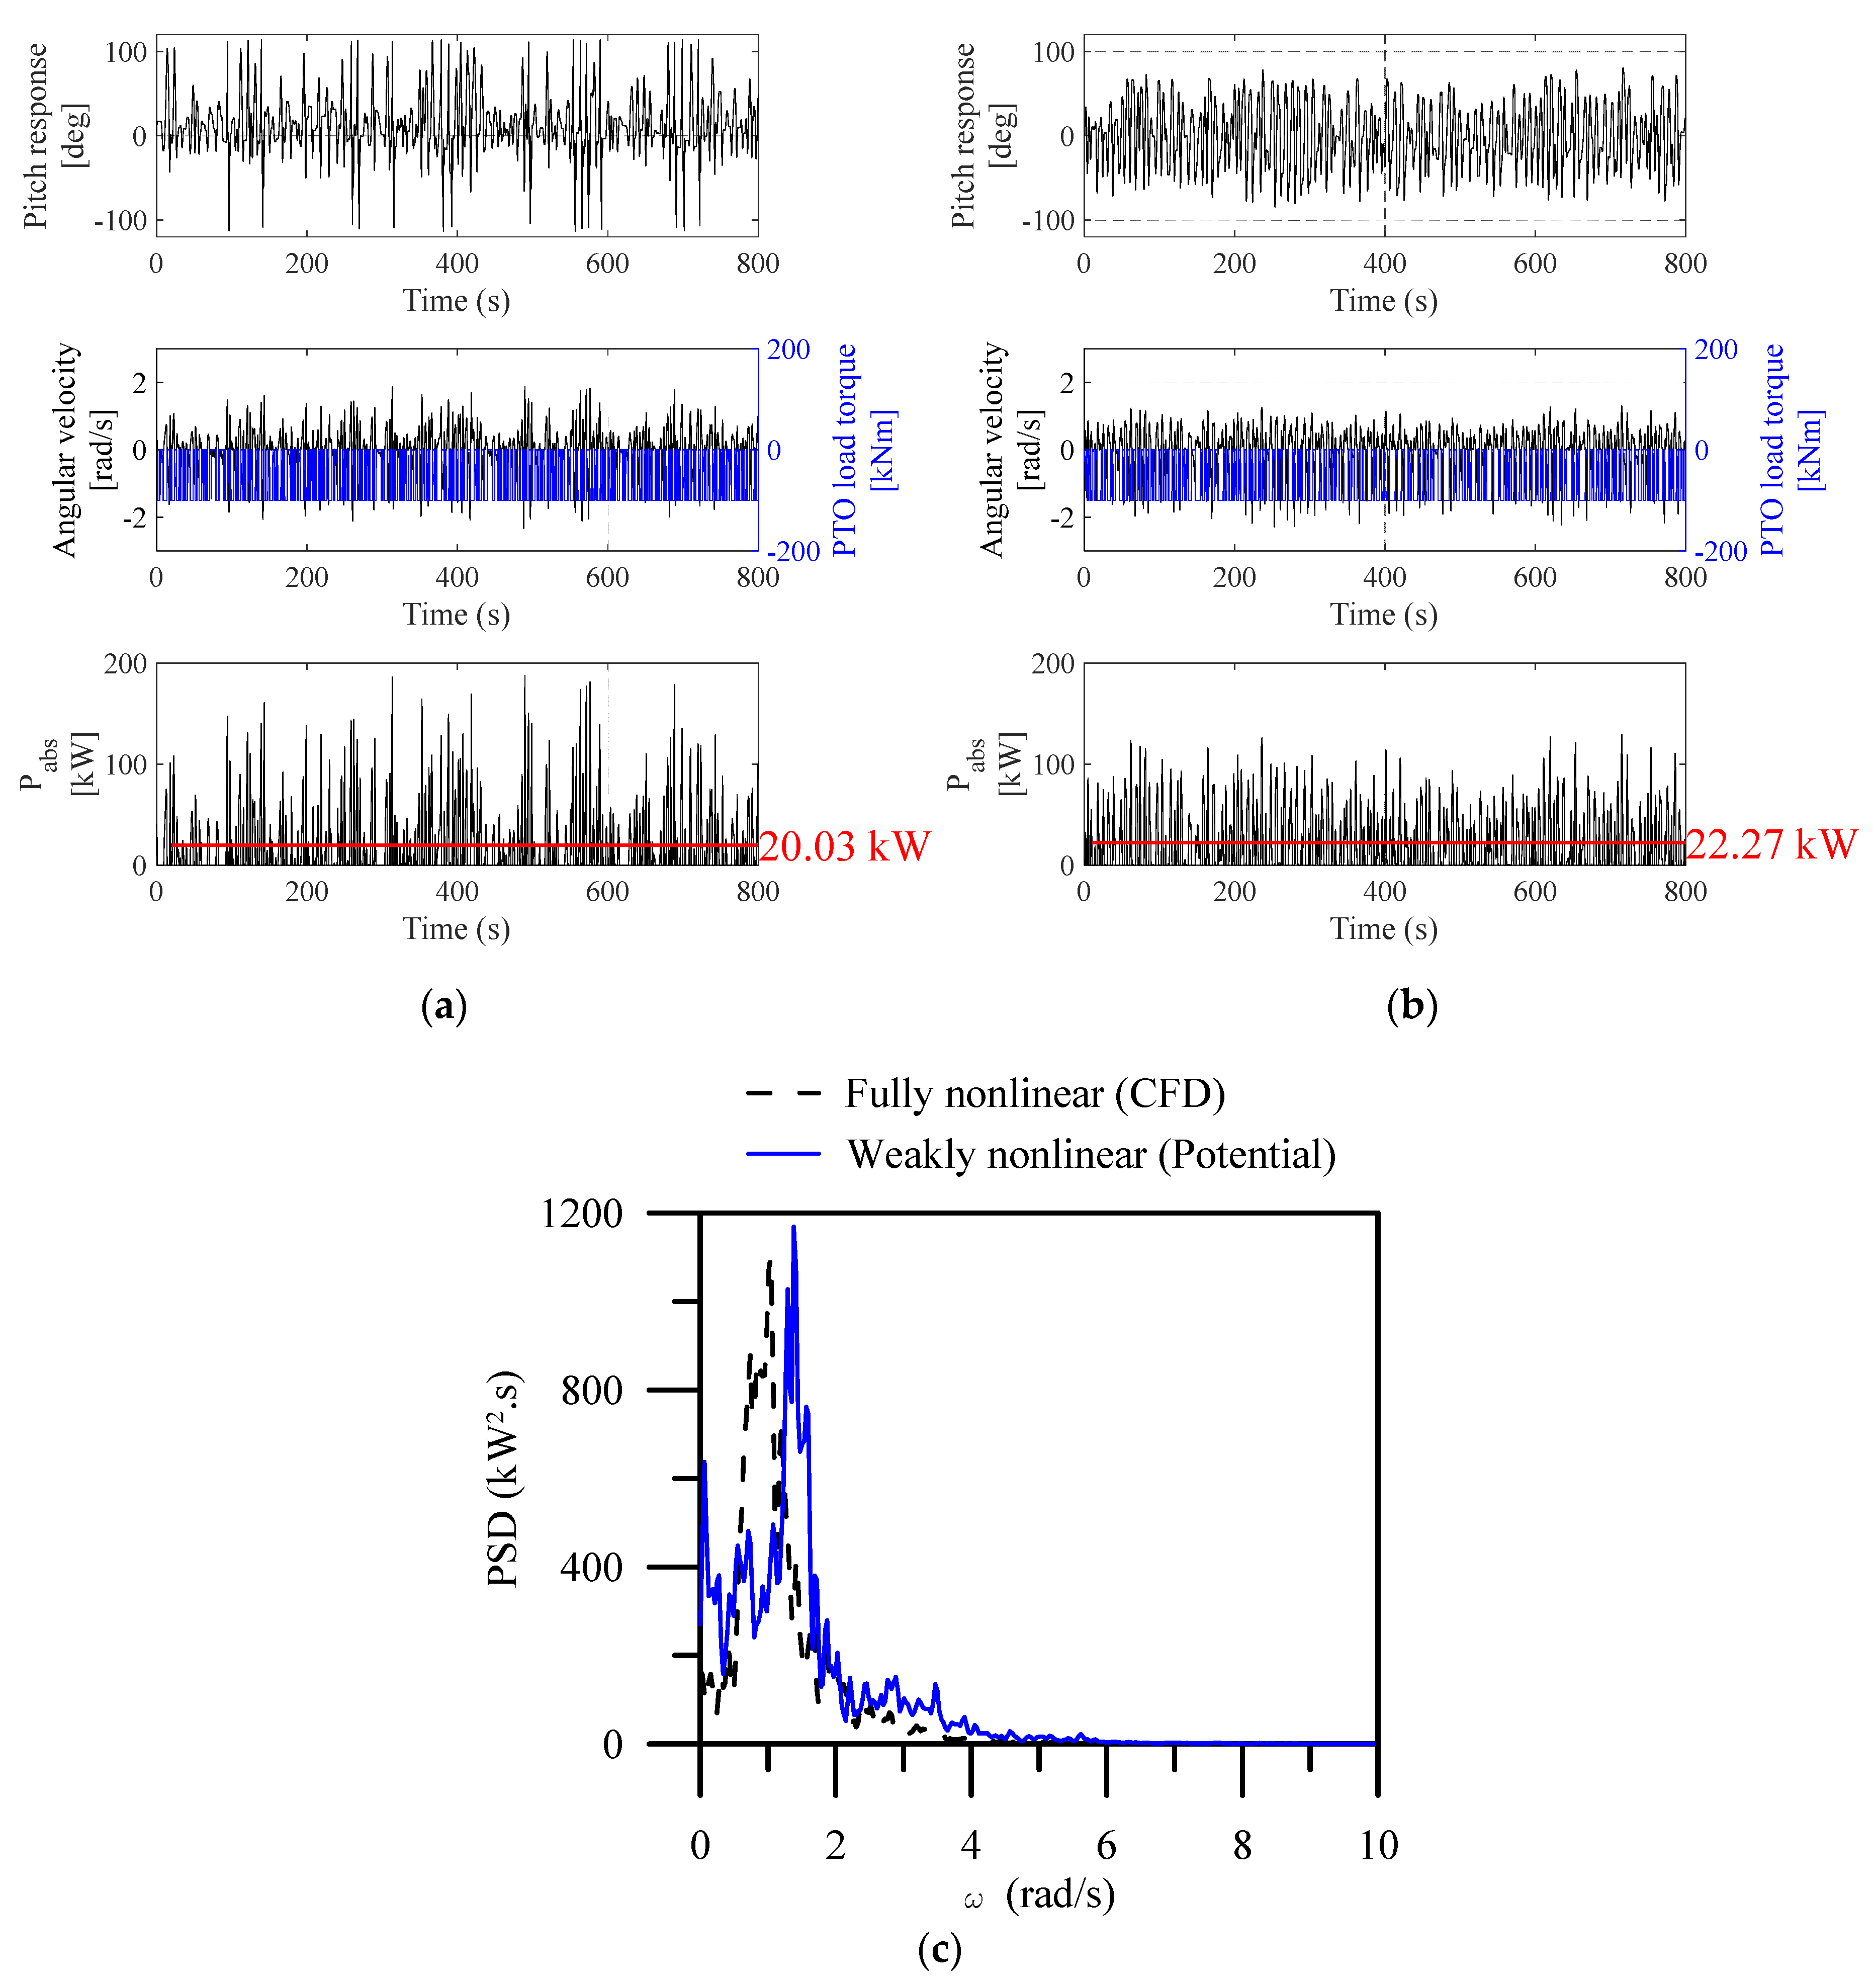
5.5. Effect of Irregular Wave Conditions
6. Conclusions
- With 3D nonlinear simulations, adopting a one-way PTO load torque in conjunction with a WEC rotor can be highly efficient compared with adopting a two-way PTO load torque.
- The average Pabs varied quadratically with the PTO load torque, and the WEC rotor exhibited higher sensitivity in the one-way PTO system, even in steeper waves, albeit with a decrease in the maximum efficiency.
- The pitch RAO and absorbed Pabs were higher during the resonance period, with weakly nonlinear models exhibiting lower values by the fully nonlinear model for both PTO load–torque systems within the considered wave period range.
- For the evaluated range of spacing between multiple WEC rotors, the center rotor consistently exhibits lower pitch RAO and average Pabs (PR ≤ 5) compared to the side rotors, regardless of the numerical model.
- Using a weakly nonlinear model can maintain accuracy up to moderate wave steepness; however, its applicability decreases with an increase in wave steepness. Fully nonlinear simulations can address a high degree of nonlinearity.
- In irregular waves, the estimated average Pabs is twice that under high-sea conditions, and the associated efficiency is three to four times lower than that under operational sea conditions.
Author Contributions
Funding
Data Availability Statement
Conflicts of Interest
Nomenclature
| u | Velocity vector |
| (x, y, z) | Cartesian coordinate system |
| Mean velocity components in the x-,y-and z-directions | |
| Fluctuating velocity components in the x-,y- and z-directions | |
| m | Viscosity |
| υ | Kinematic viscosity |
| p | Pressure and mean pressure |
| t | time |
| t1 | Time-lag |
| g | Acceleration due to gravity |
| Forcing coefficient | |
| r | Mixture of fluid density |
| Forced solution | |
| Actual solution | |
| λ | Wave length |
| K | Hydrostatic linear stiffness |
| h | Base cell size |
| a | Volume fraction |
| fwater | Density of water |
| fair | Density of air |
| k | Scaling factor |
| W | Half width of the WEC rotor |
| xg | longitudinal center of gravity |
| zg | Vertical center of gravity |
| Displacement, velocity and acceleration of the WEC rotor | |
| rm | Distance vector |
| Submerged volume of the WEC rotor | |
| τpto | Applied PTO load |
| R(ξ) | Nonlinear restoring moment |
| τvis | Linear viscosity |
| Negative critical displacement | |
| Positive critical displacement | |
| d | Water depth |
| Pabs | Absorbed power |
| T | Time period |
| H | Wave height |
| Total uncertainty | |
| Mesh size uncertainty | |
| Time step uncertainty | |
| Domain size uncertainty | |
| Reference time step | |
| Reference mesh size | |
| Cmref | Reference domain size |
| σfit | Total standard deviation |
| Pabs,ref | Reference Absorbed power |
| Pw | Wave power |
| H/λ | Wave steepness |
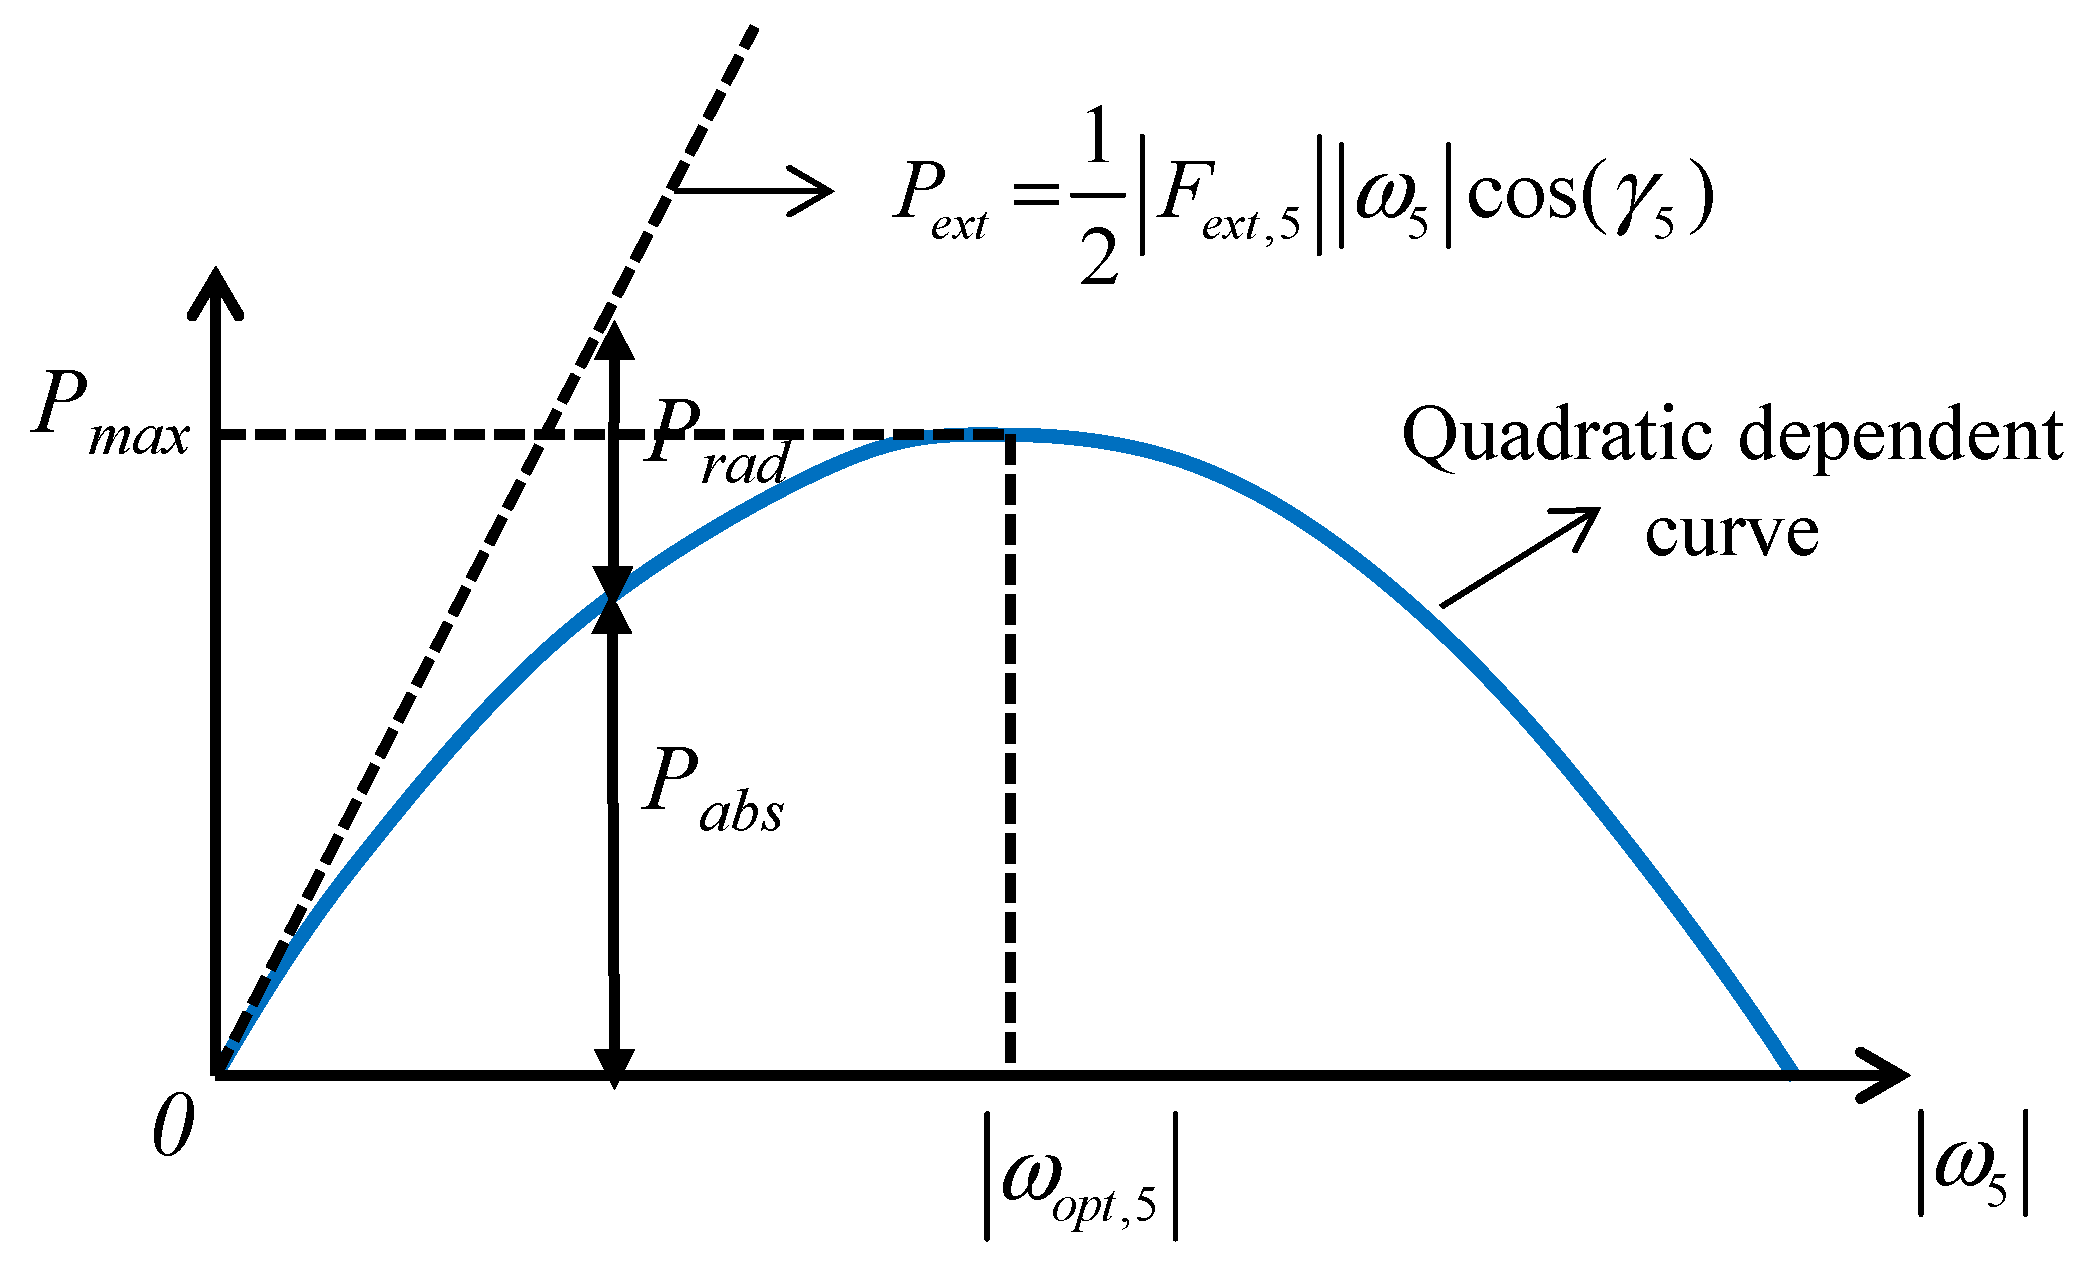
| Pext | Excitation power |
| Prad | Radiated power |
| w | Angular velocity |
| Hs | Significant wave height |
| σ | Variance of the wave record |
| ωp | Peak frequency |
| γ | Peak enhancement factor |
| β | Scale factor |
| Tp | Peak period |
| PR | Percentage ratio of multiple individual rotors to a single WEC rotor |
References
- McCormick, M.E. (Ed.) ; Ocean Wave Energy Conversion; Dover Publications: New York, NY, USA, 2013. [Google Scholar]
- Salter, S. Wave power. Nature 1974, 249, 720–724. [Google Scholar] [CrossRef]
- Evans, D.V. A theory for wave-power absorption by oscillating bodies. J. Fluid Mech. 1976, 77, 1–25. [Google Scholar] [CrossRef]
- Mei, C.C. Power extracted from water waves. J. Ship Res. 1976, 20, 63–66. [Google Scholar] [CrossRef]
- Budal, K. Theory for absorption of wave power by a system of interacting bodies. J. Ship Res. 1977, 21, 248–253. [Google Scholar] [CrossRef]
- Mynett, A.E.; Serman, D.D.; Mei, C.C. Characteristics of Salter’s cam for extracting energy from ocean waves. Appl. Ocean Res. 1979, 1, 13–20. [Google Scholar] [CrossRef]
- Pizer, D. The Numerical Prediction of the Performance of a Solo Duck; European Wave Energy Symposium: Edinburgh, UK, 1993; pp. 129–137. [Google Scholar]
- Skyner, D. Solo Duck Linear Analysis; University of Edinburgh: Edinburgh, UK, 1987. [Google Scholar]
- Ferri, F.; Pecher, A.F.S.; Kofoed, J.P. Numerical Analysis of a Large Floating Wave Energy Converter with Adjustable Structural Geometry. In Proceedings of the ISOPE The 25th International Ocean and Polar Engineering Conference, Kona, HI, USA, 21–26 June 2015; pp. 1025–1033. [Google Scholar]
- Rapuc, S. Numerical Study of the WEPTOS Single Rotor. Ph.D. Thesis, Aalborg University and Technical University of Denmark (DK), Aalborg, Denmark, 2012. [Google Scholar]
- Folley, M. Numerical Modelling of Wave Energy Converters: State-of-the-Art Techniques for Single Devices and Arrays; Academic Press: Cambridge, MA, USA, 2016. [Google Scholar]
- Heo, K.; Choi, Y.R. Numerical Investigation of Multi-body Wave Energy Converters’ Configuration. J. Ocean Eng. Technol. 2022, 36, 132–142. [Google Scholar] [CrossRef]
- Falnes, J.; Kurniawan, A. Ocean Waves and Oscillating Systems: Linear Interactions Including Wave-Energy Extraction; Cambridge University Press: Cambridge, UK, 2020; Volume 8. [Google Scholar]
- Penalba, M.; Giorgi, G.; Ringwood, J.V. Mathematical modelling of wave energy converters: A review of nonlinear approaches. Renew. Sustain. Energy Rev. 2017, 78, 1188–1207. [Google Scholar] [CrossRef]
- Gilloteaux JC, Bacelli G; Ringwood J. A non-linear potential model to predict large-amplitude-motions: Application to a multi-body wave energy converter. In Proceedings of the 10th World Renewable Energy Conference, Glasgow, UK, 19–25 July 2008; pp. 934–940.
- Gilloteaux, J.C.; Ducrozet, G.; Babarit, A.; Clement, A.H. Non-linear model to simulate large amplitude motions: Application to wave energy conversion. In Proceedings of the 22nd International Workshop on Water Waves and Floating Bodies, Plitvice, Croatia, 15–18 April 2007; pp. 97–100. [Google Scholar]
- Guérinel, M.; Alves, M.; Sarmento, A. Nonlinear modelling of the dynamics of a free floating body. In Proceedings of the 9th European Wave and Tidal Energy Conference (EWTEC), Southampton, UK, 5–9 September 2011. [Google Scholar]
- Merigaud, A.; Gilloteaux, J.C.; Ringwood, J.V. A nonlinear extension for linear boundary element methods in wave energy device modelling. In Proceedings of the International Conference on Offshore Mechanics and Arctic Engineering, New York, NY, USA, 1–6 July 2012; American Society of Mechanical Engineers: New York, NY, USA, 2012; Volume 44915, pp. 615–621. [Google Scholar]
- Viuff, T.H.; Andersen, M.T.; Kramer, M.; Jakobsen, M.M. Excitation forces on point absorbers exposed to high order non-linear waves. In Proceedings of the European Wave and Tidal Energy Conference. Technical Committee of the European Wave and Tidal Energy Conference, Aalborg, Denmark, 2–5 September 2013. [Google Scholar]
- Lawson, M.; Yu, Y.H.; Nelessen, A.; Ruehl, K.; Michelen, C. Implementing nonlinear buoyancy and excitation forces in the wec-sim wave energy converter modeling tool. In Proceedings of the International Conference on Offshore Mechanics and Arctic Engineering, 8–13 June 2014; American Society of Mechanical Engineers: New York, NY, USA, 2014; Volume 45547, p. V09BT09A043. [Google Scholar]
- Zurkinden, A.S.; Ferri, F.; Beatty, S.; Kofoed, J.P.; Kramer, M.M. Non-linear numerical modeling and experimental testing of a point absorber wave energy converter. Ocean Eng. 2014, 78, 11–21. [Google Scholar] [CrossRef]
- Wolgamot, H.A.; Fitzgerald, C.J. Nonlinear hydrodynamic and real fluid effects on wave energy converters. Proc. Inst. Mech. Eng. Part A J. Power Energy 2015, 229, 772–794. [Google Scholar] [CrossRef]
- Poguluri, S.K.; Cho, I.H.; Bae, Y.H. A study of the hydrodynamic performance of a pitch-type wave energy converter–rotor. Energies 2019, 12, 842. [Google Scholar] [CrossRef]
- Kim, D.; Poguluri, S.K.; Ko, H.S.; Lee, H.; Bae, Y.H. Numerical and Experimental Study on Linear Behavior of Salter’s Duck Wave Energy Converter. J. Ocean Eng. Technol. 2019, 33, 116–122. [Google Scholar] [CrossRef]
- van Rij, J.; Yu, Y.H.; Guo, Y.; Coe, R.G. A wave energy converter design load case study. J. Mar. Sci. Eng. 2019, 7, 250. [Google Scholar] [CrossRef]
- Katsidoniatski, E.; Yu, Y.H.; Goteman, M. Midfidelity Model Verification for a Point-Absorbing Wave Energy Converter with Linear Power Takeoff (No. NREL/CP-5700-78569); National Renewable Energy Lab. (NREL): Golden, CO, USA, 2021. [Google Scholar]
- Van’t Hoff, J. Hydrodynamic Modelling of the Oscillating Wave Surge Converter. Ph.D. Thesis, Queen’s University Belfast, Belfast, UK, 2009. [Google Scholar]
- Folley, M.; Whittaker, T.J.T.; Henry, A. The effect of water depth on the performance of a small surging wave energy converter. Ocean Eng. 2007, 34, 1265–1274. [Google Scholar] [CrossRef]
- Falnes, J. Optimum control of oscillation of wave-energy converters. Int. J. Offshore Polar Eng. 2002, 12, 147–155. [Google Scholar]
- Bjarte-Larsson, T.; Falnes, J. Laboratory experiment on heaving body with hydraulic power take-off and latching control. Ocean Eng. 2006, 33, 847–877. [Google Scholar] [CrossRef]
- Babarit, A.; Clément, A.H. Optimal latching control of a wave energy device in regular and irregular waves. Appl. Ocean Res. 2006, 28, 77–91. [Google Scholar] [CrossRef]
- Babarit, A.; Duclos, G.; Clément, A.H. Comparison of latching control strategies for a heaving wave energy device in random sea. Appl. Ocean Res. 2004, 26, 227–238. [Google Scholar] [CrossRef]
- Lopes, M.F.P.; Hals, J.; Gomes, R.P.F.; Moan, T.; Gato, L.M.C.; Falcão, A.D.O. Experimental and numerical investigation of non-predictive phase-control strategies for a point-absorbing wave energy converter. Ocean Eng. 2009, 36, 386–402. [Google Scholar] [CrossRef]
- Sheng, W.; Alcorn, R.; Lewis, A. A new latching control technology for improving wave energy conversion. In Proceedings of the 5th International Conference on Ocean Energy (ICOE), Halifax, NS, Canada, 4–6 November 2014. [Google Scholar]
- Sheng, W.; Alcorn, R.; Lewis, A. On improving wave energy conversion, part II: Development of latching control technologies. Renew. Energy 2015, 75, 935–944. [Google Scholar] [CrossRef]
- António, F.D.O. Modelling and control of oscillating-body wave energy converters with hydraulic power take-off and gas accumulator. Ocean Eng. 2007, 34, 2021–2032. [Google Scholar]
- Costello, R.; Ringwood, J.; Weber, J. Comparison of two alternative hydraulic PTO concepts for wave energy conversion. In Proceedings of the 9th European Wave and Tidal Energy Conference (EWTEC), Southampton, UK, 5–9 September 2011; School of Civil Engineering and the Environment, University of Southampton: Southampton, UK, 2011. [Google Scholar]
- Babarit, A.; Guglielmi, M.; Clément, A.H. Declutching control of a wave energy converter. Ocean Eng. 2009, 36, 1015–1024. [Google Scholar] [CrossRef]
- António, F.D.O. Phase control through load control of oscillating-body wave energy converters with hydraulic PTO system. Ocean Eng. 2008, 35, 358–366. [Google Scholar]
- Wilkinson, L.; Doherty, K.; Nicholson, J.; Whittaker, T.; Sandy, D. Modelling the performance of a modular flap-type wave energy converter. In Proceedings of the 11th European Wave and Tidal Energy Conference, Nantes, France, 6–11 September 2015. [Google Scholar]
- Wilkinson, L.; Whittaker, T.J.T.; Thies, P.R.; Day, S.; Ingram, D. The power-capture of a nearshore, modular, flap-type wave energy converter in regular waves. Ocean Eng. 2017, 137, 394–403. [Google Scholar] [CrossRef]
- Wilkinson, L. An Assessment of the Nearshore Modular Flap-Type WEC. Ph.D. Thesis, University of Edinburgh: Edinburgh, UK, 2018. [Google Scholar]
- Orszaghova, J.; Wolgamot, H.; Draper, S.; Rafiee, A. Non-linear behaviour of an idealised submerged WEC with Coulomb damping. In Proceedings of the 12th European Wave and Tidal Energy Conference, Cork, UK, 27 August–1 September 2017; Technical Committee of the European Wave and Tidal Energy Conference: Uppsala, Sweden, 2017; pp. 1088-1–1088-9. [Google Scholar]
- Gong, S.K.; Gao, J.L.; Mao, H.F. Investigations on fluid resonance within a narrow gap formed by two fixed bodies with varying breadth ratios. China Ocean Eng. 2023, 37, 962–974. [Google Scholar] [CrossRef]
- Gao, J.; Chen, H.; Zang, J.; Chen, L.; Wang, G.; Zhu, Y. Numerical investigations of gap resonance excited by focused transient wave groups. Ocean Eng. 2020, 212, 107628. [Google Scholar] [CrossRef]
- Schmitt, P. Investigation of the Near Flow Field of Bottom Hinged Flap Type Wave Energy Converters. Ph.D. Thesis, Queen’s University Belfast, Belfast, UK, 2013. [Google Scholar]
- Sjökvist, L.; Wu, J.; Ransley, E.; Engström, J.; Eriksson, M.; Göteman, M. Numerical models for the motion and forces of point-absorbing wave energy converters in extreme waves. Ocean Eng. 2017, 145, 1–14. [Google Scholar] [CrossRef]
- Windt, C.; Davidson, J.; Ringwood, J.V. High-fidelity numerical modelling of ocean wave energy systems: A review of computational fluid dynamics-based numerical wave tanks. Renew. Sustain. Energy Rev. 2018, 93, 610–630. [Google Scholar] [CrossRef]
- Devolder, B.; Stratigaki, V.; Troch, P.; Rauwoens, P. CFD simulations of floating point absorber wave energy converter arrays subjected to regular waves. Energies 2018, 11, 641. [Google Scholar] [CrossRef]
- Poguluri, S.K.; Ko, H.S.; Bae, Y.H. CFD investigation of pitch-type wave energy converter-rotor based on RANS simulations. Ships Offshore Struct. 2020, 15, 1107–1119. [Google Scholar] [CrossRef]
- Poguluri, S.K.; Kim, D.; Ko, H.S.; Bae, Y.H. Performance analysis of multiple wave energy converters due to rotor spacing. J. Ocean Eng. Technol. 2021, 35, 229–237. [Google Scholar] [CrossRef]
- Windt, C.; Davidson, J.; Ringwood, J.V. Investigation of turbulence modeling for point-absorber-type wave energy converters. Energies 2020, 14, 26. [Google Scholar] [CrossRef]
- Ransley, E.J.; Brown, S.A.; Hann, M.; Greaves, D.M.; Windt, C.; Ringwood, J.; Davidson, J.; Schmitt, P.; Yan, S.; Wang, J.X.; et al. Focused wave interactions with floating structures: A blind comparative study. Proc. Inst. Civ. Eng.-Eng. Comput. Mech. 2021, 174, 46–61. [Google Scholar] [CrossRef]
- Ko, H.S.; Kim, S.; Bae, Y.H. Study on Optimum Power Take-Off Torque of an Asymmetric Wave Energy Converter in Western Sea of Jeju Island. Energies 2021, 14, 1449. [Google Scholar] [CrossRef]
- Ha, Y.J.; Park, J.Y.; Shin, S.H. Numerical Study of Non-Linear Dynamic Behavior of an Asymmetric Rotor for Wave Energy Converter in Regular Waves. Processes 2021, 9, 1477. [Google Scholar] [CrossRef]
- Peric, M. Best Practices for Flow Simulations with Waves, Star Global Conference; Siemens AG: Berlin, Germany, 2017. [Google Scholar]
- Enger, S.; Perić, M.; Monteiro, H. Coupling of 3D Numerical Solution Method Based on Navier-Stokes Equations with Solutions Based on Simpler Theories; CILAMCE: Fortaleza, Brazil, 2014. [Google Scholar]
- Cummins, W.E.; Iiuhl, W.; Uinm, A. The Impulse Response Function and Ship Motions; Department of the NAVY: Washington, DC, USA, 1962. [Google Scholar]
- Cummins, C.; Viola, I.M.; Mastropaolo, E.; Nakayama, N. The effect of permeability on the flow past permeable disks at low Reynolds numbers. Phys. Fluids 2017, 29, 097103. [Google Scholar] [CrossRef]


| Description | Prototype | Scaling Factor (k = 11) | Model |
|---|---|---|---|
| Submergence depth, h | 3.6 m | 1/k | 0.3275 m |
| Beak angle | 60° | 1 | 60° |
| WEC rotor half width, W | 2.5 m | 1/k | 0.2275 m |
| Total mass | 21,328 kg | 1/k3 | 13.65 kg |
| Inertia about the center of rotation | 117,132 kg·m2 | 1/k5 | 0.7479 kg·m2 |
| Center of gravity with respect to the center of rotation | |||
| xg | −0.8934 m | 1/k | −0.0931 m |
| zg | 1.0189 m | 1/k | 0.0998 m |
| S.No | Wave Period (T) | Wave Length (λ) | Height (H) | Wave Steepness (H/λ) |
|---|---|---|---|---|
| 1 | 0.8 | 1.148 | 0.026 | |
| 2 | 1.00 | 1.668 | 0.03 | 0.0180 |
| 3 | 1.28 | 2.627 | 0.0114 | |
| 4 | 1.43 | 3.246 | 0.0092 | |
| 5 | 1.58 | 3.931 | 0.0076 | |
| 6 | 1.73 | 4.670 | 0.0064 | |
| 7 | 1.88 | 5.445 | 0.0055 | |
| 8 | 2.04 | 6.294 | 0.0048 |
| Spacing | Side (Rotors 1 and 3) | Center (Rotor 2) | |||||
|---|---|---|---|---|---|---|---|
| Pitch RAO (rad/m) | Average Pabs (kW) | Efficiency (%) | Pitch RAO (rad/m) | Average Pabs (kW) | Efficiency (%) | ||
| One-Way | |||||||
| Single WEC rotor | 0.780 | 15.238 | 65.39 | 0.780 | 15.238 | 65.39 | |
| 0.802 | 14.045 | 60.27 | 0.802 | 14.045 | 60.27 | ||
| Multiple WEC rotors | 0.8 × W | 0.785 (101) | 14.096 (93) | 60.49 | 0.751 (96) | 13.308 (87) | 57.11 |
| 0.825 (103) | 12.376 (88) | 53.11 | 0.796 (99) | 12.004 (85) | 51.51 | ||
| 1.0 × W | 0.777 (100) | 13.692 (90) | 58.76 | 0.770 (99) | 13.096 (86) | 56.20 | |
| 0.827 (103) | 12.405 (88) | 53.23 | 0.810 (101) | 12.188 (87) | 52.30 | ||
| 1.2 × W | 0.768 (98) | 13.703 (90) | 58.80 | 0.770 (99) | 13.184 (87) | 56.57 | |
| 0.826 (103) | 12.398 (88) | 53.20 | 0.820 (102) | 12.336 (88) | 52.30 | ||
| Sea Conditions | Wave Parameters | Spectral Peak Parameter (γ) | Wave Power (kN/m) × (0.865) × × Tp |
|---|---|---|---|
| Operational | Hs = 2 m; Tp = 6.65 s | 1.2 | 11.31 |
| High | Hs = 4.75 m; Tp = 8.62 s | 82.66 |
| Power | One-Way PTO Load (kNm) | Sea Condition | Model | |||||
|---|---|---|---|---|---|---|---|---|
| Weakly Nonlinear | Fully Nonlinear | |||||||
| Avg. | Max. | Standard Deviation | Avg. | Max. | Standard Deviation | |||
| Pabs | 50 | Operational | 9.34 | 81.88 | 15.11 | 12.49 | 68.69 | 17.06 |
| 100 | High sea | 20.03 | 187.86 | 32.77 | 22.27 | 129.3 | 29.69 | |
Disclaimer/Publisher’s Note: The statements, opinions and data contained in all publications are solely those of the individual author(s) and contributor(s) and not of MDPI and/or the editor(s). MDPI and/or the editor(s) disclaim responsibility for any injury to people or property resulting from any ideas, methods, instructions or products referred to in the content. |
© 2024 by the authors. Licensee MDPI, Basel, Switzerland. This article is an open access article distributed under the terms and conditions of the Creative Commons Attribution (CC BY) license (https://creativecommons.org/licenses/by/4.0/).
Share and Cite
Poguluri, S.K.; Kim, D.; Bae, Y.H. A Numerical Investigation of the Hydrodynamic Performance of a Pitch-Type Wave Energy Converter Using Weakly and Fully Nonlinear Models. Energies 2024, 17, 898. https://doi.org/10.3390/en17040898
Poguluri SK, Kim D, Bae YH. A Numerical Investigation of the Hydrodynamic Performance of a Pitch-Type Wave Energy Converter Using Weakly and Fully Nonlinear Models. Energies. 2024; 17(4):898. https://doi.org/10.3390/en17040898
Chicago/Turabian StylePoguluri, Sunny Kumar, Dongeun Kim, and Yoon Hyeok Bae. 2024. "A Numerical Investigation of the Hydrodynamic Performance of a Pitch-Type Wave Energy Converter Using Weakly and Fully Nonlinear Models" Energies 17, no. 4: 898. https://doi.org/10.3390/en17040898
APA StylePoguluri, S. K., Kim, D., & Bae, Y. H. (2024). A Numerical Investigation of the Hydrodynamic Performance of a Pitch-Type Wave Energy Converter Using Weakly and Fully Nonlinear Models. Energies, 17(4), 898. https://doi.org/10.3390/en17040898