Article

Influence of Inoculum Thermal Pretreatment Time on Hydrogen Production in Dark Fermentation †

by
Marlena Domińska
*,
Radosław Ślęzak
,
Justyna Świątkiewicz
,
Katarzyna Paździor
and
Stanisław Ledakowicz
Department of Bioprocess Engineering, Faculty of Process and Environmental Engineering, Lodz University of Technology, 213 Wolczanska Street, 90-924 Lodz, Poland
*
Author to whom correspondence should be addressed.
This article is a revised and expanded version of abstract entitled “Influence of inoculum thermal pretreatment on hydrogen production in dark fermentation process”, which was presented at 24th Polish Conference of Chemical and Process Engineering, Szczecin, Poland, 13–16 June 2023; pp. 56–57.
Energies 2024, 17(4), 974; https://doi.org/10.3390/en17040974
Submission received: 16 January 2024 / Revised: 14 February 2024 / Accepted: 15 February 2024 / Published: 19 February 2024
(This article belongs to the Section A5: Hydrogen Energy)

Abstract

:
Dark fermentation (DF) of kitchen waste (KW) is a promising technology for the production of renewable biohydrogen. It can be both a method of obtaining clean energy and a sustainable waste management. Despite its potential, this process requires further research to improve efficiency. The aim of the research was to test the effect of thermal pretreatment of the inoculum on H2 and volatile fatty acids (VFAs) production in the DF process. The process was carried out at 37 °C, in batch mode. The digested sludge from the Group Wastewater Treatment Plant in Lodz was used as inoculum. KW from households was used as substrate. The inoculum was pre-treated at 70 °C for 15 and 30 min. Two control reference experiments were also used. The first without the inoculum, and the second without heating the inoculum. The thermal pretreatment inhibited methane production and increased hydrogen production. After the thermal pretreatment, the amount of CO2 produced during the process decreased compared to the bioreactor without inoculum pretreatment. Additionally, the main VFAs in the samples with pretreated inoculum were acetic and butyric acids, which are associated with hydrogen production in the biochemical pathways of the DF process. However, the time of thermal pretreatment had no significant effect on H2 production.

1. Introduction

Nowadays, we are struggling with two key aspects of sustainable development. The first is environmental destruction and the second is the energy crisis. Both aspects are primarily caused by the use of fossil fuels as the main source of chemicals and electricity. Fossil fuels are depleting and pollutants are being released into the environment. Currently, about 80% of the energy consumed comes from fossil fuels [1]. As the population grows, the demand for electricity increases. This accelerates the depletion of limited fossil fuel resources. Moreover, the burning of fossil fuels produces large amounts of greenhouse and toxic gases, as well as other pollutants, causing global warming and acid rain [1,2,3]. Therefore, it is necessary to search for alternative energy sources. One of the most promising and environmentally friendly options is the use of hydrogen as a fuel. The combustion of hydrogen produces only water in the form of water vapor. In addition, it has a high-energy value per unit mass, it has a high-energy value (120–142 kJ/g). As a result, it can be used as fuel for direct combustion in an internal combustion engine or, after purification, in fuel cells [1,4]. Many valuable chemicals can be synthesized using hydrogen. One example is the production of ammonia, which is the synthesis of methanol from hydrogen together with carbon monoxide and carbon dioxide [5,6]. A second example is the direct synthesis of hydrogen peroxide from hydrogen and oxygen [7]. Unfortunately, hydrogen is currently produced mainly (almost 90%) from fossil fuels, which is not a solution to the energy and environmental pollution crisis. Another source of hydrogen is water electrolysis, which has developed significantly in recent years. However, all these methods of hydrogen production consume a lot of energy and are expensive [1,8]. Another method of producing hydrogen is biological production, for example in dark fermentation (DF). This method appears to be the most advantageous because it ensures high efficiency of biohydrogen production, compared to other biological methods such as photofermentation or biophotolysis. Additionally, this method allows the use of organic substrates. This is another advantage due to another problem: kitchen waste [9,10]. Table 1 provides an overview of methods for obtaining hydrogen.
The total amount of food waste produced per person in the European Union in 2021 is estimated to be around 127 kg. There are 447 million people living there, which means that almost 57 million tons of food were produced, of which more than 30 million tons was kitchen waste (KW) [14]. In this aspect, it is also necessary to take into account the increase in population, which causes the amount of this waste to increase every year. This is a serious problem because waste is now mainly composted. Unfortunately, there is no market for the compost produced. However, the amounts of waste produced are so large that other possibilities of using them have begun to be analyzed [15].
The DF process has not yet been thoroughly researched and described. There are many problems that need to be looked into. The main problem is that the efficiency of biohydrogen production is too low to be used in fuel cells. There are also problems in the construction of the equipment due to the low density of hydrogen, which makes it difficult to store. Another problem is to transfer the process from the laboratory or pilot scale to the commercial level. The main problems with scaling up the DF process are that the biohydrogen produced is not pure (it is a gas consisting mainly of H2 and CO2, with CO2 predominating), the stability of the biological processes is also an issue, as well as their low efficiency and the formation of by-products. [16]. Additionally, the amount and composition of the resulting products depend strictly on the process conditions and the type of inoculum (bacterial consortium). The process can be carried out using a pure culture or a mixed culture (MC). The use of MC as an inoculum has a great advantage because the bioreactor can operate in non-sterile conditions. However, MC contains methanogenic bacteria that cause a decrease in the hydrogen production efficiency in the DF process. Therefore, the inoculum should be subjected to heat pretreatment in order to kill methanogenic archaea. Caution should be exercised, however, as too high a temperature and too long a processing time may also destroy the bacteria responsible for biohydrogen production [8,17].
The DF process also produces volatile fatty acids (VFAs). These acids can be used as a substrate for the production of biogas or hydrogen. However, they are also used in many other processes, e.g., in microbial hydrogen cells, biological wastewater treatment plants, or as a substrate to produce lipids needed for biodiesel synthesis. VFAs can also be a substrate for the synthesis of polyhydroxyalkanoates (PHA) by specially selected bacterial strains [18].
There are various laboratory-scale studies that use different substrates as well as different process parameters. For example, Pagliaccia et al. [19] examined the effect of pre-thermal treatment of the substrate, which was food waste from the cafeteria, as well as a mixture of food waste and olive husks, on the production of hydrogen and methane. They obtained a maximum of 87 mL H2/gVSsubstrate, as well as 505 mL CH4/gVSsubstrate in the co-fermentation variant of these two substrates. In another study, Arain et al. [20] checked the co-fermentation of two substrates—food waste and sewage sludge. The maximum specific hydrogen efficiency was 106.7 mL H2/gVSsubstrate. In another study, Alibardi et al. [21] examined the influence of the composition of the organic fraction of municipal solid waste on the production of hydrogen and methane in anaerobic processes. The maximum specific hydrogen efficiency was 85 mL H2/gVSsubstrate, while for methane, it was 586 mL CH4/gVSsubstrate. In a study by Ji et al. [22], dark fermentation was carried out in which glucose with peptone was used as a substrate, and LaNi0.5Fe0.5O3 with a perovskite structure was added as a supplement to increase the efficiency of hydrogen production. They managed to obtain the highest biohydrogen efficiency of 265.22 mL H2/gVSsubstrate, which is 50.7% higher than in the control group.
The most similar research was conducted by Hidalgo et al. [23] and published in 2023. The influence of three different temperatures (60, 80, and 100 °C) and three different inoculum heating times (15, 30, and 60 min) was checked to kill methanogens. A simple substrate glucose was used. In these tests, a maximum hydrogen yield of 121 mL H2/gglucose was achieved when the inoculum was heated at 60 °C for 60 min and at 100 °C for 30 min. This yield is 19% higher compared to the control sample [23]. In the literature, there is no lack of influence of inoculum thermal treatment on the substrates, such as KW.
The aim of this work was to investigate the effect of inoculum pretreatment time on the production of H2 and VFAs in the DF process, to test the possibility of using other, including lower temperatures than 100 °C, as well as shorter inoculum heating times. Additionally, a more complex substrate was used to combine hydrogen and VFA production with waste management. The effect of the inoculum addition to KW on biohydrogen production efficiency of was also examined. In further research, it will be possible to focus on optimizing other process parameters, as well as aiming to make the use of DF with KW as cost-effective as possible, i.e., reducing costs as much as possible while maximizing hydrogen production. The long-term goal is to scale up the already optimized DF of the KW process, which would also be economically viable.

2. Materials and Methods

2.1. Substrate and Inoculum

Digested sludge from the Group Wastewater Treatment Plant in Lodz (Poland) was used as the inoculum (I). The basic properties of I are presented in Table 2.
KW from households in Lodz (Poland) was used as a substrate for the DF process. It mainly consisted of vegetables (in 44%), as well as fruit (in 30%), and other products such as coffee, tea, and pasta (in 25%). Before being used in the process, KW was ground in a grinder to particles smaller than 3 mm. The basic characteristics of KW are presented in Table 3.
Based on previous publications [24], a ratio of inoculum volume to organic waste of 7:3 was used. Each bioreactor contained 13 gVS of KW to maximize the production of H2.

2.2. Experimental Set-Up and Procedure

The DF process was carried out in batch mode in shaken bottles with a volume of 1 L at constant temperature and agitation speed (in an Excella E24R, Eppendorf, St Albans, UK, New Brunswick, thermostated laboratory shaker maintaining the temperature at 37 ± 0.5 °C and 80 rpm). Each process was run for 4 days. The pH was not regulated at the beginning and during the process.
The first bioreactor contained only water and KW to test the biodegradation of KW by indigenous biomass. In bioreactor 2, a mixture of KW and inoculum without thermal pretreatment was used. In bioreactors 3 and 4, a mixture of KW and inoculum heated at 70 °C for 15 and 30 min, respectively, was used. In order to remove oxygen from the bioreactors, each bioreactor was purged with nitrogen for 3 min after loading. Each bioreactor test was carried out in triplicate.

2.3. Analytical Methods

Suspension samples were taken from the bioreactor before and after the process in order to perform basic analyses. The samples were separated into solid and liquid phases in an MPW-250 centrifuge from MPW Med-Instruments, Warsaw, Poland, using a rotation speed of 5000 rpm for 5 min. The total solids (TS) and volatile solids (VS) of the reaction mixture were determined using a gravimetric method [25]. The carbon content in the solid phase was determined using an elemental analyzer NA 2500, CE Instruments, whereas the total organic carbon in the liquid fraction was measured using an analyzer IL 550 TOC-TN, Hach, Loveland, CO, USA. The pH value of the liquid phase using pH electrode—WTW pH 540 GLP—was quantified. At the beginning of the process, the amount of volatile fatty acids (VFAs) was determined using steam distillation (Buchi Distillation Unit B-324, BÜCHI Labortechnik AG, Flawil, Switzerland), followed by titration. The quality and quantity of produced VFAs at the end of the process were measured with the VARIAN CP4800 gas chromatograph, Varian Inc., Palo Alto, CA. This chromatograph consists of a BP21 capillary column with a length of 25 m, a diameter of 0.25 mm, and a film thickness of 0.25 µm. First, the liquid samples were filtered through a membrane with a pore diameter of 0.2 µm and then acidified with formic acid. The helium flow was set to 1.4 mL/min. The FID detector was heated to 250 °C. The split was set to 1:100. The sample injection volume was 1 μL. The capillary column was first heated to 110 °C. This temperature was maintained for 1 min. Then, the temperature was raised by 10 °C per minute to reach 230 °C. This temperature was maintained for 2 min. The volume of gas produced by the DF process was measured using the water displacement method. The composition of produced gas (H2, CH4, and CO2) was determined by 8610C gas chromatography (SRI Instruments). This chromatograph is equipped with two columns. The first one is filled with silica gel (length 1 m, diameter 1/8″, 80/100 mesh), and the second one is filled with molecular sieves (length 1 m, diameter 1/8″, 80/100 mesh). The chromatograph also contains a thermal conductivity detector (TCD). Helium with a flow rate of 8 cm3/min was used as the carrier gas. The column temperature was set to 60 °C, and the TCD detector temperature to 150 °C. Samples of 0.25 cm3 analyzed gas were manually injected directly into the column inlet. Analyses of individual samples were carried out in triplicates and the arithmetic mean was presented in the paper along with the standard deviation.

3. Results and Discussion
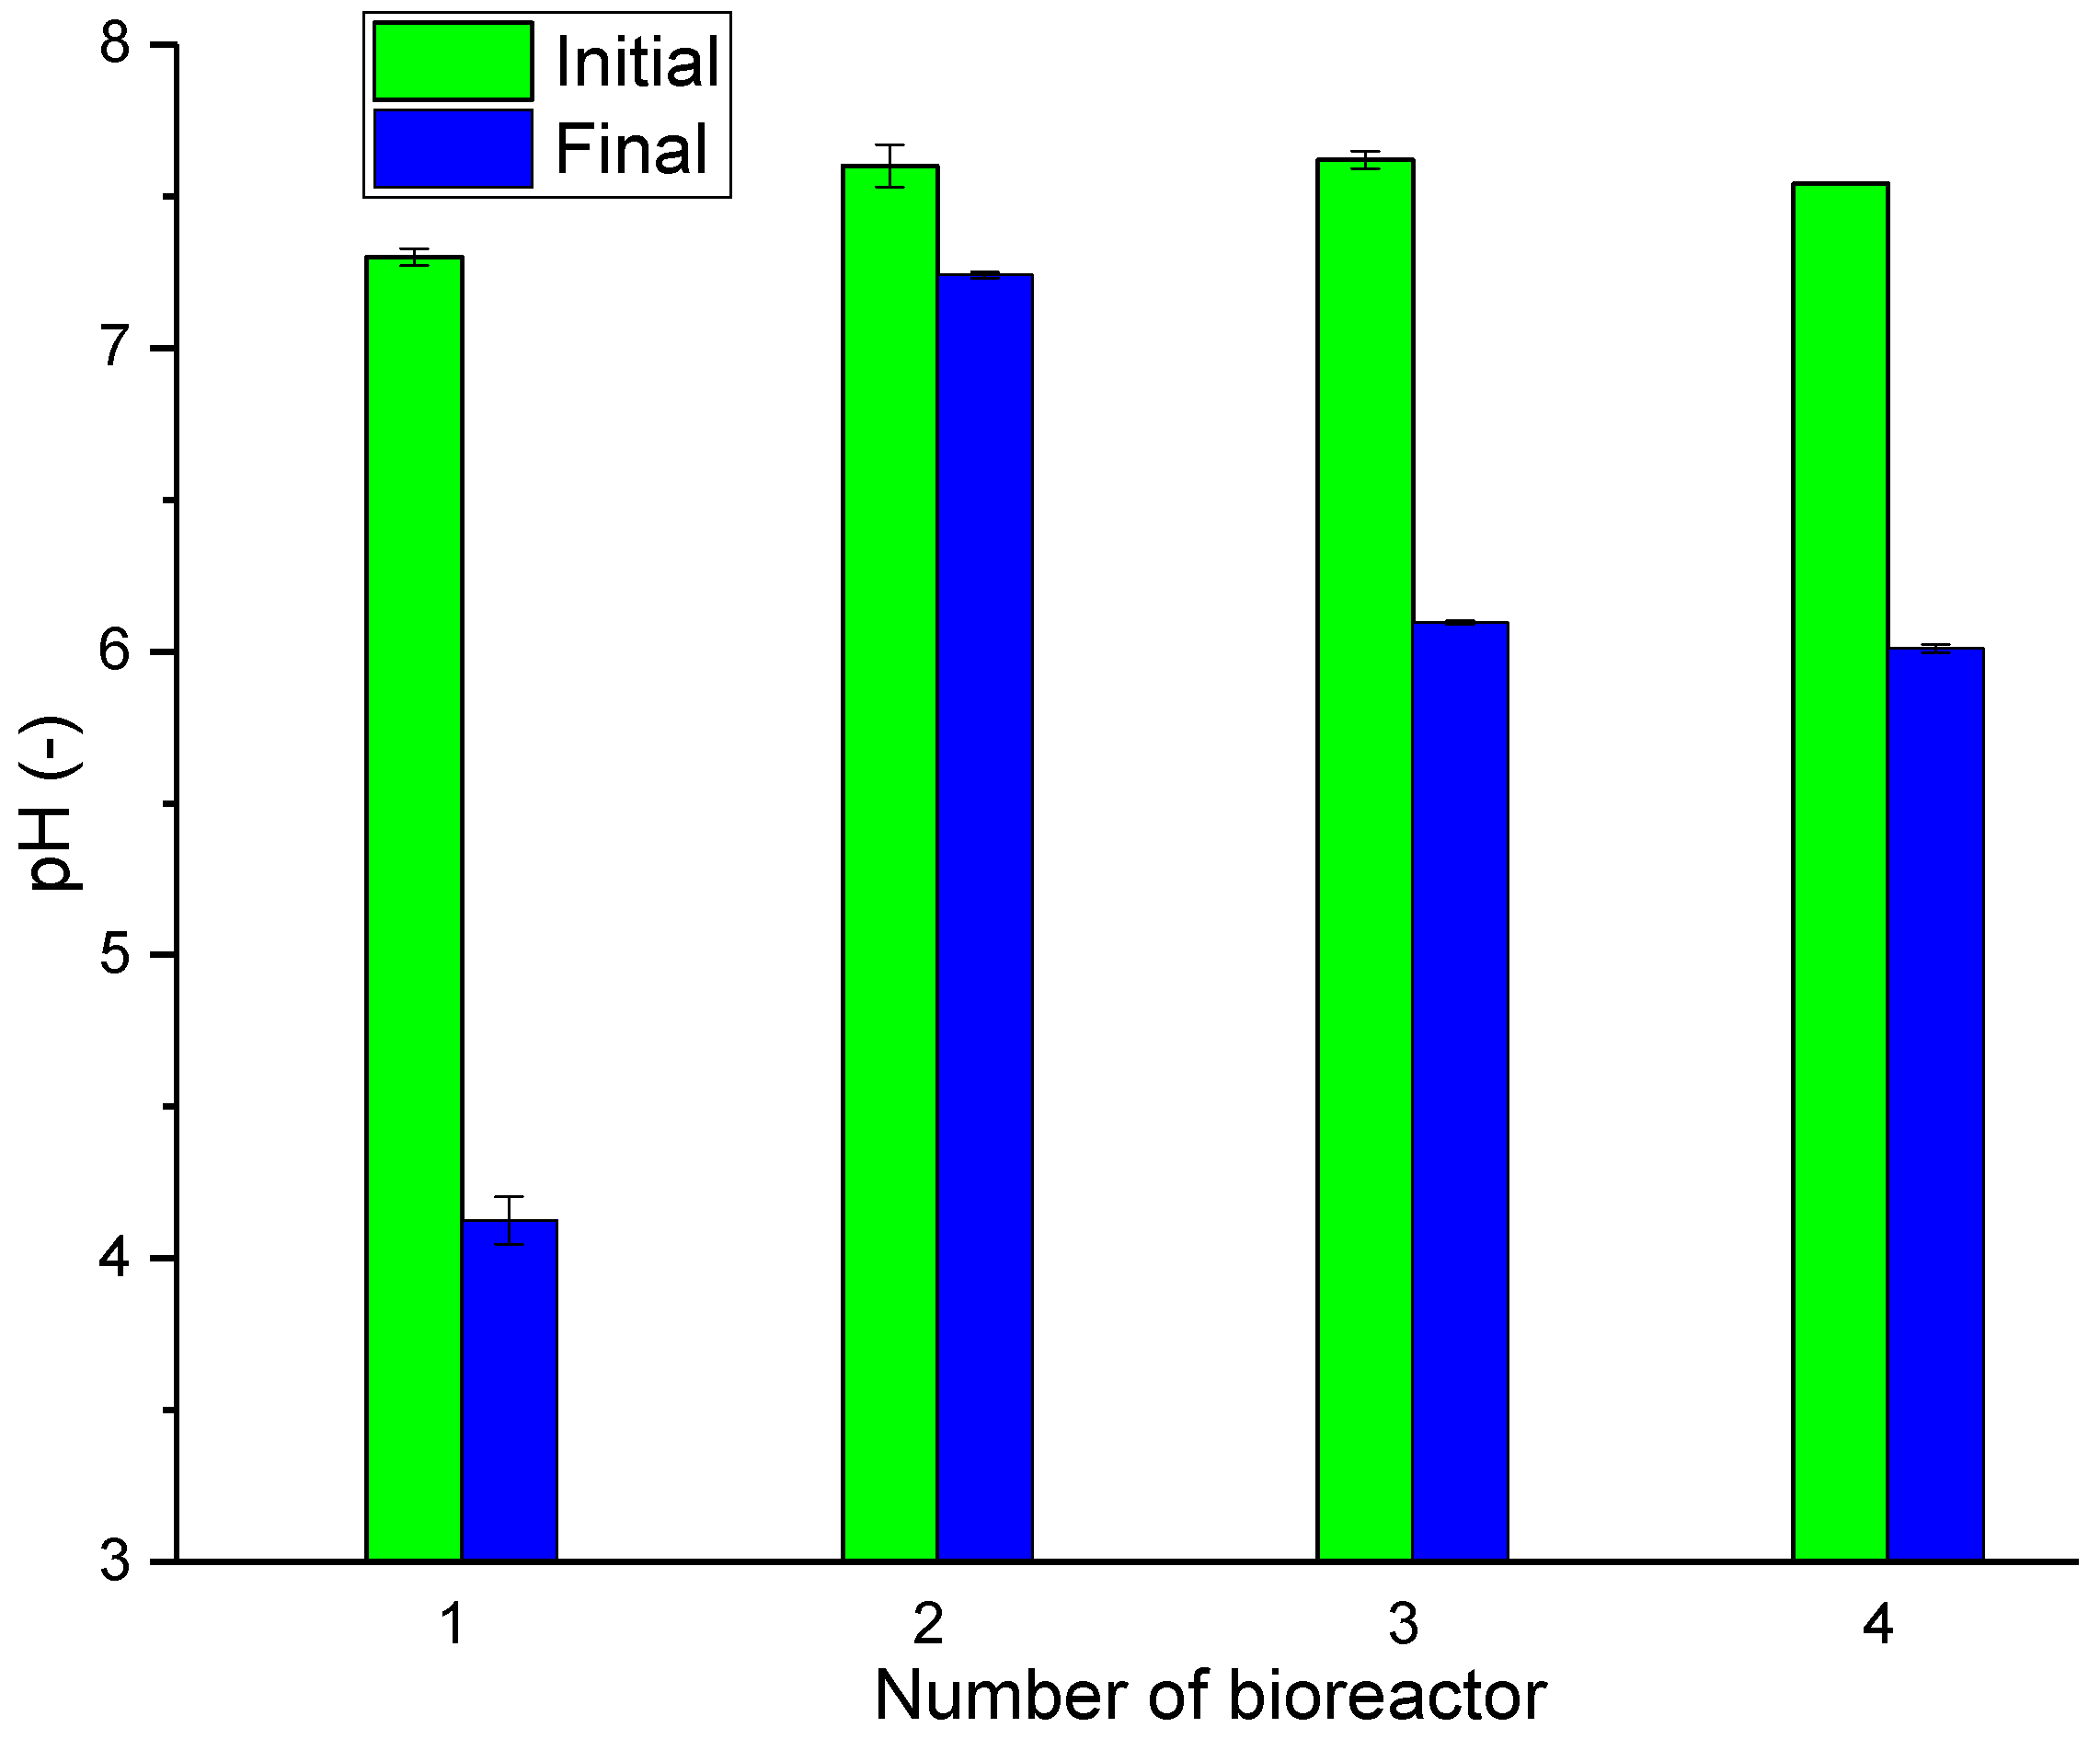
3.1. Changes in pH

At the start of the process, the pH ranged from 7.30 to 7.63. After 4 days of the DF process, a decrease in pH was observed in all bioreactors, which was due to the production of VFAs (Figure 1). The greatest decrease in pH was noticed in bioreactor No. 1, which was due to the lack of inoculum. In addition to the inoculum bacterial consortium was ammonium nitrogen, which buffers the system, causing a slight drop in pH after the process. The lack of inoculum resulted in the rapid acidification of the mixture. In samples where the inoculum was subjected to thermal pretreatment, a drop in pH was observed, favored by the production of VFAs during the DF process. Similar pH values were obtained by Pagliaccia et al., Arain et al., Pramanik et al., and Lay et al. [19,20,26,27]. The time of thermal pretreatment had no significant impact on the final pH value. The lowest pH drop occurred in bioreactor No. 2, as the VFAs produced were partly used by methanogenic bacteria for the production of CH4.

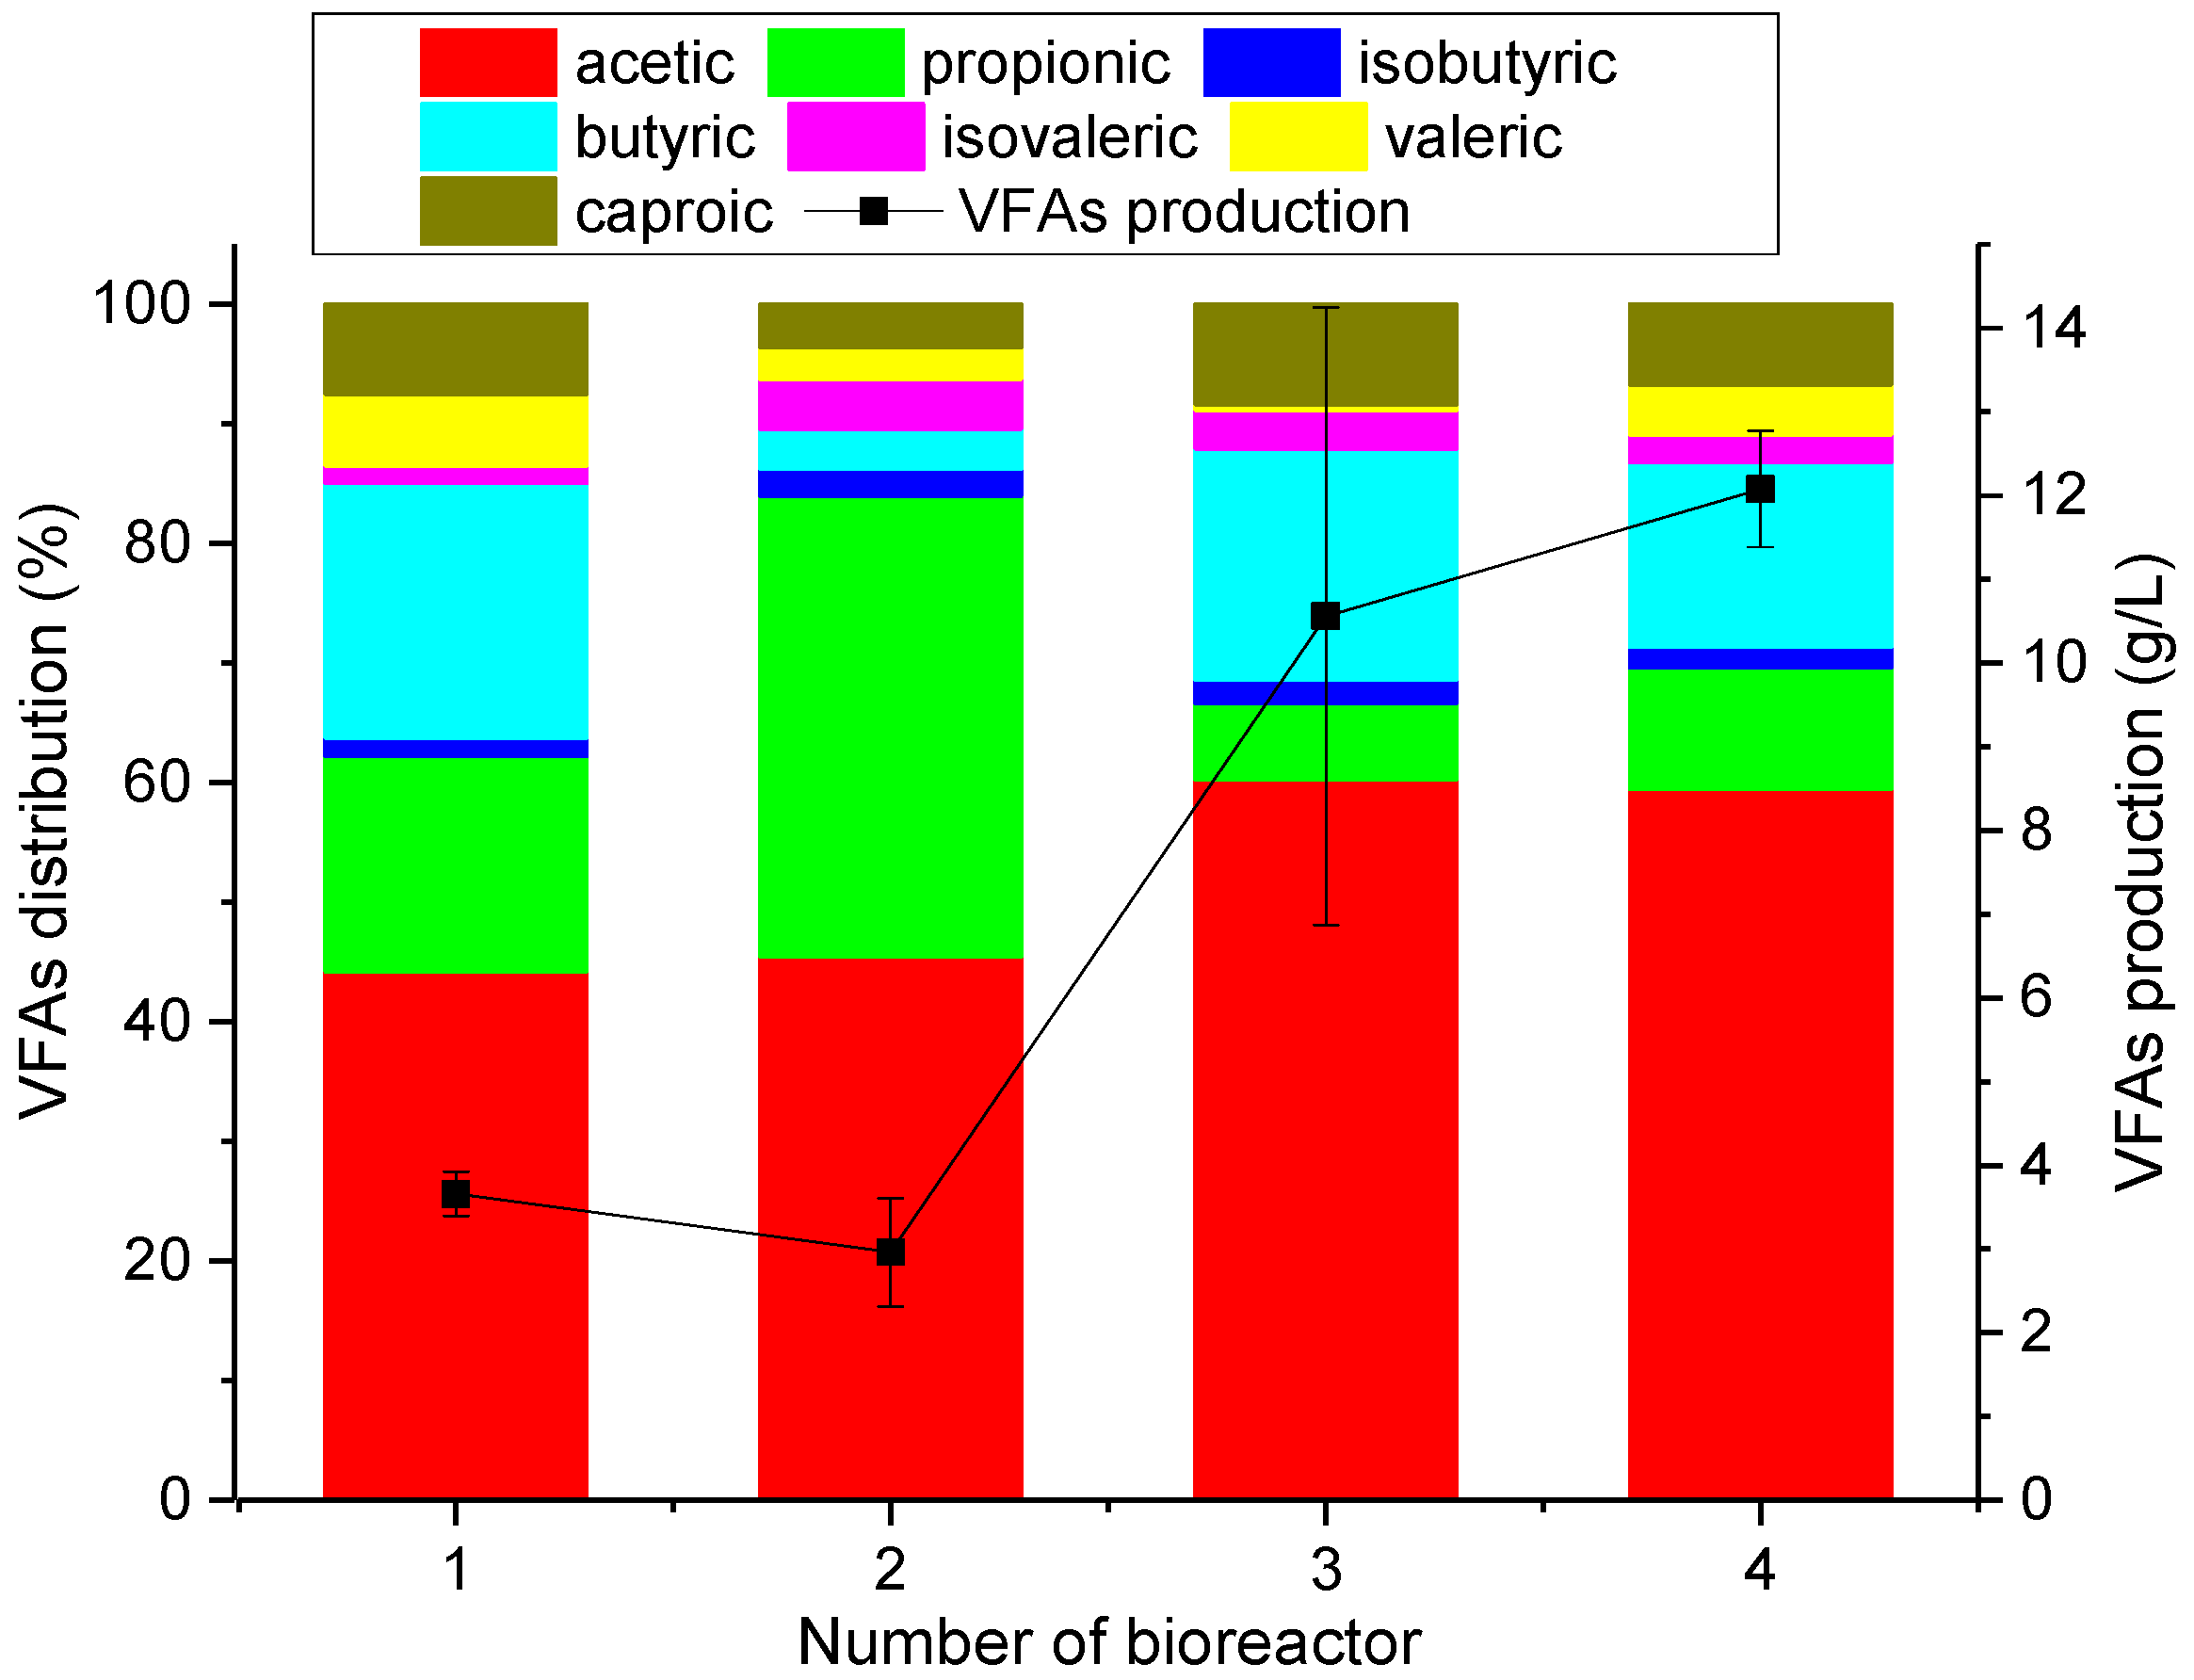
3.2. Production of VFAs

At the beginning, the total content of the VFAs was measured, and the results were below 500 mg CH3COOH/dm3. Based on a VFA analysis, it was observed that the lowest production of VFAs was in bioreactors 1 and 2 (Figure 2). In bioreactor No. 1, in the absence of buffering by inoculum, there was acidification and a lack of further VFA production. In bioreactor No. 2, the VFAs produced were used for methane production because the inoculum was not subjected to a thermal treatment to get rid of methanogenic archaea. In bioreactors No. 3 and 4, a three- and four-fold increase in VFAs was observed, compared to bioreactors No. 1 and 2, respectively. Extending the thermal treatment time of inoculum in the bioreactor caused a 15% increase in VFA production. In bioreactor No. 1, the dominant acid was acetic acid (43%), followed by butyric acid (23%), and propionic acid (20%). In bioreactor No. 2, the dominant acids were acetic (45%) and propionic (40%) acids. Whereas, in bioreactors 3 and 4, the dominant acids were acetic (60%) and butyric (20 and 15%, respectively) acids, which are associated with the production of hydrogen in the biochemical pathways of the DF process. Using a model substrate (glucose), it was observed that, in the DF process, mainly butyrate, acetate, as well as H2 and CO2 were produced. Glucose is converted to pyruvate through glycolysis to regenerate ATP. In the case of strict anaerobes, it is converted into acetyl-CoA. During the oxidation of pyruvate to acetyl-CoA, hydrogen is produced. Hydrogen production from pyruvic acid can take place in two ways. If pyruvate is oxidized to acetate, 4 moles of H2 are produced per mole of glucose, and if pyruvate is oxidized to butyrate, 2 moles of H2 are produced per mole of glucose. Therefore, the acetate-to-butyrate ratio is an important parameter for H2 production. There is also a pathway where pyruvic acid is oxidized to acetyl CoA and formic acid, and then H2 and CO2 are produced from the formic acid. The next pathway is the lactate pathway, through which pyruvic acid is oxidized to lactate, and the final metabolite is lactic acid, ethanol, or propionate. In this pathway, instead of fermentation, anaerobic respiration occurs, which may hinder hydrogen production [11]. In the series in which the largest amount of hydrogen was produced, the ratio of acetates to butyrate was approximately three. In the series without inoculum, this ratio was less than two. In the series in which the inoculum was not heated, this ratio was higher (it was approximately 15), but there was a higher amount of propionic acid, indicating that the lactate pathway occurred in this series. The amount of VFA obtained after 96 h of process in bioreactors No. 3 and 4 (approx. 8.5 g/L as acetate) is lower than the amount of VFA obtained by Lay et al. after 100 h (on average from non-meat substrate approx. 10 g/L as acetate) [27].

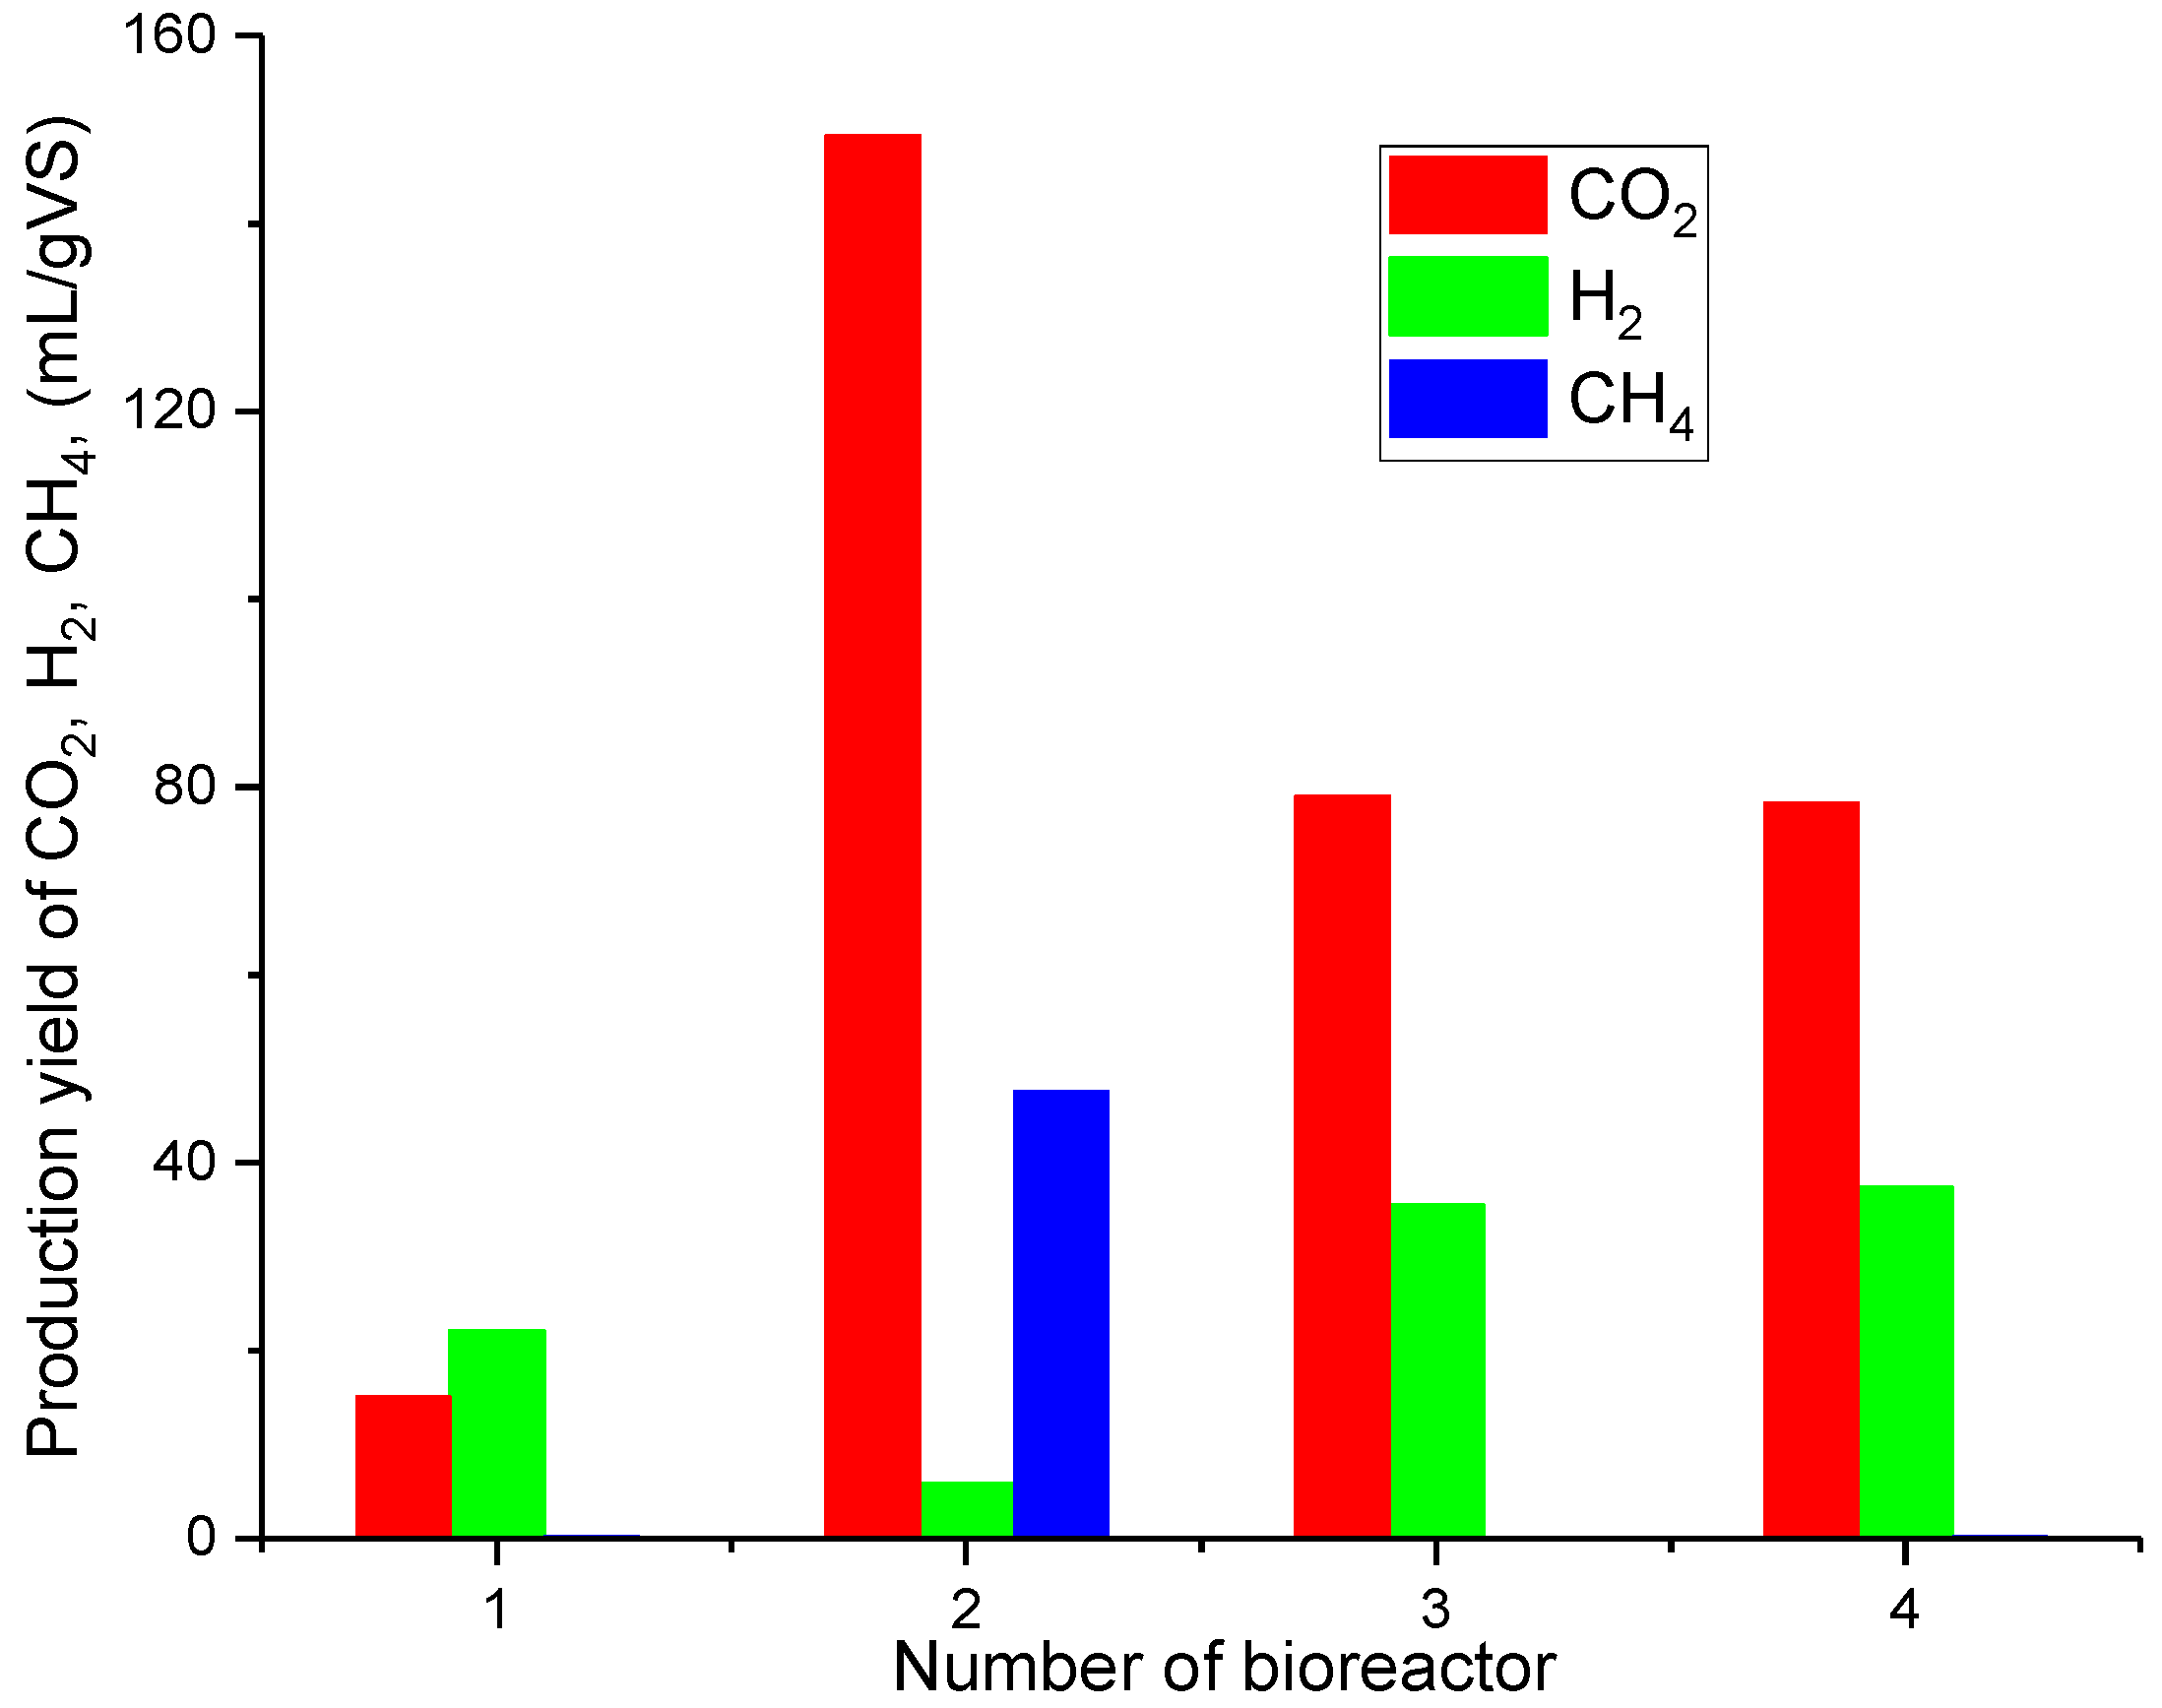
3.3. Production of CO2, H2 and CH4

During the 4 days of the process, the lowest production of H2 was observed in bioreactor No. 2 (Figure 3) [28]. This is due to the start of methane fermentation (MF), which is confirmed in the amount of CH4 produced at that time. The largest CO2 production is also observed in this bioreactor. This is due to the fact that CO2 is produced both in the stage of acetogenesis in the MF process and in the stage of methanogenesis. A higher H2 production and the lowest CO2 production were observed in bioreactor No. 1 than in bioreactor No. 2 [28]. The production of CH4 was not observed in bioreactor No. 1. This is due to the fact that KW may contain bacteria responsible for hydrogen production (in small quantities) but the methanogens are not part of the autochthonous KW microflora. In addition, the low pH resulted in the inhibition of methane fermentation. However, in the bioreactors, to which inoculum was added after thermal pretreatment (bioreactors No. 3 and 4), H2 production was twice as high as in bioreactor No. 1, and a higher CO2 production was also observed in these bioreactors than in No. 1, but not as high as in bioreactor No. 2 [28]. CH4 production was also not observed in bioreactors No. 3 and 4. This means that the stage of methanogenesis of the MF process did not take place in these reactors. Thus, the thermal inoculum pretreatment for 15 and 30 min was effective in eliminating methanogens. In the studies conducted by Alibardi et al. and Jayalakshmi et al., up to 72 mL H2/gVSKW were obtained [21,29]. In our study, lower values were achieved (almost 40 mL H2/gVSKW) due to the lack of process optimization, e.g., substrate loading or dilution of the reaction mixture. The focus was on eliminating methanogens from the inoculum to enable the dark fermentation process to occur and, at the same time, to produce hydrogen.
The highest yield and rates of H2 production were observed in bioreactors No. 3 and 4, in which inoculum was thermally pretreated (Figure 4) [28]. It shows that inoculum thermal pretreatment has a positive effect on the DF process. However, the thermal treatment time does not have a significant impact on the amount of hydrogen produced. The difference between the amount of hydrogen produced in bioreactor No. 4 and the amount of hydrogen produced in bioreactor No. 3 is about 5 mL H2/gVSKW. The lowest production of H2 was observed in bioreactor No. 2—without thermal pretreatment. This is due to the start of MF and methane production. A delay in the production of H2, as well as the lower production of H2 compared to bioreactors No. 3 and 4, was observed in bioreactor No. 1. Nevertheless, the occurrence of H2 in this bioreactor confirmed that the bacterial consortia contained in KW can carry out the DF process [28].

3.4. Carbon Balance

It is supposed that carbon is converted from the solid phase to soluble carbon compounds in the liquid phase (enzymatic process), and then these compounds are transformed into VFAs. The VFAs are then partially converted, producing carbon compounds in the gas phase (CO2 and CH4) (fermentation by microorganisms). In bioreactors No. 1, 3, and 4, an increase in the amount of carbon in the liquid phase and a decrease in the amount of carbon in the solid phase was observed after the DF process, compared to the beginning of the process. In bioreactor No. 1, at the end of the process, approximately 60% of the carbon in the liquid phase comes from VFAs. No inoculum was added to this bioreactor, but with the participation of autochthon microorganisms from KW, some of the simple, soluble carbon compounds were converted into VFAs, but not all of them. In bioreactor No. 2, at the end of the process, 82% of the carbon in the liquid phase comes from VFAs. In this bioreactor, almost all simple, soluble carbon compounds were converted into VFAs, which were then converted into gas (mainly CO2 and CH4). In bioreactors No. 3 and 4, at the end of the process, all simple, soluble carbon compounds in the liquid phase were converted into VFAs, which were then partially converted into gas (mainly CO2 and H2). In bioreactors No. 1, 3, and 4, a low amount of carbon in the gas phase (in the form of CO2) was also observed because the acetic acid dominated in these reactors, which is accompanied by the production of the largest amount of hydrogen. In bioreactor No. 2, the amount of carbon in both the solid and liquid phases decreased. The decrease in the VFA concentration was due to CH4 production. Compared to the other bioreactors, bioreactor No. 2 showed the highest amount of carbon in the gas phase in the form of CO2 and CH4. The results are presented in Table 4. Carbon balance errors can be caused by different techniques for determining total organic carbon, elementary analysis, and gas chromatography. The reason may also be the difficulty in obtaining a representative sample due to the heterogeneity of the medium in the reactor.

4. Conclusions

During the DF process, there is a large drop in the pH values, compared to MF. This is due to the production of VFAs. Additionally, the inoculum causes a smaller drop in pH value because, in addition to the bacterial consortium, it contains ammonium nitrogen, which buffers the system. During H2 production in the DF process, the main acids produced are acetic and butyric acids. This is consistent with the metabolic pathways of the DF process. When the inoculum is preheated for longer, the ratio of acetates to butyrate increases, which is a desirable phenomenon due to the greater production of H2 in the pathway in which acetic acid is also produced. As the time of thermal pretreatment of the inoculum increased, the amount of VFAs produced increased (by 15%). In reactor No. 4, despite higher acetic acid production and the acetic/butyric acid ratio, no significant increase in H2 production was observed, which was due to propionic acid production. In the series without pretreating the inoculum, a lower amount of VFAs was produced, but the content of propionic acid was higher than in the other series and there were fewer butyric and acetic acids. This can be related to the lactic pathway, where H2 production is inhibited as anaerobic respiration (methane fermentation) begins. This means that methane fermentation took place in this series. The bacterial consortia contained in KW can carry out the DF process without the addition of inoculum, but the yield of hydrogen produced is much lower. There is also a greater and faster acidification of the reaction mixture, and thus a faster completion of the process.
In further stages of research, it will be possible to focus on optimizing subsequent process parameters (e.g., substrate loading, pH regulation), as well as attempting to pretreat the substrate, which may help to use it to a greater extent. KW contains compounds such as cellulose, hemicellulose, and lignin, which, after preliminary processing, can be decomposed into simpler substances, more accessible to microorganisms. Another direction in the future may be attempts to increase the scale of the process and make it continuous, which would be suitable for industrial application. However, there are several problems in this direction. For example, the problem is to maintain a constant hydrogen production efficiency. Another problem is to ensure the right time in the reactor so that the inoculum is not tilted. The reactor load with the appropriate KW is also a problem. Therefore, further research on the DF process is needed.

Author Contributions

Conceptualization, R.Ś. and J.Ś.; methodology, R.Ś. and M.D.; formal analysis, M.D. and R.Ś.; investigation, J.Ś.; writing—original draft preparation, M.D.; writing—review and editing, K.P., R.Ś. and S.L.; supervision, S.L. All authors have read and agreed to the published version of the manuscript.

Funding

This research was funded by the National Science Centre (2021/43/B/ST8/00298).

Data Availability Statement

The data that support the findings of this study are available from the corresponding author upon reasonable request.

Acknowledgments

The authors gratefully acknowledge the Group Wastewater Treatment Plant in Lodz (Poland) for providing the research material. This work has been completed while the first author was the Doctoral Candidate in the Interdisciplinary Doctoral School at the Lodz University of Technology, Poland.

Conflicts of Interest

The authors declare no conflicts of interest. The funders had no role in the design of the study; in the collection, analyses, or interpretation of data; in the writing of the manuscript; or in the decision to publish the results.

References

  1. Guo, X.M.; Trably, E.; Latrille, E.; Carrère, H.; Steyer, J.-P. Hydrogen Production from Agricultural Waste by Dark Fermentation: A Review. Int. J. Hydrogen Energy 2010, 35, 10660–10673. [Google Scholar] [CrossRef]
  2. Ni, M.; Leung, D.Y.C.; Leung, M.K.H.; Sumathy, K. An Overview of Hydrogen Production from Biomass. Fuel Process. Technol. 2006, 87, 461–472. [Google Scholar] [CrossRef]
  3. Wang, C.; Chang, Y.; Zhang, L.; Pang, M.; Hao, Y. A Life-Cycle Comparison of the Energy, Environmental and Economic Impacts of Coal versus Wood Pellets for Generating Heat in China. Energy 2017, 120, 374–384. [Google Scholar] [CrossRef]
  4. Piera, M.; Martínez-Val, J.M.; José Montes, M. Safety Issues of Nuclear Production of Hydrogen. Energy Convers. Manag. 2006, 47, 2732–2739. [Google Scholar] [CrossRef]
  5. Pańczyk, M.; Borowiecki, T. Otrzymywanie i Zastosowanie Gazu Syntezowego. In Zakład Technologii Chemicznej; Wydział Chemii Uniwersytetu w Lublinie: Lublin, Poland, 2012. [Google Scholar]
  6. Ausfelder, F.; Bazzanella, A. Hydrogen in the Chemical Industry. In Hydrogen Science and Engineering: Materials, Processes, Systems and Technology; Wiley: Hoboken, NJ, USA, 2016; pp. 19–40. [Google Scholar] [CrossRef]
  7. Samanta, C. Direct Synthesis of Hydrogen Peroxide from Hydrogen and Oxygen: An Overview of Recent Developments in the Process. Appl. Catal. A Gen. 2008, 350, 133–149. [Google Scholar] [CrossRef]
  8. Rahman, S.N.A.; Masdar, M.S.; Rosli, M.I.; Majlan, E.H.; Husaini, T.; Kamarudin, S.K.; Daud, W.R.W. Overview Biohydrogen Technologies and Application in Fuel Cell Technology. Renew. Sustain. Energy Rev. 2016, 66, 137–162. [Google Scholar] [CrossRef]
  9. Tian, Q.-Q.; Liang, L.; Zhu, M.-J. Enhanced Biohydrogen Production from Sugarcane Bagasse by Clostridium Thermocellum Supplemented with CaCO3. Bioresour. Technol. 2015, 197, 422–428. [Google Scholar] [CrossRef]
  10. Srivastava, N.; Srivastava, M.; Abd_Allah, E.F.; Singh, R.; Hashem, A.; Gupta, V.K. Biohydrogen Production Using Kitchen Waste as the Potential Substrate: A Sustainable Approach. Chemosphere 2021, 271, 129537. [Google Scholar] [CrossRef]
  11. Gopalakrishnan, B.; Khanna, N.; Das, D. Dark-Fermentative Biohydrogen Production. In Biohydrogen; Elsevier: Amsterdam, The Netherlands, 2019. [Google Scholar] [CrossRef]
  12. Holladay, J.D.; Hu, J.; King, D.L.; Wang, Y. An Overview of Hydrogen Production Technologies. Catal. Today 2009, 139, 244–260. [Google Scholar] [CrossRef]
  13. Baeyens, J.; Zhang, H.; Nie, J.; Appels, L.; Dewil, R.; Ansart, R.; Deng, Y. Reviewing the Potential of Bio-Hydrogen Production by Fermentation. Renew. Sustain. Energy Rev. 2020, 131, 110023. [Google Scholar] [CrossRef]
  14. Eurostat. Key Figures on the EU in the World–2023 Edition. Available online: https://ec.europa.eu/eurostat/web/products-key-figures/w/ks-ex-23-001 (accessed on 12 December 2023).
  15. Jain, A.; Sarsaiya, S.; Kumar Awasthi, M.; Singh, R.; Rajput, R.; Mishra, U.C.; Chen, J.; Shi, J. Bioenergy and Bio-Products from Bio-Waste and Its Associated Modern Circular Economy: Current Research Trends, Challenges, and Future Outlooks. Fuel 2022, 307, 121859. [Google Scholar] [CrossRef]
  16. Tapia-Venegas, E.; Ramirez-Morales, J.E.; Silva-Illanes, F.; Toledo-Alarcón, J.; Paillet, F.; Escudie, R.; Lay, C.-H.; Chu, C.-Y.; Leu, H.-J.; Marone, A.; et al. Biohydrogen Production by Dark Fermentation: Scaling-up and Technologies Integration for a Sustainable System. Rev. Environ. Sci. Bio/Technol. 2015, 14, 761–785. [Google Scholar] [CrossRef]
  17. Rafieenia, R.; Lavagnolo, M.C.; Pivato, A. Pre-Treatment Technologies for Dark Fermentative Hydrogen Production: Current Advances and Future Directions. Waste Manag. 2018, 71, 734–748. [Google Scholar] [CrossRef] [PubMed]
  18. Lee, W.S.; Chua, A.S.M.; Yeoh, H.K.; Ngoh, G.C. A Review of the Production and Applications of Waste-Derived Volatile Fatty Acids. Chem. Eng. J. 2014, 235, 83–99. [Google Scholar] [CrossRef]
  19. Pagliaccia, P.; Gallipoli, A.; Gianico, A.; Montecchio, D.; Braguglia, C.M. Single Stage Anaerobic Bioconversion of Food Waste in Mono and Co-Digestion with Olive Husks: Impact of Thermal Pretreatment on Hydrogen and Methane Production. Int. J. Hydrogen Energy 2016, 41, 905–915. [Google Scholar] [CrossRef]
  20. Arain, M.; Mahar, R.B.; Sahito, A.R. Biohydrogen Production from Co-Digestion of High Carbohydrate Containing Food Waste and Combined Primary and Secondary Sewage Sludge. Mehran Univ. Res. J. Eng. Technol. 2018, 37, 139–148. [Google Scholar] [CrossRef]
  21. Alibardi, L.; Cossu, R. Composition Variability of the Organic Fraction of Municipal Solid Waste and Effects on Hydrogen and Methane Production Potentials. Waste Manag. 2015, 36, 147–155. [Google Scholar] [CrossRef]
  22. Ji, J.; Cai, Z.; Shen, L. Comparison Analysis on Biohydrogen Production of Mesophilic and Thermophilic Dark Fermentation Using Nickel Doped Lanthanum-Iron Oxide Nanoparticles as Supplementation. Int. J. Hydrogen Energy 2024, 49, 90–106. [Google Scholar] [CrossRef]
  23. Hidalgo, D.; Pérez-Zapatero, E.; Martín-Marroquín, J. Comparative Effect of Acid and Heat Inoculum Pretreatment on Dark Fermentative Biohydrogen Production. Environ. Res. 2023, 239, 117433. [Google Scholar] [CrossRef]
  24. Slezak, R.; Grzelak, J.; Krzystek, L.; Ledakowicz, S. Production of Volatile Fatty Acids and H2 for Different Ratio of Inoculum to Kitchen Waste. Environ. Technol. 2019, 41, 3767–3777. [Google Scholar] [CrossRef]
  25. APHA. Standard Methods for the Examination of Water and Wastewater, 21st ed.; American Public Health Association: Washington, DC, USA, 2005. [Google Scholar]
  26. Pramanik, S.K.; Suja, F.B.; Zain, S.M.; Pramanik, B.K. The Anaerobic Digestion Process of Biogas Production from Food Waste: Prospects and Constraints. Bioresour. Technol. Rep. 2019, 8, 100310. [Google Scholar] [CrossRef]
  27. Lay, J. Influence of Chemical Nature of Organic Wastes on Their Conversion to Hydrogen by Heat-Shock Digested Sludge. Int. J. Hydrogen Energy 2003, 28, 1361–1367. [Google Scholar] [CrossRef]
  28. Ślęzak, R.; Domińska, M.; Świątkiewicz, J.; Paździor, K.; Ledakowicz, S. Influence of Inoculum Thermal Pretreatment on Hydrogen Production in Dark Fermentation Process. In Proceedings of the 24th Polish Conference of Chemical and Process Engineering, Szczecin, Poland, 13–16 June 2023; pp. 56–57. [Google Scholar]
  29. Jayalakshmi, S.; Sukumaran, V.; Joseph, K. Enhancement of Hydrogen Production from Kitchen Waste Using Heat Treated Anaerobic Biogas Plant Slurry with PH Control. Int. J. Environ. Sustain. Dev. 2009, 8, 23–35. [Google Scholar] [CrossRef]
Figure 1. Changes in pH at the beginning and end of the process [28].
Energies 17 00974 g001
Figure 2. Production of VFAs [28].
Energies 17 00974 g002
Figure 3. Production yield of CO2, H2, and CH4 [28].
Energies 17 00974 g003
Figure 4. Changes in the production of H2 over time [28].
Energies 17 00974 g004
Table 1. Methods of obtaining hydrogen [11,12,13].
ProcessSubstrateOrganismEfficiency
Chemical/refineryAmmonia reformingAmmonia-no data
Aqueous phase reformingCarbohydrates-35–55%
Steam reformingHydrocarbons-70–85%
Partial oxidationHydrocarbons-60–75%
Autothermal reformingHydrocarbons-60–75%
Plasma reformingHydrocarbons-9–85%
BiologicalBioelectrochemical systemMicrobial electrolysis cellBiomass + electricityExoelectrogens78%
BiophotolysisDirect photolysisWater + sunlight + biomass
  • Algae
  • Cyanobacteria
0.5%
Indirect biophotolysisWater + sunlight + biomass
  • Algae
  • Cyanobacteria
0.5%
FermentationPhoto fermentationBiomass + sunlight
  • Sulphur
  • Non-sulphur
0.1%
Dark fermentationBiomass
  • Mesophiles
  • Thermophiles
5%
Biomass gasificationBiomass-35–50%
WaterAlkaline electrolyzerH2O + electricity-50–60%
PEM electrolyzerH2O + electricity-55–70%
Solid oxide electrolysis cellsH2O + electricity-40–60%
Thermochemical water splittingH2O + heat-no data
Photoelectrochemical water slittingH2O + sunlight-12.4%
Table 2. Basic characteristics of inoculum.
pHTotal Solids (g/L)Volatile Solids (g/L)Carbon (%TS)
7.85 ± 0.0531.46 ± 0.3320.06 ± 0.2948.91 ± 0.49
Table 3. Basic characteristics of the substrate.
pHTotal Solids (g/L)Volatile Solids (g/L)Carbon (%TS)
4.41 ± 0.09178.3 ± 4.5165.1 ± 3.932.72 ± 0.06
Table 4. Carbon balance at the beginning and end of DF.
Bioreactor No.1234
StartSolid fraction (gC/L)3.678.188.998.33
Liquid fraction (gC/L)1.621.722.082.07
Sum (gC/L)5.299.9011.0610.40
EndSolid fraction (gC/L)2.656.136.756.60
Liquid fraction (gC/L)3.231.694.215.45
Gas fraction—CO2 (gC/L)0.111.090.580.57
Gas fraction—CH4 (gC/L)0.000.350.000.00
Sum (gC/L)5.999.2611.5412.62
Error (%)13.23−6.464.2521.35
Disclaimer/Publisher’s Note: The statements, opinions and data contained in all publications are solely those of the individual author(s) and contributor(s) and not of MDPI and/or the editor(s). MDPI and/or the editor(s) disclaim responsibility for any injury to people or property resulting from any ideas, methods, instructions or products referred to in the content.

