Article

Impact of Sweep Gas on the Degradation of an La0.6Sr0.4Co0.8Fe0.8O3 Anode in a Solid Oxide Electrolysis Cell

by
Michał Wierzbicki
1,2,
Stanisław Jagielski
1,2,3,
Yevgeniy Naumovich
1,2,*,
Anna Niemczyk
1,2,
Marek Skrzypkiewicz
1,2 and
Jakub Kupecki
1,2
1
Center for Hydrogen Technologies (CTH2), Institute of Power Engineering—National Research Institute, Augustowka 36, 02-981 Warsaw, Poland
2
Institute of Power Engineering—National Research Institute, Mory 8, 01-330 Warsaw, Poland
3
The Faculty of Power and Aeronautical Engineering, Institute of Heat Engineering, Warsaw University of Technology, Nowowiejska 21/25, 00-665 Warsaw, Poland
*
Author to whom correspondence should be addressed.
Energies 2024, 17(5), 1144; https://doi.org/10.3390/en17051144
Submission received: 26 January 2024 / Revised: 21 February 2024 / Accepted: 23 February 2024 / Published: 28 February 2024

Abstract

:
The degradation of solid oxide electrolysis (SOE) cells with different anode sweep gases was studied in 1000 h-long measurements in order to investigate the impact of sweep gas composition on cell performance. Cathode-supported electrolysis cells with an La0.6Sr0.4Co0.2Fe0.8O3 air electrode (active area of 4 × 4 cm2) were tested under a constant current (−0.25 A/cm2) in the electrolysis mode while supplying the cathode side with 70% H2O–30% H2 mixtures at 800 °C and using oxygen, nitrogen, and steam as sweep gases. It was demonstrated that the degradation of the anode in steam conditions resulted in more than a 2-fold increase in both, polarization and ohmic resistance (from 0.20–0.25 to 0.6–0.65 Ω cm2 compared to relatively stable values of 0.15–0.2 Ω cm2 for N2), as a consequence of the phase decomposition. Strontium played an important role in steam-induced degradation, migrating from the volume of the electrode layer to the surface of the electrolyte. As a result, the Sr-enriched layer demonstrated susceptibility to Cr poisoning. The cell purged with N2 demonstrated enhanced performance, while the use of oxygen led to degradation originating from the well-described delamination process. DRT analysis demonstrated some similarity of the spectra for steam and N2, namely the presence of a slow process at τ 0.5 s, which might be associated with hindered oxygen transport due to point defect association in the perovskite structure. The results of this study showed that Sr-containing materials likely cannot be used as an SOE anode in high humidity conditions.

1. Introduction

The growing market penetration of renewable energy sources (RES), advanced by environmental issues and decreasing costs of their generation, has produced favorable conditions for the development and deployment of electrochemical “green hydrogen” technologies. The shift towards low- and zero-carbon energy sources is the leading strategy in many countries worldwide. Hydrogen is considered both, a clean fuel and an energy carrier that can substitute fossil fuel sources and relieve the burden of anthropogenic pollution of the atmosphere, including CO2 as a greenhouse gas and NOx and SOx as toxic contaminants. Hydrogen is already widely used in various industrial processes, including (i) crude oil refining, (ii) the Haber-Bosch process for fixation of nitrogen (fertilizer production), (iii) methanol synthesis, and others [1]. Electrolysis is the most promising technology for low- or even zero-emission production of hydrogen (so-called “green hydrogen”) [2,3]. Among the various types of electrolyzers, high-temperature solid oxide electrolyzers (SOE) are expected to be the most efficient [4]. An important feature of the solid oxide electrolyzer cell’s (SOEC) operation is the production of high-purity oxygen as a by-product. Pure oxygen may be considered a commodity, with applications ranging from industry (welding and cutting) to medicine; however, in the elevated temperature of the SOEC anodic compartment, it behaves as a corrosive agent. Additionally, SOE stacks have a complicated thermal balance profile: at lower current density, the process is endothermic, while with a rise of the current, it shifts to an exothermic mode [5,6]. An obvious way to manage the heat balance is by the manipulation of the anodic sweep gas (ASG) flow and temperature [7]. However, the usage of ASG other than O2 leads to the loss of the oxygen’s commercial value, and looping of the O2 may result in corrosion of the metal parts of the functional units such as heat exchangers, etc. Barelli et al. proposed steam as an alternative to pure O2 [8]. The use of steam as a sweep gas has sufficient advantages over oxygen recycling because steam generation and treatment modules are necessary parts of an SOEC. Moreover, the separation of oxygen from steam is a relatively simple procedure, which can be organized with low losses of heat. While the general operability and efficiency of the electrolysis process have already been demonstrated, the important issue of the stability and degradation of the SOEC anode in alternative ASG flow requires further investigation. For the SOFC, the stability of the cathode materials against various air impurities was studied in detail [9]. The key problem is the contamination of the air electrode with chromia, which evaporates from the surface of the unprotected steel elements of the stack. However, the negative impact of humidity was also observed for all mainstream cathode materials, namely lanthanum-strontium manganite (LSM), lanthanum-strontium cobaltite-ferrite (LSCF), and lanthanum-strontium cobaltite (LSC) [10,11,12]. For LSC and LSCF, humidity-originated degradation was associated with the segregation of Sr. For the electrolysis cells, the amount of published data concerning the impact of the humidity of the sweep gas was also considered negative; however, the literature data on this topic are limited [13]. Another option is the use of CO2 as a purge gas [14]. The authors also considered oxygen with some admixture of CO2 for the production of the N2-free oxyfuel-like burning agent. Cells with LSC anodes and carbon dioxide as the ASG demonstrated sufficiently higher degradation compared to those purged with air.
In the present work, the authors studied the impact of O2, N2, and steam as ASGs on an SOEC with an La0.6Sr0.4Fe0.8Co0.2O3 (LSCF) anode. This material was selected instead of the more favorable LSC (La1−xSrx4CoO3, x = 0.3–0.4) air electrode due to its known higher thermodynamic stability, and it was chosen instead of LSM to achieve sufficiently better performance at the intermediate temperature operation range.

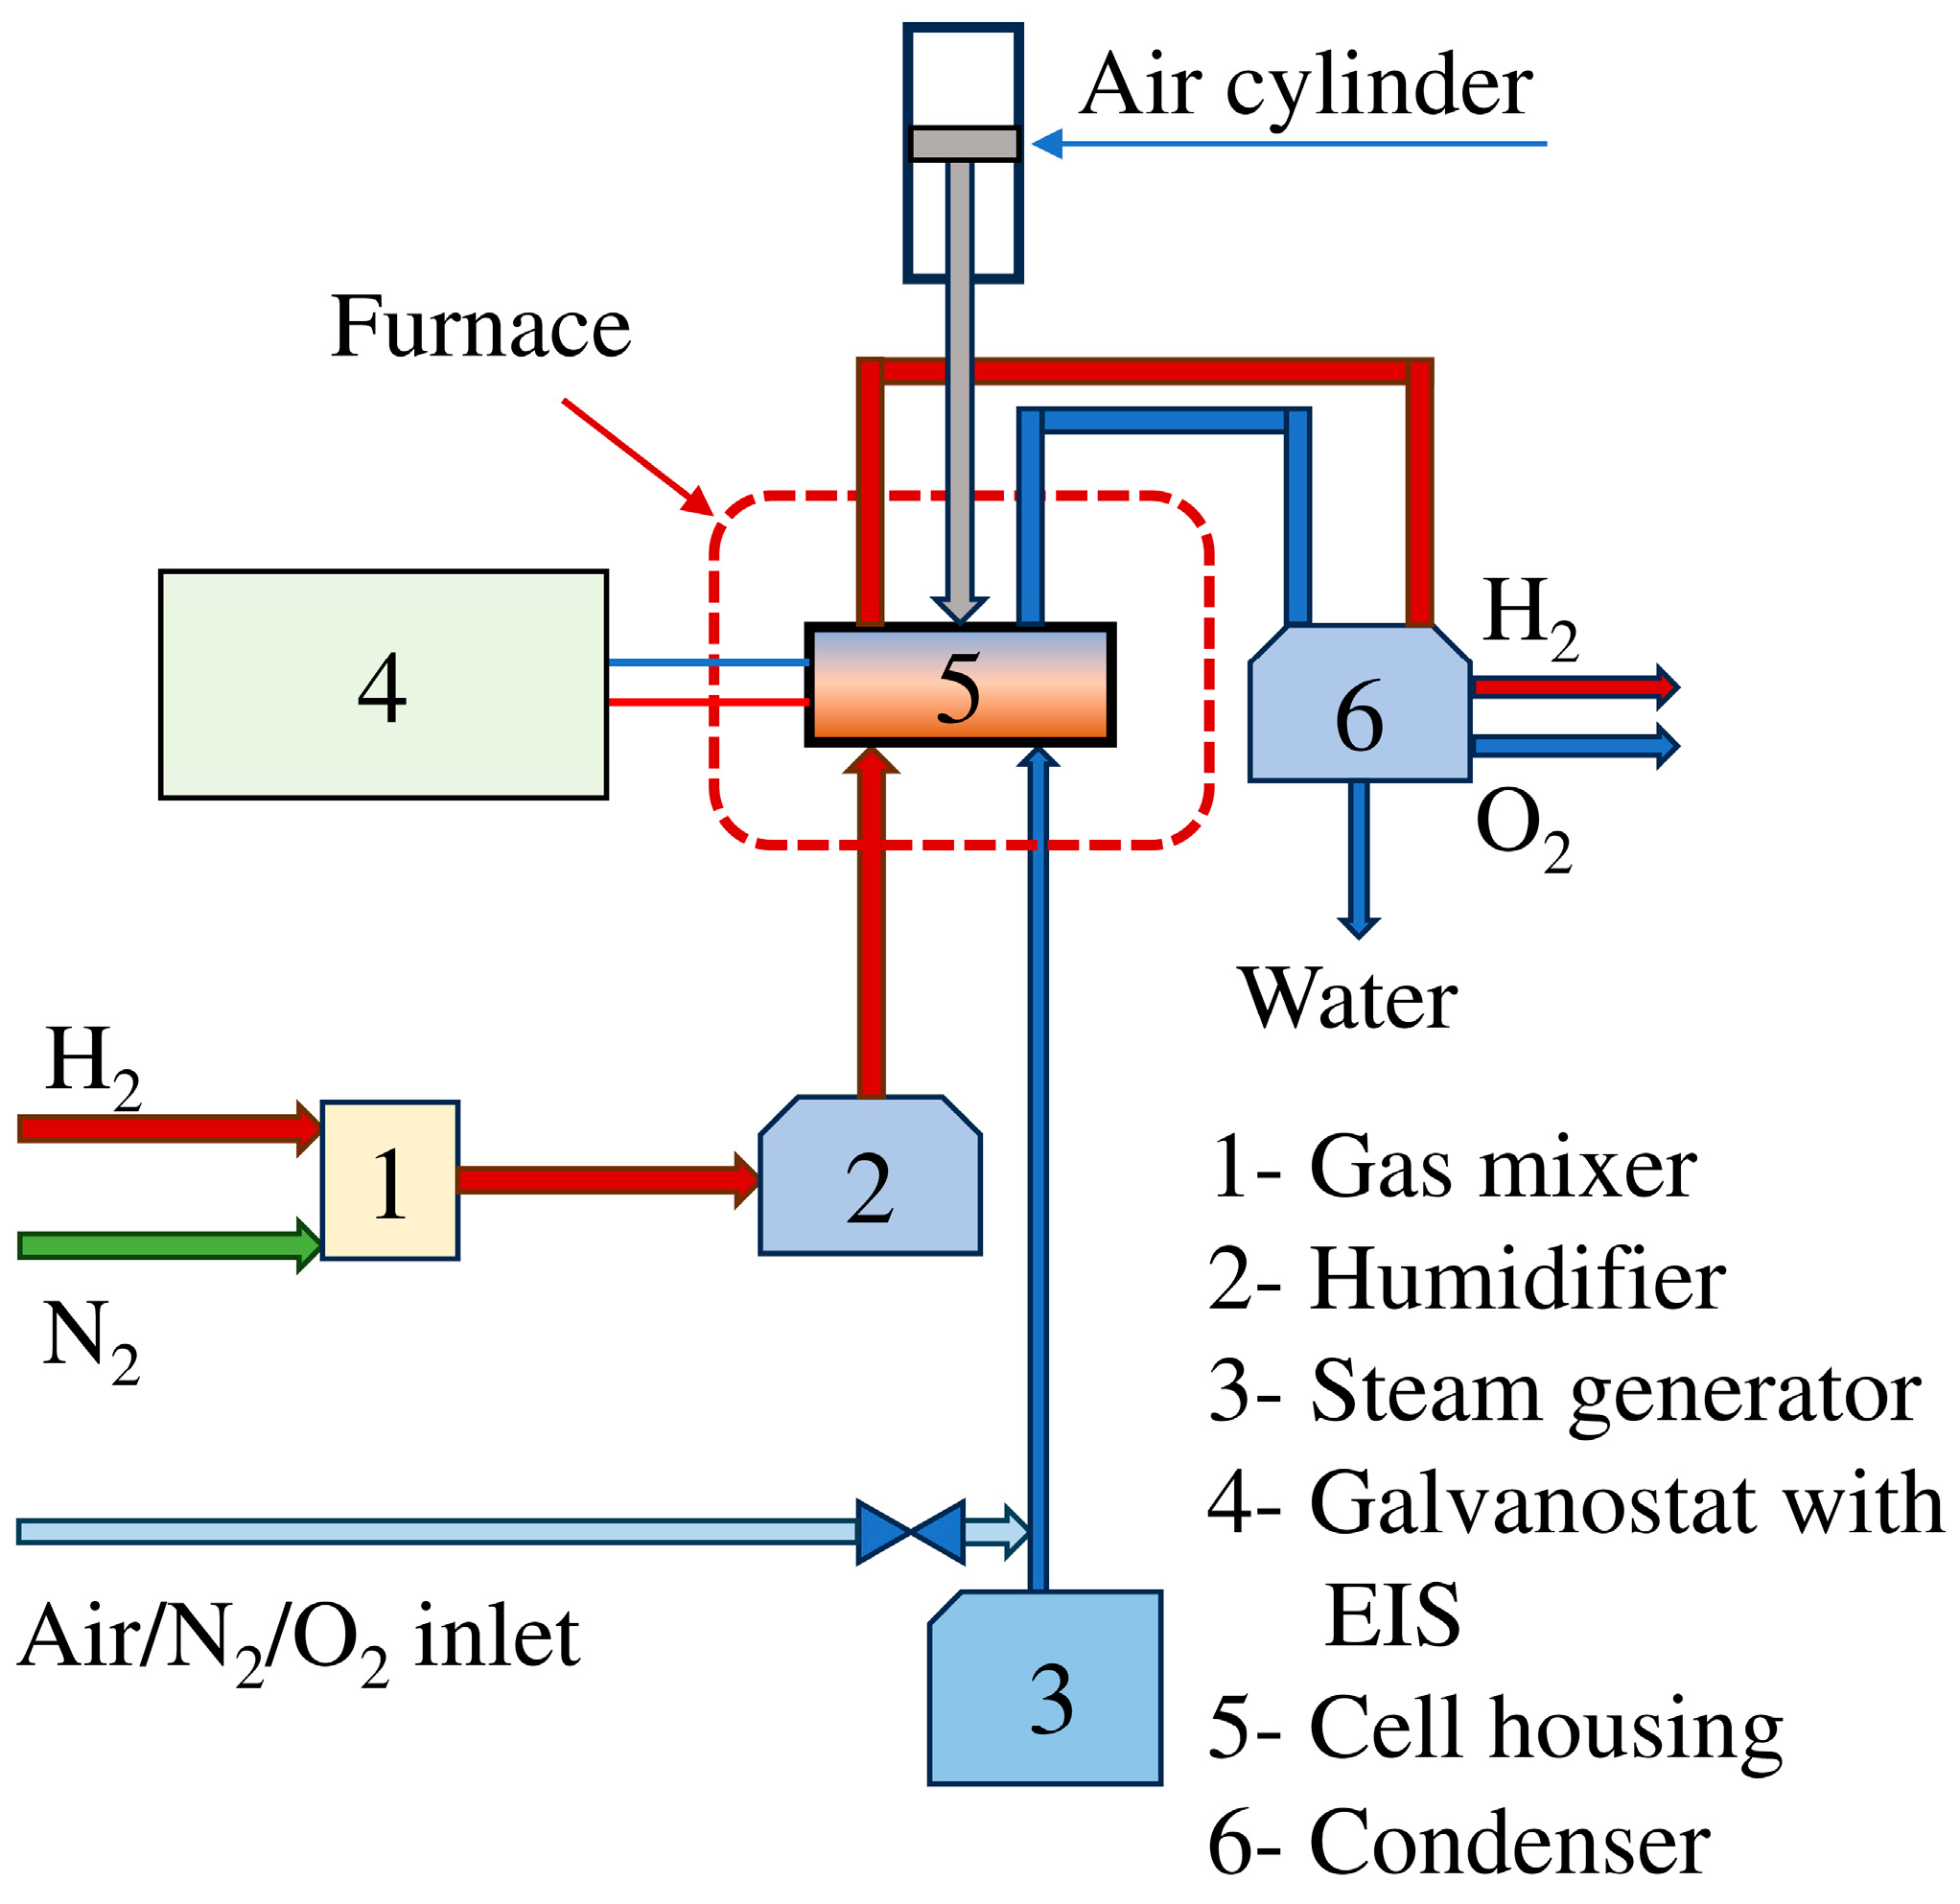
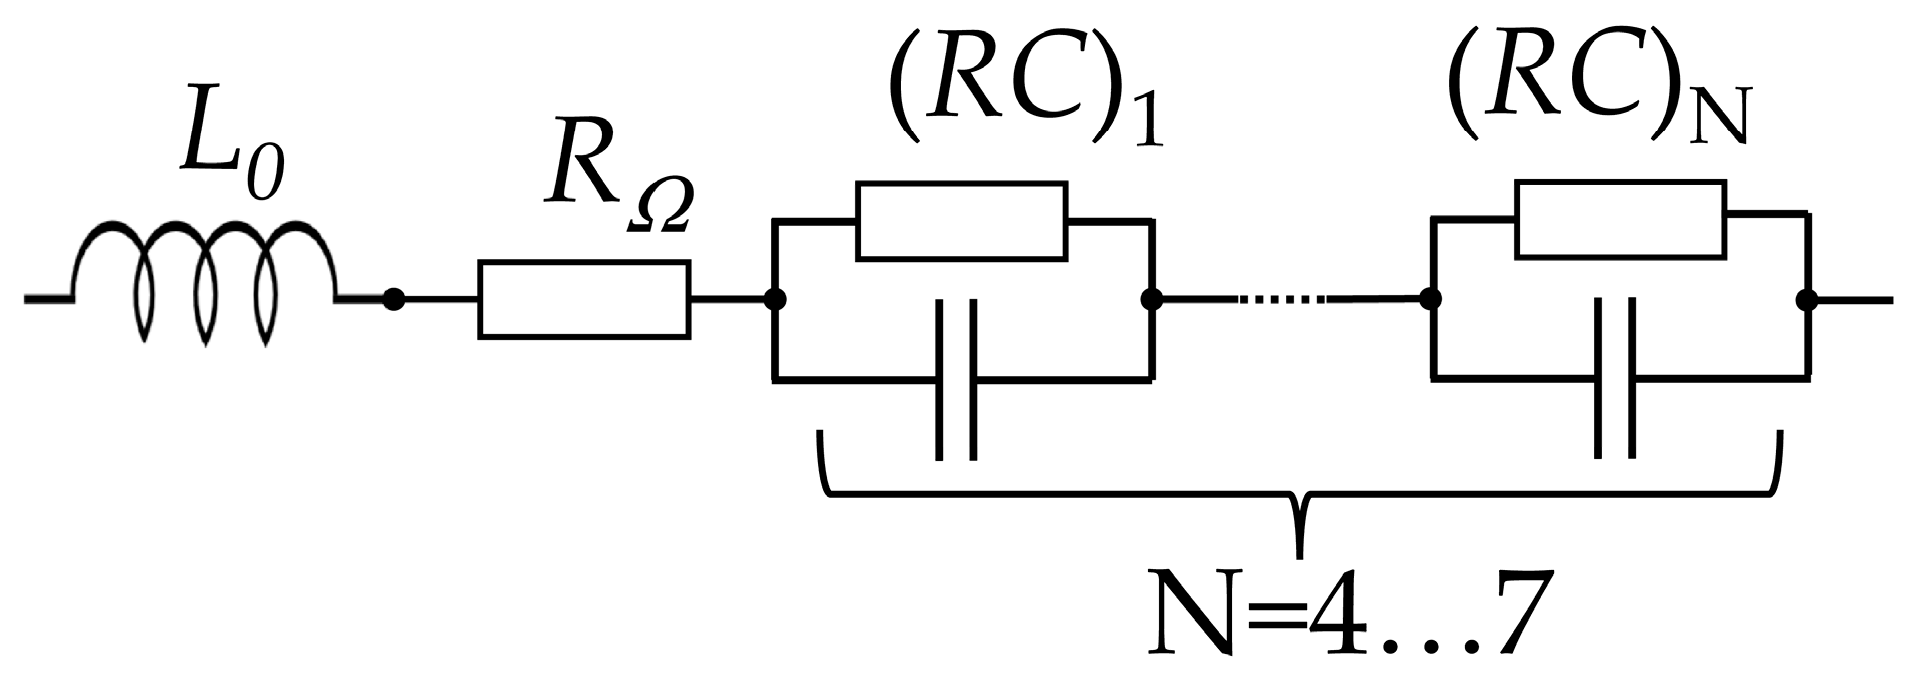
2. Materials and Methods

Electrolysis experiments were conducted in a gas-tight housing for 5 cm × 5 cm cells, with a gold grill current collector on the anode side and a nickel net on the cathode side (Figure 1). Housing was made from Crofer 22APU (VDM Metals GmbH, Werdohl, Germany) ferritic steel, which is dedicated to high-temperature electrochemical applications. Cells were sealed at 850 °C using commercially available glass-based sealing under a compression load of 300 N. The gold grill was supported by a mica gasket and ceramic paper, which also ensured electric insulation between the current collector and housing. A nickel net was directly connected to the top part of the housing. The temperature of the cell was controlled by 2 N-type thermocouples. The housing was incorporated in the test rig as schematically presented in Figure 2, which includes a furnace, gas preparation, steam generation equipment, a Zahner Electrochemical Workstation with PP240 and IM6ex modules (Zahner-Elektrik GmbH & Co., Kronach—Gundelsdorf, Germany), and a 4-quadrant potentiostat/galvanostat (±40 A, ±4 V) with an electrochemical impedance spectrometer (10 μHz–3 MHz range). Gas flows were controlled by Bronkhorst El-Flow mass flow controllers (Bronkhorst High-Tech B.V., Gelderland, The Netherlands), while for the preparation of the cathode gas, a precise Cellkraft P-10 laboratory humidifier (Cellkraft AB, Stockholm, Sweden) was used. It allows control humidity of the gas in range of 0–100% RH for the flows up to 10 LN/min at a pressure from atmospheric to 30 bar. Steam as ASG was supplied by aTHMOS precise steam generator (aDROP Feuchtemeßtechnik GmbH, Fürth, Germany). The design of the aTHMOS allowed low-pulsation generation of the 50–50,000 g/h flow of steam with a pressure of up to 6 bar. The usage of Bronkhorst El-Flow mass flow controllers for H2, N2, and O2, a precise humidifier from Cellcraft, and a steam generator from aDROP allowed the production of gas mixtures of the required quality in long-term experiments. A compressor gas cooler (6 at Figure 2) ECM-2 (M&C TechGroup, Ratingen, Germany) was used to avoid uncontrolled condensation of the water in outlet gas channels, which may interfere with electrochemical measurements by uncontrolled pressure pulsation. The test rig was designed for long-term continuous operation with semi-automatic data acquisition.
SOEC samples were prepared using commercial fuel electrode-supported half-cells from ELCOGEN [15]. The LSCF layer based on commercial powder (Kceracell Co., Ltd., Boksu-myeon, Republic of Korea) was screen-printed and sintered at 950 °C for 4 h in air. The details of the cells’ design are presented in Table 1.
After the installation of the cell in the test rig, each cell was heated to 840 °C to achieve gas tightness of the seal. A 4% H2 in N2 mixture was used as the sweep gas for the fuel electrode and air was used for the oxygen electrode. Next, the cells were cooled down to 800 °C. At that temperature, the fuel electrode was reduced in a 50% H2–50% N2 gas mixture for 6 h. After the reduction, each cell underwent preliminary tests to collect reference data on their electrochemical performance. After the finalization of these tests, the ASG was switched to O2, N2, or H2O, and the measured cells were held under a constant current of 4 A (0.25 A/cm2) for 1000 h, with periodic measurements of the electrochemical impedance. The cathode was fed with a 70% H2O–30% H2 mixture (CFG—cathode-fed gas) with a total flow of 300 mLN/min. Steam utilization under these conditions was ca. 14%. The EIS spectra were measured in the 7.5 mHz–112 kHz frequency range, with 220 samples per spectrum, in galvanostatic mode. EIS data were analyzed using in-home software (DRT module v.5.22, equivalent circuit fit module v. 8.1), which allows the analysis of the distribution of relaxation time (DRT) using an algorithm derived from the one proposed by Saccoccio et al. [16], as well as the fit of the EIS to the equivalent circuit models [17] and manipulations with spectra such as the elimination of the parasitic inductance effects or augmentation of the high-frequency part of the spectra to suppress artifacts [18] in the DRT analysis (illustrative materials can be found in Supplementary Materials, Figures S1 and S2, and Table S1). The software for EIS analysis and data treatment was written in C++, using GNU compiler collection (v. 13.1, with MingGW-W64 v.11) and optimized open-source math libraries [19,20,21]. Current–voltage characteristics (CVC) were collected from OCV (c.a. 0.770–0.955 V depending on the ASG) up to 1.35 V, with a voltage scan rate of 5 mV/s.
The post-mortem analysis of the studied cells was performed using the Versa 3D (FEI) high-resolution scanning electron microscope with an EDX detector (Carl Zeiss AG, Oberkochen, Germany). The preparation of the cell cross-sections was performed using a Hitachi IM4000Plus ion polisher (Hitachi High-Tech Corp., Ibaraki, Japan), which allows the prevention of adscititious delamination and rupture of the porous ceramic layers. X-ray diffraction experiments were conducted on CuKα radiation in the 2Θ range of 10–110° with step 0.013° using a Panalytical Empyrean diffractometer with a PIXcell3D detector (Malvern Panalytical Ltd., Malvern, UK).

3. Results and Discussion

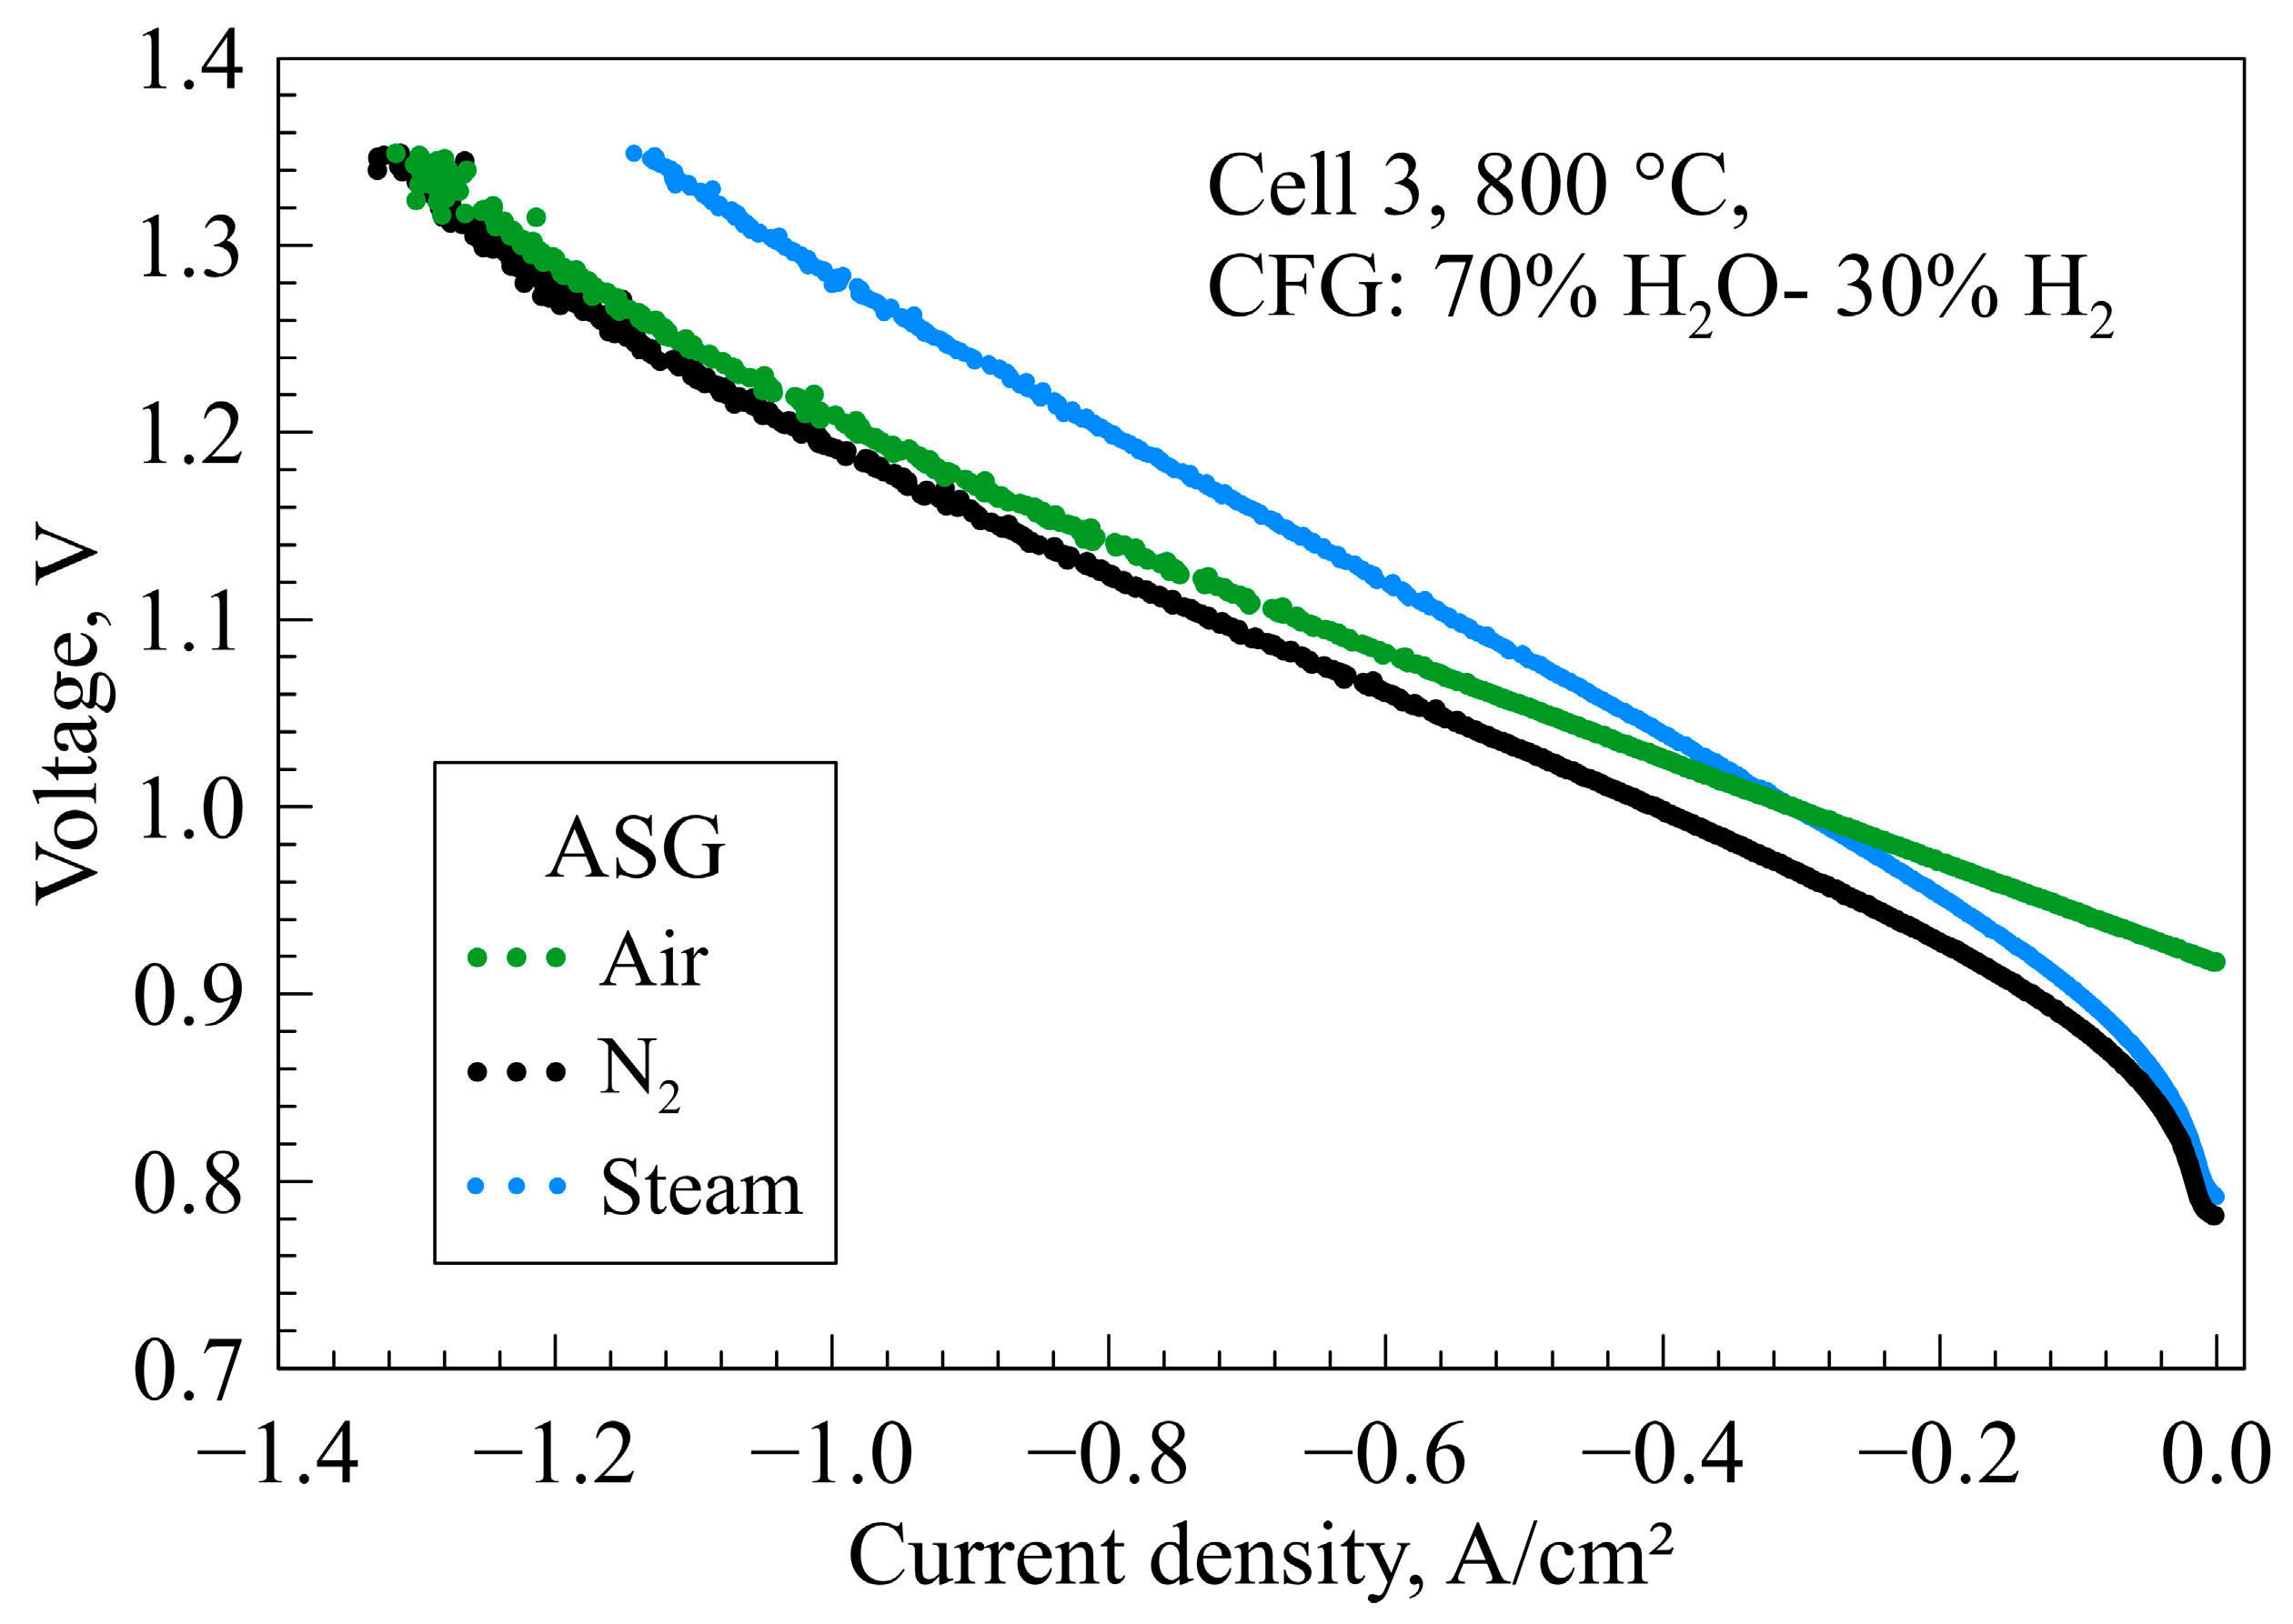
3.1. Reference Performance of the Cells

Before the long-term experiments, each cell was characterized at the standard conditions, using air as the ASG and 50% H2O–H2 mixtures as fuel gas (Table 2). The spectrum of each cell can be described as a sequent connection of the parasitic inductance L0, ohmic resistance RΩ related to the resistivity of the electrolyte and electrode layers, and a chain of the 4–7 RC elements, which relates to electrochemical processes (Figure 3):
While the elaboration of the exact model based on the equivalent circuits looks problematic due to low-frequency distortion of the spectra and developing degradation of the cell in long-term experiments, simplified models demonstrated good quality of the approximation (See Supplementary Materials, Figure S1 and Table S1) and were used to approach RΩ and the polarization resistance Rp:
R p = R C e l l R Ω = i N R i
where R C e l l is the real part of the cell impedance and R i are the real parts of the RC circuits. Models were also used to eliminate the impact of the parasitic inductance, which is necessary to augment the spectra for DRT analysis (See Supplementary Materials, Figures S1 and S2, Table S1).
Cell 1 was used to collect data for the interpretation of the DRT spectra. The impedance of the cell was measured for the different gas mixtures in the air cathodic and anodic compartments. These measurements had moderate success (Figure 4): while five peaks are distinctly observable, only peak (3) might be clearly attributed to anodic processes. While the most prominent peak (5) demonstrated mixed reaction, peak (4) likely is associated with the cathode, and low- τ effects in (1) and (2) do not demonstrate a clear correlation with either ASG or CFG. In general, the “sharing” of the relaxation time constants between electrodes is a known phenomenon [22]. Vague “slow” effects, labeled as (6), likely should be considered as artifacts, related to the operation of the steam generator, which can be observed on raw electrochemical data (See Supplementary Materials, Figures S3–S5).
Current–voltage characteristics, collected for Cell 3 with different sweep gases (Figure 5), demonstrated a sufficient difference of the steam as the ASG compared to the “standard” air and nitrogen. While at lower current densities, the differences were mainly governed by different OCV, at higher densities, the voltage on the steam-flushed cell was sufficiently high. However, the use of the steam did not limit the performance of the cell, which reached a current density of almost 1.2 A/cm2 at a voltage below 1.4 V, while practical operating of the current density value in electrolysis did not exceed 1 A/cm2 to avoid cathode degradation due to Ni coarsening [23,24,25].
Reference characterization of the cells demonstrated that initially cells had similar performance and electrochemical characteristics. While comprehensive deconvolution of the DRT spectra for studied cells looks problematic, distinctive elements of the spectra might be used for comparative analysis, and formal equivalent circuit fit can be applied to segregate ohmic, as well as polarization resistance.

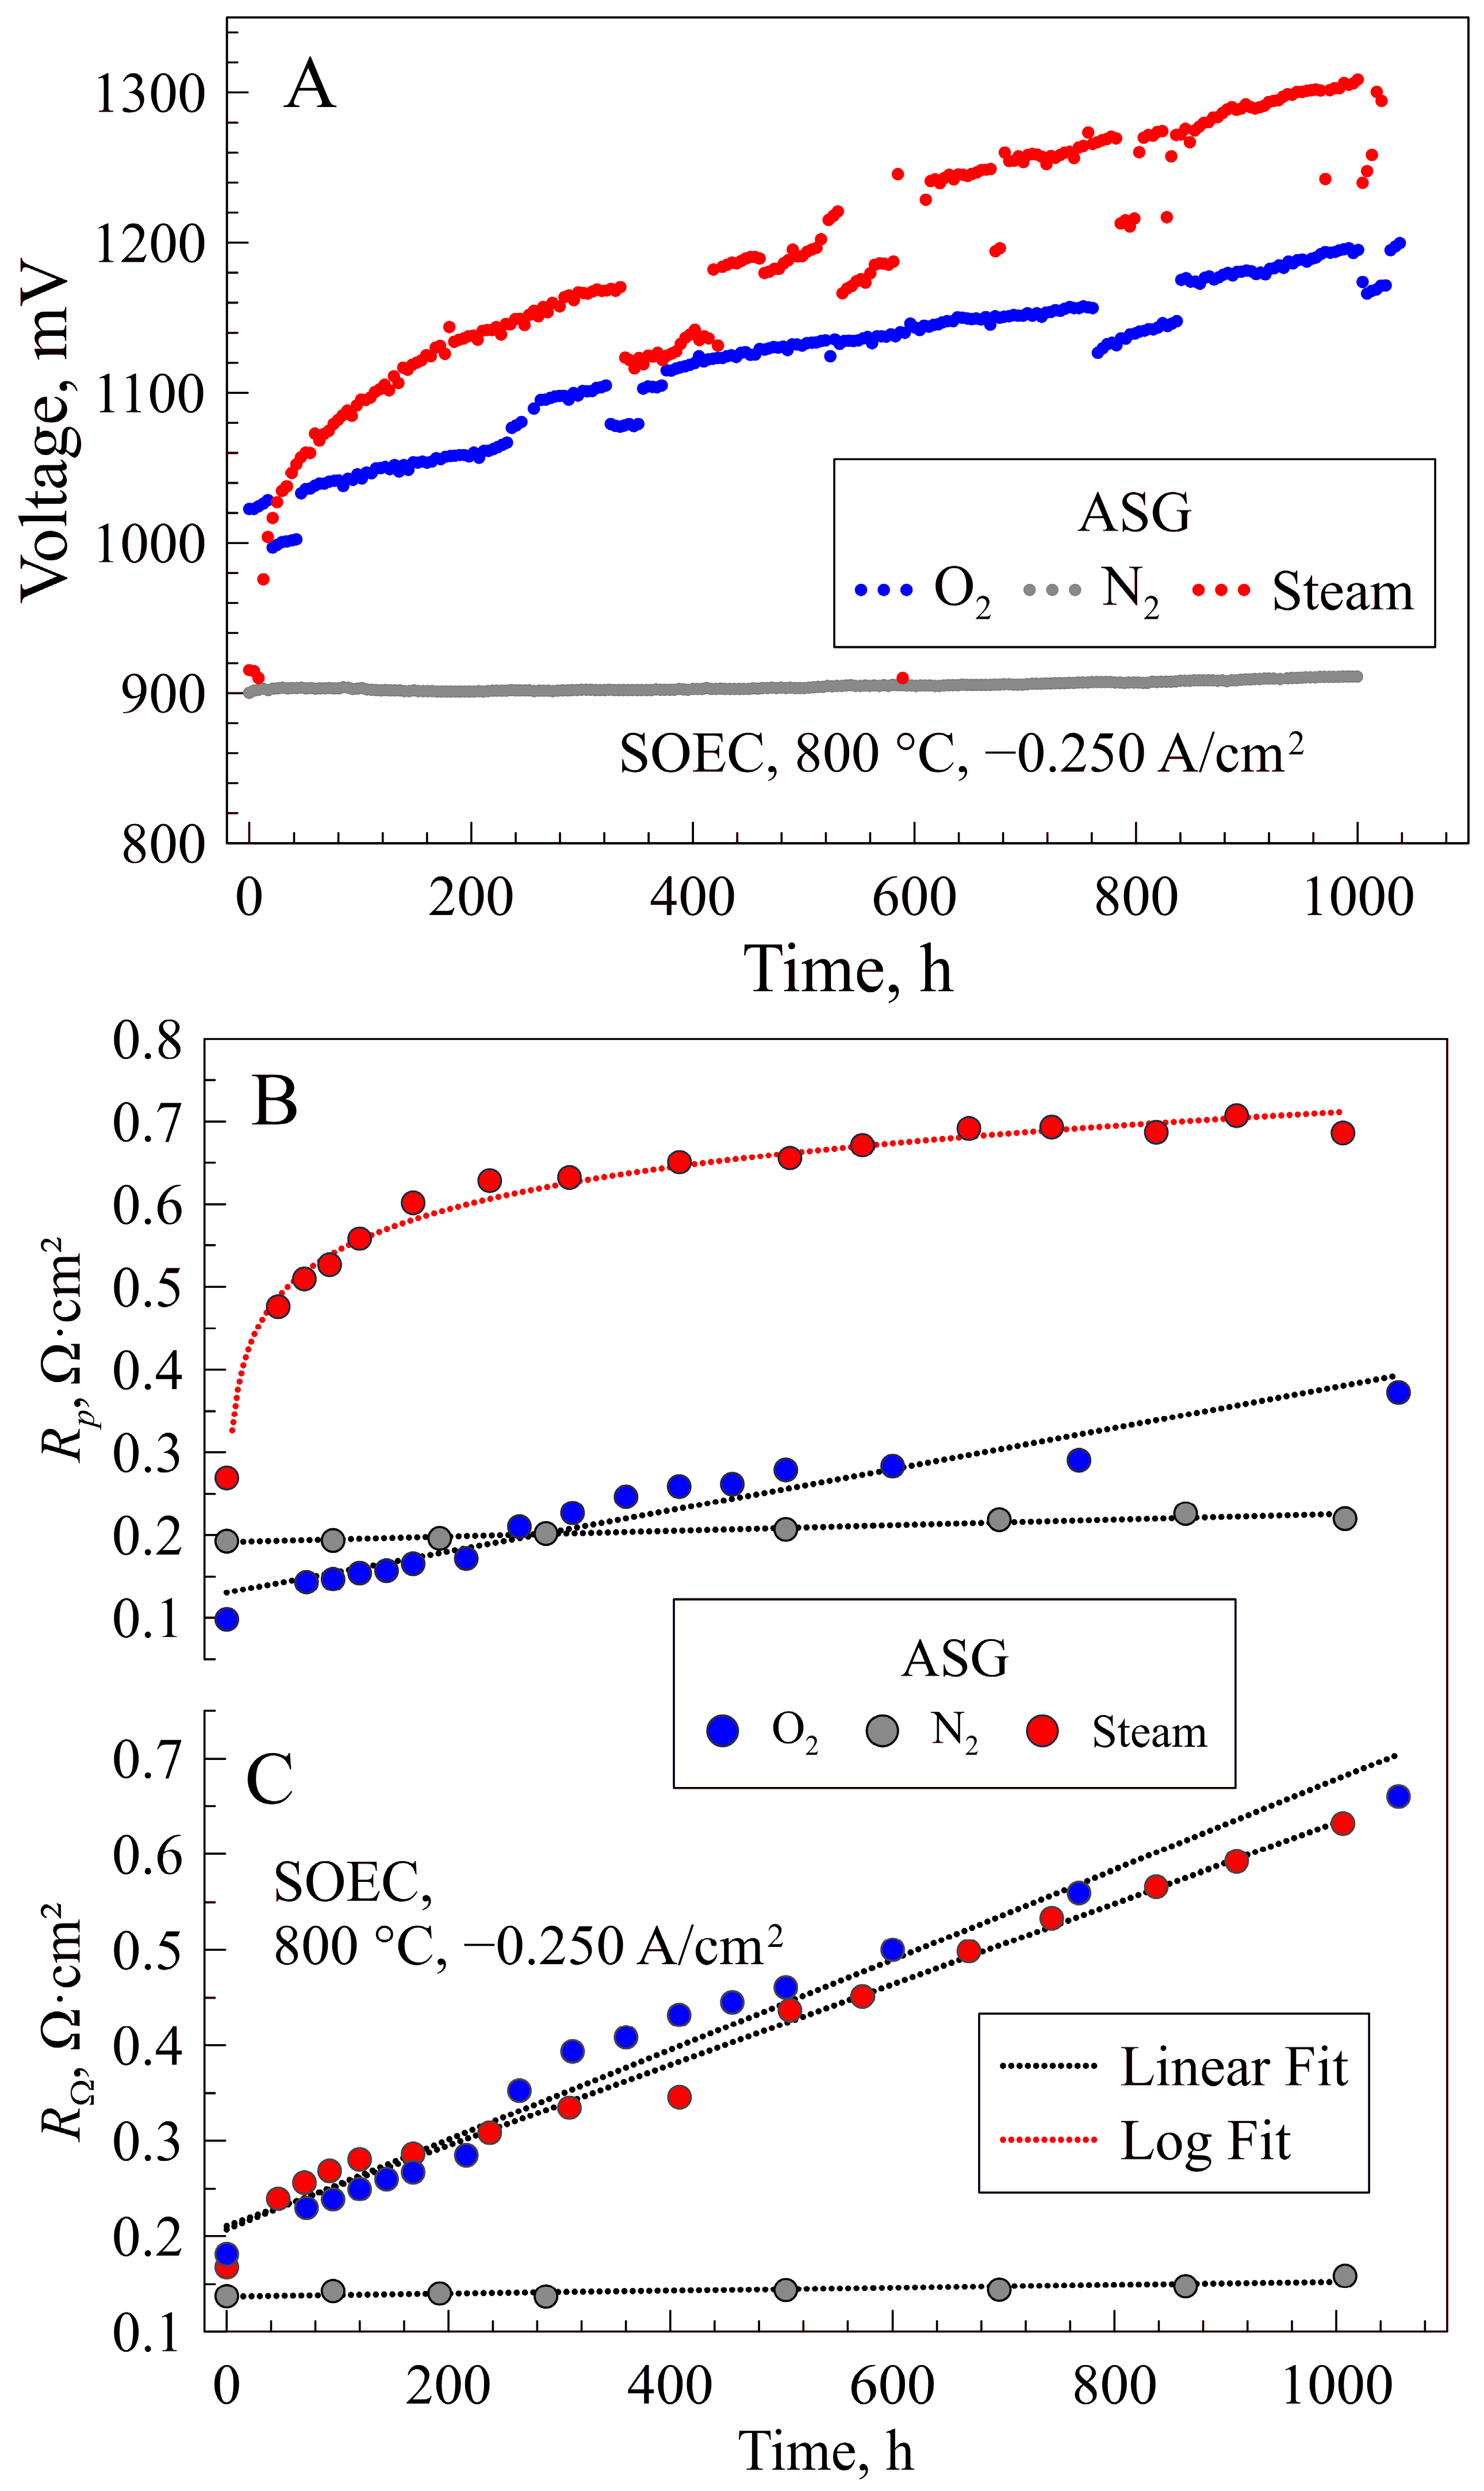
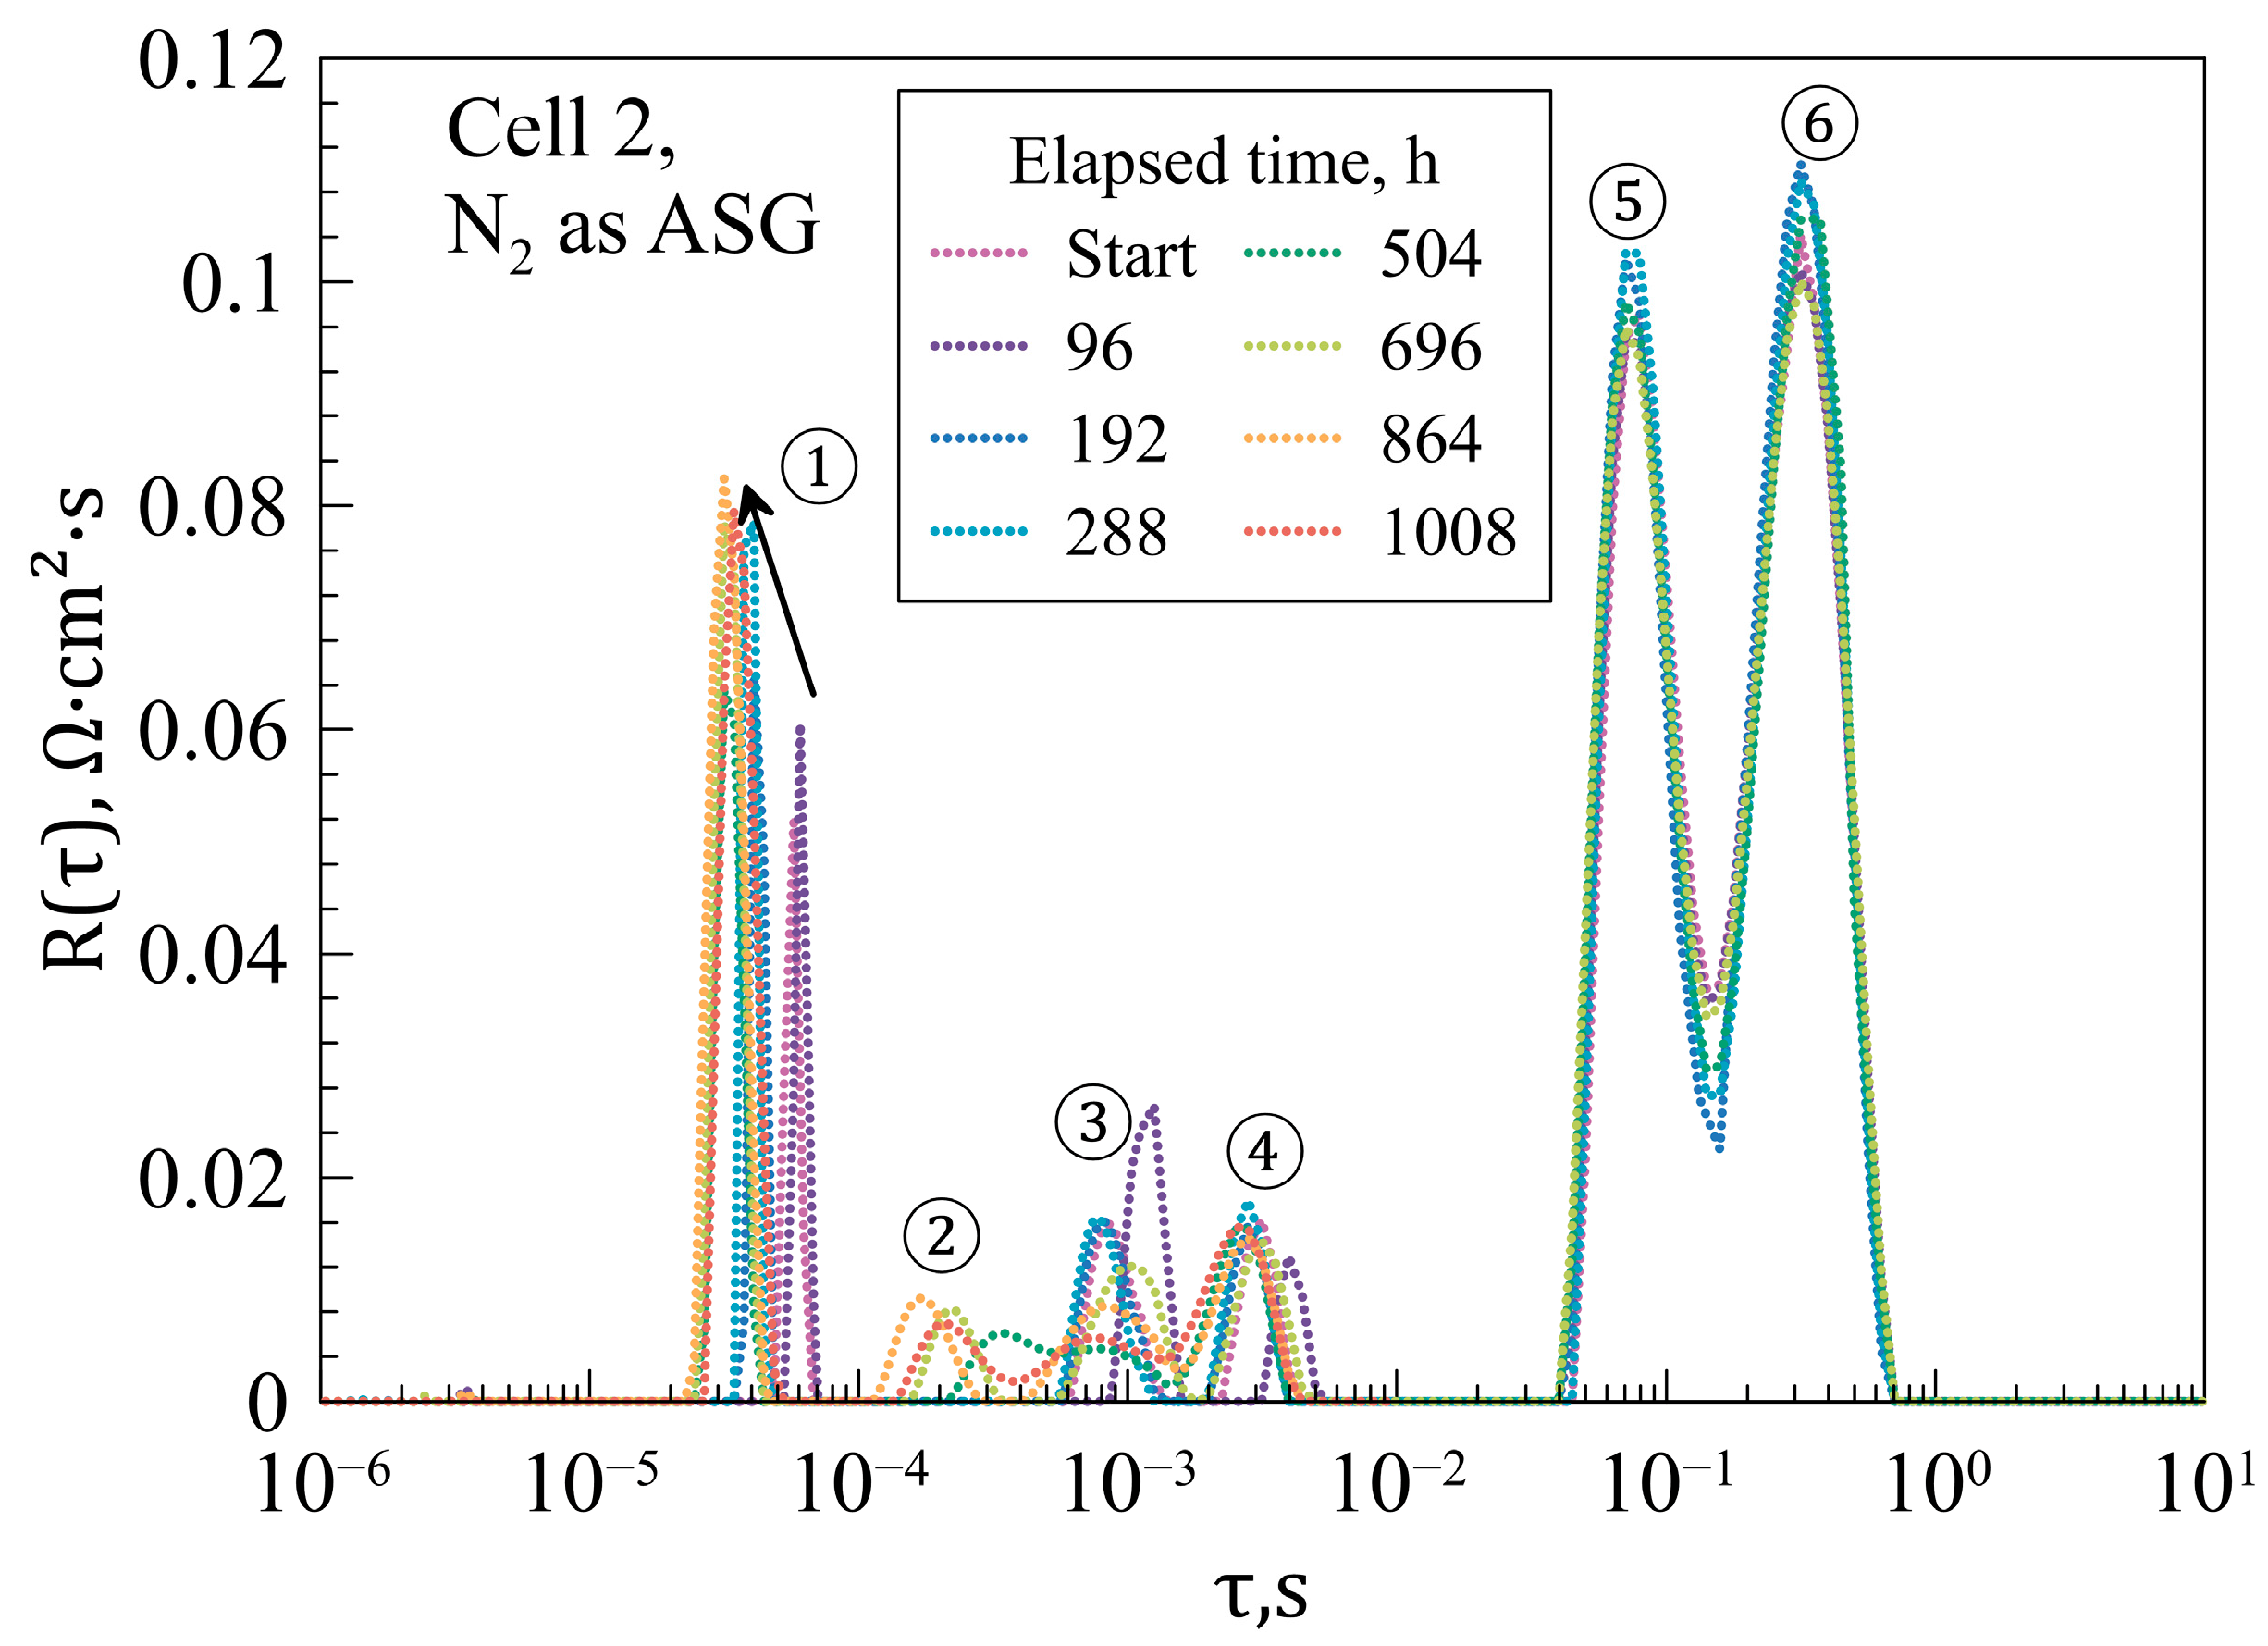
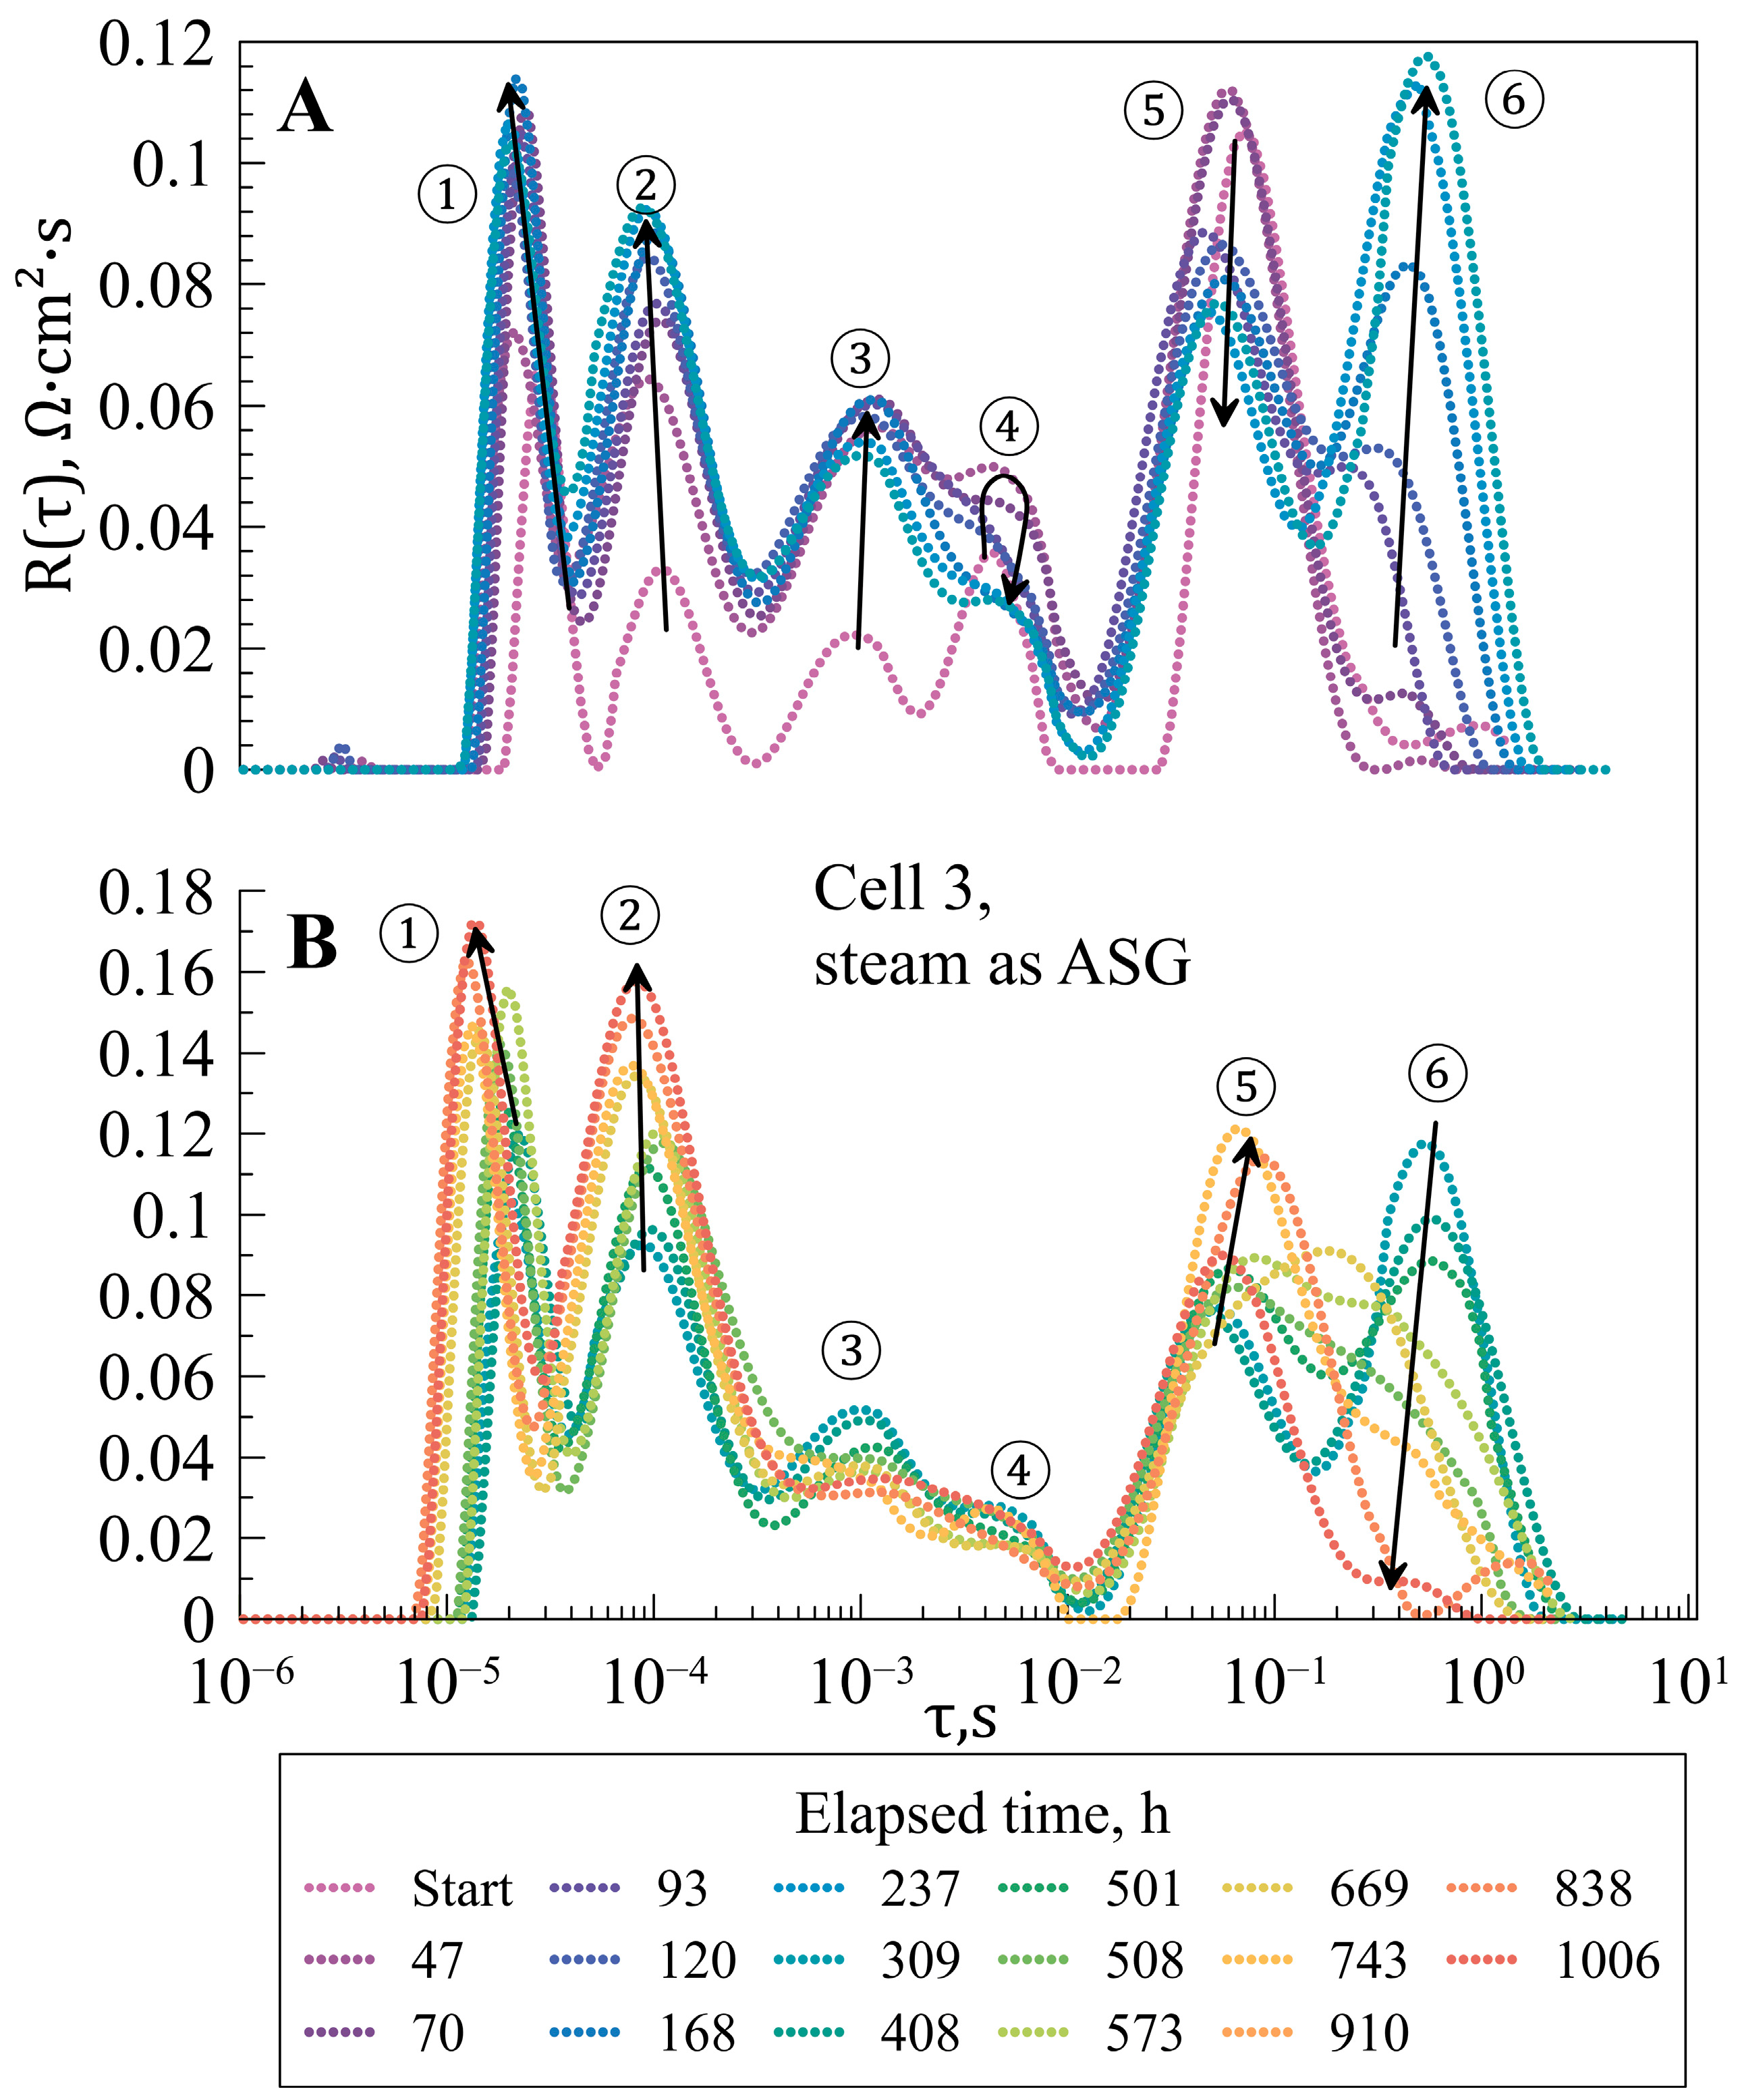
3.2. Degradation Experiments
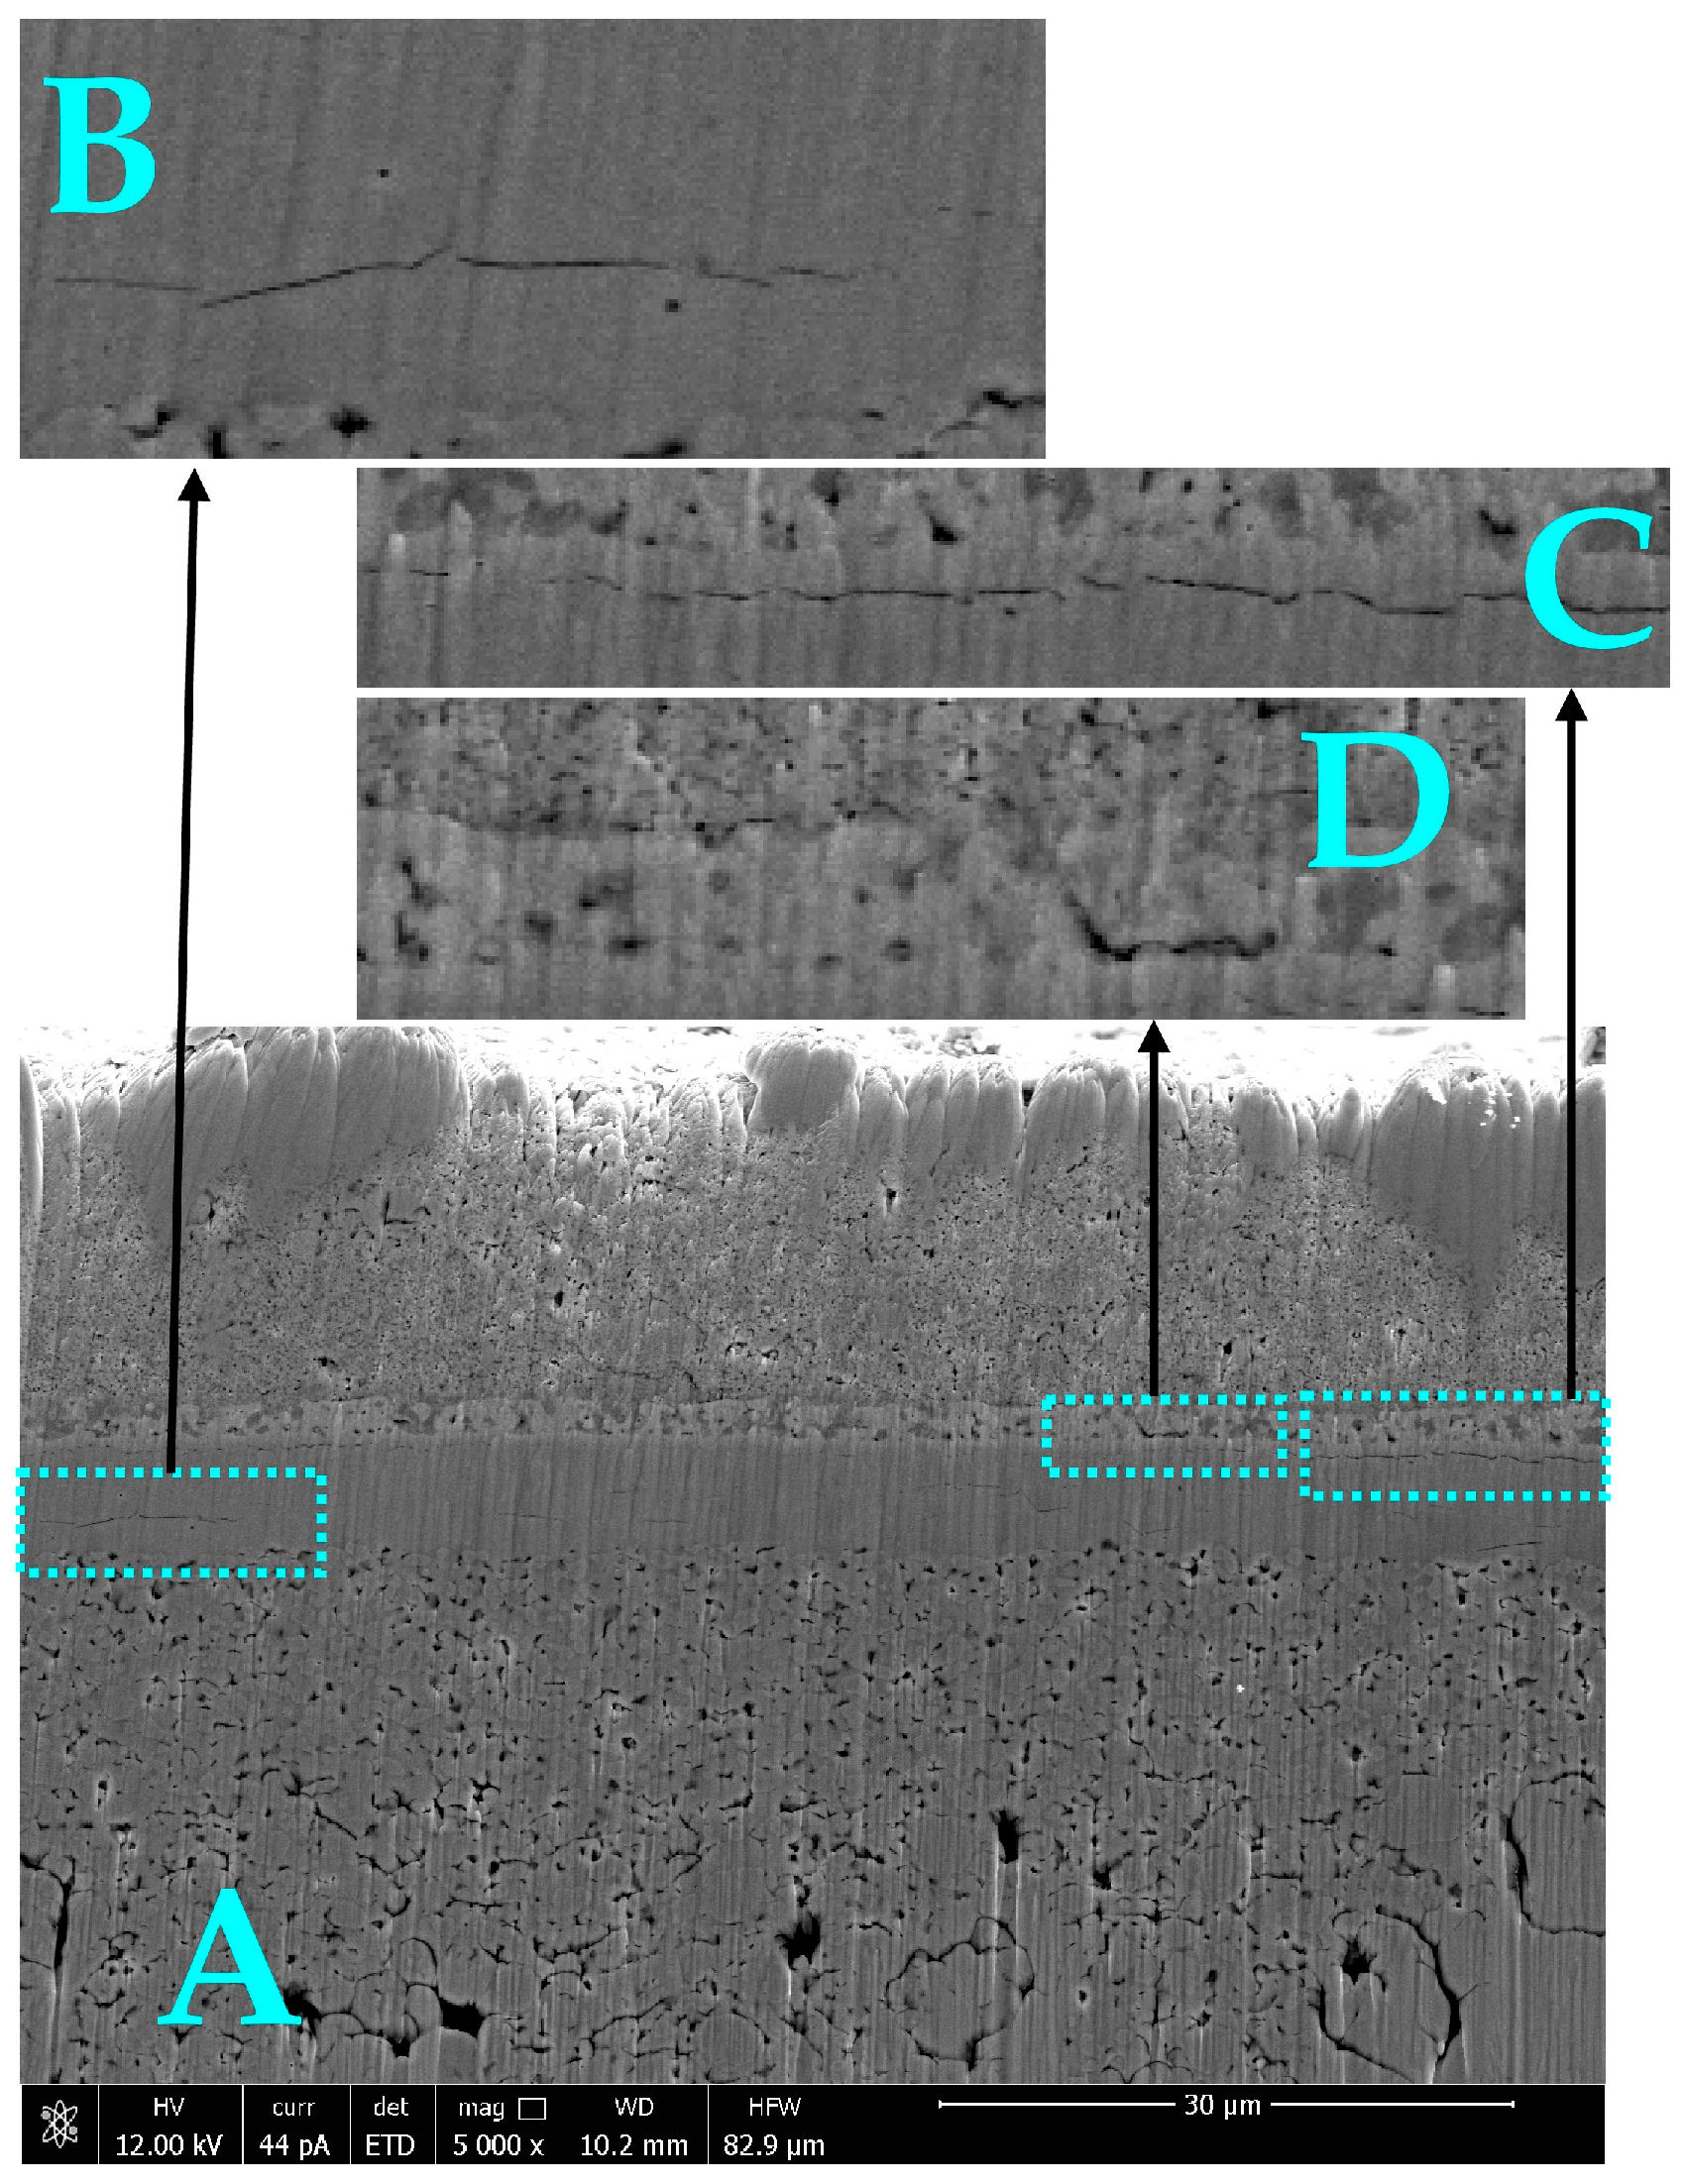
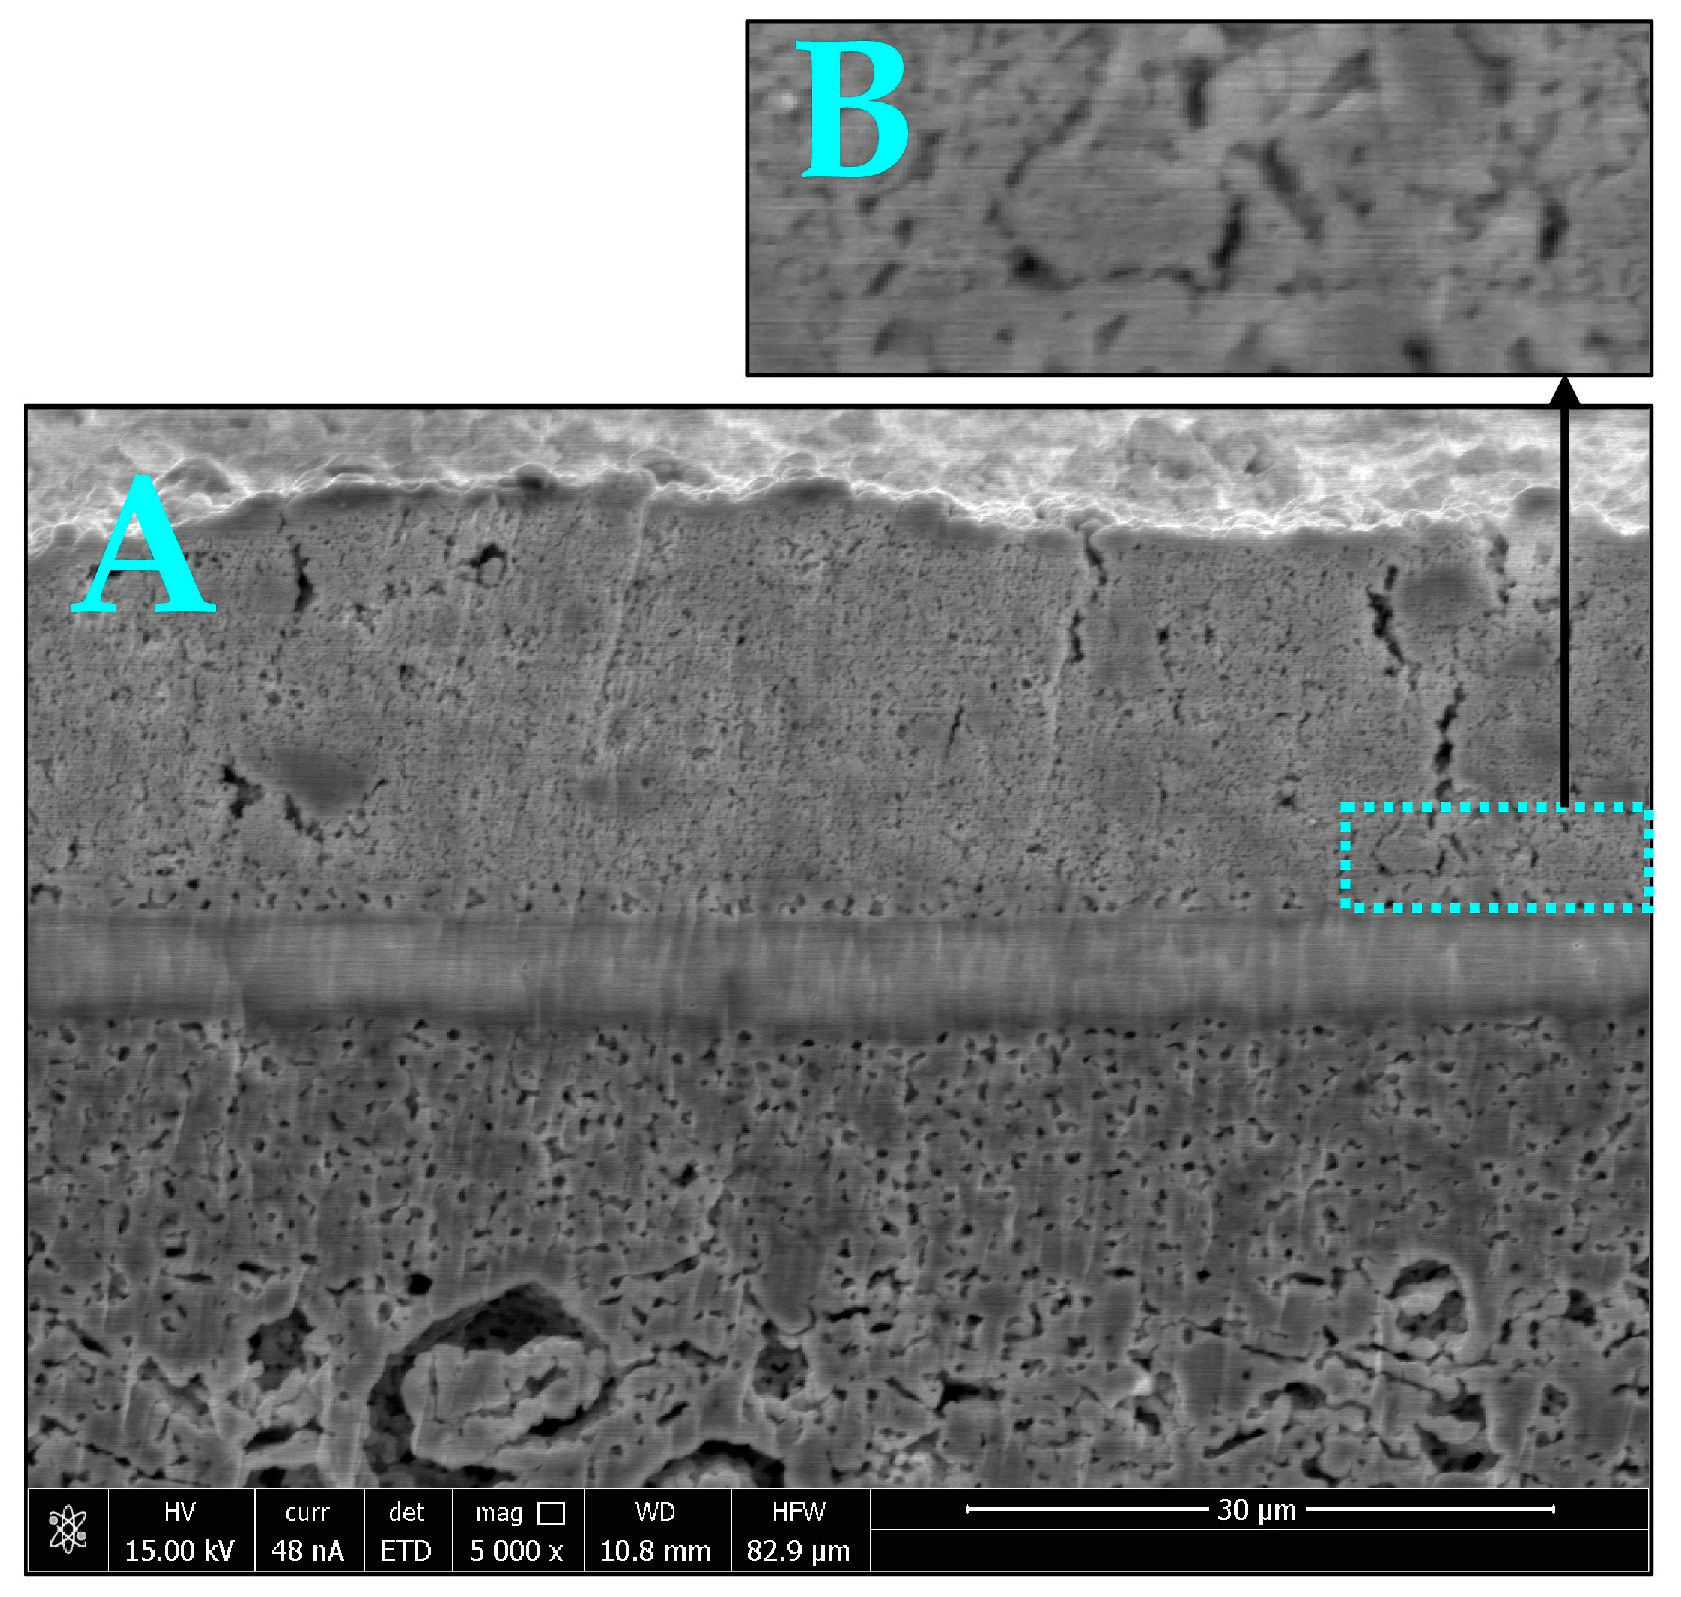
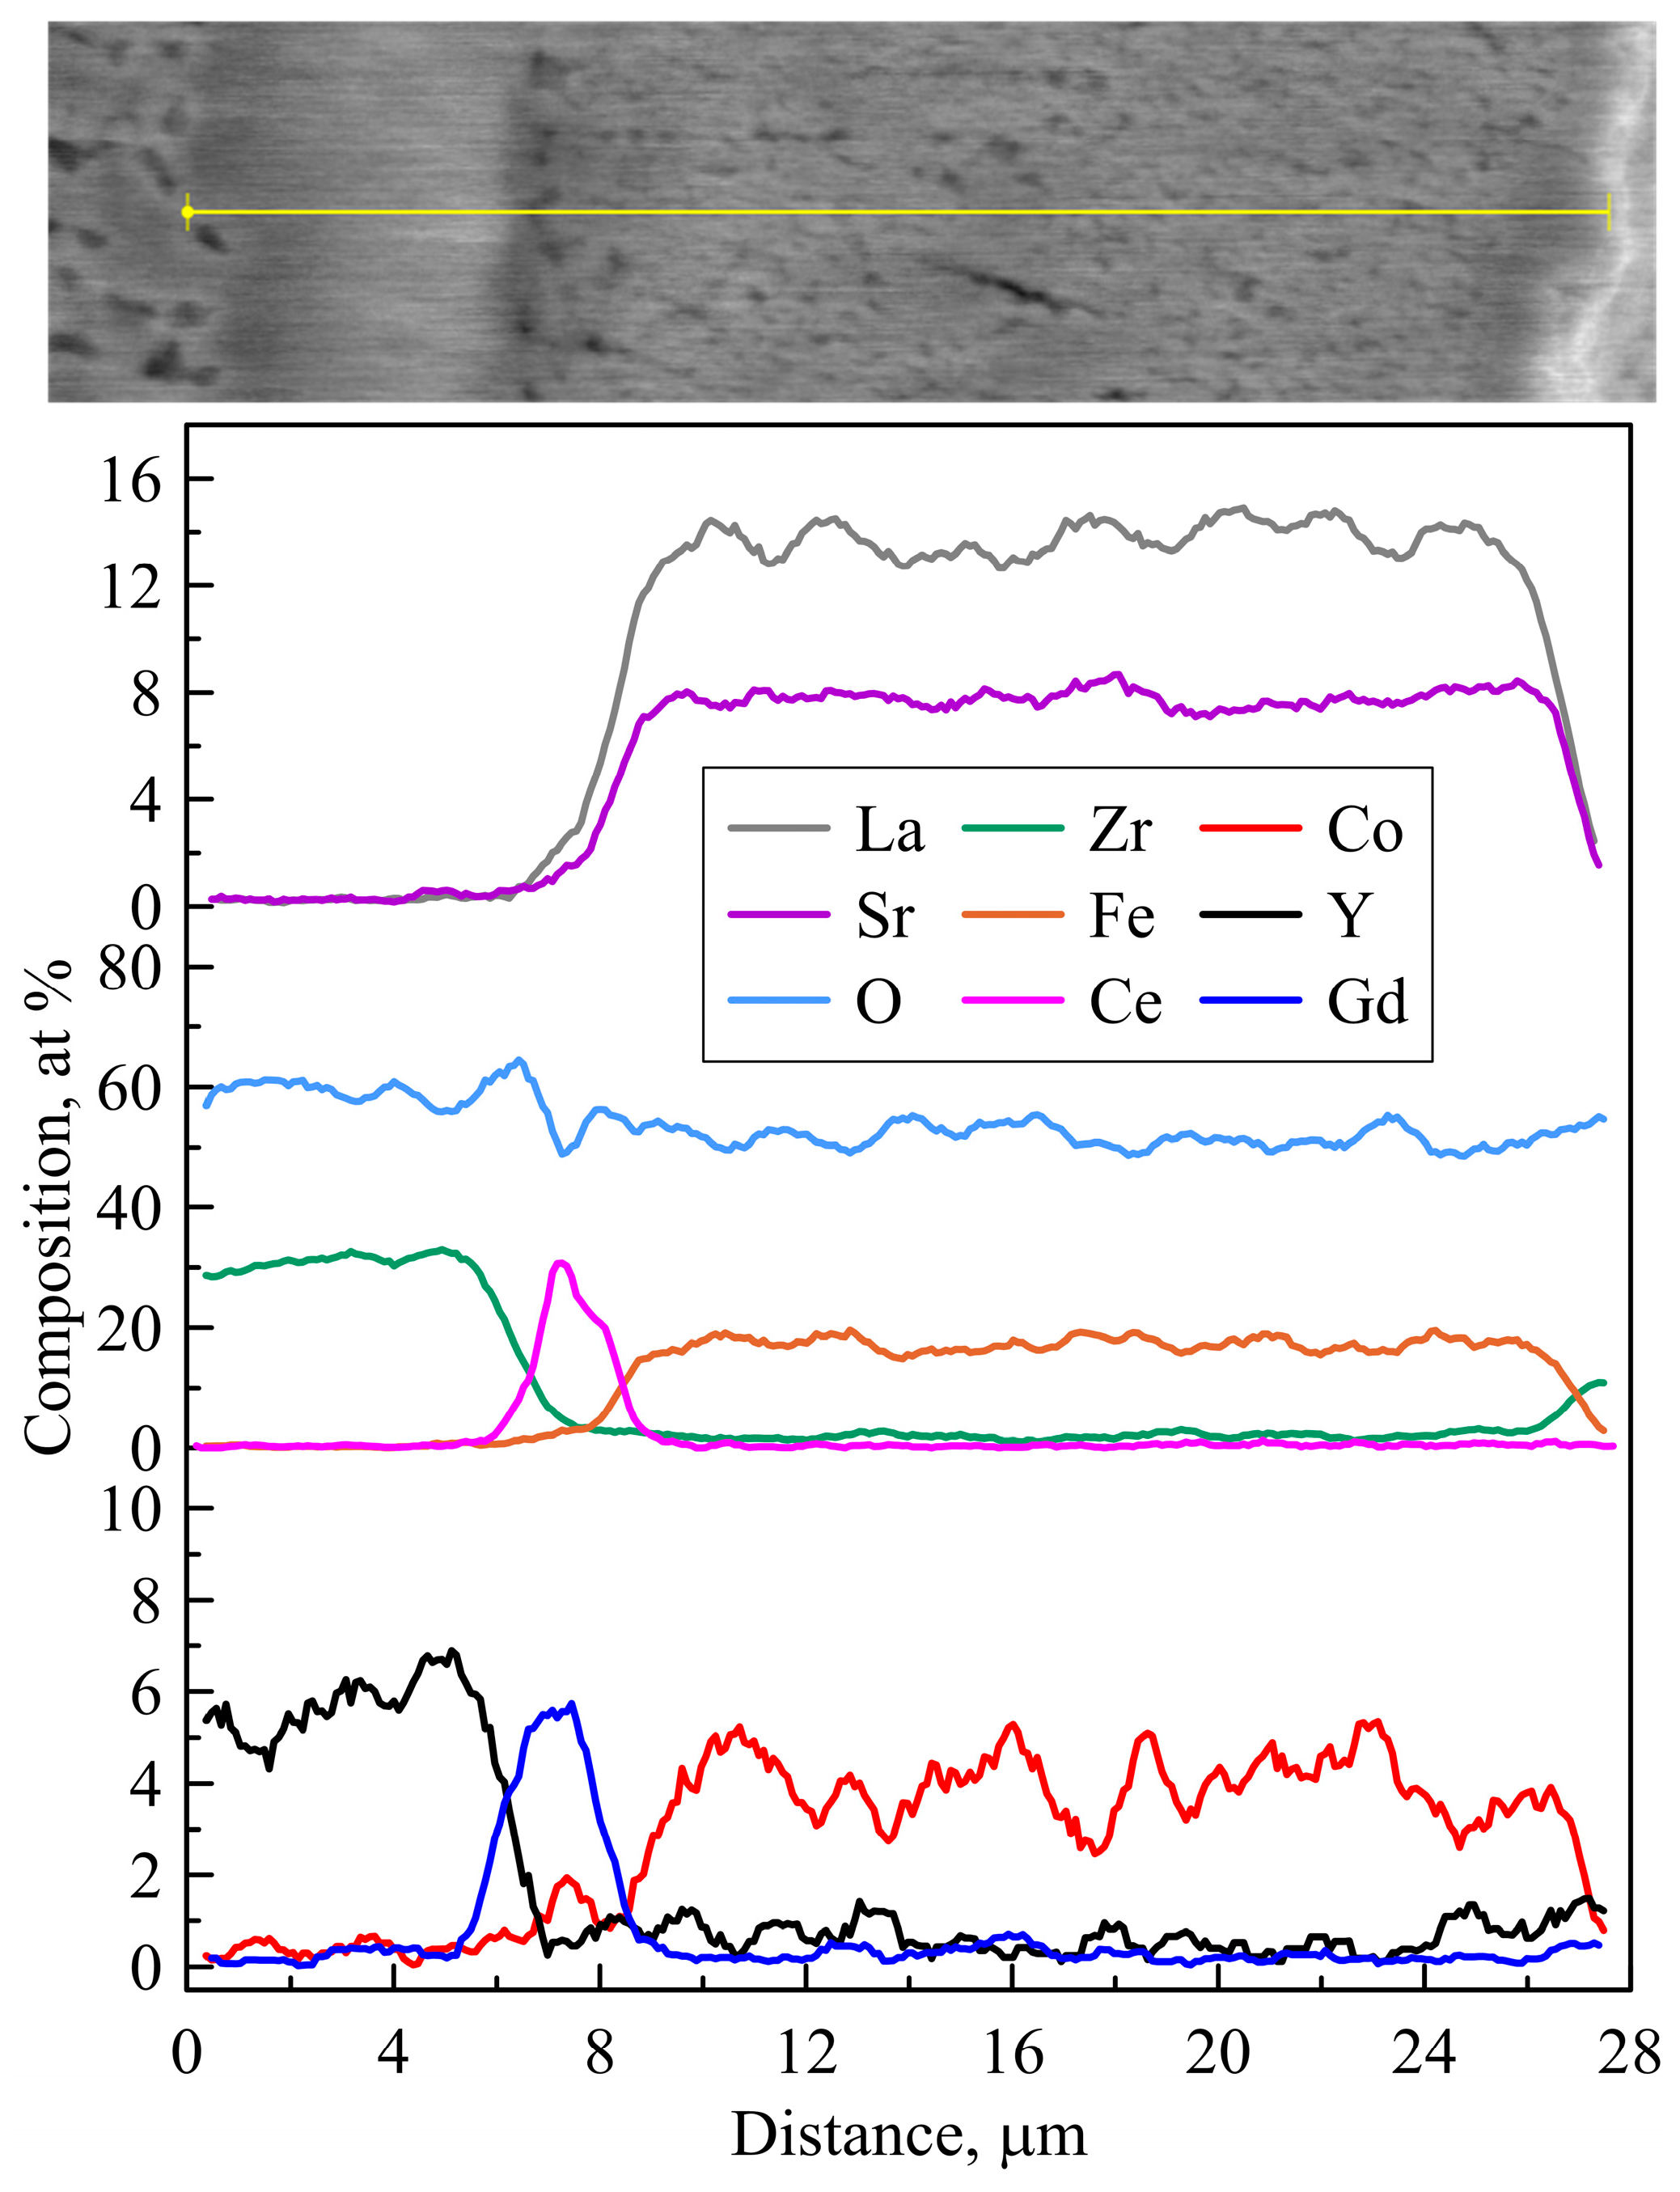
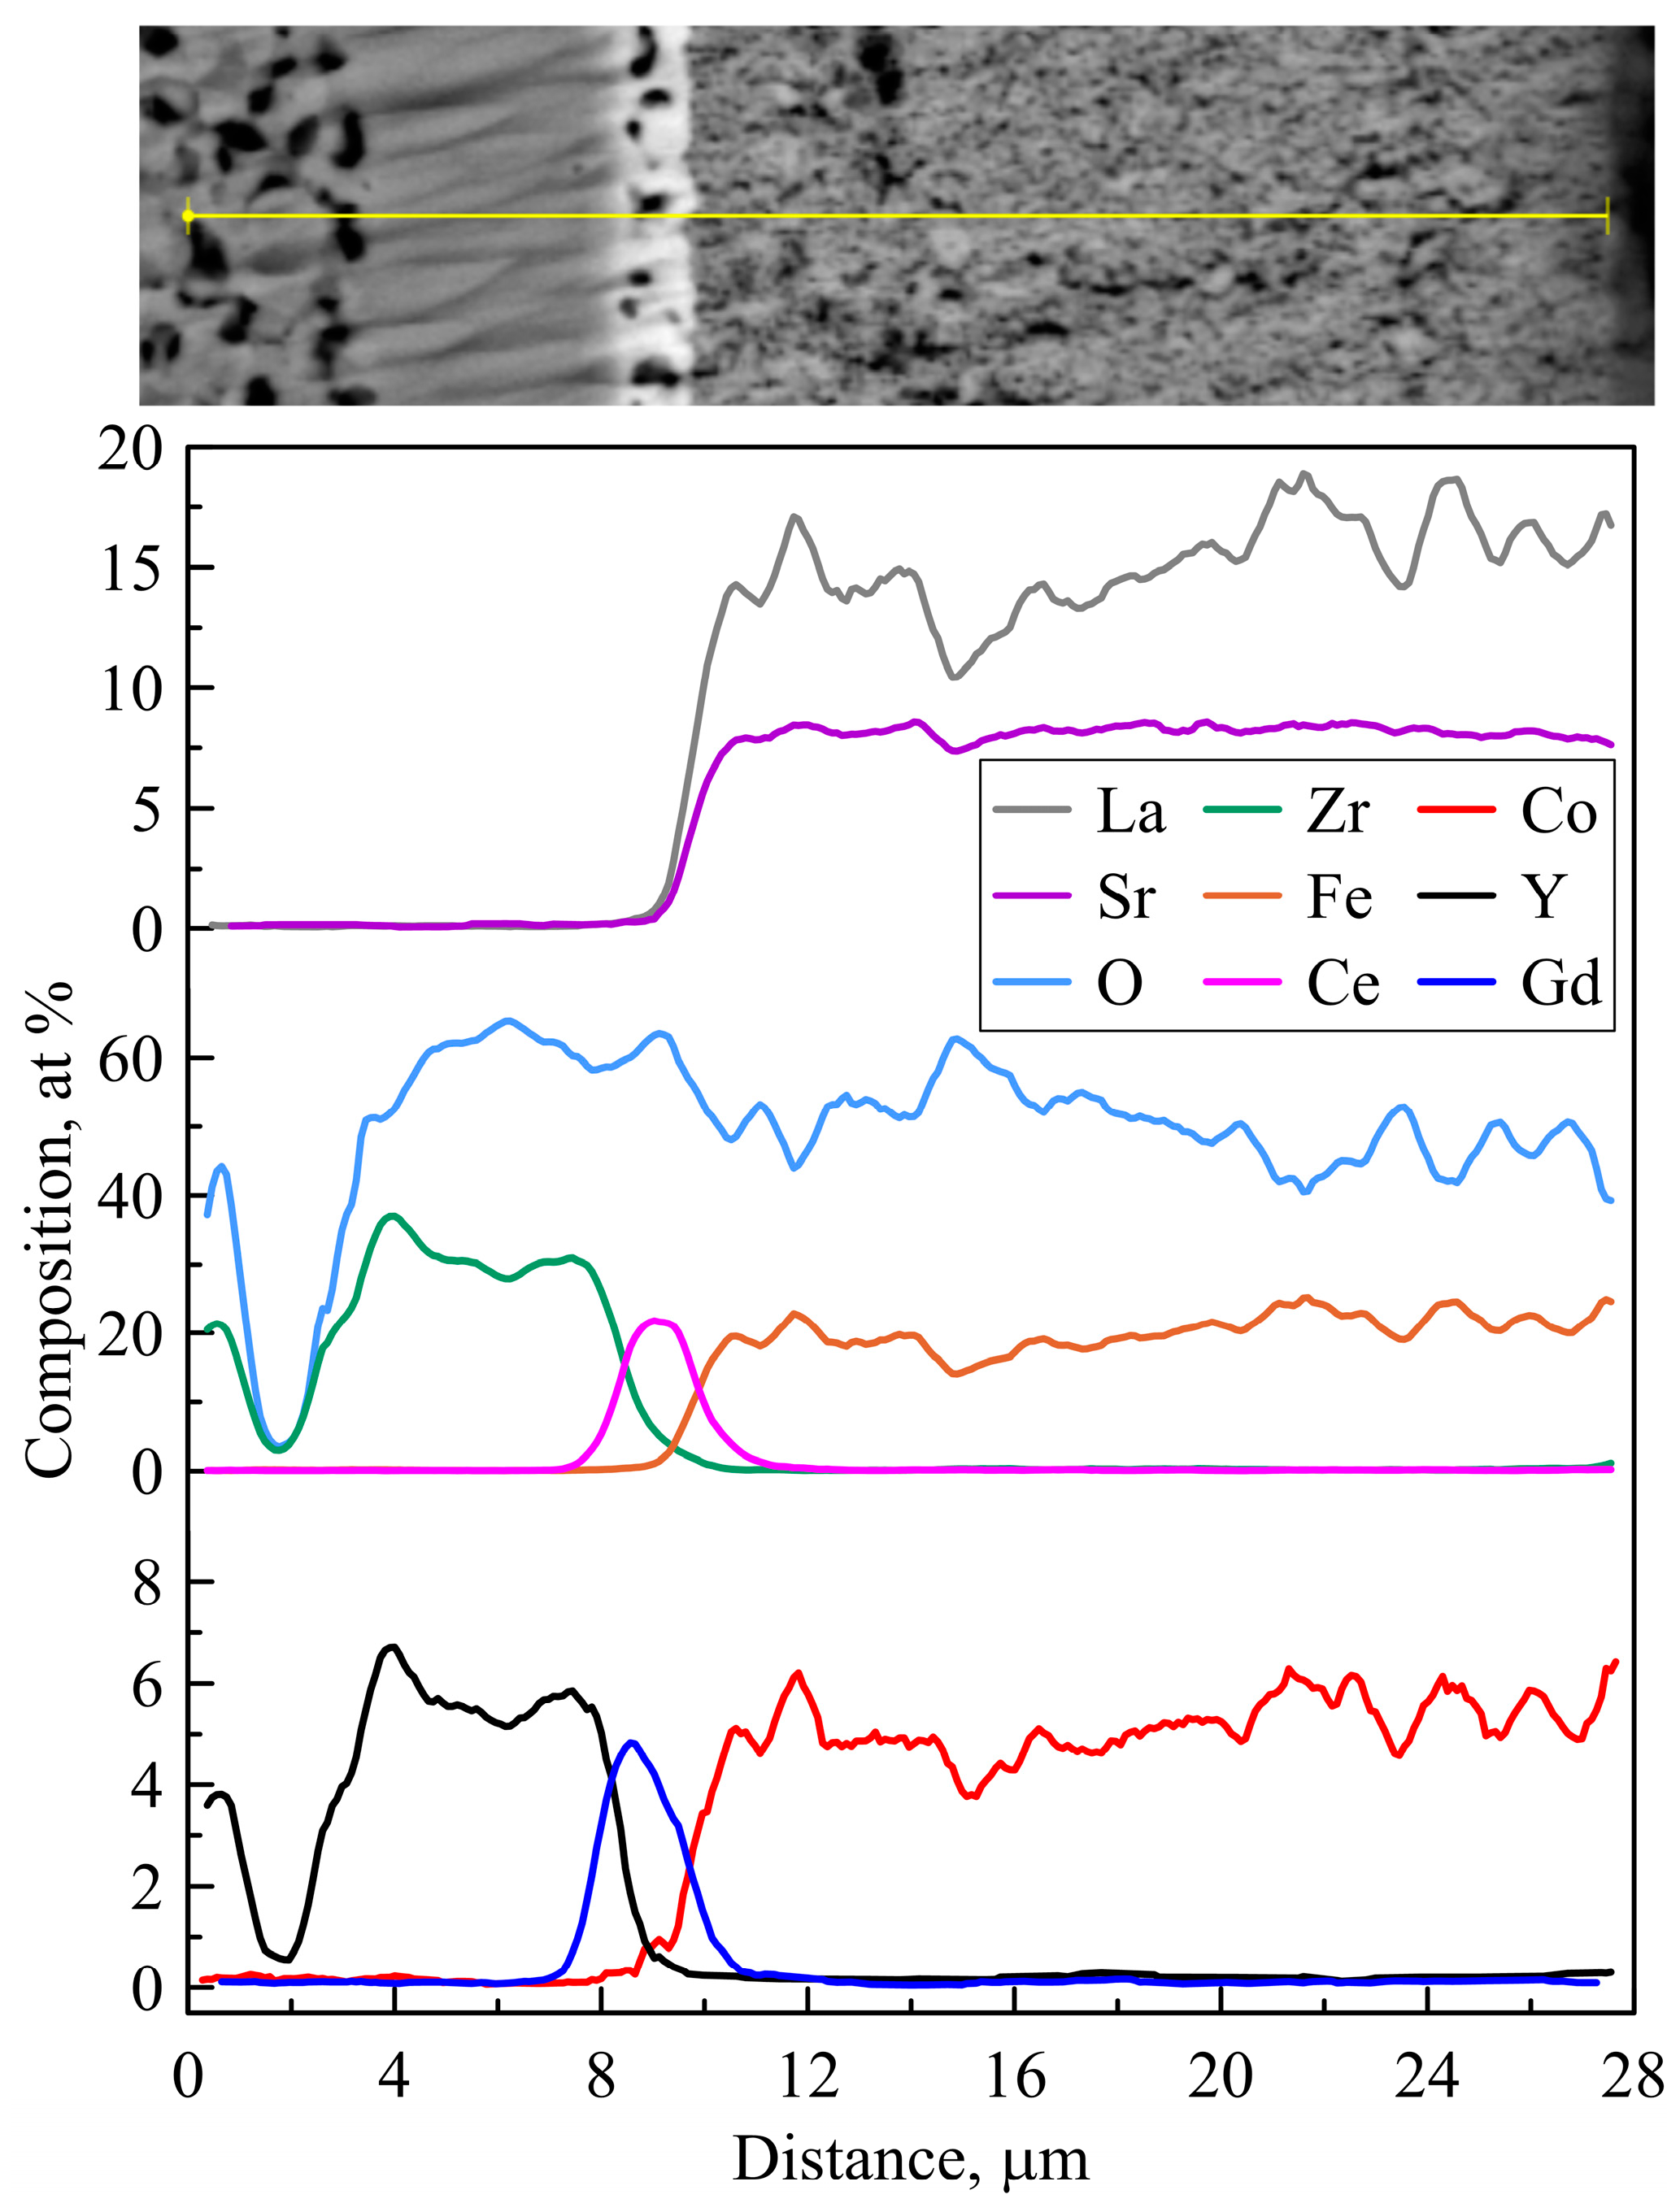
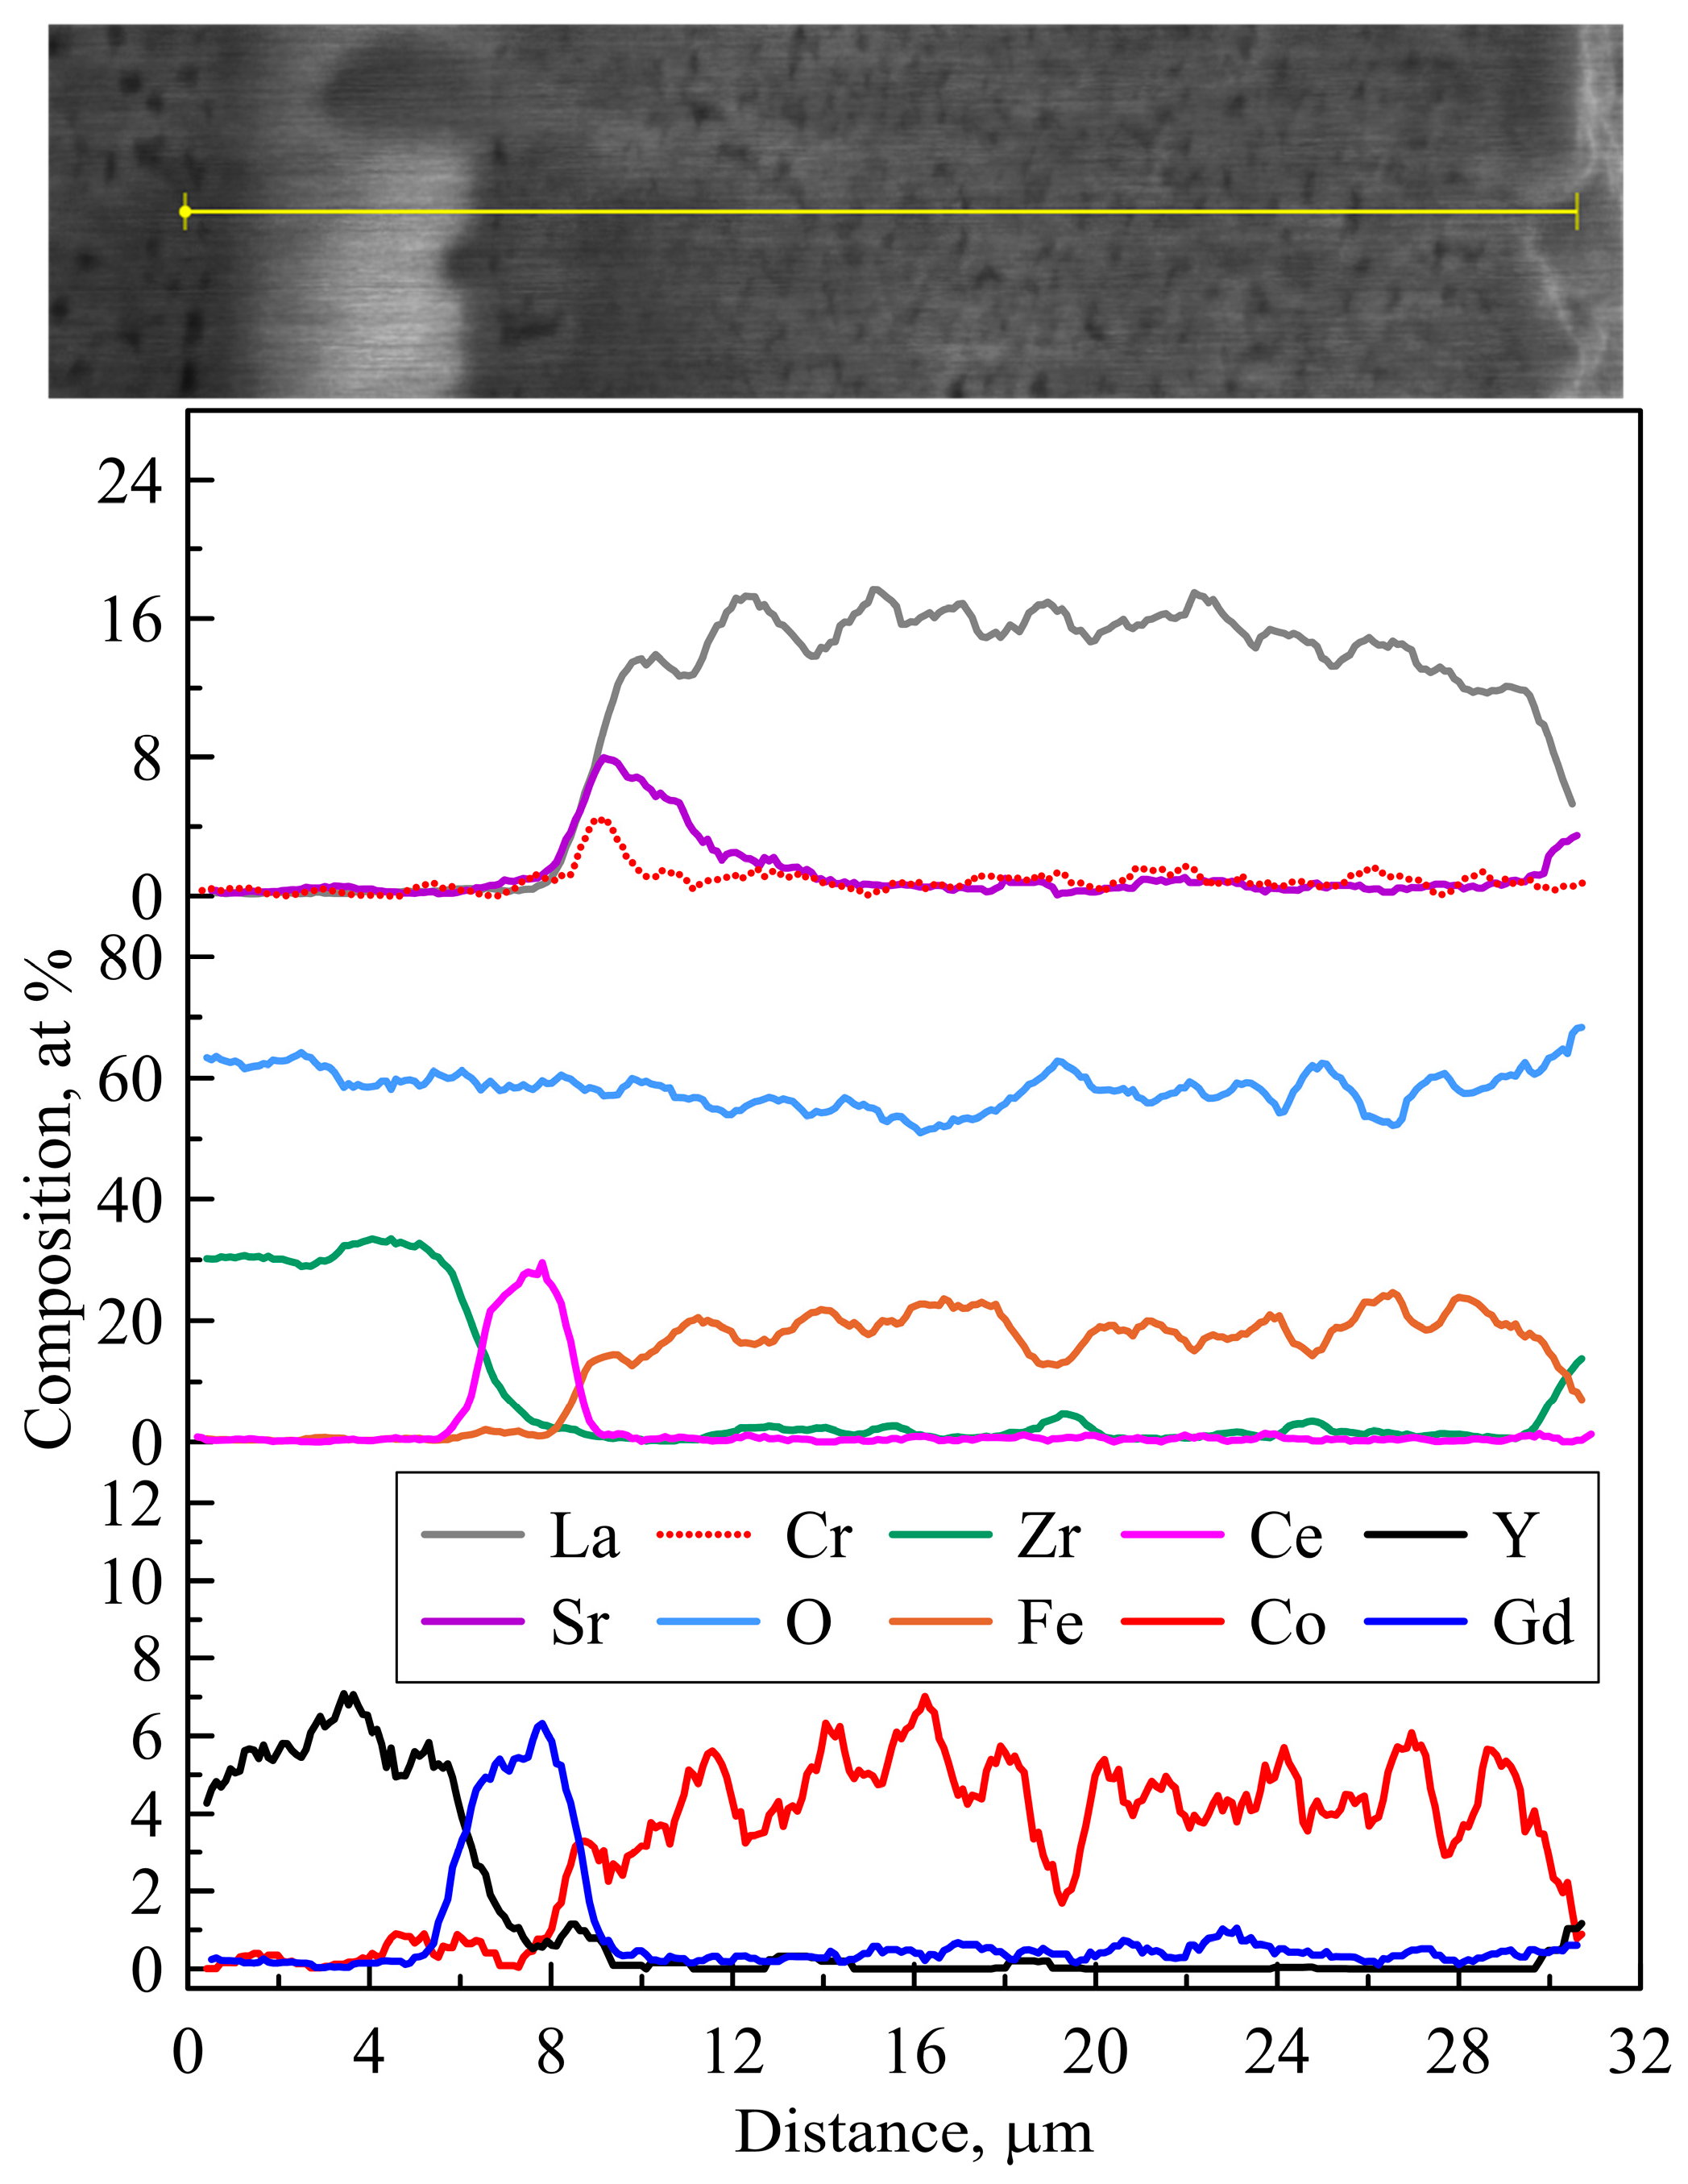
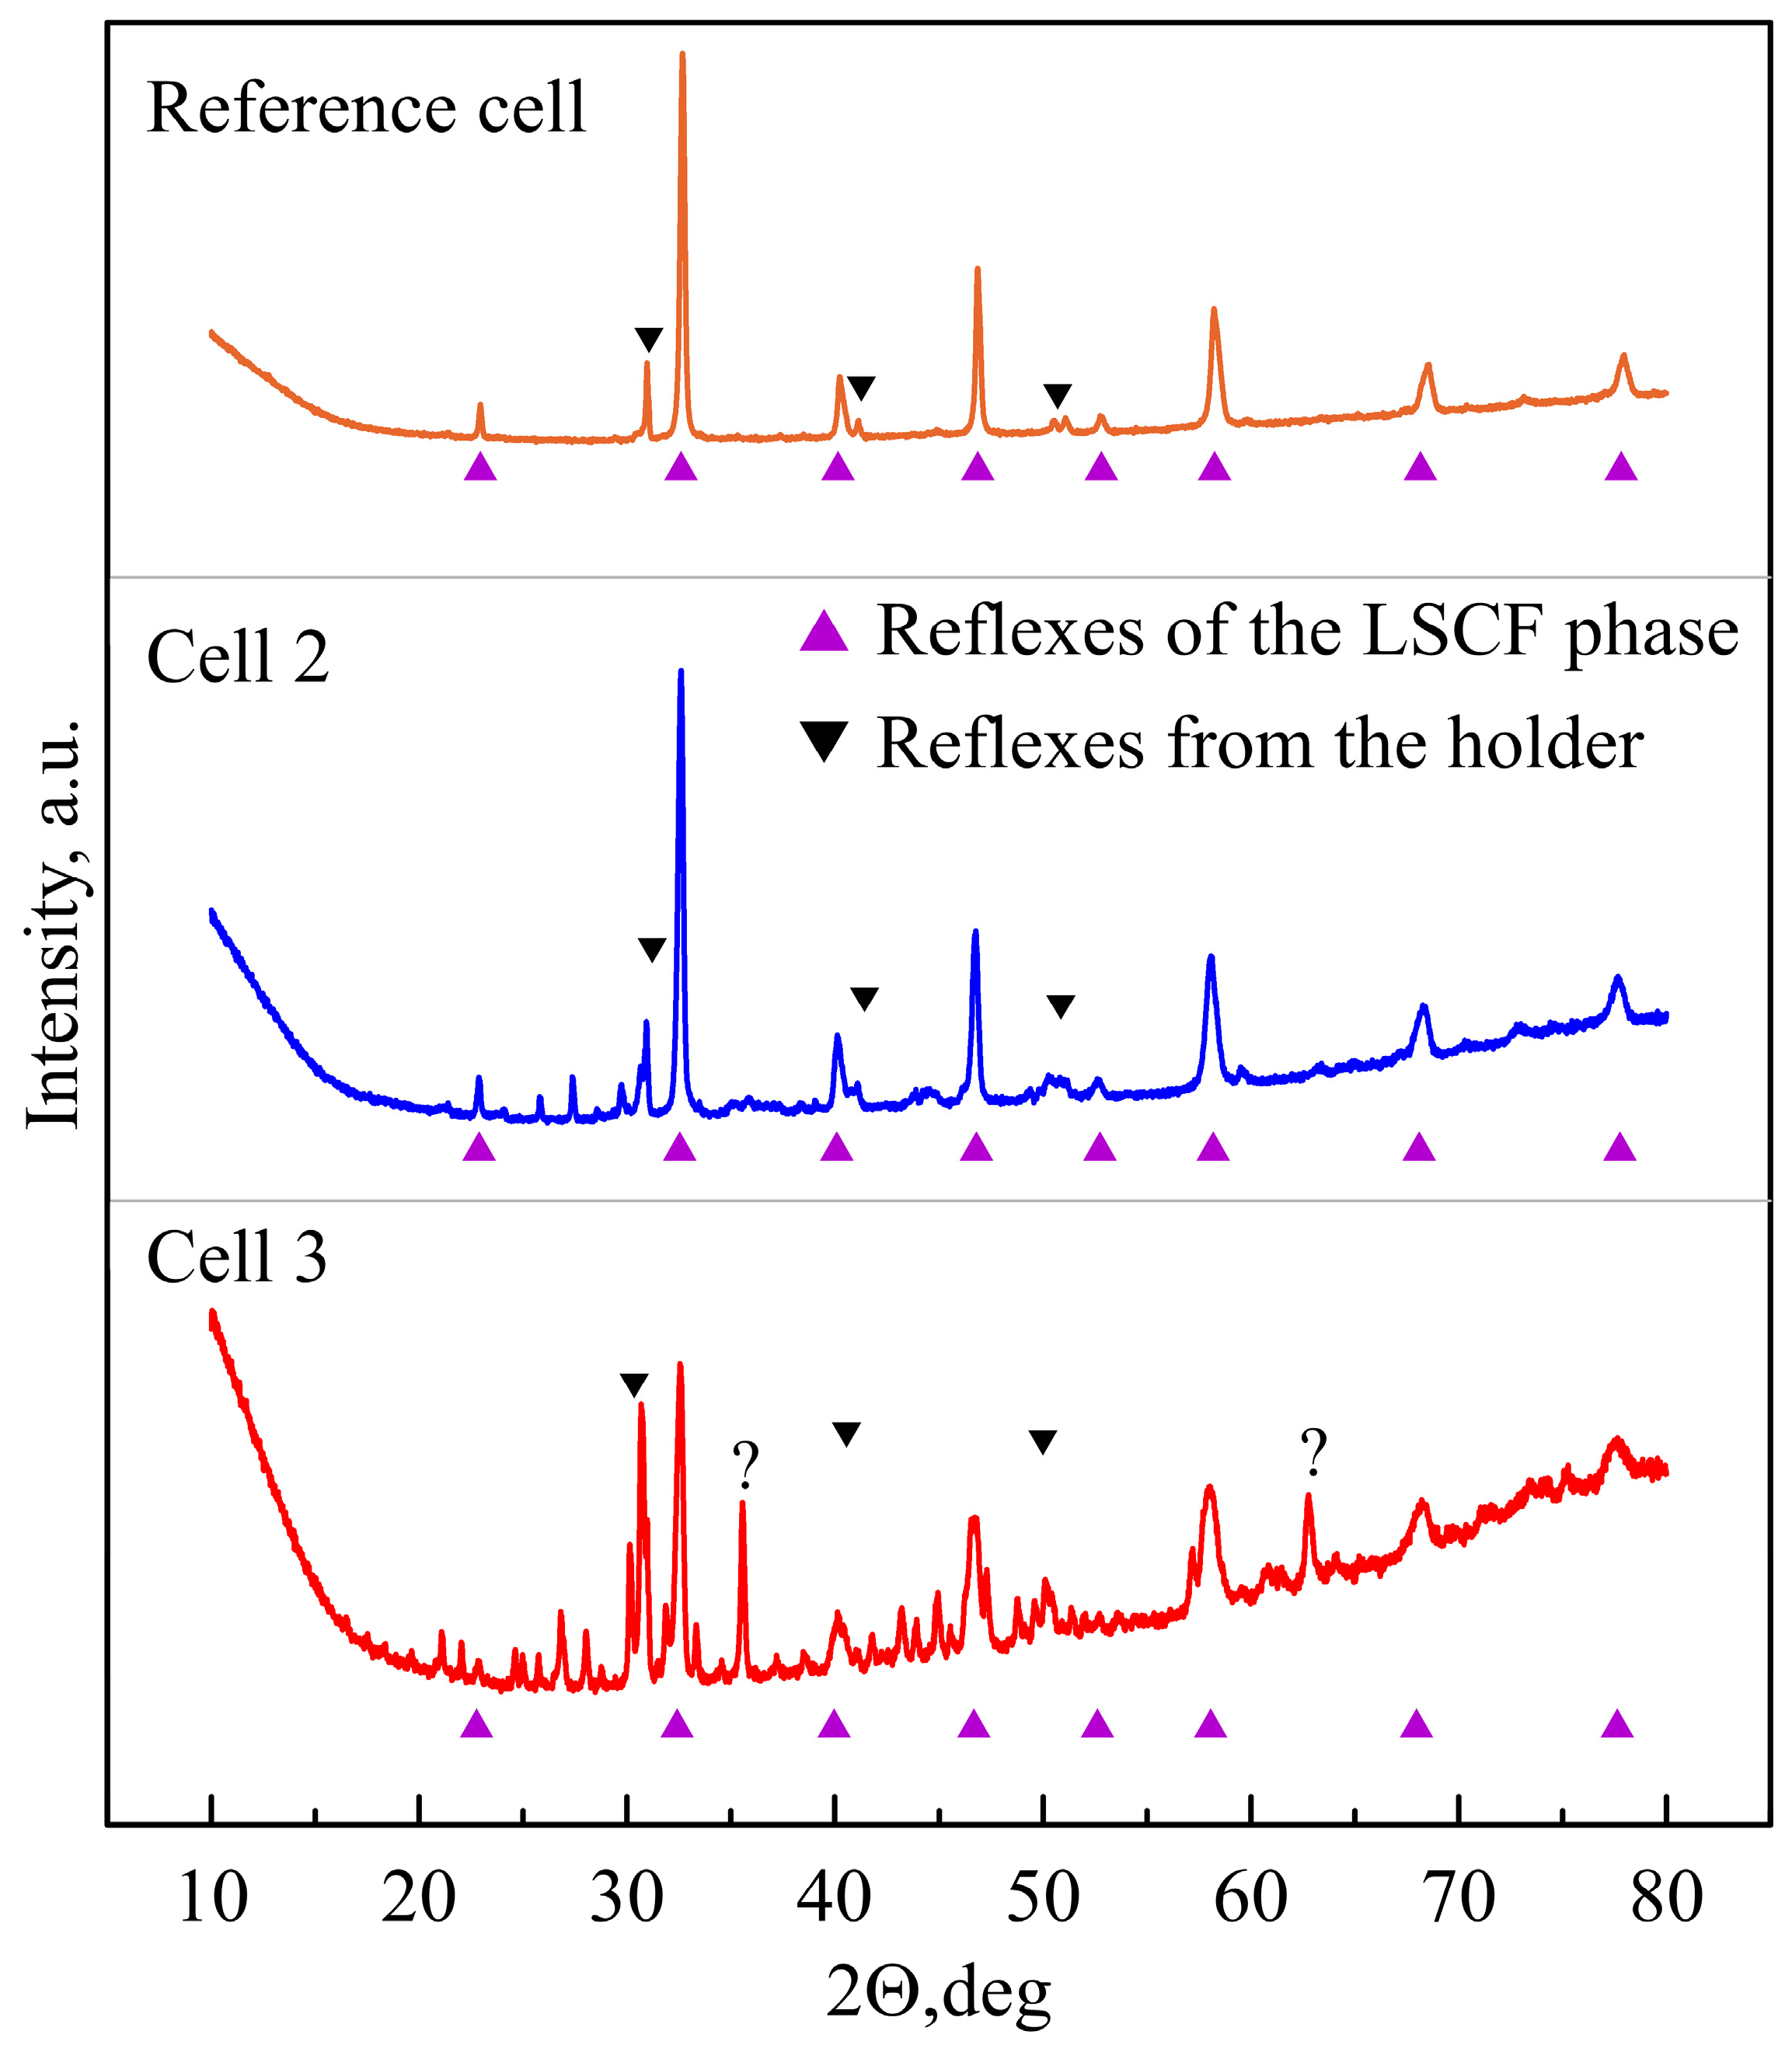
The degradation of the cells in the electrolysis mode depends on both anode and cathode stability. In the presented experiments, the conditions of electrolysis were selected to avoid known issues with Ni–YSZ cathodes, namely coarsening and oxidation of the nickel. As can be noted, the use of nitrogen as the sweep gas allows the minimization of the degradation (Figure 6), while using both steam and pure oxygen caused sufficient issues.
As one can note, the potential of the cells with O2 and steam as ASG grows under moderate current density (Figure 6A), which corresponds to parallel rise in both polarization and ohmic resistances (Figure 6B,C), calculated from the electrochemical impedance data according to Equation (1). Oxygen as ASG provoked linear-like growth of the resistances with rates of 0.25 Ω cm2/1000 h for R Ω and 0.47 Ω cm2/1000 h for R p , while for steam, R p rose in a logarithmic-like pattern, with a sharp increase of almost two folds during the first 100 h, while linear-like degradation of the R Ω had a rate of 0.42 Ω cm2/1000 h, which is similar to that observed for O2. The degradation rates of the cell with N2 as ASG were an order of magnitude lower. The degradation profile for Cell 3 is sufficiently different from Cell 1, while the behavior of Cell 2 fits the pattern of the normal operation of the electrolysis cell with an LSCF cathode. Preliminary tests of the steam-swept cells demonstrated similar behavior (See Supplementary Materials, Figure S6).
The results of the DRT analysis of the spectra confirm that the degradation processes of Cells 1, 2, and 3 differ sufficiently (Figure 7, Figure 8 and Figure 9).
All the SOEC spectra demonstrated three groups of peaks: (1) at τ 10 μs, triad (2)–(4) at τ = 0.1–10 ms, and one or two peaks (5) and (6) at τ > 0.05 s. When oxygen was used as the sweep gas, peaks (1)–(4) grew with time, and the ohmic resistance also developed systematically (Figure 6B,C and Figure 7). Such behavior may be considered as evidence for the delamination of the anode, which also does not contradict the decrease of peak (5), attributed to diffusion transport in the porosity of the electrodes [22]. Nitrogen as an ASG did not provoke sufficient degradation, with the exception of growth of the peak (1) and redistribution of the intensity in the triad (Figure 8). The ohmic resistance was also stable (Figure 9), which can be interpreted as negligible delamination and minor degradation of the electrochemical activity. Results obtained for steam differed drastically. The evolution of the cell might be a nominal split in two stages: fast degradation during the first c.a. 300 h, followed by a less prominent decrease in the electrochemical activity (Figure 6A,B). The ohmic resistance, however, behaved in the same manner as in the case of Cell 1 (Figure 6C). The evolution of the DRT of Cell 3 demonstrated very complicated behavior and was split between two time periods for the representation: first 300 h (Figure 9A), which approximately corresponds to the intense growth of the polarization and polarization resistance (Figure 9A,B). In this time period, prominent growth of the peaks (1), (2), (3), and (6) was observed, while peak (5) decreased. Peak (4) demonstrated growth for the first ca. 100 h and then slow decay. For the rest of the observation (Figure 9B), peaks (1), (2), and (5) grew, while peak (6) almost disappeared. These changes can be interpreted as a result of the substantial transformation of the anode exposed to the steam flow. It is important to note that peak (6) is likely related to the ASG with low p(O2) and might be related to oxygen diffusion of the LSCF, which should be suppressed by excessive concentration of the oxygen vacancies [26,27]. At 800 °C, oxygen non-stoichiometry is minimalistic in air and likely negligible in O2. However, in N2 or H2O, where the expected oxygen partial pressure may be as low as (3…5) × 10−6 atm, the concentration of oxygen vacancies may approach 0.2 per formula unit [28], with a corresponding decrease in oxygen migration. In the case of N2 as the ASG, peak 6 remained stable during the test after swift stabilization. Steam decomposition of the perovskite structure (which will be discussed later in the analysis of post-mortem data) led to hindered development of this effect. Until ca. 300 h of operation, it partially substituted (5). Further degradation of the anode layer interrupted oxygen ionic transportation as an extension of the anodic process, and peak (6) began to fade, while effect (5), which is presumably related to gas diffusion, started to play a more important role again.
The performed long-term experiments under constant current demonstrated that different anodic sweep gases caused clearly different degradation of the electrochemical performance: for O2 and N2, it was linear-like and later, it was very modest, but for steam, the observed degradation profiles were complicated.

3.3. Post-Mortem

After measurements, the cells were extracted from the housing and prepared for SEM analysis using an ion polishing device to avoid corruption of the microstructure. Cell 3 demonstrated minor tangential cracks in the YSZ, YSZ–GDC, and GDC–LSCF interfaces, which can be seen in Figure 10.
Such effects were not typical for Cells 1 and 2; however, some crack-like defects were observed for the former (Figure 11). Tangential cracks, or delamination, are responsible for developing both ohmic and polarization resistance because they effectively decrease the active surface of the cell. Originating from excessive pressure of the oxygen [29], delamination did not demonstrate a tendency to fade in the galvanostatic mode, which explains the steady, almost linear rise in the ohmic resistance of Cells 1 and 3 and the polarization resistance of Cell 1 (Figure 6). However, the behavior of the R p of Cell 3 is more complicated and can be explained as the result of the chemical interaction of the LSCF with steam, coupled with the de-mixing and segregation of Sr. While SEM-EDS analysis of Cells 1 and 2 did not reveal any sufficient deviation in chemical composition (Figure 12 and Figure 13), in the case of Cell 3, the situation seems totally different (Figure 14). Cell 3 demonstrated sufficient migration of Sr to the surface of the GDC; however, this migration did not lead to observable penetration through the protective barrier and the formation of strontium zirconate, as might be expected in the case of poorly-made cells [30,31]. The migration of the strontium led to an alteration of the chemical composition along the depth of the anode layer, which resulted in the decomposition of the perovskite structure of the LSCF with the formation of a mixture of complex oxides. This makes the phase composition of the steam-exposed LSCF complicated for analysis (Figure 15). While the XRD of the pristine LSCF electrode only has reflexes, which correspond to the structure of the rhombohedral perovskite with space group R-3c and copper support, the spectrum of the Cell 3 anode has sufficiently more lines, the most prominent of which are labeled with “?”. Nominally smaller additional peaks can be attributed to the reflexes of the (La,Sr)FeO4- or LaSr3(Fe,Co)O10-based Ruddlesden–Popper phases [32,33,34]; however, the intensity of the labeled peaks is much higher than can be expected from an undistorted structure. Reflexes labeled with “?” are compatible with the spinel structure of Co2FeO4 or CoFe2O4 [35], the first of which is known as a product of the Cr poisoning of the LSCF [36]. Proper deciphering of the phase composition looks problematic due to a lack of well-formed structures and the non-uniform distribution of the cations in the products of the LSCF–steam interaction. The Sr-enriched layer also traps chromium compounds (Figure 14), and the source of the volatile chromia can be found in the steel elements of the housing, which are produced from chromium-alloyed ferritic steel (Crofer 22 APU [37]). However, in cases where O2 or N2 were used as the ASG, no evidence of Cr contamination was detected, despite the fact that the LSCF electrode did not demonstrate strong stability against Cr poisoning [36]. This observation is in good agreement with the known acidity of the CrVI compounds and the presence of the acid-like volatile Cr hydroxides in the H2O-containing oxidative atmospheres over Cr-based materials [38]. Acidic CrOx(OH)y species were trapped by the relatively basic Sr-enriched compounds. It is worth underlining that no particular evidence of the excessive corrosion of the housing was detected, although the steam–oxygen mixture offered better conditions for Cr volatilization from the scale.
Post-mortem analysis revealed that the degradation of the LSCF anode in steam as a sweep gas was governed by phase decomposition, which was followed by the segregation of strontium and observable contamination with Cr. For Cells 1 and 2, known delamination-based models of the degradation look most feasible; however, a strong negative impact of pure oxygen compared to nitrogen was not expected.

4. Conclusions

The separation of pure oxygen in high-temperature steam electrolysis is challenging and requires additional investigation. While the use of steam as the anode sweep gas looks attractive from the point of view of the process design, it faces issues related to its material science and corrosion. In the case of N2 as the ASG, the stability of the electrode, based on commercial La0.6Sr0.4Co0.2Fe0.8O3 powder, might be considered high, and the SOEC demonstrated minimal degradation at moderate performance. In the case of pure oxygen, the behavior of the cell fits the pattern of delamination-based degradation, which is described in more detail in the literature. In the case of steam as the ASG, the LSCF electrode did not demonstrate sufficient chemical stability in the 1000-h experiment. Instability led to the de-mixing of the cations, the formation of a Sr-enriched zone near the GDC, and the capture therein of the chromia. As a result, the electrochemical performance of the cell degraded severely, with complicated evolution of the electrochemical processes and the development of ohmic resistance. Later, it increased from 0.2 to 0.6 Ω cm2, while polarization resistance developed from 0.25 to 0.65 Ω cm2 in a logarithmic-like trend. Thus, the production of pure oxygen as a by-product of steam electrolysis requires dedicated anode layers. These electrodes either have to demonstrate very strong oxygen mobility, electrochemical performance, and stability in the pure oxygen atmosphere to avoid delamination of the cell or they must be stable against the de-mixing of the cations in steam. The latter might likely be found among alkaline-earth-free perovskites or Ruddlesden–Popper phases.

Supplementary Materials

The following supporting information can be downloaded at: https://www.mdpi.com/article/10.3390/en17051144/s1, Figure S1: Example of the treatment of the EIS data; Figure S2: Example of the augmentation of the DRT of the EIS, using equivalent circuit model; Figure S3: Example of EIS of the Cell 1; Figure S4: Example of EIS of the Cell 2; Figure S5: Example of EIS of the Cell 3; Figure S6: Preliminary (Cells p1-p4) and final (Cell 3) tests of the electrolysis with steam as anode sweep gas; Table S1: Example of the equivalent circuit fit.

Author Contributions

Conceptualization, M.W. and J.K.; methodology, M.W. and M.S.; software, Y.N.; formal analysis, M.W., Y.N. and A.N.; investigation, M.W., S.J. and A.N.; data curation, M.W. and Y.N.; writing—original draft preparation, Y.N.; writing—review and editing, Y.N., A.N., M.W., S.J., M.S. and J.K.; visualization, Y.N. and M.W.; project administration, M.W.; funding acquisition, M.W. and Y.N. All authors have read and agreed to the published version of the manuscript.

Funding

This research was funded by the National Science Centre, Poland under grant agreement UMO-2018/31/N/ST8/02491.

Data Availability Statement

Dataset available upon request from the authors.

Acknowledgments

A. Niemczyk acknowledges support from the Foundation for Polish Science (FNP) in the form of a scholarship of the START program (agreement no. START 049.2022). The authors would also like to acknowledge the Materials Testing and Diagnostics Department at the Institute of Power Engineering–National Research Institute for providing access to the scanning electron microscope.

Conflicts of Interest

The authors declare no conflicts of interest.

References

  1. Kupecki, J.; Hercog, J.; Motyliński, K.; Malesa, J.; Muszyński, D.; Skrzypek, E.; Skrzypek, M.; Boettcher, A.; Tchorek, G. Advancing production of hydrogen using nuclear cycles—Integration of high temperature gas-cooled reactors (HTGR) with solid oxide electrolyzers (SOE). Int. J. Hydrogen Energy 2024, 53, 40–48. [Google Scholar] [CrossRef]
  2. IRENA. Geopolitics of the Energy Transformation: The Hydrogen Factor; International Renewable Energy Agency: Abu Dhabi, United Arab Emirates, 2022; ISBN 978-92-9260-370-0. [Google Scholar]
  3. Kupecki, J.; Motylinski, K.; Jagielski, S.; Wierzbicki, M.; Brouwer, J.; Naumovich, Y.; Skrzypkiewicz, M. Energy analysis of a 10 kW-class power-to-gas system based on a solid oxide electrolyzer (SOE). Energy Convers. Manag. 2019, 199, 111934. [Google Scholar] [CrossRef]
  4. Hauch, A.; Küngas, R.; Blennow, P.; Hansen, A.B.; Hansen, J.B.; Mathiesen, B.V.; Mogensen, M.B. Recent advances in solid oxide cell technology for electrolysis. Science 2020, 370, 186. [Google Scholar] [CrossRef] [PubMed]
  5. Liu, G.; Kupecki, J.; Deng, Z.; Li, X. Efficiency analysis of a novel reversible solid oxide cell system with the secondary utilization of the stack off-gas: A model-based study. J. Clean. Prod. 2023, 397, 136570. [Google Scholar] [CrossRef]
  6. Xia, Z.; Zhao, D.; Zhou, Y.; Deng, Z.; Kupecki, J.; Fu, X.; Li, X. Control-oriented performance prediction of solid oxide electrolysis cell and durability improvement through retard oxygen electrode delamination with reverse operation. Energy Convers. Manag. 2023, 277, 116596. [Google Scholar] [CrossRef]
  7. Udagawa, J.; Aguiar, P.; Brandon, N.P. Hydrogen production through steam electrolysis: Control strategies for a cathode-supported intermediate temperature solid oxide electrolysis cell. J. Power Sources 2008, 180, 354–364. [Google Scholar] [CrossRef]
  8. Barelli, L.; Bidini, G.; Cinti, G. Steam as sweep gas in SOE oxygen electrode. J. Energy Storage 2018, 20, 190–195. [Google Scholar] [CrossRef]
  9. Aphale, A.; Liang, C.; Hu, B.; Singh, P. Cathode Degradation From Airborne Contaminants in Solid Oxide Fuel Cells: A Review. In Solid Oxide Fuel Cell Lifetime and Reliability; Brandon, N.P., Ruiz-Trejo, E., Boldrin, P., Eds.; Academic Press: London, UK, 2017; pp. 101–119. [Google Scholar] [CrossRef]
  10. Hagen, A.; Neufeld, K.; Liu, Y.L. Effect of Humidity in Air on Performance and Long-Term Durability of SOFCs. J. Electrochem. Soc. 2010, 157, B1343. [Google Scholar] [CrossRef]
  11. Kim, M.; Muroyama, H.; Matsui, T.; Eguchi, K. Influence of Water Vapor on Performance Degradation and Microstructural Change of (La,Sr)(Co,Fe)O3−δ Cathode. Electrochem. Soc. 2019, 166, F1269. [Google Scholar] [CrossRef]
  12. Egger, A.; Perz, M.; Bucher, E.; Gspan, C.; Sitte, W. Effect of Microstructure on the Degradation of La0.6Sr0.4CoO3–δ Electrodes in Dry and Humid Atmospheres. Fuel Cells 2019, 19, 458–471. [Google Scholar] [CrossRef]
  13. Egger, A.; Schrödl, N.; Sitte, W. Evaluation of oxide ceramics as anodes for SOECs. Faraday Discuss. 2015, 182, 379–391. [Google Scholar] [CrossRef] [PubMed]
  14. Sun, X.; Hendriksen, P.V.; Hauch, A.; Clausen, A.K.; Lehtinen, T.; Noponen, M. Effect of Anode Side Purge Gas on the Degradation of Solid Oxide Electrolysis Cells. ECS Trans. 2021, 103, 1083. [Google Scholar] [CrossRef]
  15. Solid Oxide Fuel Cells—Elcogen | Solid Oxide Cells and Stacks. Available online: https://elcogen.com/products/solid-oxide-fuel-cells/ (accessed on 8 December 2023).
  16. Saccoccio, M.; Wan, T.H.; Chen, C.; Ciucci, F. Optimal Regularization in Distribution of Relaxation Times applied to Electrochemical Impedance Spectroscopy: Ridge and Lasso Regression Methods—A Theoretical and Experimental Study. Electrochim. Acta 2014, 147, 470–482. [Google Scholar] [CrossRef]
  17. Macdonald, J.R.; Potter, L.D. A flexible procedure for analyzing impedance spectroscopy results: Description and illustrations. Solid State Ion. 1987, 24, 61–79. [Google Scholar] [CrossRef]
  18. Boukamp, B.A. Distribution (function) of relaxation times, successor to complex nonlinear least squares analysis of electrochemical impedance spectroscopy? J. Phys. Energy 2020, 2, 042001. [Google Scholar] [CrossRef]
  19. GSL—GNU Scientific Library—GNU Project—Free Software Foundation. Available online: https://www.gnu.org/software/gsl/ (accessed on 27 December 2023).
  20. OpenBLAS: An Optimized BLAS Library. Available online: https://www.openblas.net/ (accessed on 27 December 2023).
  21. Johnson, S.G. The NLopt Nonlinear-Optimization Package. Available online: http://github.com/stevengj/nlopt (accessed on 27 December 2023).
  22. Wang, Y.; Marchetti, B.; Zhou, X.-D. Call attention to using DRT and EIS to quantify the contributions of solid oxide cell components to the total impedance. Int. J. Hydrogen Energy 2022, 47, 35437–35448. [Google Scholar] [CrossRef]
  23. Chen, M.; Liu, Y.L.; Bentzen, J.J.; Zhang, W.; Sun, X.; Hauch, A.; Tao, Y.; Bowen, J.R.; Hendriksen, P.V. Microstructural Degradation of Ni/YSZ Electrodes in Solid Oxide Electrolysis Cells under High Current. J. Electrochem. Soc. 2013, 160, F883. [Google Scholar] [CrossRef]
  24. Tietz, F.; Sebold, D.; Brisse, A.; Schefold, J. Degradation phenomena in a solid oxide electrolysis cell after 9000 h of operation. J. Power Sources 2013, 223, 129–135. [Google Scholar] [CrossRef]
  25. Rorato, L.; Shang, Y.; Yang, S.; Hubert, M.; Couturier, K.; Zhang, L.; Vulliet, J.; Chen, M.; Laurencin, J. Understanding the Ni Migration in Solid Oxide Cell: A Coupled Experimental and Modeling Approach. J. Electrochem. Soc. 2023, 170, 034504. [Google Scholar] [CrossRef]
  26. Bouwmeester, H.J.M.; Den Otter, M.W.; Boukamp, B.A. Oxygen transport in La0.6Sr0.4Co1−yFeyO3−δ. J. Solid State Electrochem. 2003, 9, 599–605. [Google Scholar] [CrossRef]
  27. Yashiro, K.; Nakano, I.; Kuhn, M.; Hashimoto, S.; Sato, K.; Mizusaki, J. Electrical Conductivity and Oxygen Diffusivity of Perovskite-Type Solid Solution La0.6Sr0.4Co1-yFeyO3-δ (y = 0.2, 0.4, 0.5, 0.6, 0.8). ECS Trans. 2011, 35, 1899. [Google Scholar] [CrossRef]
  28. Hashimoto, S.; Fukuda, Y.; Kuhn, M.; Sato, K.; Yashiro, K.; Mizusaki, J. Oxygen nonstoichiometry and thermo-chemical stability of La0.6Sr0.4Co1-yFeyO3-δ (y = 0.2, 0.4, 0.6, 0.8). Solid State Ion. 2010, 181, 1713–1719. [Google Scholar] [CrossRef]
  29. Virkar, A.V. Mechanism of oxygen electrode delamination in solid oxide electrolyzer cells. Int. J. Hydrogen Energy 2010, 35, 9527–9543. [Google Scholar] [CrossRef]
  30. Morales, M.; Miguel-Pérez, V.; Tarancón, A.; Slodczyk, A.; Torrell, M.; Ballesteros, B.; Ouweltjes, J.P.; Bassat, J.M.; Montinaro, D.; Morata, A. Multi-scale analysis of the diffusion barrier layer of gadolinia-doped ceria in a solid oxide fuel cell operated in a stack for 3000 h. J. Power Sources 2017, 344, 141–151. [Google Scholar] [CrossRef]
  31. Railsback, J.; Choi, S.H.; Barnett, S.A. Effectiveness of dense Gd-doped ceria barrier layers for (La,Sr)(Co,Fe)O3 cathodes on Yttria-stabilized zirconia electrolytes. Solid State Ion. 2019, 335, 74–81. [Google Scholar] [CrossRef]
  32. Soubeyroux, J.L.; Courbin, P.; Fournes, L.; Fruchart, D.; Le Flem, G. La phase SrLaFeO4: Structures cristalline et magnétique. J. Solid State Chem. 1980, 31, 313–320. [Google Scholar] [CrossRef]
  33. El Shinawi, H.; Greaves, C. Synthesis and characterization of the K2NiF4 phases La1+xSr1−xCo0.5Fe0.5O4−δ (x = 0, 0.2). J. Solid State Chem. 2008, 181, 2705–2712. [Google Scholar] [CrossRef]
  34. Kim, J.-H.; Lee, K.-T.; Kim, Y.N.; Manthiram, A. Crystal chemistry and electrochemical properties of Ln(Sr,Ca)3(Fe,Co)3O10 intergrowth oxide cathodes for solid oxide fuel cells. J. Mater. Chem. 2011, 21, 2482–2488. [Google Scholar] [CrossRef]
  35. Ferreira, T.A.S.; Waerenborgh, J.C.; Mendonça, M.H.R.M.; Nunes, M.R.; Costa, F.M. Structural and morphological characterization of FeCo2O4 and CoFe2O4 spinels prepared by a coprecipitation method. Solid State Sci. 2003, 5, 383–392. [Google Scholar] [CrossRef]
  36. Horita, T. Chromium poisoning for prolonged lifetime of electrodes in solid oxide fuel cells—Review. Ceram. Int. 2021, 47, 7293–7306. [Google Scholar] [CrossRef]
  37. Crofer 22APU—Material Data Sheet No. 4046. ThyssenKrupp VDM, 2010. Available online: https://www.vdm-metals.com/fileadmin/user_upload/Downloads/Data_Sheets/Data_Sheet_VDM_Crofer_22_APU.pdf (accessed on 3 June 2023).
  38. Hilpert, K.; Das, D.; Miller, M.; Peck, D.H.; Weiß, R. Chromium Vapor Species over Solid Oxide Fuel Cell Interconnect Materials and Their Potential for Degradation Processes. J. Electrochem. Soc. 1996, 143, 3642. [Google Scholar] [CrossRef]
Figure 1. Schematic drawing of the housing for the SOE.
Energies 17 01144 g001
Figure 2. Schematic drawing of the test rig used in the presented experiments.
Energies 17 01144 g002
Figure 3. Typical equivalent circuits model, as observed for studied cells.
Energies 17 01144 g003
Figure 4. Response of the Cell 1 DRT spectra on alteration of the CFG and ASG.
Energies 17 01144 g004
Figure 5. Current-voltage characteristics of Cell 3 with different ASGs.
Energies 17 01144 g005
Figure 6. Degradations of the cells with various ASGs. CFG composition was 70% H2O–30% H2. (A) Evolution of the cells voltage under constant current, (B) polarization resistance, and (C) ohmic resistance; Log Fit denotes fit to model R p = A + B   ln ( t ) . Fits are presented for visual guidance. Notched voltage plots for steam and O2 in (A) are related to the EIS measurements and minor dysfunction of the control box. For N2, these effects were eliminated.
Energies 17 01144 g006
Figure 7. Evolution of the DRT of the SOEC with oxygen as the anode sweep gas. Electrolysis conditions: 800 °C, −0.25 A/cm2, and CFG: 70% H2O–30% H2.
Energies 17 01144 g007
Figure 8. Evolution of the DRT of the SOEC with nitrogen as the anode sweep gas. Electrolysis conditions: 800 °C, −0.25 A/cm2, and CFG: 70% H2O–30% H2.
Energies 17 01144 g008
Figure 9. Evolution of the DRT of the SOEC with steam as the anode sweep gas. (A) First 309 h and (B) the rest of the 1000 h term. Electrolysis conditions: 800 °C, −0.25 A/cm2, and CFG: 70% H2O–30% H2.
Energies 17 01144 g009
Figure 10. Cell 3 cross-section after 1000 h of operation under −0.25 A/cm2 current, with steam as the ASG. (A) Full view, (B) crack in YSZ membrane, (C) crack in GDC-YSZ interface, and (D) crack in GDC-YSZ interface, propagated to LSCF-GDC border.
Energies 17 01144 g010
Figure 11. Cell 3 cross-section after 1000 h of operation under −0.25 A/cm2 current with oxygen as ASG. (A) Full view and (B) crack on LSCF-GDC border.
Energies 17 01144 g011
Figure 12. Chemical composition of Cell 1.
Energies 17 01144 g012
Figure 13. Chemical composition of Cell 2.
Energies 17 01144 g013
Figure 14. Chemical composition of Cell 3.
Energies 17 01144 g014
Figure 15. XRD of Cell 2, Cell 3, and reference pristine cell with LSCF electrode. The symbol “?” denotes significant reflexes of the novel phase (see text).
Energies 17 01144 g015
Table 1. Design of the studied cells.
LayerMaterialThickness, μm
Anode (oxygen electrode) La0.6Sr0.4Fe0.8Co0.2O3−δ30
Strontium diffusion barrierGd0.1Ce0.9O23
Electrolyte8YSZ3–6 1
Cathode (fuel electrode)NiO/8YSZ10
Fuel electrode supportNiO/8YSZ300
Contact layerNiO3
1 As claimed by the producer.
Table 2. Conditions of the long-term experiments on the impact of the anode sweep gas on the degradation of the electrode layer.
Cell LabelLong-Term ASG, mLN/minInitial RΩ, Ω cm2Initial Rp,
Ω cm2
Initial OCV *, V
Cell 1O2, 5000.1500.1051.233
Cell 2N2, 10000.1260.1071.190
Cell 3Steam, 5000.1350.1401.201
* SOEC mode—anode: 50% H2 in N2; cathode: air; cell state: after reduction.
Disclaimer/Publisher’s Note: The statements, opinions and data contained in all publications are solely those of the individual author(s) and contributor(s) and not of MDPI and/or the editor(s). MDPI and/or the editor(s) disclaim responsibility for any injury to people or property resulting from any ideas, methods, instructions or products referred to in the content.

