Article

Impact of Process Technology on Properties of Large-Scale Wind Turbine Blade Composite Spar Cap

1
School of Materials Science and Engineering, Tongji University, 4800 Caoan Road, Shanghai 201804, China
2
Aeolon Technology Co., Ltd., Shanghai 201306, China
*
Author to whom correspondence should be addressed.
Energies 2024, 17(5), 1149; https://doi.org/10.3390/en17051149
Submission received: 24 January 2024 / Revised: 19 February 2024 / Accepted: 25 February 2024 / Published: 28 February 2024
(This article belongs to the Section A3: Wind, Wave and Tidal Energy)

Abstract

:
As wind turbine blade length increases, reconciling lightweight design with strength necessitates continuous advancements in process technology. The impact of three different process technologies–vacuum-assisted resin transfer moulding (VARTM), prepreg, and pultrusion–on the properties of wind turbine blade composite spar caps was investigated using scanning electron microscopy, dynamic mechanical analysis, differential scanning calorimetry, thermogravimetric analysis, and static and fatigue testing. The results demonstrated that the fibre weight content and 0° tensile modulus of the VARTM and pultrusion composites increased as compared to those of the prepreg samples. Subsequently, the properties of a 94-m blade were analysed using the Ansys Composite PrepPost (ACP) and static structure modules in Ansys simulations, and the weights of the spar cap were compared with test data of materials under different process technologies. The results showed that the masses of the spar cap of a 94-m blade in the pultrusion, VARTM, and prepreg processes were 7965, 9170, and 9942 kg, respectively. The quantitative influence rules on the weight of the wind turbine blade spar cap prepared through different process technologies were formulated. The findings of this study are promising and are expected to aid the development of wind turbine blade process technologies.

1. Introduction

Wind energy, a mature and highly commercial renewable energy source, is widely used in diverse applications across the world [1,2,3]. According to the Wind Energy 2023 report, the global installed capacity reached 906 GW by the end of 2022, whereas 77.6 GW of new capacity was added in 2022. The global market of wind energy is expected to rise at a compound annual growth rate of 15% from 2023 to 2027, indicating the massive potential of wind energy in the energy transition [4].
Among the components of a wind turbine, the blade is not only the most expensive but also a vital part of the unit. The wind turbine blade, a carrier of wind turbine energy, is the main source of the unit load. With an increase in the length of wind turbine blades, the blade weight increases exponentially [5]. This increase further causes a gradual increase in the structural load. Thus, it is necessary to reduce the weight of wind turbine blades at the minimum production cost [6]. Compared to traditional materials such as aluminium, titanium alloy, and steel, reinforced polymer matrix composites are widely used in wind turbine blades owing to their favourable properties such as high specific strength (strength/density), high specific modulus (elastic modulus/density), and excellent fatigue life characteristics after 107 load cycles [7].
Large-scale wind turbine blades are manufactured using primarily composite materials and include multiple components, as shown in Figure 1. Among them, the most critical structural component is the blade spar cap, which performs the vital task of supporting the blade and transmitting the wind force on the blade. In the design of wind turbine blade spar caps, material selection is crucial because the spar cap is the key bearing structure of the wind turbine blade.
Wind turbine blade production technologies have continuously advanced over the past five decades. Over this period, four different process technologies have primarily been used: hand lay-up (HLU), prepreg, vacuum-assisted resin transfer moulding (VARTM), and pultrusion. The composites of wind turbine blades and their process technologies have been extensively studied. Mahavir et al. [8] studied the mechanical and thermo-mechanical behaviour of glass fibre epoxy composites manufactured by two process technologies, i.e., VARTM and HLU. Their results demonstrated that the composite fabricated via the VARTM technique possessed robust mechanical and thermo-mechanical properties compared to those obtained by using the HLU technique. Li et al. [9] reviewed the statement that wind turbine blades are confronted with the conflicting demands of large scale, low cost, and lightweight. Both new materials and innovative processing technology are crucial in promoting wind power in the parity era. For example, prepreg and pultrusion play increasingly important roles in future large-scale blade manufacturing. Ennis et al. [10] reported that pultruded fibre-reinforced polymers exhibit the highest mechanical properties among unidirectional composites, characterised by a high degree of fibre orientation and consistent properties. As compared to VARTM, this method exhibits superior fibre alignment and more consistent properties. Pultrusion composites possess improved mechanical properties, with a 17% increase in design strength at a constant fibre volume fraction and a higher fibre volume fraction.
The traditional HLU process technology is no longer used in spar caps, mainly because of environmental issues. Therefore, prepreg [11,12,13,14], VARTM [15,16], and pultrusion [17,18,19] are the most common approaches utilised in the processing technology of spar caps. However, the current literature lacks a systematic evaluation and comparative analysis of the aforementioned three composite process technologies. The selection of materials is closely related to the process technology. Hence, this study aimed to comparatively analyse the performances of different process technology and their impact on the weight and performance of composite spar caps of wind turbine blades for the first time. To this end, three process technologies, namely, VARTM, prepreg, and pultrusion were systematically analysed. In addition, finite element simulations of a 94-m blade were performed using Ansys, and the weight of the spar cap corresponding to different process technologies was compared.

2. Experimental Section

2.1. Sample Preparation

The reinforcement of three types of samples, based on S-glass with the same yarn grades (TMII468GS and E8-390), was used in this study. These yarns exhibit similar performance, with a tensile modulus of impregnated yarn of approximately 95 GPa. The difference in tensile modulus was within 2%. They were obtained from mainstream suppliers in the wind power industry.
Three composite materials, manufactured from VARTM, prepreg, and pultrusion process technologies, were presented in Figure 2a–c. In addition, the direction of the main fibre is shown by the red arrow in the figure.
For prepreg process technology, the glass fibre TMII468GS was purchased from Chongqing International Composite Material Co., Ltd. (Chongqing, China), while the epoxy prepreg resin system, ZENPREG 2554, was procured from Swancor Co., Ltd. (Shanghai, China). The curing process involved the following steps. First, the material was heated at a rate of 1–2 °C·min−1 to 120 °C and cured for 2 h. Subsequently, it was cooled at a rate of 1–3 °C·min−1 below 60 °C, and the mould was released. Specimens Size: 500 mm (along the length of the fibre) × 500 mm (along the vertical direction of the fibre) × 2 to 4 mm (along the thickness direction of the fibre).
For VARTM process technology, the glass fibre E8-390 yarn unidirectional fabric UD-1250 (fabric areal density = 1249 g·m−2) was purchased from Zhejiang Zhenshi New Materials Co., Ltd. (Tongxiang, China) and the epoxy infusion resin system TECHSTORM 180/185, purchased from Techstorm Advanced Material Corporation Limited Co., Ltd. (Shanghai, China), were used. The curing process was as follows. The material was heated at a rate of 0.5 °C·min−1 to 50 °C and then cured at a constant temperature for 5 h. It was then heated to 80 °C and cured for 8 h; when the natural cooling was below 40 °C, the mould was released. Specimens Size: 500 mm (along the length of the fibre) × 500 mm (along the vertical direction of the fibre) × 2 to 4 mm (along the thickness direction of the fibre).
For pultrusion process technology, the glass fibre E8-390 yarn was purchased from Zhejiang Zhenshi New Materials Co., Ltd. (Tongxiang, China), and the epoxy pultrusion resin system ER6136X/EH6136X, purchased from Anhui Zhongbo New Materials Co., Ltd. (Chuzhou, China), were used. Reciprocating pultrusion traction equipment was used for the experiment. The pultrusion speed was 40–60 cm/min, and the thickness of the pultrusion plank was 5 mm. Three-stage curing at a temperature of 130–190 °C (gradual heating) was performed. The composite material was cured after releasing the mould, and the post-curing temperature was 160–120 °C (gradual cooling). Specimens Size: 1000 mm (along the length of the fibre) × 120 mm (along the vertical direction of the fibre) × 5 mm (along the thickness direction of the fibre).
Although the resin brands and manufacturers of the three process technologies are different, they are all essentially epoxy resin systems. However, the resin system has a relatively small impact on the strength and modulus of the composite material, and the main properties of the composite material are provided by the fibre.

2.2. Analysis of the Cross-Section

The composites were characterised via scanning electron microscopy (SEM) ZEISS-EVO15 purchased from Carl Zeiss Microscopy Ltd. (Berlin, Germany). Prior to observation, charge accumulation during the analysis was reduced by sputtering Au particles. The test parameters used include acceleration voltage = 15 kV and beam current = 4.52 A for capturing the SEM images.

2.3. Thermoanalysis

Dynamic Mechanical Analysis (DMA) was conducted to evaluate the thermo-mechanical properties of the three composite materials produced using different process technologies. Rectangular cut specimens measuring 55 mm (along the length of the fibre) × 10 mm (along the vertical direction of the fibre) × 2 mm (along the thickness direction) were tested in the double-cantilever mode on a dynamic mechanical analyser DMA 850 purchased from TA Instruments (New Castle, DE, USA). The test temperature range was −50 to 200 °C, the heating rate was 5 °C·min−1, the test frequency was 1 Hz, the preload was 0.01 N, and the amplitude was 20 μm.
Simultaneously, thermal performance tests were conducted using a differential scanning calorimeter DSC2500 procured from TA Instruments (New Castle, DE, USA). In this experiment, a 30-mg sample was placed in an aluminium crucible and heated at a rate of 10 °C·min−1. The experiment was performed in a nitrogen atmosphere at a scanning temperature range of 30–280 °C.

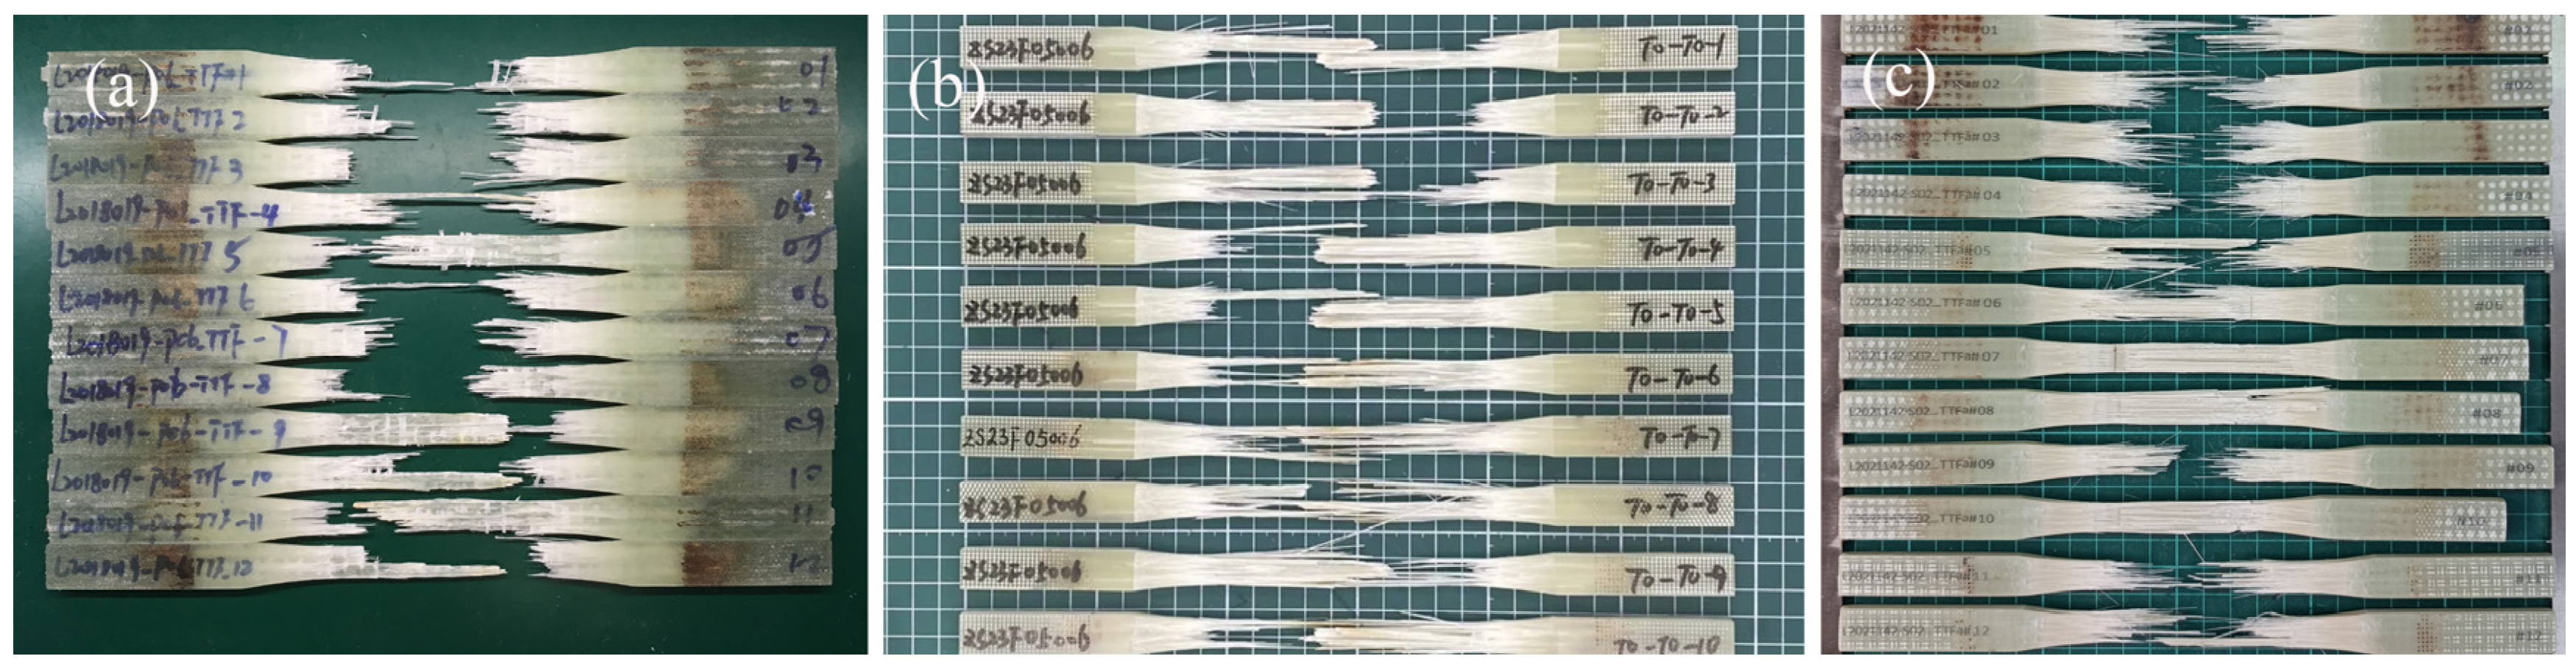
2.4. Mechanical Property Analysis

Static mechanical properties were assessed using a universal material tester LE5105 procured from LSI SYSTEMS CORPORATION (Shanghai, China). The samples were prepared by cutting with a computer numerical control (CNC) machine with a tolerance of 0.02 mm. Tensile, compressive, and shear mechanical properties were tested according to ISO 527-5 [20], ISO 14126 [21], and ASTM D7078 [22], respectively.
A universal fatigue testing machine Instron 8801 purchased from Instron (Shanghai) Testing Equipment Trading Co., Ltd. (Shanghai, China) was employed to evaluate the fatigue’s mechanical properties. Specimens were cut using a CNC machine with a tolerance of 0.02 mm. The tension-tensile fatigue test involved cyclic stress between the maximum stress (Smax) and the minimum stress (Smin). The fatigue test was performed in accordance with ISO 13003 [23]. The loading frequency was 5 Hz, the stress ratio was 0.1, and the stress waveform was sinusoidal.

3. Results

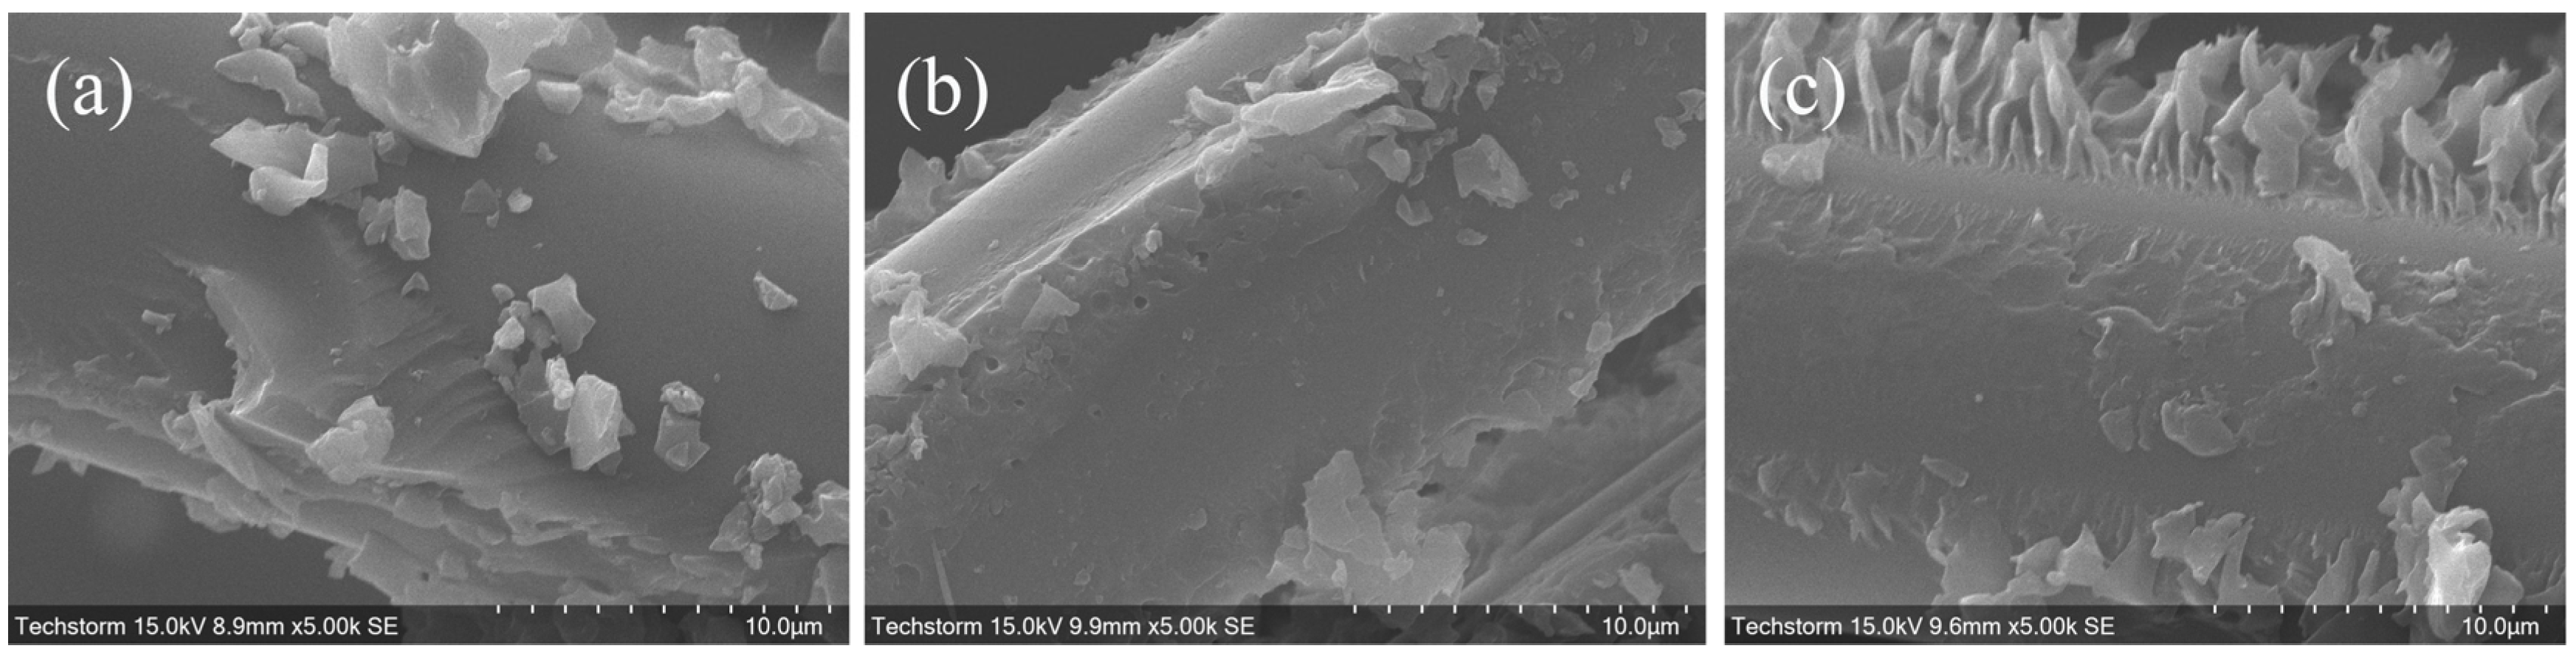
3.1. Micromorphology Analysis

The metallographic morphology of the fibre microstructure of composite materials for the three process technologies was examined. The results are illustrated in Figure 3, which displays the SEM microstructural images of composites prepared by different processes. Among them, Figure 3a–c and Figure 3d–f show the 100× and 1000× magnified images, respectively. Figure 3a depicts the micromorphology of the VARTM process composite material, capturing an image of the glass fibre fabric layer and the area between layers. It can clearly identify the position of the stitching thread in the fabric (as shown in the red frame) and the glass fibre (circular area) and can also clearly distinguish the gap between the glass fibre stitching thread, which is evidently different from those in the composite materials in the other two types of process technology. The size of the gap is mainly determined by the stitching process of the fabric, which directly affects the flow and flow direction of the resin during the VARTM process. Figure 3b shows the composite material associated with the prepreg process; although the fibres are relatively evenly distributed, the space between the fibres is large. Figure 3c displays the composite material in the pultrusion process. Owing to the high glass fibre weight content of the composite materials, the fibres are uniformly arranged and distributed in one direction. Thus, the fibres on the end face are densely distributed, and the resin enrichment area is smaller. The ordered arrangement of fibre helps improve the mechanical properties of the composite materials. As evident in Figure 3d–f, owing to the fibre content, there are evident differences in the distribution of single fibres on the end faces of composite materials with different moulding processes. Simultaneously, cracks between glass fibre and resins are not evident in the three processes, and the glass fibres are tightly wrapped by resins. The interface between fibre and resins is well combined, and there is no gap between a single fibre and matrix. In summary, the different processing technologies lead to different fibre microstructures and, ultimately, disparate mechanical properties. For a single process technology, the effects of the changes in the process conditions during the process technology can be effectively evaluated on the basis of the distribution of the microstructure of the fibre. For example, the change in pressure during the process would change the thickness between the fabric layers.

3.2. Research on Thermal Properties

The DMA test results of the three types of composite materials produced using different processes, as shown in Figure 4a–c, show the correlations among energy storage and loss modulus, phase angle and temperature. The elastic and plastic properties of the composites fabricated using different process technologies exhibited similar behaviour.
E r = E r u b + ( E g l a s s + E g l a s s T × T E r u b ) 1 + e x p ( C m ( T T g σ m ) ) ,
Eglass is the modulus of the resin in the glass state, and EglassT represents the dependence on temperature in the glass state. The modulus in the rubber state is represented by Erub. Cm denotes the width of the transition, and σm represents the change in temperature [24].
The difference in the initial values of the modulus of the three samples may be attributed to the difference in the material processes. The energy storage modulus E′ of the three process composites of VARTM, prepreg, and pultrusion were 33.8, 26.6, and 40.5 GPa, respectively (Figure 4a). The higher the fibre weight content, the higher the energy storage modulus E′ and the correlation between fibre mass content and energy storage modulus. In addition, the initial temperatures of the decay of the storage modulus (E′) of the three processed composites were 75.02, 100.21, and 104.73 °C, respectively. As the temperature further increased, movement of the cross-linked polymer chain of the composite would begin; consequently, the material softened, and the mechanical properties began to gradually decline. The storage modulus then decreased significantly in a linear manner to E′ ≈ 8.1 GPa at T ≈ 100 °C for the VARTM process composites. For the prepreg composites, it was significantly reduced to E′ ≈ 3.5 GPa at T ≈ 130 °C. Furthermore, the pultrusion composite was reduced to E′ ≈ 19.1 GPa at T ≈ 171 °C. Therefore, among the high-temperature performances of the three composites, the prepreg composite possessed the lowest modulus.
Figure 4b displays the curve of the change in the loss modulus (E″) of the three composite processes according to temperature, which first increases gradually to a peak value and then decreases, reaching a peak value at Tg. Via the DMA test, Tg was measured based on the loss modulus (E″). The peak loss modulus (E″) curve shows the Tg values of the three composite processes. The Tg values for VARTM, prepreg, and pultrusion composites are 83.0, 112.85, and 120.30 °C, respectively. It can be observed that the Tg value of the pultrusion composite was the highest.
The peak tanð of the phase angle of three process composites––VARTM, prepreg, and pultrusion––was 83.03, 125.64, and 126.69 °C, respectively (Figure 4c).
The differential scanning calorimetry (DSC) results of the composites in the temperature range of 30–280 °C are shown in Figure 5. The midpoint glass transition temperature values of the process composites for VARTM, prepreg, and pultrusion are 82.12, 118.42, and 105.11 °C, respectively. In addition, the reaction enthalpies of the composite materials of the three processes (VARTM, prepreg, and pultrusion) are 0.78759, 4.5822, and 0.17174 J·g−1, respectively. The enthalpy of the prepreg composite exhibited a slight increase compared to the other two processes. Based on the total enthalpy test data of 400 J·g−1 (derived from test experience), it is expected that the prepreg composite contained roughly 1% of unreacted residue and 99% of cured materials, whereas the VARTM and pultrusion composites were fully cured.

3.3. Study of Mechanical Properties

An ideal blade material must achieve a high strength-to-weight ratio, fatigue life, and stiffness at a low cost and with the desired blade profile while fully considering the structural characteristics of the blade. The structural properties of the blade materials are listed in Figure 6a. The mechanical properties of the three process composites depend on the properties of the component materials, bonding quality at the interface between fibre and resin, fibre arrangement, interface shape of pultruded cross-section, and manufacturing process [25]. The results of the static tensile tests of the three processed technology composites, VARTM, prepreg, and pultrusion, are listed in Figure 6b. The aforementioned test data are average values.
Table 1 summarises the characteristics and main mechanical properties of the three composite materials employed in this study. The fibre weight content and density were tested in accordance with ISO 1172 [26] and ISO 845 [27], respectively.
The fibre weight contents of the VARTM, prepreg, and pultrusion composites were 75.14%, 69.72%, and 84.98%, respectively. Specifically, the VARTM composite had a 7.8% higher fibre weight content, while the pultrusion composite exhibited a 21.9% increase compared to the prepreg samples. Furthermore, the 0° tensile modulus of the VARTM composite exceeded the prepreg samples by 20%, while the pultrusion composite demonstrated a remarkable 52% improvement.
This indicates that the composite process technology and fibre quality content are related [28]. The mechanical properties of the composite and their contributions can be explained based on the micromechanical relationship between the fibre and resin. Evidently, less resin is required for the complete impregnation of glass fibre in the pultrusion process. Because of the continuous and high moulding pressure, fibres are compacted, resulting in a thinner cross-section compared to that in the VARTM and prepreg process and higher strength per unit volume. The increase in strength may be attributed to an increased fibre volume fraction and excellent interfacial bonding between fibre and matrix.
The fatigue fracture of composite materials refers to the fracture phenomenon of the material under cyclic loading or repeated loading. The fatigue failure mode of the three types of composite materials is generally a brittle failure. Cracks appeared between the fractured panels of the specimen, and a large number of glass fibres were dispersed, as shown in Figure 7a–c.
Under high-stress levels, the specimen began to break after several cycles, and most of the fibres detached from the matrix. As the number of cycles increased, the fatigue damage of the composite specimen gradually expanded to the middle of the entire section of the specimen until complete failure. Under a low-stress level, the fatigue failure mode of the specimen was essentially the same as that under a high-stress level, and the only difference was with regard to the fatigue cycle.
The Stress–Number of Cycles (S–N) curve is a classical approach that describes the fatigue behaviour of fibre-reinforced plastic (FRP). Currently, the exponential form of the S–N curve is the most widely used approach to describe the fatigue properties of FRP and the S–N curve power function is the most commonly used form to describe the material’s S–N curve.
N · e m S = C
After taking logarithms on both sides of Equation (2) [29], we obtain the following:
S = A + B l g ( N )
where A, B and C are material parameters. Here, where S is the stress level, N is the number of stress cycles.
The S–N curves were fitted according to the fatigue life of the pultrusion composite specimens under different stress levels, as shown in Figure 8 and Table 2.
The essential data on the tension-tensile fatigue performance of the three process composites, including the test results form, the 107 limit, and R2 values, are shown in Table 2. As shown in Figure 8, the m value of the VARTM process composites was the highest, whereas that of the pultrusion process was the lowest. The m value of the prepreg process was intermediate. The low fibre content of the prepreg process does not enhance fatigue performance.
For the composite material as a whole, the interface was the most vulnerable phase of the composite material. Therefore, SEM analysis of the samples after tensile testing of three types of composite materials, especially the analysis of the interface combination between the reinforced fibre and the resin of the composite material, aims at exploring the fracture microscopic mechanism of the three types of composite materials [30].
Figure 9, depicting the tensile samples of the three types of composite materials, shows that the composite materials of the VARTM process composites exhibit a transparent state after curing, and the stitch yarn is evident. The prepreg-process composites exhibited a translucent state after curing. The pultrusion samples were opaque after curing because the pultruded resin itself was not a transparent system. The images of the three sections before and after failure show that the glass fibre was explosively dispersed after tensile failure; the degree of dispersion of the three processes was pultrusion > VARTM > prepreg, and the damage at the fracture point of the composite materials of the three processes was mainly fibre fracture, as shown in Figure 9.
SEM analysis was performed on the fracture sections of the tensile failure of the composites of the three process technologies; the results are shown in Figure 10a–c. Based on the damage state of the resin on the fibre surface, the toughness failure between the resins indicated that the cohesion between the resins was strong. In addition, it was found that the fractured fibres of the VARTM, prepreg, and pultrusion composites were fully coated with resin, indicating that the resin possessed good wettability to the glass fibres and strong bonding between the fibre and resin. This further indicates that the interface between the fibre and resin has sufficient adhesion. When the load is transferred to the fibre layer, the resin protects not only the reinforcement material from being fixed in the proper position but also the fibre and prevents crack transmission between the fibres. Under an external force, the resin still covers the surface of the glass fibre, ensuring that the pultrusion process composite material possesses good mechanical properties.

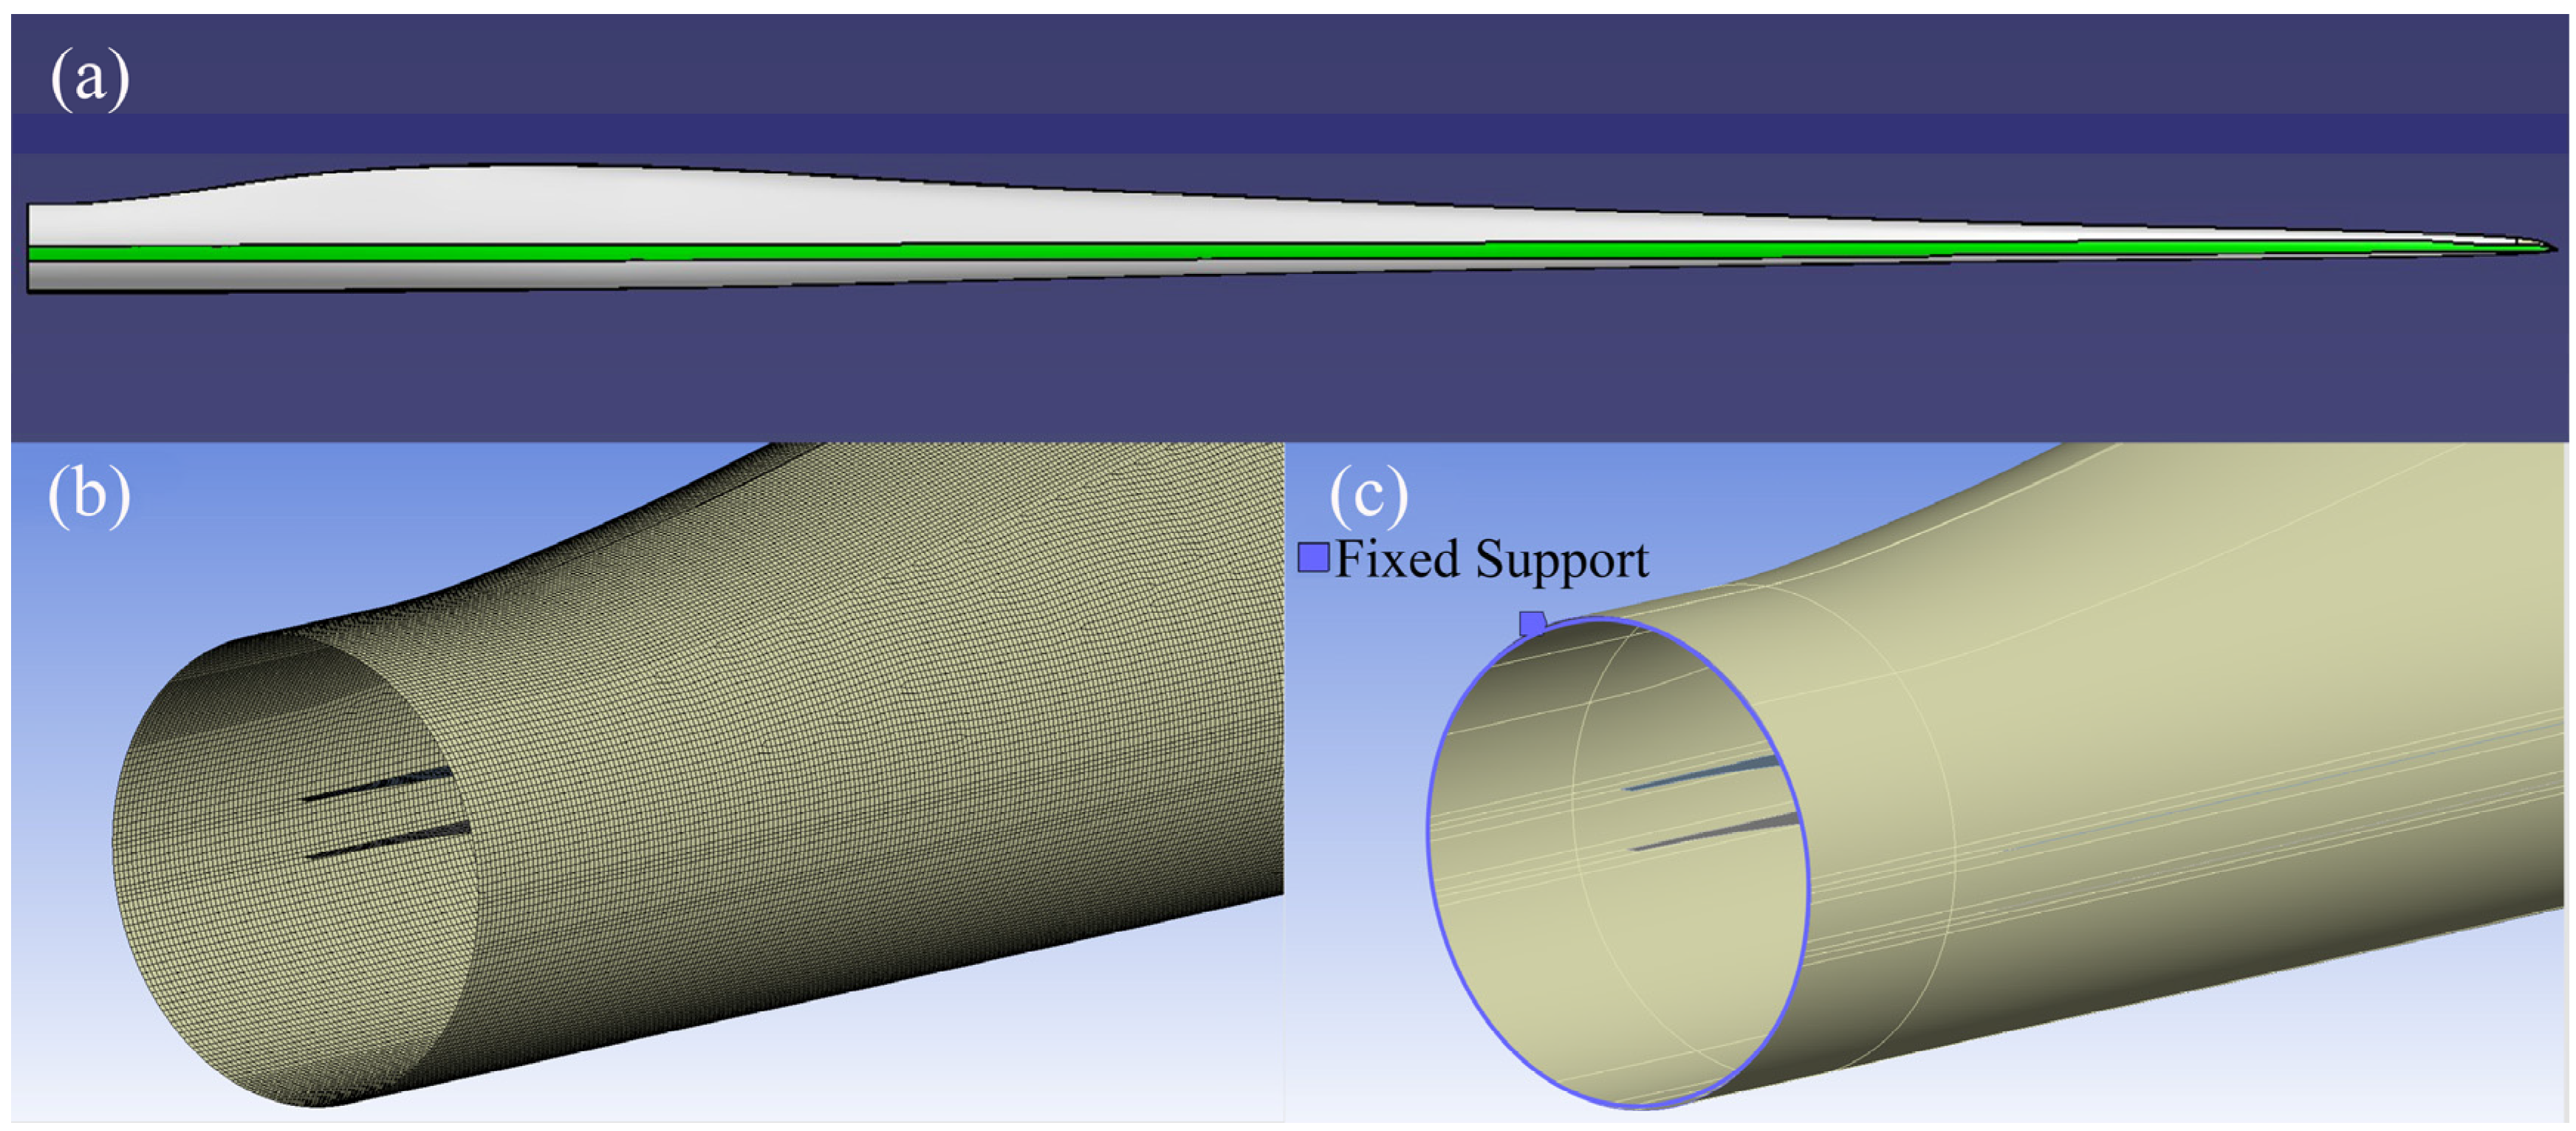
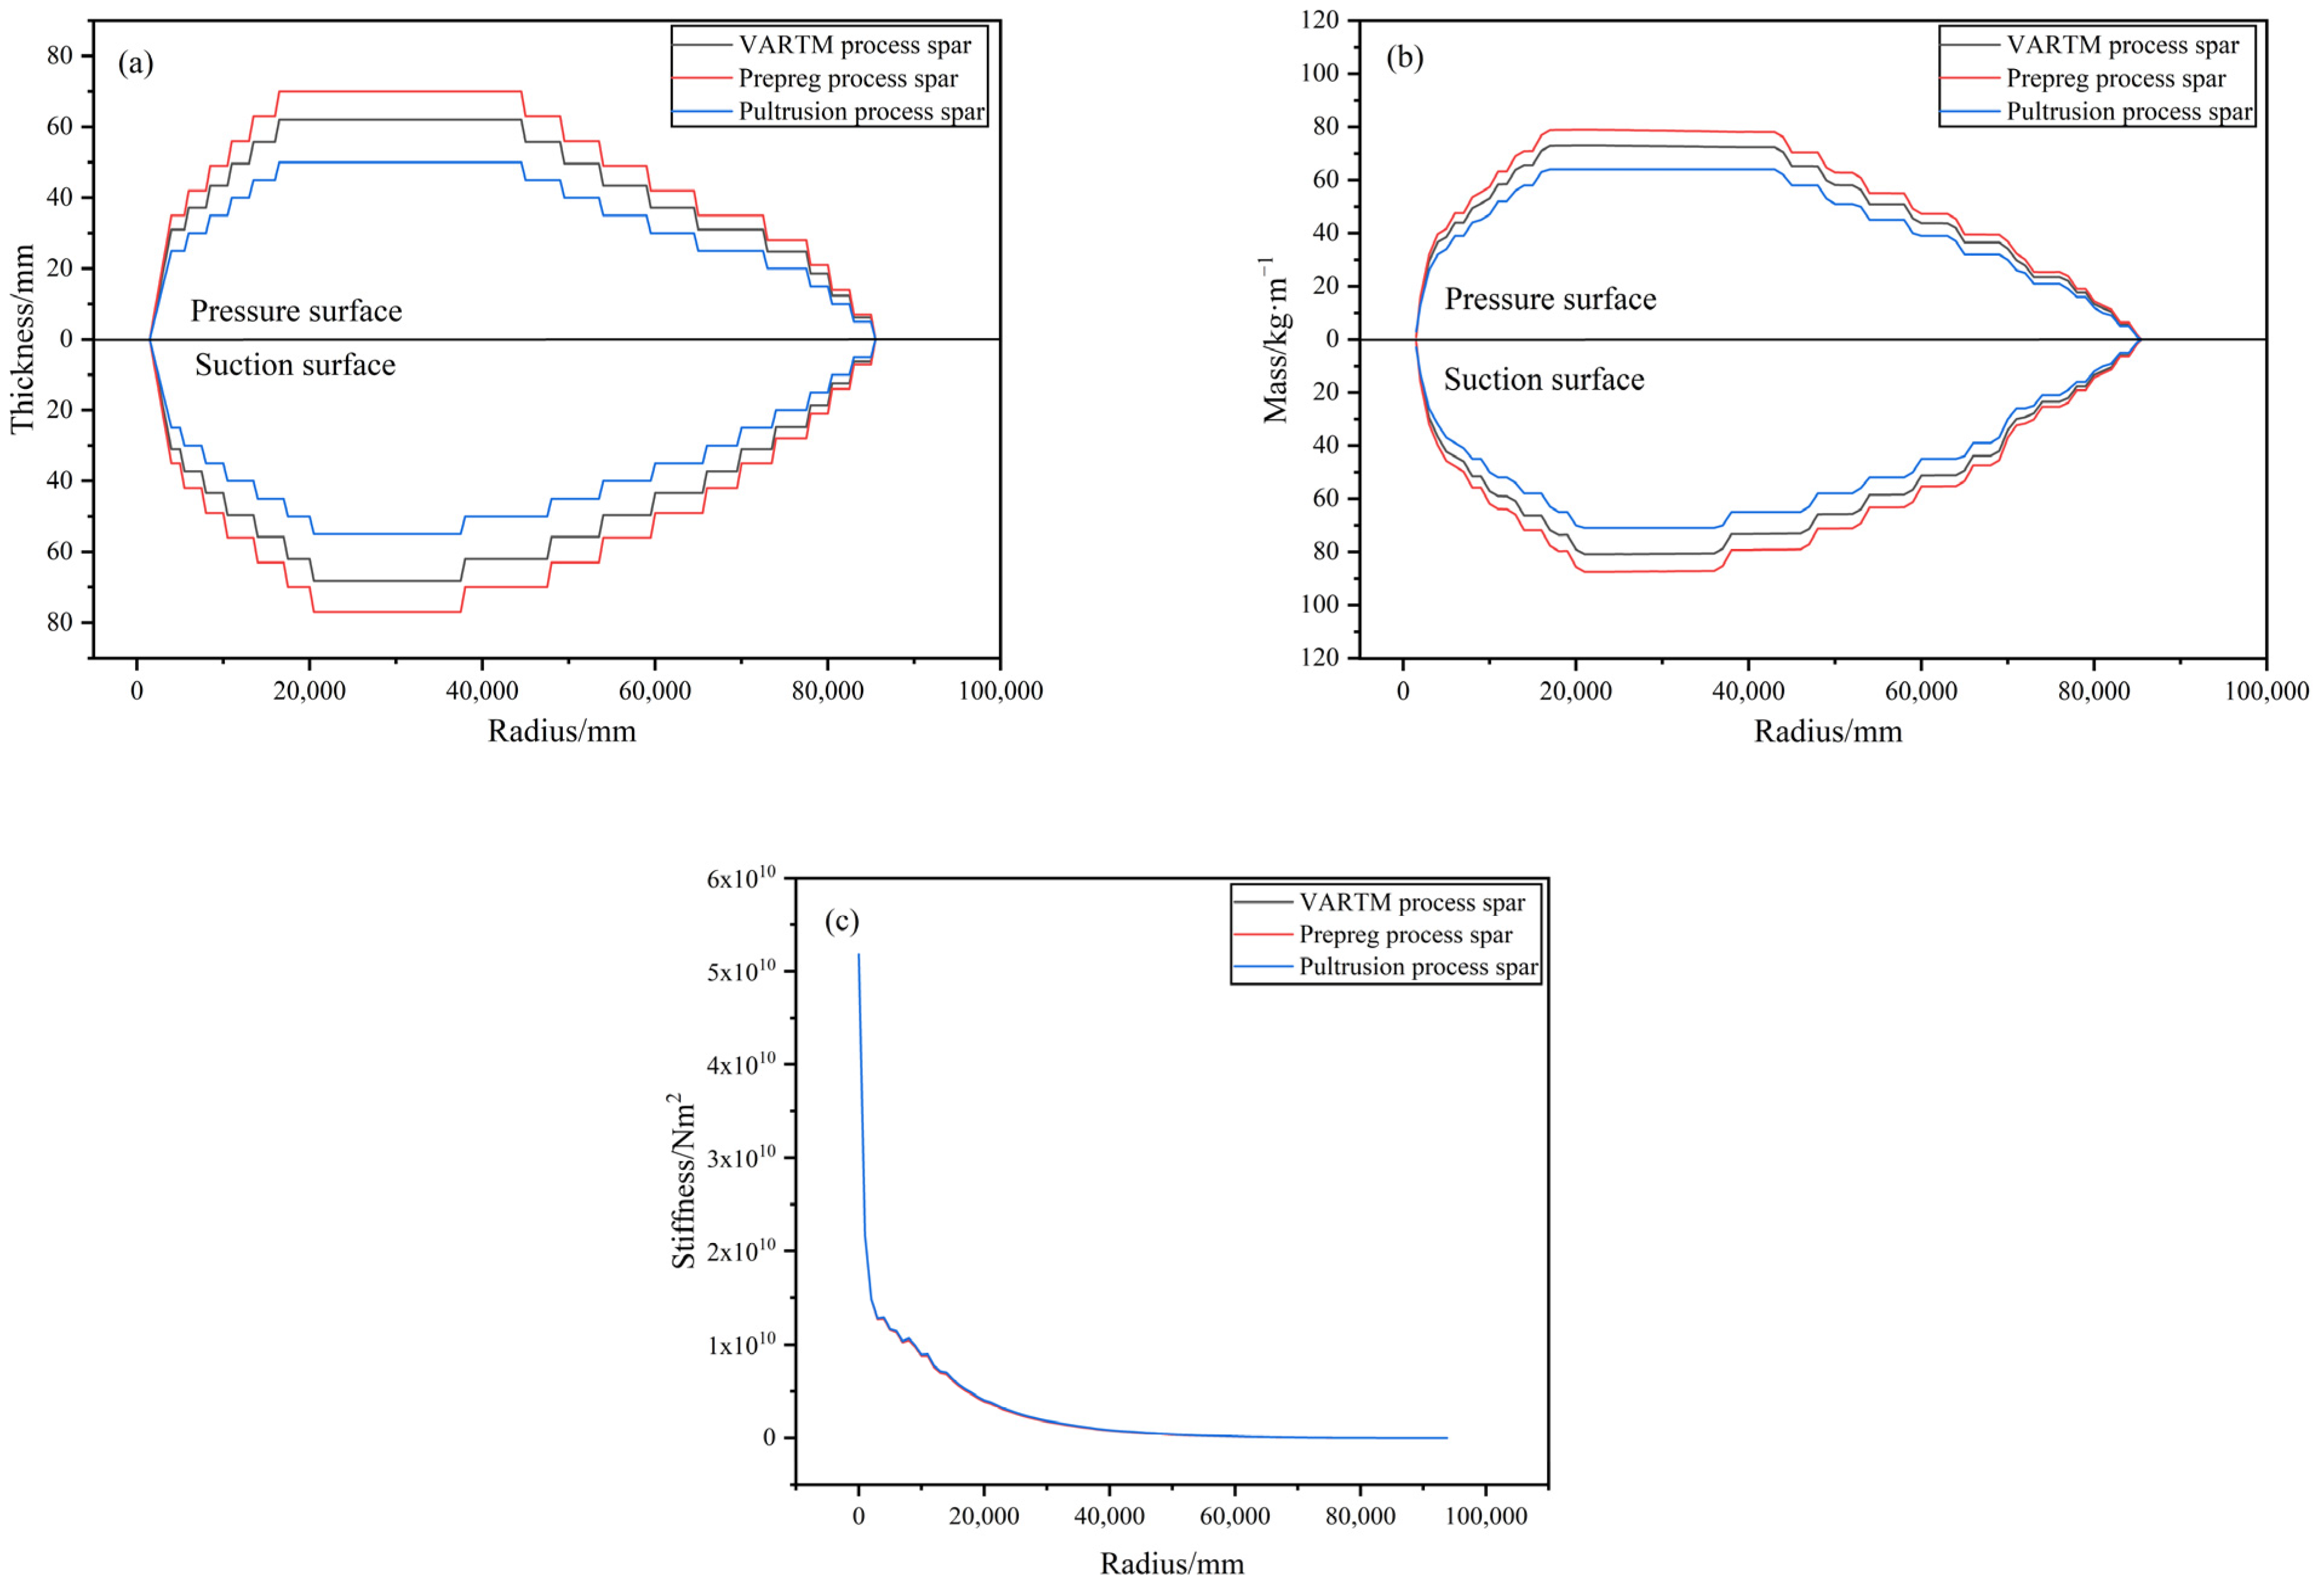
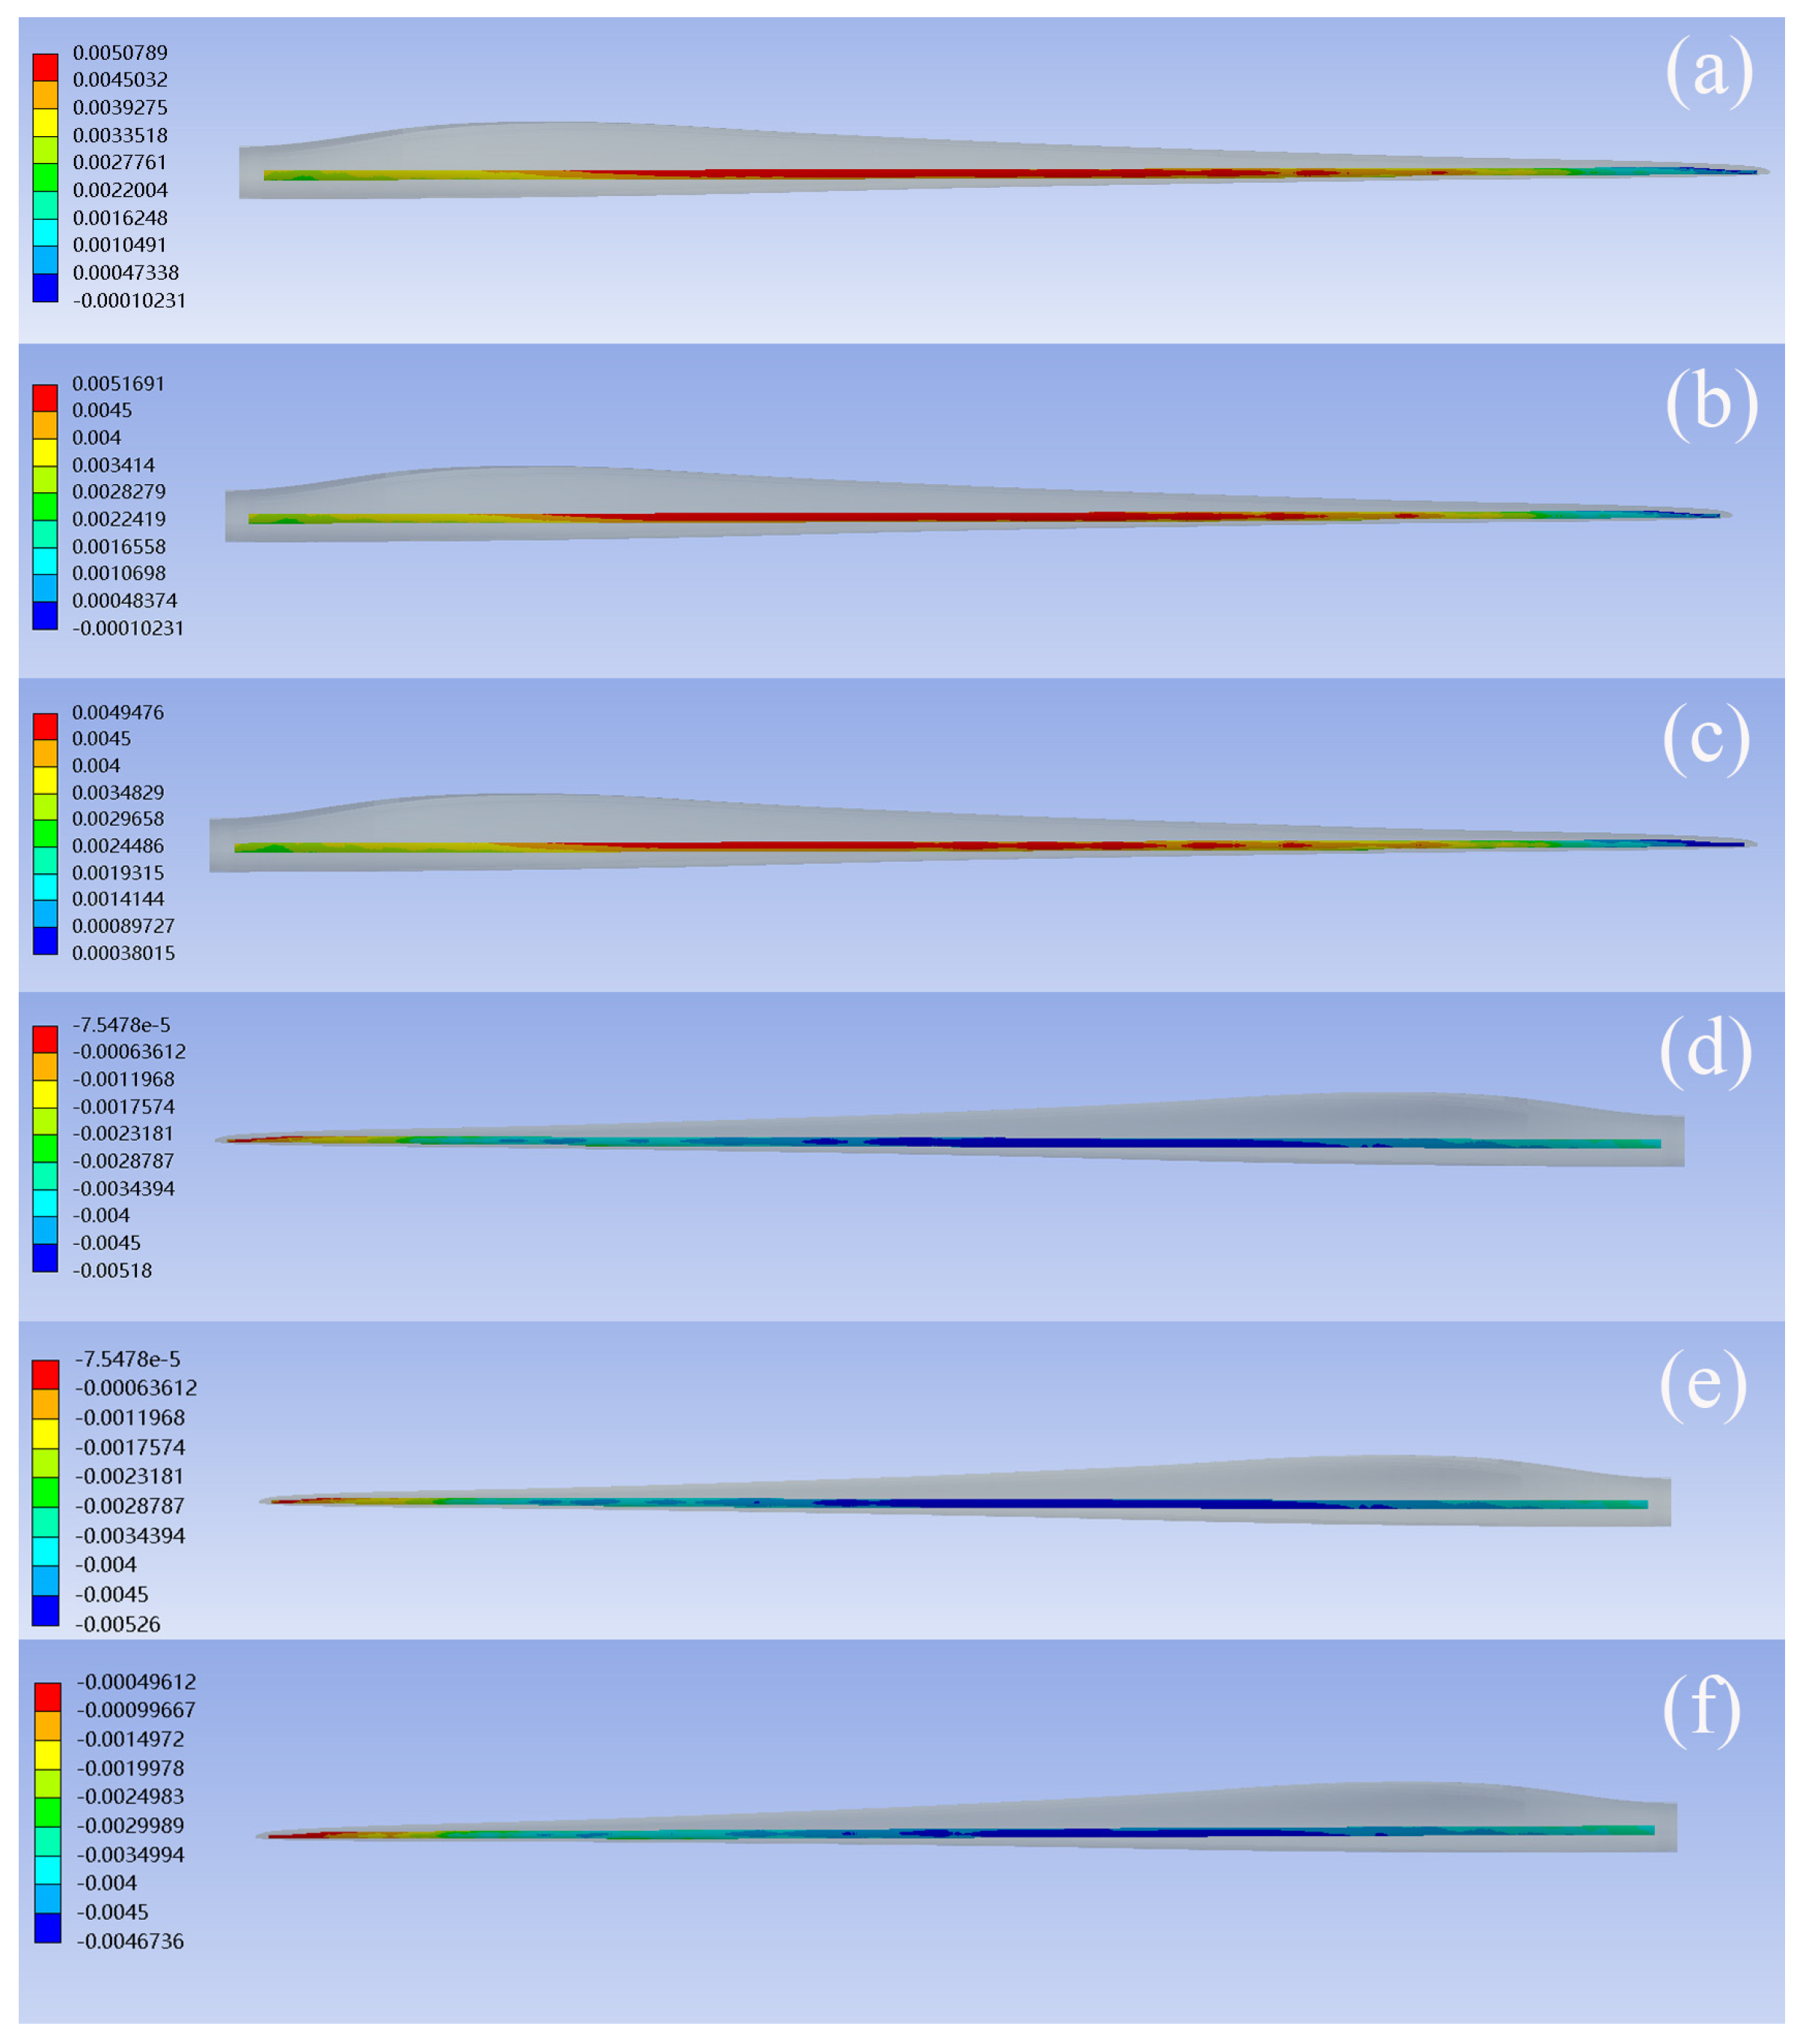
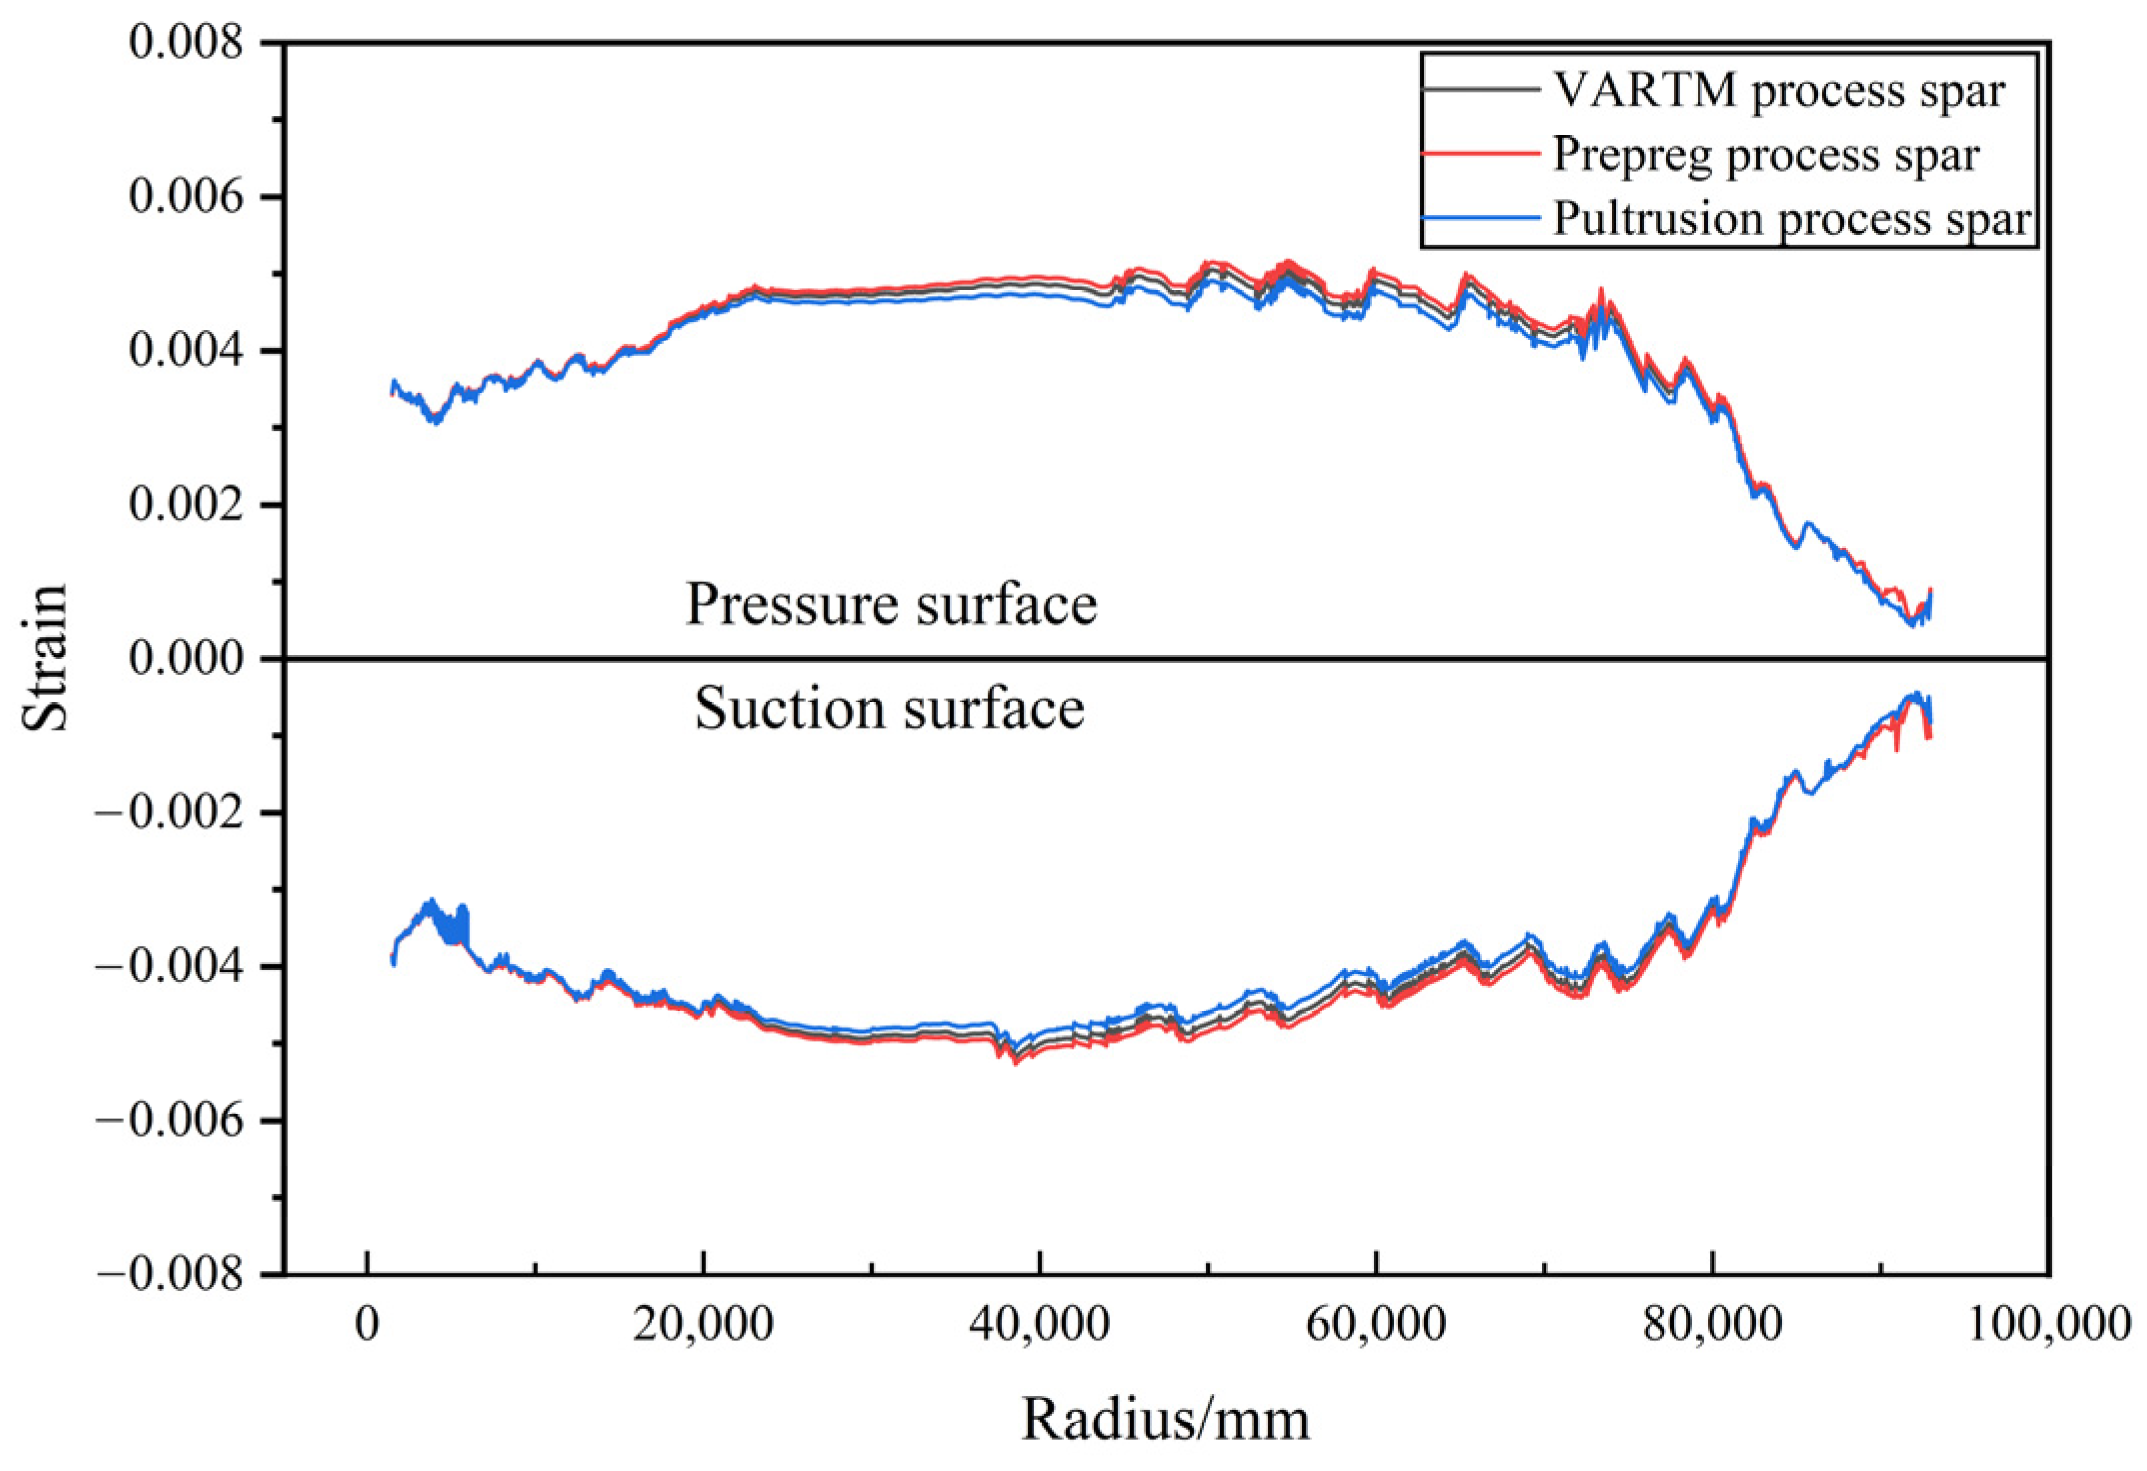
3.4. Wind Turbine Blade Design for Three Processes

The geometric shape of a 94-m blade is shown in Figure 11a (the green part shows the position of the spar cap on the pressure surface of the blade). In order to improve the bearing capacity and stiffness of the blade and reduce its weight, the 94-m blade adopts a three-web structure, and the cross-section structure is shown in Figure 1. Stiffness is a measure of the ability of an object to resist bending and deformation. Because the spar cap is the main bearing part in the flap direction of the blade, it must satisfy the design requirements of anti-bending and anti-deformation. In this study, the principle of equal-rigidity substitution was followed for spar caps under different process technologies.
The stiffness of the spar cap of a 94-m blade profile was calculated as follows:
k = E A L
where E, A, and L are the elastic modulus, cross-sectional area of the spar cap, and the spar cap length, respectively.
In this study, the finite element software Ansys (2021 R2) was used to simulate a 94-m blade. The local meshes of the blade are shown in Figure 11b, and the mesh size of the blade model was approximately 50 mm. The number of meshes and nodes was 395,114 and 399,920. All shell meshes were assigned SHELL181. In Ansys, the aerodynamic load on the blade was simplified to a concentrated force load, which was applied to the spar cap. The bending moment load is the algebraic sum of the product of the concentrated force and the distance between the blade roots. As shown in Figure 11c, the “Fix support” boundary condition was applied to the blade root.
The properties of the materials used in the blade model are listed in Table 3.
The weights of the spar cap under different process technologies were compared. The ANSYS Composite PrepPost (ACP) module in the Ansys Workbench may be used for the structural lay-up of composite materials. The output data can be used for various calculations such as modal, static, fatigue, and stability analyses. Based on the principle that the stiffness of the blade spar cap is equal, the blade spar cap structures of the three different process technologies were programmed in the ACP module. The mass of the spar cap of the pultrusion technology in a certain 94-m blade shape was 7965 kg. According to the principle of equal-rigidity substitution, from Equation (4) and Figure 6, it can be inferred that the pultrusion spar cap can be replaced by a VARTM (or prepreg) spar cap of equal length and a mass of 9170 (or 9942) kg, indicating a corresponding increase of 15.1 (or 24.8) %, equivalent to the result of the finite element lay-up simulation. Figure 12 shows the thickness and mass distribution of a 94-m blade spar cap. The damping stiffness distribution of each section of the blade, calculated using the finite element method, is shown in the figure. This value satisfies the principle of equal stiffness.
The spar caps of VARTM, prepreg, and pultrusion process technologies were simulated using the finite element method. The strain cloud image is depicted in Figure 13, and a comparison of the strain distribution at different positions on the spar cap is presented in Figure 14.
As shown in Figure 14, the maximum tensile strains of the spar caps from the VARTM, prepreg, and pultrusion process technologies on the pressure surface were 0.005079, 0.005169, and 0.004947, respectively, and the positions for all three process technologies were at 54352 mm in the axial direction (blade root point to blade tip). The maximum compressive strains on the suction surface for the VARTM, prepreg, and pulsation processes were −0.00518, −0.00526, and −0.004673, respectively, and the positions were at 38550 mm in the axial direction (blade root point to blade tip). The comparison of the strain of the spar cap in the three process technologies indicates that the higher the elastic modulus of the composite material, the smaller the thickness of the spar cap required by the blade and, consequently, the lower the corresponding strain value under equal-rigidity substitution.

4. Conclusions

The composite materials prepared via VARTM, prepreg, and pultrusion were systematically tested and compared. In addition, finite element simulation analysis of the spar cap under different processes was performed using Ansys. The following main conclusions were drawn:
(1)
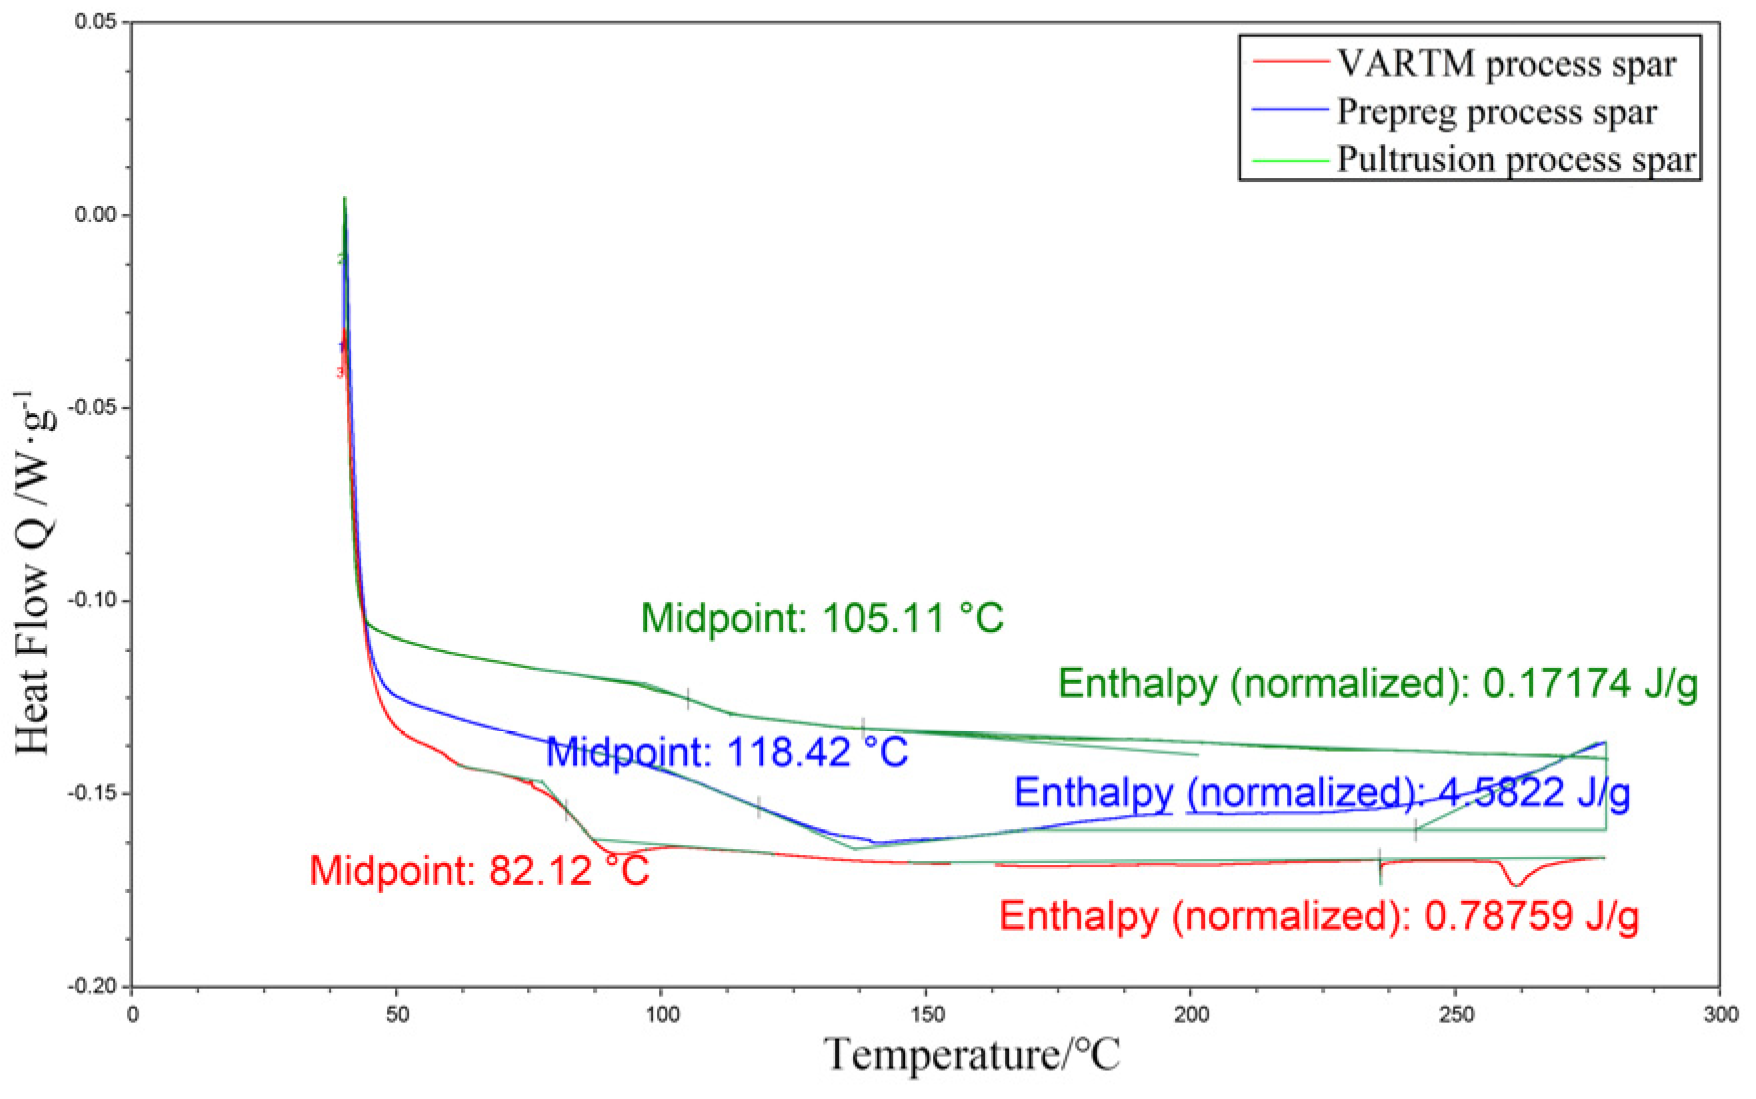
Compared with VARTM and prepreg, the fibres of pultrusion were uniformly distributed and dense, as indicated by the SEM results. Through DSC and DMA analysis, the pultrusion process exhibits a higher Tg value and a higher energy storage modulus at high temperatures compared with those of VARTM and prepreg processes.
(2)
The fibre weight contents of the VARTM, prepreg, and pultrusion composites were 75.14%, 69.72%, and 84.98%, respectively. The fibre weight content of the VARTM and pultrusion composites was higher by 7.8% and 21.9%, respectively, compared with that of the prepreg samples.
(3)
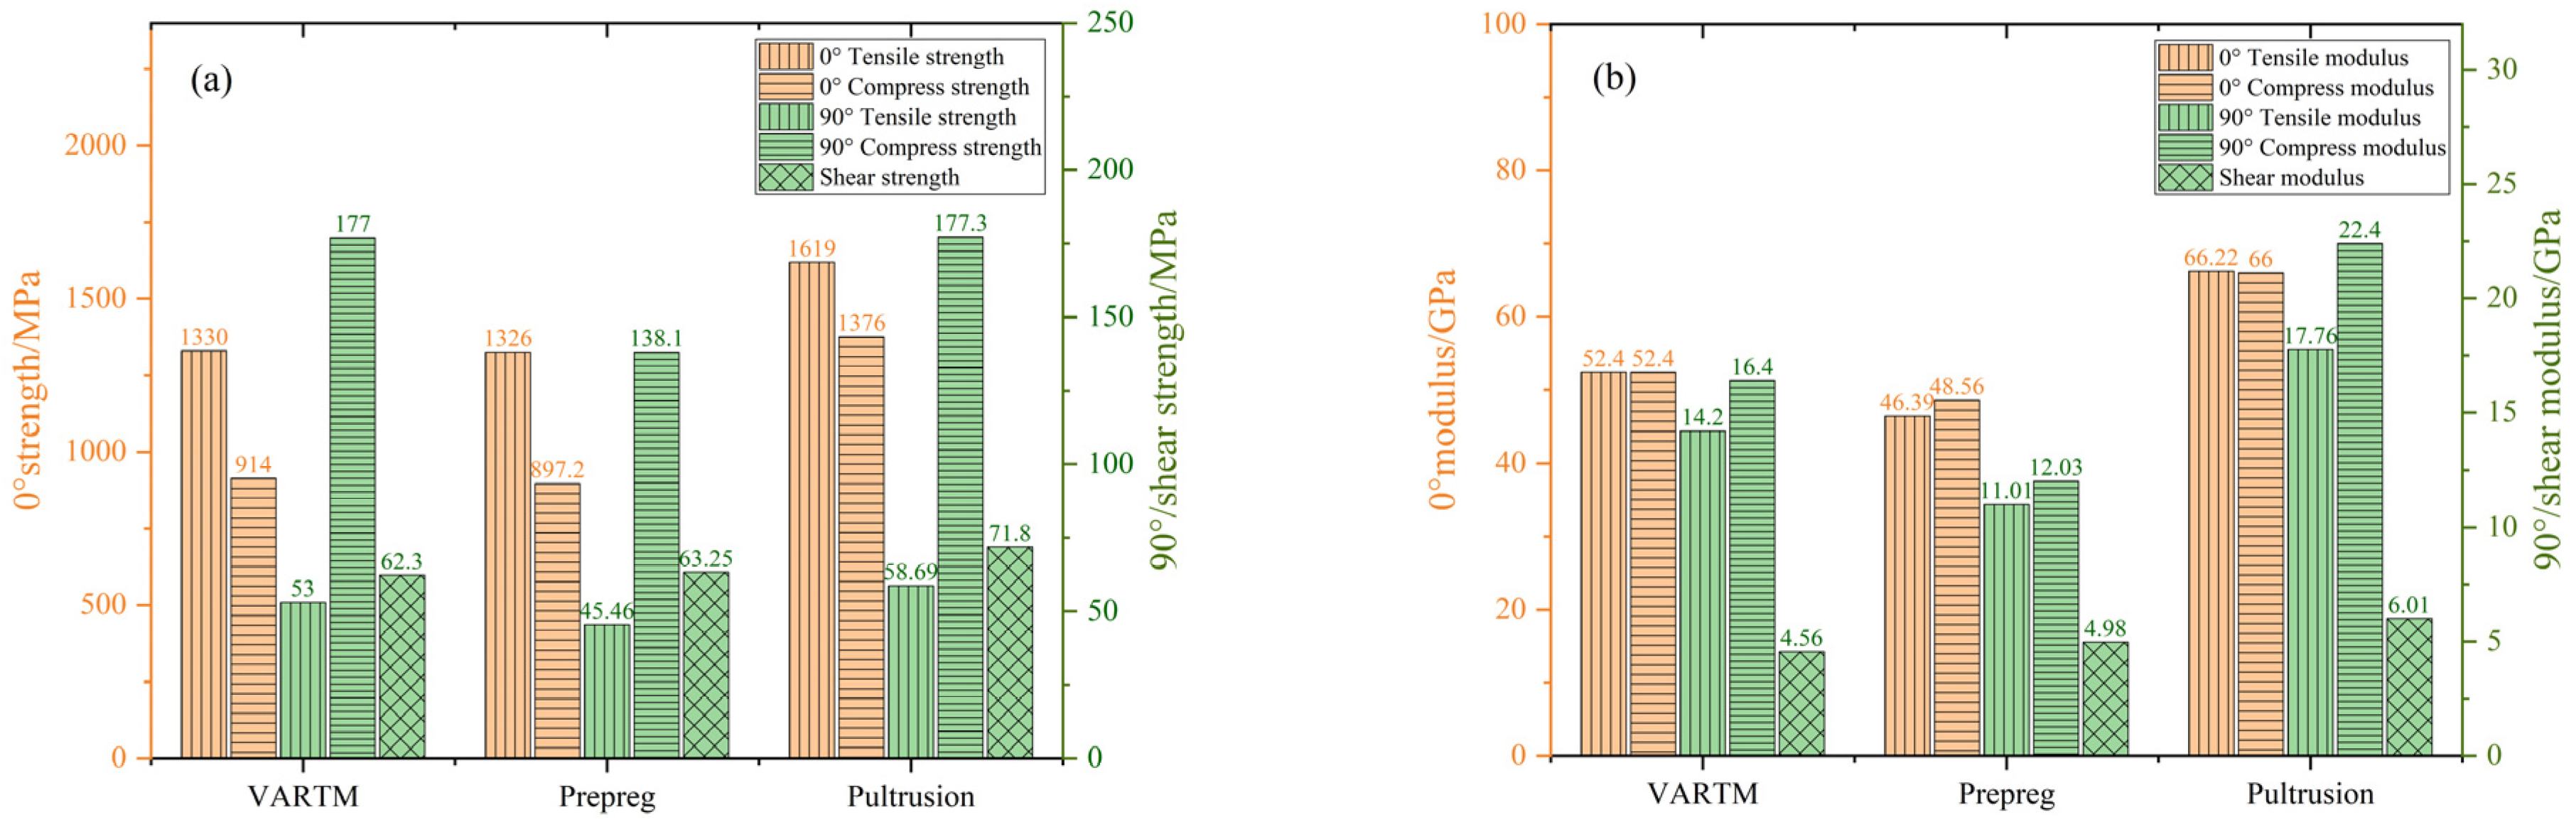
Under the same yarn-grade S-glass conditions, the 0° tensile modulus of the VARTM, prepreg, and pultrusion composites were 52.4, 46.39, and 66.2 GPa, respectively. The 0° tensile modulus of the VARTM and pultrusion composites were higher by 13.0% and 42.7%, respectively, compared to those of the prepreg samples.
(4)
Under equal stiffness, the spar cap weight of a 94-m blade under the pultrusion process was 7965 kg, while those of the VARTM and prepreg processes were 9170 and 9942 kg, respectively, indicating an increase of 15.1% and 24.8%, respectively.

5. Research Limitations and Future Work

Although the three process composites were compared and the pultrusion process composites were shown to have good applicability in terms of lightweight and large-scale manufacturability, they all employed S-glass fibre of the same level. E-glass and H-glass fibres were not compared. Additionally, there was also no comparison involving carbon fibre used in larger blades. Subsequent comparisons can include carbon fibre to obtain more comprehensive data.

Author Contributions

Conceptualization and methodology, C.H.; software, validation, formal analysis and investigation, data curation, writing—original draft preparation, Y.S.; writing—review and editing, J.L. All authors have read and agreed to the published version of the manuscript.

Funding

This research received no external funding.

Data Availability Statement

Data is contained within the article.

Acknowledgments

The authors extend their heartfelt gratitude to Weiguang Xing, Yihang Qu, Peiyu Qi, Huawei Liu and Wang Xia from Aeolon Technology Co., Ltd. for their invaluable technical assistance and support.

Conflicts of Interest

Authors Yuanrong Sun and Congli Hu were employed by the company Aeolon Technology Co., Ltd. The remaining authors declare that the research was conducted in the absence of any commercial or financial relationships that could be construed as a potential conflict of interest.

Nomenclature

SymbolDescription
VARTMVacuum-assisted resin transfer moulding
HLUHand lay-up
SEMScanning electron microscopy
DMADynamic mechanical analysis
DSCDifferential scanning calorimetry
TGAThermogravimetric analysis
HLUHand lay-up
SmaxThe maximum stress
SminThe minimum stress
CNCComputer numerical control
ACPAnsys Composite PrepPost

References

  1. Singh, U.; Rizwan, M.; Malik, H.; García Márquez, F.P. Wind Energy Scenario, Success and Initiatives towards Renewable Energy in India—A Review. Energies 2022, 15, 2291. [Google Scholar] [CrossRef]
  2. Dupré la Tour, M.-A. Photovoltaic and Wind Energy Potential in Europe—A Systematic Review. Renew. Sust. Energ. Rev. 2023, 179, 113189. [Google Scholar] [CrossRef]
  3. Chaudhuri, A.; Datta, R.; Kumar, M.P.; Davim, J.P.; Pramanik, S. Energy Conversion Strategies for Wind Energy System: Electrical, Mechanical and Material Aspects. Materials 2022, 15, 1232. [Google Scholar] [CrossRef] [PubMed]
  4. Hutchinson, M.; Zhao, F. Global Wind Report 2023; GWEC: Brussels, Belgium, 2023. [Google Scholar]
  5. He, Y.; Wang, Y.; Zhou, H.; Li, C.; Zhang, L.; Zhang, Y. Research on Mechanical Properties and Damage Evolution of Pultruded Sheet for Wind Turbine Blades. Materials 2022, 15, 5719. [Google Scholar] [CrossRef] [PubMed]
  6. Jureczko, M.; Mrówka, M. Multiobjective Optimization of Composite Wind Turbine Blade. Materials 2022, 15, 4649. [Google Scholar] [CrossRef] [PubMed]
  7. Adolphs, G.; Skinner, C. Non-Crimp Fabric Composites in Wind Turbines; OCV Technical Fabrics: Zele, Belgium, 2011; pp. 481–493. [Google Scholar]
  8. Choudhary, M.; Sharma, A.; Dwivedi, M.; Patnaik, A. A Comparative Study of the Physical, Mechanical and Thermo-mechanical Behavior of GFRP Composite Based on Fabrication Techniques. Fibers Polym. 2019, 20, 823–831. [Google Scholar] [CrossRef]
  9. Li, C.; Yang, C.; Ni, A.; Wang, J.; Song, Q. Application and Development of Composite Materials in Large-Scale Wind Turbine Blade. Acta Mater. Compos. Sin. 2023, 3, 1274–1284. [Google Scholar]
  10. Ennis, B.L.; Das, S.; Norris, R.E. Economic Competitiveness of Pultruded Fiber Composites for Wind Turbine Applications. Compos. Part B Eng. 2023, 265, 110960. [Google Scholar] [CrossRef]
  11. Pilawka, R.; Osiewicz-Powezka, M.; Hankus, H. Prepregs Based on Epoxy Resin as a Repair Material for Wind Turbine Blades. Przem. Chem. 2021, 4, 353–355. [Google Scholar]
  12. Budelmann, D.; Schmidt, C.; Meiners, D. Adhesion-Cohesion Balance of prepreg tack in thermoset automated fibre placement. Part 1: Adhesion and surface wetting. Compos. Part C Open Access 2021, 6, 100204. [Google Scholar] [CrossRef]
  13. Wolff-Fabris, F.; Lengsfeld, H.; Kramer, J. 2. Prepregs and their precursors. In Composite Technology, 2nd ed.; Lengsfeld, H., Lacalle, J., Neumeyer, T., Altstadt, V., Eds.; Hanser Publications: Munich, Germany, 2021; pp. 11–30. [Google Scholar]
  14. Song, Q.; Jia, Z.; Gao, K. Study on mechanical properties and process performance of domestic carbon fiber prepregs for wind turbine blade. J. Fiber Reinforced Plastics/Composites 2016, 2, 40–46. [Google Scholar]
  15. Grujicic, M.; Arakere, G.; Pandurangan, B. Multidisciplinary Design Optimization for Glass-Fiber Epoxy-Matrix Composite 5 MW Horizontal-Axis Wind-Turbine Blades. J. Mater. Eng. Perform 2010, 8, 1116–1127. [Google Scholar] [CrossRef]
  16. Ma, L.; Mehta, R.; Athreya, S.R.; Barpanda, D.; Shafi, A. Composite Processing Modeling for Wind Turbine Blade Applications. SAMPE J. 2017, 6, 34–44. [Google Scholar]
  17. Kim, S.O.; Seong, D.G.; Um, M.K.; Choi, J.H. Experimental and Phenomenological Modeling Studies on Variation of Fibre Volume Fraction During Resin Impregnation in VARTM. Compos. Res. 2015, 6, 340–347. [Google Scholar] [CrossRef]
  18. Gao, Q.; Xin, H.; Zhang, Y. Experimental Investigation on Transverse Tension-Tension Fatigue Behavior of Pultruded Glass-Fibre Reinforced Polymer (GFRP) Unidirectional Lamina. Constr. Build. Mater. 2023, 399, 132527. [Google Scholar] [CrossRef]
  19. Vedernikov, A.; Safonov, A.; Tucci, F.; Carlone, P.; Akhatov, I. Pultruded materials and structures: A review. J. Compos. Mater. 2020, 54, 4081–4117. [Google Scholar] [CrossRef]
  20. ISO 527-5:2021; Plastics Determination of Tensile Properties Part 5: Test Conditions for Unidirectional Fibre-Reinforced Plastic Composites. International Organization for Standardization (ISO): Geneva, Switzerland, 2021.
  21. ISO 14126:2023; Fibre-Reinforced Plastic Composites Determination of Compressive Properties in the In-Plane Direction. International Organization for Standardization (ISO): Geneva, Switzerland, 2023.
  22. ASTM D7078/D7078M-20e1; Standard Test Method for Shear Properties of Composite Materials by V-Notched Rail Shear Method. American Society for Testing Materials (ASTM): West Conshohocken, PA, USA, 2021.
  23. ISO 13003:2003; Fibre-Reinforced Plastics Determination of Fatigue Properties Under Cyclic Loading Conditions. International Organization for Standardization (ISO): Geneva, Switzerland, 2003.
  24. Struzziero, G.; Nardi, D.; Sinke, J.; Teuwen, J.J.E. Cure-Induced Residual Stresses for Warpage Reduction in Thermoset Laminates. J. Compos. Mater. 2020, 54, 3055–3065. [Google Scholar] [CrossRef]
  25. Rosemeier, M.; Lester, C.; Antoniou, A.; Fahrenson, C.; Manousides, N.; Balzani, C. Determination of As-Built Properties of Fibre Reinforced Polymers in a Wind Turbine Blade Using Scanning Electron and High-Resolution X-ray Microscopy. Compos. Part C Open Access 2022, 9, 100310. [Google Scholar] [CrossRef]
  26. ISO 1172:2023; Textile-Glass-Reinforced Plastics—Prepregs, Moulding Compounds and Laminates—Determination of the Textile-Glass and Mineral-Filler Content Using Calcination Methods. International Organization for Standardization (ISO): Geneva, Switzerland, 2023.
  27. ISO 845:2006; Cellular Plastics and Rubbers—Determination of Apparent Density. International Organization for Standardization (ISO): Geneva, Switzerland, 2006.
  28. Ghamarian, N.; Hanim, M.; Penjumras, P.; Abdul Majid, D.L.A.H. Effect of Fibre Orientation on the Mechanical Properties of Laminated Polymer Composites. In Encyclopedia of Materials: Composites; Brabazon, D., Ed.; Elsevier: Oxford, UK, 2016; pp. 746–765. [Google Scholar]
  29. Zheng, T.; Zhao, C.; He, J. Research on fatigue performance of offshore wind turbine blade with basalt fiber bionic plate. Structures 2023, 47, 466–481. [Google Scholar] [CrossRef]
  30. Beura, S.; Chakraverty, A.P.; Thatoi, D.N.; Mohanty, U.K.; Mohapatra, M. Failure Modes in GFRP Composites Assessed with the Aid of SEM Fractographs. Mater. Today Proc. 2021, 41, 172–179. [Google Scholar] [CrossRef]
Figure 1. Blade structure.
Energies 17 01149 g001
Figure 2. Three composite materials were manufactured from (a) VARTM, (b) prepreg, and (c) pultrusion.
Energies 17 01149 g002
Figure 3. Scanning electron microscopy (SEM) images with 100 times magnification of the end faces of composite materials from (a) VARTM, (b) pre-preg, and (c) pultrusion; SEM images of (d) VARTM, (e) prepreg, and (f) pultrusion composites with face magnification of 1000 times.
Energies 17 01149 g003
Figure 4. Comparison of energy storage modulus (E′), loss modulus (E″) and phase angle (tanð) of (a) VARTM, (b) prepreg, and (c) pultrusion process composites.
Energies 17 01149 g004
Figure 5. Differential scanning calorimetry (DSC) analysis of three process composites: VARTM, prepreg, and pultrusion.
Energies 17 01149 g005
Figure 6. Static strength (a) modulus (b) test results of composites of different process technologies.
Energies 17 01149 g006
Figure 7. VARTM (a), prepreg (b), and pultrusion (c) tensile fatigue failure modes of process composite specimens.
Energies 17 01149 g007
Figure 8. S–N curves of tensile fatigue of composites from VARTM, prepreg, and pultrusion processes.
Energies 17 01149 g008
Figure 9. Tensile specimens of composite materials from (a) VARTM, (b) prepreg, and (c) pultrusion processes before their failure. Tensile specimens of (d) VARTM, (e) prepreg, and (f) pultrusion composites after they were destroyed.
Energies 17 01149 g009
Figure 10. Scanning electron microscopy (SEM) images of tensile specimens of (a) VARTM, (b) prepreg, and (c) pultrusion composites after failure.
Energies 17 01149 g010
Figure 11. (a) Geometry shape of a 94-m blade, (b) The local meshes of the blade, (c) Fixed Support at the blade root.
Energies 17 01149 g011
Figure 12. (a) Comparison diagram of thickness distribution of blade spar cap; (b) Comparison diagram of mass distribution of blade spar cap; (c) Blade brandishing stiffness distribution comparison diagram.
Energies 17 01149 g012
Figure 13. Strain cloud images of the three processes. In addition, strain cloud images of the spar caps on the pressure surface from (a) VARTM, (b) prepreg, and (c) pultrusion processes; Strain cloud images of the spar caps on the suction surface from (d) VARTM, (e) prepreg, and (f) pultrusion processes.
Energies 17 01149 g013
Figure 14. Maximum tensile strain of the spar caps of three processes.
Energies 17 01149 g014
Table 1. Characteristics and main mechanical property of three-process composites.
Process
Technology
Fibre Mass Weight Content %0° Tensile Modulus Density
Test Value
%
Growth Ratio
(Equivalent to Prepreg)
Test Value
GPa
Growth Ratio (Equivalent to Prepreg)Test Value
g·cm−3
Growth Ratio (Equivalent to Prepreg)
Prepreg69.72100%43.61100%1.9178100%
VARTM75.14107.8%52.4120%1.998104%
Pultrusion84.98121.9%66.2152%2.193114%
Table 2. Tensile S–N curves of three types of process composite materials.
Fatigue PropertiesPrepreg
Process Composites
VARTM
Process Composites
Pultrusion
Process Composites
m values9.6910.208.87
107 Limit maximum stress value/MPa525.29407.57282.36
R2 value0.9830.9820.990
Table 3. The properties of the materials used in the blade model.
Fabric0° Tensile Modulus90° Tensile ModulusShear Modulus Poisson’s RatioDensity
MPaMPaMPa-g·cm−3
UD48,00013,00036000.241.960
BIAX13,50013,50013,8000.5751.960
Balsa100100300.30.325
Polyvinyl chloride8080200.30.227
Polyethylene glycol terephthalate120120150.30.222
Disclaimer/Publisher’s Note: The statements, opinions and data contained in all publications are solely those of the individual author(s) and contributor(s) and not of MDPI and/or the editor(s). MDPI and/or the editor(s) disclaim responsibility for any injury to people or property resulting from any ideas, methods, instructions or products referred to in the content.

