Comparison of the Roles of the South Korean and Japanese Electric Power Sectors in Their National Economies
Abstract
:1. Introduction
2. Materials and Methods
2.1. IO Technique as A Method
2.2. Demand-Side Model
2.3. Supply-Side Model
2.4. Price-Side Model
3. Data and Results
3.1. Reconstruction of the IO Table for the Comparative Analysis
3.2. Comparison of the Role of South Korean and Japanese EPSs in the National Economy
3.3. Production-Inducing Effects of the EPS
3.4. Value-Added Creation Effects of the EPS
3.5. Wage-Inducing Effects of the EPS
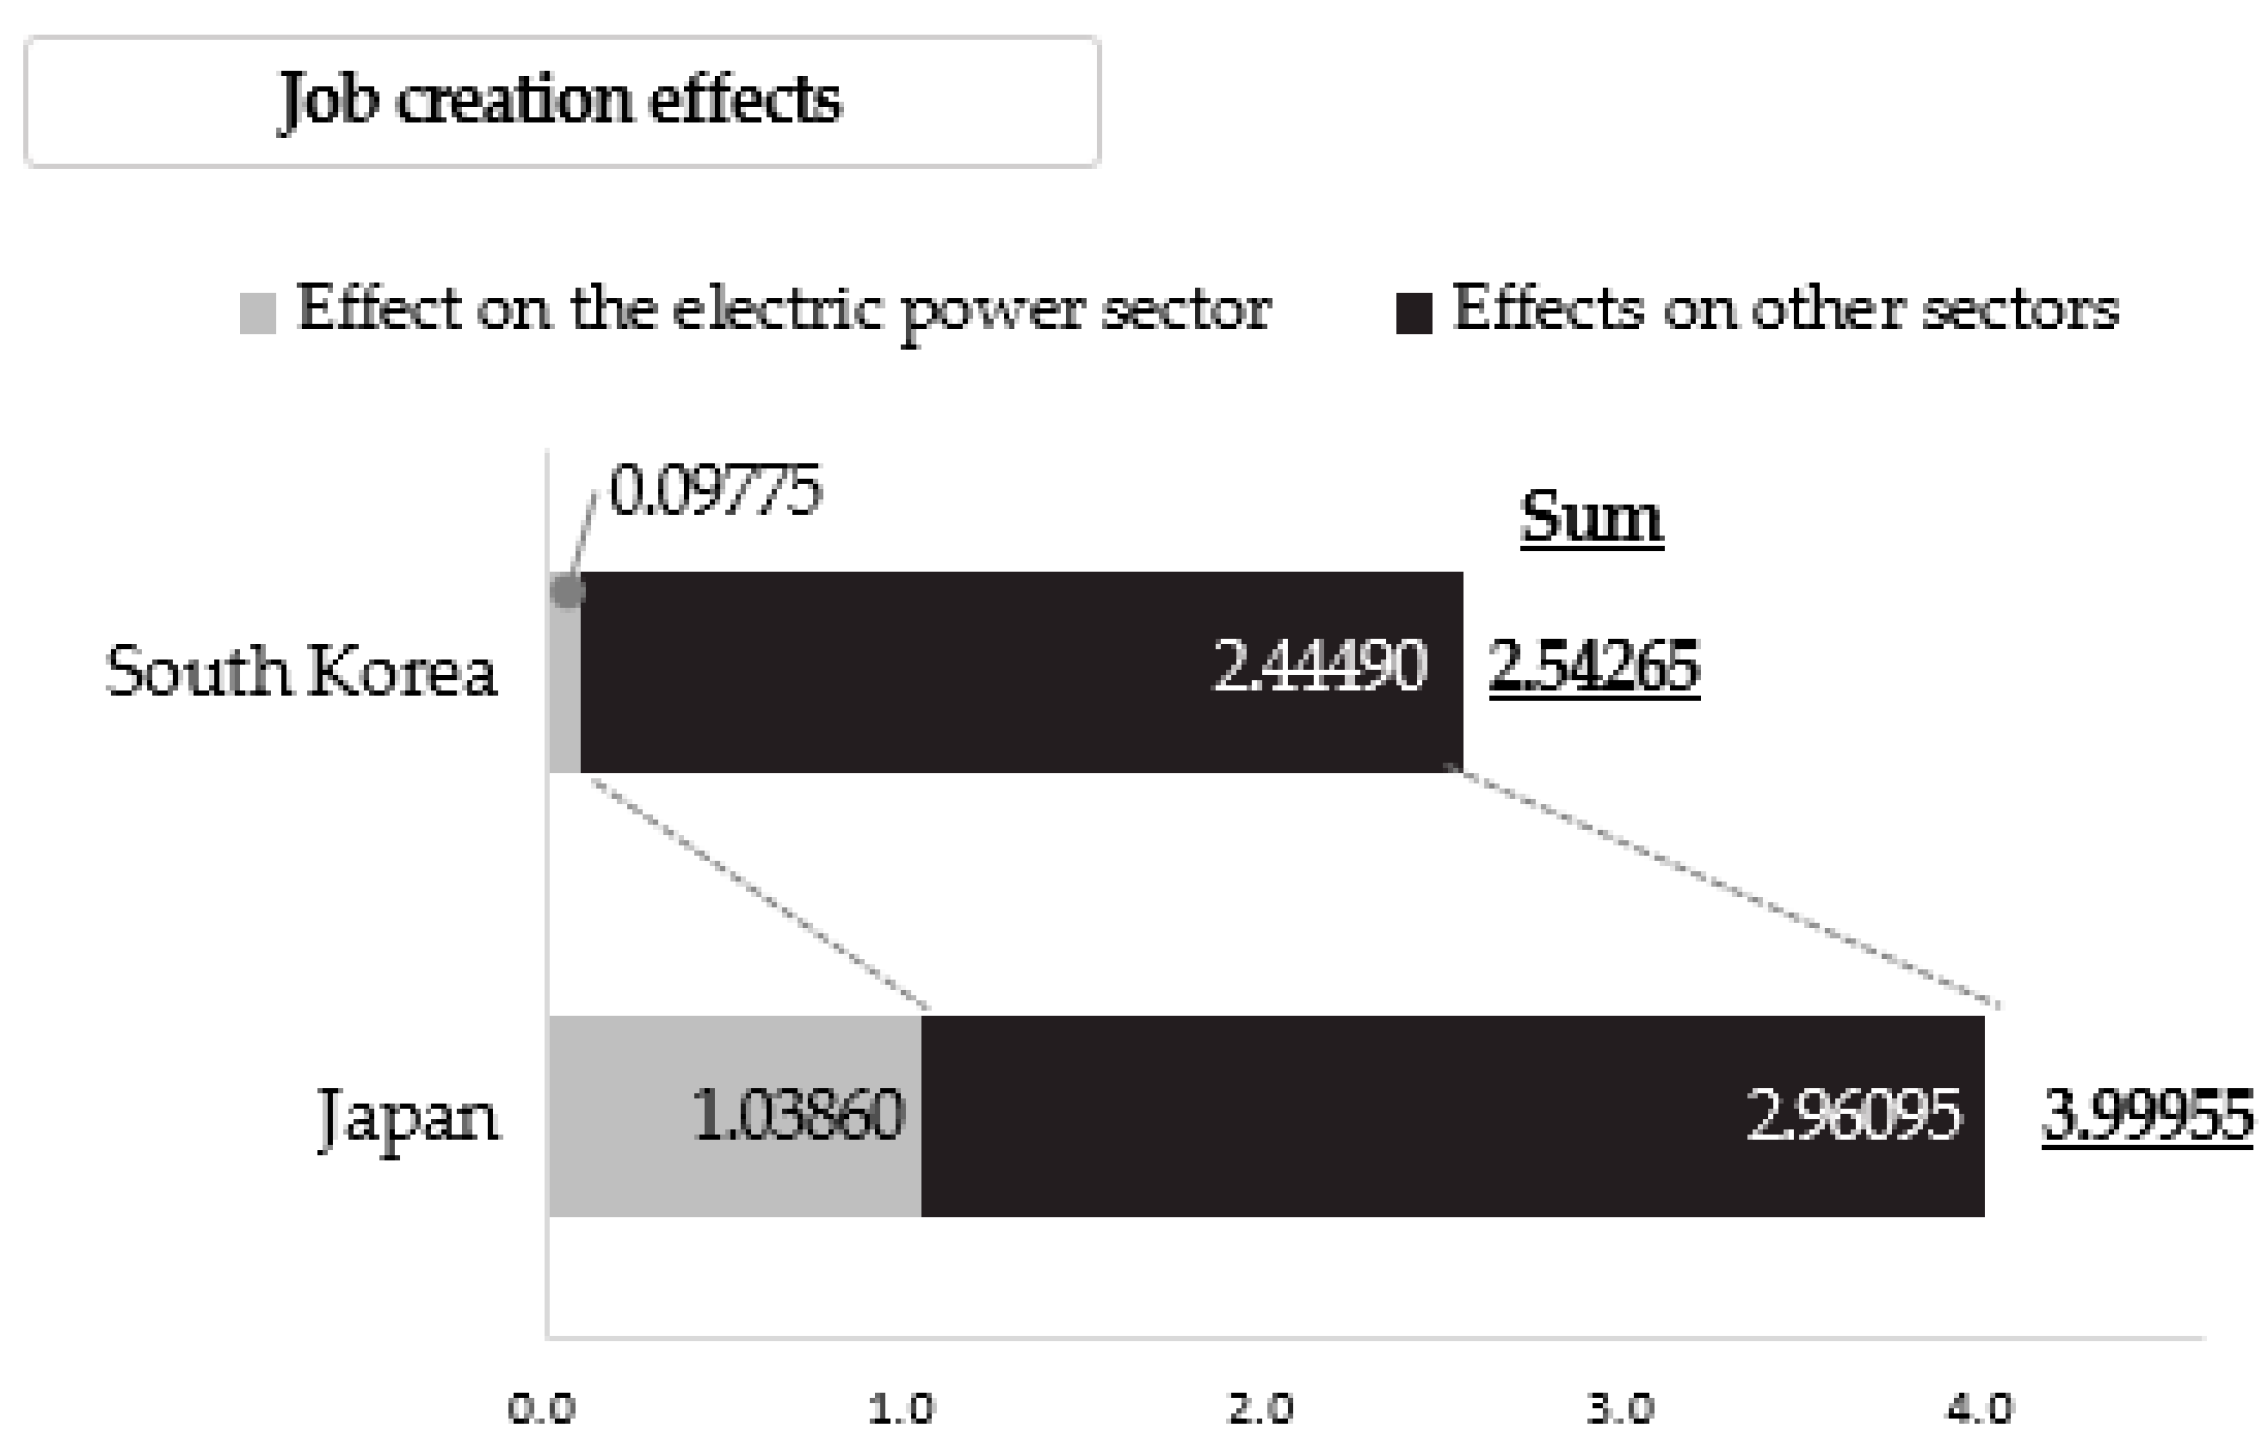
3.6. Job-Creation Effects of the EPS
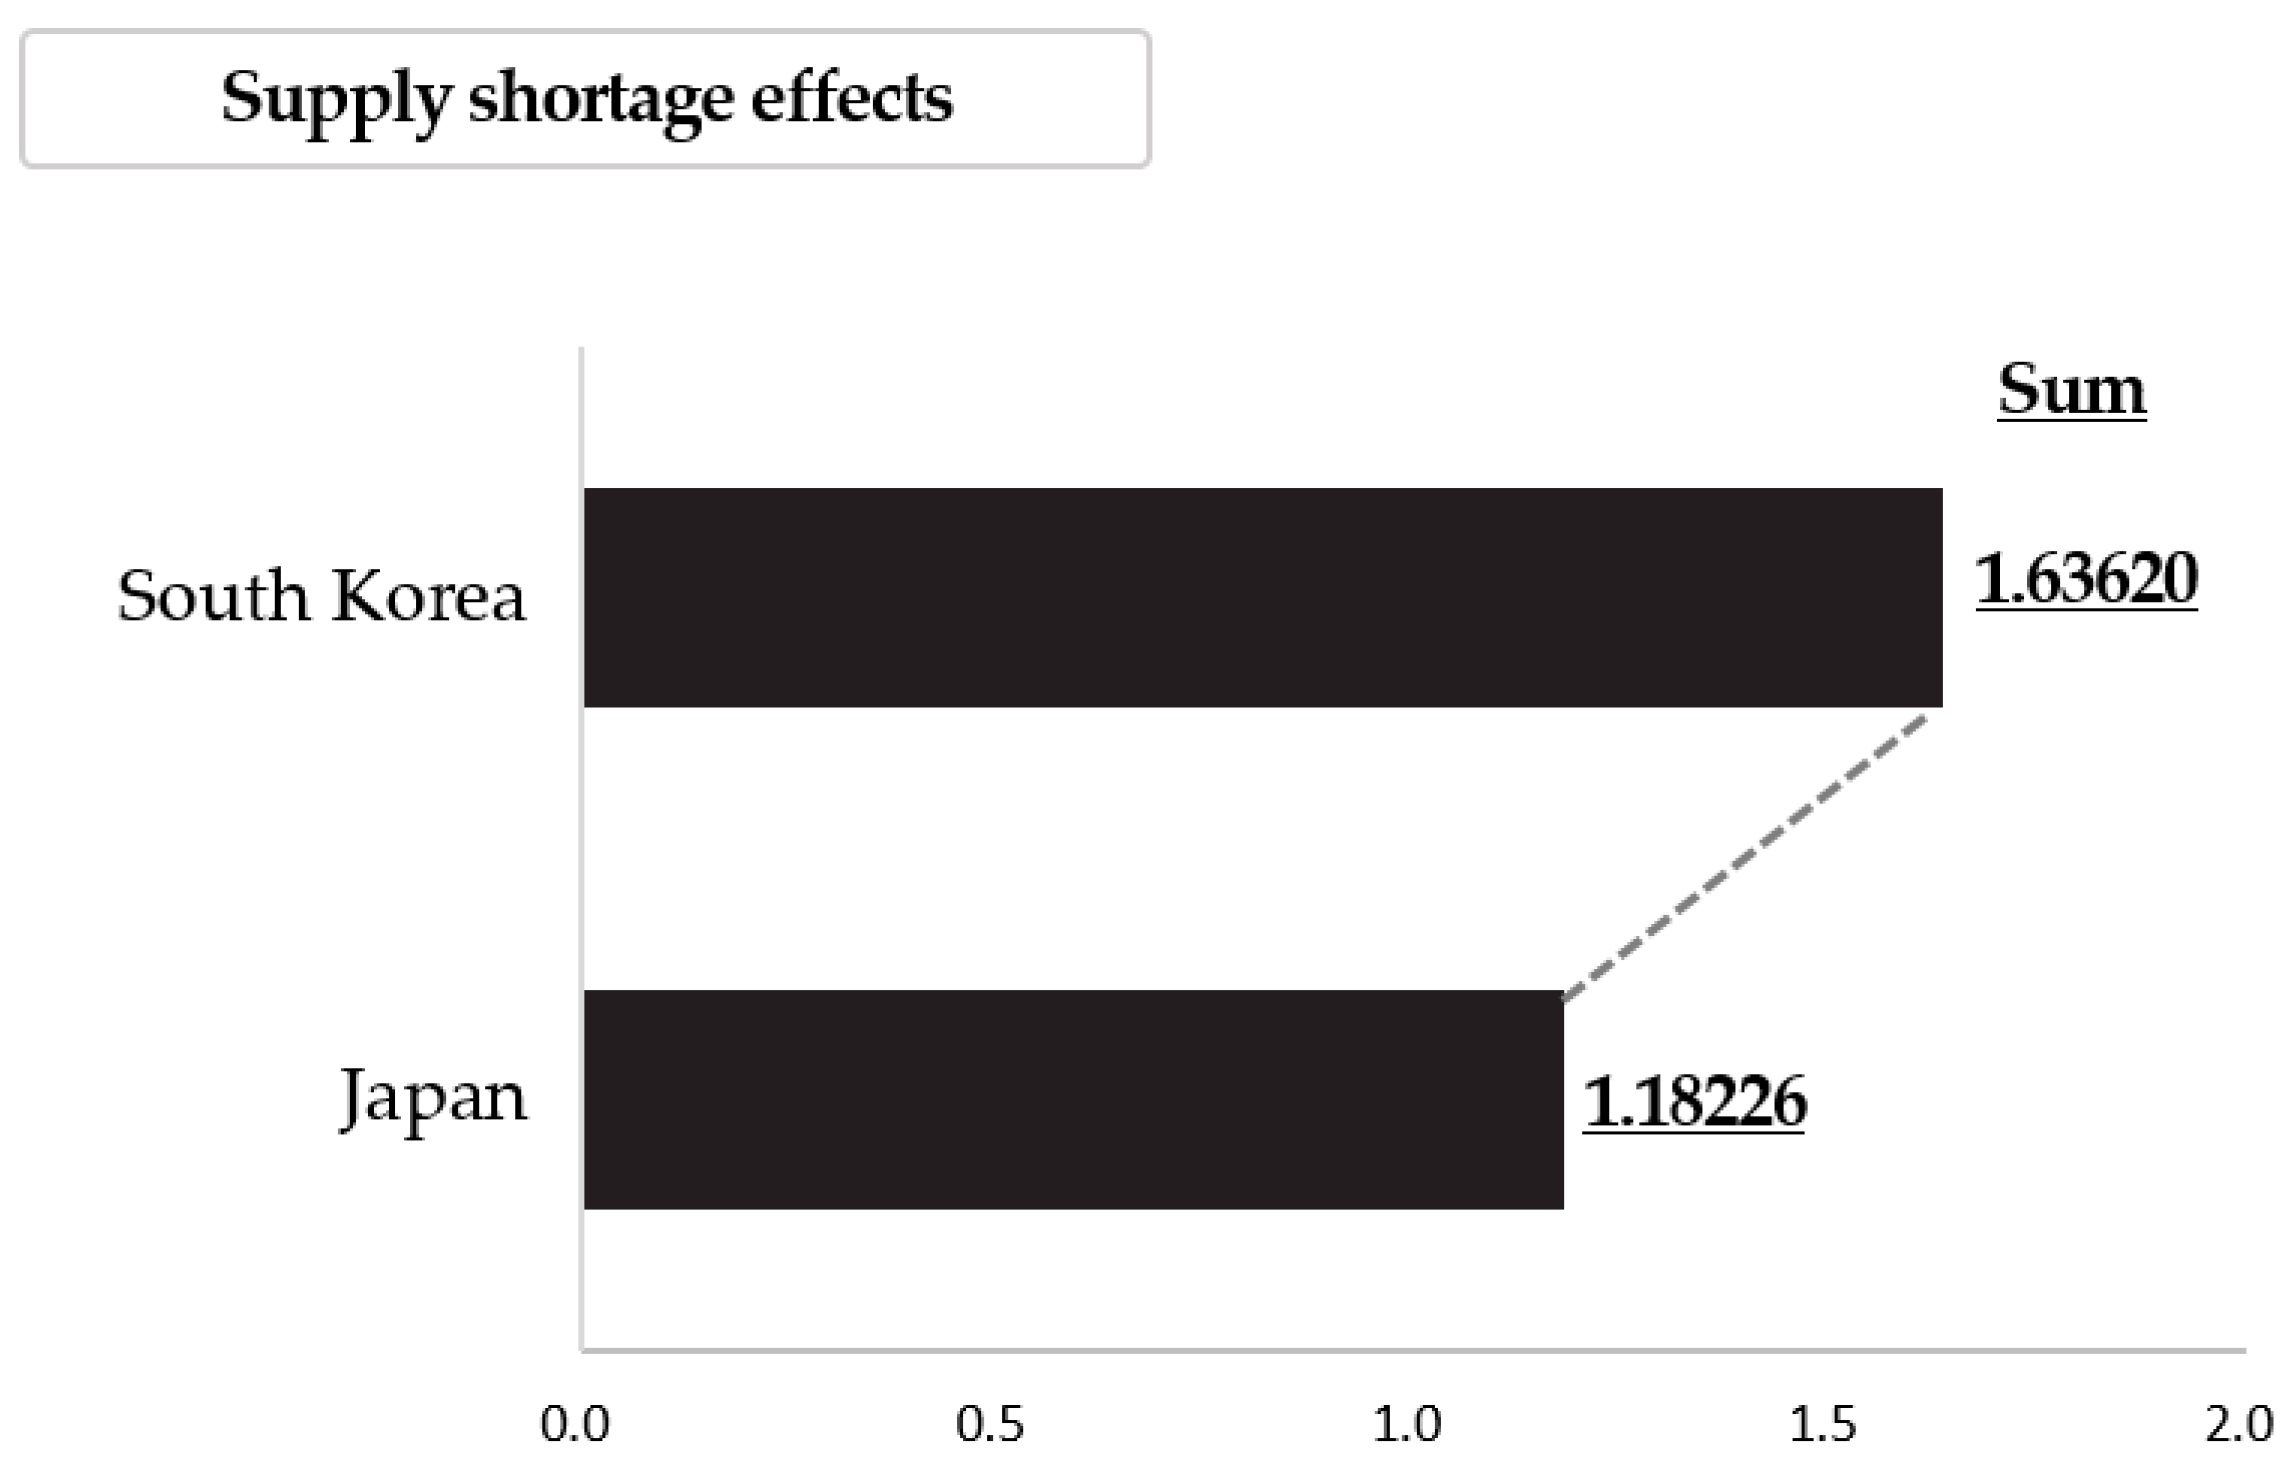
3.7. Supply-Shortage Effects of the EPS
3.8. Price Effects of the EPS
4. Discussion of the Results
5. Conclusions
Author Contributions
Funding
Data Availability Statement
Conflicts of Interest
References
- Balat, M. Electricity from worldwide energy sources. Energy Sources Part B Econ. Plan. Policy 2006, 1, 395–412. [Google Scholar] [CrossRef]
- Zohuri, B.; McDaniel, P.; Zohuri, B.; McDaniel, P. The Electricity: An Essential Necessity in Our Life. In Advanced Smaller Modular Reactors: An Innovative Approach to Nuclear Power; Springer: Cham, Switzerland, 2019; pp. 1–21. [Google Scholar]
- Gbadebo, O.O.; Okonkwo, C. Does energy consumption contribute to economic performance? Empirical evidence from Nigeria. J. Econ. Int. Financ. 2009, 1, 44. [Google Scholar]
- Zhang, C.; Zhou, K.; Yang, S.; Shao, Z. On electricity consumption and economic growth in China. Renew. Sustain. Energy Rev. 2017, 76, 353–368. [Google Scholar] [CrossRef]
- Wolde-Rufael, Y. Electricity consumption and economic growth: A time series experience for 17 African countries. Energy Policy 2006, 34, 1106–1114. [Google Scholar] [CrossRef]
- Yoo, S.H. Electricity consumption and economic growth: Evidence from Korea. Energy Policy 2005, 33, 1627–1632. [Google Scholar] [CrossRef]
- Wolfram, C.; Shelef, O.; Gertler, P. How will energy demand develop in the developing world? J. Econ. Perspect. 2012, 26, 119–138. [Google Scholar] [CrossRef]
- Sugiyama, M. Climate change mitigation and electrification. Energy Policy 2012, 44, 464–468. [Google Scholar] [CrossRef]
- International Energy Agency. Electricity Market Report 2023; International Energy Agency: Paris, France, 2023. [Google Scholar]
- Kim, H.S.; Shin, E.S.; Chung, W.J. Energy demand and supply, energy policies, and energy security in the Republic of Korea. Energy Policy 2011, 39, 6882–6897. [Google Scholar] [CrossRef]
- Kim, C. A review of the deployment programs, impact, and barriers of renewable energy policies in Korea. Renew. Sustain. Energy Rev. 2021, 144, 110870. [Google Scholar] [CrossRef]
- Korea Ministry of Trade, Industry and Energy. The 10th Basic Plan for Electricity Demand and Supply (2022–2036); Korea Ministry of Trade, Industry and Energy: Sejong, Republic of Korea, 2023. [Google Scholar]
- Lee, B.H.; Ahn, H.H. Electricity industry restructuring revisited: The case of Korea. Energy Policy 2006, 34, 1115–1126. [Google Scholar] [CrossRef]
- Kim, J.; Kim, K. The electricity industry reform in Korea: Lessons for further liberalization. In Infrastructure Regulation: What Works, Why and How Do We Know? World Scientific Publishing: Singapore, 2011; pp. 333–358. [Google Scholar]
- Park, J.K.; Kim, Y.J. Status and perspective of electric power industry in Korea. In Proceedings of the IEEE Power Engineering Society General Meeting, San Francisco, CA, USA, 16 June 2005; pp. 2896–2899. [Google Scholar]
- Goto, M.; Sueyoshi, T. Electric power market reform in Japan after Fukushima Daiichi nuclear plant disaster: Issues and future direction. Int. J. Energy Sect. Manag. 2015, 9, 336–360. [Google Scholar] [CrossRef]
- Ofuji, K.; Tatsumi, N. Wholesale and retail electricity markets in Japan: Results of market revitalization measures and prospects for the current. Econ. Energy Environ. Policy 2016, 5, 31–50. [Google Scholar] [CrossRef]
- Lee, C.; Kim, K.D. Effects of the forest industry on the South Korean national economy: Evidence from an Input-Output analysis based on the special classification for the forest industry. For. Sci. Technol. 2022, 18, 56–66. [Google Scholar] [CrossRef]
- Kim, K.H.; Kim, J.H.; Yoo, S.H. An Input-Output Analysis of the Economic Role and Effects of the Mining Industry in South Korea. Minerals 2020, 10, 624. [Google Scholar] [CrossRef]
- Lee, I.; Jang, S.; Chung, Y.; Seo, H. Economic spillover from renewable energy industries: An input-output analysis. Int. J. Green Energy 2022, 19, 809–817. [Google Scholar] [CrossRef]
- Kim, J.H.; Yoo, S.H. Comparison of the economic effects of nuclear power and renewable energy deployment in South Korea. Renew. Sustain. Energy Rev. 2021, 135, 110236. [Google Scholar] [CrossRef]
- Yagi, M.; Kagawa, S.; Managi, S.; Fujii, H.; Guan, D. Supply constraint from earthquakes in Japan in input–output analysis. Risk Anal. 2020, 40, 1811–1830. [Google Scholar] [CrossRef] [PubMed]
- Matsumoto, K.I.; Matsumura, Y. Challenges and economic effects of introducing renewable energy in a remote island: A case study of Tsushima Island, Japan. Renew. Sustain. Energy Rev. 2022, 162, 112456. [Google Scholar] [CrossRef]
- Ali, Y.; Sabir, M.; Muhammad, N. A comparative input-output analysis of the construction sector in three developing economies of South Asia. Constr. Manag. Econ. 2019, 37, 643–658. [Google Scholar] [CrossRef]
- Bon, R.; Pietroforte, R. Historical comparison of construction sectors in the United States, Japan, Italy and Finland using input-output tables. Constr. Manag. Econ. 1990, 8, 233–247. [Google Scholar] [CrossRef]
- Ilhan, B.; Yaman, H. A comparative input-output analysis of the construction sector in Turkey and EU countries. Eng. Constr. Archit. Manag. 2011, 18, 248–265. [Google Scholar] [CrossRef]
- De Souza, K.B.; De Andrade Bastos, S.Q.; Perobelli, F.S. Multiple trends of tertiarization: A comparative input–output analysis of the service sector expansion between Brazil and United States. EconomiA 2016, 17, 141–158. [Google Scholar] [CrossRef]
- Hasanli, Y.; Salihova, S. A comparative analysis of tourism sectors of Azerbaijan, Turkey and Kazakhstan through input-output tables. J. Econ. Sci. Theory Pract. 2019, 76, 70. [Google Scholar]
- Mun, J.; Yun, E.; Choi, H.; Kim, J. Comparative study in software and healthcare industries between South Korea and US based on economic input–output analysis. Atmosphere 2022, 13, 209. [Google Scholar] [CrossRef]
- Fotia, A.; Teclean, C. The Innovation efficiency in Central and Eastern European input-output comparative analysis between Czech Republic, Hungary, Poland and Romania. EURINT 2019, 6, 269–287. [Google Scholar]
- Gorska, R. Backward and forward linkages based on an input-output analysis–comparative study of Poland and selected European countries. Appl. Econom. Pap. 2015, 2, 30–50. [Google Scholar]
- Thangavelu, S.M.; Wang, W.; Oum, S. Servicification in global value chains: Comparative analysis of selected Asian countries with OECD. World Econ. 2018, 41, 3045–3070. [Google Scholar] [CrossRef]
- Proops, J.L.; Faber, M.; Wagenhals, G. Reducing CO2 Emissions: A Comparative Input-Output Study for Germany and the UK; Springer Science & Business Media: Berlin/Heidelberg, Germany, 2012. [Google Scholar]
- Li, Z.; Sun, L.; Geng, Y.; Dong, H.; Ren, J.; Liu, Z.; Tian, X.; Yabar, H.; Higano, Y. Examining industrial structure changes and corresponding carbon emission reduction effect by combining input-output analysis and social network analysis: A comparison study of China and Japan. J. Clean. Prod. 2017, 162, 61–70. [Google Scholar] [CrossRef]
- Long, R.; Li, J.; Chen, H.; Zhang, L.; Li, Q. Embodied carbon dioxide flow in international trade: A comparative analysis based on China and Japan. J. Environ. Manag. 2018, 209, 371–381. [Google Scholar] [CrossRef]
- Giaschini, M. Input-output Analysis; Chapman and Hall: London, UK, 1988. [Google Scholar]
- Miller, R.E.; Blair, P.D. Input-Output Analysis: Foundations and Extensions; Prentice-Hall: Hoboken, NJ, USA, 1985. [Google Scholar]
- Hienuki, S. Environmental and socio-economic analysis of naphtha reforming hydrogen energy using input-output tables: A case study from Japan. Sustainability 2017, 9, 1376. [Google Scholar] [CrossRef]
- Ju, H.C.; Yoo, S.H.; Kwak, S.J. The electricity shortage cost in Korea: An input-output analysis. Energy Sources Part B Econ. Plan. Policy 2016, 11, 58–64. [Google Scholar] [CrossRef]
- Lim, S.Y.; Yoo, S.H. The impact of electricity price changes on industrial prices and the general price level in Korea. Energy Policy 2013, 61, 1551–1555. [Google Scholar] [CrossRef]
- Lim, H.J.; Yoo, S.H.; Kwak, S.J. Industrial CO2 emissions from energy use in Korea: A structural decomposition analysis. Energy Policy 2009, 37, 686–698. [Google Scholar] [CrossRef]
- Logar, I.; Van Den Bergh, J.C. The impact of peak oil on tourism in Spain: An input–output analysis of price, demand and economy-wide effects. Energy 2013, 54, 155–166. [Google Scholar] [CrossRef]
- Önder, H.G. Renewable energy consumption policy in Turkey: An energy extended input-output analysis. Renew. Energy 2021, 175, 783–796. [Google Scholar] [CrossRef]
- O’Sullivan, M.; Edler, D. Gross employment effects in the renewable energy industry in Germany—An input–output analysis from 2000 to 2018. Sustainability 2020, 12, 6163. [Google Scholar] [CrossRef]
- Robison, M.H.; Duffy-Deno, K.T. The role of the oil and gas industry in Utah’s economy: An economic base/input-output analysis. Resour. Energy Econ. 1996, 18, 201–218. [Google Scholar] [CrossRef]
- Siala, K.; de la Rúa, C.; Lechón, Y.; Hamacher, T. Towards a sustainable European energy system: Linking optimization models with multi-regional input-output analysis. Energy Strategy Rev. 2019, 26, 100391. [Google Scholar] [CrossRef]
- Sun, C.; Chen, Z.; Guo, Z.; Wu, H. Energy rebound effect of various industries in China: Based on hybrid energy input-output model. Energy 2022, 261, 125147. [Google Scholar] [CrossRef]
- Wang, Q.; Ge, S. Uncovering the effects of external demand on China’s coal consumption: A global input–output analysis. J. Clean. Prod. 2020, 245, 118877. [Google Scholar] [CrossRef]
- Karkacier, O.; Goktolga, Z.G. Input–output analysis of energy use in agriculture. Energy Convers. Manag. 2005, 46, 1513–1521. [Google Scholar] [CrossRef]
- Casler, S.; Wilbur, S. Energy input-output analysis: A sample guide. Resour. Energy 1984, 6, 187–201. [Google Scholar] [CrossRef]
- Leontief, W. Input-output analysis. New Palgrave. A Dict. Econ. 1987, 2, 860–864. [Google Scholar]
- Leontief, W. Input-Output Economics; Oxford University Press: Oxford, UK, 1986. [Google Scholar]
- Fletcher, J.E. Input-output analysis and tourism impact studies. Ann. Tour. Res. 1989, 16, 514–529. [Google Scholar] [CrossRef]
- Rose, A.; Miernyk, W. Input-output analysis: The first fifty years. Econ. Syst. Res. 1989, 1, 229–272. [Google Scholar] [CrossRef]
- Lahr, M.L.; Dietzenbacher, E. (Eds.) Input-Output Analysis: Frontiers and Extensions; Palgrave: New York, NY, USA, 2001; pp. 1–31. [Google Scholar]
- Ten Raa, T. The Economics of Input-Output Analysis; Cambridge University Press: Cambridge, UK, 2006. [Google Scholar]
- Miller, R.E.; Blair, P.D. Input-Output Analysis: Foundations and Extensions, 2nd ed.; Cambridge University Press: New York, NY, USA, 2009. [Google Scholar]
- Wu, X.F.; Chen, G.Q. Energy use by Chinese economy: A systems cross-scale input-output analysis. Energy Policy 2017, 108, 81–90. [Google Scholar] [CrossRef]
- Ghosh, A. Input-output approach in an allocation system. Economica 1958, 25, 58–64. [Google Scholar] [CrossRef]
- Deman, S. Stability of supply coefficients and consistency of supply-driven and demand-driven input—Output models. Environ. Plan. A 1988, 20, 811–816. [Google Scholar] [CrossRef]
- Oosterhaven, J. On the plausibility of the supply-driven input-output model. J. Reg. Sci. 1988, 28, 203–217. [Google Scholar] [CrossRef]
- Gruver, G.W. On the plausibility of the supply-driven input-output model: A theoretical basis for input-co-efficient change. J. Reg. Sci. 1989, 29, 441–450. [Google Scholar] [CrossRef]
- Rose, A.; Allison, T. On the plausibility of the supply-driven input-output model: Empirical evidence on joint stability. J. Reg. Sci. 1989, 29, 451–458. [Google Scholar] [CrossRef]
- Leung, P.; Pooley, S. Regional economic impacts of reductions in fisheries production: A supply-driven approach. Mar. Resour. Econ. 2001, 16, 251–262. [Google Scholar] [CrossRef]
- Zhang, Y. Supply-side structural effect on carbon emissions in China. Energy Econ. 2010, 32, 186–193. [Google Scholar] [CrossRef]
- Bank of Korea. Input-Output Table in 2019 Year. Available online: http://www.bok.or.kr (accessed on 1 December 2022).
- Statistics Bureau of Japan. Input-Output Table in 2015 Year. Available online: http://www.stat.go.jp (accessed on 1 December 2022).
- Bank of Korea. Exchange Rate/International Reserves and Trade. Available online: https://ecos.bok.or.kr (accessed on 21 February 2024).
- Schweizer-Ries, P. Energy sustainable communities: Environmental psychological investigations. Energy Policy 2008, 36, 4126–4135. [Google Scholar] [CrossRef]
- Cecconet, D.; Raček, J.; Callegari, A.; Hlavínek, P. Energy recovery from wastewater: A study on heating and cooling of a multipurpose building with sewage-reclaimed heat energy. Sustainability 2019, 12, 116. [Google Scholar] [CrossRef]
- Kim, M.H.; Kim, D.W.; Han, G.; Heo, J.; Lee, D.W. Ground Source and Sewage Water Source Heat Pump Systems for Block Heating and Cooling Network. Energies 2021, 14, 5640. [Google Scholar] [CrossRef]
- Liu, Z.; Ma, L.; Zhang, J. Application of a heat pump system using untreated urban sewage as a heat source. Appl. Therm. Eng. 2014, 62, 747–757. [Google Scholar] [CrossRef]
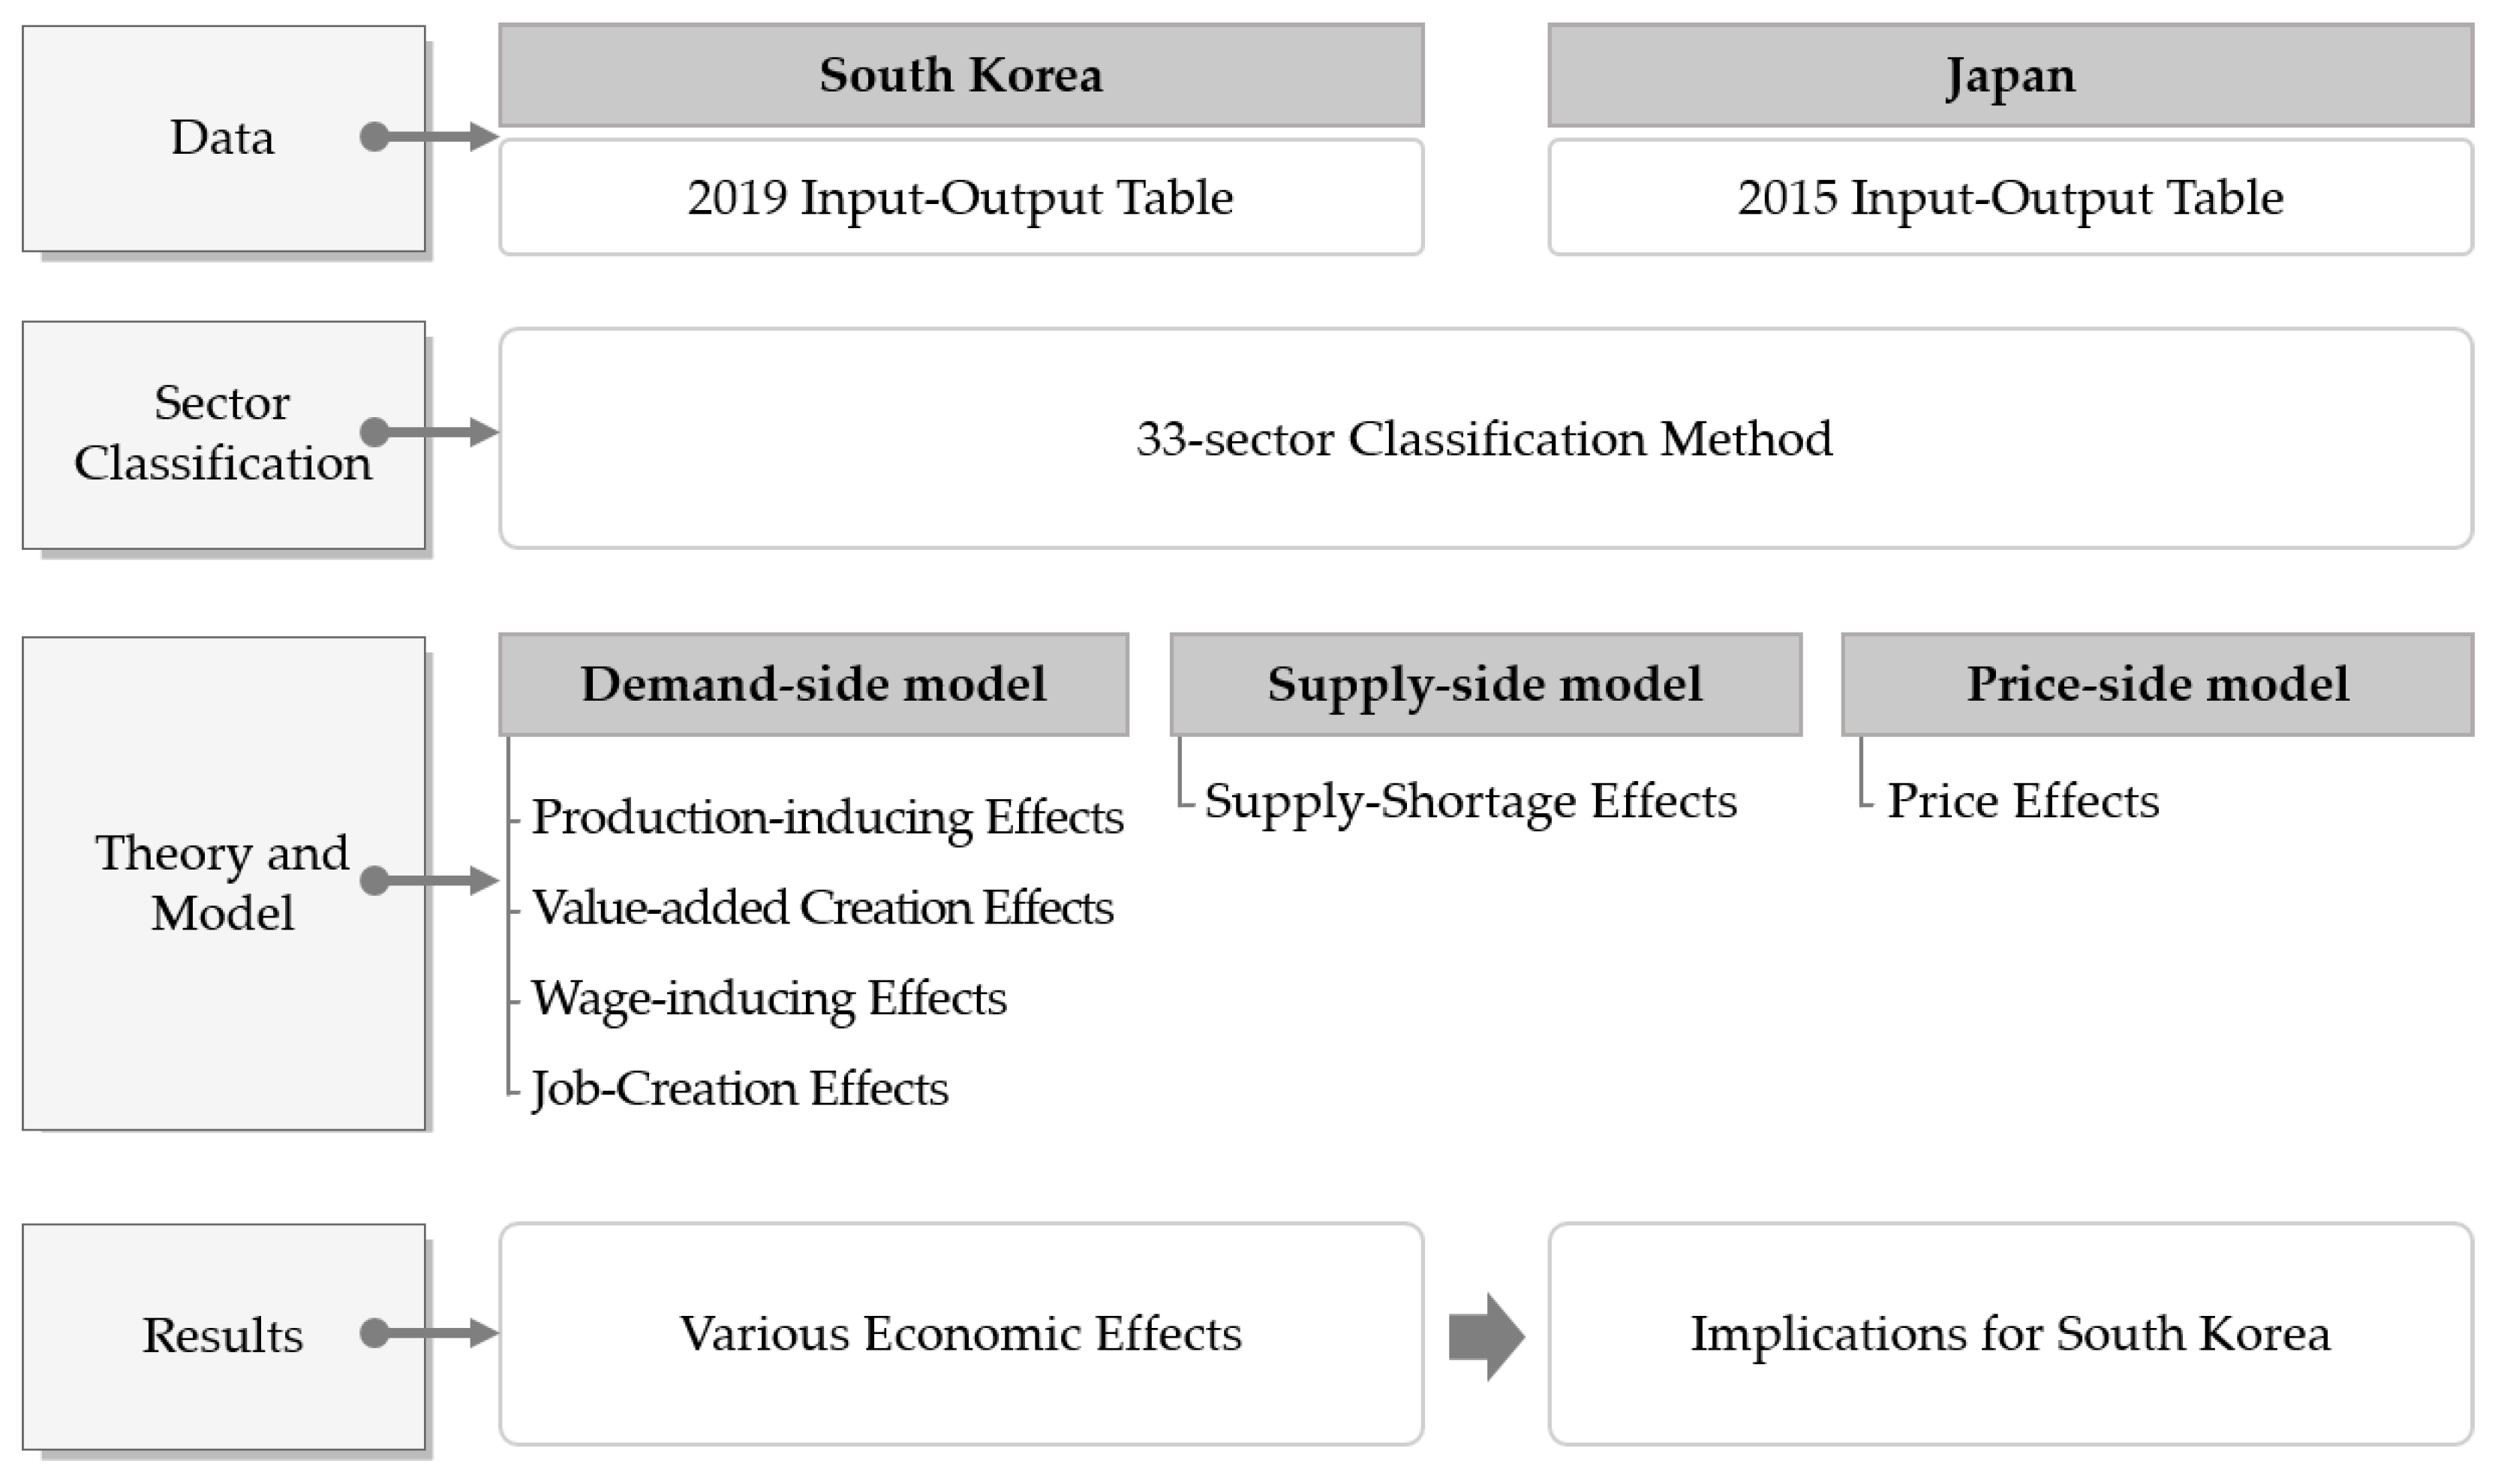
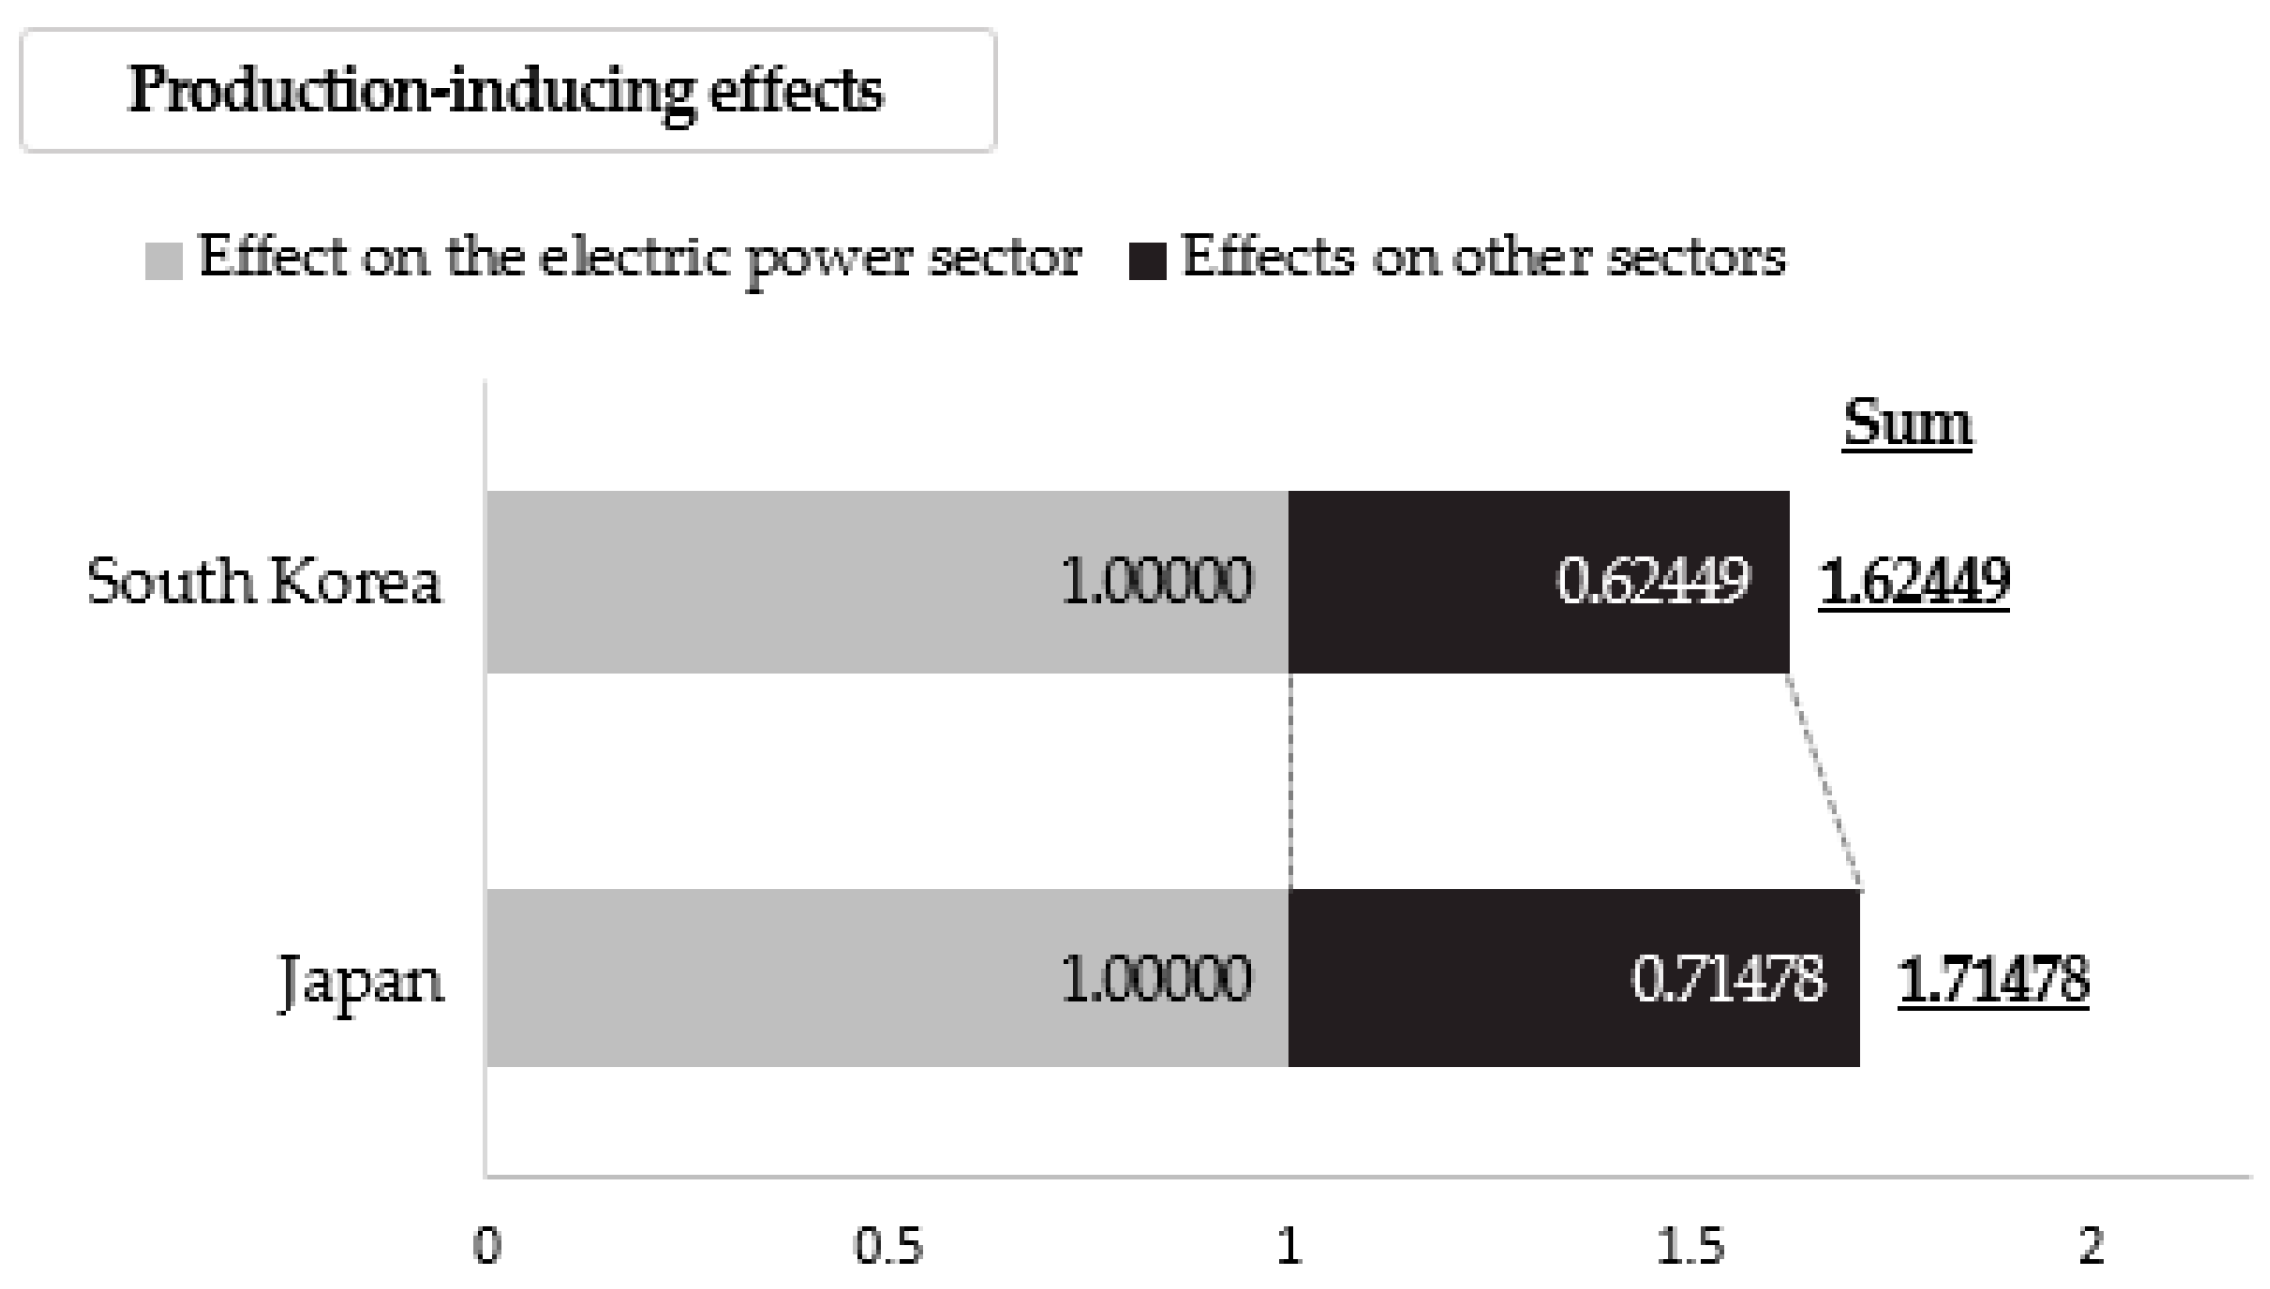
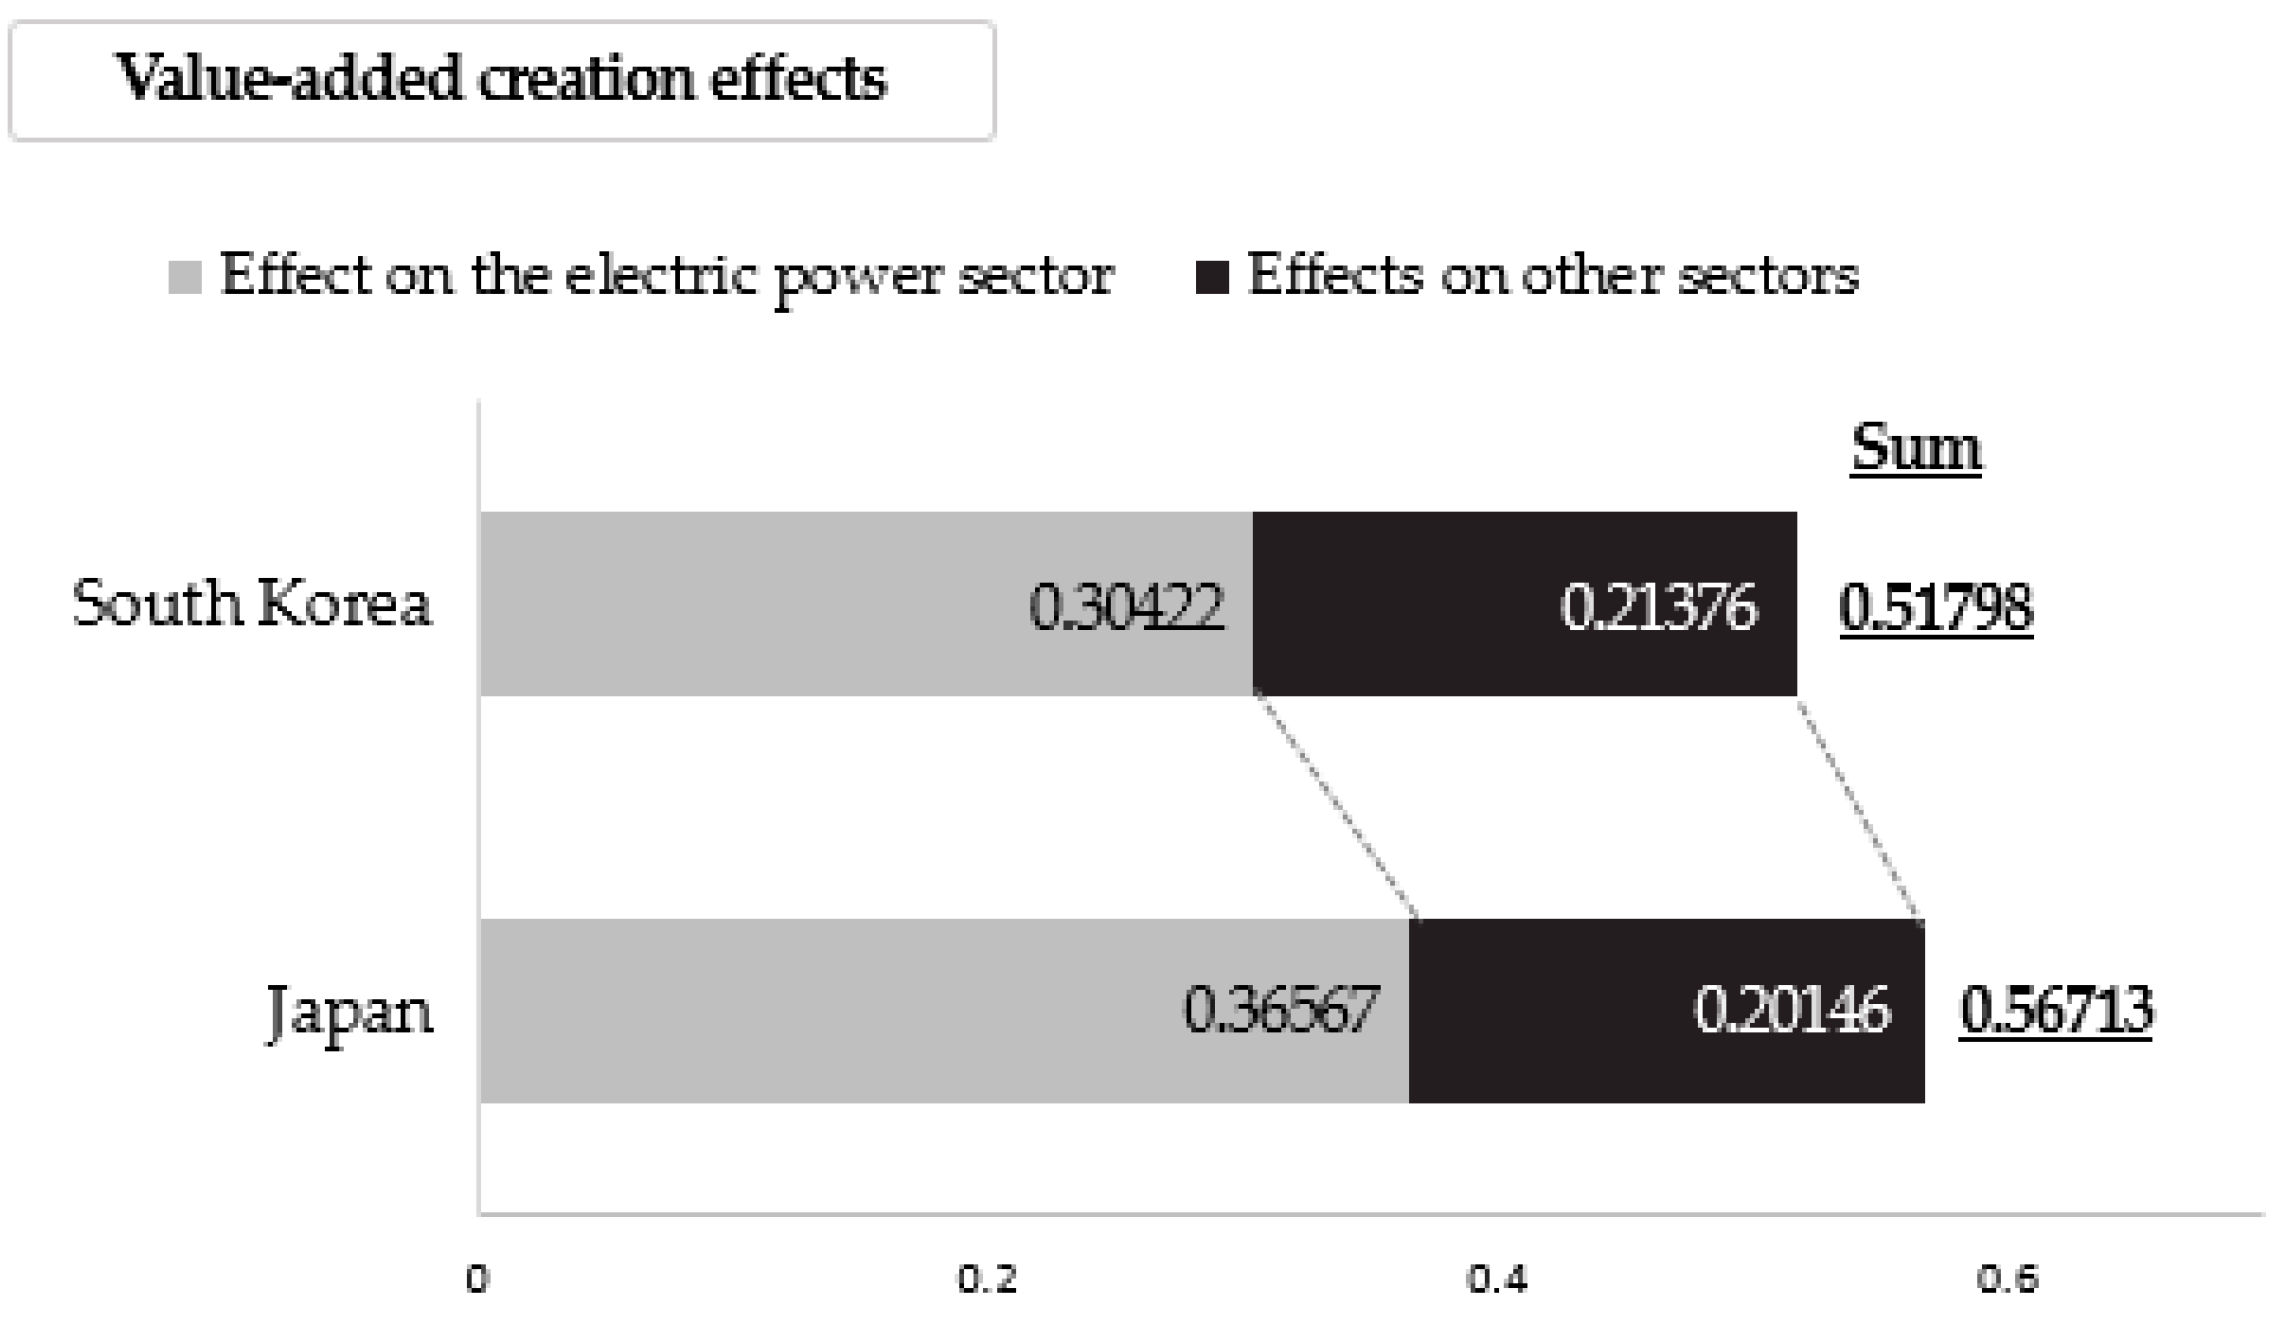
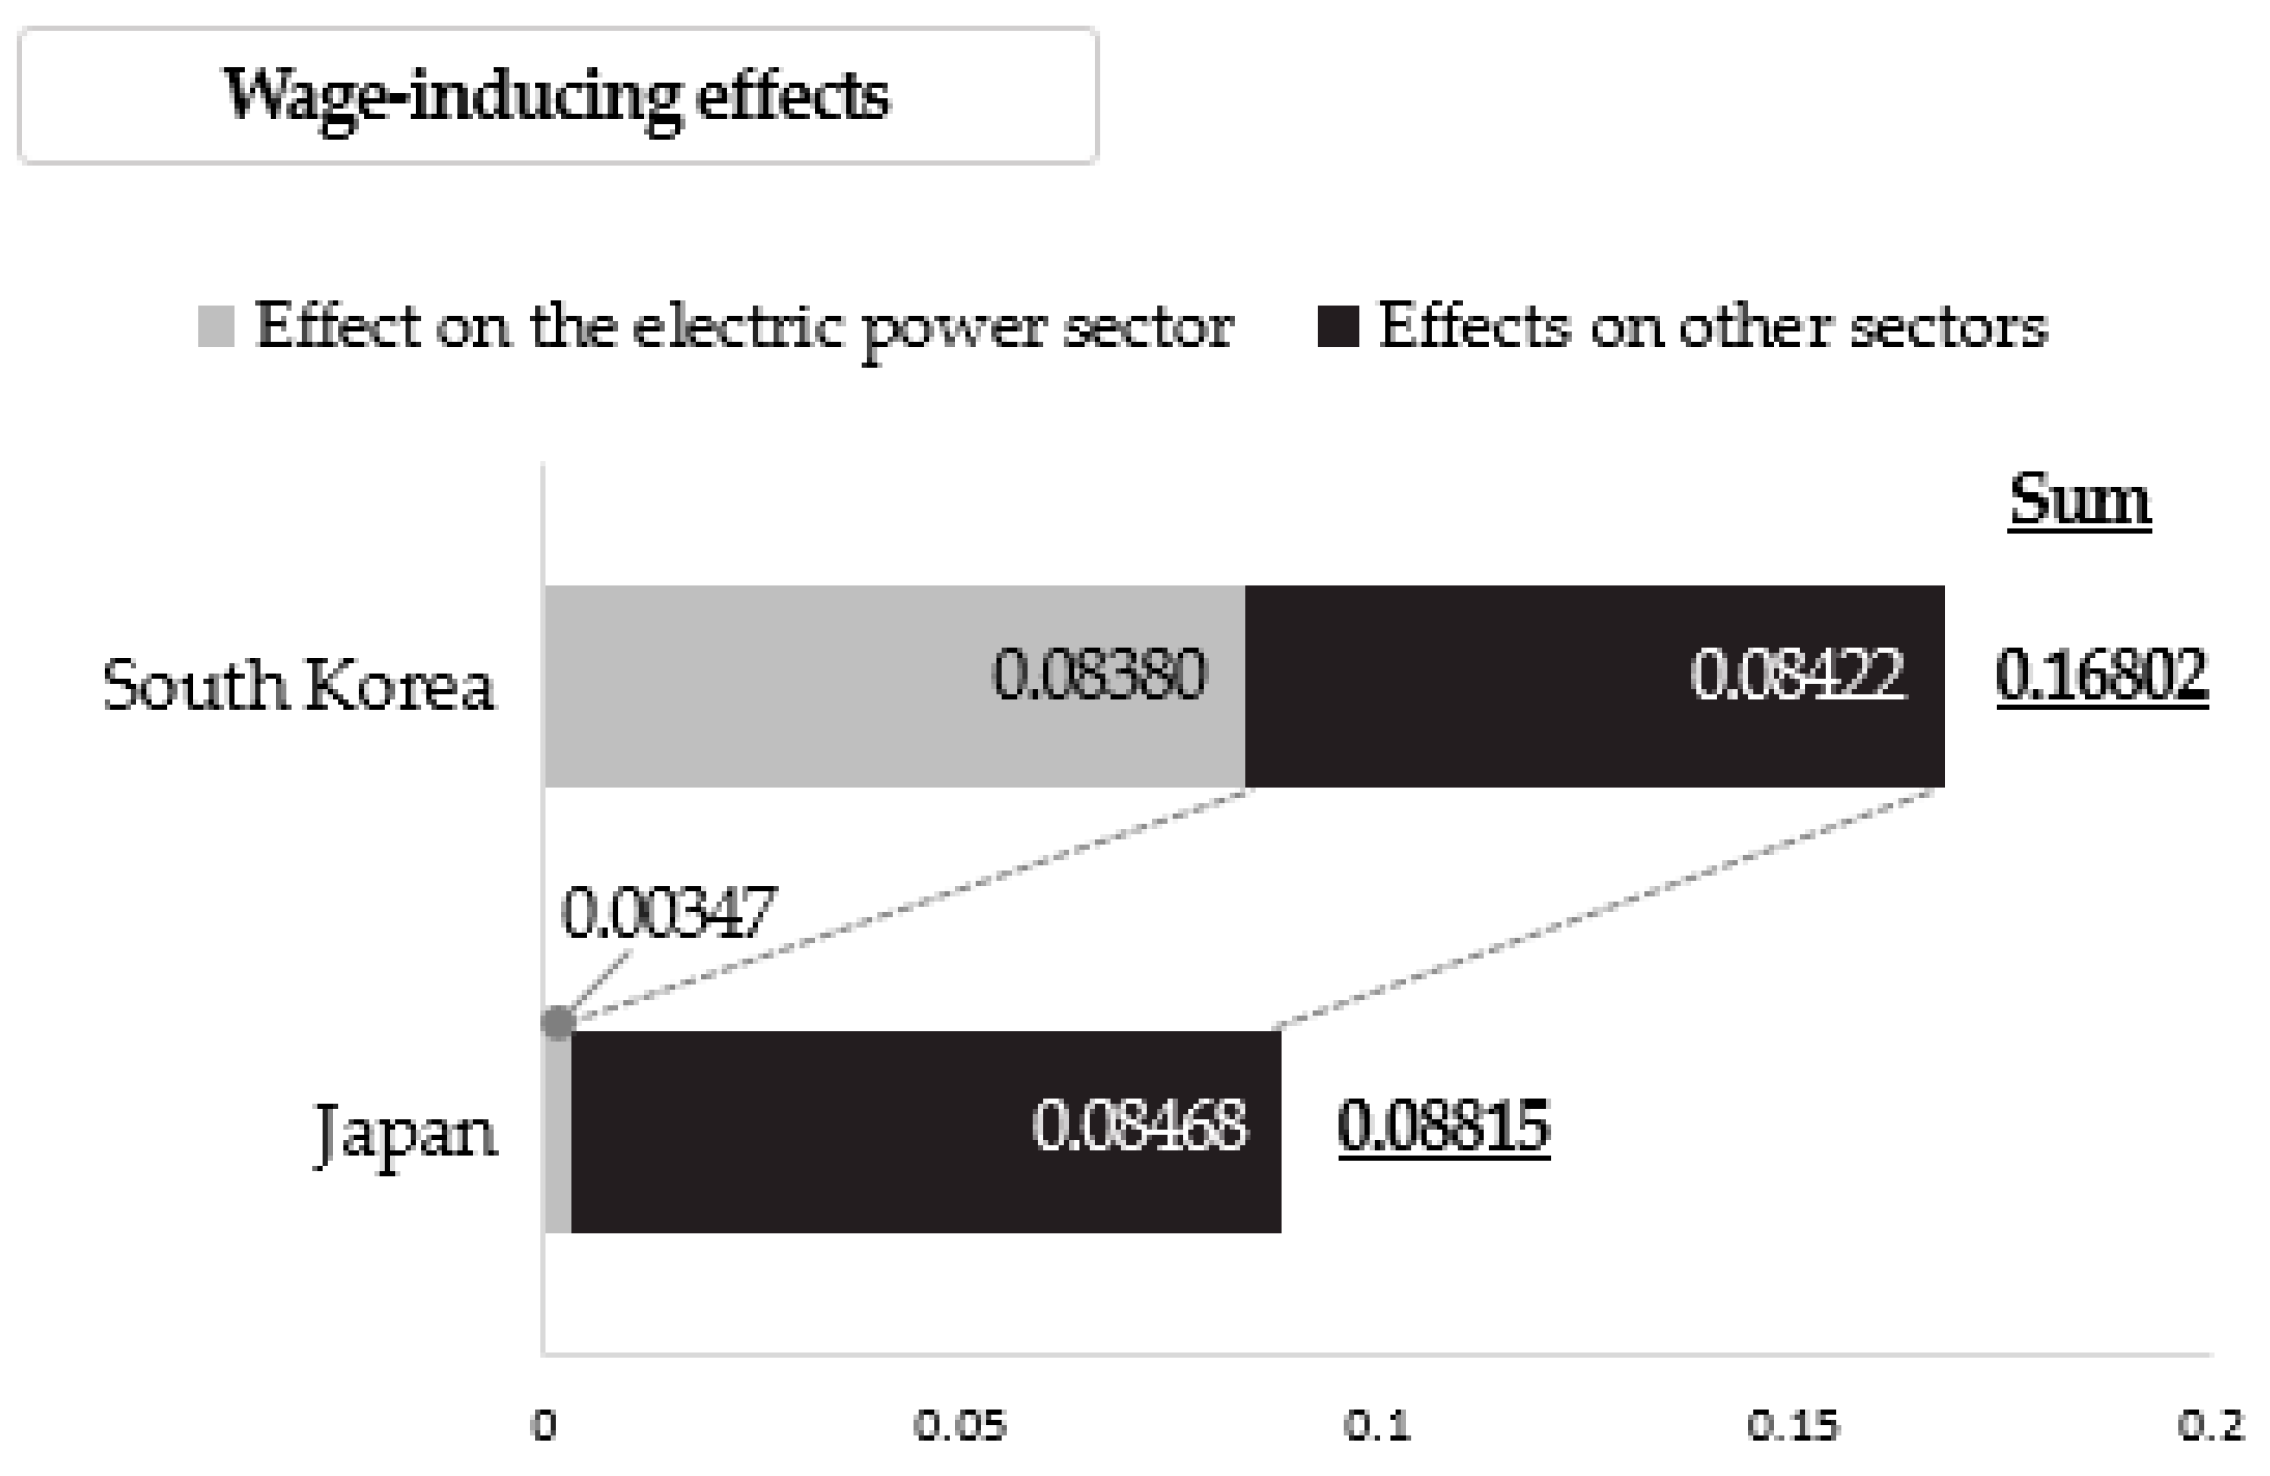

| Sources | Countries | Objects to Be Investigated | Models |
|---|---|---|---|
| Hienuki [38] | Japan | Naphtha reforming hydrogen energy | Demand-side model |
| Ju et al. [39] | South Korea | Electricity | Value-added maximization model |
| Lim and Yoo [40] | South Korea | Electricity | Price-side model |
| Lim et al. [41] | South Korea | Coal, petroleum, natural gas | Structural decomposition analysis model |
| Logar and Van Den Bergh [42] | Spain | Oil | Price-side model |
| Önder [43] | Turkey | Renewable energy | Demand-side model |
| O’Sullivan and Edler [44] | Germany | Renewable energy | Demand-side model |
| Robison and Duffy-Deno [45] | United States | Oil and gas | Multiregional IO model |
| Siala et al. [46] | Europe | Energy-related CO2 emissions | Multiregional IO model |
| Sun et al. [47] | China | Coal, oil, natural gas, electricity | Supply-side model |
| Wang and Ge [48] | China | Coal | Multiregional IO model |
| Karkacier and Goktolga [49] | Turkey | Energy use in agriculture | Demand-side model |
| Number of Sectors | Name of Sectors |
|---|---|
| 1. | Agricultural, forest, and fishery goods |
| 2. | Mined and quarried goods |
| 3. | Food, beverages and tobacco products |
| 4. | Textile and leather products |
| 5. | Wood, paper products, printing and reproduction of recorded media |
| 6. | Petroleum and coal products |
| 7. | Chemical products |
| 8. | Non-metallic mineral products |
| 9. | Basic metal products |
| 10. | Fabricated metal products, except machinery and furniture |
| 11. | Computing machinery, electronic equipment and optical instruments |
| 12. | Electrical equipment |
| 13. | Machinery and equipment |
| 14. | Transport equipment, manufacturing services, and repair services of industrial equipment |
| 15. | Other manufactured products |
| 16. | Gas and steam supply |
| 17. | Water supply, sewage, waste treatment, and disposal services |
| 18. | Construction |
| 19. | Wholesale, retail trade, and commodity brokerage services |
| 20. | Transportation |
| 21. | Food services and accommodation |
| 22. | Communications and broadcasting |
| 23. | Finance and insurance |
| 24. | Real estate services |
| 25. | Professional, scientific, and technical services |
| 26. | Business support services |
| 27. | Public administration, defense, and social security services |
| 28. | Education services |
| 29. | Health and social care services |
| 30. | Art, sports, and leisure services |
| 31. | Other services |
| 32. | Others |
| 33. | Electric power |
| South Korea | Japan | |||||
|---|---|---|---|---|---|---|
| Electric Power Sector (A) | National Economy (B) | Share of Electric Power Sector (A/B) | Electric Power Sector (A) | National Economy (B) | Share of Electric Power Sector (A/B) | |
| Total output | KRW 63.1 trillion (USD 73.5 billion) | KRW 4365.9 trillion (USD 5087.9 billion) | 1.4% | JPY 20.3 trillion (USD 24.6 billion) | JPY 1017.8 trillion (USD 1234.2 billion) | 2.0% |
| Value added | KRW 19.2 trillion (USD 22.4 billion) | KRW 1900.7 trillion (USD 2215.5 billion) | 1.0% | JPY 7.4 trillion (USD 9.0 billion) | JPY 548.2 trillion (USD 664.7 billion) | 1.4% |
| Wage | KRW 5.3 trillion (USD 6.2 billion) | KRW 913.4 trillion (USD 1064.8 billion) | 0.6% | JPY 0.1 trillion (USD 0.1 billion) | JPY 4.7 trillion (USD 5.7 billion) | 1.5% |
| Employment | 42.2 thousand persons | 24.6 million persons | 0.2% | 0.2 million persons | 68.6 million persons | 0.3% |
| Sectors a | Production-Inducing Effects | Value-Added Creation Effects | Wage-Inducing Effects | |||||||||
|---|---|---|---|---|---|---|---|---|---|---|---|---|
| South Korea | Japan | South Korea | Japan | South Korea | Japan | |||||||
| Value | Rank | Value | Rank | Value | Rank | Value | Rank | Value | Rank | Value | Rank | |
| 1. | 0.00246 | 25 | 0.00044 | 27 | 0.00126 | 23 | 0.00017 | 28 | 0.00026 | 29 | 0.00000 | 29 |
| 2. | 0.00276 | 24 | 0.31966 | 1 | 0.00130 | 22 | 0.00667 | 10 | 0.00056 | 23 | 0.00151 | 6 |
| 3. | 0.00564 | 19 | 0.00023 | 29 | 0.00144 | 21 | 0.00007 | 30 | 0.00050 | 25 | 0.00000 | 30 |
| 4. | 0.00455 | 21 | 0.00129 | 21 | 0.00093 | 28 | 0.00020 | 26 | 0.00041 | 27 | 0.00001 | 24 |
| 5. | 0.00560 | 20 | 0.01174 | 11 | 0.00180 | 20 | 0.00416 | 12 | 0.00083 | 18 | 0.00011 | 11 |
| 6. | 0.05155 | 3 | 0.06455 | 3 | 0.01293 | 7 | 0.01621 | 5 | 0.00051 | 24 | 0.00039 | 7 |
| 7. | 0.05441 | 2 | 0.00740 | 13 | 0.01486 | 5 | 0.00211 | 13 | 0.00493 | 6 | 0.00007 | 12 |
| 8. | 0.00065 | 32 | 0.00123 | 22 | 0.00020 | 31 | 0.00053 | 22 | 0.00008 | 31 | 0.00003 | 18 |
| 9. | 0.01331 | 14 | 0.00468 | 16 | 0.00250 | 17 | 0.00107 | 17 | 0.00092 | 17 | 0.00004 | 15 |
| 10. | 0.02109 | 9 | 0.00283 | 17 | 0.00750 | 10 | 0.00115 | 15 | 0.00358 | 8 | 0.00002 | 21 |
| 11. | 0.02043 | 10 | 0.00184 | 20 | 0.00823 | 9 | 0.00044 | 23 | 0.00205 | 14 | 0.00001 | 23 |
| 12. | 0.03842 | 5 | 0.00100 | 24 | 0.01093 | 8 | 0.00028 | 24 | 0.00437 | 7 | 0.00001 | 26 |
| 13. | 0.00798 | 18 | 0.00266 | 18 | 0.00246 | 18 | 0.00102 | 18 | 0.00124 | 15 | 0.00001 | 25 |
| 14. | 0.01636 | 11 | 0.00512 | 14 | 0.00460 | 14 | 0.00115 | 16 | 0.00244 | 13 | 0.00002 | 20 |
| 15. | 0.00098 | 30 | 0.00091 | 25 | 0.00028 | 30 | 0.00023 | 25 | 0.00016 | 30 | 0.00001 | 28 |
| 16. | 0.18222 | 1 | 0.00209 | 19 | 0.03879 | 1 | 0.00067 | 21 | 0.00650 | 5 | 0.00003 | 19 |
| 17. | 0.00424 | 22 | 0.02223 | 9 | 0.00236 | 19 | 0.01243 | 8 | 0.00111 | 16 | 0.00028 | 8 |
| 18. | 0.00865 | 17 | 0.01386 | 10 | 0.00382 | 16 | 0.00650 | 11 | 0.00272 | 10 | 0.00004 | 14 |
| 19. | 0.02439 | 7 | 0.02506 | 7 | 0.01299 | 6 | 0.01748 | 4 | 0.00690 | 4 | 0.00001 | 27 |
| 20. | 0.01513 | 12 | 0.05398 | 4 | 0.00550 | 13 | 0.02610 | 2 | 0.00321 | 9 | 0.03539 | 1 |
| 21. | 0.01338 | 13 | 0.00000 | 31 | 0.00458 | 15 | 0.00000 | 31 | 0.00270 | 11 | 0.00000 | 31 |
| 22. | 0.01165 | 15 | 0.02653 | 6 | 0.00654 | 12 | 0.01309 | 7 | 0.00259 | 12 | 0.01495 | 2 |
| 23. | 0.02872 | 6 | 0.02485 | 8 | 0.01691 | 3 | 0.01615 | 6 | 0.00692 | 3 | 0.00003 | 16 |
| 24. | 0.00966 | 16 | 0.00940 | 12 | 0.00709 | 11 | 0.00790 | 9 | 0.00067 | 21 | 0.00001 | 22 |
| 25. | 0.04572 | 4 | 0.00000 | 32 | 0.02297 | 2 | 0.00000 | 32 | 0.01575 | 1 | 0.00000 | 32 |
| 26. | 0.02403 | 8 | 0.06779 | 2 | 0.01626 | 4 | 0.04196 | 1 | 0.00937 | 2 | 0.01194 | 4 |
| 27. | 0.00129 | 29 | 0.00122 | 23 | 0.00098 | 26 | 0.00087 | 19 | 0.00062 | 22 | 0.00016 | 9 |
| 28. | 0.00066 | 31 | 0.00083 | 26 | 0.00047 | 29 | 0.00067 | 20 | 0.00040 | 28 | 0.00016 | 10 |
| 29. | 0.00179 | 28 | 0.00013 | 30 | 0.00095 | 27 | 0.00008 | 29 | 0.00069 | 20 | 0.00003 | 17 |
| 30. | 0.00194 | 27 | 0.00026 | 28 | 0.00107 | 25 | 0.00018 | 27 | 0.00042 | 26 | 0.00007 | 13 |
| 31. | 0.00277 | 23 | 0.03593 | 5 | 0.00125 | 24 | 0.01988 | 3 | 0.00082 | 19 | 0.01418 | 3 |
| 32. | 0.00206 | 26 | 0.00502 | 15 | 0.00000 | 32 | 0.00204 | 14 | 0.00000 | 32 | 0.00516 | 5 |
| Sum (A) | 0.62449 | 0.71478 | 0.21376 | 0.20146 | 0.08422 | 0.08468 | ||||||
| Effect on the electric power sector (B) | 1.00000 | 1.00000 | 0.30422 | 0.36567 | 0.08380 | 0.00347 | ||||||
| Total (A + B) | 1.62449 | 1.71478 | 0.51798 | 0.56713 | 0.16802 | 0.08815 | ||||||
| Sectors a | South Korea b | Japan b | ||
|---|---|---|---|---|
| Value | Rank | Value | Rank | |
| 1. | 0.05822 | 15 | 0.01322 | 14 |
| 2. | 0.01154 | 26 | 0.06957 | 9 |
| 3. | 0.01589 | 24 | 0.00096 | 30 |
| 4. | 0.01834 | 23 | 0.00789 | 19 |
| 5. | 0.02256 | 20 | 0.06842 | 10 |
| 6. | 0.00492 | 30 | 0.00909 | 18 |
| 7. | 0.09887 | 8 | 0.01942 | 12 |
| 8. | 0.00188 | 31 | 0.00708 | 21 |
| 9. | 0.01376 | 25 | 0.00577 | 23 |
| 10. | 0.08087 | 10 | 0.02385 | 11 |
| 11. | 0.03188 | 16 | 0.00480 | 24 |
| 12. | 0.09764 | 9 | 0.00320 | 26 |
| 13. | 0.02656 | 19 | 0.01190 | 15 |
| 14. | 0.05958 | 14 | 0.01120 | 16 |
| 15. | 0.00693 | 29 | 0.00594 | 22 |
| 16. | 0.11642 | 7 | 0.00329 | 25 |
| 17. | 0.03053 | 17 | 0.16984 | 5 |
| 18. | 0.06538 | 11 | 0.13794 | 7 |
| 19. | 0.33397 | 2 | 0.34681 | 4 |
| 20. | 0.16016 | 5 | 0.39795 | 3 |
| 21. | 0.17717 | 4 | 0.00005 | 31 |
| 22. | 0.06179 | 13 | 0.10716 | 8 |
| 23. | 0.11999 | 6 | 0.14815 | 6 |
| 24. | 0.02837 | 18 | 0.01355 | 13 |
| 25. | 0.34893 | 1 | 0.00000 | 32 |
| 26. | 0.32553 | 3 | 0.78696 | 1 |
| 27. | 0.01073 | 27 | 0.00757 | 20 |
| 28. | 0.00914 | 28 | 0.00979 | 17 |
| 29. | 0.02234 | 21 | 0.00179 | 28 |
| 30. | 0.02156 | 22 | 0.00263 | 27 |
| 31. | 0.06345 | 12 | 0.56377 | 2 |
| 32. | 0.00000 | 32 | 0.00139 | 29 |
| Sum (A) | 2.44490 | 2.96095 | ||
| Effect on the electric power sector (B) | 0.09775 | 1.03860 | ||
| Total (A + B) | 2.54265 | 3.99955 | ||
| Sectors a | South Korea | Japan | ||
|---|---|---|---|---|
| Value | Rank | Value | Rank | |
| 1. | 0.02388 | 24 | 0.01312 | 26 |
| 2. | 0.00228 | 31 | 0.00193 | 32 |
| 3. | 0.05382 | 13 | 0.04391 | 11 |
| 4. | 0.02307 | 25 | 0.00690 | 28 |
| 5. | 0.03263 | 19 | 0.04678 | 10 |
| 6. | 0.02547 | 22 | 0.00844 | 27 |
| 7. | 0.13940 | 3 | 0.09430 | 3 |
| 8. | 0.03218 | 20 | 0.01898 | 22 |
| 9. | 0.14998 | 1 | 0.12967 | 1 |
| 10. | 0.05798 | 10 | 0.02591 | 19 |
| 11. | 0.07348 | 7 | 0.03533 | 12 |
| 12. | 0.03924 | 16 | 0.02219 | 20 |
| 13. | 0.05437 | 11 | 0.04695 | 9 |
| 14. | 0.11171 | 4 | 0.09200 | 4 |
| 15. | 0.01052 | 29 | 0.00424 | 30 |
| 16. | 0.00785 | 30 | 0.00475 | 29 |
| 17. | 0.02200 | 26 | 0.03198 | 13 |
| 18. | 0.09203 | 6 | 0.05566 | 6 |
| 19. | 0.09689 | 5 | 0.10670 | 2 |
| 20. | 0.04805 | 14 | 0.05359 | 8 |
| 21. | 0.06720 | 8 | 0.05542 | 7 |
| 22. | 0.03749 | 17 | 0.03074 | 15 |
| 23. | 0.03574 | 18 | 0.01523 | 24 |
| 24. | 0.04667 | 15 | 0.02021 | 21 |
| 25. | 0.14296 | 2 | 0.01456 | 25 |
| 26. | 0.01699 | 28 | 0.02829 | 18 |
| 27. | 0.02827 | 21 | 0.02972 | 17 |
| 28. | 0.05427 | 12 | 0.03025 | 16 |
| 29. | 0.06352 | 9 | 0.06292 | 5 |
| 30. | 0.02403 | 23 | 0.01744 | 23 |
| 31. | 0.02032 | 27 | 0.03080 | 14 |
| 32. | 0.00191 | 32 | 0.00337 | 31 |
| Sum | 1.63620 | 1.18226 | ||
| Sectors a | South Korea b | Japan b | ||
|---|---|---|---|---|
| Value | Rank | Value | Rank | |
| 1. | 0.23947 | 16 | 0.17009 | 21 |
| 2. | 0.33627 | 7 | 0.01855 | 32 |
| 3. | 0.24616 | 14 | 0.19357 | 17 |
| 4. | 0.20826 | 23 | 0.13760 | 26 |
| 5. | 0.44168 | 4 | 0.48659 | 4 |
| 6. | 0.11736 | 30 | 0.08507 | 28 |
| 7. | 0.31524 | 8 | 0.37117 | 6 |
| 8. | 0.47833 | 3 | 0.54761 | 3 |
| 9. | 0.66537 | 1 | 0.64581 | 1 |
| 10. | 0.35369 | 6 | 0.40610 | 5 |
| 11. | 0.16180 | 25 | 0.24301 | 11 |
| 12. | 0.22596 | 19 | 0.21722 | 16 |
| 13. | 0.24185 | 15 | 0.24032 | 12 |
| 14. | 0.23585 | 18 | 0.31212 | 9 |
| 15. | 0.27202 | 10 | 0.14669 | 23 |
| 16. | 0.14576 | 27 | 0.22528 | 14 |
| 17. | 0.57592 | 2 | 0.62289 | 2 |
| 18. | 0.21105 | 22 | 0.18612 | 19 |
| 19. | 0.21412 | 21 | 0.22691 | 13 |
| 20. | 0.19524 | 24 | 0.18599 | 20 |
| 21. | 0.24750 | 13 | 0.33478 | 8 |
| 22. | 0.15268 | 26 | 0.11959 | 27 |
| 23. | 0.12225 | 29 | 0.08407 | 29 |
| 24. | 0.12788 | 28 | 0.05094 | 31 |
| 25. | 0.39013 | 5 | 0.14494 | 24 |
| 26. | 0.10863 | 32 | 0.08407 | 30 |
| 27. | 0.11192 | 31 | 0.15213 | 22 |
| 28. | 0.26328 | 12 | 0.24334 | 10 |
| 29. | 0.23947 | 17 | 0.18938 | 18 |
| 30. | 0.30253 | 9 | 0.36020 | 7 |
| 31. | 0.21629 | 20 | 0.21834 | 15 |
| 32. | 0.26646 | 11 | 0.14435 | 25 |
| Weighted average | 0.23995 | 0.21873 | ||
| South Korea | Japan | |
|---|---|---|
| Production-inducing effects | ||
| Effects on other sectors | 0.62449 | 0.71478 |
| Effect on the electric power sector | 1.00000 | 1.00000 |
| Sum | 1.62449 | 1.71478 |
| Value-added creation effects | ||
| Effects on other sectors | 0.21376 | 0.20146 |
| Effect on the electric power sector | 0.30422 | 0.36567 |
| Sum | 0.51798 | 0.56713 |
| Wage-inducing effects | ||
| Effects on other sectors | 0.08422 | 0.08468 |
| Effect on the electric power sector | 0.08380 | 0.00347 |
| Sum | 0.16802 | 0.08815 |
| Job-creation effects a | ||
| Effects on other sectors | 2.44490 | 2.96095 |
| Effect on the electric power sector | 0.09775 | 1.0360 |
| Sum | 2.54265 | 3.99955 |
| Supply-shortage effects | 1.63620 | 1.18226 |
| Price effects b | 0.23995 | 0.21873 |
Disclaimer/Publisher’s Note: The statements, opinions and data contained in all publications are solely those of the individual author(s) and contributor(s) and not of MDPI and/or the editor(s). MDPI and/or the editor(s) disclaim responsibility for any injury to people or property resulting from any ideas, methods, instructions or products referred to in the content. |
© 2024 by the authors. Licensee MDPI, Basel, Switzerland. This article is an open access article distributed under the terms and conditions of the Creative Commons Attribution (CC BY) license (https://creativecommons.org/licenses/by/4.0/).
Share and Cite
Lee, S.-Y.; Bak, K.-M.; Yoo, S.-H. Comparison of the Roles of the South Korean and Japanese Electric Power Sectors in Their National Economies. Energies 2024, 17, 1186. https://doi.org/10.3390/en17051186
Lee S-Y, Bak K-M, Yoo S-H. Comparison of the Roles of the South Korean and Japanese Electric Power Sectors in Their National Economies. Energies. 2024; 17(5):1186. https://doi.org/10.3390/en17051186
Chicago/Turabian StyleLee, Seo-Young, Kyung-Min Bak, and Seung-Hoon Yoo. 2024. "Comparison of the Roles of the South Korean and Japanese Electric Power Sectors in Their National Economies" Energies 17, no. 5: 1186. https://doi.org/10.3390/en17051186
APA StyleLee, S.-Y., Bak, K.-M., & Yoo, S.-H. (2024). Comparison of the Roles of the South Korean and Japanese Electric Power Sectors in Their National Economies. Energies, 17(5), 1186. https://doi.org/10.3390/en17051186


