Article

Three-Dimensional Heterogeneity of the Pore and Fracture Development and Acoustic Emission Response Characteristics of Coal Rocks in the Yunnan Laochang Block

School of Energy Resources, China University of Geosciences, Beijing 100083, China
*
Author to whom correspondence should be addressed.
Energies 2024, 17(5), 1207; https://doi.org/10.3390/en17051207
Submission received: 6 February 2024 / Revised: 23 February 2024 / Accepted: 25 February 2024 / Published: 3 March 2024
(This article belongs to the Section H: Geo-Energy)

Abstract

:
Studying the heterogeneity of coal reservoirs is significant to coal bed methane (CBM) exploitation. To investigate the development of the pore–fracture and acoustic emission response characteristics of the coal rock in the Yunnan Laochang block, four cores were extracted from the same coal rock in different directions. Through a comprehensive analysis using CT scanning and three-axis compression tests combined with synchronous acoustic emission experiments, a three-dimensional visualization of the pore–fracture structure and an analysis of the acoustic emission process during the elastic phase were conducted. Additionally, the impact of the heterogeneous development of pore–fractures on the acoustic emission characteristics was discussed. The results show that: there is strong heterogeneity in pore and fracture development within the coal rock, with the most significant development occurring along the direction of vertical stratification; the acoustic emission process in the elastic phase can be divided into three stages: strong–weak–strong; the development of pores and fractures affects the acoustic emission characteristics, with both counts and signal strength increasing as the percentage of voids rises; and the inferred in situ stress aligns with strike-slip faulting stress using acoustic emission. These results can provide a reference for the actual project.

1. Introduction

The Laochang area in Yunnan is an important coal- and coal bed methane (CBM)-producing area in southern China. Understanding the coal rock structure and properties, as well as calculating the in situ stress of the reservoir, are crucial for the development and utilization of coal and CBM resources. The coal seams in this area are shallow, with numerous layers and a large total thickness [1]; the coal rock fractures are well-developed and often filled with minerals [2]; and the degree of coal metamorphism is high, and anthracite is more developed [3]. The Yuwang block (Figure 1), located in the southeast of the Laochang mining area, is a key block for CBM exploration and development, with the Upper Permian Longtan Formation and the Changxing Formation as the main coal-bearing strata [4]. Scholars have analyzed the characteristics of CBM reservoirs and the production capacity of this block, establishing geological models [5]. However, there is a lack of systematic research on the heterogeneity of the pore and fracture structure of the coal rocks in this area and the characteristics of the response of acoustic emissions. Additionally, research on the in situ stress of coal seams in this area is not comprehensive enough.
There exist a large number of irregular pores and fractures within rocks, whose morphology, size, distribution, and interrelationships contribute to the heterogeneity and anisotropy of rocks. Various methods can be used to study the pore structure inside the rock, including mercury intrusion porosimetry (MIP), nitrogen gas adsorption (NGD), nuclear magnetic resonance (NMR), scanning electron microscopy (SEM), field emission scanning electron microscopy (FESEM), and micro-CT (µ-CT). Among these techniques, µ-CT technology allows for the non-destructive imaging of rock pore structures through CT scanning, enabling the creation of a three-dimensional pore structure model [6]. In recent years, micro-CT technology has been increasingly utilized. Peng et al. used micro-CT technology to conduct a three-dimensional reconstruction of the shale oil reservoirs in the Dongpu Depression, obtaining information on pore distribution and characteristics [7]. Guo et al. analyzed the effect of the pore structure on the cluster morphology and displacement efficiency by µ-CT [8]. Li et al. conducted three-dimensional pore characterization and compared the primary, fragmented, scaled, and vesiculated coal through CT scanning [9]. Pant et al. used CT scanning to study pore connectivity in coal reservoirs and discussed the mechanisms of coal-to-methane biotransformation [10]. Zhang et al. used micro-CT to assess the impact of de-mineralization on coal porosity and permeability [11].
The acoustic emission phenomenon is generated during the process of pressure rupture of rocks. Scholars at home and abroad have conducted many studies on the acoustic emission phenomenon in rocks. Jia et al. discussed the acoustic emission process during the evolution of coal damage at different depths under triaxial compression [12]. Lisjak et al. numerically simulated the acoustic emission process of rock fractures based on a two-dimensional finite discrete element analysis [13]. Chen et al. investigated the mechanical properties of oil shale–coal composites through acoustic emission experiments under uniaxial compression [14]. Liu et al. found that the strain rate affected the rock acoustic emission characteristics [15]. Rodríguez et al. qualitatively and quantitatively analyzed acoustic emission signals during the fracturing of rocks [16]. However, to date, there have been few studies that consider the impact of the original pore and fracture structure of coal rocks on the acoustic emission phenomenon, and a comparative analysis of the acoustic emission response of coal rocks with three-dimensional heterogeneity has yet to be conducted.
In situ stress can be calculated economically and conveniently using the acoustic emission method [17], which relies on the Kaiser effect: the generation of a large amount of acoustic emissions occurs when the loading stress reaches or surpasses the maximum stress previously experienced by the rock [18]. This method, which involves identifying Kaiser stress points, is widely used in mining areas. For instance, Jiao et al. studied the in situ stress distribution law of the Xiaochangba mine based on the Kaiser effect [19], while Bai et al. applied an in situ stress measurement method utilizing the acoustic emission Kaiser effect to the Baijiao coal mine [20]. In situ stress can significantly affect the pore permeability properties of coal seams, providing valuable insights for underground project design [21]. Therefore, calculating in situ stress is crucial for effective coal mine production. However, there are few studies on the in situ stress in the Laochang block, and no scholars have used the acoustic emission method to predict the in situ stress in this region.
Therefore, in order to study the three-dimensional characteristics of coal rock pore and fracture development and the acoustic emission response characteristics in the Yunnan Laochang Yuwang block and summarize the correlation of pore–fracture development and the acoustic emission signals of samples in different directions without interference, this paper utilizes four columnar samples drilled in different directions from the same sample in the Xiaoaozi coal mine in the Yunnan Laochang Yuwang block. Through CT scanning and 3D visual modeling, we investigate the characteristics of the internal pore and fracture structural development of coal rock samples and compare the heterogeneity nature of pore and fracture development of the coal rock in different directions. A triaxial compression experiment and acoustic emission experiment are also conducted on the coal rock samples to analyze the strain condition and the characteristics of the acoustic emission signals generated by the samples under triaxial compression, to calculate the regional in situ stress condition and to compare the four samples in terms of the sampling direction and the differences of the internal pore and fracture structure of the coal rock. Then, we put forward the correlation between the acoustic emission characteristics of the coal rock samples and the original structure of the coal rock.

2. Sample Collection and Methods

2.1. Experimental Samples

The coal samples were taken from the No. 8 coal seam of the Xiaoaozi coal mine in the Yuwang block of Laochang, which is one of the main coal seams of the Laochang mining area. The types of coal rock are mainly semi-bright coal and semi-dull coal, with a single structure and occasional interbedded gangue [22]. The sampling depth was about 300 m. Standard cylindrical cores with a diameter of 25 mm and a height of 50 mm were drilled from the same coal sample in four different directions (parallel to stratification with face cleat at 0°, 45°, 90°, and vertical stratification, as illustrated in Figure 2a). These cores were sequentially designated as LXA8-S1, LXA8-S2, LXA8-S3, and LXA8-C, respectively (Figure 2b). The industrial analysis of the coal rock was carried out according to the national standard GB/T 212-2008 [23]. The test results are shown in Table 1, which indicates that these coal samples belong to the category of high-ash and low-volatile coal.

2.2. CT Scan Test

The CT scan test was performed on the core samples. The CT instrument used in this experiment was the Phoenix nanotom m CT detection system, produced by the General Electric Company of the United States. This system featured a maximum voltage of 180 kV, power range of 1~20 W, and a remarkable minimum resolution of 0.2 µm. The core samples were placed on the rotary table of the CT instrument. After adjusting the parameters of the equipment, the rotary table rotated 360° for CT scanning. Each of the four samples was scanned from multiple perspectives—front and back, left and right, and up and down—resulting in 3260 slices per scan.

2.3. Coal Rock Compression and Acoustic Emission Tests

The core samples underwent triaxial compression testing accompanied by simultaneous acoustic emission monitoring. The device used in the experiment consisted of several integral components: a high-temperature and high-pressure triaxial chamber, a peripheral pressure pressurization system, an axial pressurization system, a heating and constant temperature system, and a data acquisition and control system. The maximum design index for the peripheral pressure of the triaxial chamber was 100 MPa, and the diameter of the rock sample was accommodated to be 50 mm. Sensors within the autoclave were utilized to measure the axial load and strain experienced by the rock samples during testing. For the triaxial compression experiment, the acoustic emission signal monitoring device was turned on at the same time, which can record the acoustic emission signal generated throughout the loading process. Once the core samples were securely placed in the autoclave, the confining pressure was adjusted to 10 MPa, which is close to the state in the actual reservoir according to the logging data [24]. The axial load was then applied at a rate of 100 N/s, and the strain and acoustic emission signals generated by the sample during loading were carefully recorded. The experiment was conducted at room temperature.

3. Analysis of the Coal Rock Pore and Fracture Structure

3.1. Three-Dimensional Reconstruction of the Coal Rock Based on Avizo

The images obtained through CT scanning were two-dimensional, and they were reconstructed into three dimensions using the Avizo 2020.1. The grayscale of each pixel point in a CT-slice grayscale image corresponds to the density of the component [25]. Coal rock cores are mainly composed of minerals, matrix, and voids. The density of minerals is the highest, appearing white on the slice image; the density of voids is the lowest, appearing black on the slice image; and the density of matrix is between the first two, appearing gray on the slice image.
The original CT slice images were cropped, and an interactive threshold segmentation algorithm was used to set the threshold. The grayscale of the minerals was set from 170 to 255, and the grayscale of the voids was set from 0 to 35. By binarizing the grayscale of the image, it was possible to distinguish the three components of the matrix, voids, and minerals in the coal rock. The specific image-processing procedure is shown in Figure 3, and the blue area in Figure 3c is the distinguished mineral distribution. Then, we used three-dimensional reconstruction and visual display to establish a three-dimensional pore and fracture network model of the coal rock sample and identified the different sizes of pore and fracture with different colors (Figure 4). As shown in Figure 4, there is an obvious difference in the pore and fracture development of the different samples. Large exogenous fractures that cut diagonally through the stratification plane are evident in the samples oriented vertically to the stratification plane (sample C), while the three samples oriented parallel to the stratification plane mainly develop small pores mainly in the cis-layer, without exogenous fractures, and endogenous fractures are also not obvious. In addition, the pore and fracture development in the samples is affected by the distribution of minerals and coal matrix in different areas. The difference between the three samples oriented in the direction of the parallel stratification plane reflects the strong heterogeneity of the coal reservoir.

3.2. Characteristics of the Coal Rock Pore and Fracture Development

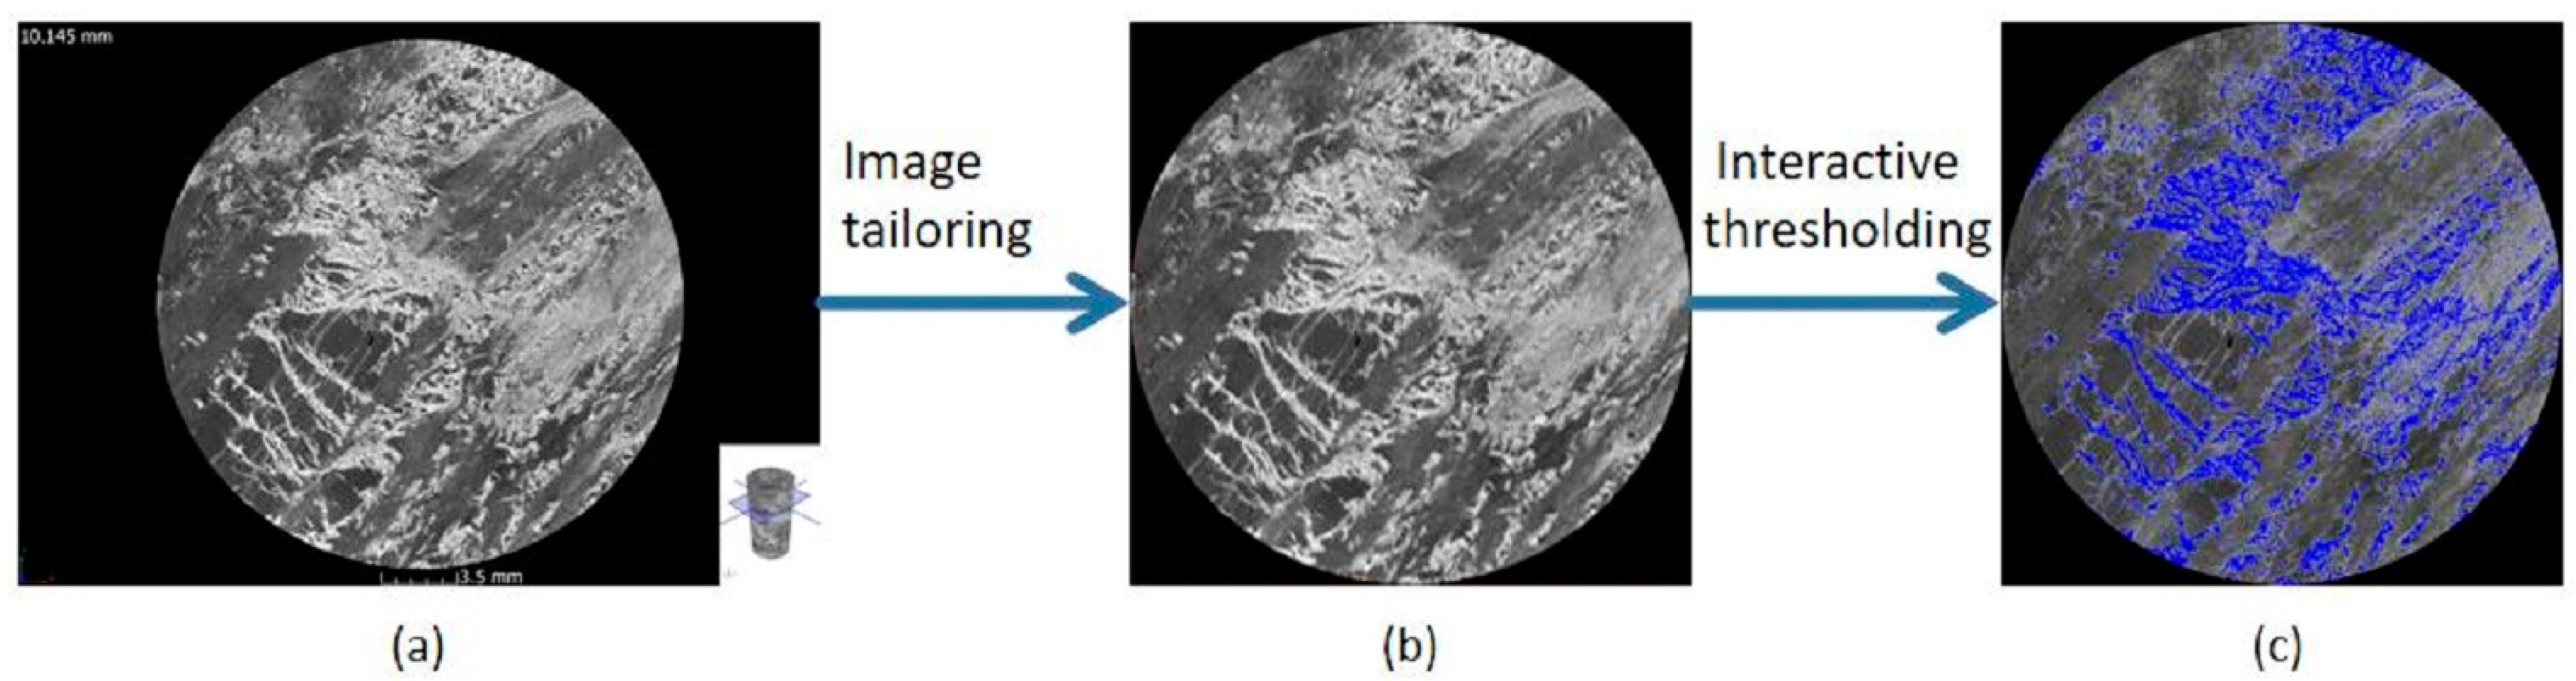
3.2.1. Distinguishing between the Pore and Fracture

The spatial morphology of voids in coal rocks is diverse, and it is not possible to distinguish between pores and fractures using threshold segmentation, which requires further delineation based on shape. Fractures are generally larger and have a narrow morphology, whereas pores are generally smaller and closer to a spherical shape than fractures [26]. Li et al. [27] and Zhu et al. [28] both used the shape factor method to classify the voids. The shape factor is calculated as:
S F = A 3 36 × π × V 2 ,
where SF is the shape factor, A is the surface area of the 3D space (μm2), and V is the volume of the 3D space (μm3).
Using the shape factor as an indicator, three-dimensional voids with SF ≥ 40 were defined as fractures, while three-dimensional voids with SF < 40 were defined as pores. Subsequently, the volume, surface area, location, and diameter of each pore and fracture were derived independently, and the pore percentage and fracture percentage were calculated. The detailed statistics are presented in Table 2.
It should be noted that the recognition capability of CT scans depends on the resolution. In this experiment, the minimum resolvable pore diameter for samples S1, S2, and S3 was 14 μm, while for sample C, it was 28 μm. All pores and fractures in the diagrams in this paper referred to those that can be recognized. As nanoscale pores are dominant in the coal rock, the actual porosity of each sample is significantly higher than what is listed in Table 2.

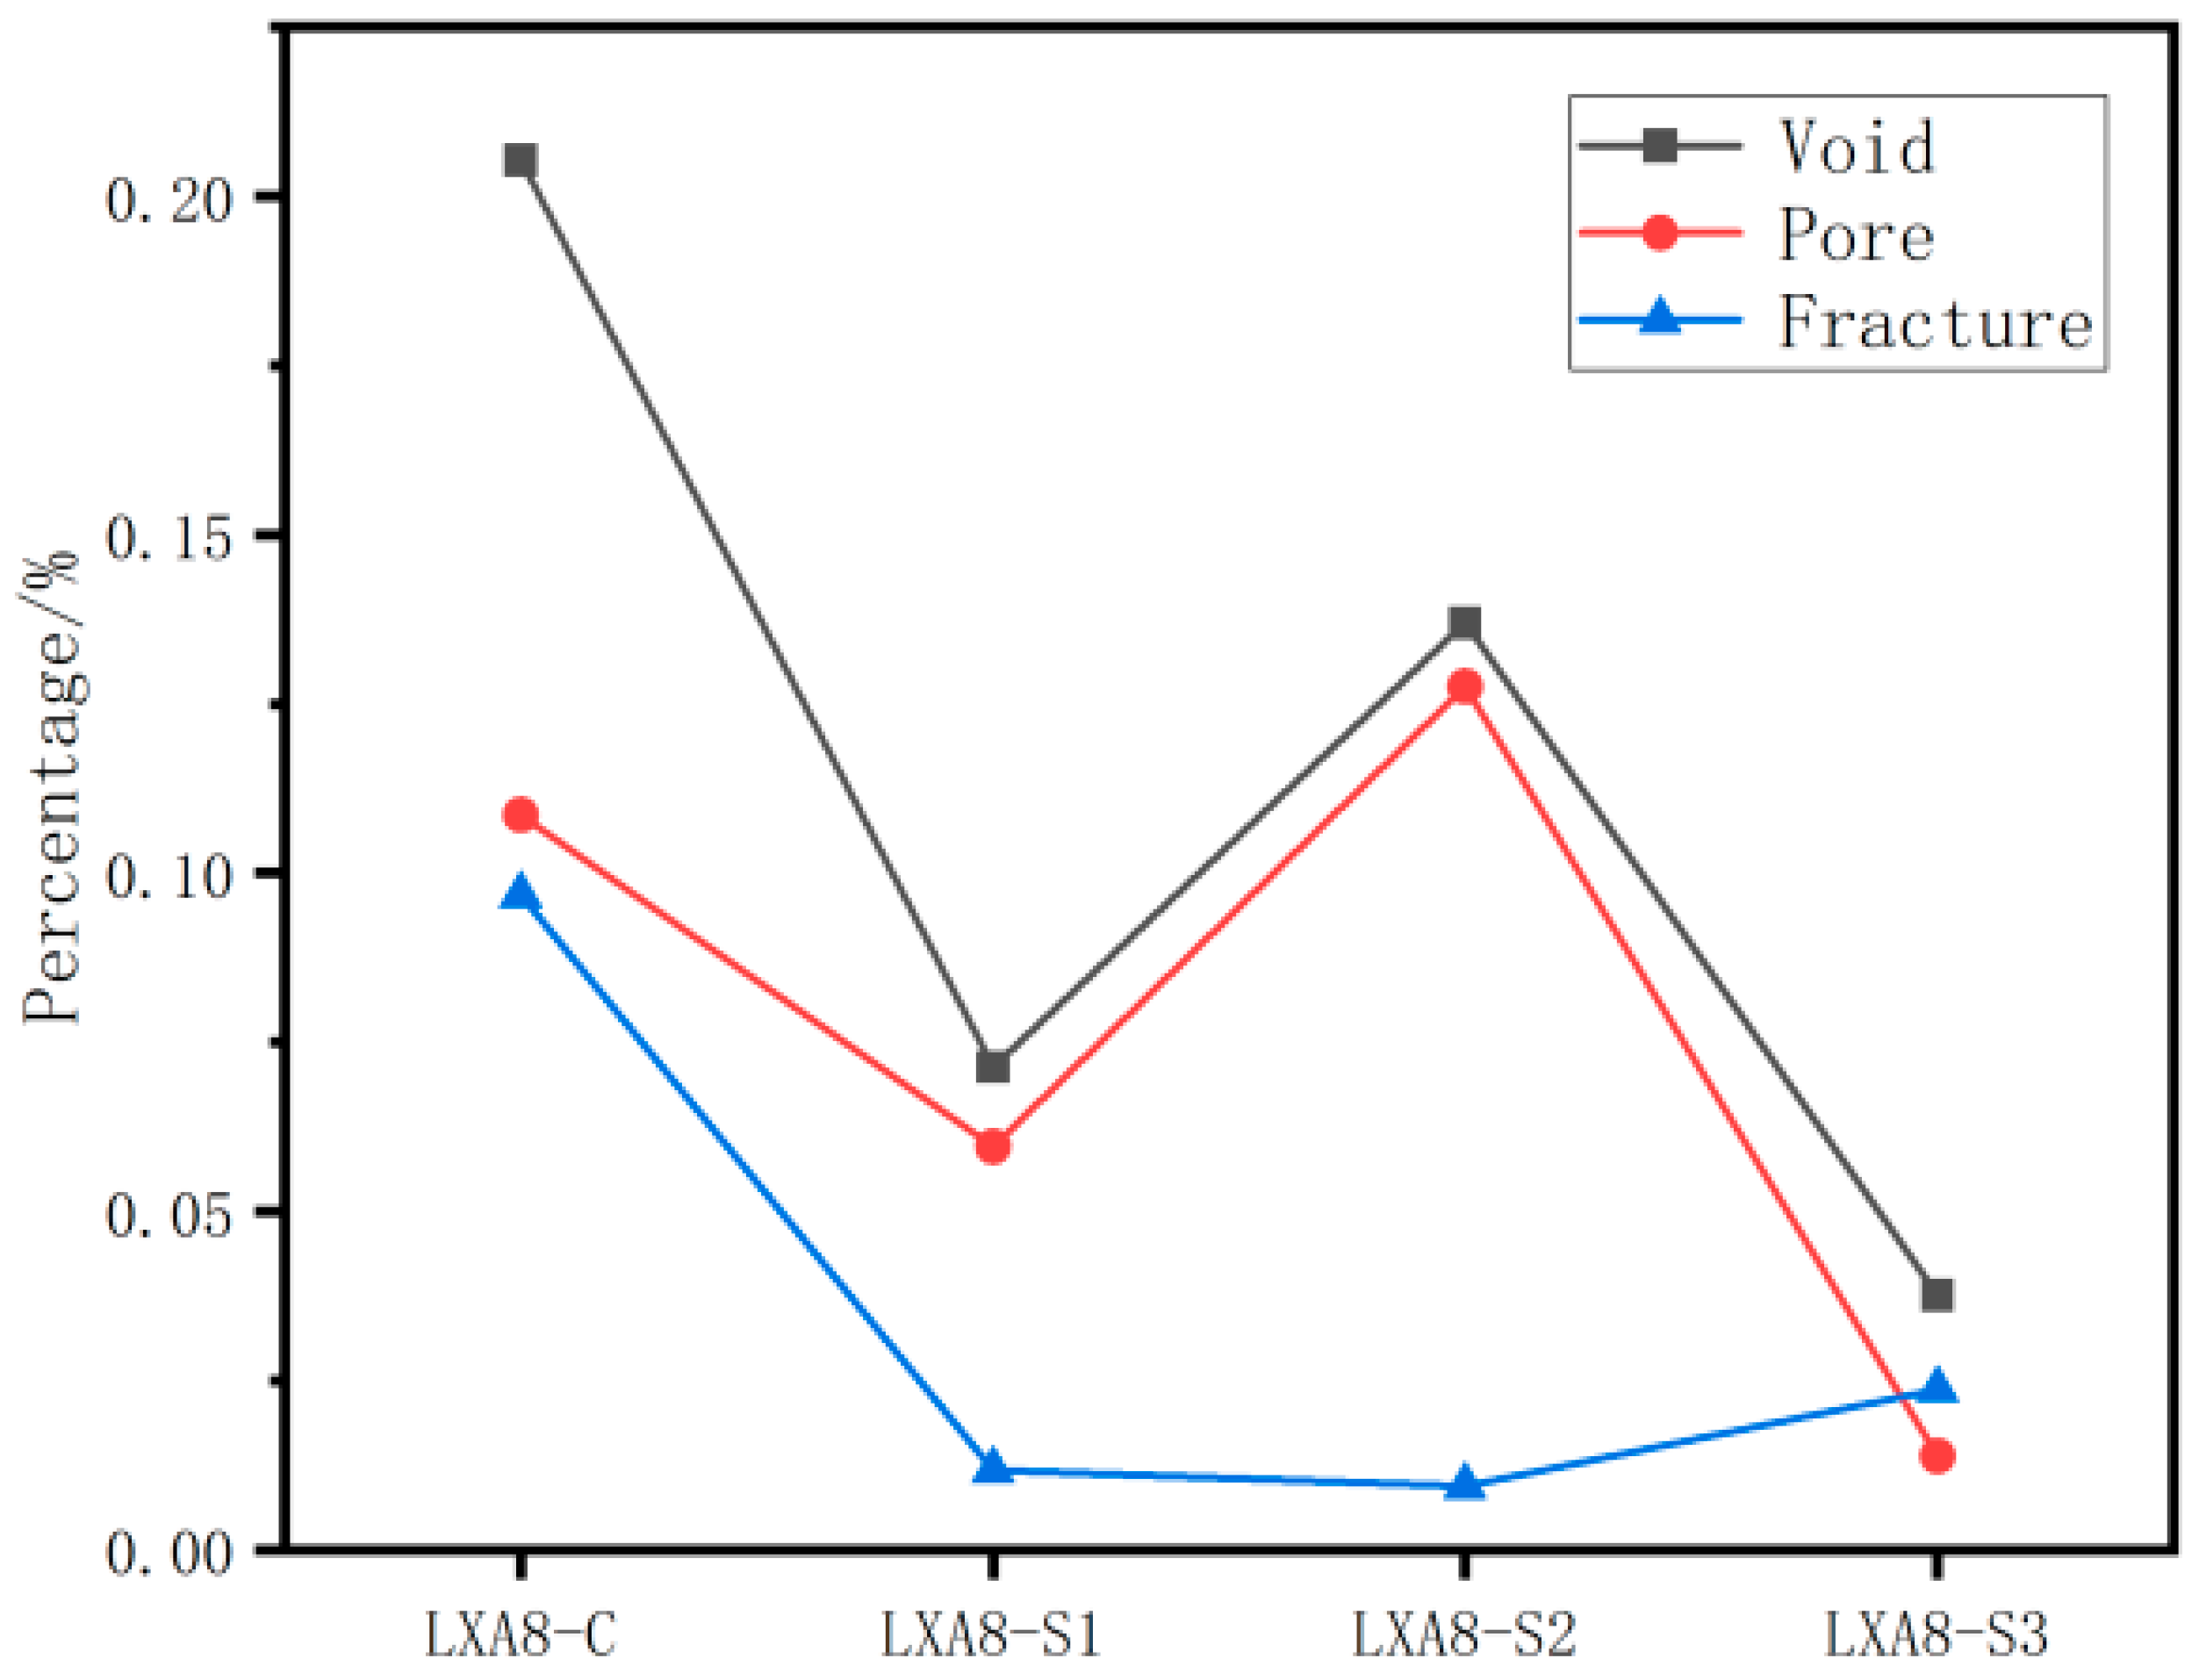
3.2.2. Distribution and Percentage of the Pores and Fractures

As seen in Figure 4 and Table 2, the distribution of voids in sample C is dense, with the highest percentage up to 0.2054%, and it contains some large fractures that cut the stratification plane obliquely, probably caused by tectonic movements. According to previous research, the study area underwent many tectonic movements, which led to the extensive development of fractures. The geophysical logging data show that thick coal seams are prone to the formation of granulated coal and mylonitized coal [4]. The distribution of voids in sample S2 is also dense, but almost exclusively with very small pores and fractures, with a void percentage of 0.1370%. Sample S1 has fewer voids, clustered only in the lower center, with a void percentage of 0.0714%. The distribution of voids in sample S3 is much sparser, with a percentage of 0.0376%. It is evident that the voids are most developed in sample C drilled in the vertical stratification plane. In the parallel stratification plane, the void of sample S2 drilled at 45° to the face cleat is relatively developed, the void of sample S1 drilled parallel to the face cleat is poorly developed, and the void of sample S3 drilled vertically to the face cleat is very little developed.
When comparing the pore and fracture percentage of each sample (Figure 5), it is evident that the pore percentage is higher than the fracture percentage for all samples, except sample S3. This is especially true for sample S2 and sample S1, where the pore percentage is much larger than the fracture percentage. In terms of pore percentage, sample S2 is the highest at 0.1276%; sample C is the next highest at 0.1086%; sample S1 comes in third at 0.0596%; and sample S3 has the lowest pore percentage at 0.0139%. Since the smallest resolvable pore in sample C is larger than that in the other three samples, its pore percentage is lower than what it actually is. If the experimental resolution of sample C was consistent with the other three samples, its pore percentage would be even higher. It can be concluded that the pores of sample C and sample S2 are more developed, followed by those of sample S1, while the pores of sample S3 are less developed.
In terms of fracture percentage, sample C has the highest value at 0.0968%, much higher than the other three samples; sample S3 follows, with a fracture percentage of 0.0237%; the fracture percentages for sample S1 and sample S2 are very low, at 0.0118% and 0.0094%, respectively. This suggests that sample C has the most developed fractures; the three samples drilled in the parallel stratification plane have less developed fractures, and sample S3 contains more fractures than samples S1 and S2.

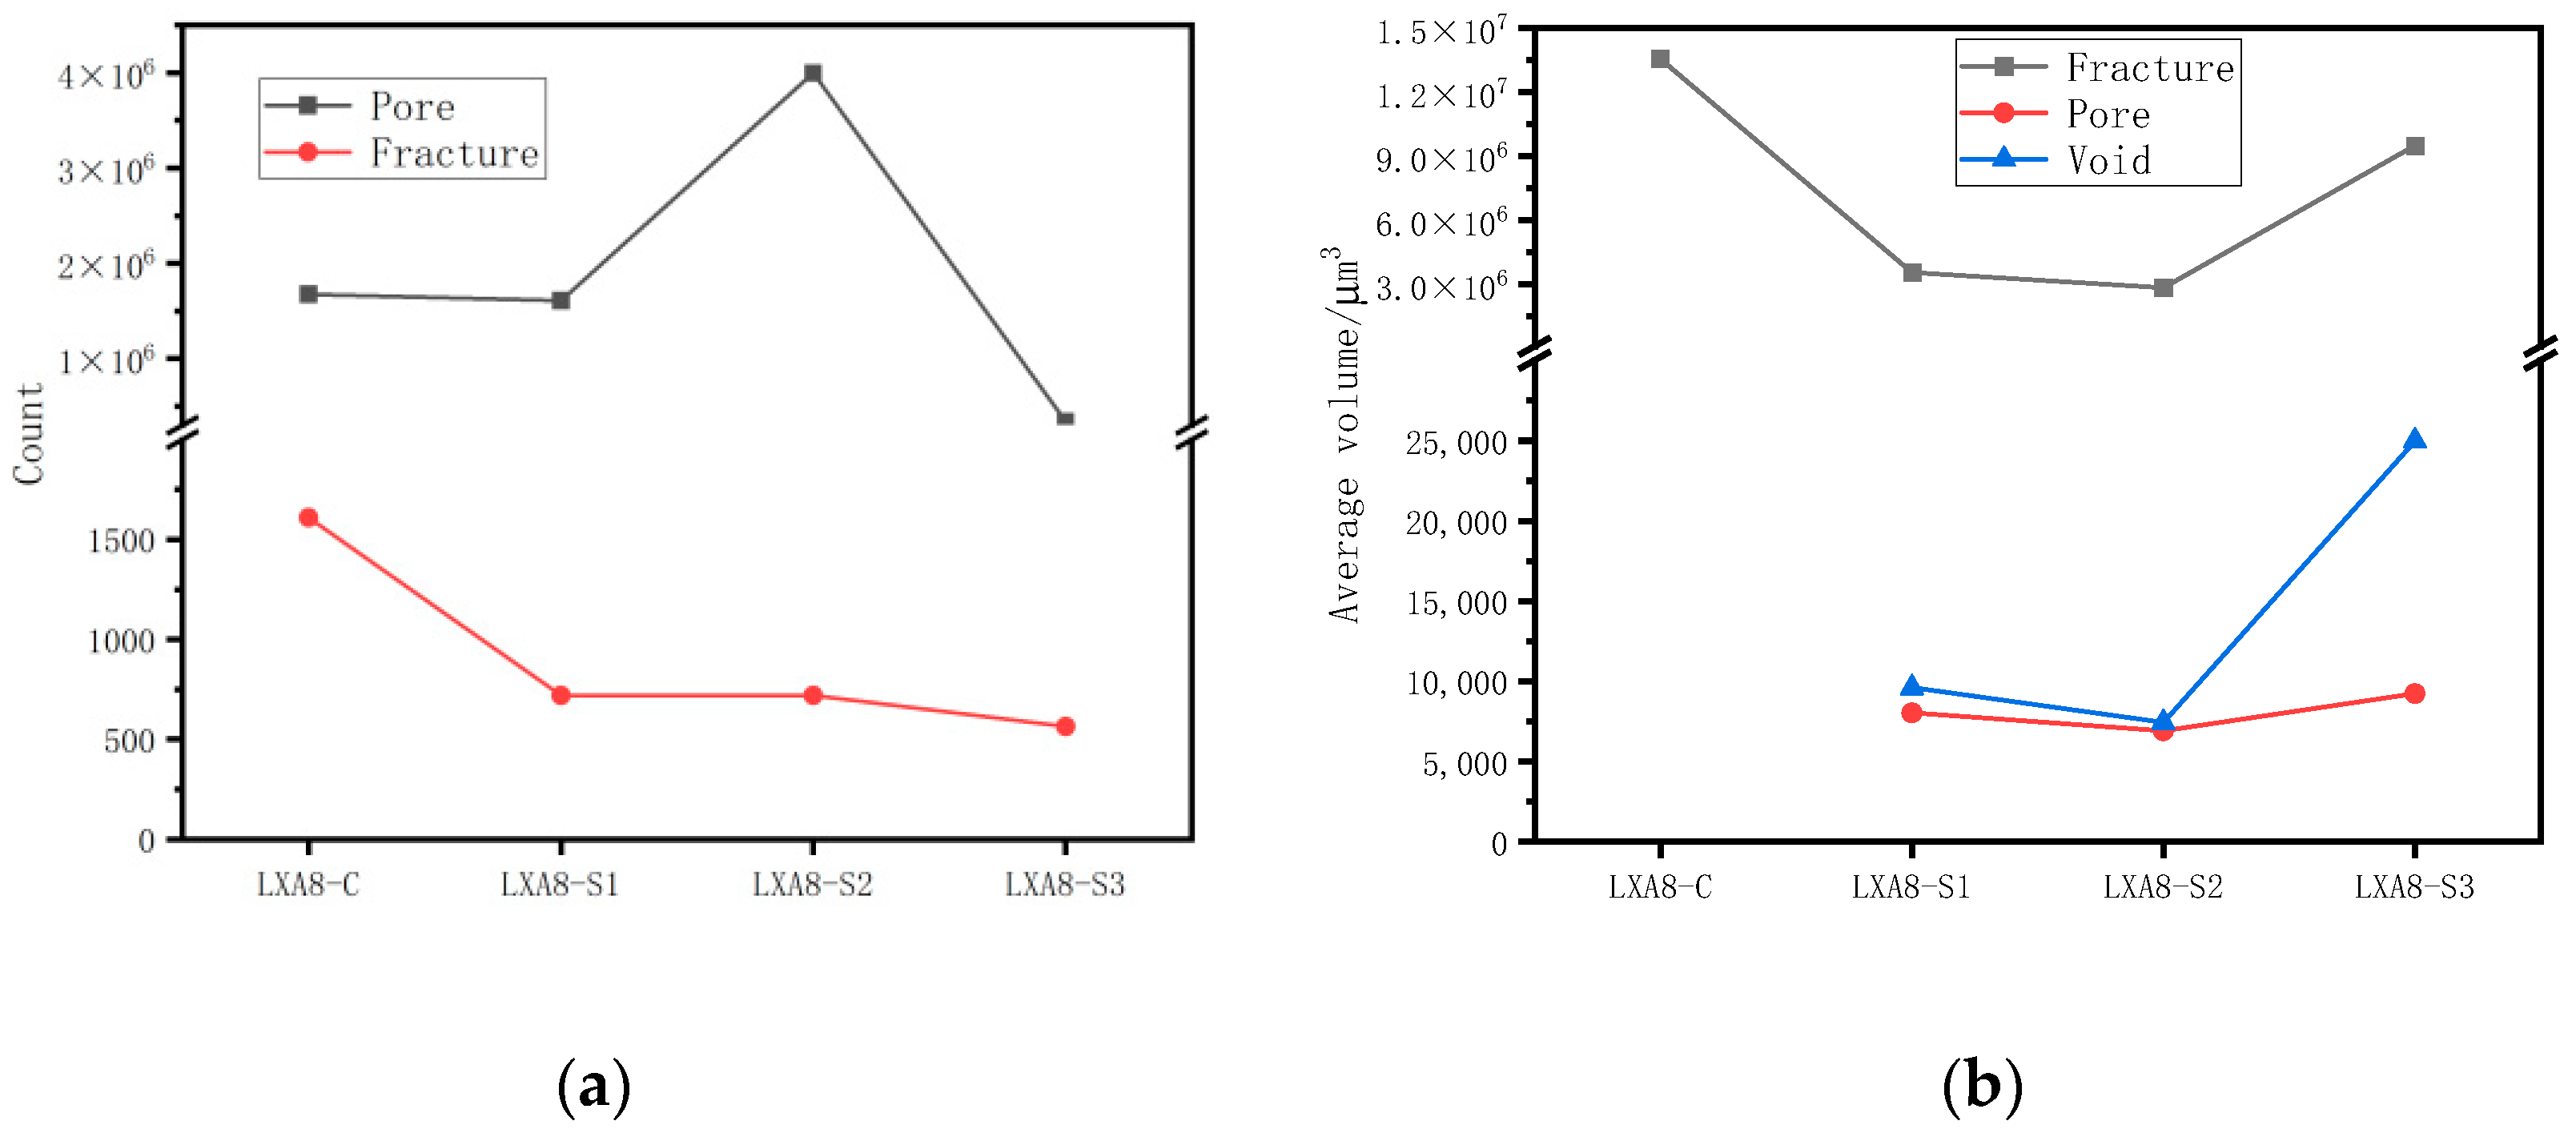
3.2.3. Number and Average Volume of the Pores and Fractures

When comparing the number of pores and fractures in each sample (Figure 6a), it is clear that sample S2 has the highest number of pores at 3,999,514; samples C and S1 follow closely, while sample S3 has the lowest number of pores at 338,556. The highest number of fractures was found in sample C with 1609 fractures; sample S1 and sample S2 are next in line, both with 720 fractures; and sample S3 has the lowest number of fractures at 564. As mentioned before, the pores in sample C, with pore diameters located between 14 μm and 28 μm, were not identified as in the other three samples, and the number of pores in this part of the sample is high; so, actually, the number of pores in sample C should be much higher than that of the experimental results. Similarly, sample C could not be compared with the other samples in terms of the average pore volume and average void volume.
As shown in Figure 6b, of samples S1, S2, and S3, the average volume of voids is the largest for sample S3, which is 24,976 μm3, significantly larger than those of samples S1 and S2; the average volume of voids in sample S1 is 9604 μm3, and the average volume of voids in sample S2 is 7434 μm3. The average pore volumes of the three samples drilled in the parallel stratification plane are, in descending order, sample S3 (9226 μm3) > sample S1 (8044 μm3) > sample S2 (6925 μm3). Sample C has the largest average volume of fractures at 13,543,795 μm3; the average volume of the fractures in sample S3 is 9,488,337 μm3, while the average volume of the fractures in sample S1 and sample S2 is small, both less than 5 × 106 μm3. In summary, sample C and sample S3 have a large volume of pores and fractures, while samples S1 and S2 have a small volume of pores and fractures.
From the above analysis, it can be concluded that the pores and fractures developed in sample C, drilled in the direction of vertical stratification, are large and numerous, and the characteristics of pore and fracture development can be summarized as “numerous and large”. On the parallel stratification plane, sample S3, drilled perpendicularly to the face cleat, has the lowest number of pore fractures but has a large volume, and the characteristics of the development of pores and fractures can be summarized as “few but large”; sample S2, drilled in a 45° direction to the face cleat, has a large number of pores and fractures with small volumes, and the characteristics of the development of pores and fractures can be summarized as “numerous but small”; sample S1, drilled in the direction of the parallel face cleat, has a moderate number of pores and fractures among the four samples and is smaller in volume.

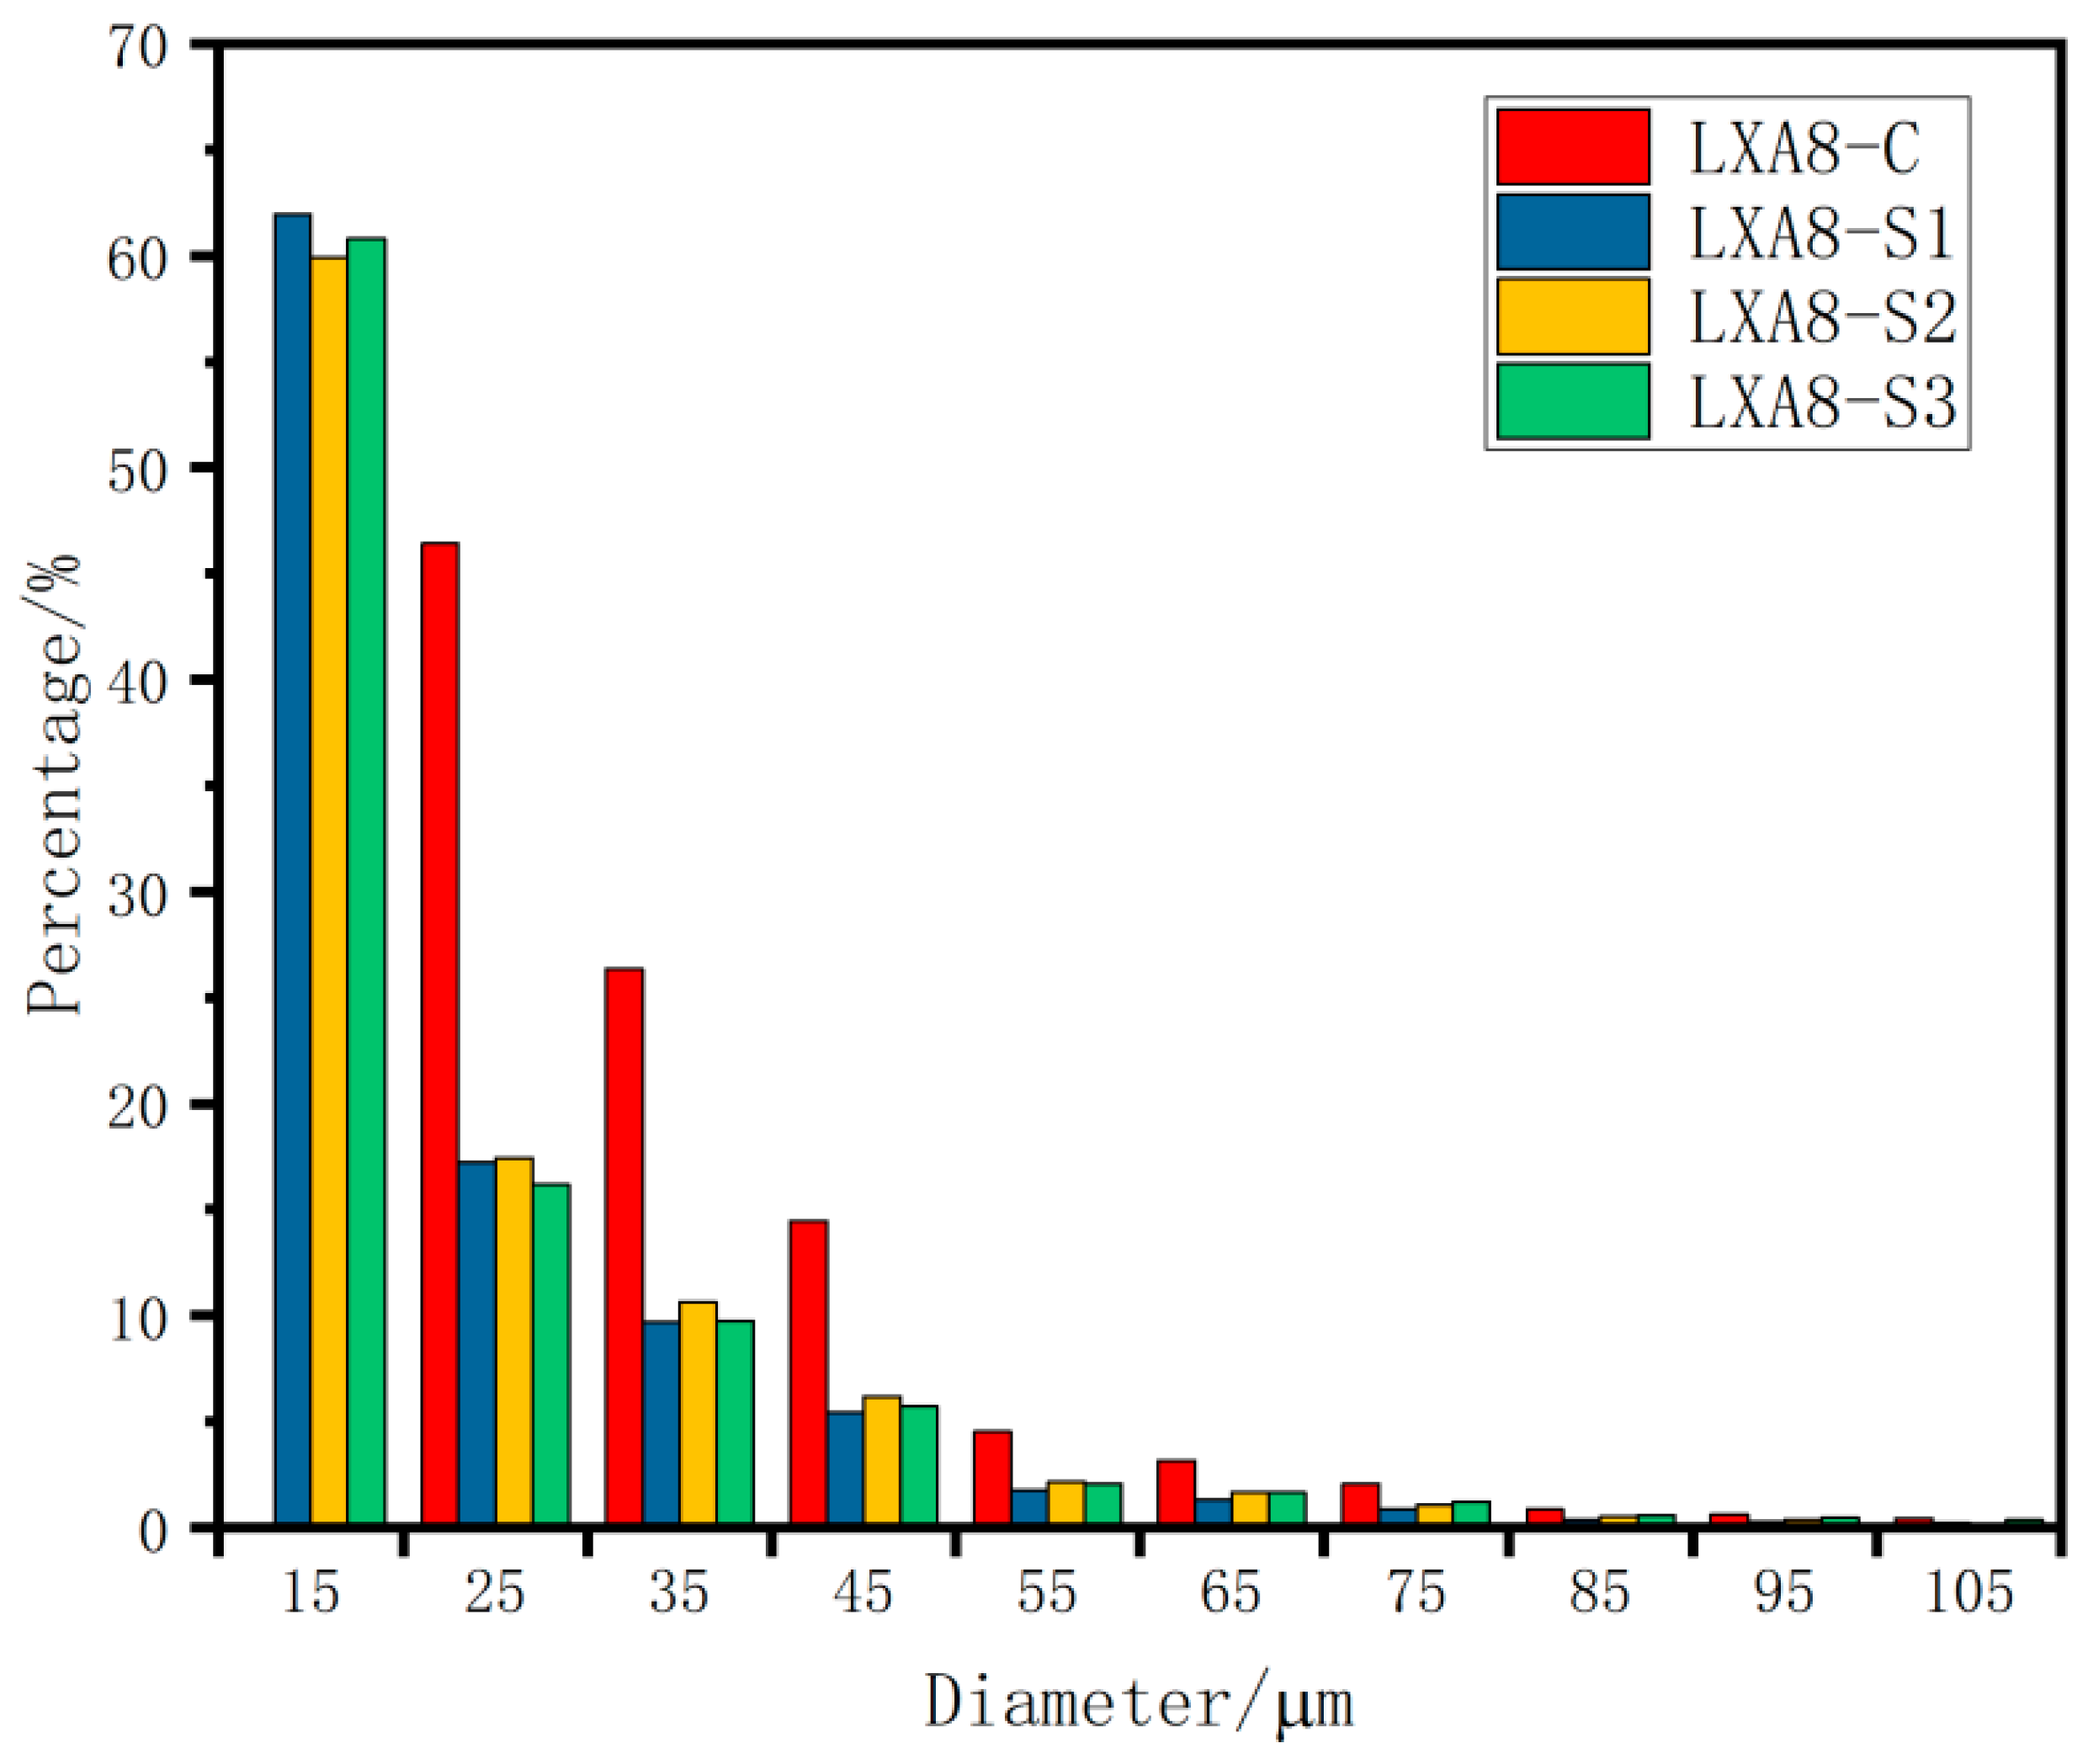
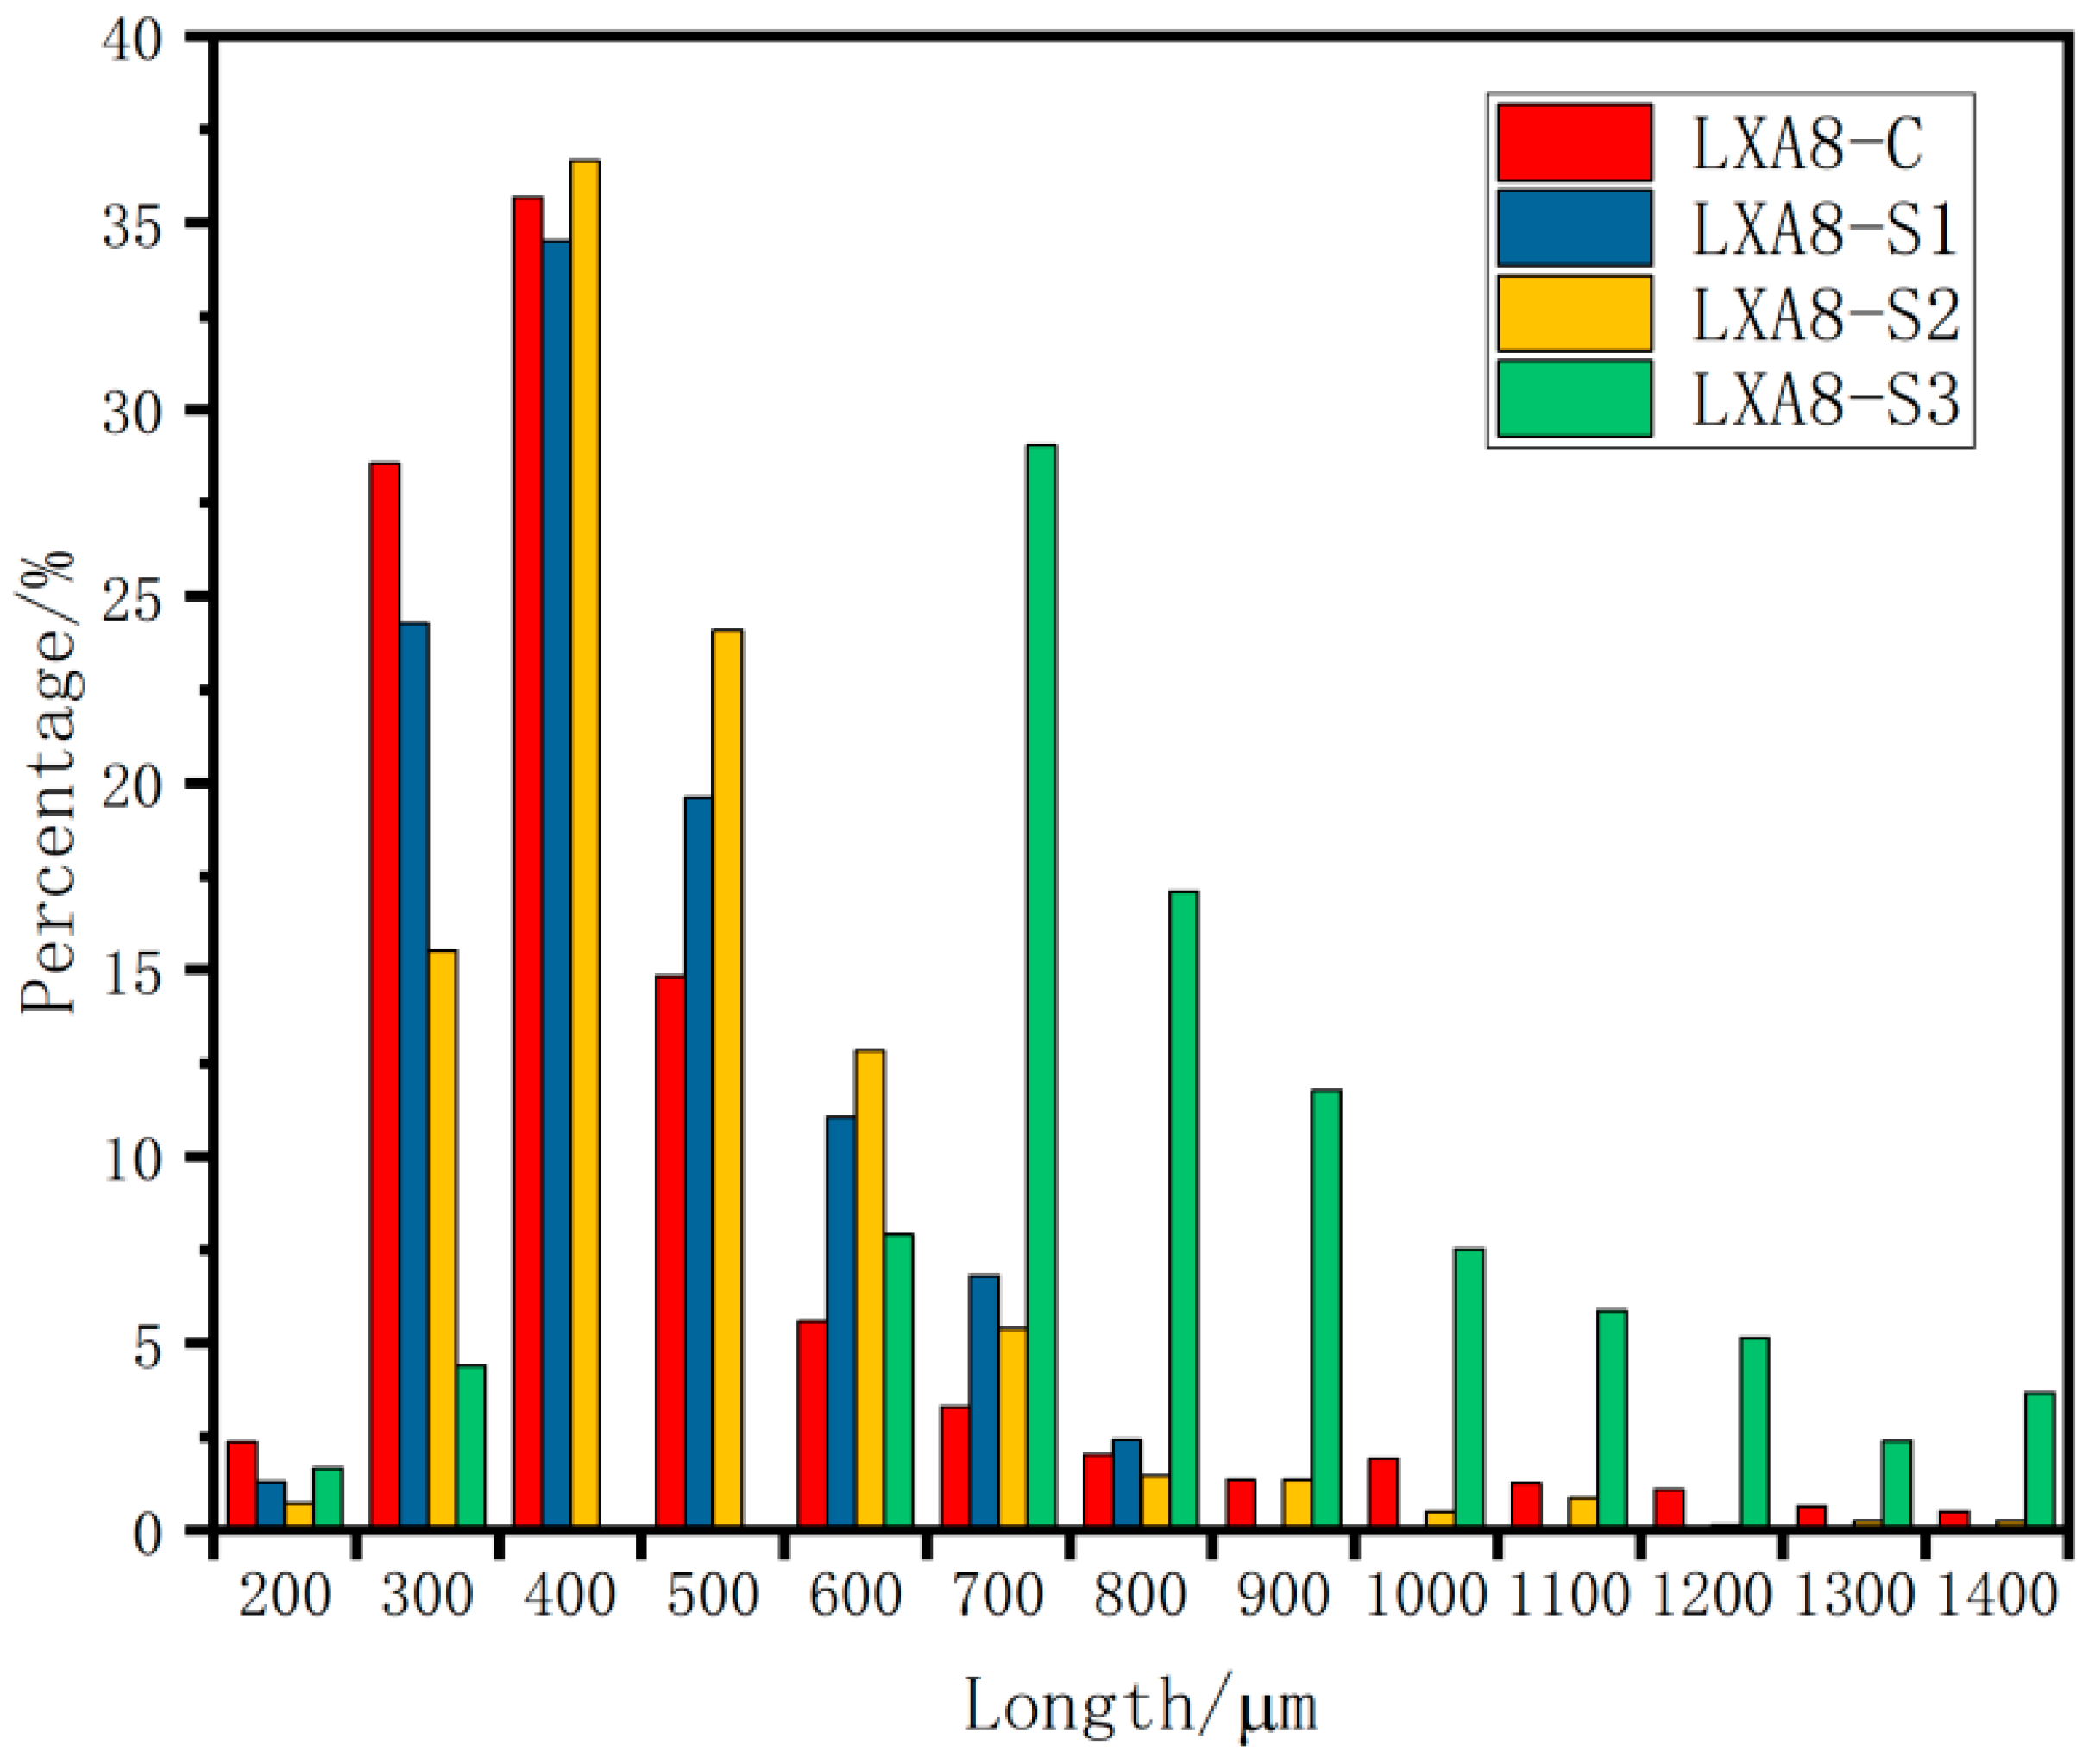
3.2.4. Void Size Distribution

The majority of the coal rock contains small voids. Figure 7 displays the pore diameter distribution of the four samples, making it clear that pores with small diameters constitute a significant proportion. Samples S1, S2, and S3 share similarities, where pores with diameters smaller than 20 μm account for about 60% of the total pores. Conversely, the histogram morphology of sample C is slightly different from those of S1, S2, and S3 due to its <28 μm pores that cannot be recognized. Nevertheless, the percentage of pores with diameters smaller than 40 μm in sample C is more than 70%, consistent with the other three samples, as the percentage of larger-diameter pores is very low.
Figure 8 shows the distribution of the fracture lengths of the samples. In general, the fractures with small lengths are in the majority. Among them, samples C, S1, and S2 have the highest percentage of fractures with lengths around 400 μm, and nearly 90% of the fractures have lengths below 600 μm. However, the highest percentage of sample S3 is the fracture with a length of about 700 μm, while fractures with a length of more than 800 μm account for nearly 50%, which is much higher than that of the other three samples. It is worth mentioning that, as shown in Table 2, sample S3 has the lowest number of fractures, but its fracture percentage is higher than that of samples S1 and S2, precisely due to its average fracture length of reaching up to 900 μm and its average fracture volume being higher than that of samples S1 and S2.

4. Compressive Properties and Acoustic Emission Characteristics of the Coal Rock

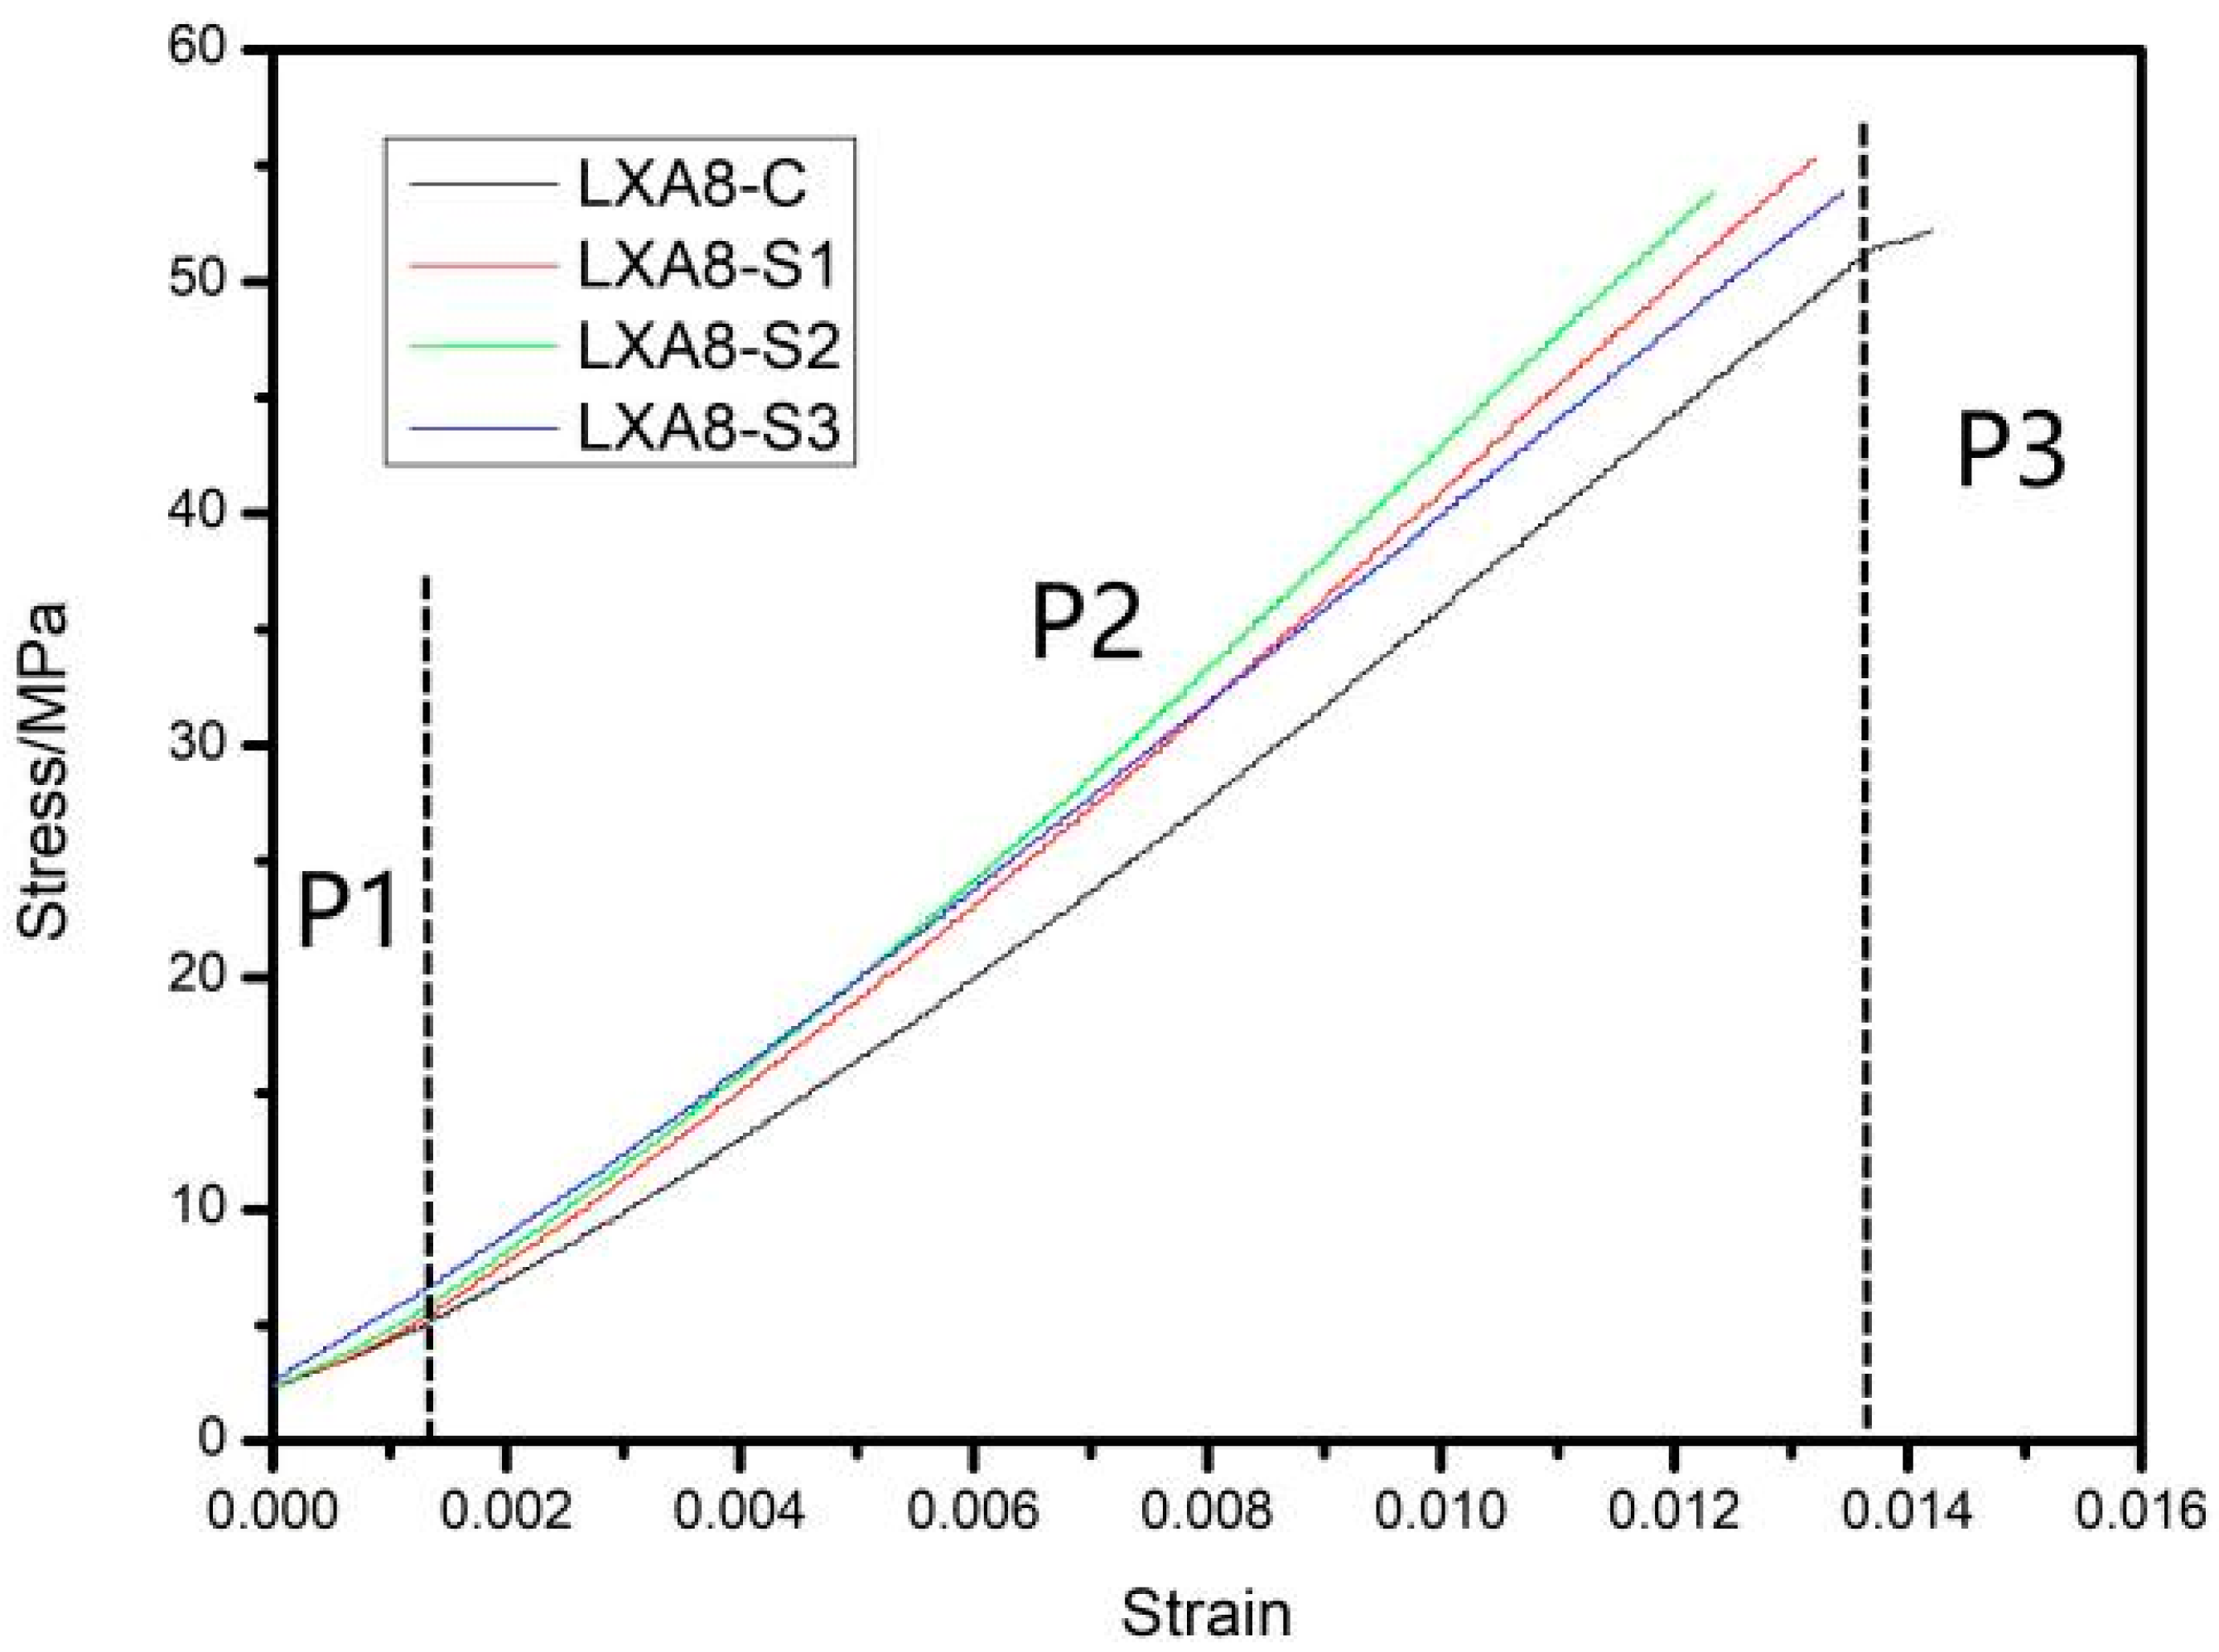
4.1. Analysis of the Stress–Strain Curve of the Coal Rock

The process of compressing rocks to the point of failure essentially occurs as cracks initiate, propagate, and coalesce [29]. The deformation damage of rocks before peak strength includes four stages: crack closure stage, elastic stage, stable crack growth stage, and unstable crack growth stage [30]. The four stage endpoints correspond to four stress thresholds, i.e., crack closure stress, crack emergence stress, crack damage stress, and peak strength [31]. Figure 9 illustrates the triaxial compressive stress–strain curves for the four samples. All four curves begin with a brief, slightly upward concave phase (labeled as P1 in Figure 9), known as the crack closure phase, in which the micropore fractures shrink and the distance between the grains decreases. The brevity of this compaction phase indicates that the coal rock is relatively dense. Next comes the crack closure stage, in which the curves enter a prolonged linear phase (labeled as P2 in Figure 9), indicating the elastic deformation of the rock.
The confining pressure for the triaxial compression test was set at 10 MPa. This pressure enhances the bearing capacity of numerous microfractures within the coal rock samples, significantly increasing their yield limit [32]. Until the load of 25 kN and the stress of about 50 MPa, the four samples were almost still in the elastic stage without any macroscopic damage; only sample C showed a flattening in the stress–strain curve, displaying some degree of signs of yielding (labeled as P3 in Figure 9). This finding is aligned with the results reported by Cheng et al., who observed that, under a high confining pressure, the peak strength of coal rock increased, making the specimen more resistant to damage [33].
The modulus of elasticity formula is as follows:
E = σ ε ,
where σ is the change in the linear segment stress and ε is the change in the linear segment strain.
The calculated modulus of elasticity for all four samples is relatively small, not exceeding 5 GPa (Table 3). Among them, sample S2 has the largest modulus of elasticity, followed by sample S1 and then sample S3, and sample C has the smallest modulus of elasticity, which is only 3.778 GPa. To verify the accuracy of the results, a comparison was made with the logging data [34,35], which shows that the average value of the elastic modulus measured from the logging data of No. 7 + 8 coal seam in the Laochang area was 4.40 GPa [36], and the measured values of elastic modulus for the samples were closer to the logging data.
The modulus of elasticity for the four samples exhibits a negative correlation with the percentage of fractures and the average volume of those fractures (Figure 10), which suggests that the elastic properties of the coal rock are related to the development of fractures and that the coal samples with more developed fractures have a lower modulus of elasticity. In particular, the presence of larger micro-fractures may allow more space for the deformation of the coal rock, resulting in a more plasticized material. Moreover, this experiment was carried out at a 10 MPa confining pressure. Previous research by Qi et al. has shown that confining pressure can compress and reduce microporous fractures within the coal rock, leading to increased friction and slip deformation [37], ultimately resulting in a higher measured modulus of elasticity. This observation can also indicate that the pores and fracture space affect the mechanical properties of the coal rock.

4.2. Coal Rock Acoustic Emission Characteristics

The phenomenon in which a large number of tiny fractures within a rock undergo external forces, leading to the closure, expansion, and penetration between the fractures and the release of energy in the form of elastic waves, is referred to as rock acoustic emission (AE) [38]. By analyzing the variations in the acoustic emission parameters throughout the loading and unloading processes, it is possible to establish a correlation between the acoustic emission characteristics and the material’s internal deformation evolution [39,40].
The accumulative acoustic emission count curves and signal strength characteristics of the four samples are shown in Figure 11. The graph can be divided into three phases. In the first phase, lasting approximately 200 s, the acoustic emission signal is dense, with a high signal strength, a high number of events, and a rapid increase in the accumulative counting curve. The second phase spans from approximately 200 to 350 s (from 200 to 300 s for sample S3). During this phase, the acoustic emission signals become sparse, with a lower signal strength, fewer events, and a relatively flat accumulative counting curve. The third phase starts at approximately 350 s (300 s for sample S3). In this phase, the acoustic emission signals are very dense, with high signal strengths and significant values. The number of events is high, and the accumulative counting curve exhibits a steep pattern.
The acoustic emission accumulative count characteristics and signal strength characteristics in Figure 11 differ from those in some previous studies. As in the studies of Liu et al. [41] and Wang et al. [42], the accumulative counts and accumulative energies of acoustic emissions are low in the pre-elastic phase, while the accumulative curves show a sudden increase when the coal rock approaches yielding, along with a significant increase in the frequency and strength of the acoustic emission events. This is because the triaxial compression experiments in this study did not destroy the coal rock and characterized the compression and pre-elastic phases, in which the acoustic emission signals generated were much less intense and frequent than in the yielding and destructive phases. The three phases in Figure 11 in this paper correspond to the acoustic emission characteristics within the low state of the previous period. In the third phase, particularly when the stress reaches about 45~50 MPa, a peak in the acoustic emission signal appearance is observed. Acoustic emission features that exhibit high frequency, high energy, and surge characteristics may indicate the response of the coal rock elastic deformation approaching the yield state.
The differences in experimental conditions, such as enclosure pressure conditions and loading rates, can lead to changes in the acoustic emission characteristics. Compared to the experiments of Gao et al., it was observed that, as the loading rate increases, the acoustic emission characteristics exhibit a step-like growth [43], which is one of the reasons why the acoustic emission accumulative curve characteristics in the experiments presented in this paper exhibit multiple step-shape characteristics.

4.3. Determination of the Kaiser Effect Point for Acoustic Emission

There are various methods for determining the acoustic emission Kaiser effect point. Nowadays, it is common to use the surge point of a metric of acoustic emission on the time axis as the Kaiser effect point [44]. However, this method is limited to relatively ideal circumstances, where there are clear surge mutation points on the relationship graph, and subjectivity plays a significant role. Zhao et al. calculated the tangent intersection of the accumulative counts of the acoustic emission versus time curves without obvious inflection points, and then calculated the acoustic emission energy correlation dimension to comprehensively interpret the Kaiser effect points [45]. The accuracy of the discrimination can also be improved by wavelet analysis methods [46]. In addition, previous studies have shown that the acoustic emission Kaiser effect point identification accuracy is higher under triaxial compression than under uniaxial compression [47].
To enhance the accuracy of the Kaiser effect point discrimination, the experiment in this paper was conducted at a confining pressure of 10 MPa. However, the acoustic emission accumulation curves observed in this study exhibit a complex morphology, making it more challenging to solely rely on these curves for Kaiser effect point discrimination. Moreover, there is a higher likelihood of error. Given the interrelationship among the various acoustic emission indicators, it is feasible to look for points where multiple indicators (including accumulative counts of acoustic emission and signal strength) simultaneously undergo significant changes. By combining these data with the historical evolution of regional structures, we can accurately determine the Kaiser effect points and their corresponding stress values (Figure 11). Notably, the Kaiser stress values obtained for the four samples are relatively low, ranging around 15 MPa, which is attributed to the shallow burial depth of the coal seam that experienced less historical stress previously.

4.4. In Situ Stress Calculation Using the Acoustic Emission

Based on the theory of elastic mechanics and previous research, the formula for calculating triaxial in situ stress by acoustic emission method is as follows [48]:
σ v = σ K P c ,
σ H = σ 0 ° + σ 90 ° 2 + σ 0 ° σ 90 ° 2 1 + tan 2 2 θ 1 2 K P c ,
σ h = σ 0 ° + σ 90 ° 2 σ 0 ° σ 90 ° 2 1 + tan 2 2 θ 1 2 K P c ,
tan 2 θ = σ 0 ° + σ 90 ° 2 σ 45 ° σ 0 ° σ 90 ° ,
where σ v , σ H , and σ h , respectively, are the vertical principal stress, the maximum horizontal principal stress, and the minimum horizontal principal stress; σ , σ 0 ° , σ 45 ° , and σ 90 ° , respectively, are the values of Kaiser point stresses in the vertical, 0° direction, 45° direction, and 90° direction; K is the perimeter pressure correction factor; and P c is the confining pressure.
According to the above equation, the calculated in situ stress results are summarized in Table 4. Upon the examination of the data, it is evident that the vertical principal stress is between the maximum horizontal principal stress and the minimum horizontal principal stress, i.e., σ H > σ v   >   σ h , indicating a strike-slip faulting stress regime, which is conducive to the formation of strike-slip cracks [49].
In comparison to the logging data of the study block, the in situ stress and horizontal stress difference values obtained via the acoustic emission method are slightly lower [36,50], which may be related to the very shallow burial depth of the sampled coal seams. Nevertheless, the overall type of the in situ stress field is consistent with the drilling data, indicating that the study area is primarily influenced by strike-slip stress. In general, coal seams with burial depths lower than 600 m are almost all under the stress regime of strike-slip, and the depth of the in situ stress regime transition is about 600–800 m [50]. Therefore, the acoustic emission method offers a convenient and reasonably reliable approach for in situ stress calculation and stress field analysis.

5. Acoustic Emission Response of Heterogeneity in the Pores and Fractures of Coal Rocks

Rock acoustic emission is caused by microscopic pores and fractures inside the rock. Given the inherent heterogeneity of rocks, the distribution, proportion, morphology, and size of these internal features vary from rock to rock. Consequently, this leads to distinct acoustic emission characteristics even among rocks of the same type or within a single rock’s different cores [51].

5.1. Impact of Coal Rock Pore and Fracture Development on the Acoustic Emission Characteristics

After the comparative analysis of the acoustic emission signals from the four samples presented in Figure 12, it becomes apparent that substantial variations exist in the accumulated acoustic emission count curves and the signal strength characteristics among the samples. Specifically, the cumulative counts of acoustic emission for sample C are significantly higher than those observed for the other three samples. In detail, at the axial stress of 50 MPa, sample C exhibits a cumulative count of 1952, whereas samples S1, S2, and S3 record counts of 651, 540, and 398, respectively. Furthermore, the acoustic emission signal strength demonstrates a similar trend, with sample C exhibiting the highest strength, followed by samples S2, S1, and S3, which display progressively lower signal strengths.
There are significant differences in the pore and fracture development among samples collected from four different directions in this study. This heterogeneity of the coal rock contributes to the differences in the acoustic emission characteristics of each sample. Generally, an increase in the void percentage corresponds to a higher incidence and intensity of acoustic emission phenomena. Overall, the accumulative acoustic emission counts and the percentage of voids conform to a positive correlation (Figure 13a). However, sample S2 has a higher void percentage than sample S1, while its accumulative acoustic emission counts are lower than that of sample S1. The acoustic emission mean signal strength, maximum signal strength, and void percentage also conform to a positive correlation (Figure 13b), with a substantial linear relationship observed between the mean acoustic emission signal strength and the void percentage.
In general, coal rock cores with a higher percentage of voids tend to exhibit higher acoustic emission accumulative counts and stronger signal strengths. In particular, sample C, which was oriented perpendicularly to the stratification plane, demonstrates much higher accumulative acoustic emission counts and signal strengths than the three core samples parallel to the stratification plane, and this is due to the exceptionally well-developed pores and fractures present in sample C.

5.2. Impact of Large Fractures on Acoustic Emission Counts

The larger pores and fractures have a significant impact on the acoustic emission counts. Although smaller pores and fractures also emit acoustic signals, they often produce weaker signals that do not reach the threshold for significant recording. Table 5 lists the accumulative acoustic emission counts versus the number of large fractures for each sample. As shown in the table, sample C contains the highest number and volume of large fractures, resulting in the highest cumulative acoustic emission counts among all four samples, much higher than those of the other three samples; sample S1 has 4 fractures with magnitudes ranging from 0.1 to 1 mm3 and 12 fractures ranging from 0.01 to 0.1 mm3; sample S3 has one fracture ranging from 0.1 to 1 mm3 and 148 fractures ranging from 0.01 to 0.1 mm3; sample S2, on the other hand, has no fractures larger than 0.1 mm3, and there are only 15 fractures between 0.01 and 0.1 mm3.
As mentioned in the previous section, although the void percentage of sample S1 is smaller than that of sample S2, its acoustic emission accumulative counts are higher than those of S2. This is because sample S1 contains more fractures with larger volumes, while S2 has a smaller percentage of fractures, and the volumes of its voids are too small. Acoustic emission activity often begins and concentrates around large fractures and the acoustic emission events with high ringing signals are more associated with extensive fracture networks [52]. Samples C, S1, and S3 have more large primary fractures, significantly elevating their recorded acoustic emission counts and resulting in notably higher cumulative acoustic emission counts for sample C compared to the others; the accumulative acoustic emission counts for sample S1 exceed those for sample S2; sample S3 has accumulative acoustic emission counts close to, but not exceeding, those of sample S2 due to too small a void percentage.
Therefore, the cumulative counts of acoustic emissions in coal rocks are not solely determined by the void percentage; they are also significantly influenced by large fractures. The development and existence of these substantial fractures play a crucial role in enhancing the cumulative acoustic emission counts observed in the coal rock samples.

6. Conclusions

In this study, coal rock samples obtained from the Yuwang block of Yunnan Laochang underwent CT scanning to investigate the heterogeneity of their internal pore and fracture structure. A three-dimensional pore and fracture network model was established. Acoustic emission experiments were carried out under triaxial compression on the coal rock samples. The acoustic emission method was employed to assess the in situ stress conditions in the study area. Furthermore, this research delved into the characteristics of acoustic emissions exhibited by coal rocks and their association with their inherent structural properties. The main conclusions are as follows:
(1)
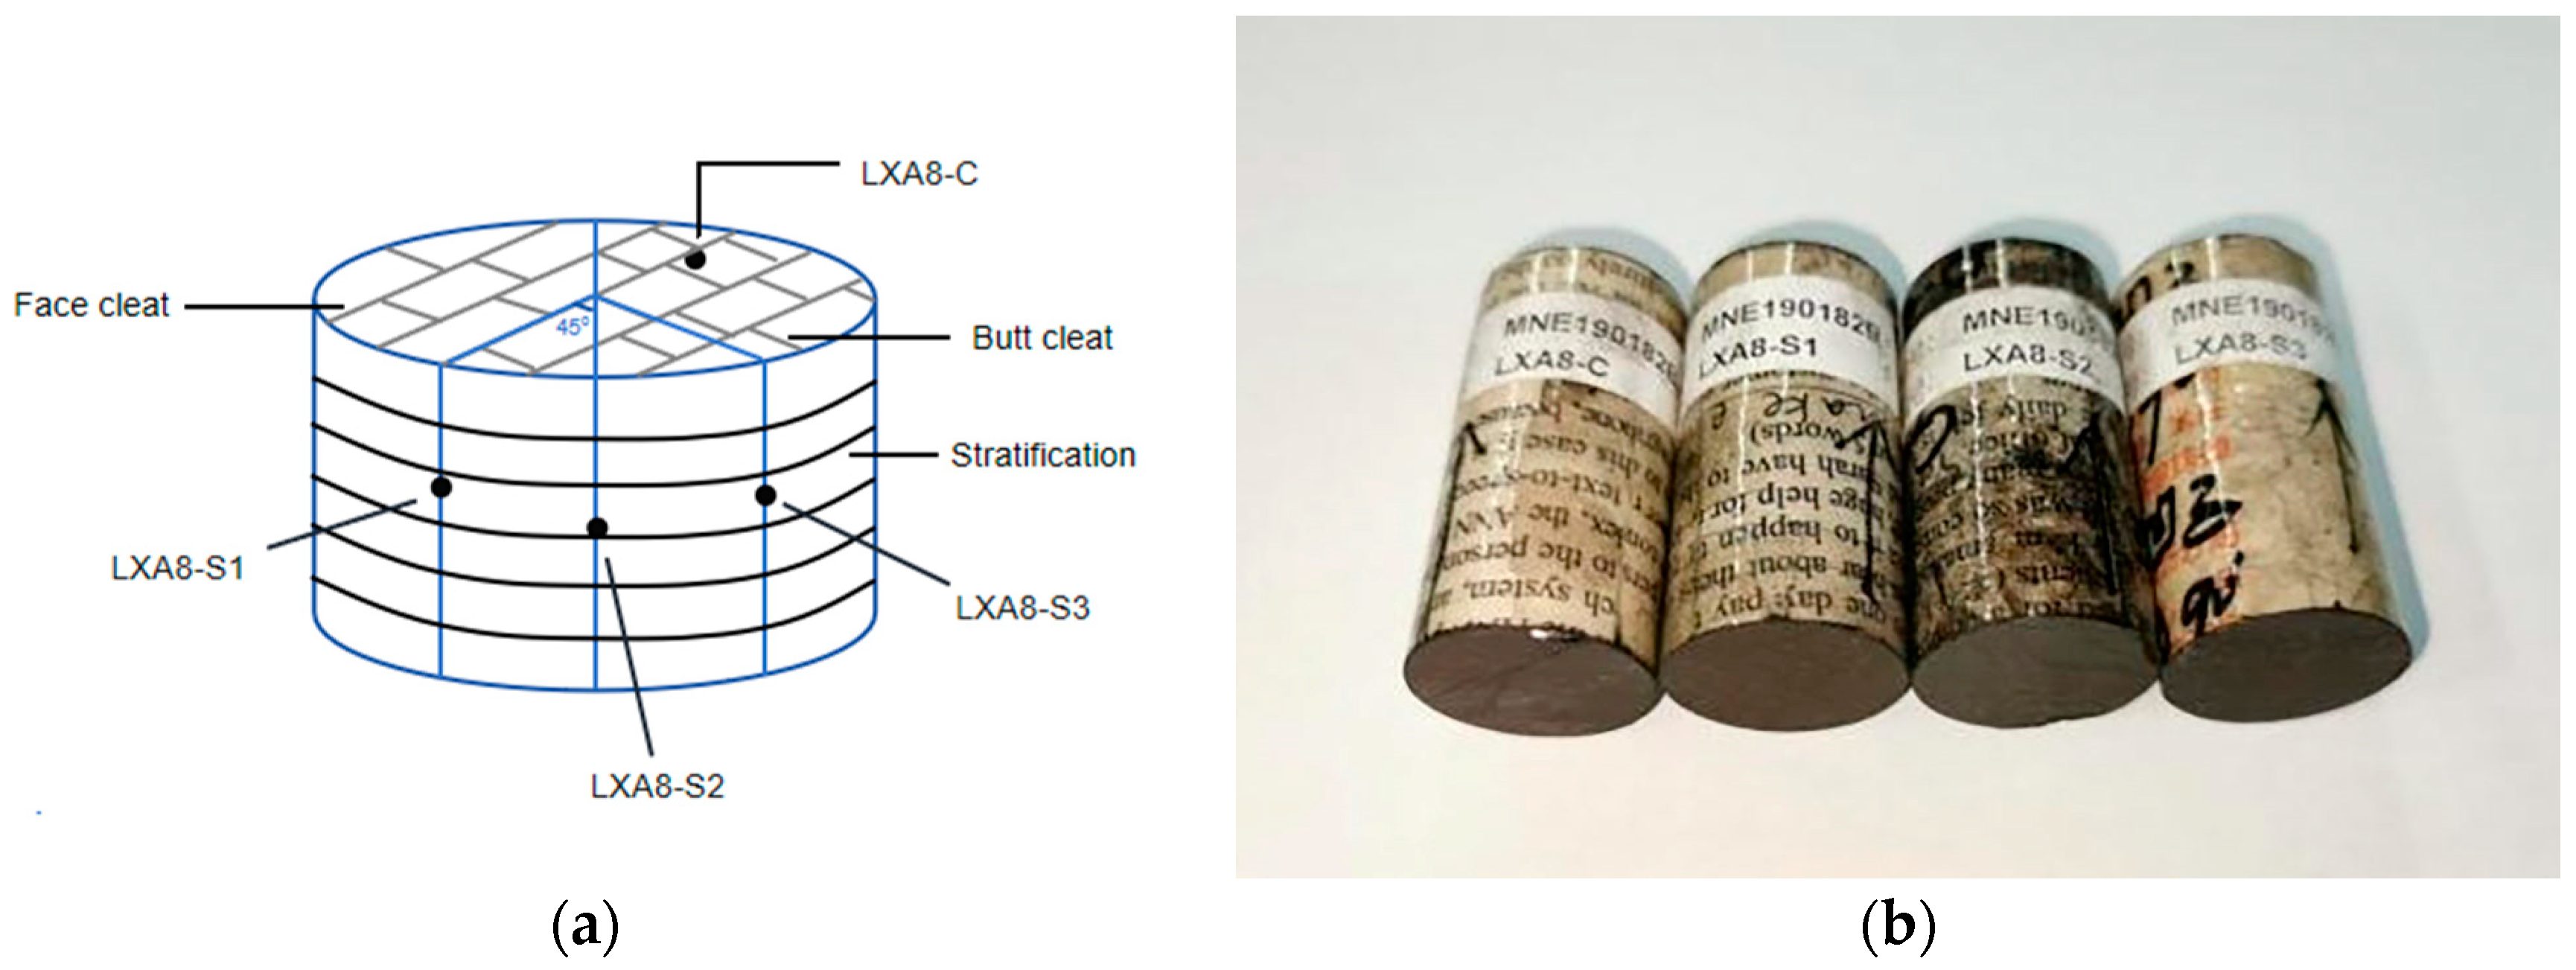
In the direction of the vertical stratification plane, the greatest concentration of core voids can be observed, accompanied by the formation of large and densely packed pores and fractures. On the parallel stratification plane, a high percentage of core voids are oriented at 45° to the face cleat, accompanied by numerous minuscule pores and fractures; the percentage of core voids running parallel to the face cleat is comparatively low, with a moderate count of pores and fractures that are generally small in volume; the core voids oriented vertically to the face cleat have the lowest percentage and count, yet the average volume of these pores and fractures are relatively large. The analysis of the pore diameter distribution and fracture length reveals that the majority of pores and fractures within the core are of the smaller variety.
(2)
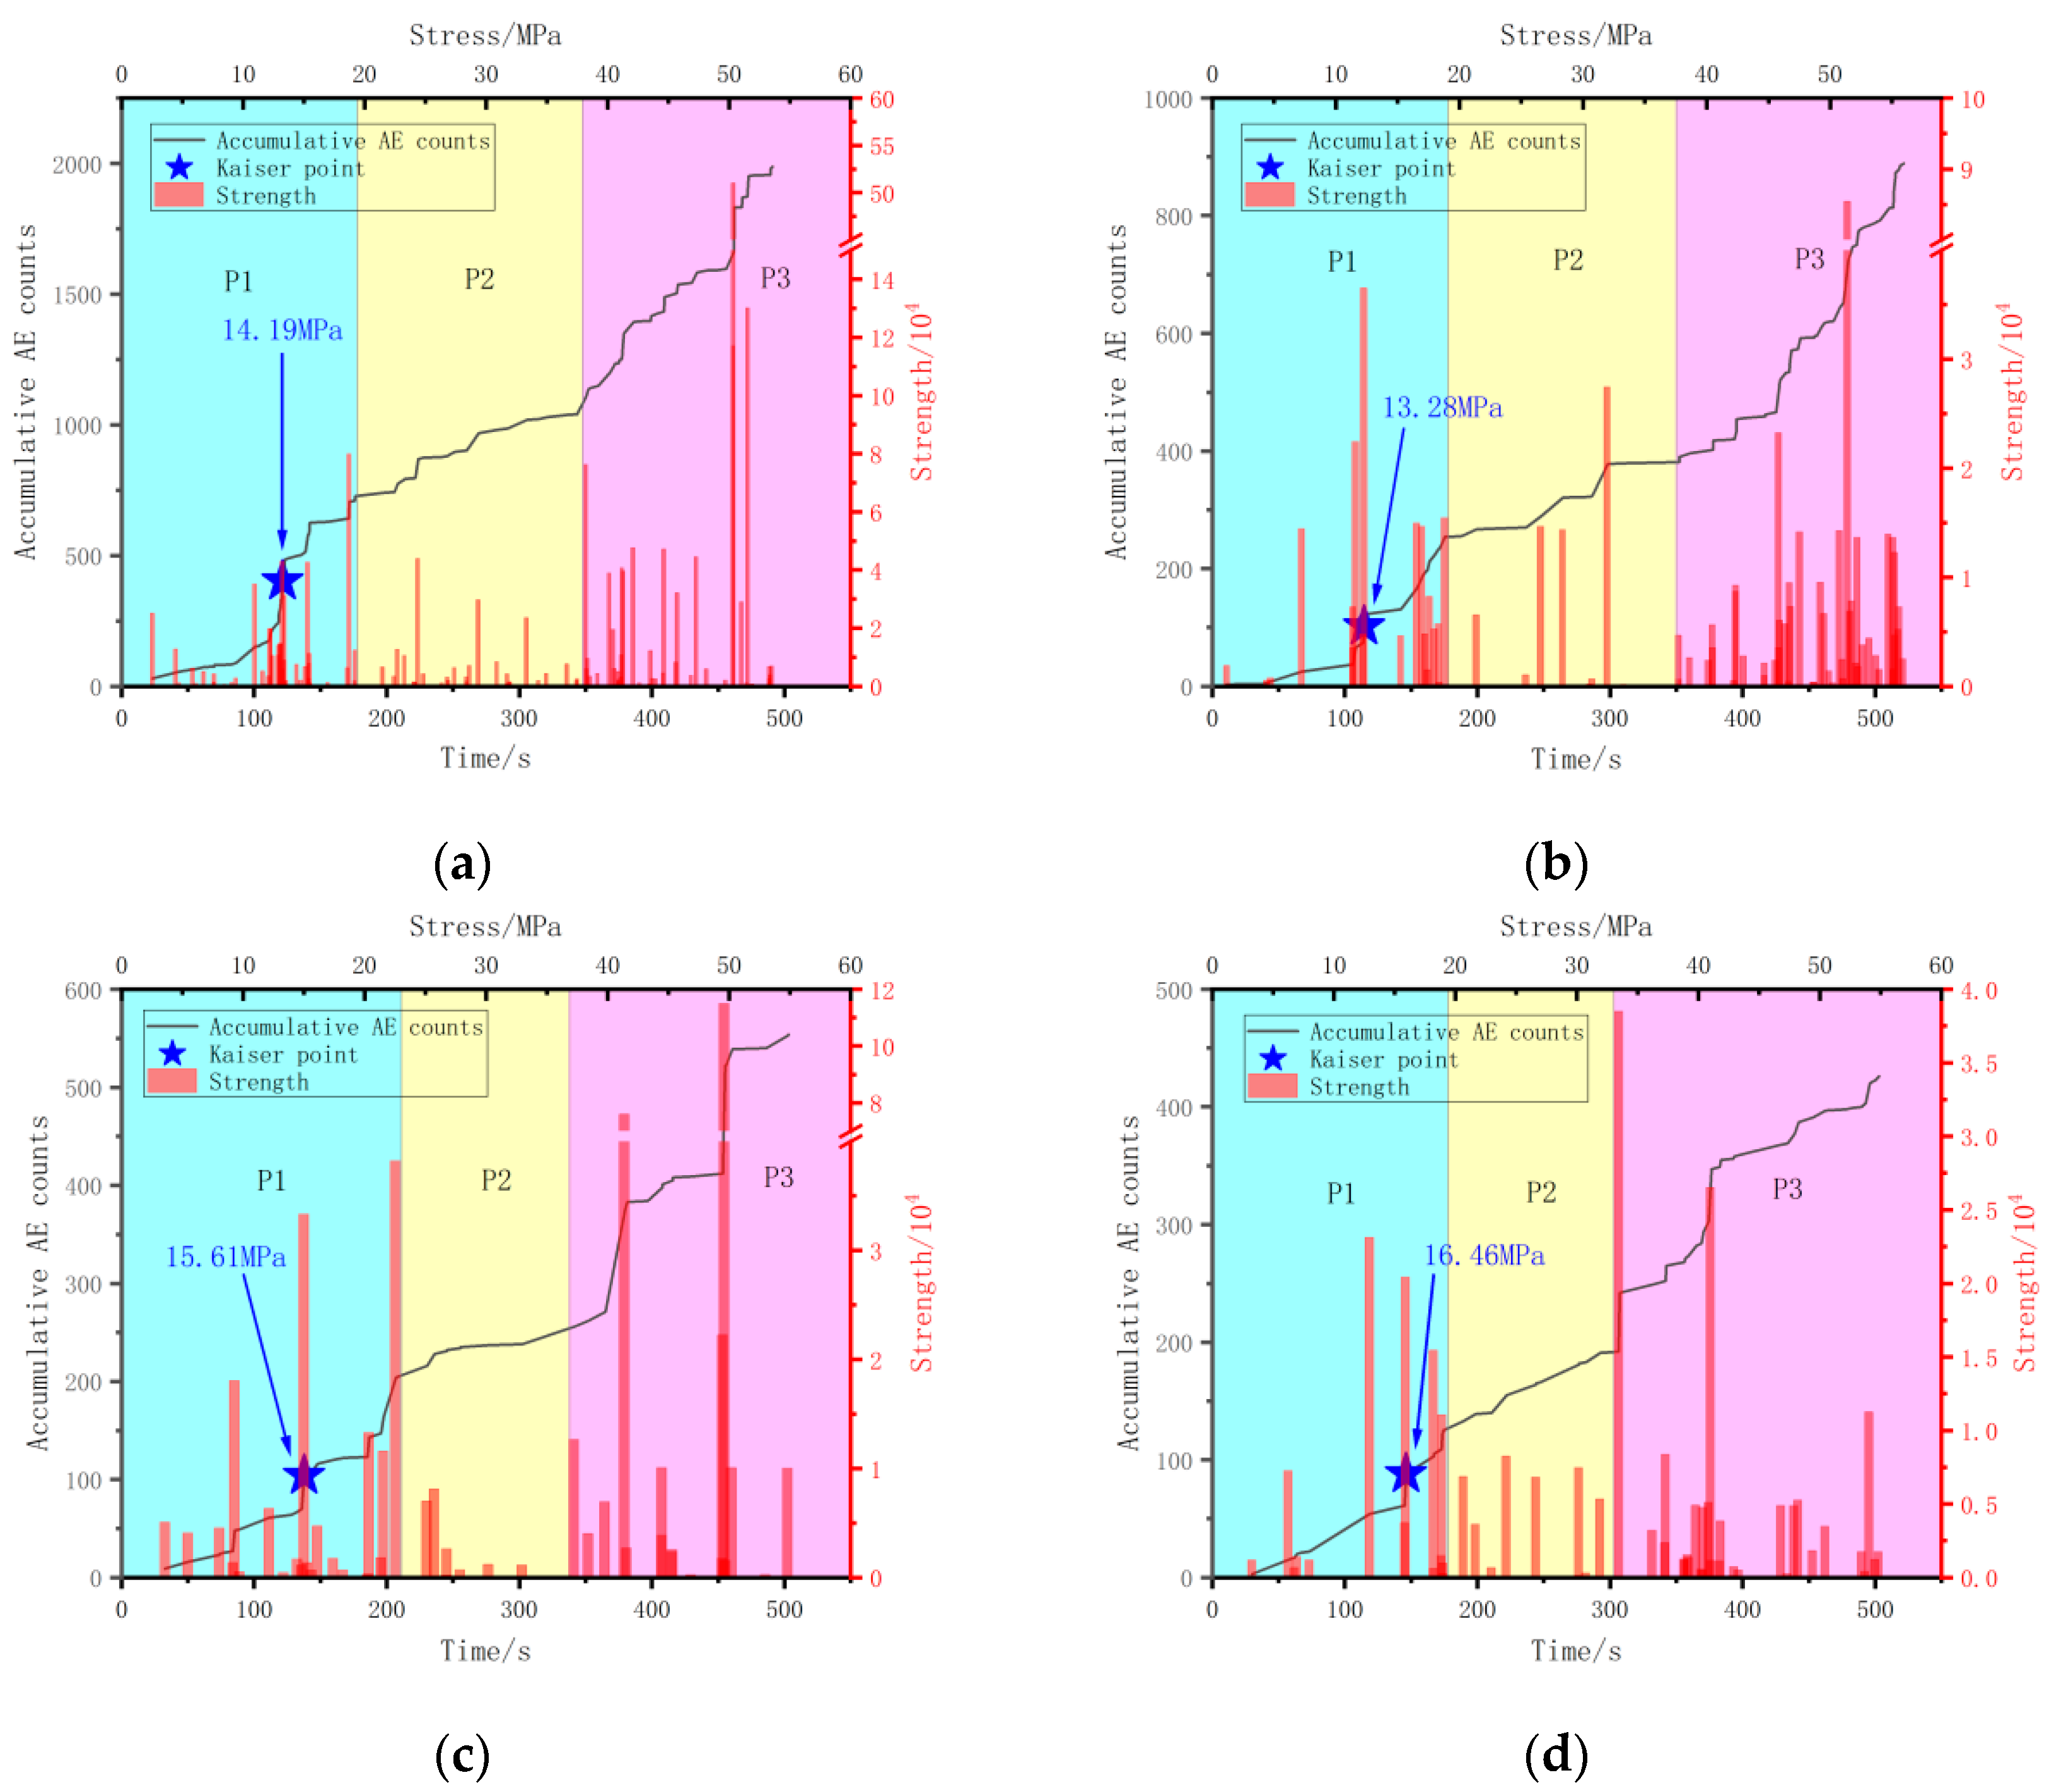
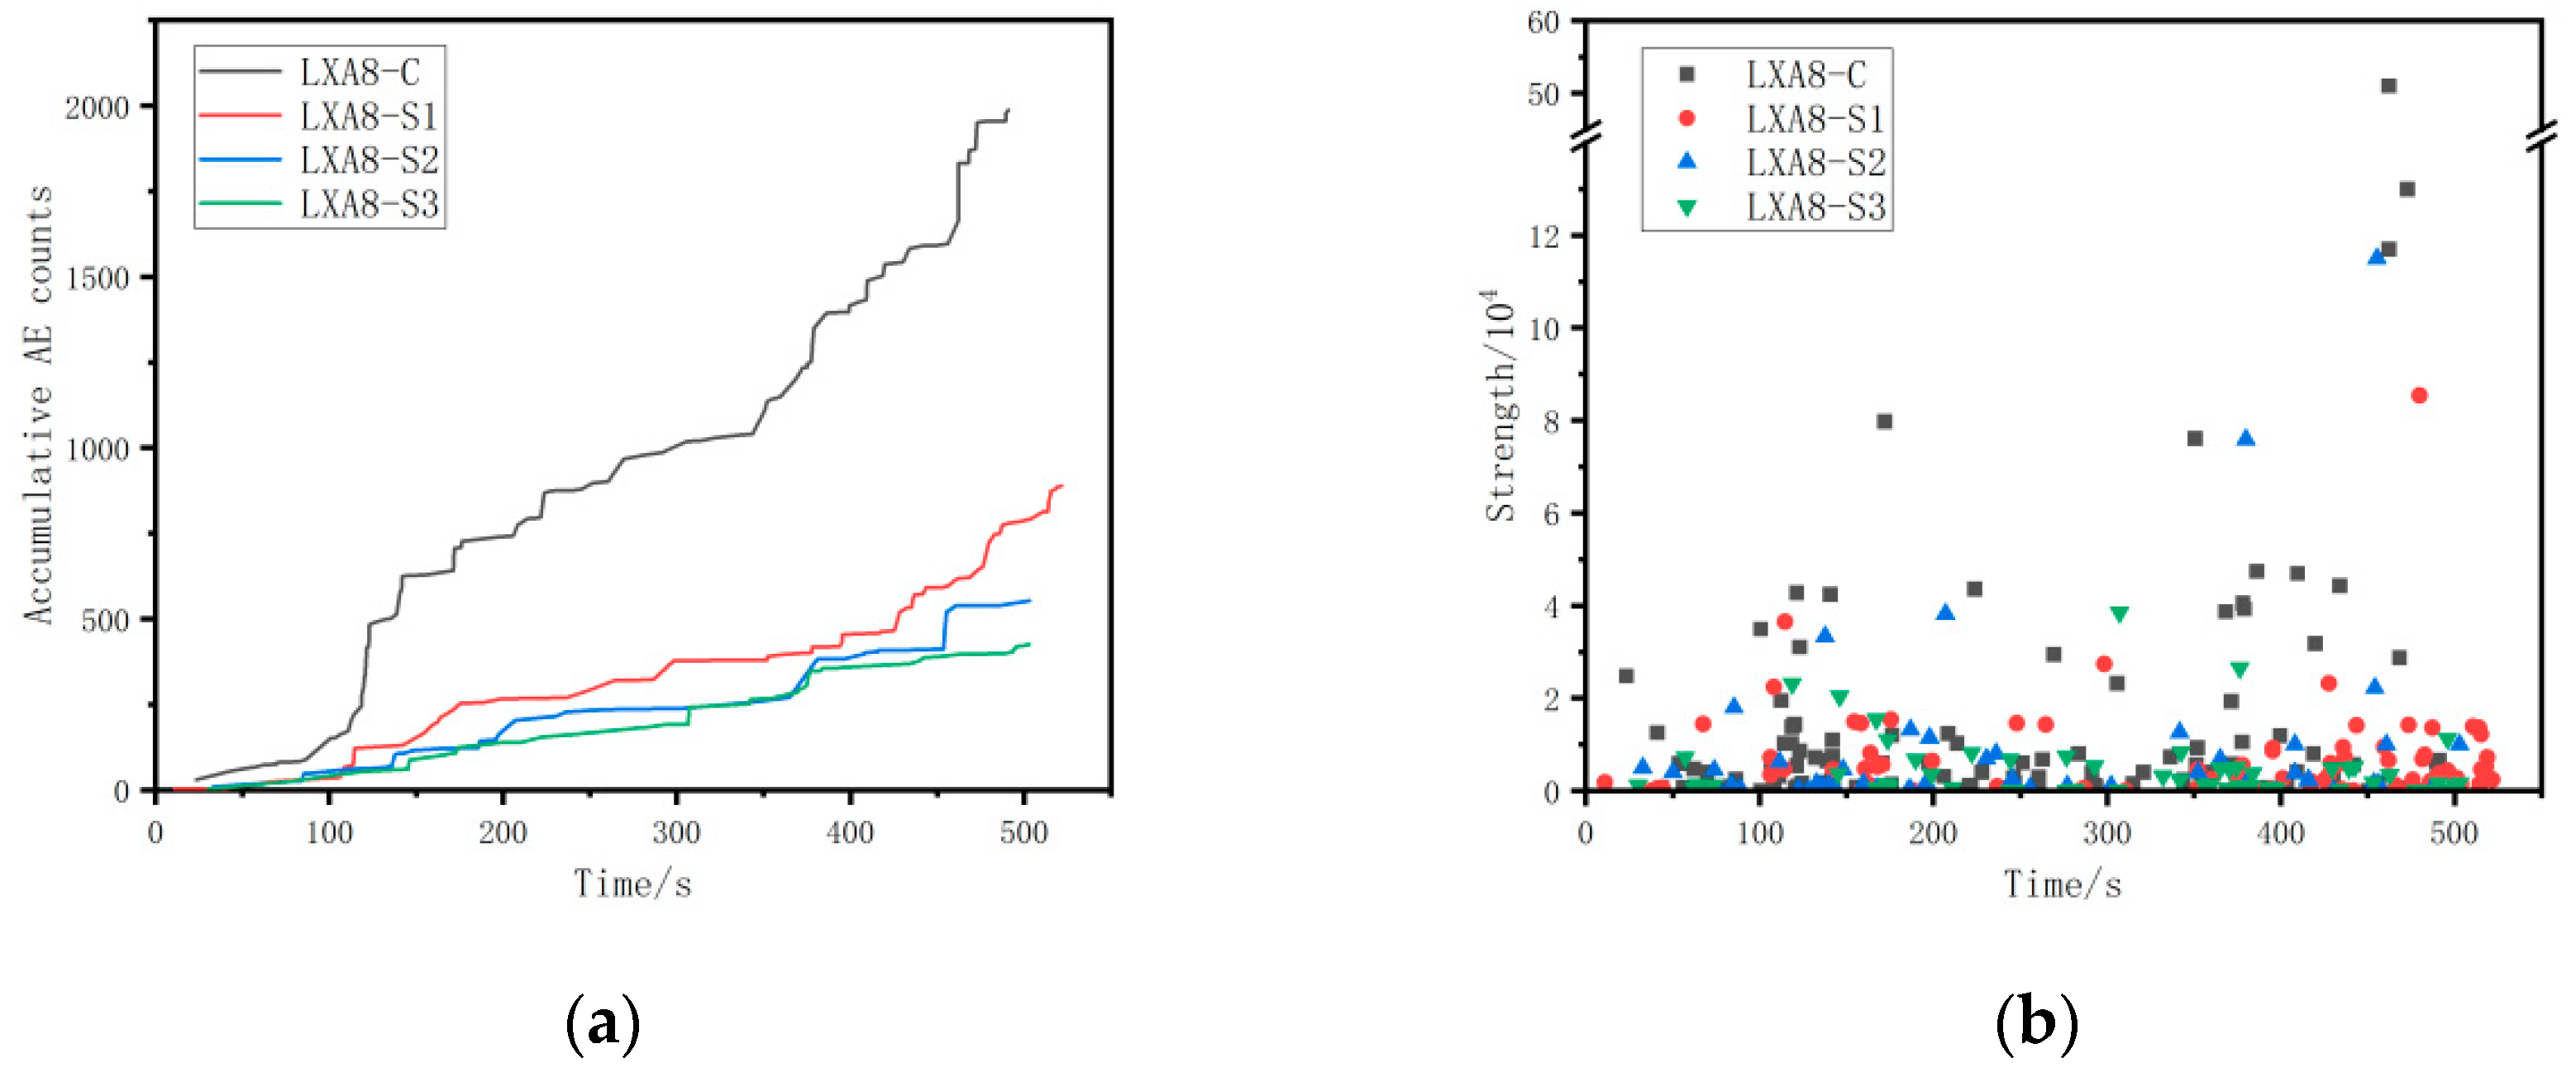
The coal rock acoustic emission process examined in this study can be roughly divided into three phases. The first phase is characterized by a comparatively high accumulative count and strength of acoustic emissions. Following this, the second phase exhibits a noticeable lull, marked by a decrease in the frequency and strength of acoustic emissions. The third phase emerges as the peak period for acoustic emission, producing numerous high-strength acoustic emission events.
(3)
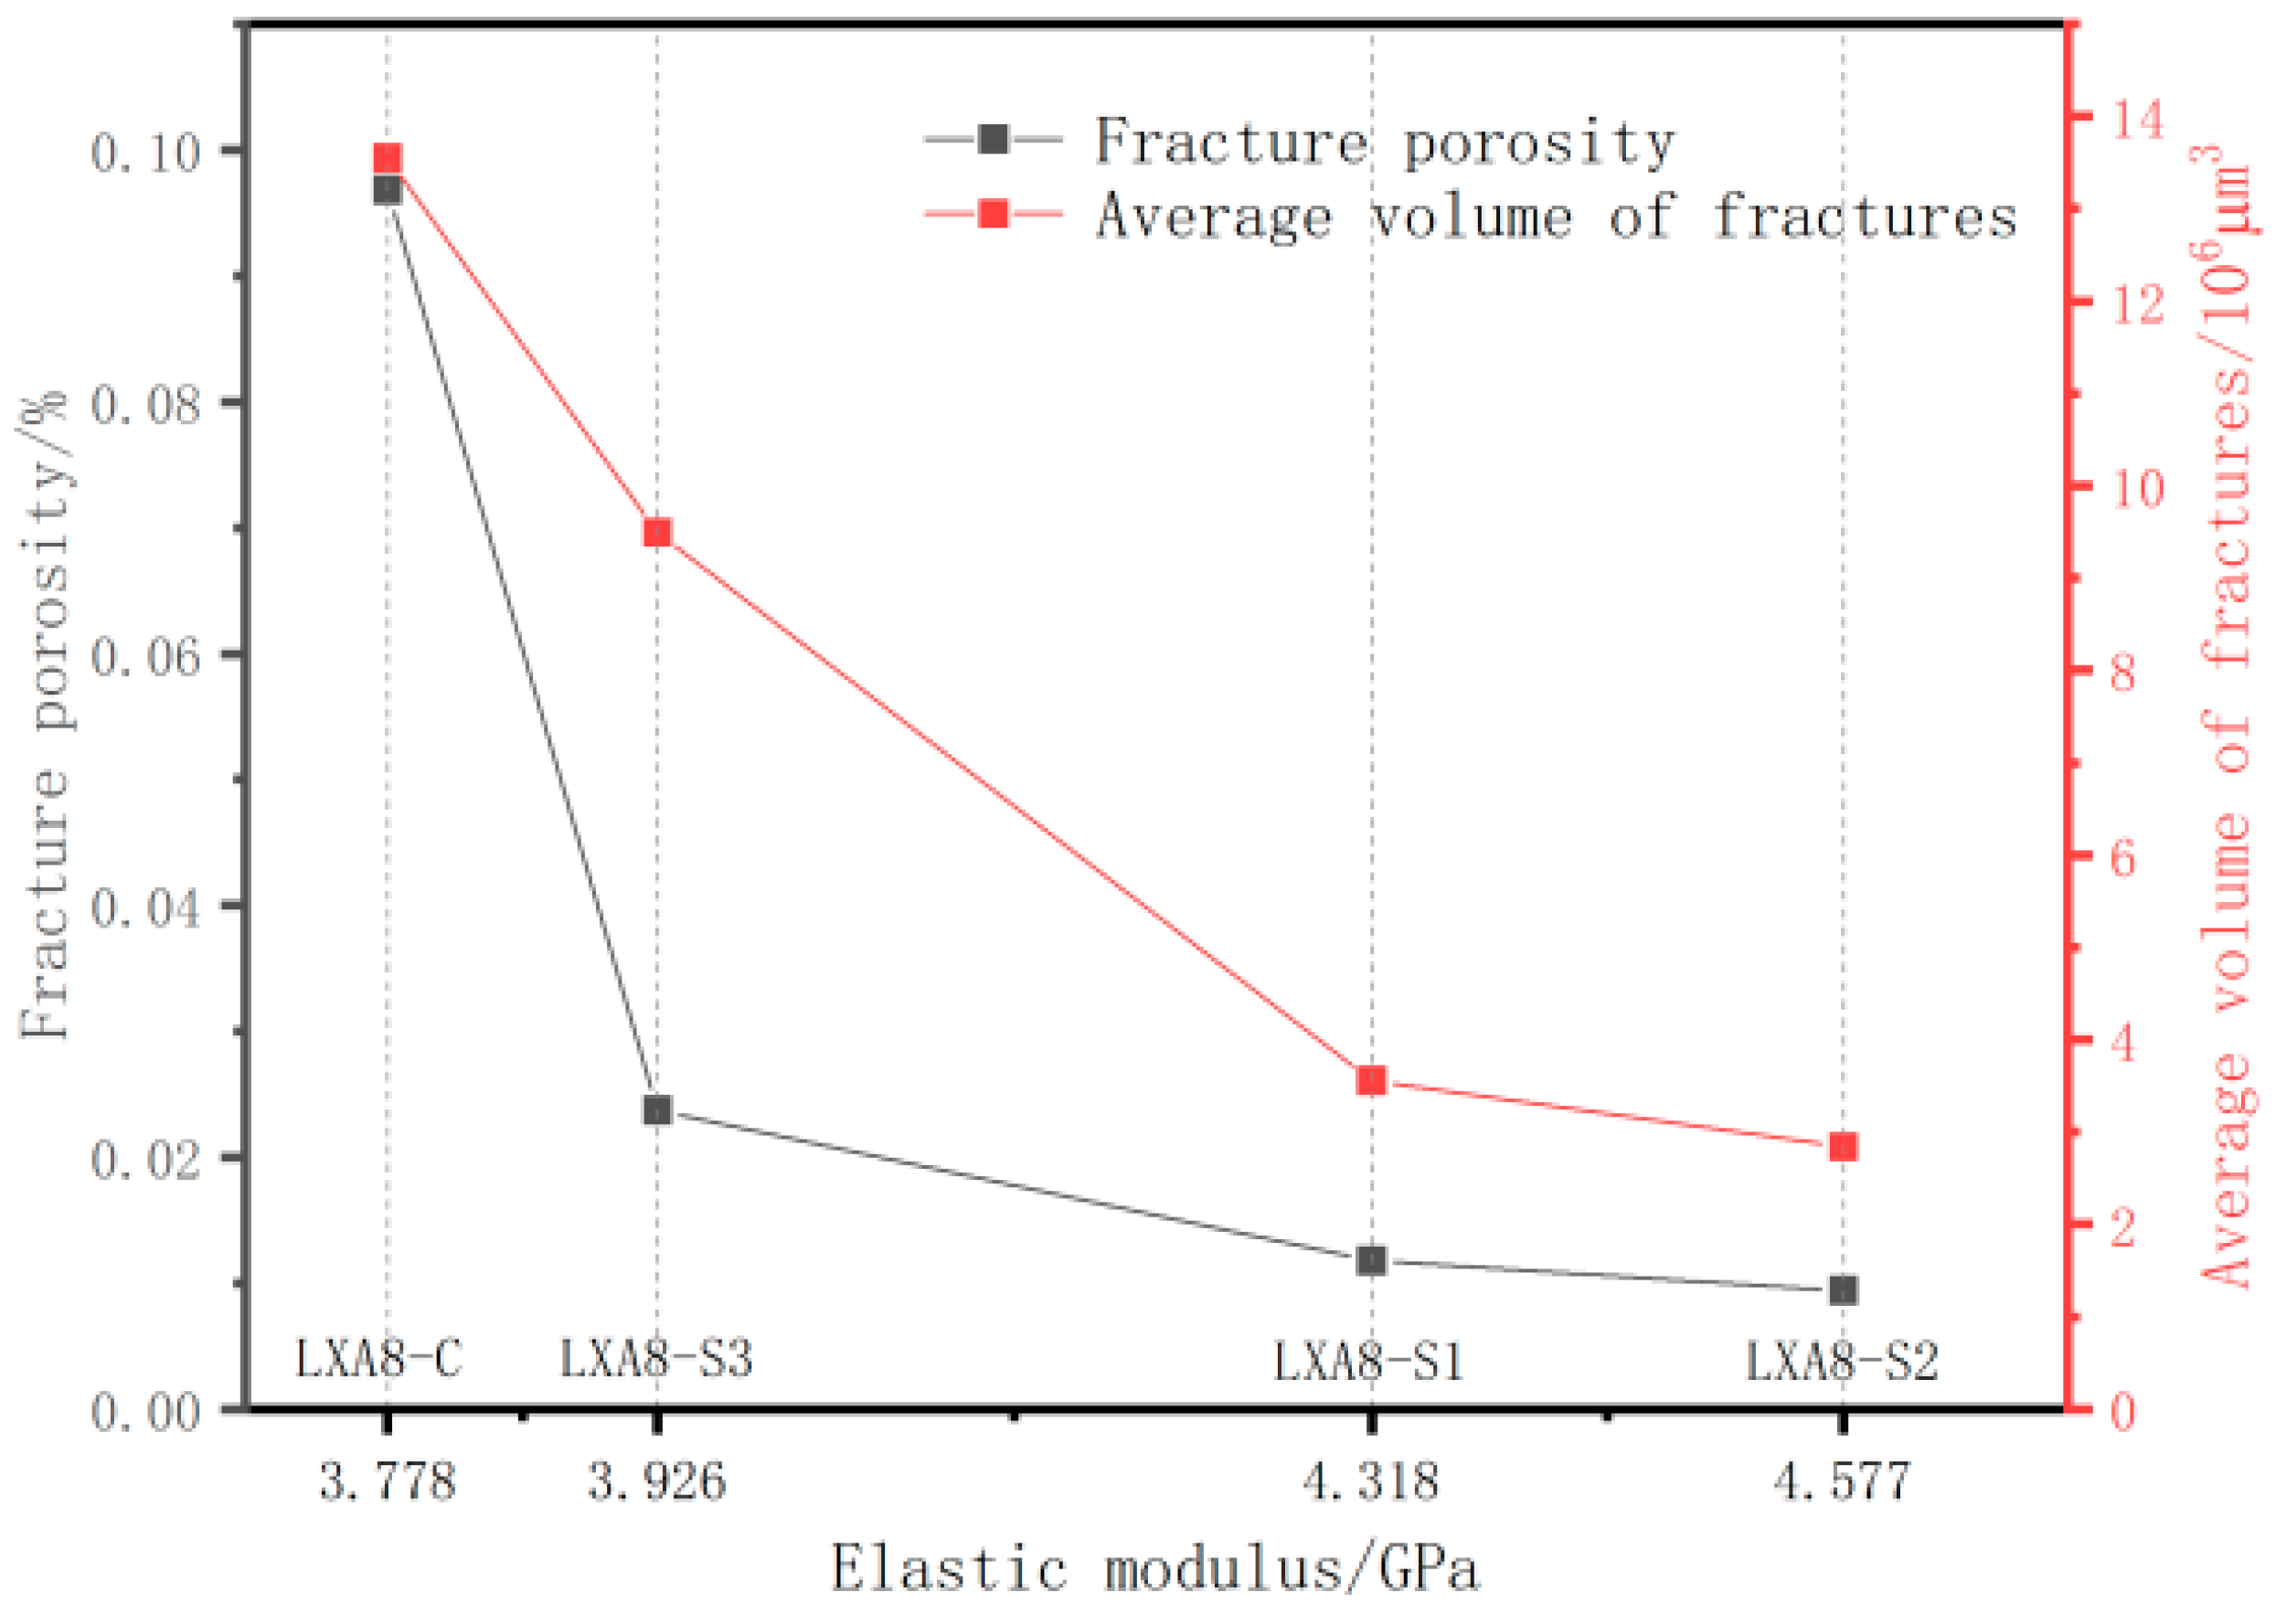
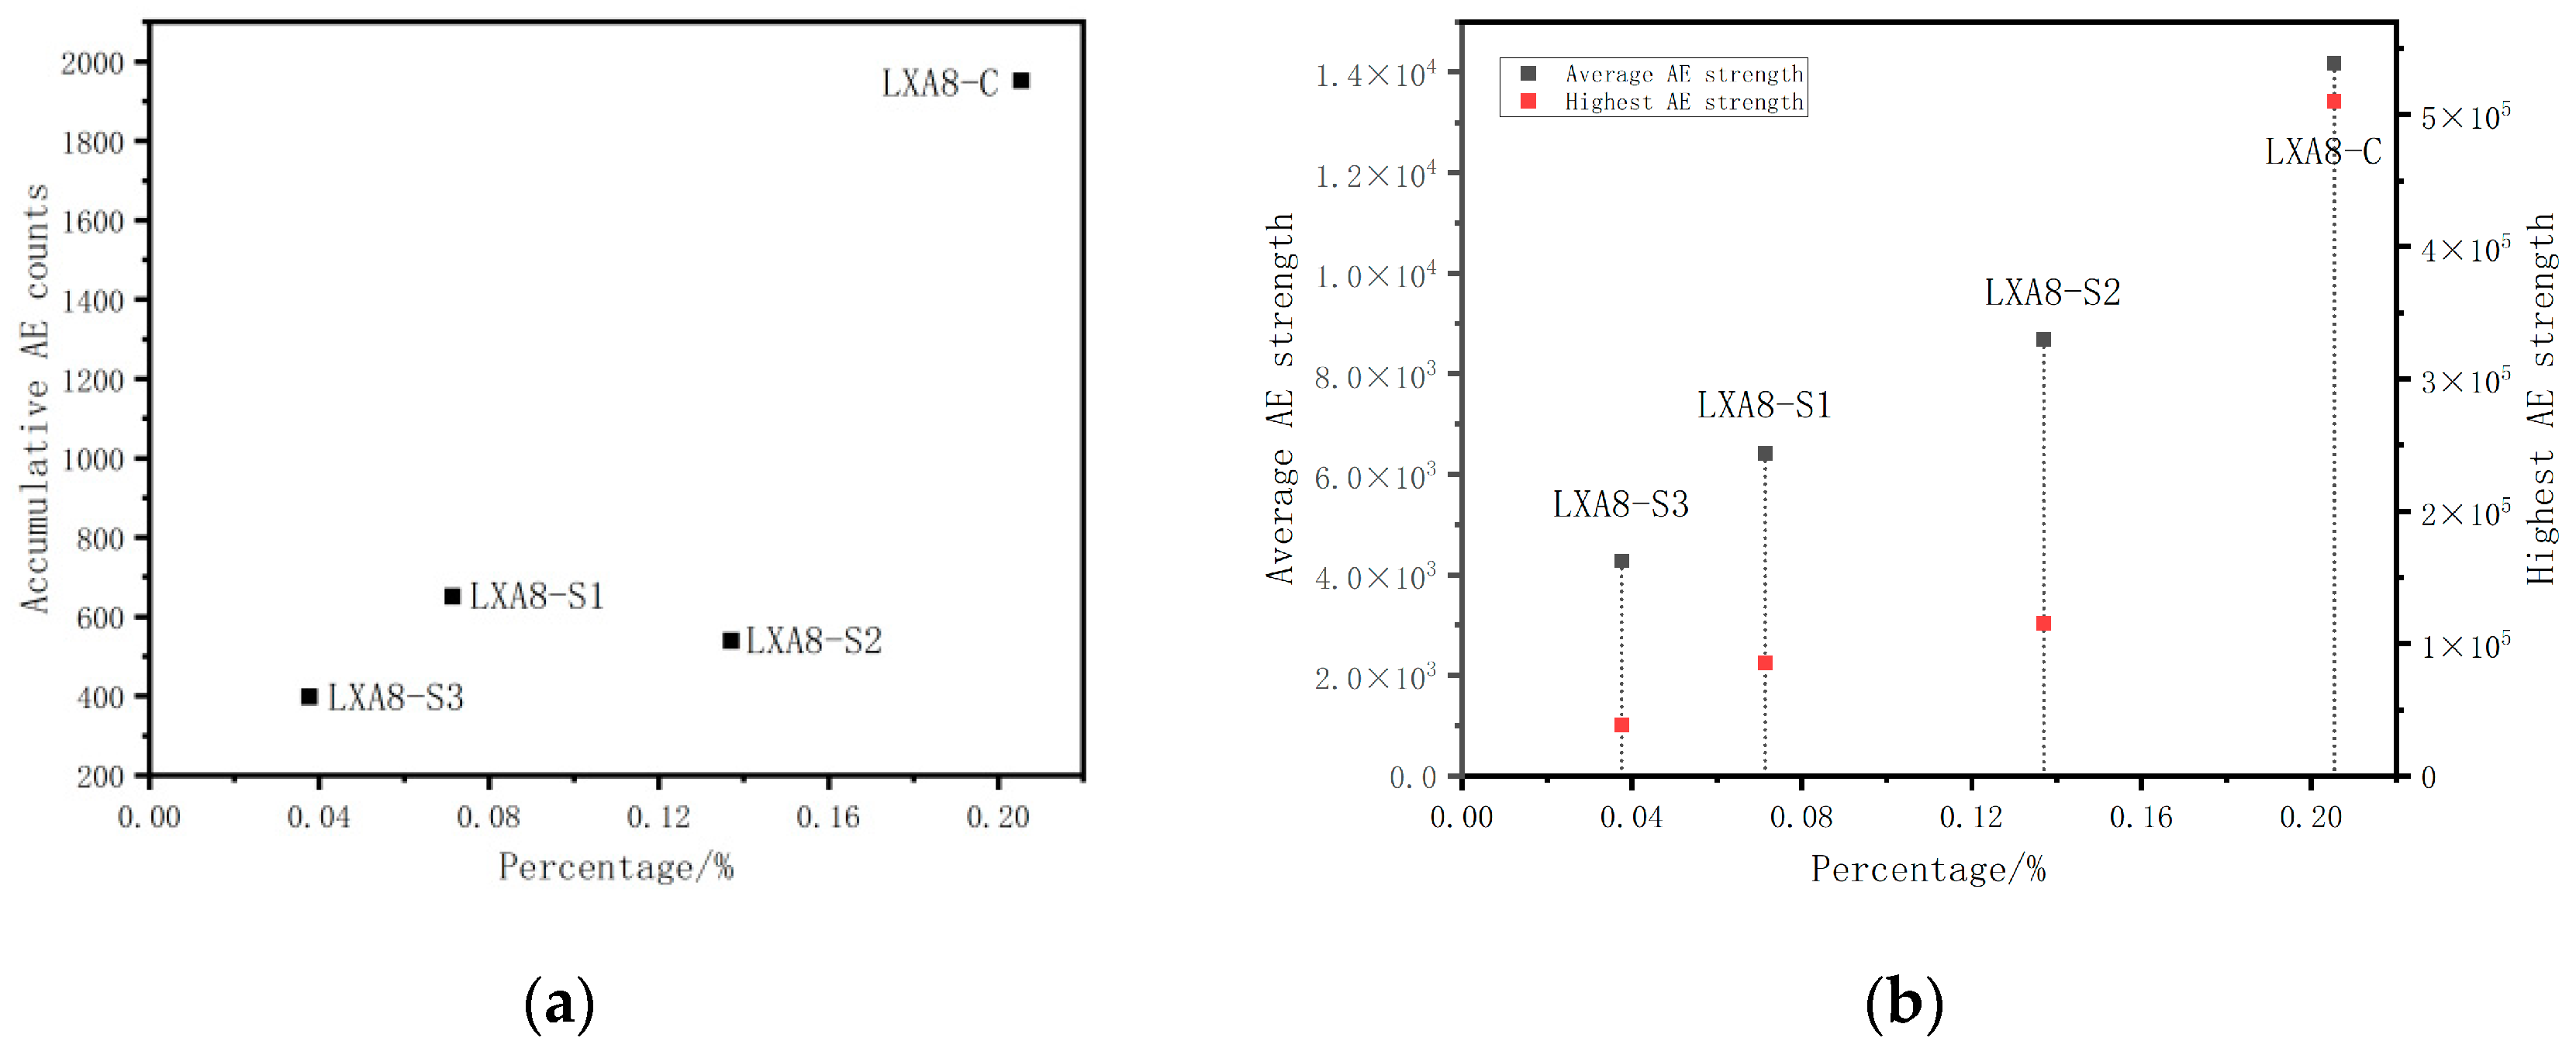
The acoustic emission characteristics of the coal rock samples are correlated with the original structure, and the higher the percentage of voids, the higher the acoustic emission signal strength, whereas the cumulative acoustic emission counts are not only influenced by the proportion of voids but also by the development of large fractures. The presence of large fractures significantly increases the accumulative acoustic emission counts and also results in a lower modulus of elasticity of the coal rock.
(4)
Kaiser effect points are identified based on a comprehensive analysis of the acoustic emission accumulative counts and signal strength. The vertical in situ stress is 4.19 MPa, the maximum horizontal principal stress is 6.62 MPa, and the minimum horizontal principal stress is 3.12 MPa, corresponding to a strike-slip type of stress field. The predictions made regarding the stress field type based on the acoustic emission method align closely with the drilling data, confirming the accuracy and reliability of the study.

Author Contributions

Conceptualization, X.L. and S.Z.; methodology, X.L. and S.Z.; software, X.L. and Y.X.; validation, S.Z. and X.L.; formal analysis, X.L.; resources, S.Z.; data curation, X.L.; writing—original draft preparation, X.L. and Y.X.; writing—review and editing, S.Z. and X.L.; visualization, X.L., Y.X. and T.W.; supervision, S.Z.; project administration, X.L.; funding acquisition, S.Z. All authors have read and agreed to the published version of the manuscript.

Funding

This research was funded by the National Natural Science Foundation of China, grant number 42272197. This research was also funded by the Training Program of Innovation and Entrepreneurship for Undergraduates (Category A) in 2023, project number S202311415081.

Data Availability Statement

Data are contained within the article.

Acknowledgments

This study was assisted by Yiming Wang in basic data acquisition and project advancement; we sincerely thank her for her dedication.

Conflicts of Interest

The authors declare no conflicts of interest.

References

  1. Liu, B.; Ji, C.; Guo, H.; Zhai, J.; Tang, S.; Zhang, S. Origin and Productivity Response of Gas and Water in Coalbed Methane Field of Yuwang Block at Laochang, Yunnan Province. Geoscience 2022, 36, 1341–1350. [Google Scholar] [CrossRef]
  2. Wang, J.; Li, J.; Li, Q.; Chen, W.; Xue, X.; Cai, Y.; Chen, Z. Geological Conditions and Resource Potential of Coalbed Methane Reservoirs in Laochang Mining Area, Yunnan Province. Geoscience 2022, 36, 1351–1359. [Google Scholar] [CrossRef]
  3. Zhang, S.; Wu, C.; Liu, H. Comprehensive characteristics of pore structure and factors influencing micropore development in the Laochang mining area, eastern Yunnan, China. J. Pet. Sci. Eng. 2020, 190, 107090. [Google Scholar] [CrossRef]
  4. Zhang, Z.; Qin, Y.; Wang, G.; Sun, H.; You, Z.; Jin, J.; Yang, Z. Evaluation of Coal Body Structures and Their Distributions by Geophysical Logging Methods: Case Study in the Laochang Block, Eastern Yunnan, China. Nat. Resour. Res. 2021, 30, 2225–2239. [Google Scholar] [CrossRef]
  5. Yang, Z.B.; Li, Y.Y.; Qin, Y.; Sun, H.S.; Zhang, P.; Zhang, Z.G.; Wu, C.C.; Li, C.L.; Chen, C.X. Development unit division and favorable area evaluation for joint mining coalbed methane. Pet. Explor. Dev. 2019, 46, 583–593. [Google Scholar] [CrossRef]
  6. Cheng, Z.; Ning, Z.; Zhao, H.; Wang, Q.; Zeng, Y.; Wu, X.; Qi, R.; Zhang, S. A comprehensive characterization of North China tight sandstone using micro-CT, SEM imaging, and mercury intrusion. Arab. J. Geosci. 2019, 12, 407. [Google Scholar] [CrossRef]
  7. Peng, J.; Sun, N.; Lu, K.; Xu, Y.; Chen, F. Shale oil reservoir of the Palaeogene Shahejie Formation in the Dongpu Sag: Petrology and pore microstructural characteristics. Earth Sci. Front. 2023, 30, 128–141. [Google Scholar] [CrossRef]
  8. Guo, C.; Wang, X.; Wang, H.; He, S.; Liu, H.; Zhu, P. Effect of pore structure on displacement efficiency and oil-cluster morphology by using micro computed tomography (μCT) technique. Fuel 2018, 230, 430–439. [Google Scholar] [CrossRef]
  9. Li, W.; Yao, H.; Liu, H.; Kang, Z.; Song, X.; Feng, Z. Advanced characterization of three-dimensional pores in coals with different coal-body structure by micro-CT. J. China Coal Soc. 2014, 39, 1127–1132. [Google Scholar] [CrossRef]
  10. Pant, L.M.; Huang, H.; Secanell, M.; Larter, S.; Mitra, S.K. Multi scale characterization of coal structure for mass transport. Fuel 2015, 159, 315–323. [Google Scholar] [CrossRef]
  11. Zhang, G.; Ranjith, P.G.; Perera, M.S.A.; Haque, A.; Choi, X.; Sampath, K.S.M. Characterization of coal porosity and permeability evolution by demineralisation using image processing techniques: A micro-computed tomography study. J. Nat. Gas Sci. Eng. 2018, 56, 384–396. [Google Scholar] [CrossRef]
  12. Jia, Z.; Xie, H.; Zhang, R.; Li, C.; Wang, M.; Gao, M.; Zhang, Z.; Zhang, Z. Acoustic Emission Characteristics and Damage Evolution of Coal at Different Depths Under Triaxial Compression. Rock Mech. Rock Eng. 2020, 53, 2063–2076. [Google Scholar] [CrossRef]
  13. Lisjak, A.; Liu, Q.; Zhao, Q.; Mahabadi, O.K.; Grasselli, G. Numerical simulation of acoustic emission in brittle rocks by two-dimensional finite-discrete element analysis. Geophys. J. Int. 2013, 195, 423–443. [Google Scholar] [CrossRef]
  14. Chen, S.; Yin, D.; Jiang, N.; Wang, F.; Zhao, Z. Mechanical properties of oil shale-coal composite samples. Int. J. Rock Mech. Min. Sci. 2019, 123, 104120. [Google Scholar] [CrossRef]
  15. Liu, X.; Liu, Z.; Li, X.; Gong, F.; Du, K. Experimental study on the effect of strain rate on rock acoustic emission characteristics. Int. J. Rock Mech. Min. Sci. 2020, 133, 104420. [Google Scholar] [CrossRef]
  16. Rodríguez, P.; Celestino, T.B. Application of acoustic emission monitoring and signal analysis to the qualitative and quantitative characterization of the fracturing process in rocks. Eng. Fract. Mech. 2019, 210, 54–69. [Google Scholar] [CrossRef]
  17. Momayez, M.; Hassuni, E.P. Application of Kaiser Effect to measure in-situ stresses in underground mines. In Proceedings of the 33rd U.S. Symposium on Rock Mechanics (USRMS), Santa Fe, New Mexico, 3–5 June 1992. ARMA–92-0979. [Google Scholar]
  18. Lavrov, A. The Kaiser effect in rocks: Principles and stress estimation techniques. Int. J. Rock Mech. Min. Sci. 2003, 40, 151–171. [Google Scholar] [CrossRef]
  19. Mandai, J.; Tao, L.I.U. Study on stress distribution law of in Xiaochangba mining area based on Kaiser effect. China Min. Mag. 2019, 28, 161–165. [Google Scholar] [CrossRef]
  20. Bai, X.; Zhang, D.-M.; Wang, H.; Li, S.-J.; Rao, Z. A novel in situ stress measurement method based on acoustic emission Kaiser effect: A theoretical and experimental study. R. Soc. Open Sci. 2018, 5, 181263. [Google Scholar] [CrossRef]
  21. Zhang, N.; Lan, H.; Li, L.; Sun, W.; Liu, S.; Lin, G.; Tian, C. Characteristics and Implications of In-Situ Stresses in Southeastern Tibetan Plateau. J. Eng. Geol. 2022, 30, 696–707. [Google Scholar] [CrossRef]
  22. Fang, X.; Wu, C.; Liu, X.; Zhang, S.; Liu, N. Productivity characteristics and influencing factors of coalbed methane wells in Yuwang block of Laochang mining area in eastern Yunnan and western Guizhou provinces. J. Henan Polytech. Univ. (Natual Sci.) 2020, 39, 11–16. [Google Scholar] [CrossRef]
  23. GB/T 212-2008; Proximate analysis of coal. General Administration of Quality Supervision, Inspection and Quarantine of the People’s Republic of China. Standardization Administration of the People’s Republic of China: Beijing, China, 2008.
  24. Wang, Z.; Qin, Y. Physical experiments of CBM coproduction: A case study in Laochang district, Yunnan province, China. Fuel 2019, 239, 964–981. [Google Scholar] [CrossRef]
  25. Liu, S.; Huang, Z. Exploration of microstructure characteristics and mechanical behaviors of thermal-damaged argillaceous sandstone via LF-NMR and µ-CT technologies. Geomech. Geophys. Geo-Energy Geo-Resour. 2023, 9, 27. [Google Scholar] [CrossRef]
  26. Wang, Z.; Shi, Y.; Pan, M.; Wang, H.; Ma, Z. Mineralogical Mechanism of Micro-Remaining Oil Occurrence: An Example Study of Middle-Low Permeability Sandstone Reservoir of Ordos Basin. Acta Sci. Nat. Univ. Pekin. 2021, 57, 111–120. [Google Scholar]
  27. Li, X.; Lu, Y.; Zhang, X.; Fan, W.; Lu, Y.; Pan, W. Quantification of macropores of Malan loess and the hydraulic significance on slope stability by X-ray computed tomography. Environ. Earth Sci. 2019, 78, 522. [Google Scholar] [CrossRef]
  28. Zhu, Y.; Tan, Y.; Zhang, S.; Wang, M.; Wang, B. Dynamic Evolution and Quantitative Characterization of Fractures in Coal at the Eastern Edge of Ordos Basin under Axial Loading. Processes 2023, 11, 1631. [Google Scholar] [CrossRef]
  29. Mo, Z.; Qian, L.; Yao, T.; Gao, Y.; Zhang, J.; Zhang, R.; Liu, E.; Jiang, H. Stress Threshold Determination Method and Damage Evolution Modelling Based on Micritic Bioclastic Limestone. Rock Mech. Rock Eng. 2024, 57, 45–60. [Google Scholar] [CrossRef]
  30. Tang, M.; Wang, G.; Chen, S.; Yang, C. Crack initiation stress of brittle rock with different porosities. Bull. Eng. Geol. Environ. 2021, 80, 4559–4574. [Google Scholar] [CrossRef]
  31. Qian, L.; Yao, T.; Mo, Z.; Gao, Y.; Zhang, J.; Li, Y.; Zhang, R.; Li, Z. Experimental study on crack evolution behavior and constitutive model of granite based on the deviatoric stress to peak strength ratio. Bull. Eng. Geol. Environ. 2022, 81, 278. [Google Scholar] [CrossRef]
  32. Jiang, G.; Zuo, J.; Li, Y.; Wei, X. Experimental Investigation on Mechanical and Acoustic Parameters of Different Depth Shale Under The Effect of Confining Pressure. Rock Mech. Rock Eng. 2019, 52, 4273–4286. [Google Scholar] [CrossRef]
  33. Cheng, C.; Xue, S.; Han, Y. Experimental Study on the Mechanical Behavior of Coal under Triaxial Dynamic Compression. Minerals 2022, 12, 1206. [Google Scholar] [CrossRef]
  34. Chen, S.; Zhu, Y.; Wang, H.; Liu, H.; Wei, W.; Fang, J. Shale gas reservoir characterisation: A typical case in the southern Sichuan Basin of China. Energy 2011, 36, 6609–6616. [Google Scholar] [CrossRef]
  35. Hui, G.; Chen, Z.; Wang, Y.; Zhang, D.; Gu, F. An integrated machine learning-based approach to identifying controlling factors of unconventional shale productivity. Energy 2023, 266, 126512. [Google Scholar] [CrossRef]
  36. Xing, Y. Study on the Removability of Multi-Layer Stacked Coal Reservoir in Laochang Block of Eastern Yunnan. Master’s Thesis, China University of Geosciences, Beijing, China, 2020. [Google Scholar]
  37. Xiaohan, Q.; Shuangrong, H.; Heng, M.; Pin, W.; Yang, L.; Xiangming, Z. Research on Triaxial Test of Coal Rock Mechanics Based on Graphical Measurement Technology. Chin. Q. Mech. 2023, 44, 739–749. [Google Scholar] [CrossRef]
  38. Lockner, D. The role of acoustic-emission in the study of rock fracture. Int. J. Rock Mech. Min. Sci. 1993, 30, 883–899. [Google Scholar] [CrossRef]
  39. Zhao, K.; Yang, D.; Gong, C.; Zhuo, Y.; Wang, X.; Zhong, W. Evaluation of internal microcrack evolution in red sandstone based on time–frequency domain characteristics of acoustic emission signals. Constr. Build. Mater. 2020, 260, 120435. [Google Scholar] [CrossRef]
  40. Meng, Q.; Zhang, M.; Han, L.; Pu, H.; Nie, T. Effects of Acoustic Emission and Energy Evolution of Rock Specimens Under the Uniaxial Cyclic Loading and Unloading Compression. Rock Mech. Rock Eng. 2016, 49, 3873–3886. [Google Scholar] [CrossRef]
  41. Liu, S.; Li, X.; Wang, D.; Wu, M.; Yin, G.; Li, M. Mechanical and Acoustic Emission Characteristics of Coal at Temperature Impact. Nat. Resour. Res. 2020, 29, 1755–1772. [Google Scholar] [CrossRef]
  42. Wang, H.; Zhao, F.; Huang, Z.; Yu, H.; Niu, J.; Zhang, P. Study on acoustic emission characteristics of sandstone under different fracture modes. Arab. J. Geosci. 2018, 11, 772. [Google Scholar] [CrossRef]
  43. Gao, B.; Qian, Y.; Lv, P. Study on failure mechanics and acoustic emission characteristics of coal sample under loading rate. Chin. J. Undergr. Space Eng. 2020, 16, 463–474. [Google Scholar]
  44. Zhang, X.; Fu, X.; Shen, Z.; Huang, X. Study on the method of in-situ stress measurement with Kaiser effect of rock acoustic emission. China Meas. Test 2017, 43, 18–23. [Google Scholar] [CrossRef]
  45. Kui, Z.; Dao-Quan, Y.A.N.; Chun-Hui, Z.; Xue-Yi, Z.H.I.; Xiao-Jun, W.; Xue-Qiang, X. Comprehensive analysis method and experimental vertification for in-situstress measurement by acoustic emission tests. Chin. J. Geotech. Eng. 2012, 34, 1403–1411. [Google Scholar]
  46. Ebrahimian, Z.; Ahmadi, M.; Sadri, S.; Li, B.Q.; Moradian, O. Wavelet analysis of acoustic emissions associated with cracking in rocks. Eng. Fract. Mech. 2019, 217, 106516. [Google Scholar] [CrossRef]
  47. Zhengjun, H.; Lei, Z.; Yu, L.; Dong, Z. Experimental Test for Geostress by Accepting the kaiser Effect under Confining Pressure Conditions. Res. Explor. Lab. 2018, 37, 68–71. [Google Scholar]
  48. Jingen, D.; Kangping, W.; Rongzun, H. In-situ stress determination at great depth by using acoustic emission technique. In Proceedings of the 35th U.S. Symposium on Rock Mechanics (USRMS), Reno, NV, USA, 5–7 June 1995. [Google Scholar]
  49. Zhao, J.; Gao, Y.; Chen, Z.; Guo, T.; Gao, X. Stress state of deep seam and its influence on development performance of CBM wells in South Yanchuan Block, Odors Basin. Geol. China 2021, 48, 785–793. [Google Scholar] [CrossRef]
  50. Ju, W.; Jiang, B.; Qin, Y.; Wu, C.; Wang, G.; Qu, Z.; Li, M. The present-day in-situ stress field within coalbed methane reservoirs, Yuwang Block, Laochang Basin, south China. Mar. Pet. Geol. 2019, 102, 61–73. [Google Scholar] [CrossRef]
  51. Guo, Y.-X.; Zhao, Y.-H.; Wang, S.-W.; Feng, G.-R.; Zhang, Y.-J.; Ran, H.-Y. Stress-strain-acoustic responses in failure process of coal rock with different height to diameter ratios under uniaxial compression. J. Cent. South Univ. 2021, 28, 1724–1736. [Google Scholar] [CrossRef]
  52. Zhao, Z.; Jing, H.; Shi, X.; Wu, J.; Yin, Q. Experimental investigation on fracture behaviors and acoustic emission characteristics of sandstone under different strain rates. Environ. Earth Sci. 2021, 80, 85. [Google Scholar] [CrossRef]
Figure 1. Location and tectonic outline map of the Laochang mining area and Yuwang block [4] (according to Zhang et al., 2021).
Energies 17 01207 g001
Figure 2. Sample collection: (a) sampling schematic; (b) sample photos.
Energies 17 01207 g002
Figure 3. CT image processing: (a) original image; (b) cut image; (c) binarized image (blue color indicates minerals).
Energies 17 01207 g003
Figure 4. Three-dimensional pore and fracture network model: (a) LXA8-C; (b) LXA8-S1; (c) LXA8-S2; (d) LXA8-S3.
Energies 17 01207 g004
Figure 5. Comparison of the pore and fracture percentage of the four samples.
Energies 17 01207 g005
Figure 6. Comparison of the number and average volume of pores and fractures in the four samples: (a) number of pores and fractures; (b) average volume of pores and fractures.
Energies 17 01207 g006
Figure 7. Sample pore diameter distribution.
Energies 17 01207 g007
Figure 8. Sample fracture length distribution.
Energies 17 01207 g008
Figure 9. Stress–strain curve of the samples (P1: phase 1; P2: phase 2; P3: phase 3).
Energies 17 01207 g009
Figure 10. Correlation analysis between the elastic modulus and the fracture development characteristics of four samples.
Energies 17 01207 g010
Figure 11. Acoustic emission characterization of the four samples: (a) LXA8-C; (b) LXA8-S1; (c) LXA8-S2; (d) LXA8-S3.
Energies 17 01207 g011
Figure 12. Comparison of the acoustic emission characteristics of the four samples: (a) accumulative acoustic emission counts; (b) acoustic emission signal strengths.
Energies 17 01207 g012
Figure 13. Effect of the void percentage on the acoustic emission: (a) accumulative acoustic emission counts; (b) acoustic emission signal strength.
Energies 17 01207 g013
Table 1. Coal rock industrial analysis test results.
SampleMad/%Ad/%Vd/%FCd/%
LXA80.5236.9413.4349.63
Table 2. Pore and fracture statistics of each sample.
SamplePore NumberFracture NumberPore Percentage/%Fracture Percentage/%Void Percentage/%Average Pore Volume/μm3Average Fracture Volume/μm3Average Void Volume/μm3
LXA8-C1,675,37316090.10860.09680.205413,19113,543,79527,549
LXA8-S11,608,9717200.05960.01180.071480443,559,4319604
LXA8-S23,999,5147200.12760.00940.137069252,839,1647434
LXA8-S3338,5565640.01390.02370.037692269,488,33724,976
Table 3. Modulus of elasticity of the samples.
SampleLXA8-CLXA8-S1LXA8-S2LXA8-S3
Modulus of elasticity/GPa3.7784.3184.5773.926
Table 4. In situ stress calculation results.
Vertical Principal Stress/MPaMaximum Horizontal Principal Stress/MPaMinimum Horizontal Principal Stress/MPa
4.196.623.12
Table 5. Relationship between the number of fractures with a volume larger than 0.01 mm3 and the accumulative acoustic emission counts in each sample.
SampleNumber of Large FracturesAcoustic Emission Accumulative Count (in 50 MPa)
0.01~0.1 mm30.1~1 mm3>1 mm3
LXA8-C36451952
LXA8-S11240651
LXA8-S21500540
LXA8-S314810398
Disclaimer/Publisher’s Note: The statements, opinions and data contained in all publications are solely those of the individual author(s) and contributor(s) and not of MDPI and/or the editor(s). MDPI and/or the editor(s) disclaim responsibility for any injury to people or property resulting from any ideas, methods, instructions or products referred to in the content.

