Abstract
The exceptionally low geothermal gradient (~2 °C/100 m) in the Tarim Basin, notably in the Shuntuoguole (STGL) area with depths exceeding 7000 m, has catalyzed the discovery of ultra-deep liquid hydrocarbons. Yet, the genesis of these hydrocarbons remains elusive, presenting significant challenges to further exploration and development endeavors. To address this quandary, an extensive analysis involving biomarker assessments and compound-specific δ2H and δ13C isotopic evaluations of n-alkanes was conducted, unveiling the secondary alterations and origins of these crude oils. For the first time, an approximately horizontal distribution of compound-specific δ2H and δ13C in n-alkanes was observed. Through the integration of diagnostic biomarker compounds, it was elucidated that the STGL crude oils did not undergo significant biodegradation, thermal alteration, or thermal sulfate reduction. Biomarker- and compound-specific C/H isotopic correlations suggest that the STGL crude oil predominantly originates from the Lower Cambrian calcareous shale, positing it as a potential end-member oil for this lithofacial source rock. Furthermore, the STGL crude oil exhibits similar biomarker configurations (notably abundant C28 triaromatic sterones, C23 tricyclic terpenoids, and aryl isoprenoids, with minimal 4-methylstane and gammacerane presence) to those oils previously considered as mixed from the Tazhong and Tabei Uplifts within the Tarim Basin. This similarity suggests that these previously deemed mixed oils may also derive from the Lower Cambrian calcareous shale. Consequently, more focused investigations into the Lower Cambrian calcareous shale are imperative to bolster refined deep and ultra-deep petroleum exploration efforts within the Tarim Basin in forthcoming studies.
1. Introduction
The advent of gas chromatography–thermal conversion–isotope ratio mass spectrometry (GC–TC–IRMS) technology has significantly enhanced the precision of compound-specific isotope analysis (CSIA) for individual organic compounds. This advancement is increasingly pivotal in geochemical research [1,2,3,4,5,6,7,8,9]. Notably, n-alkanes, the most copious lipid molecules derived from a spectrum of precursors spanning terrestrial vascular plants, bacteria, and algae, encapsulate extensive information concerning their precursors, depositional environments, and thermal maturity. After more than 20 years of development, compound-specific carbon isotope analysis (CCIA) is relatively mature. The CCIA of n-alkanes has become an effective analytical technique to de-convolute the mixed liquid hydrocarbons [8] and to elucidate multiple organic matter origins in oils, source rock extracts, and kerogen pyrolysates [6,7,9]. In contrast, compound-specific hydrogen isotope analysis (CHIA), though a later development, offers distinct advantages over CCIA. These advantages stem primarily from the substantial mass difference between stable hydrogen isotopes and the unique hydrogen compositions that mirror environmental water characteristics. Consequently, CHIA of n-alkanes has sparked renewed interest in employing hydrogen isotopes (δ2H) for oil–source and oil–oil correlations in both marine and terrestrial petroleum systems [10] for assessing thermal maturity [11], deciphering biogeochemical cycles [12], reconstructing paleoenvironments and paleoclimates [13], evaluating the in-reservoir alteration processes [4], and unravelling complex petroleum mixtures [14]. The δ2H values are predominantly influenced by four factors [14]: kinetic isotopic fractionation during liquid hydrocarbon generation [15]; post-depositional hydrogen exchange with water or clay minerals [11]; the hydrogen source in organic substrates [16]; and physiological and metabolic processes in organisms transferring water-derived hydrogen into organic molecules. Excluding the effects of secondary alterations, such as thermal cracking, biodegradation, and thermochemical sulfate reduction, the δ2H in marine-derived hydrocarbons can reflect the isotopic composition of biosynthetic precursors. This is because the δ2H of oceans has remained relatively constant over significant geological periods. However, identifying unaltered end-member oil in the Tarim Basin, characterized by its complex stratigraphy involving deep burial, multi-stage accumulations, adjustments, and secondary alterations, remains a formidable challenge. This complexity impedes the efficacy of steroid/terpene biomarkers traditionally employed in oil–source correlation. Consequently, currently identified end-member crude oils from Cambrian/Ordovician source rocks, exemplified by samples from wells TD2 (4630–4670 m), TZ62 (4052.88–4073.88 m), ZS1 (6439–6458 m), ZS1C (6861–6944 m), and YM2 (3597–6050 m), fail to represent specific source intervals due to extensive secondary alterations that have obliterated original signatures [17,18]. Therefore, it is hypothesized that the longstanding controversy in oil–source correlation within this region may stem from the imprudent selection of end-member oils, a factor that has significantly impeded progress in this field [17].
As exploration well drilling ventures into greater depths, the ultra-deep liquid hydrocarbons are constantly discovered in the Tarim Basin, especially those from depths exceeding 7000 m in the Shuntuoguole (STGL) area, attributed to the notably low geothermal gradient (~2 °C/100 m) [18]. Recent analyses employing positive ion electrospray Fourier transform ion cyclotron resonance mass spectrometry (FT–ICR MS) on polar compounds enriched with nitrogen, sulfur, and oxygen (NSO) suggest the potential presence of unaltered or minimally altered crude oils in STGL [19].
Accordingly, this study aims to leverage the sensitivity of compound-specific δ2H and δ13C values of n-alkanes to secondary alterations. This approach is strategically employed to distinguish unaltered or minimally altered crude oils. The objective is to identify credible end-member oils, elucidate their origins, and contribute novel insights to the protracted debate surrounding oil–source correlations.
2. Geologic Setting
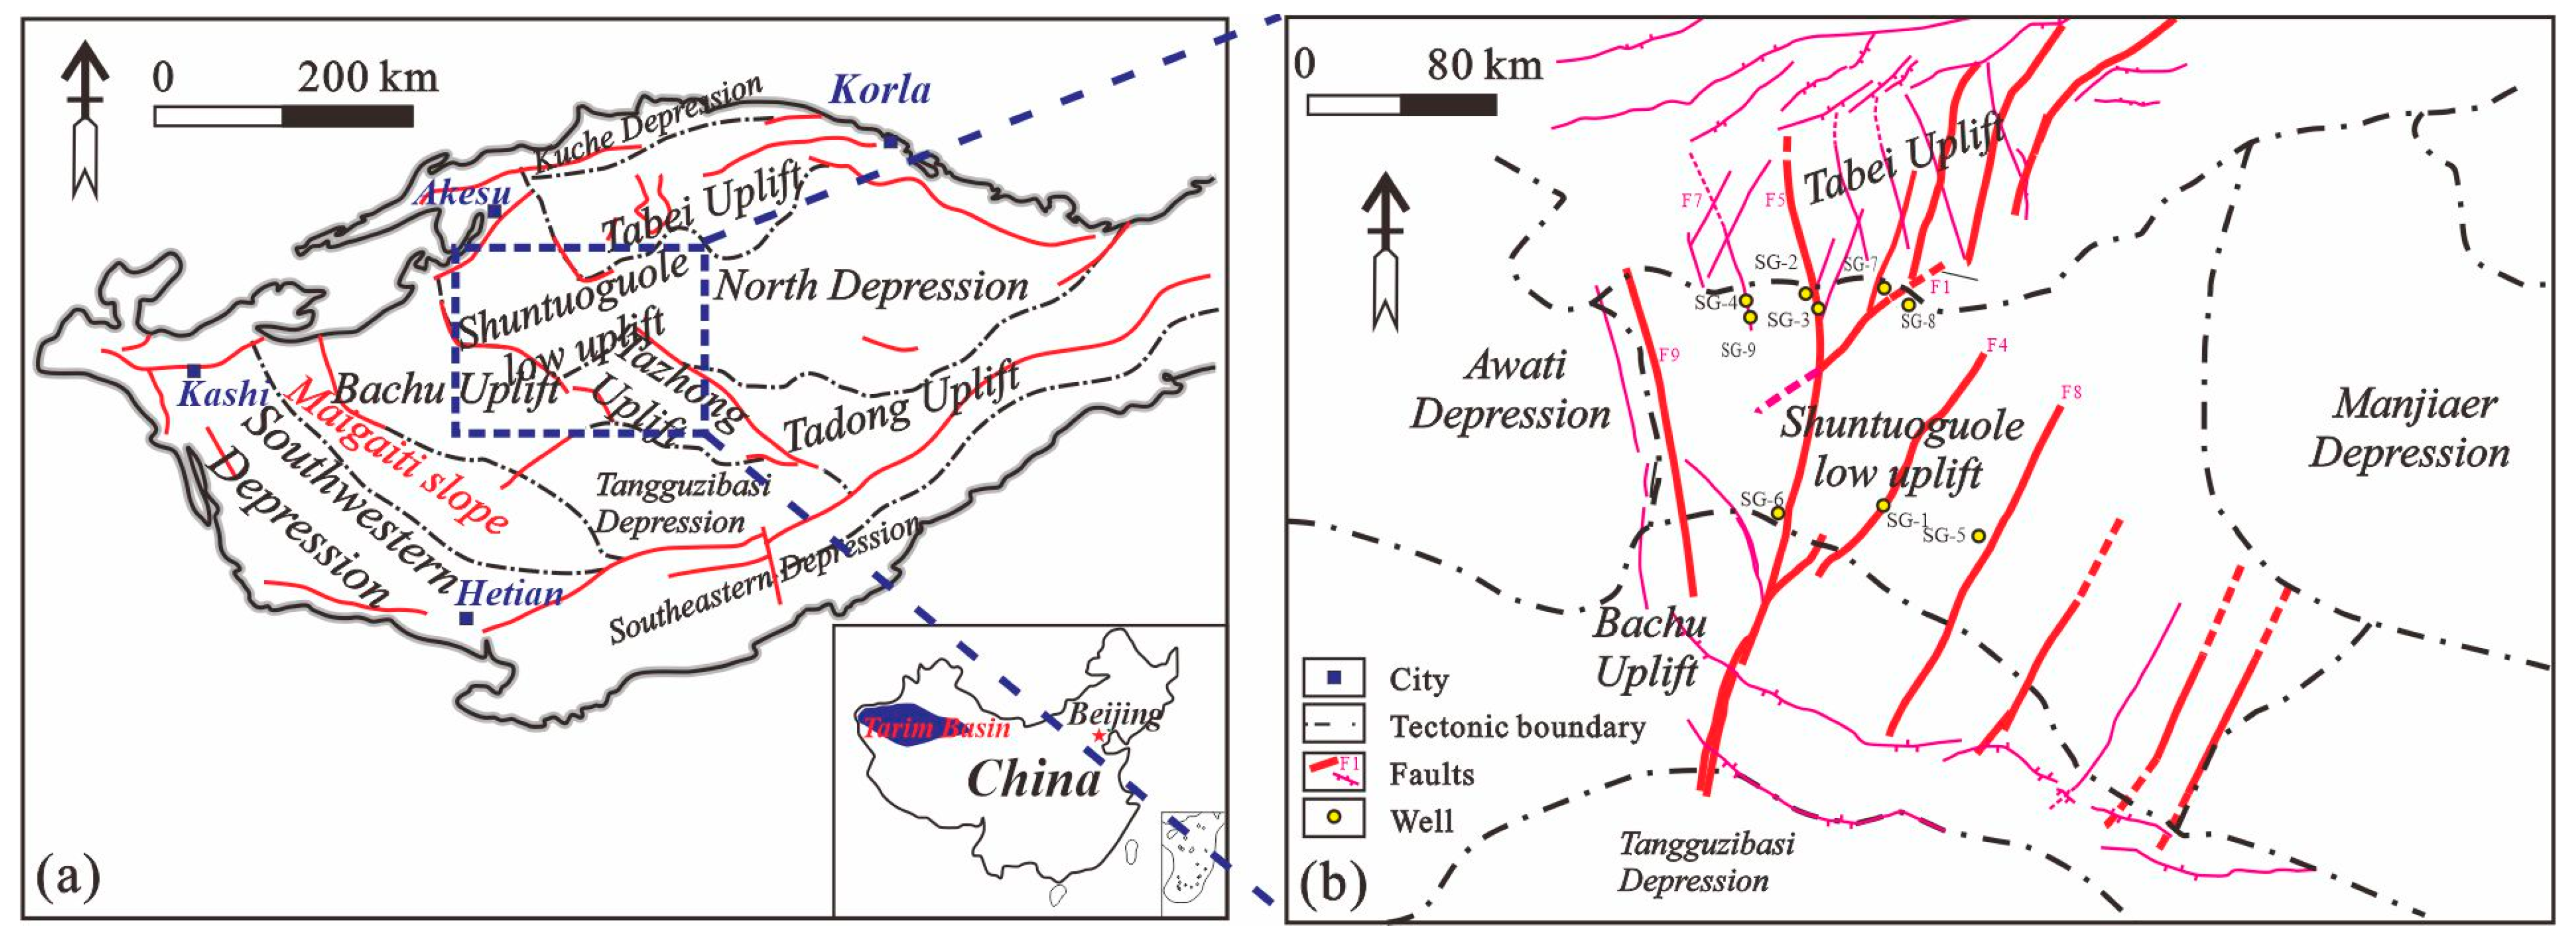
STGL, situated in the expansive Tarim Basin which spans an area of approximately 560,000 km2, boasts a wealth of deep and ultra-deep petroleum resources. Geographically, it is delineated by the Shaya Uplift to the north, the Katalon Uplift to the south, the Awati Depression to the west, and the Mangar Depression to the east (Figure 1). The regional structural composition of STGL is characterized by a relatively stable and intermediate elevated topography, especially when compared to the Tabei and Tazhong uplifts. This geological setting is particularly conducive to the in situ accumulation of oil and gas, a process significantly influenced by the presence of 18 extensive strike-slip fault zones that cumulatively span over 907 km [20].
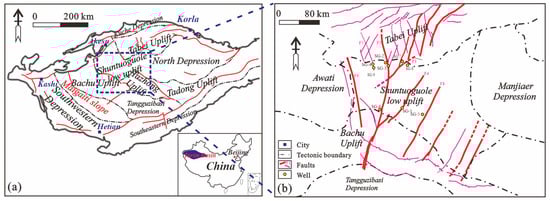
Figure 1.
The location of typical oil wells sampled in the Tarim Basin, China ((a) location of Shuntuoguole low uplift in the Tarim Basin, China; (b) location of typical oil wells in the Shuntuoguole low uplift).
Notwithstanding the absence of Jurassic sediments and the partial or complete lack of Cretaceous, Permian, Carboniferous, Devonian, and Silurian strata, the remaining geological layers in STGL are well developed. Significant discoveries of oil and gas have been made in the Middle–Lower Ordovician Yingshan Formation (O1–2y), the Middle Ordovician Yijianfang Formation (O2y), the Silurian Kepingtag Formation (Sk), and the Cretaceous Shushanhe Formation (Ks) within STGL. Notably, the O1–2y and O2y formations serve as the principal hydrocarbon reservoirs. STGL exhibits a rich diversity of resource types, including light oil reservoirs, volatile oil reservoirs, condensate gas reservoirs, and dry gas reservoirs, predominantly found in the Ordovician. These resources display distinctive distribution patterns of “west oil and east gas” as well as “north oil and south gas”. Oil and gas accumulations are primarily governed by the strike-slip fault zones, with significant concentrations along these faults [20,21,22]. For instance, the progressive exploration and development within the Shunbei No.5 fault zone have been markedly successful, culminating in 18 exploration and development wells and 17 industrial hydrocarbon flow wells, thereby underscoring the promising prospects for oil and gas exploration and development in the region. Given the relatively recent (within the past five years) discovery of these hydrocarbons in the STGL, scholarly studies focusing on their origins are comparatively scarce.
3. Samples and Experiments Methods
In this research, a total of nine representative marine crude oil samples were collected from STGL, as depicted in Figure 1. The samples primarily originated from the Ordovician strata, specifically the O1–2y and O2y formations, with a burial depth exceeding 6000 m, as detailed in Table 1. To investigate the secondary alterations and origins of these crude oils, we conducted comprehensive biomarker and isotopic analyses, including the δ13C of the whole oil and its fractions and the compound-specific δ13C and δ2H of n-alkanes.

Table 1.
The δ13C values of whole oil and its fractions from STGL, the Tarim Basin.
Initially, liquid chromatography using a silica gel–alumina column was employed to fractionate each filtrate following asphaltene precipitation of crude oils. This process involved separating saturated hydrocarbons with light petroleum ether, aromatic hydrocarbons with a methanol/dichloromethane mixture (3:97 v:v), and non-hydrocarbons with dichloromethane. Subsequently, the δ13C values of the whole oil and the aforementioned four fractions were determined using an Element analyzer-MAT 253 PLUS isotope ratio mass spectrometry (EA-MAT 253 PLUS IRMS) joint instrument from China University of Petroleum (East China), Qingdao, China. Each sample underwent a minimum of three tests, maintaining an error margin of less than 0.3‰. Additionally, gas chromatography–mass spectrometry (GC-MS) analyses of the saturate and aromatic fractions were conducted on SHIMADZU GC2010/GC-2010Plus-MS OP2010 Ultra from Guangzhou Institute of Geochemistry, Chinese Academy of Sciences, Guangzhou city, China, with further instrument parameter details referenced in our previous works [23,24,25,26].
Following GC-MS analysis, the saturated fractions were further separated into branched/cyclic and linear components using a two-stage procedure. Initially, 0.7 mL of cyclohexane and 300 mg of activated 5 Å molecular sieves were introduced to the saturated hydrocarbons. This mixture was heated at 95 °C for 8 h before being filtered through a Babbitt dropper with cyclohexane to segregate branched chains and cycloalkanes (present in the filtrate). In the subsequent step, 1.5 mL of a mixed solvent (cyclohexane/n-pentane at a ratio of 15:85 v:v) was added to the pre-treated molecular sieve. This was then heated at 80 °C for 8 h. Finally, the remaining molecular sieve was cleaned with n-hexane to obtain linear fractions (n-alkanes). Linear fractions then underwent compound-specific δ13C and δ2H analysis of n-alkanes. The compound-specific δ13C measurements of n-alkanes were executed on an Isoprime IRMS instrument interfaced to a HP6890 GC (equipped with a HP5 column: 30 m, 0.32 mm i.d., 0.25 μm film thickness), using a combustion interface to quantitatively convert the compound-specific n-alkanes to CO2 at 860 °C, catalyzed by CuO. For the compound-specific δ2H measurements of n-alkanes, a Finnigan Delta+ XL IRMS interfaced to a HP6890 GC via a high-temperature conversion interface was utilized, where compound-specific n-alkanes were pyrolyzed to H2 at 1420 °C. These compound-specific δ13C and δ2H analyses of each sample were performed in duplicate, with precisions of less than 0.3‰ and less than 5‰, respectively.
The GC-MS analyses for the saturate and aromatic fractions from the source rock extracts have been previously reported [23,24,25,26] and were utilized for comparative analysis in this study.
4. Results
4.1. Biomarkers
The analysis of biomarkers revealed that the relative content of saturated hydrocarbons in the studied samples was notably high, with values exceeding 70% and reaching up to 90.5%. These saturated hydrocarbons predominantly comprised n-alkanes with no obvious unrecognized complex materials (UCMs).
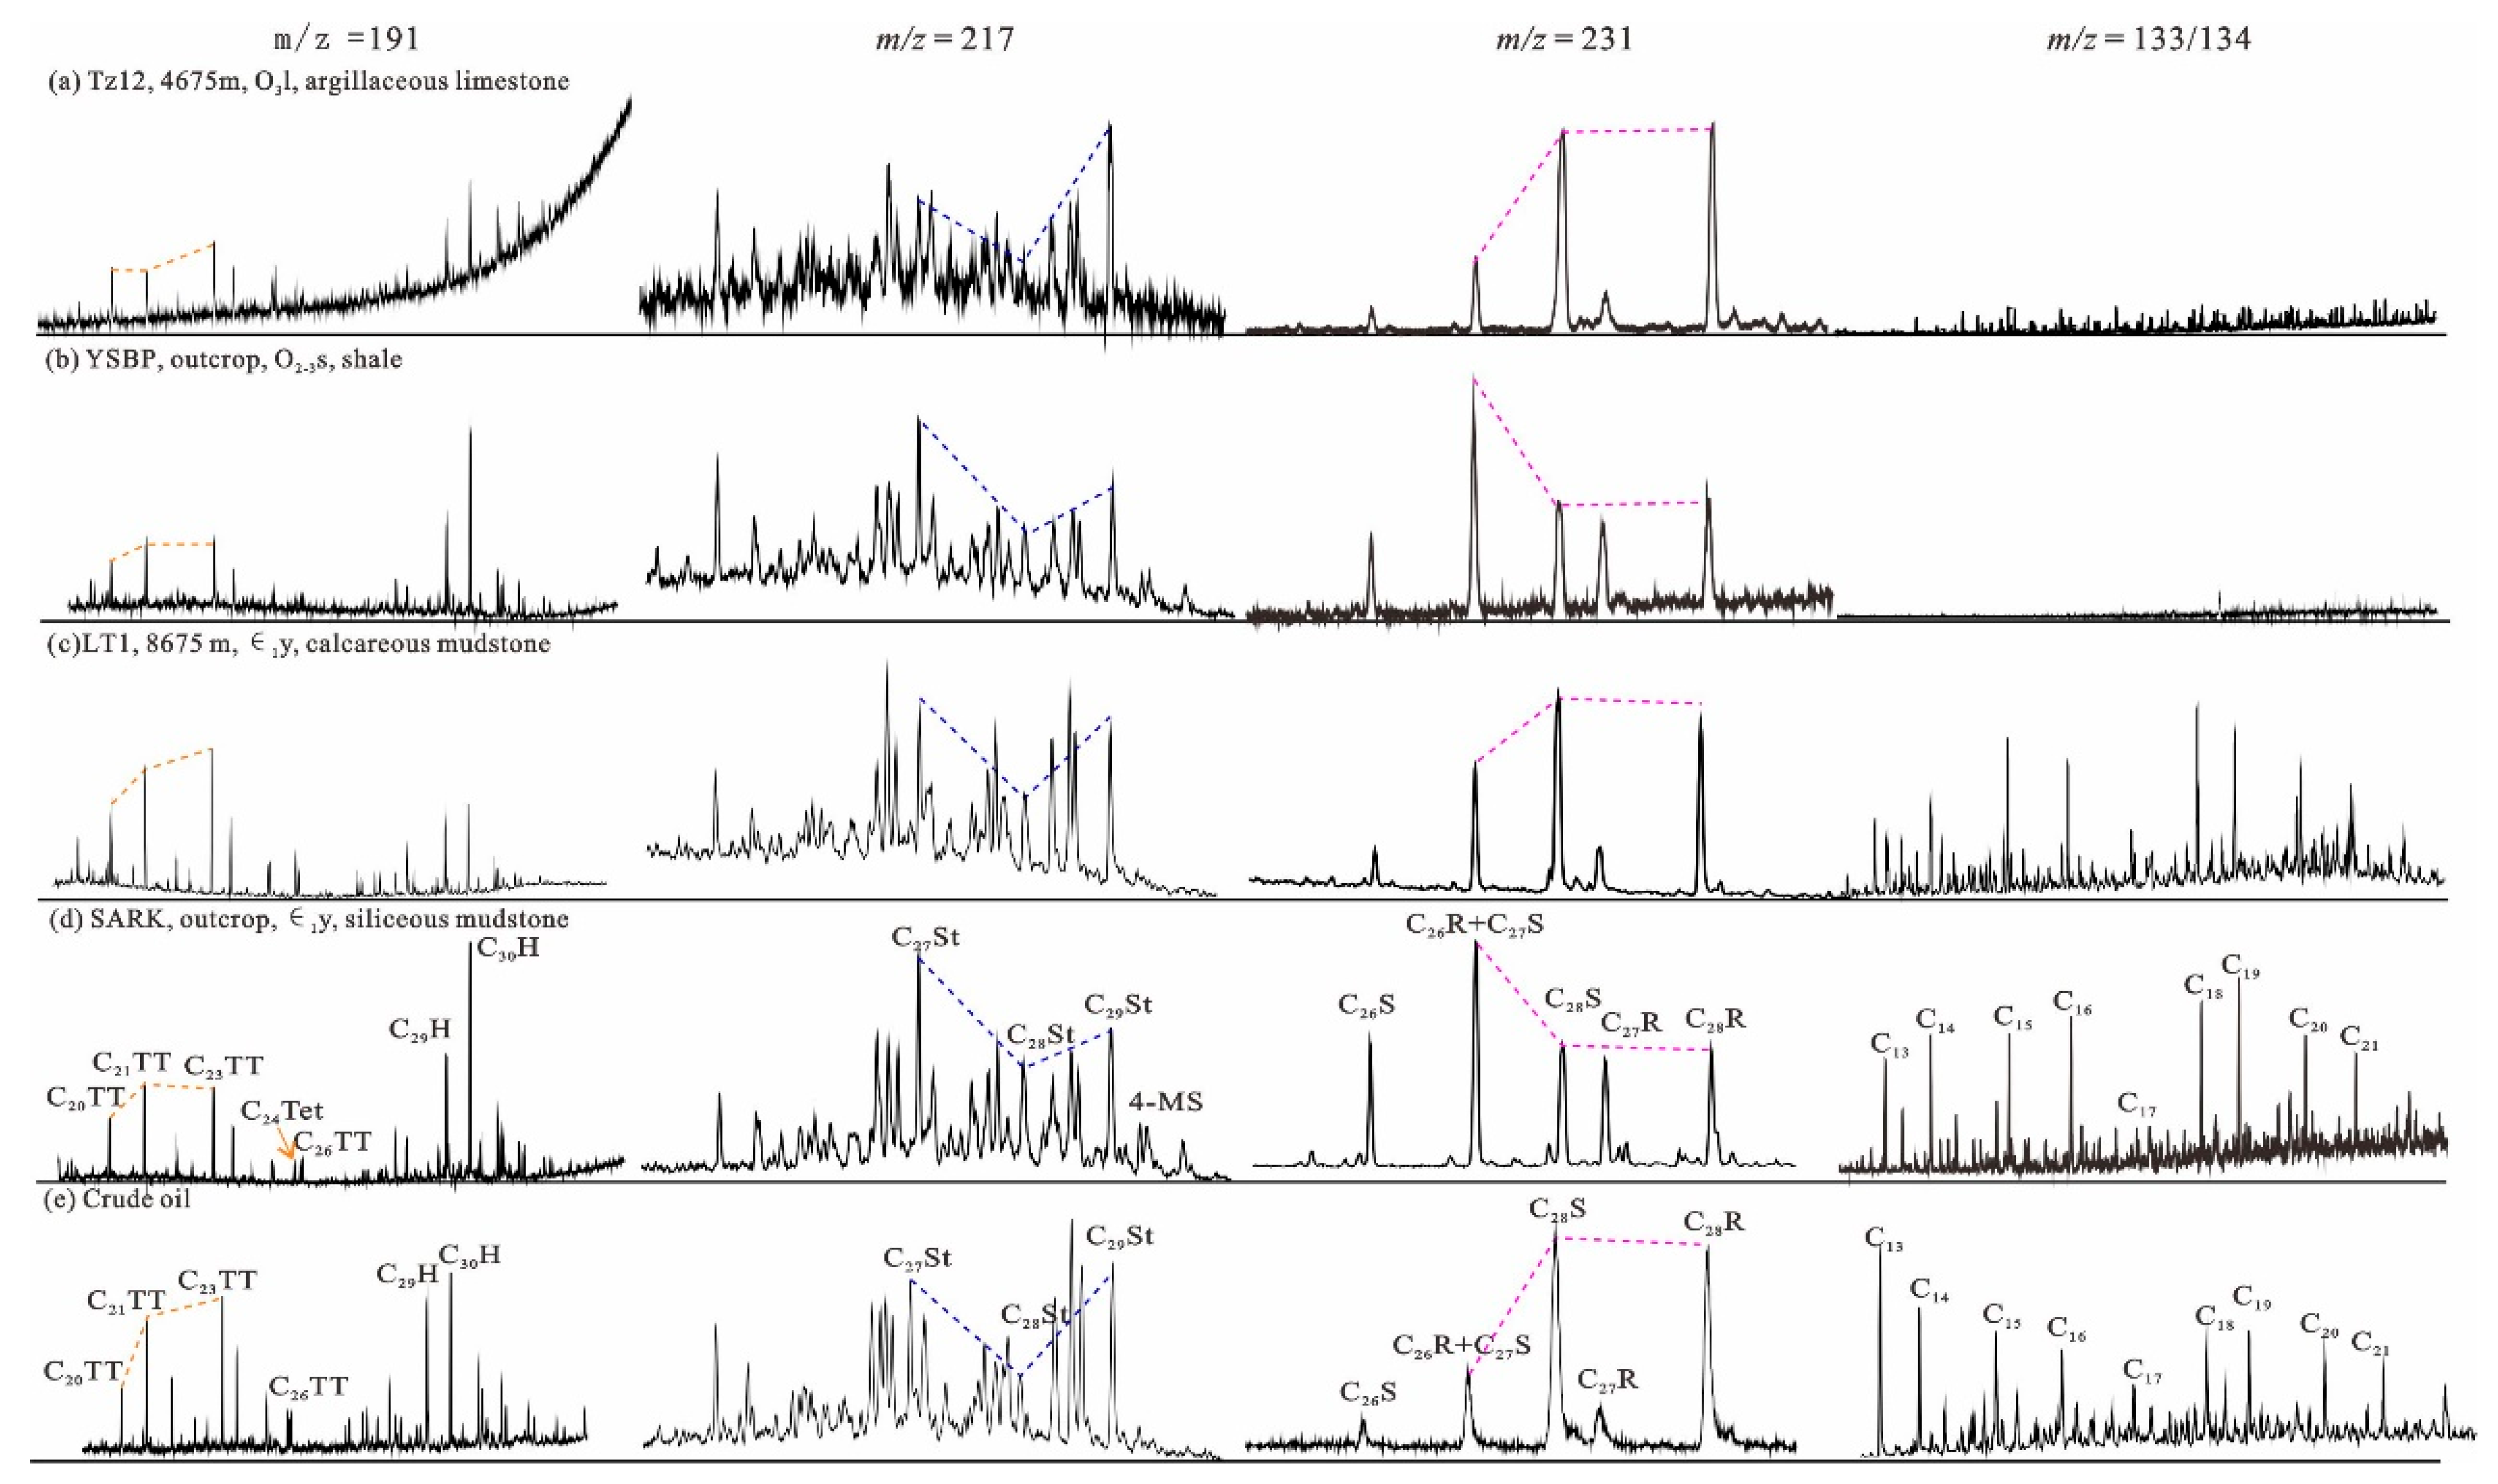
TNR-3 (TNR-3 = 1,3,7-/(1,3,7- + 1,2,5-) trimethylnaphthalenes) and (TeNR = 1,3,6,7-/(1,3,6,7- + 1,2,5,6- + 1,2,3,5-) tetramethylnaphthalenes) values, which are indicative of maturity, were observed to be greater than 0.4, with specific samples SG-2 and SG-3 displaying values as high as 0.91. Such findings suggest that the crude oils primarily originated from source rocks at an advanced stage of thermal evolution [27]. Under these highly mature conditions, traditional biomarkers, including steranes and terpanes, were detectable (as illustrated in Figure 2). However, their related parameters are susceptible to maturity levels and may exhibit convergence. For instance, the relative percentage content of C29 steranes (C29 St), C28 St, and C27 St displayed a “V”-shaped distribution without a dominant abundance of either C27 St or C29 St. Additionally, ratios such as the 4-methylsterane index (4-MSI = 4-methylsteranes/αααC29 regular sterane (C29 St)), C23/C21 tricyclic terpanes (TT), and Pr/Ph were calculable and are depicted in Figure 1.
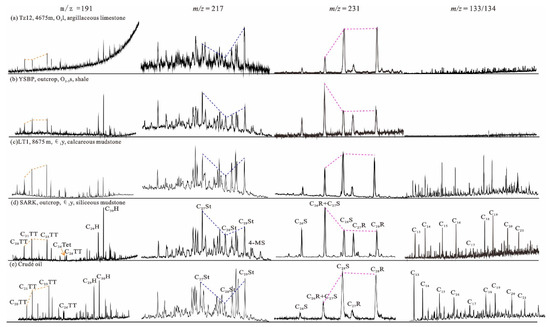
Figure 2.
Partial mass chromatograms of saturated fractions (m/z 191 and 217) and aromatic fractions (m/z 231 and 133/134) for typical source rocks and crude oil (SG-3).
The m/z = 133/134 aromatic fraction chromatogram of all crude oil samples exhibited a complete distribution of aryl isoprenoids (AIs) with carbon numbers ranging from 12 to 22, as shown in Figure 2d. The mass spectra of these compounds were characterized by a base peak at m/z 133/134, a molecular ion peak at m/z 147 + 14n (n = 1~12), and other distinctive peaks at m/z 91/105/119/147/147 + 14 n, aligning with the general formula CnH2n-6 of a trimethylbenzene series. Notably, with the increasing carbon number of AIs (AIs-Ci, i = 12~22), a regular absence or low value was observed at AIs-C23, AIs-C17, and AIs-C12, while a predominance of AIs-C13~C16 and AIs-C18~C22 homologues was evident. These patterns were consistent with the mass spectra of irregular isoprenoids featuring a tail-to-tail linkage [28] and were thus interpreted as side chains of AIs. The mass spectrum and retention time of these compounds were further corroborated by comparing them with previously published standards [29,30,31]. Consequently, the identified AIs were determined to be 1,3,4-trimethyl-aryl isoprenoids in accordance with IUPAC nomenclature [31].
4.2. δ13C of STGL Oils and Their Group Components
The carbon isotopic composition (δ13Coil) of the whole oil from STGL crude oils exhibited a range from −32.2‰ to −29.4‰, with a mean value of −31.2‰, as detailed in Table 1. The δ13C values of the saturated hydrocarbons (δ13CSAs) within these oils varied from −32.5‰ to −30.3‰, averaging at −31.7‰. In the case of aromatic hydrocarbons (δ13CAHs), the range was from −31.4‰ to −29.1‰, with an average of −30.4‰. For the non-hydrocarbon fractions (δ13CNHs) of STGL crude oils, the δ13C values extended from −30.7‰ to −26.9‰, yielding an average of −29.5‰. Additionally, the δ13C values of the asphaltenes (δ13CASs) ranged from −31.2‰ to −27.8‰, with a mean value of −29.6‰. When compared to crude oils from the Tazhong and Tabei Uplifts, known for their complex origins [4], the isotopic disparities observed among STGL crude oils and their respective group components were predominantly less than 3‰. This suggests that the oils from the STGL region are likely to have homologous origins.
4.3. Compound-Specific δ13C of n-Alkanes
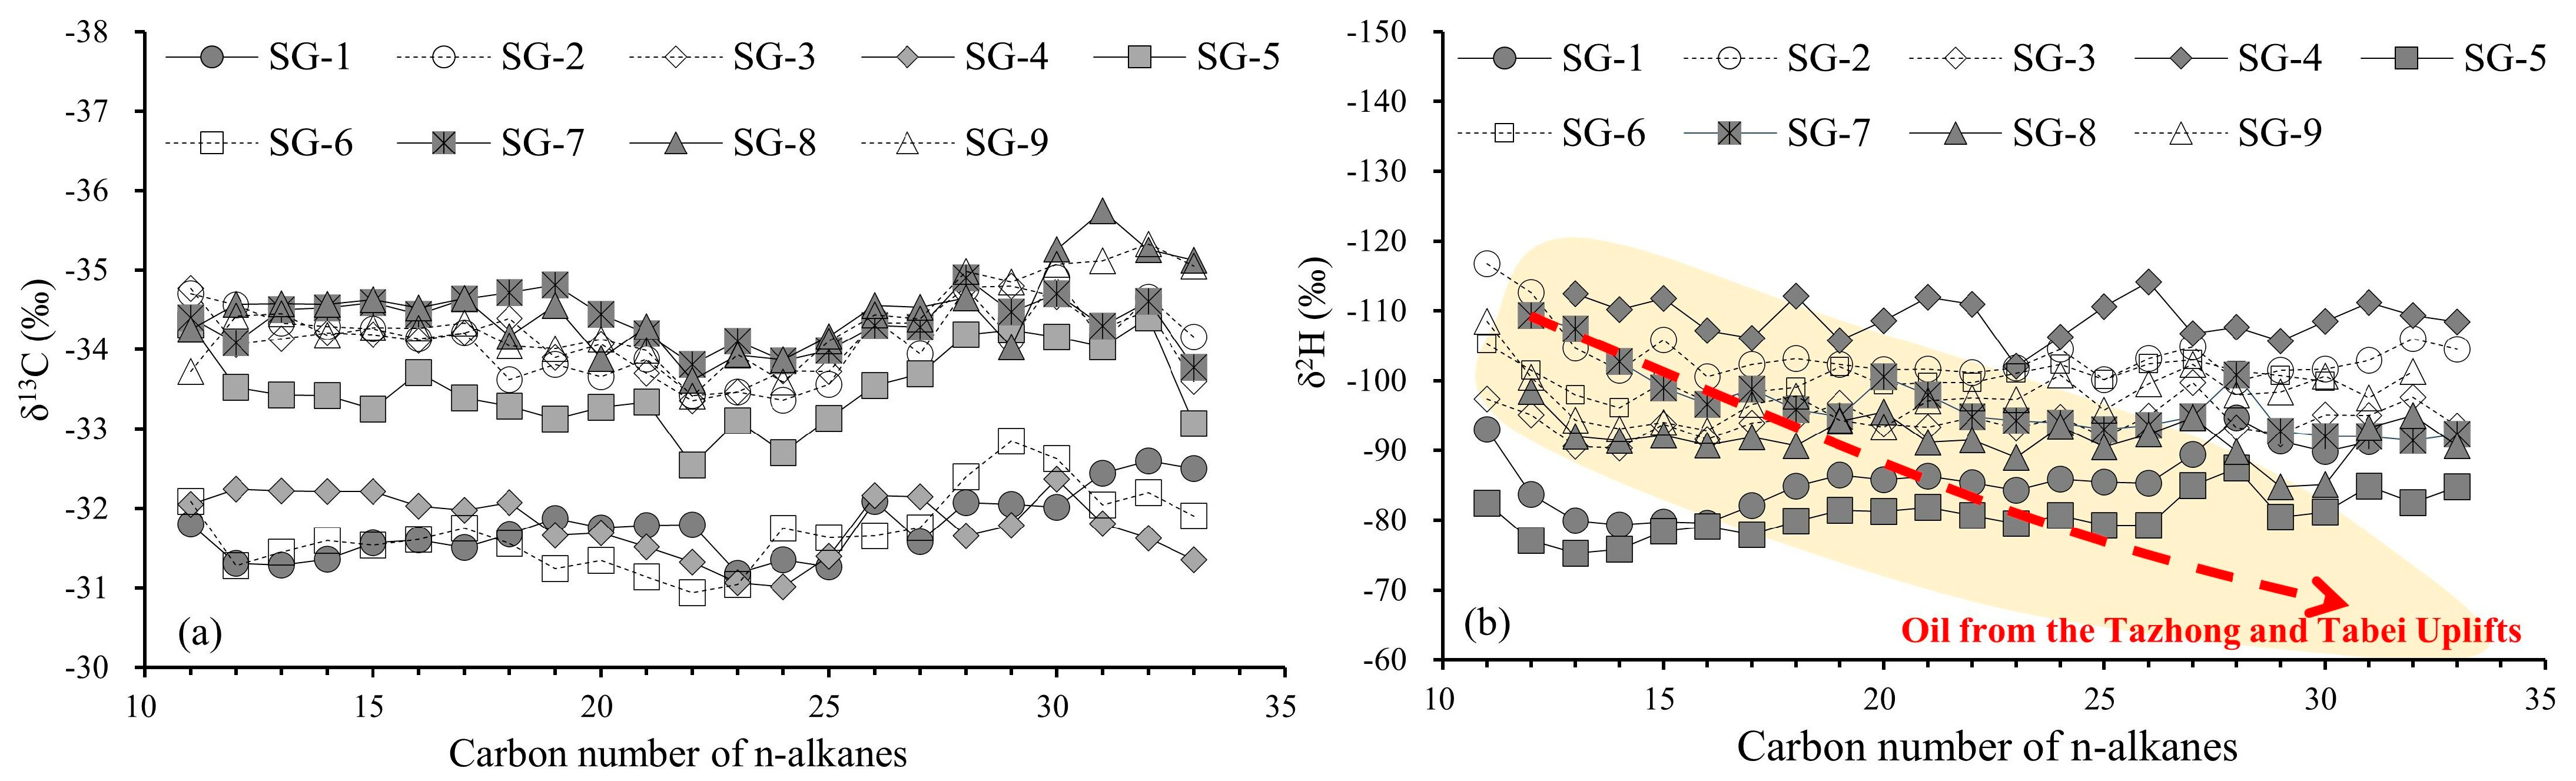
The analysis of compound-specific δ13C values of n-alkanes (ranging from nC11 to nC33) in each STGL oil sample revealed remarkably minor variations, not exceeding 2‰, as represented in Table 2. For instance, in the SG-8 oil sample, the lightest δ13C values of n-alkanes predominantly ranged between −35.5‰ and −33.6‰, averaging at −34.5‰, with a maximum divergence of 1.9‰. Conversely, the heaviest δ13C values of n-alkanes, observed in the SG-4 oil sample, were primarily concentrated between −32.4‰ and −31.0‰, with an average of −31.8‰ and a maximal discrepancy of 1.4‰. Similarly, the SG-7 oil sample, which exhibited the smallest internal δ13C variation, had its δ13C values of n-alkanes chiefly distributed between −34.9‰ and −33.8‰, resulting in an average value of −34.4‰ and a maximum difference of merely 1.1‰. This approximately horizontal distribution pattern of compound-specific δ13C values strongly indicates that crude oils from the STGL area have not undergone significant secondary alterations.
Table 2.
Compound-specific δ13C (‰) of n-alkanes from the STGL crude oil, the Tarim Basin.
4.4. Compound-Specific δ2H of n-Alkanes
The compound-specific δ2H values of n-alkanes (ranging from nC11 to nC32) in each of the STGL oil samples demonstrated relatively larger variations when compared to their δ13C counterparts, as detailed in Table 3. However, when juxtaposed with crude oils from the Tazhong and Tabei Uplifts, which exhibit compound-specific δ2H differences of up to 60‰, the discrepancies in the compound-specific δ2H values within STGL oils appear considerably more constrained. Specifically, these differences span from a mere 9‰ in the case of SG-6 oil to a maximum of 18‰ in SG-7 oil, averaging at about 13.6‰. This observation suggests a relatively narrower range of hydrogen isotopic variability within STGL oils, in contrast to those from the Tazhong and Tabei Uplifts.
Table 3.
Compound-specific δ2H (‰) of n-alkanes from the STGL crude oil, the Tarim Basin.
5. Discussion
5.1. Secondary Alterations
The analysis of secondary alterations which predominantly influence individual carbon and hydrogen isotopes in hydrocarbon parent material and sedimentary environments has indicated that biodegradation, thermal alteration, and thermal sulfate reduction (TSR) are primary factors. The crude oil in the study area exhibits similarities, suggesting a common type of source rocks, thereby implying analogous hydrocarbon-generating parent materials and depositional environments.
- (1)
- Biodegradation
Oils subjected to biodegradation tend to transform into heavier oils, characterized by a high concentration of 25-norhopanes, a prominent presence of unrecognizable complex materials (UCM), and varying degrees of n-alkane depletion (with lower carbon number n-alkanes experiencing greater losses). During the initial stages of biodegradation, stable δ13C and δ2H fractionations of individual organic compounds are predominantly governed by kinetic isotope effects. Molecules with lighter isotopes (1H, 12C) react slightly faster than those with heavier isotopes (2H, 13C), resulting in the residual compounds becoming increasingly enriched in heavy isotopes as biodegradation progresses, akin to Rayleigh distillation. Moreover, due to the preferential consumption of low-carbon normal alkanes during biodegradation and the susceptibility of 12C-12C and 1H-1H bonds to biodegradation attacks, the remaining carbon and hydrogen isotopes in normal alkanes tend to be relatively heavier in low-carbon normal alkanes compared to high-carbon ones [32]. In a study of progressively biodegraded oils, it was observed that with increasing biodegradation severity and decreasing carbon number of n-alkanes, the divergence in individual carbon and hydrogen isotopes becomes more pronounced (up to >3‰ for δ13C of nC17; up to >30‰ for δ2H of nC19) [32]. Asif et al. (2009) further corroborated this, noting that with advancing biodegradation, the largest δ2H fractionation (50‰) occurs in low-molecular-weight n-alkanes (nC14~nC22), while high-molecular-weight n-alkanes (>nC23) show a smaller fractionation, approximately 20‰ [33].
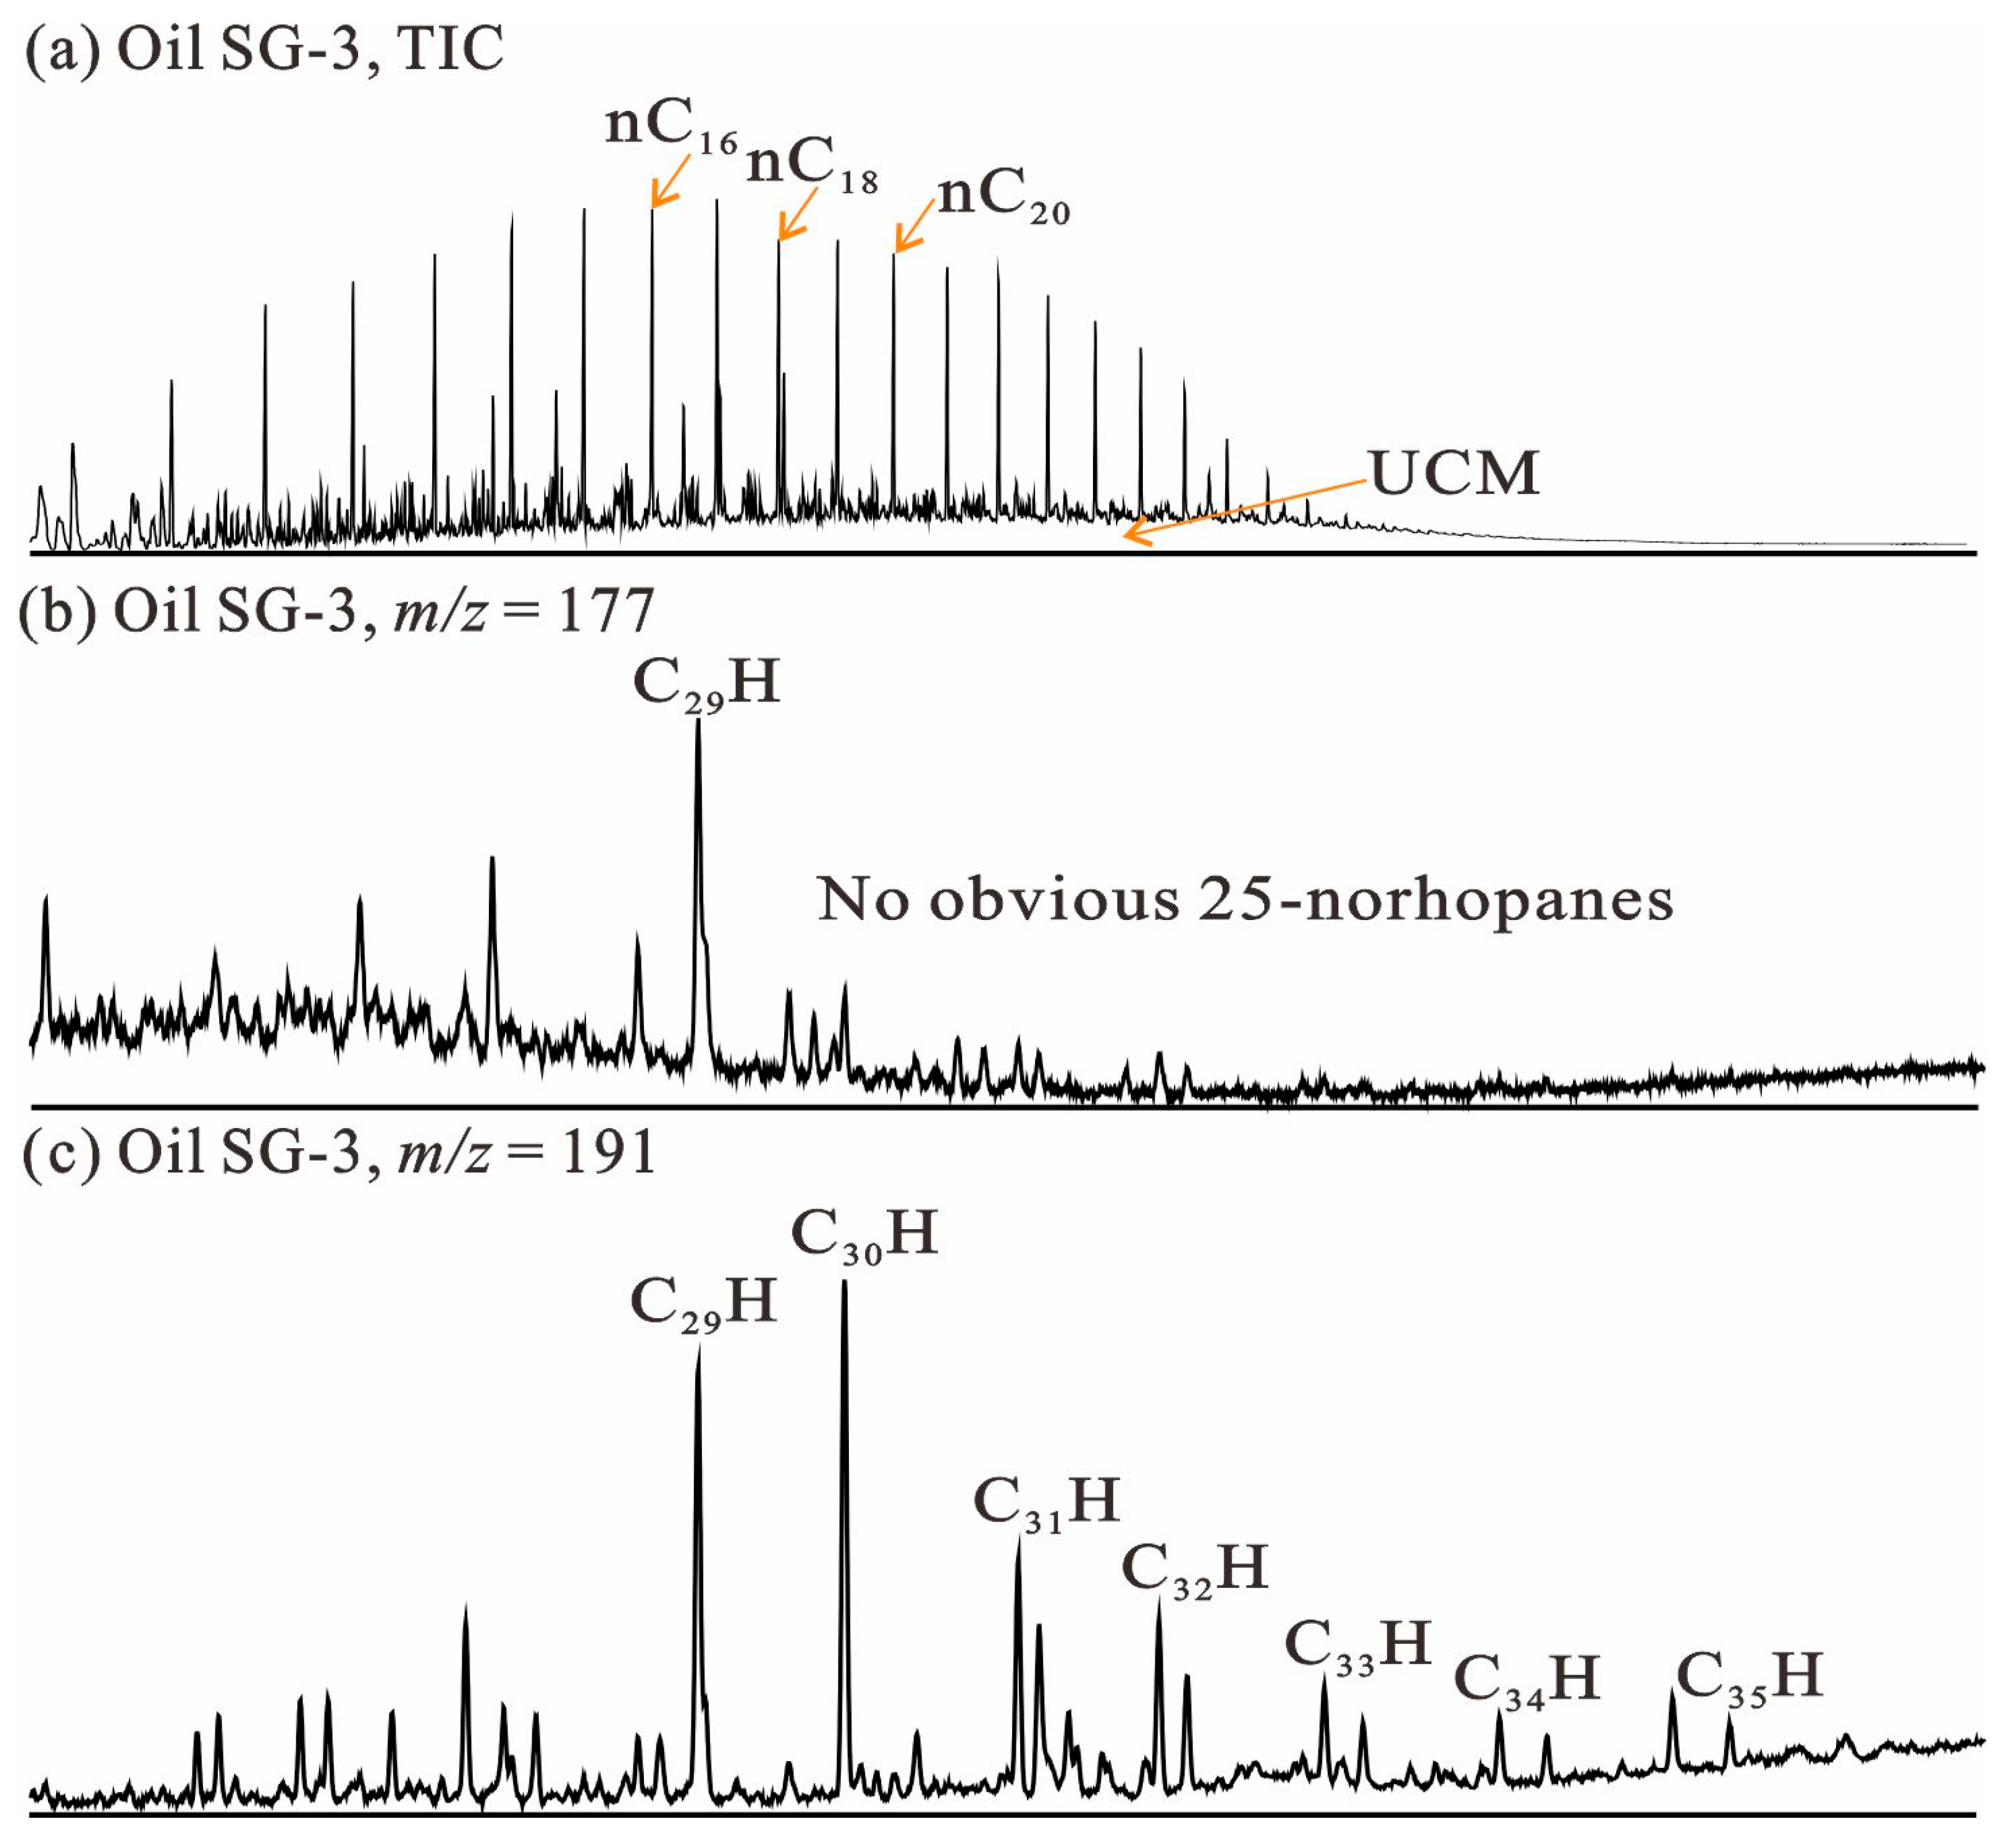
For the ultra-deep hydrocarbon fluids from the Shuntuoguole area: (1) a complete distribution of normal alkanes from nC11 to nC30 is observed, characterized by a parabolic distribution with higher values in the middle and lower values on both sides (Figure 3a); (2) there is an absence of detectable UCM and 25-norhopanes (Figure 3); (3) the distribution of compound-specific δ13C values is approximately horizontal across the range of carbon numbers, without significant heavier values in the δ13C of low-molecular-weight normal alkanes (Figure 4a); and (4) the distribution of compound-specific δ2H is also approximately horizontal across the range of carbon numbers, without notable heavier values in the δ2H of low-molecular-weight normal alkanes (Figure 4b). These findings collectively suggest that the crude oils from STGL have not undergone significant biodegradation alteration.
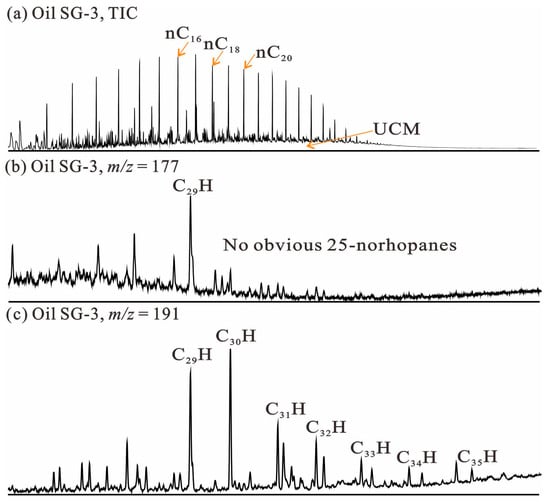
Figure 3.
TIC and mass chromatograms of saturated fractions (m/z 191 and 217) for typical crude oil (SG-3).
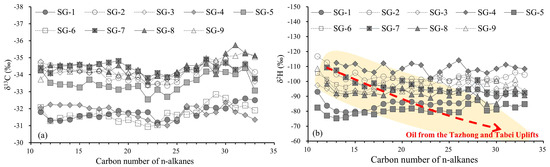
Figure 4.
Compound-specific δ13C (a) and δ2H (b) of n-alkanes from the STGL oil, the Tarim Basin (data of oil from the Tazhong and Tabei Uplifts are reported by Jia et al. [7]).
- (2)
- Thermal alteration
Over extended geological periods, the primary δ13C and δ2H compositions of sedimentary organic matters can be extensively modified by diagenetic and catagenetic processes, particularly under conditions of increasing thermal maturity during primary and secondary cracking stages. Anhydrous thermal simulation experiments, such as those conducted by Tang et al. (2005) using a gold tube cracking device on Beihai crude oil, are commonly employed to study the thermal evolution characteristics of biomarkers and individual isotopes [15]. The findings indicated that at elevated temperatures of 445 °C (Ro ~1.5%), the δ2H value of n-alkanes increased by approximately 60‰. Notably, this 2H enrichment was more pronounced in long-chain n-alkanes than in their short-chain counterparts. This phenomenon could be attributed to two factors: first, the faster cracking rate and higher degree of decomposition of long-chain alkanes, and second the isotope kinetic fractionation, where the cracking products (short-chain alkanes) derived from long-chain alkanes are depleted in 2H, resulting in a relative 2H enrichment in the residual long-chain alkanes. Further research supports this observation. For example, studies on kerogen before and after hydrocarbon generation/expulsion of a type II kerogen revealed that the δ2H value of n-alkanes increased slowly within an EasyRo range of 0.7% to 1.1%, but accelerated sharply upon reaching an EasyRo of 1.4%, paralleling the rapid increase in δ13C values. Additionally, gold tube thermal simulation experiments on certain Tarim Basin crude oil asphaltenes and asphalt sands demonstrated that the δ2H values of n-alkanes in asphaltene pyrolysis products rose with increasing pyrolysis temperatures from 320 °C, with a more rapid increase at higher temperatures (380 °C) [6]. Similar isotope kinetic fractionation patterns were observed for δ13C, with increases correlating to rising maturity levels.
In the context of the ultra-deep hydrocarbon fluids from STGL, the distribution of compound-specific δ13C and δ2H values appears to be approximately horizontal across varying carbon numbers. Notably, no significant heavier values were observed, and in some cases, even slightly lighter values were detected in the δ13C of low-molecular-weight normal alkanes (Figure 4a,b). This pattern suggests that STGL crude oils did not experience significant thermal alteration.
- (3)
- TSR alteration
Thermochemical sulfate reduction (TSR) can significantly alter the δ13C and δ2H values of an oil, resulting in a shift towards heavier values in compound-specific δ13C and δ2H of n-alkanes. This is due to the preferential cleavage and oxidation of 12C and 1H bonds in individual n-alkanes during the TSR process [34]. A prime example of this is the crude oil from well ZS1C (6861–6944 m, the Lower Cambrian, 165 °C, 74–75 MPa). This condensate oil, with a density of 0.79 g/cm3 and a sulfur content of 2.06%, exhibits higher concentrations of 2-thiadiamondoids (8578 mg/g oil), diamondoids (155,000 mg/g oil), and dibenzothiophenes (70 mg/g oil). Moreover, it displays the heaviest compound-specific sulfur isotope values (~35‰) for alkylthiaadamantanes, alkyldibenzothiophenes, alkylbenzothiophenes, and alkylthiolanes, indicating that it has undergone severe TSR alteration [35,36]. Correspondingly, the compound-specific δ13C values of n-alkanes in this oil are also among the heaviest, reaching around −29‰, which is about 5‰ heavier than most non-TSR altered crude oils from the Tazhong and Tabei Uplifts in the Tarim Basin [37]. In contrast, the compound-specific δ13C of n-alkanes from the ultra-deep hydrocarbon fluids in the STGL are approximately horizontally distributed, with most values being around ~34‰, akin to most non-TSR altered crude oils in the Tazhong and Tabei Uplifts. This suggests that the crude oils from the Shuntuoguole area have not experienced significant TSR alteration.
Additionally, STGL crude oils have been reported to possess a lower concentration of thiadiamondoids, ranging between 5.84 mg/g oil and 7.08 mg/g oil [19]. These values are less than 1/1000 of those found in the severely TSR-altered crude oil from well ZS1C, with thiadiamondoid content of approximately 10,000 mg/g oil [19] (Figure 5). This further corroborates the understanding that STGL crude oils have not undergone significant TSR alteration.
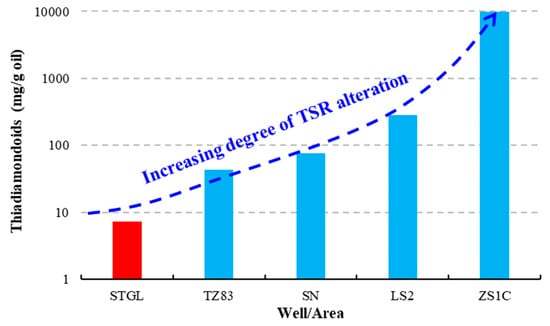
Figure 5.
Comparisons of thiadiamondoids in the STGL oil and some typical TSR-altered samples [38,39]. Note that the STGL oil samples, marked in red, have low concentration of thiadiamondoids with values ranging between 5.84 mg/g oil and 7.08 mg/g oil, with a mean value of 6.49 mg/g oil [19].
5.2. Oil–Source Correlation
The delineation of δ13C and δ2H profiles at the compound-specific molecular level is increasingly recognized as an efficacious instrument for the precise delineation of petroleum systems, enhancing the accuracy of oil–oil and oil–source correlations [32,40]. However, for these molecular isotopic compositions to serve as reliable indicators, they must remain identifiable through the myriad processes inherent in hydrocarbon genesis, migration, and accumulation, particularly amidst secondary alterations within reservoirs such as potential biodegradation, thermal modification, and thermochemical sulfate reduction (TSR).
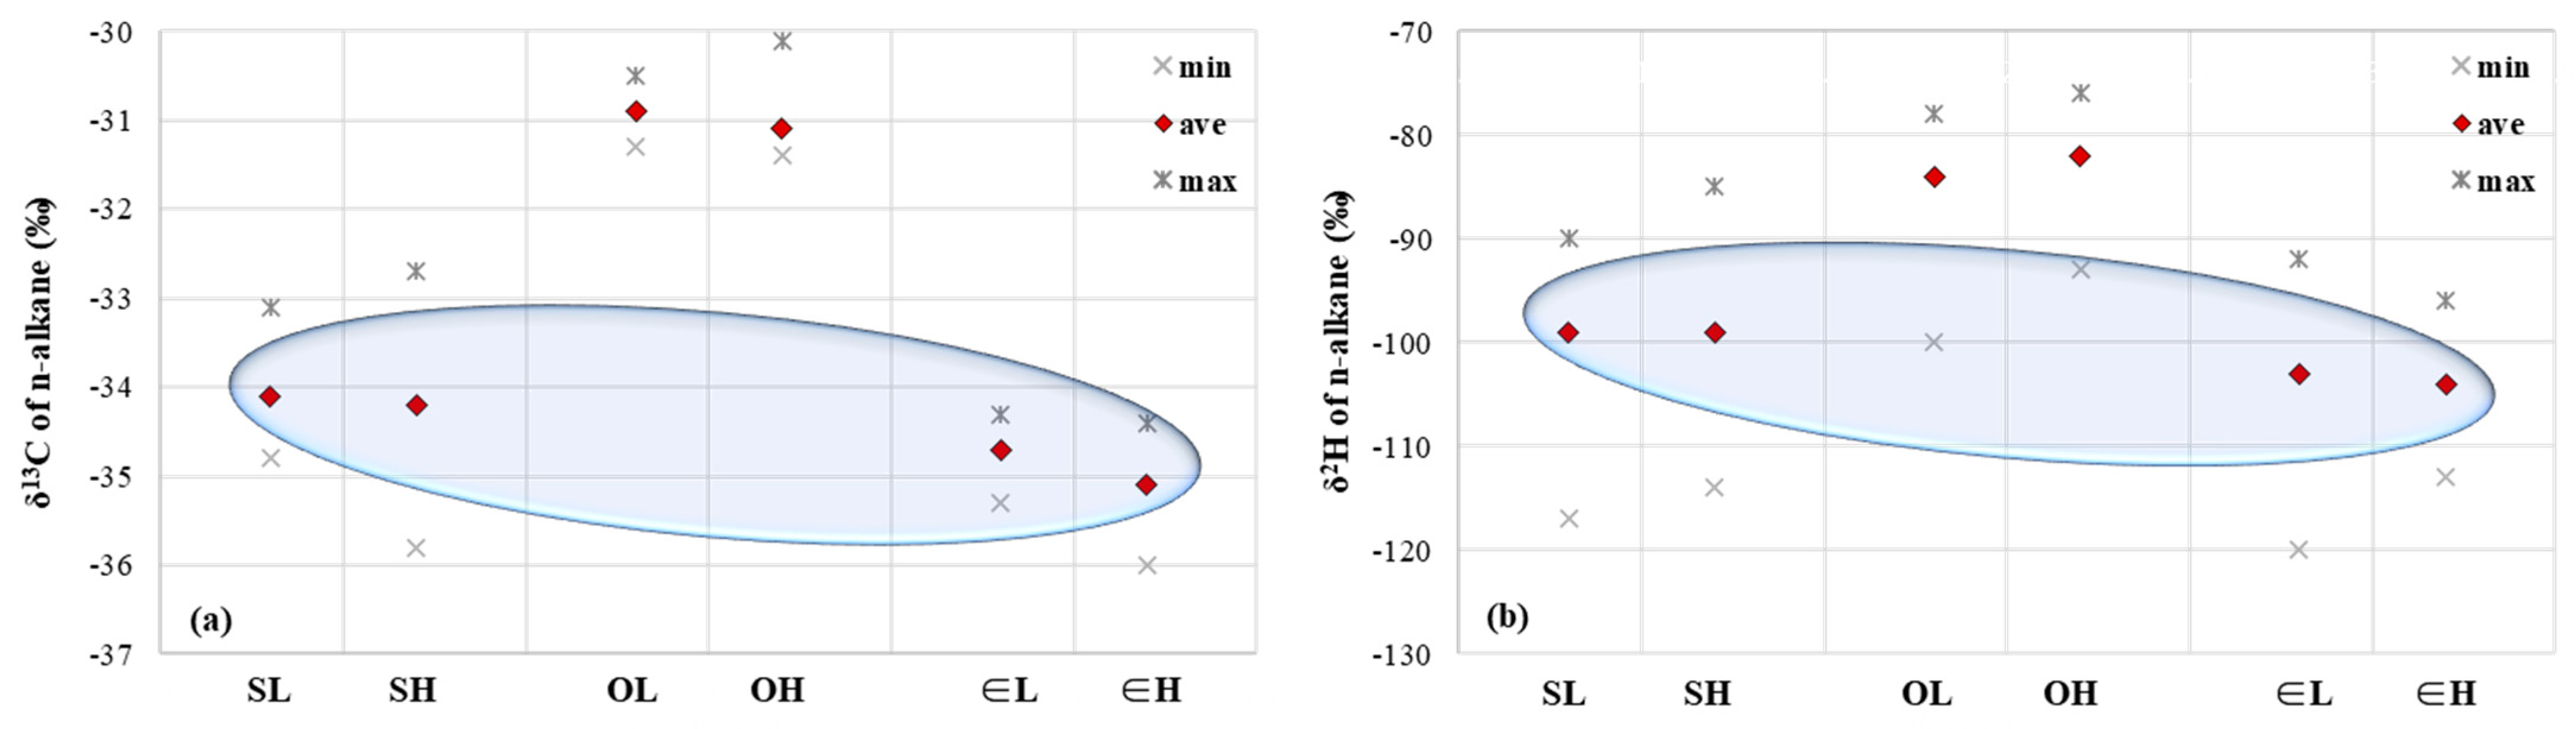
As previously elucidated, the crude oils from the Shuntuoguole area were not subjected to significant biodegradation, thermal alteration, or TSR, affirming the reliability of compound-specific δ13C and δ2H compositions as tools for oil–source correlation in this context. Source rocks from the Middle–Upper Ordovician and Lower Cambrian, exhibiting maturity rather than the high-mature or over-mature stages typically observed in outcrops and exploration wells on the periphery of the Tarim Basin, were meticulously selected for oil–source correlation analysis. To elucidate the isotopic distinctions of n-alkanes across different molecular weights, n-alkanes were bifurcated into two groups: lower-molecular-weight n-alkanes (carbon number < 22) and higher-molecular-weight n-alkanes (carbon number ≥ 22). Figure 6a demonstrates that while the overall compound-specific δ13C difference across varying molecular weights approximates 2‰ (surpassing the instrumental testing error), the mean discrepancy is confined to within 0.5‰. This suggests that outliers may reflect testing variances attributed to disparities in the relative concentrations of individual compounds, yet do not alter their overall horizontal distribution pattern, which maintains a consistent average value. A parallel trend for compound-specific δ2H is observed in Figure 6b. Oil–source correlation, leveraging compound-specific δ13C and δ2H of low-molecular-weight (<nC22) and high-molecular-weight (≥nC22) n-alkanes between STGL crude oil and source rocks, indicates that (1) the mean compound-specific δ13C value of n-alkanes showcases a negligible difference (~1.0‰) between STGL crude oil and Lower Cambrian source rocks, attributable to potential carbon isotope fractionation (<3.0‰) across varying thermal evolutions, whereas a substantial divergence (>3.0‰) from Middle–Upper Ordovician source rocks exceeds the expected range of thermal evolution-induced carbon isotope fractionation [27]; (2) a similar minimal discrepancy and a pronounced gap are also evident in the average compound-specific δ2H value of n-alkanes between STGL crude oil and Lower Cambrian/Middle–Upper Ordovician source rocks. Consequently, it is inferred that STGL crude oils predominantly originate from Lower Cambrian source rocks. This conclusion is corroborated by comparisons of component carbon isotopes and specific biomarker compounds.
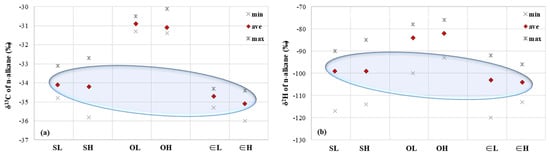
Figure 6.
Oil–source correlation based on compound-specific δ13C (a) and δ2H (b) of low-molecular-weight (<nC22) and high-molecular-weight (≥nC22) n-alkanes between STGL crude oil and source rocks (SL, low-molecular-weight n-alkanes of STGL crude oil; SH, high-molecular-weight n-alkanes of STGL crude oil; OL, low-molecular-weight n-alkanes of Middle–Upper Ordovician source rocks; OH, high-molecular-weight n-alkanes of Middle–Upper Ordovician source rocks; ЄL, low-molecular-weight n-alkanes of Lower Cambrian source rocks; ЄH, high-molecular-weight n-alkanes of Lower Cambrian source rocks; data of source rocks under maturity stage are from previous works [41,42,43]).
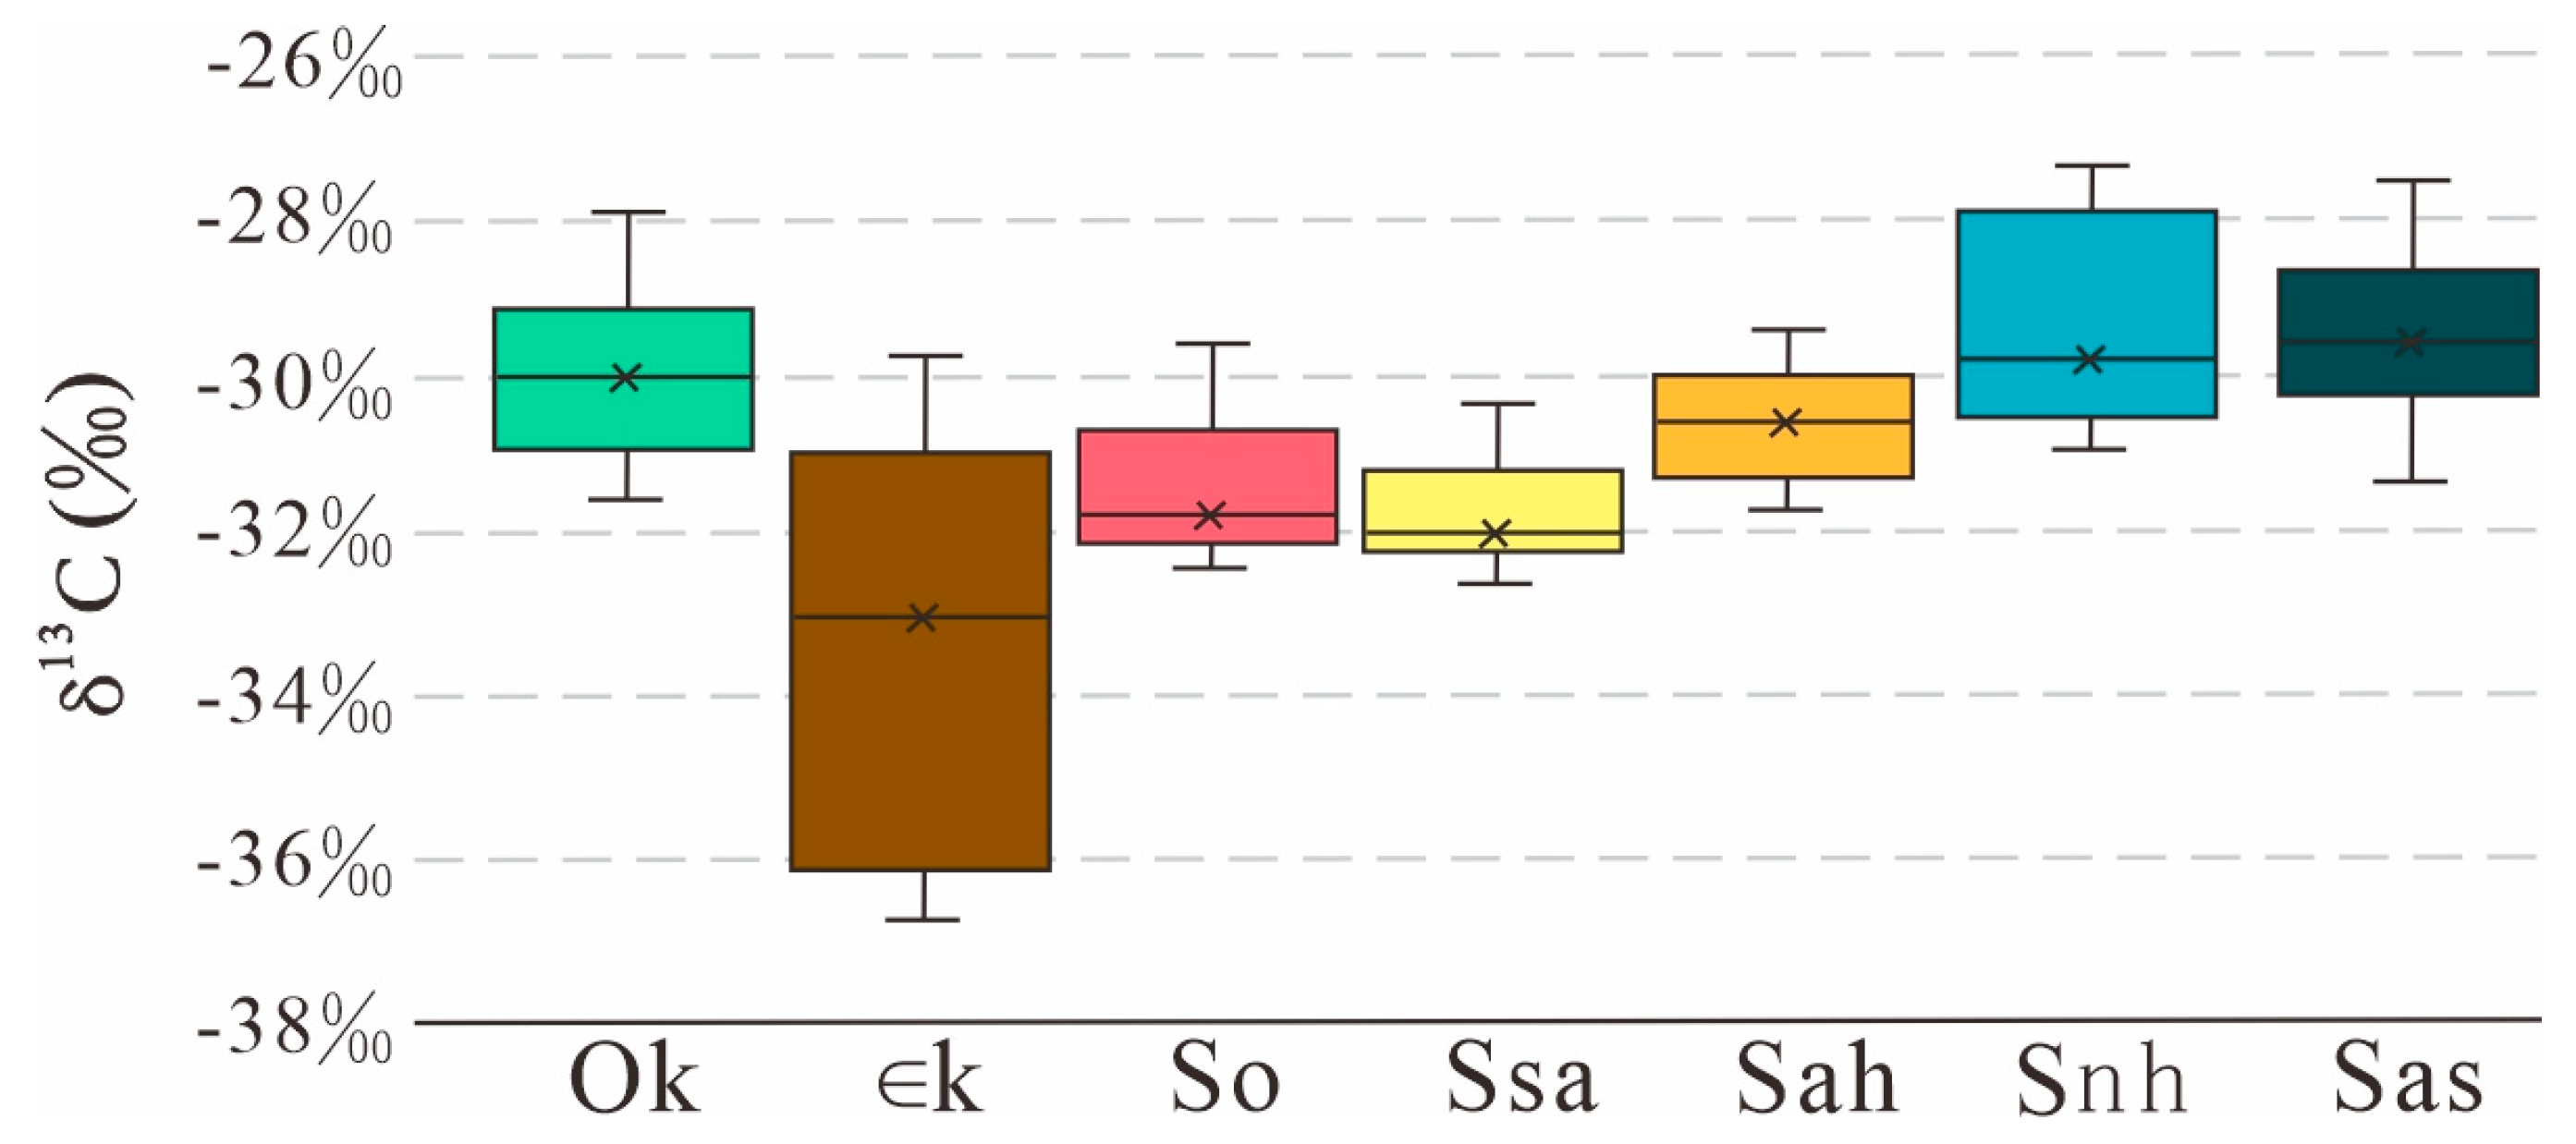
Oil–source correlations utilizing δ13C from source rocks, crude oil, and their fractions (Figure 7) demonstrate that the carbon isotopes of the entire crude oil and its saturated hydrocarbons both approximate ~32‰, aligning with the predominant distribution of kerogen carbon isotopes in Lower Cambrian source rocks and diverging markedly from the kerogen carbon isotope distribution in Middle–Upper Ordovician source rocks. Conversely, the carbon isotopes of aromatic hydrocarbons, non-hydrocarbons, and asphaltenes in STGL crude oil, exceeding −31‰, reside within the primary distribution range of kerogen carbon isotopes in Middle–Upper Ordovician source rocks, distancing from that in Lower Cambrian source rocks. This disparity in carbon isotope values during hydrocarbon genesis results in the heavier carbon isotopes of aromatic hydrocarbons, non-hydrocarbons, and asphaltenes compared to saturated hydrocarbons. Nonetheless, due to their lower relative content, these components do not encapsulate the total oil’s characteristic isotopic composition. However, saturated hydrocarbons, which generally possess a higher relative content, exhibit carbon isotope values consistent with the total crude oil (as depicted in Figure 7), suggesting that the carbon isotopic composition of saturated hydrocarbons accurately reflects that of the entire oil. Consequently, given that the carbon isotopes of both the whole oil and saturated hydrocarbons correspond to those found in Cambrian kerogen, it can be inferred that crude oil primarily originates from Lower Cambrian source rocks.
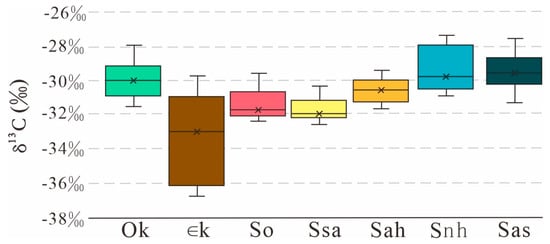
Figure 7.
Oil–source correlation based on δ13C of source rocks, crude oil, and fractions (Ok, kerogen of Middle–Upper Ordovician source rocks; Єk, kerogen of Lower Cambrian source rocks; So, STGL crude oil; Ssa, saturated hydrocarbons of STGL crude oil; Sah, aromatic hydrocarbons of STGL crude oil; Snh, non-hydrocarbons of STGL crude oil; Sas, asphaltenes of STGL crude oil; data of source rocks under maturity stage are from [41]).
Comparative mass chromatograms of saturated (m/z 191 and 217) and aromatic fractions (m/z 231 and 133/134) from representative source rocks and crude oil reveal that STGL crude oil contains significant quantities of aryl isoprenoids (AIs), as shown in Figure 2e. This unique biomarker is predominantly associated with Lower Cambrian source rocks, signifying a hydrocarbon contribution from these strata. Additionally, the absence of 4-methylsterane (4-MS) and the abundance of C28 triaromatic sterones, coupled with a dominant presence of C23 tricyclic terpenoids (C23TT) in the terpenoid spectrum, exhibit a close resemblance to Lower Cambrian calcareous shale and distinct divergence from Lower Cambrian siliceous shale (as illustrated in Figure 2). This specificity suggests a refined focus on Lower Cambrian calcareous shale as the primary source of STGL crude oil, rather than a broad attribution to Lower Cambrian source rocks as previously posited by scholars [37].
5.3. Insights into Deep to Ultra-Deep Petroleum Exploration in the Tarim Basin
The elucidation of oil sources remains a paramount challenge in the exploration of marine deep to ultra-deep petroleum within the Lower Paleozoic strata of the Tarim Basin. This study establishes, via compound-specific C/H isotopic analysis and distinctive biomarker profiles, that STGL crude oil originates from the Lower Cambrian calcareous shale. Considering the absence of significant secondary alterations (biodegradation, thermal alteration, and TSR) in STGL crude oil, it is posited as a potential end-member oil for this source rock. This revelation paves the way for the development of a new quantitative unmixing method tailored for the complexly mixed oils from the Tazhong and Tabei Uplifts.
STGL crude oil, along with oils from the Tazhong and Tabei Uplifts, exhibits remarkably similar biomarker distributions, notably characterized by abundant C28 triaromatic sterones (C28 TAS), C23 tricyclic terpenoids (C23TT), and aryl isoprenoids (AIs), but scant 4-methylsteranes (4-MS) and gammacerane. These biomarkers were previously interpreted as indicative of mixed oils from Middle–Upper Ordovician and Lower Cambrian sources, a conclusion drawn in the absence of sufficient quantitydeep exploration wells and core samples. The presence of these biomarker assemblages (such as AIs, 4-MS, C28 TAS, etc.) in the Lower Cambrian calcareous shale suggests that the oils from the Tazhong and Tabei Uplifts may originate from a singular lithofacial source rock (Figure 2), challenging the previous notion of them being mixed oils. Future research directions could include conducting compound-specific C/H isotopic analyses to substantiate the oil–source correlation further. Moreover, integrating logging and seismic data with comprehensive exploration of wells and outcrop samples will elucidate and define the Lower Cambrian calcareous shale more clearly, thereby providing a theoretical foundation for refined deep to ultra-deep petroleum exploration strategies in the Tarim Basin.
6. Conclusions
This study marks the inaugural observation of an approximately horizontal distribution of compound-specific δ13C and δ2H values of n-alkanes in ultra-deep hydrocarbon fluids from the STGL area of the Tarim Basin with respect to the increment in carbon numbers. Through the integration of conventional and distinctive biomarkers, it is unequivocally established that STGL crude oils have not undergone notable secondary alterations (biodegradation, thermal alteration, and TSR). Furthermore, these oils are substantiated to originate from Lower Cambrian calcareous shale, signifying their status as potential end-member oils for this lithofacial source rock. Additionally, STGL crude oils exhibit a remarkable similarity in biomarker profiles, notably abundant C28 triaromatic sterones, C23 tricyclic terpenoids (C23TT), and aryl isoprenoids (AIs), alongside scant occurrences of 4-methylsteranes (4-MS) and gammacerane, with oils previously categorized as mixed from the Tazhong and Tabei Uplifts within the Tarim Basin. This similarity suggests that these so-called mixed oils may actually originate from a singular lithofacial source rock, specifically Cambrian calcareous shale. Future investigations focusing on calcareous shale are imperative to advance the methodology for refined deep to ultra-deep petroleum exploration within the Tarim Basin and analogous basins globally.
Author Contributions
Conceptualization and writing the original draft, J.X. and T.H.; Funding acquisition, T.H. and Z.W.; Data curation, Methodology and Visualization, Q.Z. and Y.Z. All authors have read and agreed to the published version of the manuscript.
Funding
Financial supports provided by the open fund of SINOPEC Key Laboratory of Petroleum Accumulation Mechanisms (NO. 33550007-22-ZC0613-0040), Sinopec Technology Research and Development Project (NO. KLP23016), Open Fund of Key Laboratory of Exploration Technologies for Oil and Gas Resources (Yangtze University), Ministry of Education (NO. K202307), and the National Natural Science Foundation of China (NO. 42272160 and NO. 41872118).
Institutional Review Board Statement
Not applicable.
Informed Consent Statement
Not applicable.
Data Availability Statement
Detailed information describing the experimental data is in the main text.
Acknowledgments
The authors would like to express their gratitude to Qianru Wang from China University of Geosciences (Wuhan) for her discussion of petroleum geological background of the study area. We also acknowledge the precious advice of the editors and reviewers.
Conflicts of Interest
The authors declare no conflicts of interest.
References
- Liu, J.; Geng, A.; Xiong, Y. The application of stable carbon and hydrogen isotopic compositions of individual n-alkanes to Paleozoic oil/source rock correlation enigmas in the Huanghua depression, China. J. Petrol. Sci. Eng. 2006, 54, 70–78. [Google Scholar] [CrossRef]
- Li, W.; Li, J.; Lu, S.; Chen, G.; Pang, X.; Zhang, P.; He, T. Evaluation of gas-in-place content and gas-adsorbed ratio using carbon isotope fractionation model: A case study from Longmaxi shales in Sichuan Basin, China. Int. J. Coal Geol. 2022, 249, 103881. [Google Scholar] [CrossRef]
- Li, W.; Lu, S.; Li, J.; Zhao, S.; Zhang, P.; Li, X.; Wang, J. Research progress on isotopic fractionation in the process of shale gas/coalbed methane migration. Petrol. Explor. Dev. 2022, 49, 1069–1084. [Google Scholar] [CrossRef]
- Murillo, W.A.; Horsfield, B.; Vieth-Hillebrand, A. Unraveling petroleum mixtures from the South Viking Graben, North Sea: A study based on d13Cof individual hydrocarbons and molecular data. Org. Geochem. 2019, 137, 103900. [Google Scholar] [CrossRef]
- Hu, T.; Pang, X.; Jiang, F.; Zhang, C.; Wu, G.; Hu, M.; Jiang, L.; Wang, Q.; Xu, T.; Hu, Y.; et al. Dynamic continuous hydrocarbon accumulation (DCHA): Existing theories and a new unified accumulation model. Earth-Sci. Rev. 2022, 232, 104109. [Google Scholar] [CrossRef]
- Jia, W.; Chen, S.; Zhu, X.; Peng, P.; Xiao, Z. D/H ratio analysis of pyrolysis-released n-alkanes from asphaltenes for correlating oils from different sources. J. Anal. Appl. Pyrol. 2017, 126, 99–104. [Google Scholar] [CrossRef]
- Jia, W.; Wang, Q.; Peng, P.; Xiao, Z.; Li, B. Isotopic compositions and biomarkers in crude oils from the Tarim Basin: Oil maturity and oil mixing. Org. Geochem. 2013, 57, 95–106. [Google Scholar] [CrossRef]
- He, T.; Li, W.; Lu, S.; Yang, E.; Jing, T.; Ying, J.; Zhu, P.; Wang, X.; Pan, W.; Zhang, B.; et al. Quantitatively unmixing method for complex mixed oil based on its fractions carbon isotopes: A case from the Tarim Basin, NW China. Petrol. Sci. 2023, 20, 102–113. [Google Scholar] [CrossRef]
- He, T.; Li, W.; Lu, S.; Yang, E.; Jing, T.; Ying, J.; Zhu, P.; Wang, X.; Pan, W.; Chen, Z. Distribution and isotopic signature of 2-alkyl-1,3,4-trimethylbenzenes in the Lower Paleozoic source rocks and oils of Tarim Basin: Implications for the oil-source correlation. Petrol. Sci. 2022, 19, 2572–2582. [Google Scholar] [CrossRef]
- Schimmelmann, A.; Sessions, A.L.; Boreham, C.; Edwards, D.; Logan, G.A.; Summons, R.E. D/H ratios in terrestrially sourced petroleum systems. Org. Geochem. 2004, 35, 1169–1195. [Google Scholar] [CrossRef]
- Pedentchouk, N.; Freeman, K.; Harris, N. Different response of delta D values of n-alkanes, isoprenoids, and kerogen during thermal maturation. Geochim. Cosmochim. Acta 2006, 70, 2063–2072. [Google Scholar] [CrossRef]
- Li, C.; Sessions, A.L.; Kinnaman, F.S.; Valentine, D.L. Hydrogen-isotopic variability in lipids from Santa Barbara Basin sediments. Geochim. Cosmochim. Acta 2009, 73, 4803–4823. [Google Scholar] [CrossRef]
- Yang, H.; Liu, W.G.; Leng, Q.; Hren, M.T.; Pagani, M. Variation in n-alkane dD values from terrestrial plants at high latitude: Implications for paleoclimate reconstruction. Org. Geochem. 2011, 42, 283–288. [Google Scholar] [CrossRef]
- Murillo, W.A.; Horsfield, B.; Garcin, Y.; Vieth, A.; Sachse, D. Compound-specific δ2H and δ13C values of n-alkanes as a tool to unravel complex petroleum mixtures in the South Viking Graben, Norway. Org. Geochem. 2021, 152, 104167. [Google Scholar] [CrossRef]
- Tang, Y.; Huang, Y.; Ellis, G.S.; Wang, Y.; Kralert, P.G.; Gillaizeau, B.; Ma, Q.; Hwang, R. A kinetic model for thermally induced hydrogen and carbon isotope fractionation of individual n-alkanes in crude oil. Geochim. Cosmochim. Acta 2005, 69, 4505–4520. [Google Scholar] [CrossRef]
- Sachse, D.; Billault, I.; Bowen, G.J.; Chikaraishi, Y.; Dawson, T.E.; Feakins, S.J.; Kahmen, A. Molecular Paleohydrology: Interpreting the Hydrogen-Isotopic Composition of Lipid Biomarkers from Photosynthesizing Organisms. Annu. Rev. Earth Planet. Sci. 2012, 40, 221–249. [Google Scholar] [CrossRef]
- Huang, H.; Zhang, S.; Su, J. Palaeozoic oil–source correlation in the Tarim Basin, NW China: A review. Org. Geochem. 2016, 94, 32–46. [Google Scholar] [CrossRef]
- Zhu, G.; Milkov, A.V.; Li, J.; Xue, N.; Chen, Y.; Hu, J.; Li, T.; Zhang, Z.; Chen, Z. Deepest oil in Asia: Characteristics of petroleum system in the Tarim basin, China. J. Petrol. Sci. Eng. 2021, 199, 108246. [Google Scholar] [CrossRef]
- Wang, Q.; Hao, F.; Cao, Z.; Tian, J. Heteroatom compounds in oils from the Shuntuoguole low uplift, Tarim Basin characterized by (+ESI) FT-ICR MS: Implications for ultra-deep petroleum charges and alteration. Mar. Petrol. Geol. 2021, 134, 105321. [Google Scholar] [CrossRef]
- Deng, S.; Zhao, R.; Kong, Q.; Li, Y.; Li, B. Two distinct strike-slip fault networks in the Shunbei area and its surroundings, Tarim Basin: Hydrocarbon accumulation, distribution, and controlling factors. AAPG Bull. 2022, 106, 77–102. [Google Scholar] [CrossRef]
- Jiao, F. Significance of oil and gas exploration in NE strike-slip fault belts in Shuntuoguole area of Tarim Basin. Oil Gas Geol. 2017, 38, 831–839. [Google Scholar]
- Bian, Q.; Deng, S.; Lin, H.; Han, J. Strike-slip salt tectonics in the Shuntuoguole Low Uplift, Tarim Basin, and the significance to petroleum exploration. Mar. Petrol. Geol. 2022, 139, 105600. [Google Scholar] [CrossRef]
- He, T.; Lu, S.; Li, W.; Tan, Z.; Zhang, X. Effect of Salinity on Source Rock Formation and Its Control on the Oil Content in Shales in the Hetaoyuan Formation from the Biyang Depression, Nanxiang Basin, Central China. Energy Fuels 2018, 32, 6698–6707. [Google Scholar] [CrossRef]
- He, T.; Lu, S.; Li, W.; Sun, D.; Pan, W.; Zhang, B.; Tan, Z.; Ying, J. Paleoweathering, hydrothermal activity and organic matter enrichment during the formation of earliest Cambrian black strata in the northwest Tarim Basin, China. J. Petrol. Sci. Eng. 2020, 189, 106987. [Google Scholar] [CrossRef]
- He, T.; Lu, S.; Li, W.; Wang, W.; Sun, D.; Pan, W.; Zhang, B. Geochemical characteristics and effectiveness of thick, black shales in southwestern depression, Tarim Basin. J. Petrol. Sci. Eng. 2020, 185, 106607. [Google Scholar] [CrossRef]
- He, T.; Li, W.; Lu, S.; Pan, W.; Ying, J.; Zhu, P.; Yang, E.; Wang, X.; Zhang, B.; Sun, D. Mechanism and geological significance of anomalous negative δ13Ckerogen in the Lower Cambrian, NW Tarim Basin, China. J. Petrol. Sci. Eng. 2022, 208, 109384. [Google Scholar] [CrossRef]
- Peters, K.; Walters, C.; Moldowan, J. The Biomarker Guide: Biomarkers and Isotopes in Petroleum Exploration and Earth History; Cambridge University Press: Cambridge, UK, 2005. [Google Scholar]
- Lu, H.; Shen, C.; Zhang, Z.; Liu, M.; Sheng, G.; Peng, P.; Hsu, C.S. 2,3,6-/2,3,4-aryl isoprenoids in Paleocene crude oils from Chinese Jianghan Basin: Constrained by water column stratification. Energy Fuels 2015, 29, 4690–4700. [Google Scholar] [CrossRef]
- Sun, Y.; Xu, S.; Lu, H.; Cuai, P. Source facies of the Paleozoic petroleum systems in the Tabei uplift, Tarim Basin, NW China: Implications from aryl isoprenoids in crude oils. Org. Geochem. 2003, 34, 629–634. [Google Scholar] [CrossRef]
- Summons, R.E.; Powell, T.G. Identification of aryl isoprenoids in source rocks and crude oils: Biological markers for the green sulphur bacteria. Geochim. Cosmochim. Acta 1987, 51, 557–566. [Google Scholar] [CrossRef]
- Requejo, A.G.; Allan, J.; Creaney, S.; Gray, N.R.; Cole, K.S. Aryl isoprenoids and diaromatic carotenoids in Paleozoic source rocks and oils from the Western Canada and Williston Basins. Org. Geochem. 1992, 19, 245–264. [Google Scholar] [CrossRef]
- Sun, Y.; Chen, Z.; Xu, S.; Cai, P. Stable carbon and hydrogen isotopic fractionation of individual n-alkanes accompanying biodegradation: Evidence from a group of progressively biodegraded oils. Org. Geochem. 2005, 36, 225–238. [Google Scholar] [CrossRef]
- Asif, M.; Grice, K.; Fazeelat, T. Assessment of petroleum biodegradation using stable hydrogen isotopes of individual saturated hydrocarbon and polycyclic aromatic hydrocarbon distributions in oils from the Upper Indus Basin, Pakistan. Org. Geochem. 2009, 40, 301–311. [Google Scholar] [CrossRef]
- Cai, C.; Zhang, C.; He, H.; Tang, Y. Carbon isotope fractionation during methane-dominated TSR in East Sichuan Basin gasfields, China: A review. Mar. Petrol. Geol. 2013, 48, 100–110. [Google Scholar] [CrossRef]
- Cai, C.; Amrani, A.; Worden, R.H.; Xiao, Q.; Wang, T.; Gvirtzman, Z.; Li, H.; Said-Ahmad, W.; Jia, L. Sulfur isotopic compositions of individual organosulfur compounds and their genetic links in the Lower Paleozoic petroleum pools of the Tarim Basin, NW China. Geochim. Cosmochim. Acta 2016, 182, 88–108. [Google Scholar] [CrossRef]
- Cai, C.; Xiao, Q.; Fang, C.; Wang, T.; He, W.; Li, H. The effect of thermochemical sulfate reduction on formation and isomerization of thiadiamondoids and diamondoids in the Lower Paleozoic petroleum pools of the Tarim Basin, NW China. Org. Geochem. 2016, 101, 49–62. [Google Scholar] [CrossRef]
- Cai, C.; Zhang, C.; Worden, R.H.; Wang, T.; Li, H.; Jiang, L.; Huang, S.; Zhang, B. Application of sulfur and carbon isotopes to oil–source rock correlation: A case study from the Tazhong area, Tarim Basin, China. Org. Geochem. 2015, 83–84, 140–152. [Google Scholar] [CrossRef]
- Ma, A.L.; Jin, Z.J.; Zhu, C.S.; Gu, Y. Detection and significance of higher thiadiamondoids and diamondoidthiols in oil from the Zhongshen 1C well of the Tarim Basin, NW China. Sci. China Earth Sci. 2018, 61, 1440–1450. [Google Scholar] [CrossRef]
- Zhu, G.Y.; Zhang, Y.; Zhang, Z.Y.; Li, T.T.; He, N.N.; Grice, K.; Neng, Y.; Greenwood, P. High abundance of alkylated diamondoids, thiadiamondoids and thioaromatics in recently discovered sulfur-rich LS2 condensate in the Tarim Basin. Org. Geochem. 2018, 123, 136–143. [Google Scholar] [CrossRef]
- Yang, L.; Xing, J.; Xue, W.; Zheng, L.; Wang, R.; Xiao, D. Characteristics and Key Controlling Factors of the Interbedded-TypeShale-Oil Sweet Spots of Qingshankou Formation in Changling Depression. Energies 2023, 16, 6213. [Google Scholar] [CrossRef]
- Zhu, X. Carbon and Hydrogen Isotopic Characteristics of n-Alkanes in the Cambrian-Ordovician Source Rocks and Deep Oils from the Tarim Basin; University of Chinese Academy of Sciences: Beijing, China, 2019; pp. 1–114. [Google Scholar]
- Chen, S. Pyrolytical Methods for Determining the Structure and Hydrogen Isotopic Composition of Macromolecules and Their Applications in Studying the Genesis of Petroleum from the Tarim Basin; University of Chinese Academy of Sciences: Beijing, China, 2017; pp. 1–138. [Google Scholar]
- Zhou, C. Study on Oil Source, Maturity and Charge Episodes of Marine Crude Oil in Cratonic Region of Tarim Basin; University of Chinese Academy of Sciences: Beijing, China, 2021; pp. 1–207. [Google Scholar]

Disclaimer/Publisher’s Note: The statements, opinions and data contained in all publications are solely those of the individual author(s) and contributor(s) and not of MDPI and/or the editor(s). MDPI and/or the editor(s) disclaim responsibility for any injury to people or property resulting from any ideas, methods, instructions or products referred to in the content. |
© 2024 by the authors. Licensee MDPI, Basel, Switzerland. This article is an open access article distributed under the terms and conditions of the Creative Commons Attribution (CC BY) license (https://creativecommons.org/licenses/by/4.0/).