Article

Operation, Maintenance, and Decommissioning Cost in Life-Cycle Cost Analysis of Floating Wind Turbines

by
Nurullah Yildiz
,
Hassan Hemida
and
Charalampos Baniotopoulos
*
School of Engineering, Civil Engineering Department, University of Birmingham, Edgbaston, Birmingham B15 2TT, UK
*
Author to whom correspondence should be addressed.
Energies 2024, 17(6), 1332; https://doi.org/10.3390/en17061332
Submission received: 28 January 2024 / Revised: 2 March 2024 / Accepted: 8 March 2024 / Published: 10 March 2024
(This article belongs to the Section A3: Wind, Wave and Tidal Energy)

Abstract

:
Offshore wind farms are great options for addressing the world’s energy and climate change challenges, as well as meeting rising energy demand while taking environmental and economic impacts into account. Floating wind turbines, in specific, depict the next horizon in the sustainable renewable energy industry. In this study, a life-cycle cost analysis for floating offshore wind turbines is developed by combining the most recent data and parametric formulas from databases and relevant papers. The cost analysis models focused on cost minimization with special emphasis on Operation and Maintenance Cost (OPEX), Decommissioning Cost (DECOM), and Levelized Cost of Energy (LCOE), which are important factors in wind power economy. Given that floating wind energy is still developing, the presented scenarios should be beneficial in making future decisions. The cost analysis scenarios include on-site and off-site maintenance scenarios for OPEX. In addition, four alternative scenarios for DECOM have been examined: mechanical recycling, mechanical-incineration, incineration processes, and landfill. According to the findings of these scenarios, OPEX varies from 16.89 to 19.93 £/MWh and DECOM between 3.47 and 3.65 £/MWh, whilst the total LCOE varied from 50.67 to 66.73 £/MWh.

1. Introduction

The electricity-generating industry is considered to be one of the primary producers of greenhouse gas emissions, accounting for 25% of total global emissions [1,2]. To address this problem, countries should focus on renewable energy sources [3]. Today, wind power is a rapidly expanding renewable energy resource, most notably in the United Kingdom, Germany, the United States of America (USA), and China [4]. Its capacity has increased significantly in recent decades, reaching 622 GW in 2019 and anticipated to rise to 903 GW by 2023, with a 12% annual growth rate [5]. Offshore and floating wind energy are deemed to have a high development potential and are likely to become one of the primary renewable energy sources [6,7,8,9].
Fixed foundations are the dominant type of offshore wind farms, installed in shallow water. However, research and development (R&D) works have risen dramatically in the last several years, with various models being developed for deep water operations. When wind turbines are installed in deep water, the supporting structures are of the floating type. Different floating platforms have been proposed, with the Semi-Submersible, Tension Leg Platform, Barge-Type, and Spar Buoy being the four most common forms [10,11,12,13]. Given the rapid advancement of floating wind turbine technology, research into economic feasibility and investment profitability is presently a high priority. Hence, life-cycle cost factors are becoming more important for operators, developers, and investors when evaluating floating wind turbine platforms [6].
A life-cycle cost analysis (LCC) is a cost analysis technique that was initially presented by the United States Department of Defense (DoD) in the 1970s. When it was first introduced, it was widely used in a broad range of industries involving construction, energy, manufacturing, and healthcare [14]. LCC analysis is a method of assessing a system or project’s long-term economic viability. The potential of LCC analysis tools to identify, analyse, assess, and minimise the total cost of important activities makes it a useful tool in the conceptual phase of any project. Using the findings of an LCC analysis, managers may gain more detailed information about the financial life of assets while also assisting other stakeholders in making appropriate investment choices [15].
When conducting a Life Cycle Cost (LCC) assessment of offshore and floating wind farms, it is imperative to consider the key elements of wind power economics. Specifically, these entail the Capital Cost (CAPEX), Operation and Maintenance Cost (OPEX), and Decommissioning Cost (DECOM) [16]. CAPEX represents the largest portion of the LCC for wind power plants, encompassing all investment expenditures incurred before the start-up date. OPEX includes all expenses accrued after the commencement of commercial operations but before decommissioning, necessary for maintaining the project’s operation and ensuring turbine efficiency [17,18]. CAPEX may constitute up to 80% of the overall cost of a wind power project over its lifetime and includes expenses related to turbines, substructures (platforms, mooring systems, and anchoring), and transmission systems (onshore and offshore substations, and cables) [17]. DECOM covers all the costs associated with cleaning up the land. Usually, following the deconstruction of offshore infrastructure, some elements, such as the steel of floating platforms or the aluminium, copper materials of electrical lines, may be sold for scrap, generating some income. Consequently, this operation generates a profit that could be deducted from the expenses [19]. Furthermore, DECOM handles the expenses of the end stage of a wind farm’s life cycle, which amounts to approximately 1–3% of the total cost [20].

Literature Review of Life Cycle Cost Analysis for Offshore and Floating Wind Energy

As a consequence of the increased investment in new wind power projects over the past ten years, life cycle cost analysis modelling, and analysis of wind power systems have gained a great deal of interest. Madariaga et al. [21] indicated that developing a realistic and accurate technique for LCC analysis of large offshore wind farms that takes into consideration all relevant features of the associated project is an extremely difficult challenge. Mekhilef et al. [22] carried out an investigation to assess offshore wind farms in Malaysia. According to their reports, the locations bordering the South China Sea are financially efficient, with energy prices estimated based on a 2 MW of wind turbine assessment. Ibrahim and Albani [23] performed another investigation to assess the potential of wind energy in Kudat. They noted that with a payback time of fewer than 10 years, wind energy-generating capacity is 10 to 11% on average and found that the most favourable prices for wind projects with committed capital were in the range of MYR (Malaysian ringgit) 0.46 to 0.80 per kWh.
Nian et al. [24] indicated that cost reduction and performance improvement may help lower the LCOE of offshore wind generation. More crucially, their research showed that even under the worst-case climate scenarios, offshore wind can compete with solar PV on LCOE. Mytilinous and Kolios [25] concentrated on life cycle cost parameters that are directly related to the physical elements of each site, where three alternative offshore wind farm layouts and four kinds of wind turbines are taken into account. These have total costs ranging between £1.6 million and £1.8 billion.
In cost-cutting investigations [26,27,28], LCOE is used to calculate future costs based on technological learning curves or projections. These may be constrained by the small cumulative capacity of offshore wind farms against which to forecast cost reductions, as well as the limited number of site options, which specify the distance to transmission network and sea depth. While various wind turbine’s component costs may decrease in price with time, real project costs may rise as projects advance into deeper waters and further from shore. Moreover, while evaluations from international organisations [9,29] provide a worldwide view of cost comparisons, most studies do not explicitly address the cost of financing, which has a considerable influence on LCOE due to the capital-intensive nature of the wind energy sector. This is reported by Ebenhoch et al. [30], who found that a tiny percentage change in the weighted average cost of capital (WACC) had the greatest influence on the overall cost of a project, behind only generating capacity. Rinne et al. [31] indicated that when operational lifespan was expected to be 20 years and simulated expenses were less than 50 €/MWh, a change in interest rate produced the second-biggest loss in wind energy potential.
Some studies expressly address geographical factors. Cavazzi and Dutton [32], and Hdidouan and Staffel [33] undertook spatially detailed studies of the United Kingdom’s LCOE of wind energy. Cavazzi and Dutton [32] evaluated the economics of the UK’s offshore energy potential, while Hdidouan and Staffel [33] investigated the impact of weather and climatic variability on LCOE. The foundation and transmission expenditures of wind farms are determined by distance and depth-based functions in both studies.
Kaiser and Snyder [34] considered all elements of offshore wind facility installation and decommissioning and then established a methodological approach to quantify the associated costs. Nilsson and Bertling [35], and Judge et al. [36] also evaluated the LCC of wind farms, although, these studies primarily concentrate on analysing the expenditures during the operation and maintenance (O&M) stage.
With regard to floating wind turbine cost analysis, there has recently been considerable interest in the LCC analysis of floating wind turbines. Laura and Vicente [19] developed a thorough framework for cost analysis of floating wind turbines. They suggested a cost breakdown structure (CBS) to highlight the cost elements involved in the six stages of development of floating wind turbine technologies being conceptualization, development, manufacture, installation, usage, and disposal. Myhr et al. [37] developed an analytical model to analyse the levelized cost of energy of five different floating wind turbine platforms, including the Spar-Buoy, Tension-Leg-Spar, Semi-Submersible, Tension-Leg, and Tension-Leg-Buoy platforms. Moreover, they highlighted that floating turbine for rising depths may have a lower levelized cost of energy (LCOE) than bottom-fixed turbines. Baita-Saavedra et al. [38] concentrated on the economics of an offshore concrete floating wind platform, a 10 MW wind turbine in Europe’s Atlantic Arc. As a consequence, their results indicated that the Canary Islands in Spain and Flores in Portugal are the most effective areas in a financial sense at which to erect a floating offshore wind farm constructed of concrete platforms in Europe’s South Atlantic region. It is possible that these locations will contribute future advancements in the offshore wind sector. Maienza et al. [39] investigated the economics of Semi-Submersible, Spar-Buoy, and Tension Leg platforms in Southern Italy, taking into account their CAPEX, OPEX, and DECOM costs. Their research revealed that semi-submersible platforms are more cost-effective than other types of floating wind platforms, according to their observations.
In the light of the literature review, Laura and Vicente [19], Myhr et al. [37] and Maienza et al. [39] investigated the levelized cost of energy (LCOE) for various floating turbine platforms including Spar-Buoy, Tension-Leg-Spar, Semi-Submersible, Tension-Leg, and Tension-Leg-Buoy designs. Baita-Saavedra et al. [38] focused specifically on the LCOE of concrete Spar-Buoy platforms in certain European regions. Notably, the LCOE analysis of barge-type floating wind turbine models, another significant design, was not addressed in these studies. The present study considers the cost analysis of a barge-type floating wind turbine, evaluating the costs of various operating and maintenance scenarios as well as end-of-life scenarios. The aim of this study is to propose a method for the minimization of the levelized cost of energy for operation, maintenance, and decommissioning for barge-type floating wind turbines.

2. Methods

The cost analysis approach is structured around a breakdown of Life Cycle Cost (LCC) and utilizes the Levelized Cost of Energy (LCOE) methodology. LCC analysis encompasses three main components: Capital Expenditure (CAPEX), Operational Expenditure (OPEX), and Decommissioning Costs (DECOM) [40]. These components are further divided into five categories to represent the entirety of a floating wind project, spanning conceptualization to decommissioning [41]. Figure 1 illustrates the various stages of LCC, including predevelopment and consenting, production and acquisition, installation and commissioning, operation and maintenance, and decommissioning and disposal, while Table 1 summarizes the equations for those that. Equation (1) provides a standardized definition for the floating wind turbine’s life cycle costs or economic viability cost ( E C v ):
E C v = ( C C A P E X + C O P E X + C D E C O M )
C v = The total cost over a lifetime.
The major characteristics of wind power economics are considered while calculating the LCC of offshore and floating wind farms. These are the Capital Cost (CAPEX), Operation and Maintenance Cost (OPEX), and Decommissioning Cost (DECOM) [18,39]. Wind farm capital expenditures (CAPEX) are the major contributor to the life cycle cost of wind farms and are defined as the initial investment costs incurred during the development and construction stages of a wind farm [16]. OPEX includes all expenses made after the start of commercial operations but before the end of the project’s operational life, such as maintenance activities, which are required to keep the project running and its turbines operating at optimal efficiency [16]. DECOM is comprised of the costs associated with decommissioning and site clearing. Following the decommissioning stage, the site must be cleaned up in accordance with established rules. As a result, site clearing entails the removal of all assets associated with the offshore and floating wind farms from the construction site [39].

2.1. CAPEX

Predevelopment and consenting (P&C), production and acquisition (P&A), and installation and commissioning (I&C) are the three main phases of CAPEX [2]. In this section, details of each phase are given.

2.1.1. Predevelopment and Consenting

The cost of predevelopment and consenting ( C P & C ) phase of a wind farm project is its initial stage cost. This stage begins with a concept and ends with the start of the project’s implementation. In addition, five subcategories are included: cost of project management (CprojM), cost of legal authorization (Clegal), cost of surveys (Csurveys), cost of engineering activities (Ceng), and cost of contingency planning (Ccontingency) [15].
C P & C = C p r o j M + C l e g a l + C s u r v e y s + C e n g + C c o n t i n g e n c y
  • Project management: All administrative services, prefeasibility studies, funding, tenders, internal control systems, and agreements with subcontractors are included in the project management activities. It is common to express the overall cost of project management during CAPEX. Project management costs approximately 3% of the CAPEX, according to a study by Shafiee et al. [15].
    C p r o j M = 0.03 × C A P E X
  • Legal authorization: The government or a regulatory authority must approve the establishment of a wind farm. The legal authorisation procedure is included in certain research as an element of project management. The cost of legal authorisation is expected to be around 0.13% of the CAPEX [15]. Thus,
    C l e g a l = 0.0013 × C A P E X
  • Surveys: In evaluating the viability of offshore wind projects, several site-specific surveys should be performed. The sort of survey completed normally changes depending to the amount of information requested. Environmental ( C s u r v E N ), coastal process ( C s u r v C P ), seabed ( C s u r v S B ), and metocean conditions ( C s u r v M O ) surveys are now applied for offshore and floating wind farm projects [15]. The cost of surveying is determined by the following formulation:
    C s u r v e y s   = C s u r v E N + C s u r v C P + C s u r v S B + C s u r v M O
  • Engineering: Once a project is accepted and the final investment decision has been made, a multidisciplinary and experienced team is formed to design the offshore and floating wind farms. Many of the operations that are conducted throughout this phase encompass the aspects of structural design and selection of substructure, design of wind farm planning, and design of electrical system and grid connection [15,42]. Thus, the cost of engineering is given by the following formulation:
    C e n g = C b a s e + C e n g v e r i f + C e n g u n i t × I C
    where C b a s e , C e n g v e r i f , C e n g u n i t , and I C present the sum of a fixed base cost, design verification process, the cost of a unit term, and the installation capacity [19].
  • Contingencies: The contingency cost compensates for uncertain annual costs and provides for the replacement of the most expensive components prone to catastrophic failure. It is projected to constitute 10% of CAPEX costs [2].
      C c o n t i n g e n c y = 0.1 × C A P E X

2.1.2. Production and Acquisition

Production and acquisition (P&A) are the second phase and contributes the highest share of lifecycle costs. This cost encompasses all costs related to the acquisition of wind turbines (CWT), the support structure or foundation (CSS), the power transmission system (CPTS), and the monitoring system (Cmonitoring) [2]. Thus,
C P & A = C W T + C S S + C P T S + C m o n i t o r i n g
  • Wind Turbines: The cost of wind turbine procurements is stated as a function of the total number of wind turbines (NWT) erected in the farm and can be obtained by the following equation:
C W T = ( C W T m a t + C W T t r a n s ) × N W T
In Equation (9), C W T m a t depicts the material costs for a wind turbine, including all of its component subsystems, and C W T t r a n s accounts for the transportation expenses incurred during the transfer of the wind turbine from the manufacturing place to the installation site [15]. The material costs of wind turbines are contingent upon the nominal power rating (PR). Shafiee et al. [15] utilised a logarithmic regression model applied to a comprehensive database containing the cost of various turbines to estimate the material cost (£) using Equation (10).
C W T m a t = 3,000,000 × I n P R 662,400  
  • Support structures: The cost of a support structure is split into two parts: the material cost ( C S S m a t ) and the transportation and assembly costs ( C S S t r a n s ). Thus,
C S S = ( C S S m a t + C S S t r a n s ) × N W T
The cost of support structures is mostly dependent on the type of platform (Semi-Submersible, Tension Leg, Spar Buoy, etc.) and the mooring and anchoring systems for floating wind turbines [39,41].
  • Power transmission system: The electricity transmission system is made up of many cables that link wind turbines to the grid as well as onshore/offshore substations ( C o n s u b s / C o f s u b s ) [15]. As a result, the cost of the power transmission system is provided by
C P T S = C c a b l e s + C o f s u b s + C o n s u b s
  • Monitoring system: To record condition data, a vast number of sensors and control devices are installed across offshore wind farms (sea-state, deterioration data, etc.). The information gathered is often sent to a supervisory control and data acquisition (SCADA) system and saved in databases. These condition data can be used by system analysts to arrange maintenance and inspection activities. The cost of offshore and floating wind farms’ SCADA and condition monitoring systems ( C C M S ) is determined by the number of wind turbines deployed [43]. Hence,
C m o n i t o r i n g = ( C S C A D A + C C M S ) ×   N W T

2.1.3. Installation and Commissioning

This consists of the expenses connected to the activities of construction and installation of offshore wind turbines, support structures, and electrical systems (CI&C-comp), port charges (Cport), commissioning cost (Ccomm), and insurance cost (CI&C-ins). Hence,
C I & C = C I & C c o m p + C p o r t + C c o m m + C I & C i n s
  • Port cost: The port is critical to the management of the supply chain for offshore and floating wind projects. Yearly fees must be paid to local governments for the use of port facilities, quayside docking, and crane usage authorization [44]. Furthermore, the annual fee to wind farm labourers who conduct project tasks (for example, pre-assembling the components) must be considered.
C p o r t = C p o r t u s e + C p o r t l a b o u r
C p o r t l a b o u r   = N I d   ×   L r
  • N I d = Average labour-day
  • L r = Daily labour rate
  • Installation of the components: Some procedures must be carried out throughout the erection of offshore wind farm projects. The expenditure of any such installation is split into four categories based on the kind of components installed: foundation, wind turbine, and offshore and onshore electrical systems [15,34]. The costs associated with hiring chartered ships and technicians are included in all of the aforementioned cost categories. Hence,
C I & C c o m p = C I & C f o u n d a t i o n + C I & C w i n d t u r b i n e + C I & C o f s u b s + C I & C o n s u b s
  • Commissioning: In order to discover early faults and enhance dependability, offshore wind farms must undergo extensive testing before to being put into operation. This includes testing the wind turbines, electrical systems, SCADA, and CMSs. In most cases, the expenses involved with renting vessels and staff personnel make up the bulk of the cost of commissioning [45].
  • Insurance: Insurance is necessary at this stage to mitigate the effects of any unexpected occurrences. The insurance cost (CI&C-ins) is included in the capital cost. Insurance costs are calculated using the average worldwide cost for installation insurance of wind turbines, foundations, and electrical systems (including offshore and onshore electrical substations) [34,45,46].

2.2. OPEX

There are two aspects to the wind farm operation and maintenance (O&M) costs C O & M , namely operational expenditures (CO) and maintenance expenditures (CM) [15]. These are calculated by,
C O & M = C O + C M

2.2.1. Operational Expenditures

The rental/lease fees (Crent), the insurance cost (CO&M-ins), and the transmission charges (Ctransmission) associated with a wind farm are all included in the associated project’s operating costs (CO) [15].
C O = C r e n t + C O   &   M i n s + C t r a n s m i s s i o n
  • Rental (lease): The wind farm contractors must pay fees to the local government and residents in exchange for the use of the seabed. Depending on the country, the amount of these fees might vary, but they are often expressed as a percentage of the wind farm’s profits [2,15].
  • Insurance: It is necessary to contract operational insurance coverage in order to protect offshore wind facilities from design flaws, collision accidents, and substation outages. When it comes to insurance packages, the cost is determined by the size of the wind farm in question [15].
  • Transmission charges: A yearly fee must be paid to the authorities in control of the national electricity grid. Transmission costs are typically determined by the capacity of the wind farm [2,15].

2.2.2. Maintenance

Wind turbine maintenance aims to increase availability while reducing the expenses associated with unplanned breakdowns. There are two kinds of maintenance costs: direct (CM-direct) and indirect (CM-indirect) [39]. Thus,
C M = C M d i r e c t + C M i n d i r e c t
  • Direct maintenance cost: Direct maintenance expenses include the costs of transporting malfunctioning components, maintenance specialists who conduct repair/replacement procedures, and all consumables and spare parts necessary for wind farm maintenance. Corrective maintenance (CM) and proactive maintenance (PM) are the two primary types of the wind farm maintenance process (ProM) [47,48]. These are described as corrective maintenance, which occurs when a component fails, and proactive maintenance, which occurs before the component fails [48].
  • Indirect maintenance: The cost of actions required to maintain the direct effort involved in delivering repair services is known as indirect maintenance cost. Port costs for replacement parts storage and quayside amenities must be paid regardless of the number of maintenance jobs to be accomplished. Aside from this, different procedures (such as weather forecasts and repair work scheduling) should need to be carried out onshore to coordinate maintenance tasks [47,48]. Thus, the cost of indirect maintenance can be expressed by,
C M i n d i r e c t = C i n d p o r t + C i n d v e s s e l + C i n d l a b o u r
Cind-port, Cind-vessel, and Cind-labour are the port fees, vessel recruitment expenses, and maintenance labour costs, respectively.

2.3. DECOM

The final step in a wind project’s life cycle is decommissioning and disposal, which follows a protocol that is effectively the inverse of the installation and commissioning (I&C) phase. In addition to decommissioning, wind farm equipment is removed or repurposed depending on the waste management method used. In addition, some materials may be sold, which results in a decrease in overall expenses. Following decommissioning, the site must be cleaned up in accordance with established rules. As a result, site clearing entails the dismantling of all assets associated with the offshore wind farm from the construction site [6,19,39]. Hence, the cost of decommissioning and disposal ( C D & D ) of the wind turbine can be expressed by,
C D & D = C D e c o m + C W M + C S C + C p o s t M
C D e c o m , C W M ,   C S C and C p o s t M are the costs of decommissioning, waste management, site clearing, and post-monitoring, respectively.

2.3.1. Decommissioning

The decommissioning cost ( C D e c o m ) includes the expenditures of port preparation (CD&D-port) and removal activities (Cremov) [19]. Hence, the cost of decommissioning can be expressed by,
C D e c o m = C D & D p o r t + C r e m o v

2.3.2. Waste Management

Wind farm materials are disposed of according to the waste management (CWM) plan. There are four basic alternatives for disposing of waste: reuse, recycling, incineration with energy recovery, and landfilling [49]. Waste processing (CW-proc) and waste transport (CW-trans) expenses will be incurred regardless of the waste treatment method selected, since the materials must be first processed into smaller pieces and afterwards transported to predefined destinations. When the waste is transferred to a landfill (Clandfill), a predetermined charge must also be paid [6,19]. Hence, waste management cost is given by,
C W M = C W p r o c + C W t r a n s + C l a n d f i l l S V
S V : The decommissioned assets’ salvage (residual) value (£).
  • Waste processing: Wind turbine waste should be handled under strict quality controls after decommissioning. The cost of waste processing varies according to the complexity and size and weight of the components [2,39].
  • Waste transport: Following processing, waste materials undergo either landfill disposal or recycling. The transportation cost is calculated by multiplying the anticipated number of trucks required for waste transportation by the fixed fee for each truck [2,19].
  • Landfill: Materials that cannot be recycled are disposed of in landfills, with the disposal cost determined by multiplying the predetermined landfill fee per tonne by the total weight of non-recyclable materials disposed of [2,19,39].
  • Salvage value: The salvage value represents the anticipated value of a property at the end of its operational life. A considerable volume of the materials used in wind turbines, such as stainless steel and aluminium, can be recycled. The salvage value of materials recovered from a wind farm depends on the type, quantity (weight or volume), and quality (condition) of recyclable materials [2,39,50].

2.3.3. Site Clearing

After the wind farm has been decommissioned, the whole site should be removed in compliance with the authorised rules. Site clearance entails the elimination of all assets associated with the wind project [2,39].

2.3.4. Post Monitoring

Some offshore and floating wind components (for example, cables and anchors) may not be removed completely during the decommissioning process. As a result, a post-decommissioning monitoring and management strategy is necessary to detect and reduce the dangers caused by leftover materials on the seafloor. The cost of a post-decommissioning monitoring programme (CpostM) is influenced by various parameters, including the size, type, and condition of the remains [15,51].

3. Levelized Cost of Energy Calculation

The Levelized Cost of Energy (LCOE) is a value used to evaluate the costs of energy from various sources (e.g., wind, solar, natural gas). The LCOE is the proportion of the average cost at which the energy generated during the whole life of the wind project must be sold to perfectly meet all expenditures paid for a farm’s construct, administration, and dismantling. It is computed as the ratio of the levelized cost of the wind project (CAPEX, OPEX, and DECOM) to the Annual Energy Production (AEP), which correspond to the total electricity generation during the wind project’s lifespan [30]. It was assumed that the barge-type platform would operate for 3000 h per year.
L C O E = C A P E X + O P E X + D E C O M A E P

4. Case Study

The suggested entire life cost methodology is applied to a 2 MW barge-type floating wind turbine in this study, and the costs of various maintenance and end-of-life scenarios are examined. A barge-type floating wind tower consists of two sections: the lower section, which is 25 m long, and the upper section, which is 35 m long. The tower and the transition piece weigh a total of 133 tonnes (t) and 50 tonnes (t), respectively. The turbine in this instance is a Vestas 80 V 2 MW (40 m blade length). The floating foundation is a barge-type platform built of concrete and steel reinforcement that is 36 m wide, 9.5 m high, and 7.5 m draft with square-ring shape. The square-ring shape is known as a damping pool, and its dimensions are 20 × 20 m. Semi taut moorings are used. The floating platform is attached to the seabed by synthetic fibre-nylon ropes in this mooring technique. The rope’s major advantage is that it does not corrode [13].
The system’s mass distribution is shown in Table 2. It is demonstrated that the platform housing the mooring system exhibits the highest mass. The construction of the floating wind turbine platform primarily involves concrete and steel, while the mooring system is composed of steel, cast iron, polyurethane foam, and nylon fibres to ensure platform stability. The nacelle structure incorporates materials such as steel, aluminium, cast iron, glass fibre-reinforced plastic, and copper. Additionally, the rotor’s blades are constructed using a combination of glass fibre-reinforced plastic and cast iron [13,52,53]. Moreover, the study also considers the recycling rates of various materials within the wind turbine components. Specifically, steel and cast iron are assumed to have a recycling rate of 85%, while copper and aluminium are expected to be recycled at a rate of 90%. Polyurethane foam, utilized in certain parts, is assumed to have a recycling rate of 80%, and nylon fibre, another constituent material, is assumed to be entirely recyclable, with a recycling rate of 100% [13].
The purpose of this study is to examine the economic performance of various maintenance and end-of-life scenarios for the barge-type floating wind turbine. According to maintenance cost scenarios, there are two different ways of taking notice of these scenarios: on-site and off-site. Depending on the maintenance scenario, it is also planned to extend the life of the barge-type floating wind turbine to between 25 and 30 years through using strict maintenance strategies. In some of these scenarios, the replacement of parts like the turbine’s gearbox and blades is also taken into consideration. In the replacement of parts, in the field maintenance, the wind turbine is maintained and parts are replaced on-site where the wind turbine is working. In off-site replacement, the wind turbine is transported to the repair area on the shore with the help of tugboats, and after the parts replacement and maintenance performed there, it is taken back to the old working location. Each of the OPEX scenarios in Table 3 includes specifics on the types of maintenance areas, the number of prevention and unscheduled maintenance visits, the type of vehicle, and the replacement components. With regard to the decommissioning scenario, examining the decommissioning and recycling of wind turbines properly is another crucial component from an environmental and economic aspect [55,56]. A wind turbine will be taken out of service when it has reached its designated life expectancy (20–30 years), can no longer carry out its intended function owing to failure or material fatigue, or no longer satisfies the needs or expectations of the user [53,57]. To lessen their impact on the environment, materials from decommissioned wind turbines must be managed in accordance with the European Waste Framework Directive [49]. The Directive lists five fundamental principles for disposal: waste reduction, reuse (of components, etc.), recycling, incineration, and landfill. This study applied four different recycling scenarios in accordance with the disposal principle, and the useable materials recovered from the scenarios are turned into a financial benefit. In the most basic scenario, DECOM 1, all waste material is shipped to a landfill. In the case of glass fibre, it is first transported to the cutting process to be sliced into little pieces. Because turbine blades are large in size, they could be chopped to ease transit and minimise storage space. The DECOM 2 scenario is that glass fibre is employed in a mechanical recycling process as an end-of-life scenario. The leftover waste from the mechanical process is disposed of at a landfill. In the DECOM 3 scenario, after implementing cutting and mechanical procedures to treat the glass fibre, the waste from all these processes is burned. As a result of this scenario, ash is conveyed to a landfill for safekeeping. After cutting the glass fibre, the incineration procedure is carried out in the DECOM 4 scenario. This combustion process produces a considerable quantity of heat and ash. The ash produced by the incineration process is disposed of in a landfill. Furthermore, Table 4 summarizes all DECOM scenarios in each process. The LCOE has been calculated for each scenario, taking into account the costs calculated by considering the maintenance and disposal scenarios, the materials used in both scenarios, labour, the usage of new components, the scrapping of materials, and the equipment used in these scenarios.

5. Results and Discussion

In this paper, a life cycle cost analysis method for barge-type floating wind turbines was proposed, and then, the high-costs components of the barge-type floating wind turbine development were identified and analysed in detail. The cost components can be categorized into three groups: capital expenditure (CAPEX), operation and maintenance (OPEX), and decommissioning and disposal (DECOM).
The cost distribution of cost elements, as well as their contribution to the total CAPEX cost of the barge-type floating wind turbine, is reported in Table 5. The capital expenditure is composed of the P&C, P&A, and I&C project phases, with a total cost of around £5.402 m. It has been determined that the production and acquisition (P&A) phase accounted for about 62.67% of the total CAPEX cost, which was expended via the purchase of wind turbines, foundations, and electrical equipment. According to the findings, the wind turbine and support structures made the largest contributions, accounting for 26.23% and 24.67%, respectively, of the total CAPEX. The predevelopment and consenting cost were relatively less than other cost elements. Moreover, 15.02% of costs covered contingencies, project management, engineering work, surveys, and other elements. The highest cost among them was incurred by contingencies, i.e., 9.23% of total CAPEX costs.
In the OPEX analysis, the costs of the various maintenance scenarios in Table 2 were computed, and their LCOE values for both the OPEX and the total cost phases were also calculated. Table 6 gives a full breakdown of the expenditures incurred throughout the operation and maintenance scenario phase, as well as their distribution. Following the analysis, it was indicated that transmission charge costs, which are paid to the local authority responsible for the national electrical grid, accounted for about 35 to 42% of the total operating expenses (OPEX). When the cost of operating expense (OPEX) scenarios are taken into consideration, the OPEX 6 scenario has the highest overall cost, whilst the OPEX 1 scenario has the lowest. When the LCOE for OPEX scenarios is calculated, it is observed that OPEX 5 has the lowest value and OPEX 3 has the highest, at 16.89 £/MWh and 19.93 £/MWh, respectively, being the lowest and highest values in Figure 2. When the levelized cost of energy (LCOE) of the barge-type floating wind turbine is assessed, OPEX 6 has the lowest value. The most significant reason for this is the extension of the lifetime of the wind turbine to 30 years in maintenance scenario 6, which results in an increase in annual energy production and, as a consequence, a decrease in the cost per megawatt-hour generated.
This study handled four different end-of-life scenarios for barge-type floating wind turbine materials and determined their DECOM and LCOE. Table 7 reports all of the expenditures incurred throughout the end-of-life scenarios phase, as well as the LCOE contribution of each scenario. When considering the cost of the decommissioning and disposal (DECOM) scenarios, the DECOM 3 scenario has the greatest overall cost, whereas the DECOM 4 scenario has the lowest. In addition, in the incineration scenario (DECOM 4), which has the lowest cost, the cost of the equipment used is lower than in mechanical recycling, and in the mechanical process, more cutting is used to send the parts to mechanical recycling. But in the incineration process, there are fewer cutting processes than in mechanical recycling, resulting in lower costs. The high cost of the DECOM 3 scenario is due to the fact that two different processes are used in this end-of-life scenario, namely mechanical and incineration, and the transfer of waste material between these processes incurs additional transportation costs. In comparison to incineration, mechanical recycling is more expensive. Mechanical recycling is only practicable with composite materials, and the amount of material used for mechanical processing represents only a very small percentage when compared to other components of the wind turbine. When comparing the LCOE values of the decommissioning and disposal (DECOM) scenarios, the difference between the largest and smallest LCOEs was reported to be quite small, at 3.693 £/MWh and 3.647 £/MWh, respectively, in Figure 3.

6. Conclusions

In this study, LCC, LCOE, OPEX, and DECOM have been analysed to evaluate the economic performance of a barge-type floating wind turbine. These analyses include a detailed examination of the costs and energy generation costs over the project’s lifetime. Different scenarios involving operation and maintenance (OPEX) and end-of-life and disposal (DECOM) phases of the wind turbine have been investigated, and the results of these scenarios have been compared. The OPEX scenarios include on-site and off-site maintenance requirements at different durations (20 to 30 years) over the lifetime of the wind turbine. The DECOM scenarios examined the processes to be followed at the end of the lifetime of the wind turbine, including landfill, mechanical, mechanical and incineration and incineration processes. In light of the results of this study, the following conclusions were reached:
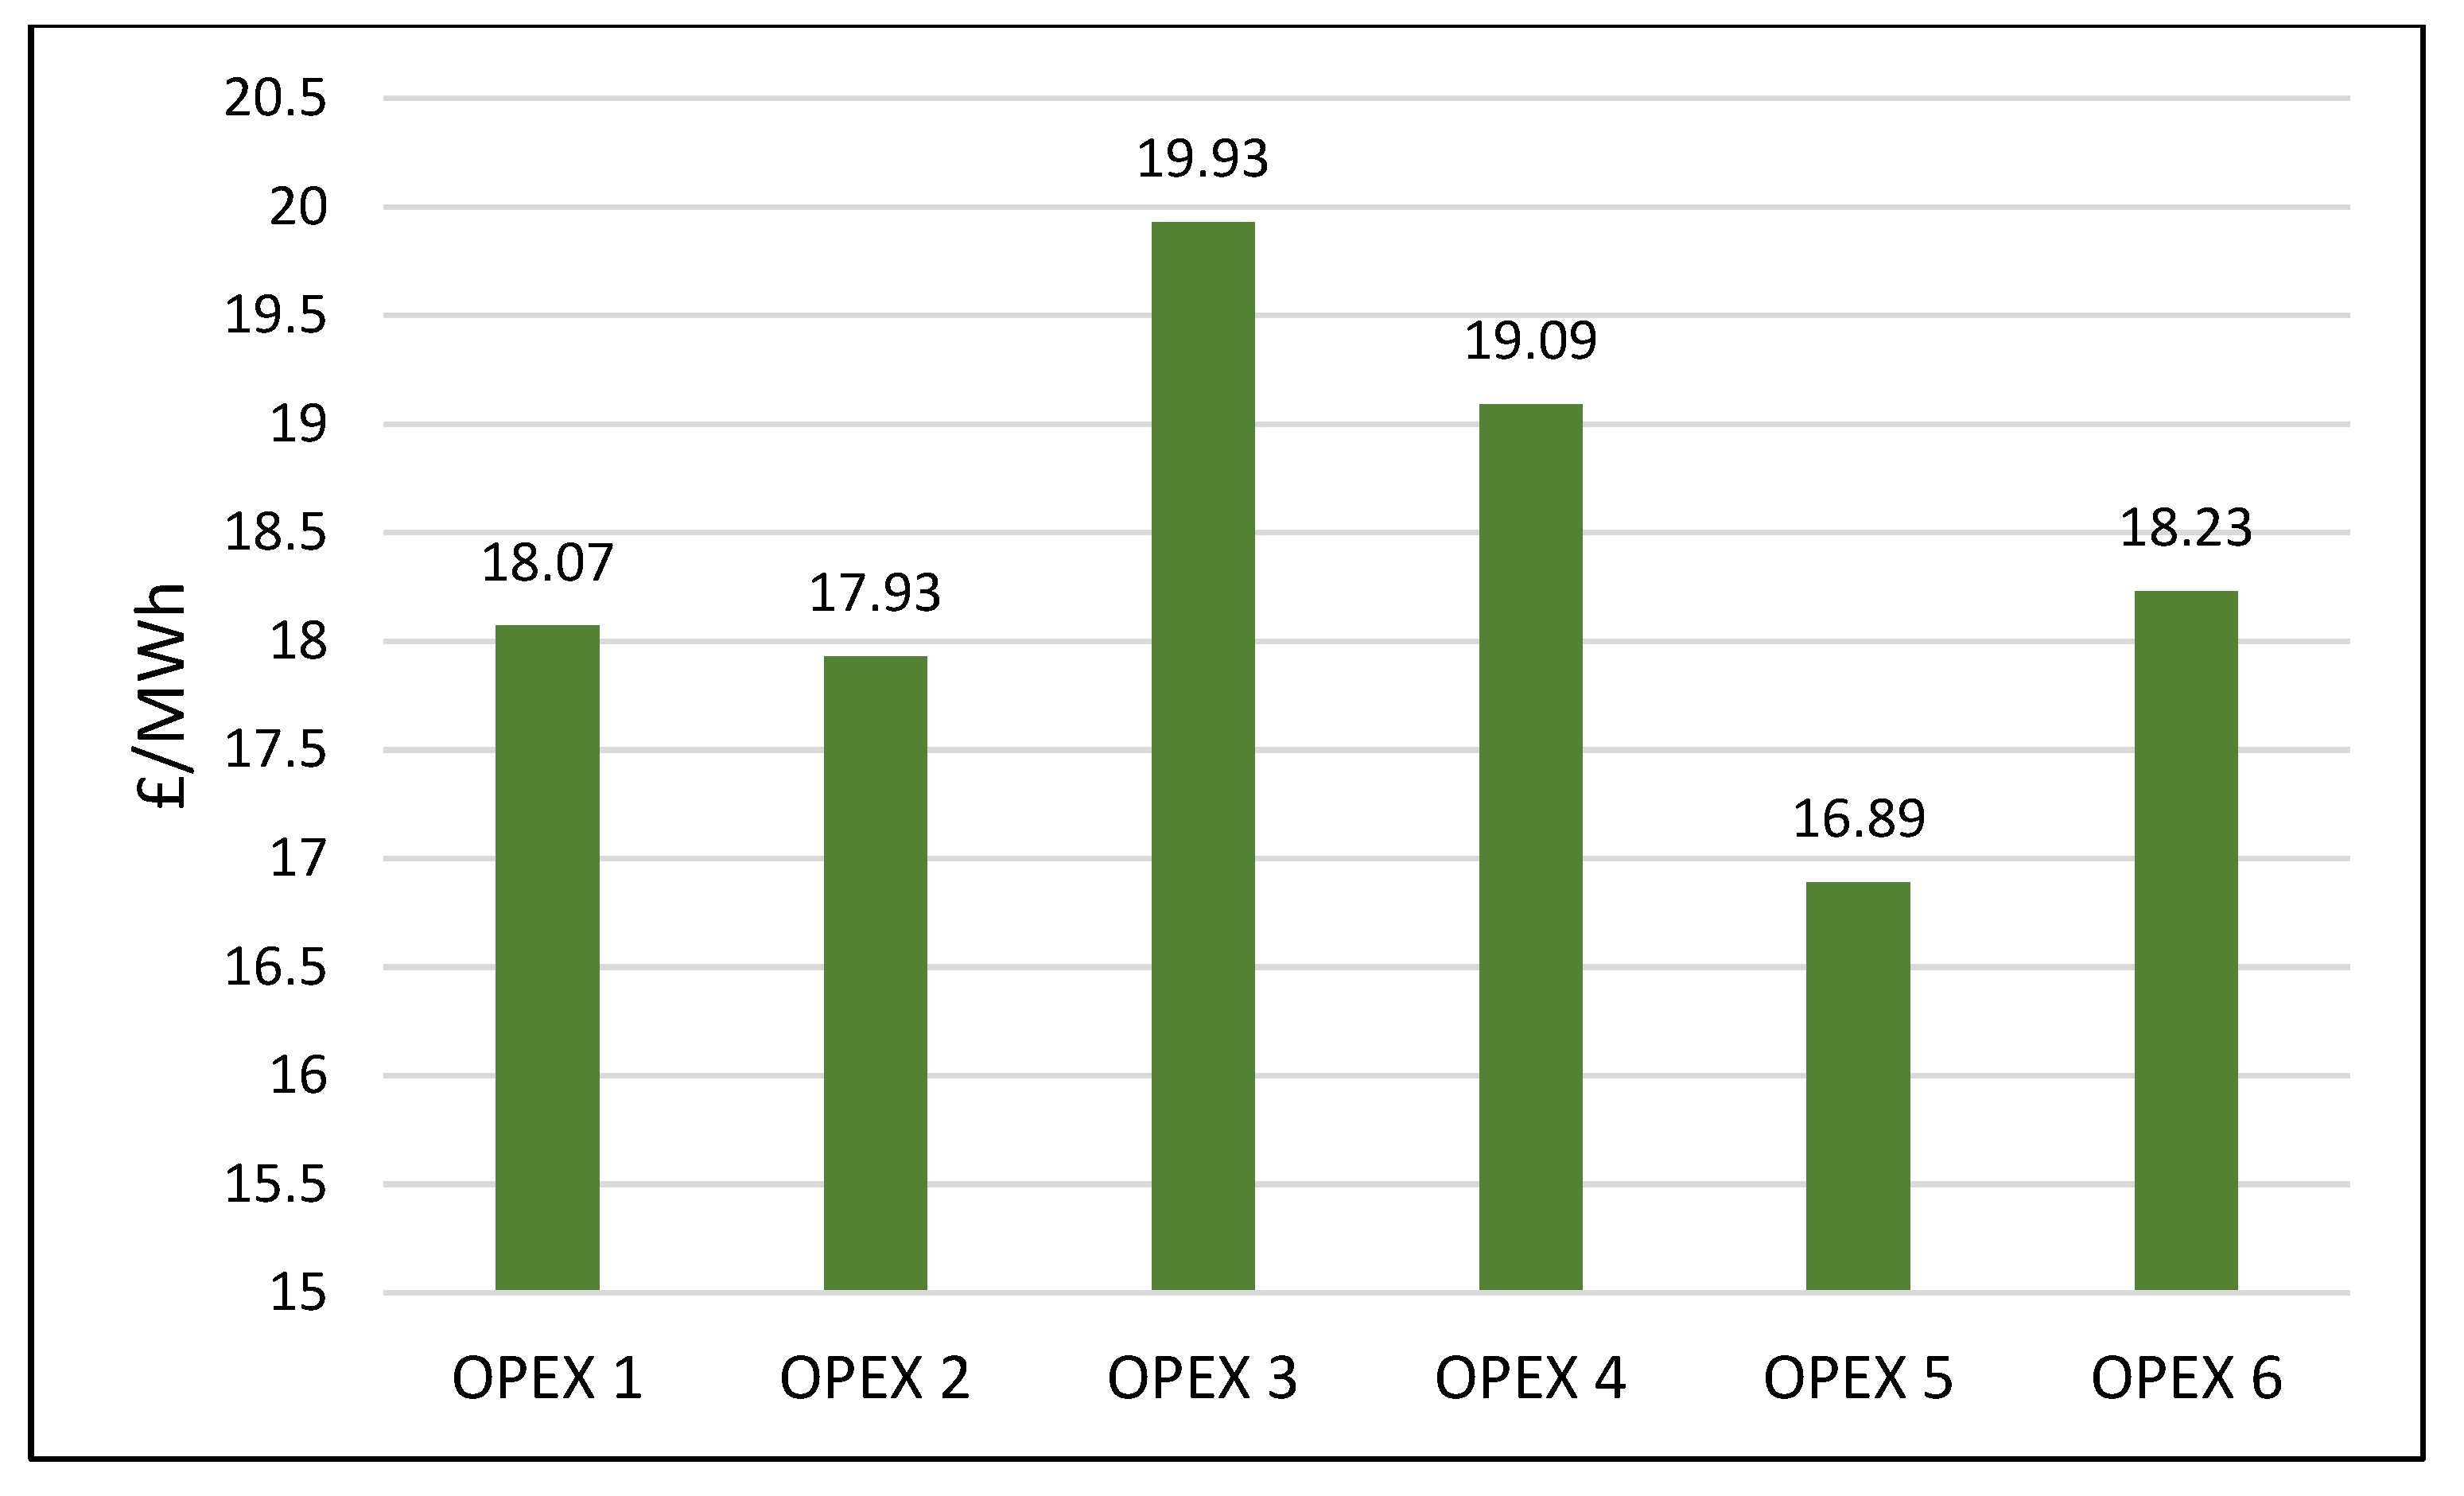
  • Based on the findings of the total operating expenses scenarios and whole LCOE results, the OPEX scenario that includes off-site maintenance and a wind turbine lifetime of 30 years, is the most cost-effective (£/MWh). The main reasons for this result are that the rental costs of the equipment used for on-site maintenance (motherships, etc.) are higher than those used for onshore maintenance, and sea conditions (wind, weather, etc.) increase the duration of on-site maintenance.
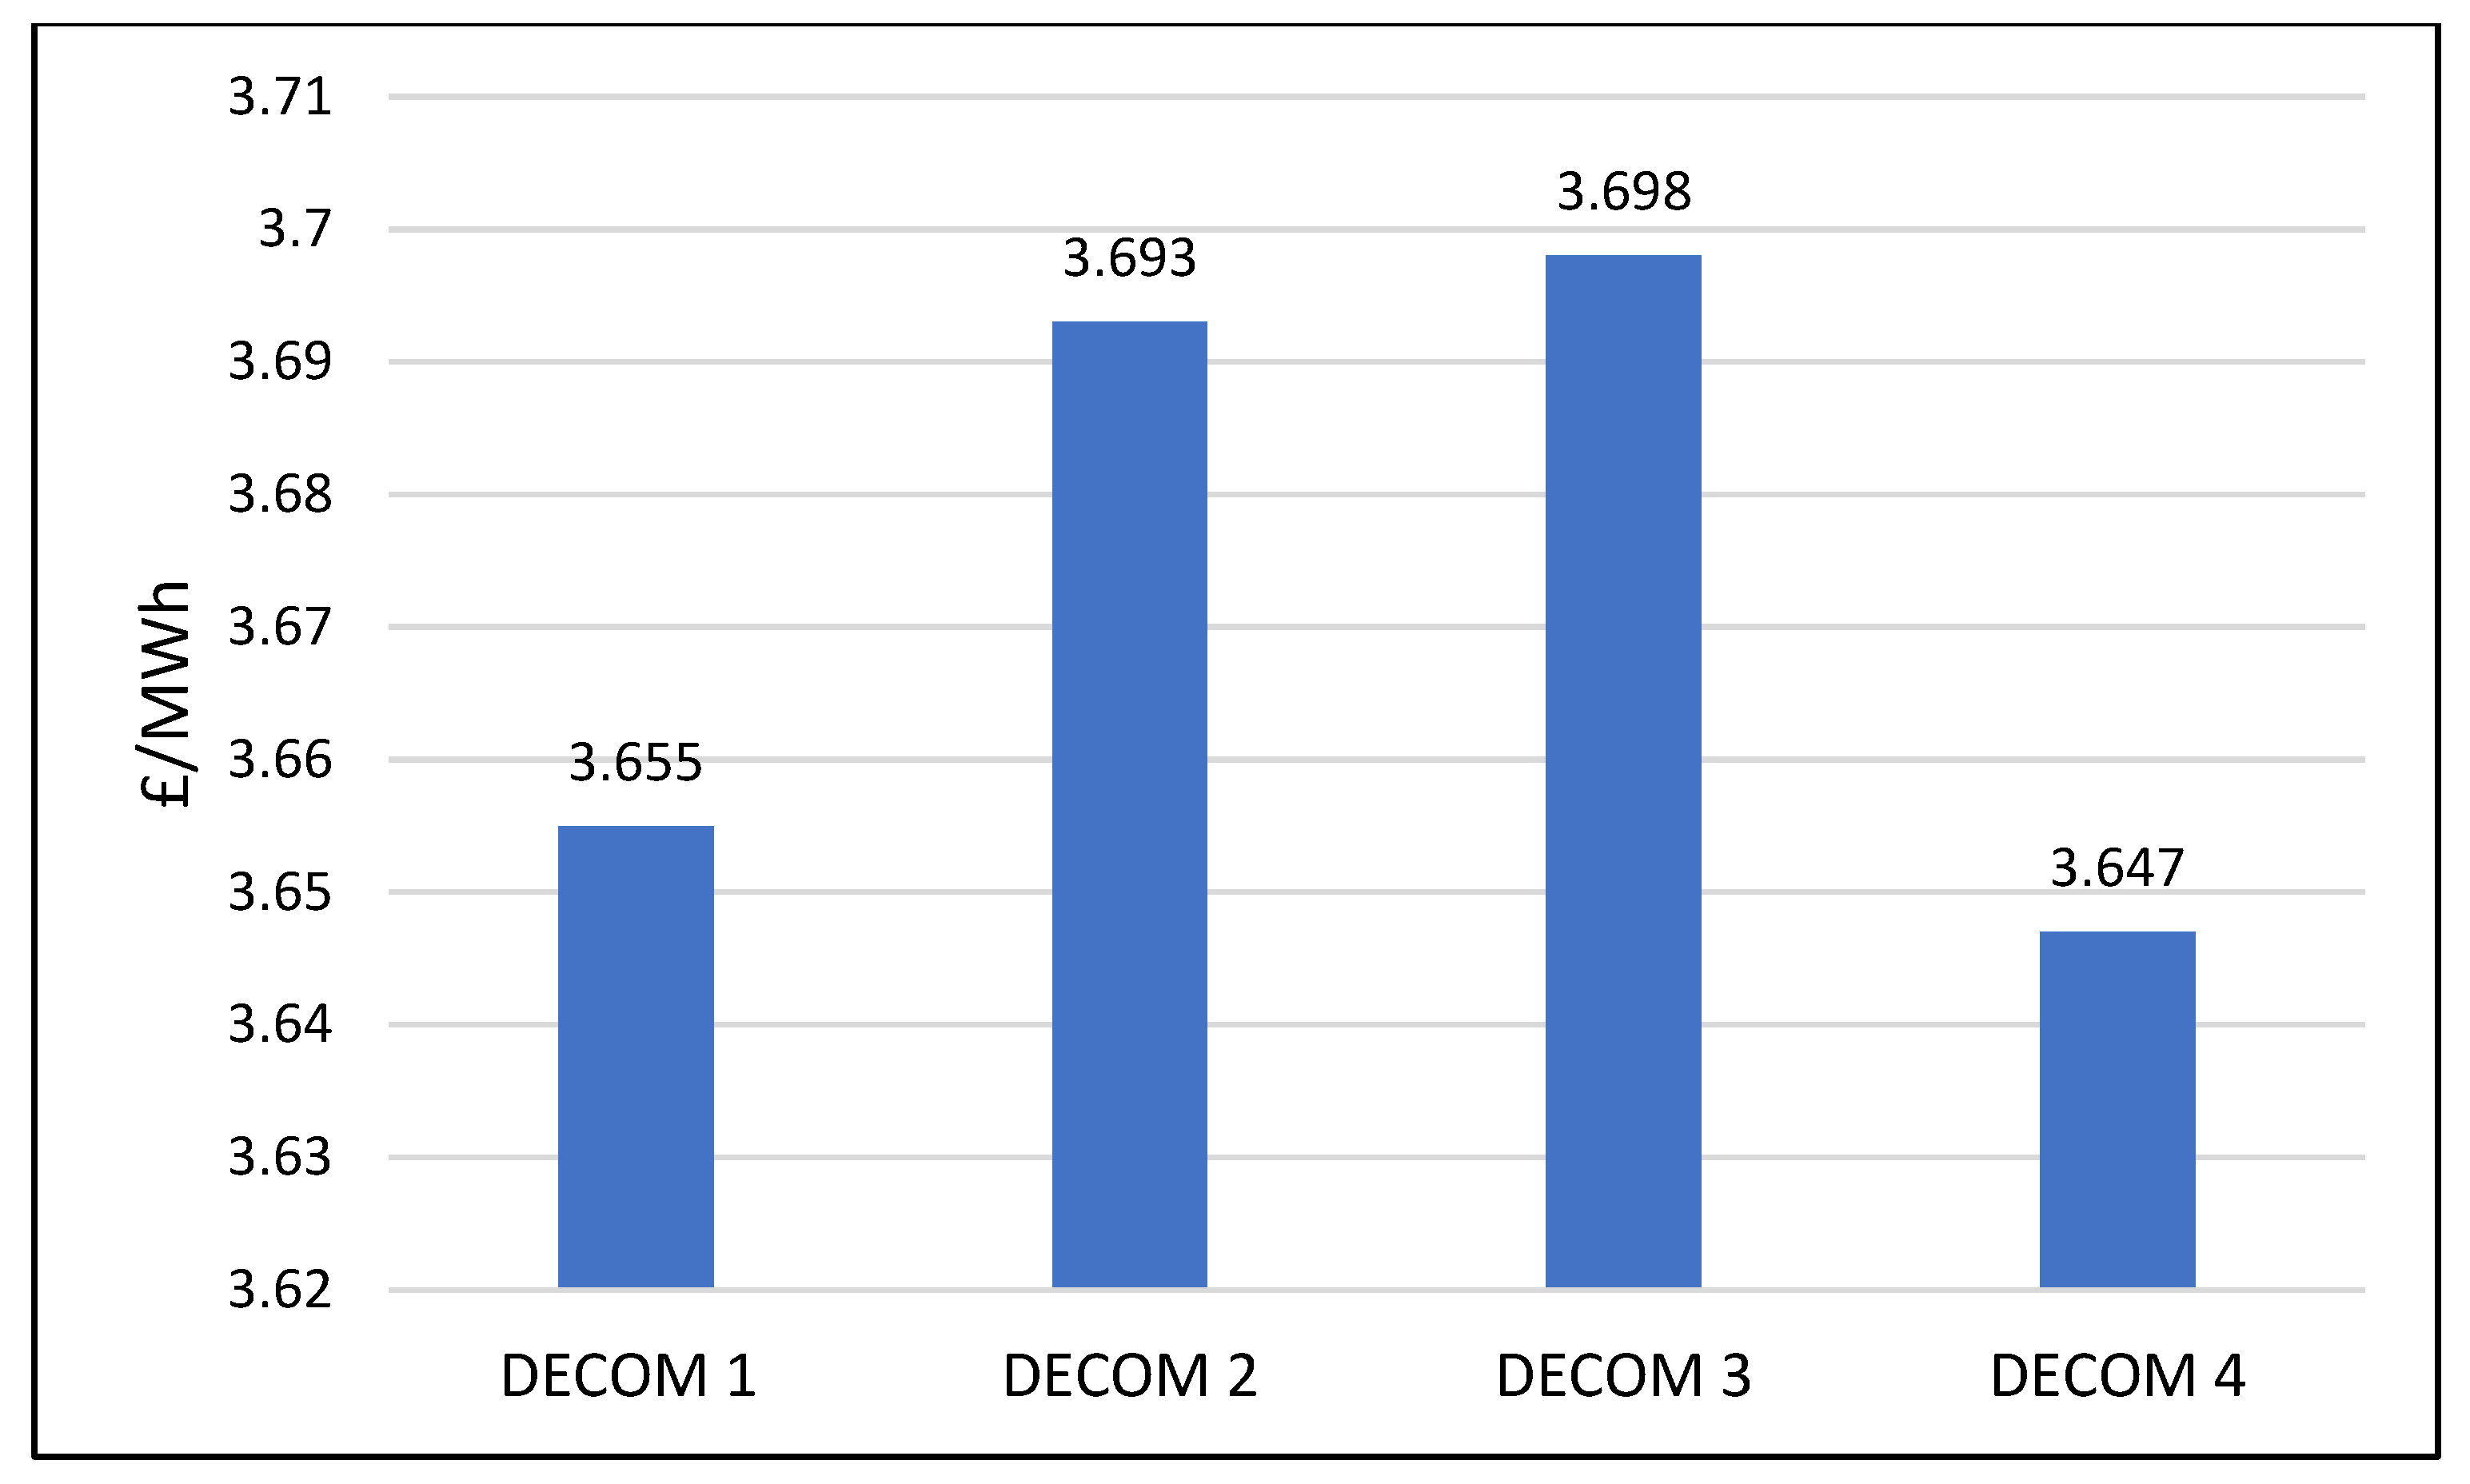
  • In terms of decommissioning and disposal scenarios, the incineration scenario was found to contribute the least to DECOM’s LCOE compared to the other scenarios. However, increasing the recycling rate in the mechanical process and reducing the cost per tonne of the process could lead to a scenario with a lower LCOE.
  • The lowest cost alternatives are OPEX 6 for maintenance and DECOM 4 for end-of-life, according to the total cost analysis. The total LCOE of these two scenarios is calculated at £50.66/MWh. Compared to the baseline scenario, a cost re-duction of approximately 24.08% was achieved with these two scenarios.
This study has made a substantial contribution to determining the best cost-effective offshore wind energy generation strategies. This study contributes significantly to the identification of economically efficient ways for offshore wind power generation. These studies provide ideas for providing energy that is both inexpensive and sustainable in the energy business.

Author Contributions

Conceptualization, N.Y.; methodology, N.Y.; software, N.Y.; validation, N.Y.; formal analysis, N.Y.; investigation, N.Y.; resources, N.Y.; data curation, N.Y.; writing—original draft preparation, N.Y.; writing—review and editing, N.Y., H.H. and C.B.; visualization, N.Y. All authors have read and agreed to the published version of the manuscript.

Funding

This research received no external funding.

Data Availability Statement

Data are included in the paper, and no further data are stored anywhere.

Acknowledgments

The authors acknowledge with thanks the Ministry of Education of Turkey and COST Action 20109 MODENERLANDS for their support to this research work.

Conflicts of Interest

The authors declare no conflicts of interest.

References

  1. Salah Alaloul, W.; Ali Musarat, M. Impact of Zero Energy Building: Sustainability Perspective. In Sustainable Sewage Sludge Management and Resource Efficiency; IntechOpen: Rijeka, Croatia, 2020. [Google Scholar]
  2. Alsubal, S.; Alaloul, W.S.; Shawn, E.L.; Liew, M.S.; Palaniappan, P.; Musarat, M.A. Life Cycle Cost Assessment of Offshore Wind Farm: Kudat Malaysia Case. Sustainability 2021, 13, 7943. [Google Scholar] [CrossRef]
  3. Kucaj, E.; Susaj, E.; Qaja, B. Renewable Energy—A Great Energizing Potential that Eliminates Environmental Pollution. Eur. J. Econ. Bus. Stud. 2017, 9, 40–45. [Google Scholar] [CrossRef]
  4. Wang, C.M.; Utsunomiya, T.; Wee, S.C.; Choo, Y.S. The IES Journal Part A: Civil & Structural Engineering Research on Floating Wind Turbines: A Literature Survey. Science (1979). IES J. Part A Civ. Struct. Eng. 2010, 3, 267–277. [Google Scholar]
  5. IRENA Insights on Renewables: Installed Capacity Trends. 2022. Available online: https://www.irena.org/Data (accessed on 10 January 2024).
  6. Pantusa, D.; Francone, A.; Tomasicchio, G.R. Floating Offshore Renewable Energy Farms. A Life-Cycle Cost Analysis at Brindisi, Italy. Energies 2020, 13, 6150. [Google Scholar] [CrossRef]
  7. European Commission. An EU Strategy to Harness the Potential of Offshore Renewable Energy for a Climate Neutral Future; European Comission: Brussels, Belgium, 2020. [Google Scholar]
  8. GWEC Global Wind Report 2019. 2020. Available online: https://gwec.net. (accessed on 20 January 2023).
  9. IRENA Offshore Renewables: An Action Agenda for Deployment. 2021. Available online: https://www.irena.org/Publications/2021/Jul/Offshore-Renewables-An-Action-Agenda-for-Deployment (accessed on 10 May 2022).
  10. Viselli, A.M.; Goupee, A.J.; Dagher, H.J. Model Test of a 1:8-Scale Floating Wind Turbine Offshore in the Gulf of Maine1. J. Offshore Mech. Arct. Eng. 2015, 137. [Google Scholar] [CrossRef]
  11. Liu, Z.; Fan, Y.; Wang, W.; Qian, G. Numerical Study of a Proposed Semi-Submersible Floating Platform with Different Numbers of Offset Columns Based on the DeepCwind Prototype for Improving the Wave-Resistance Ability. Appl. Sci. 2019, 9, 1255. [Google Scholar] [CrossRef]
  12. Liu, Y.; Ishihara, T. Numerical Study on Sectional Loads and Structural Optimization of an Elastic Semi-Submersible Floating Platform. Energies 2021, 14, 182. [Google Scholar] [CrossRef]
  13. Yildiz, N.; Hemida, H.; Baniotopoulos, C. Life Cycle Assessment of a Barge-Type Floating Wind Turbine and Comparison with Other Types of Wind Turbines. Energies 2021, 14, 5656. [Google Scholar] [CrossRef]
  14. Fuller, S.K.; Petersen, S.R. Life-Cycle Costing Manual of the US Federal Energy Management Program 1995. In NIST Handbook; US Department of Energy: Gaithersburg, MD, USA, 1996; p. 135. [Google Scholar]
  15. Shafiee, M.; Brennan, F.; Espinosa, I.A. A parametric whole life cost model for offshore wind farms. Int. J. Life Cycle Assess. 2016, 21, 961–975. [Google Scholar] [CrossRef]
  16. Maienza, C.; Avossa, A.M.; Ricciardelli, F.; Scherillo, F.; Georgakis, C.T. A Comparative Analysis of Construction Costs of Onshore and Shallow- and Deep-Water Offshore Wind Farms. In Lecture Notes in Civil Engineering; Springer: Berlin/Heidelberg, Germany, 2019; Volume 25, pp. 440–453. [Google Scholar]
  17. Blanco, M.I. The Economics of Wind Energy. Renew. Sustain. Energy Rev. 2009, 13, 1372–1382. [Google Scholar] [CrossRef]
  18. Ioannou, A.; Angus, A.; Brennan, F. Parametric CAPEX, OPEX, and LCOE expressions for offshore wind farms based on global deployment parameters. Energy Sources Part B Econ. Plan. Policy 2018, 13, 281–290. [Google Scholar] [CrossRef]
  19. Laura, C.-S.; Vicente, D.-C. Life-cycle cost analysis of floating offshore wind farms. Renew. Energy 2014, 66, 41–48. [Google Scholar] [CrossRef]
  20. Topham, E.; McMillan, D. Sustainable decommissioning of an offshore wind farm. Renew. Energy 2017, 102, 470–480. [Google Scholar] [CrossRef]
  21. Madariaga, A.; De Alegría, I.M.; Martín, J.L.; Eguía, P.; Ceballos, S. Current Facts about Offshore Wind Farms. Renew. Sustain. Energy Rev. 2012, 16, 3105–3116. [Google Scholar] [CrossRef]
  22. Mekhilef, S.; Safari, A.; Chandrasegaran, D. Feasibility Study of Off-Shore Wind Farms in Malaysia. Energy Educ. Sci. Technol. Part A Energy Sci. Res. 2012, 28, 519–530. [Google Scholar]
  23. Ibrahim, M.; Albani, A. The Potential of Wind Energy in Malaysian Renewable Energy Policy: Case Study in Kudat, Sabah. Energy Environ. 2014, 25, 881–898. [Google Scholar] [CrossRef]
  24. Nian, V.; Liu, Y.; Zhong, S. Life cycle cost-benefit analysis of offshore wind energy under the climatic conditions in Southeast Asia – Setting the bottom-line for deployment. Appl. Energy 2018, 233, 1003–1014. [Google Scholar] [CrossRef]
  25. Mytilinou, V.; Kolios, A.J. Techno-economic optimisation of offshore wind farms based on life cycle cost analysis on the UK. Renew. Energy 2019, 132, 439–454. [Google Scholar] [CrossRef]
  26. Junginger, M.; Faaij, A.; Turkenburg, W.C. Cost Reduction Prospects for Offshore Wind Farms. Wind. Eng. 2004, 28, 97–118. [Google Scholar] [CrossRef]
  27. Valpy, B.; Hundleby, G.; Freeman, K.; Roberts, A.; Logan, A. Future Renewable Energy Costs: Offshore Wind; BVG Associates, Inno Energy: Swindon, UK, 2017. [Google Scholar]
  28. McAuliffe, F.D.; Murphy, J.; Lynch, K.; Desmond, C.; Norbeck, J.A.; Nonås, L.M.; Attari, Y.; Doherty, P.; Sorensen, J.D.; Giebhardt, J.; et al. Driving Cost Reductions in Offshore Wind: The Leanwind Project Final Publication; Driving Cost Reduction on Offshore Wind; Leanwind: Brussels, Belgium, 2017; p. 72. [Google Scholar]
  29. Darwish, A.S. Floating Offshore Wind Technology Development: Current State and Future Vision. In Sustainable Energy Development and Innovation: Selected Papers from the World Renewable Energy Congress (WREC) 2020; Springer International Publishing: Berlin/Heidelberg, Germany, 2022; pp. 651–659. [Google Scholar] [CrossRef]
  30. Ebenhoch, R.; Matha, D.; Marathe, S.; Muñoz, P.C.; Molins, C. Comparative Levelized Cost of Energy Analysis. Proc. Energy Procedia 2015, 80, 108–122. [Google Scholar] [CrossRef]
  31. Rinne, E.; Holttinen, H.; Kiviluoma, J.; Rissanen, S. Effects of turbine technology and land use on wind power resource potential. Nat. Energy 2018, 3, 494–500. [Google Scholar] [CrossRef]
  32. Cavazzi, S.; Dutton, A. An Offshore Wind Energy Geographic Information System (OWE-GIS) for assessment of the UK’s offshore wind energy potential. Renew. Energy 2016, 87, 212–228. [Google Scholar] [CrossRef]
  33. Hdidouan, D.; Staffell, I. The impact of climate change on the levelised cost of wind energy. Renew. Energy 2017, 101, 575–592. [Google Scholar] [CrossRef]
  34. Kaiser, M.J.; Snyder, B.F. Offshore Wind Energy Cost Modeling: Installation and Decommissioning. Green Energy Technol. 2012, 85, 135–154. [Google Scholar]
  35. Nilsson, J.; Bertling, L. Maintenance Management of Wind Power Systems Using Condition Monitoring Systems—Life Cycle Cost Analysis for Two Case Studies. IEEE Trans. Energy Convers. 2007, 22, 223–229. [Google Scholar] [CrossRef]
  36. Judge, F.; McAuliffe, F.D.; Sperstad, I.B.; Chester, R.; Flannery, B.; Lynch, K.; Murphy, J. A lifecycle financial analysis model for offshore wind farms. Renew. Sustain. Energy Rev. 2019, 103, 370–383. [Google Scholar] [CrossRef]
  37. Myhr, A.; Bjerkseter, C.; Ågotnes, A.; Nygaard, T.A. Levelised cost of energy for offshore floating wind turbines in a life cycle perspective. Renew. Energy 2014, 66, 714–728. [Google Scholar] [CrossRef]
  38. Baita-Saavedra, E.; Cordal-Iglesias, D.; Filgueira-Vizoso, A.; Castro-Santos, L. Economic Aspects of a Concrete Floating Offshore Wind Platform in the Atlantic Arc of Europe. Int. J. Environ. Res. Public Health 2019, 16, 4122. [Google Scholar] [CrossRef] [PubMed]
  39. Maienza, C.; Avossa, A.; Ricciardelli, F.; Coiro, D.; Troise, G.; Georgakis, C. A life cycle cost model for floating offshore wind farms. Appl. Energy 2020, 266, 114716. [Google Scholar] [CrossRef]
  40. Levitt, A.C.; Kempton, W.; Smith, A.P.; Musial, W.; Firestone, J. Pricing offshore wind power. Energy Policy 2011, 39, 6408–6421. [Google Scholar] [CrossRef]
  41. Castro-Santos, L.; Martins, E.; Soares, C.G. Methodology to Calculate the Costs of a Floating Offshore Renewable Energy Farm. Energies 2016, 9, 324. [Google Scholar] [CrossRef]
  42. Effiom, S.; Nwankwojike, B.; Abam, F. Economic cost evaluation on the viability of offshore wind turbine farms in Nigeria. Energy Rep. 2016, 2, 48–53. [Google Scholar] [CrossRef]
  43. TTavner, P. Offshore Wind Turbines Reliability, Availability and Maintenance; The Institution of Engineering and Technology: London, UK, 2012. [Google Scholar] [CrossRef]
  44. Maples, B.; Saur, G.; Hand, M.; Pietermen, R.; van Obdam, T. Installation, Operation, and Maintenance Strategies to Reduce the Cost of Offshore Wind Energy; Technical Report Nrel/Tp-5000-57403; National Renewable Energy Lab. (NREL): Golden, CO, USA, 2013.
  45. Dinmohammadi, F.; Shafiee, M. A Fuzzy-FMEA Risk Assessment Approach for Offshore Wind Turbines. Int. J. Progn. Health Manag. 2013, 4, 59–68. [Google Scholar] [CrossRef]
  46. Ahn, D.; Shin, S.-C.; Kim, S.-Y.; Kharoufi, H.; Kim, H.-C. Comparative evaluation of different offshore wind turbine installation vessels for Korean west–south wind farm. Int. J. Nav. Arch. Ocean Eng. 2017, 9, 45–54. [Google Scholar] [CrossRef]
  47. Kang, J.; Sobral, J.; Soares, C.G. Review of Condition-Based Maintenance Strategies for Offshore Wind Energy. J. Mar. Sci. Appl. 2019, 18, 1–16. [Google Scholar] [CrossRef]
  48. Ren, Z.; Verma, A.S.; Li, Y.; Teuwen, J.J.; Jiang, Z. Offshore wind turbine operations and maintenance: A state-of-the-art review. Renew. Sustain. Energy Rev. 2021, 144, 110886. [Google Scholar] [CrossRef]
  49. European Council Directive 2008/98/EC on Waste (Waste Framework Directive)—Environment—European Commission. Off. J. Eur. Union 2008, 312, 6–36.
  50. Topham, E.; McMillan, D.; Bradley, S.; Hart, E. Recycling offshore wind farms at decommissioning stage. Energy Policy 2019, 129, 698–709. [Google Scholar] [CrossRef]
  51. James Floating Offshore Wind: Installation, Operation & Maintenance Challenges. Available online: https://blackfishengineering.com/2020/07/29/floating-offshore-wind-installation-operation-maintenance-challenges/ (accessed on 10 November 2023).
  52. Yildiz, N.; Hemida, H.; Baniotopoulos, C. Floating Versus Offshore Wind Turbines: A Comparative Life Cycle Assessment. In Proceedings of the CESARE Conference Publications; University of Birmingham: Birmingham, UK, 2022. [Google Scholar]
  53. Yildiz, N.; Hemida, H.; Baniotopoulos, C. Maintenance and End-of-Life Analysis in LCA for Barge-Type Floating Wind Turbine. Wind 2022, 2, 246–259. [Google Scholar] [CrossRef]
  54. Vargas, A.; Zenón, E.; Oswald, U.; Islas, J.; Güereca, L.; Manzini, F. Life cycle assessment: A case study of two wind turbines used in Mexico. Appl. Therm. Eng. 2015, 75, 1210–1216. [Google Scholar] [CrossRef]
  55. Martínez, E.; Sanz, F.; Pellegrini, S.; Jiménez, E.; Blanco, J. Life cycle assessment of a multi-megawatt wind turbine. Renew. Energy 2009, 34, 667–673. [Google Scholar] [CrossRef]
  56. Ortegon, K.; Nies, L.F.; Sutherland, J.W. Preparing for end of service life of wind turbines. J. Clean. Prod. 2013, 39, 191–199. [Google Scholar] [CrossRef]
  57. Echavarria, E.; Hahn, B.; Van Bussel, G.J.W.; Tomiyama, T. Reliability of Wind Turbine Technology through Time. J. Sol. Energy Eng. 2008, 130, 031005. [Google Scholar] [CrossRef]
Figure 1. Life cycle cost analysis for offshore and floating wind farms.
Energies 17 01332 g001
Figure 2. OPEX results for the barge-type floating wind turbine.
Energies 17 01332 g002
Figure 3. DECOM results for the barge-type floating wind turbine.
Energies 17 01332 g003
Table 1. Summarize of CAPEX, OPEX and DECOM.
CostsFormulation
The total cost over a lifetime E C v = ( C C A P E X   + C O P E X + C D E C O M )  
Predevelopment and consenting C P & C = C p r o j M + C l e g a l + C s u r v e y s + C e n g + C c o n t i n g e n c y
Project management C p r o j M = 0.03  ×    C A P E X
Legal authorization C l e g a l = 0.0013  ×  C A P E X
Surveys C s u r v e y s = C s u r v E N + C s u r v C P + C s u r v S B + C s u r v M O
Engineering C e n g = C b a s e + C e n g v e r i f + C e n g u n i t   ×   I C
Contingencies   C c o n t i n g e n c y = 0.1    ×    C A P E X
Production and acquisition C P & A = C W T + C S S + C P T S + C m o n i t o r i n g  
Wind turbines C W T = ( C W T m a t + C W T t r a n s ) ×   N W T
Support structures C S S = ( C S S m a t + C S S t r a n s )  ×    N W T
Power transmission system C P T S = C c a b l e s + C o f s u b s + C o n s u b s
Monitoring system C m o n i t o r i n g = ( C S C A D A + C C M S ) ×   N W T
Installation and commissioning C I & C = C I & C c o m p + C p o r t + C c o m m + C I & C i n s
Port cost C p o r t = C p o r t u s e + C p o r t l a b o u r
Installation of the components C I & C c o m p = C I & C f o u n d a t i o n + C I & C w i n d t u r b i n e + C I & C o f s u b s + C I & C o n s u b s
Operation and maintenance (O&M) C O & M = C O + C M
Operational expenditures C O = C r e n t + C O   &   M i n s + C t r a n s m i s s i o n
Maintenance C M = C M d i r e c t + C M i n d i r e c t
Indirect maintenance C M i n d i r e c t = C i n d p o r t + C i n d v e s s e l + C i n d l a b o u r
Decommissioning and disposal C D & D = C D e c o m + C W M + C S C + C p o s t M
Decommissioning C D e c o m = C D & D p o r t + C r e m o v
Waste management C W M = C W p r o c + C W t r a n s + C l a n d f i l l S V
Levelized cost of energy C A P E X + O P E X + D E C O M A E P
Table 2. The barge-type floating wind turbine’s mass distribution [13,54].
ComponentsUnitValue
Rotorton28.5
Nacelleton64
Towerton183
Platformton5472.5
Table 3. Details of OPEX scenarios.
Scenario NamePlace of Maintenance ScenariosPrevention Maintenance and Inspections (Year)Unscheduled Maintenance
(Year)
Lifetime of the Wind Turbine (Year)Vehicles UsedComponents Replaced
OPEX 1On-site12120Workboat-
OPEX 2On-site12125Workboat and mother vesselGearbox
OPEX 3On-site12125Workboat and mother vesselGearbox and blades
OPEX 4On-site12130Workboat and mother vesselGearbox and blades
OPEX 5Off-site12125Workboat, crane, and tugboatsGearbox
OPEX 6Off-site12130Workboat, crane, and tugboatsGearbox and blades
Table 4. Details of DECOM scenarios.
Scenario NameFirst ProcessSecond ProcessThird ProcessLast Process
DECOM 1Cutting--Landfill
DECOM 2CuttingMechanical recycling -Landfill
DECOM 3CuttingMechanical recyclingIncinerationLandfill
DECOM 4CuttingIncineration-Landfill
Table 5. CAPEX of the barge-type floating wind turbine.
Cost ElementCost (£)Contribution of Phase (%)Contribution of CAPEX (%)
Project Management (CprojM)166,89620.57%3.09%
Legal Authorizing (Clegal)65,8428.12%1.22%
Surveys (Csurveys)75,5569.31%1.40%
Engineering Activities (Ceng)45100.56%0.08%
Contingencies (Ccontingency)498,47261.44%9.23%
Predevelopment and Consenting (P&C)811,276100%15.02%
Support Structures (CSS)1,332,66239.36%24.67%
Wind Turbines (CWT)1,417,04141.85%26.23%
Power Transmission Systems (CPTS)625,91418.48%11.59%
Monitoring Systems (Cmonitoring)98880.29%0.18%
Production and Acquisition (P&A)3,385,505100%62.67%
Support Structures and Electrical Systems (CI&C-comp)58,7564.87%1.09%
Ports Charges (Cport)1,063,07688.15%19.68%
Commissioning Cost (Ccomm)9600.08%0.02%
Insurance Cost (CI&C-ins)83,2006.90%1.54%
Installation and Commissioning (I&C)1,205,992100%22.33%
CAPEX5,402,773
Table 6. OPEX of the barge-type floating wind turbine.
Scenario Name and Cost Element for OPEXCost (£)% ContributionLCOE for OPEX 1 (£/MWh)Total LCOE (£/MWh)
Crent46,7402.15%0.388
CO&M-ins174,6108.04%1.452
Ctransmission860,70039.67%7.168
CM-indirect390,00017.97%3.247
CProM376,20017.34%3.133
CCM321,10014.80%2.674
Total OPEX 12,169,350100%18.0766.73
Crent58,4252.17%0.389
CO&M-ins218,262.58.11%1.454
Ctransmission1,075,87540.00%7.172
CM-indirect487,50018.12%3.248
CProM448,10016.66%2.987
CCM401,37514.92%2.675
Total OPEX 22,689,537.5100%17.9356.85
Crent58,4251.95%0.388
CO&M-ins218,262.57.30%1.454
Ctransmission1,075,87535.98%7.170
CM-indirect487,50016.30%3.248
CProM748,10025.02%4.986
CCM401,37513.42%2.674
Total OPEX 32,989,537.5100%19.9358.85
Crent70,1102.03%0.387
CO&M-ins261,9157.61%1.452
Ctransmission1,291,05037.55%7.168
CM-indirect58,500017.01%3.247
CProM748,10021.76%4.153
CCM481,65014.01%2.674
Total OPEX 43,437,825100%19.0951.54
Crent58,4252.30%0.388
CO&M-ins218,262.58.61%1.454
Ctransmission1,075,87542.46%7.171
CM-indirect487,50019.24%3.249
CProM292,10011.52%1.945
CCM401,37515.84%2.675
Total OPEX 52,533,537.5100%16.8955.81
Crent70,1102.13%0.388
CO&M-ins261,9157.98%1.454
Ctransmission1,291,05039.33%7.169
CM-indirect585,00017.82%3.248
CProM592,10018.04%3.288
CCM481,65014.67%2.674
Total OPEX 63,281,825100%18.2350.67
1 Weighted-average cost of capital is assumed to be 2.72%.
Table 7. DECOM of the barge-type floating wind turbine.
Scenario Names and Cost Element for DECOMCost (£)% ContributionLCOE for DECOM 1 (£/MWh)
CD&D-port99,27822.63%0.827
Cremove729,190.8166.23%6.075
CWM−407,008−92.78%−3.391
CpostM17,1783.91%0.142
Total DECOM 1438,638.8100%3.655
CD&D-port99,27822.40%0.827
Cremove729,190.8164.53%6.076
CWM−402,462.775−90.81%−3.353
CpostM17,1783.87%0.142
Total DECOM 2 443,184.025100%3.693
CD&D-port99,27822.37%0.827
Cremove729,190.8164.31%6.076
CWM−401,870.05−90.55%−3.348
CpostM17,1783.87%0.143
Total DECOM 3443,776.75100%3.698
CD&D-port99,27822.68%0.8271
Cremove729,190.8166.58%6.075
CWM−407,917.4−93.18%−3.398
CpostM17,1783.92%0.142
Total DECOM 4437,729.4100%3.647
1 Weighted-average cost of capital is assumed to be 2.72%.
Disclaimer/Publisher’s Note: The statements, opinions and data contained in all publications are solely those of the individual author(s) and contributor(s) and not of MDPI and/or the editor(s). MDPI and/or the editor(s) disclaim responsibility for any injury to people or property resulting from any ideas, methods, instructions or products referred to in the content.

