Abstract
This paper presents a comprehensive study on the impacts of peer-to-peer (P2P) energy markets on distribution systems, specifically focusing on voltage, power loss, and congestion. While P2P energy markets create opportunities for direct trading between prosumers and consumers, ensuring compliance with distribution system constraints remains a challenge. This paper proposes an iterative method and graphical interpretation in order to assess complex interactions, addressing the persistent issue of network constraints. Additionally, this paper proposes a method to determine distribution locational marginal prices (DLMPs) for real-time traditional energy markets. This ensures effective coordination among sellers, buyers, and the distribution system operator. The proposed method aims to prevent negative impacts on distribution system operation via the determination of the allowable maximum trading power (MTP), ensuring empirical validity and practical implementation via operating conditions and forecast errors, thus distinguishing it from prior studies. This paper also establishes a model for P2P energy market interactions, utilizing linear estimations for efficient DLMP updates. The contributions of this paper enhance the understanding and operation of P2P energy markets, and is supported by simulation results validating the proposed method.
1. Introduction
A peer-to-peer (P2P) energy market is a novel concept that allows prosumers and consumers, acting as sellers and buyers, to directly trade electricity without relying on an intermediary [1,2]. According to this concept, sellers and buyers can benefit from the P2P energy market by negotiating and transacting both prices and power. However, it is essential for established P2P energy transactions to undergo a recheck by a distribution system operator (DSO) [3]. The role of the DSO is to ensure that no adverse technical consequences occur relating to the distribution system as power flows from the seller’s house to the buyer’s house. Although the rechecking procedure by the DSO is widely accepted, it remains one of the major challenges associated with P2P energy market operations in many countries, including Thailand [4,5,6].
2. Literature Review
2.1. Technical Effects of P2P Energy Transactions
Previous research [7,8,9,10,11,12] has focused on investigating the technical effects of P2P energy transactions on the distribution system. Zhang et al. [7] proposed a distributed P2P energy trading model that accounts for active power loss. Azim et al. [8] conducted an in-depth analysis of the impact of the P2P energy market on active power loss at the physical layer. Khorasany et al. [9] utilized line flow constraints in the P2P energy market to mitigate congested lines in the distribution system. Ai et al. [10] achieved local energy sharing while minimizing line congestion in the distribution system. Paudel et al. [11] proposed a decentralized algorithm for the local energy market, considering voltage management to ensure network constraints are not violated. Liu et al. [12] developed a fully decentralized dual-loop P2P energy market mechanism that included voltage regulation. While many previous studies have considered network constraints, they typically have focused on a single network constraint. In order to provide a comprehensive understanding of the intricate behavior of network constraints and swiftly identify potential issues via visual representations, this paper proposes an iterative method and graphical interpretation for the study of the impacts of P2P energy transactions on voltage, power loss, and congestion within the distribution system. This approach allows for a more precise assessment of their effects compared to previous research. Although an iterative method can be computationally intensive and sensitive to the choice of the initial conditions for convergence, this method is crucial for addressing the complexity, nonlinearity, and dynamic behavior of such power systems. This method facilitates the efficient resolution of large-scale, constrained optimization problems, thereby contributing to the reliable and economical operation of power grids.
2.2. DLMPs, MTP, and NUCs in P2P Energy Markets
Traditionally, in the absence of a P2P energy market, the DSO has been responsible for ensuring the safe operation of distribution systems. However, as indicated by some previous studies [13,14,15], the role of the DSO extends to assessing whether network constraints are violated during P2P energy transactions. Moreover, once energy exchanges begin between sellers and buyers, the DSO is tasked with determining distribution locational marginal prices (DLMPs) for all buses in the distribution system, establishing buying and selling prices for the energy imported from and exported to the distribution system [16,17,18,19]. For instance, Morstyn et al. [16] proposed a novel strategy for day-ahead DLMPs, considering uncertainties related to local generation, demand, and upstream prices via the incorporation of a spread between imported and exported energy prices. Building on this, Haggi et al. [17] utilized DLMPs as the upper bound for buyers’ bids; if these bids exceed the DLMPs, buyers may lose the auction and be required to purchase active power from the distribution system at that price. Utilizing a different approach, Mohammadi et al. [18] computed the probability density function of DLMPs, highlighting the growing importance of the DSO seeking lower-risk solutions from distributed energy resources. Lastly, Lu et al. [19] proposed a decomposable carbon-aware DLMP-based DSO operation service pricing scheme to achieve secure and low-carbon network operation.
In this context, DLMPs or their probabilistic models can assist the DSO in better coordinating sellers and buyers on the P2P energy market. However, the exchange of real trading power (RTP), or actual trading power, does not guarantee the avoidance of network constraint violations. To address this, this paper proposes a method to determine DLMPs, thus allowing sellers and buyers to trade their energy with the DSO in real-time on the traditional energy market. Additionally, it establishes the allowable maximum trading power (MTP) for sellers and buyers, representing the distribution system’s capability to support RTP without violating network constraints. To the best of our knowledge, much of the previous research [20,21] has examined the MTP by forecasting the trading power of sellers and buyers over a specific time period, such as one day or one hour, without considering forecast errors during power exchange periods. Therefore, this paper proposes an algorithm to determine the allowable MTP, while considering the operating conditions of the distribution system and forecast error data of PV generation and load consumption. The goal is to identify suitable points for the allowable MTP, ensuring that the actual exchange of trading power between sellers and buyers during power exchange periods does not negatively impact the distribution system’s operation in terms of voltage levels and congestion. Moreover, this paper determines the MTP based on the study’s results, while previous research [22,23,24,25] relied on optimization approaches. For instance, Wang et al. [25] proposed a bi-level distributed optimization approach to address interactions under uncertainty between power flows supervised by the DSO and P2P transactions among microgrids. Although the MTP in this paper is not determined using direct optimization, there are several benefits, including empirical validity, a reflection of the actual conditions, and practical implementation. Finally, this paper employs linear estimation to establish a relationship between DLMPs and the RTP of sellers and buyers, determining prices associated with uncertainty on both the supply and demand sides.
This paper utilizes the difference in the determined DLMPs for each P2P energy transaction, a methodology which has also been employed in previous works [26,27,28], to recover the DSO’s network operation costs. These costs, directly tied to network constraints, are converted into network usage charges (NUCs). Additionally, NUCs can incentivize sellers and buyers to enhance the accuracy of their power forecasts. This is essential because the benefits of participating in the P2P energy market diminish when power is not accurately forecasted.
3. Contributions and Paper Organization
In summary, the paper contributes novel methods addressing the challenges associated with P2P energy transactions, network constraints, and the role of the DSO in ensuring the reliable and economical operation of the distribution system. The contributions of this paper can be summarized as follows:
- (1)
- Iterative method and graphical interpretation: (1.1) proposing an iterative method and graphical interpretation to study voltage, power loss, and congestion impacts of P2P energy transactions on the distribution system, (1.2) aiming to provide a more comprehensive understanding of network constraints compared to previous research, and (1.3) efficiently and effectively resolving large-scale, constrained optimization problems, thus contributing to the reliable and economical operation of distribution systems by dealing with the complexity, nonlinearity, and dynamic behavior of power systems. The iterative method proposed for the compliance assessment can be computationally intensive and sensitive to the initial conditions for convergence. This paper overcomes computational intensity and sensitivity to the initial conditions by carefully selecting convergence criteria and optimization techniques.
- (2)
- Algorithm for MTP considering operating conditions and forecast errors: (2.1) proposing an algorithm to determine the allowable MTP considering the operating conditions of the distribution system and forecast error data of PV generation and load consumption, (2.2) addressing the limitations of previous research by accounting for forecast errors during power exchange periods, and (2.3) enhancing the accuracy of the MTP determination, contributing to improved system reliability and efficiency. Determining the allowable MTP involves a multivariable nonlinear optimization problem, adding complexity to the analysis, and studying the impacts of P2P energy transactions is challenging due to the dynamic behavior, complexity, and nonlinearity of the power systems. This paper addresses the complexity and nonlinearity of power systems by utilizing the proposed iterative method and considering the operating conditions and forecast errors in the analysis.
- (3)
- DLMP determination for the real-time traditional energy market: (3.1) proposing a method to determine DLMPs for real-time traditional energy market transactions between sellers, buyers, and the DSO, (3.2) utilizing linear estimations to establish a relationship between DLMPs and the RTP of sellers and buyers, and (3.3) enabling efficient transactions by providing a mechanism to determine DLMPs in real-time, facilitating effective coordination between market participants and the DSO.
The rest of this paper is structured as follows: Section 4 outlines the procedures for operating the P2P energy market, coordinating with the DSO’s traditional energy market. Section 5 explains the proposed methodology in detail. In Section 6, simulation results are presented, accompanied by a discussion supporting the case studies. Finally, Section 7 concludes the paper.
4. Procedures for P2P Energy Market Operations
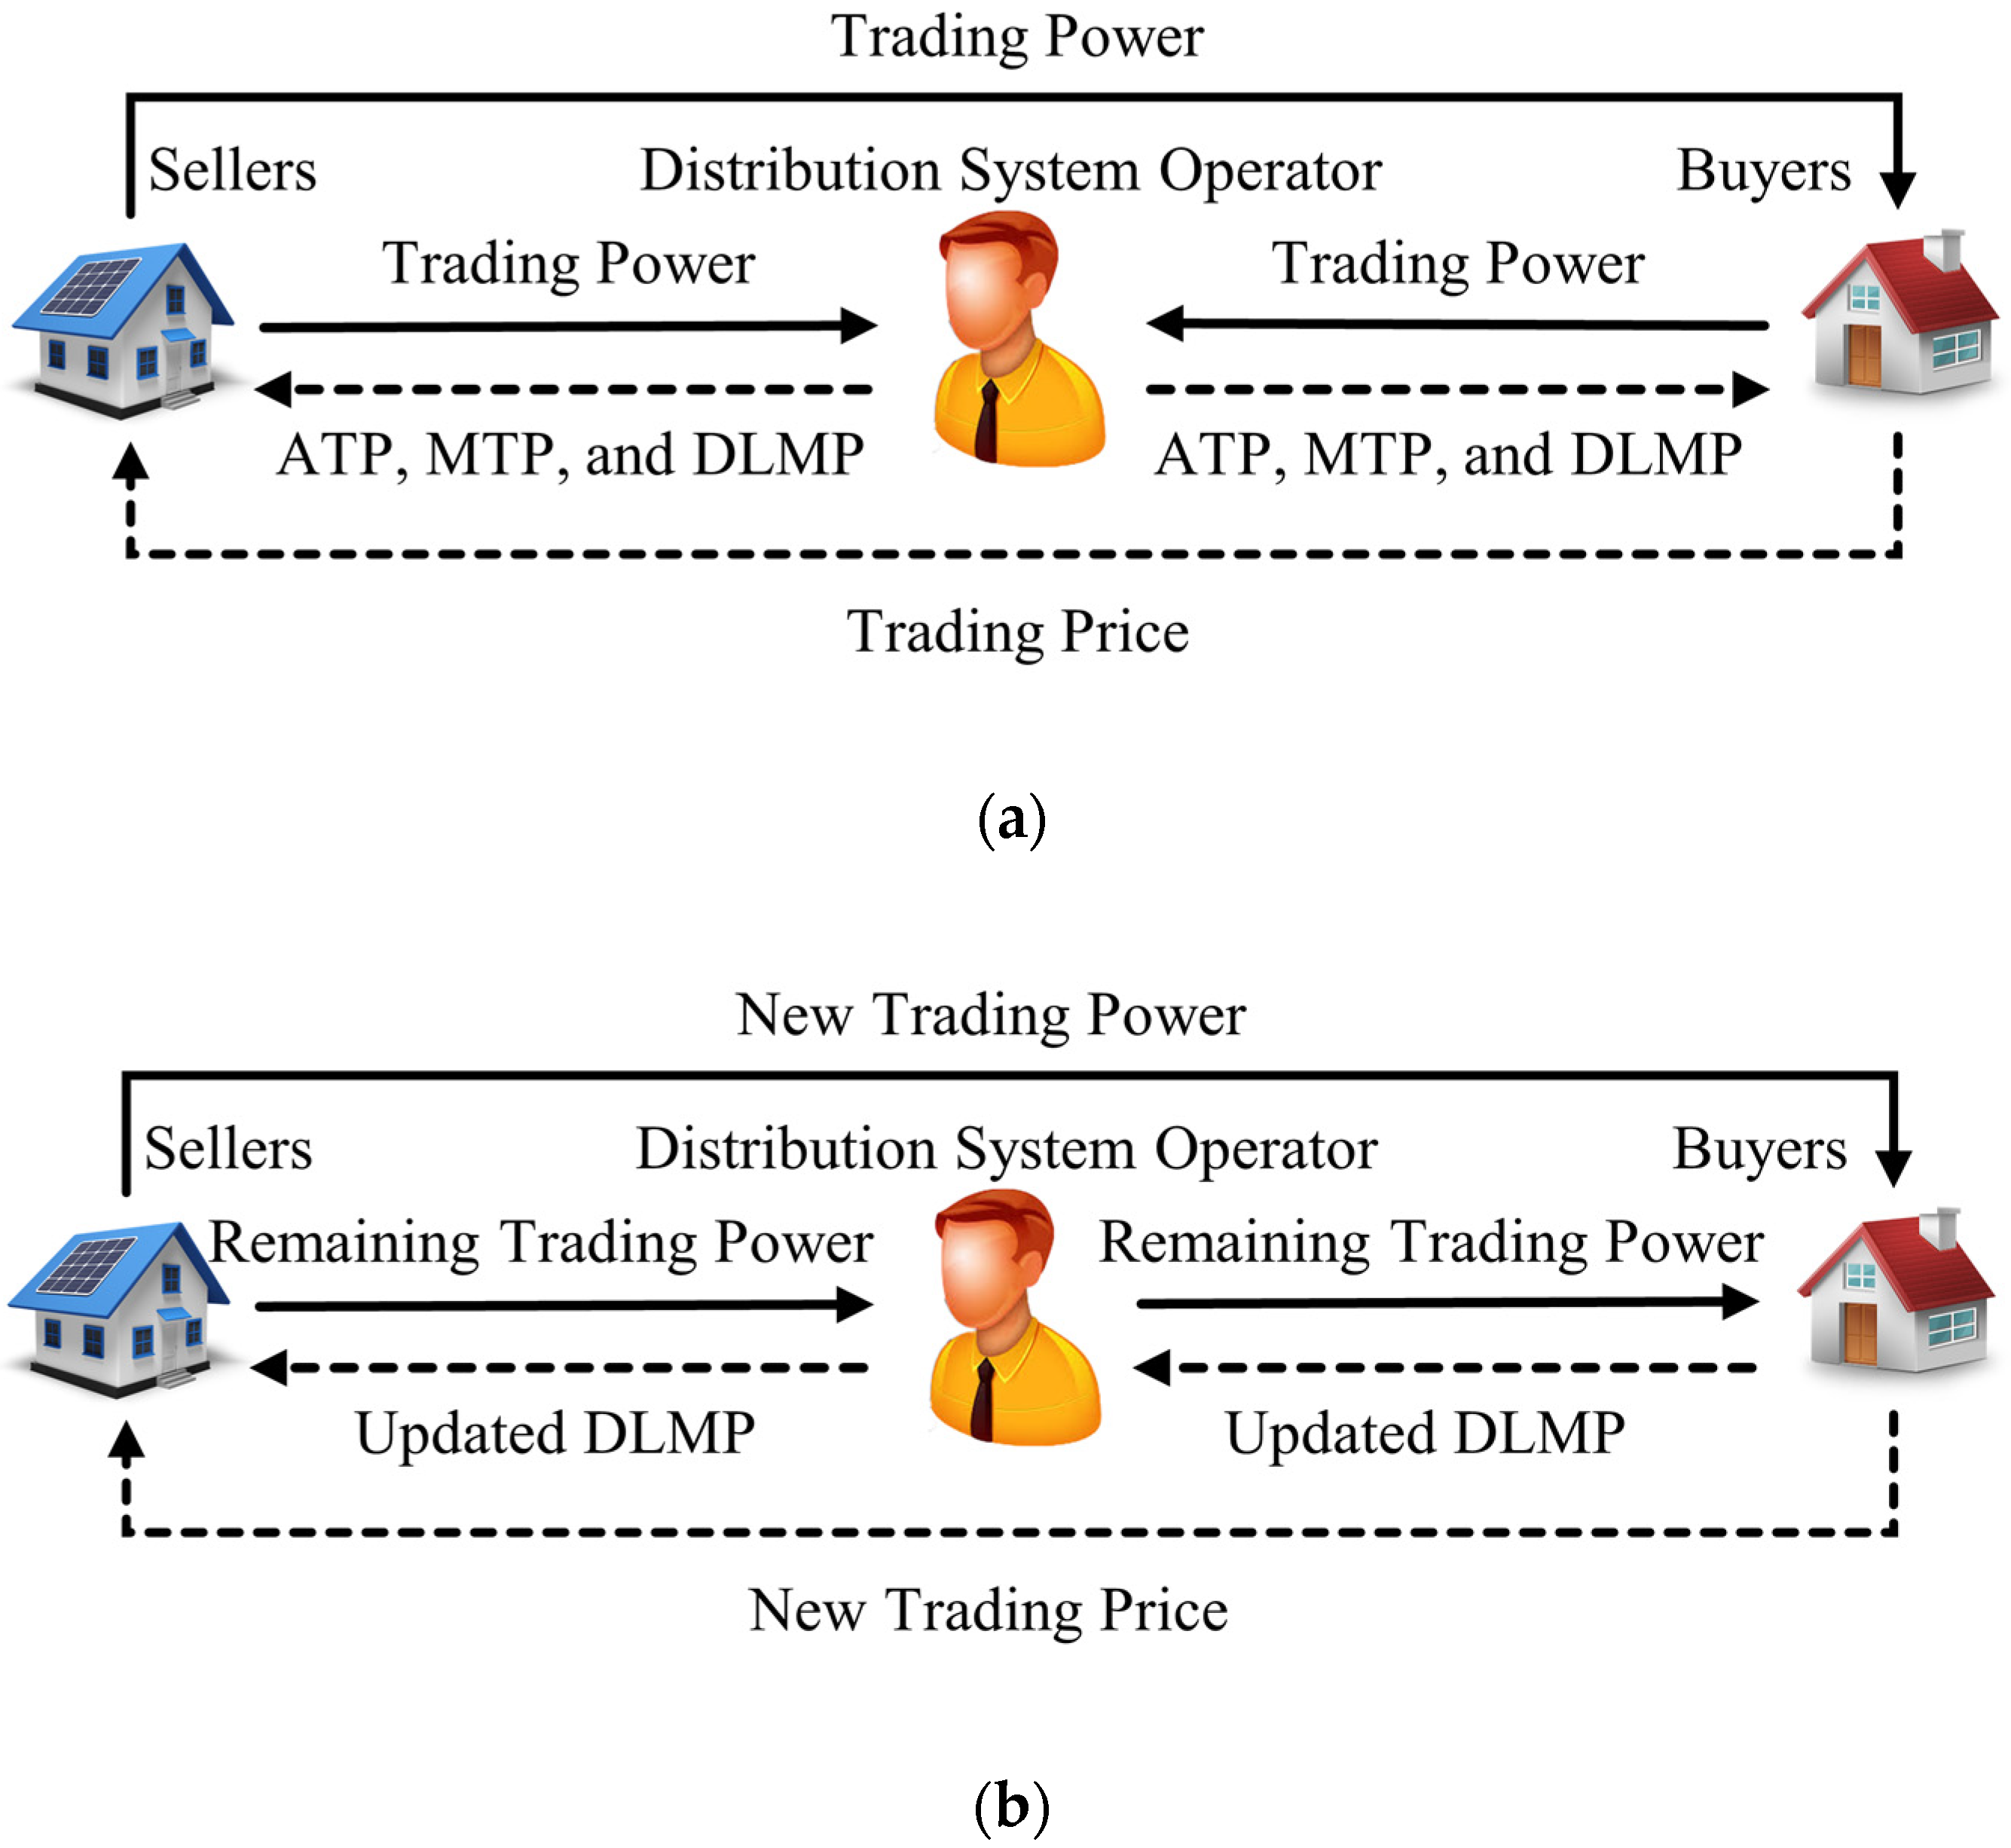
The operational framework of the proposed P2P energy trading market, as shown in Figure 1, aligns seamlessly with the traditional energy trading market operations of the DSO, ensuring a comprehensive assessment of potential network constraint violations. Furthermore, the P2P energy trading market allows for dynamic rematching between sellers and buyers, especially in transactions involving NUCs.
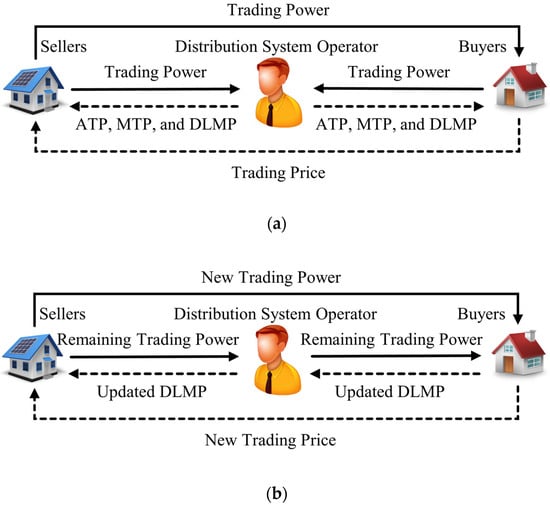
Figure 1.
Procedures for operating the P2P energy market: (a) energy trading between sellers and buyers during bidding periods on the P2P energy market and (b) energy trading between sellers and buyers during power exchange periods on the P2P energy market and the DSO’s traditional energy market.
In Step 1, during bidding periods, sellers and buyers submit orders to a P2P energy trading platform. These orders specify the price at which they are willing to trade and the total power agreed on for trading at the specified price. The total power, submitted in Step 1, plays a dual role, serving not only within the P2P energy trading platform, but also within the DSO’s rechecking procedure in Step 2 to assess the impact on distribution system operations. Notably, to address the privacy concerns raised in previous papers regarding the data transferred by sellers and buyers to the DSO [29,30], this paper emphasizes preserving the privacy of price data by restricting the DSO’s access to this sensitive information.
Step 2, a critical stage of the procedure, involves meeting three key objectives. First, the DSO determines whether the total power is suitable for trading on the P2P energy trading market. This is achieved by assessing the technical impacts on distribution system operations, including the voltage and line capacity limits. If there are no network constraint violations, the DSO notifies sellers and buyers that their total power can be traded, indicating they have appropriate trading power (ATP). However, if network constraint violations are present, the total power must be adjusted in order to achieve ATP.
Second, suppose sellers and buyers on the P2P energy trading market have not completed their trades and intend to engage with the DSO. In such a case, the DSO is responsible for clearing the remaining trading power and determining the DLMPs at all buses in the distribution system. These DLMPs are used for trading energy among the remaining sellers and buyers to fulfill the DSO’s traditional energy trading market, which serves as a second energy market of the P2P energy trading market, similarly to [31,32]. The DLMPs represent the trading prices in the traditional energy trading market because they incorporate the outcomes of network constraints. Furthermore, because the DSO is assumed to be able to reserve the remaining power at the slack bus, the DLMPs are calculated as if the slack bus was the marginal bus, meaning it operates below its capacity. Due to the fact that the P2P energy trading market provides a more direct, flexible, and efficient approach to energy trading, the benefits for sellers and buyers on the P2P energy trading market are greater than on the DSO’s traditional energy trading market. Moreover, in the event that the P2P energy trading market is unable to complete the P2P energy transactions according to the total power submitted in Step 1 and the network constraints are not violated, the remaining total power, which lacks energy storage such as batteries, must flow into the distribution system. In such a case, it becomes necessary to engage in trading the remaining total power with the DSO. Consequently, the DSO’s traditional energy trading market is considered the secondary market, where sellers and buyers remaining from the P2P energy trading market are granted the opportunity to trade the remaining total power with the DSO.
Third, this paper proposes a method for ensuring that distribution system operations remain stable during the exchange of RTP among sellers and buyers. This involves maintaining voltage magnitudes within the acceptable limits and preventing power line flow from exceeding the equipment capacity. As a result, the DSO is tasked to calculate the allowable MTP and the corresponding DLMPs for sellers and buyers based on the submitted total power. In this case, the DLMPs are used when one or more sellers or buyers have injected or consumed RTP at the allowable MTP.
Following the determination of ATP, MTP, and DLMPs of sellers and buyers, the DSO returns all three sets of these values to the sellers and buyers on the P2P energy trading market. This facilitates a reconsideration of contract partners in Step 3. In this step, the submitted total power of sellers and buyers is converted to ATP, and DLMPs are used to calculate NUCs. The NUC calculation involves subtracting any two DLMPs of matched sellers and buyers to recover the DSO’s operational cost.
Lastly, Step 4 involves updating the DLMPs of sellers and buyers based on their RTP during power exchange periods. Because both the ATP and MTP are known, updating DLMPs via linear estimation becomes a more efficient process. The updated DLMPs affect both the DSO’s trading prices and the NUCs of sellers and buyers on the P2P energy trading market. Excess trading power is curtailed when the RTP exceeds the MTP, thereby mitigating the potential violation of network constraints. This process enables the DSO to save time because it eliminates the need for a power flow analysis during power exchange periods to assess the technical impacts on distribution system operations, thus contributing to the more realistic implementation of the P2P energy trading market.
5. Proposed Methodology
This section explains the interaction between sellers and buyers on a P2P energy market based on the seller’s profit and the buyer’s cost-saving maximization. Thereafter, it is detailed how the proposed method determines the MTP and the corresponding DLMPs of sellers and buyers using an iterative method and a graphical interpretation in conjunction with the fmincon MATLAB optimization toolbox solver (version R2022b). In recovering the DSO’s operational cost, the NUC derivation is finally justified. Each subsection of the proposed methodology is outlined in Figure 2.
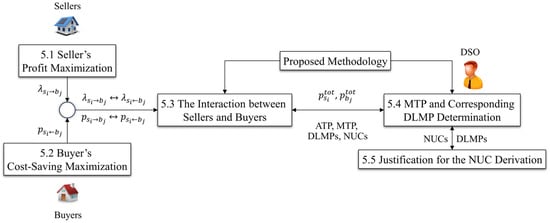
Figure 2.
Outline of the proposed methodology.
5.1. Seller’s Profit Maximization
On the P2P energy market, sellers who trade energy with buyers aim to maximize their profits. This paper defines profit as the difference between the total amount of money that sellers receive from trading energy at the agreed-upon price and the total amount of money that sellers trade their energy for at their willing-to-trade price. Consequently, according to this definition, the profit maximization of seller can be shown in (1).
subject to
where , and is the price at which the seller is willing to trade with buyers.
According to the objective function (1), the seller will make a profit from trading energy with the buyer on the P2P energy market if the trading price is set to be greater than the submitted price , including the NUC . After setting the trading price, the seller sends it to the buyer .
5.2. Buyer’s Cost-Saving Maximization
In an effort to maximize cost savings, once the buyer is aware of the trading price offered by the seller , i.e., setting to , the buyer gives priority to selecting the seller who offers the lowest trading price. Therefore, under the price at which the buyer is willing to trade energy on the P2P energy market, the maximization of cost savings is expressed as follows:
subject to
where , and is the price at which the buyer is willing to trade with sellers.
The objective function (5) demonstrates that the lowest trading price offered by the seller must be less than the submitted price at which the buyer is willing to trade, including the NUC ; otherwise, the cost savings of the buyer cannot be realized. After setting the trading power to the select seller , the buyer returns it to the seller .
5.3. The Interaction between Sellers and Buyers
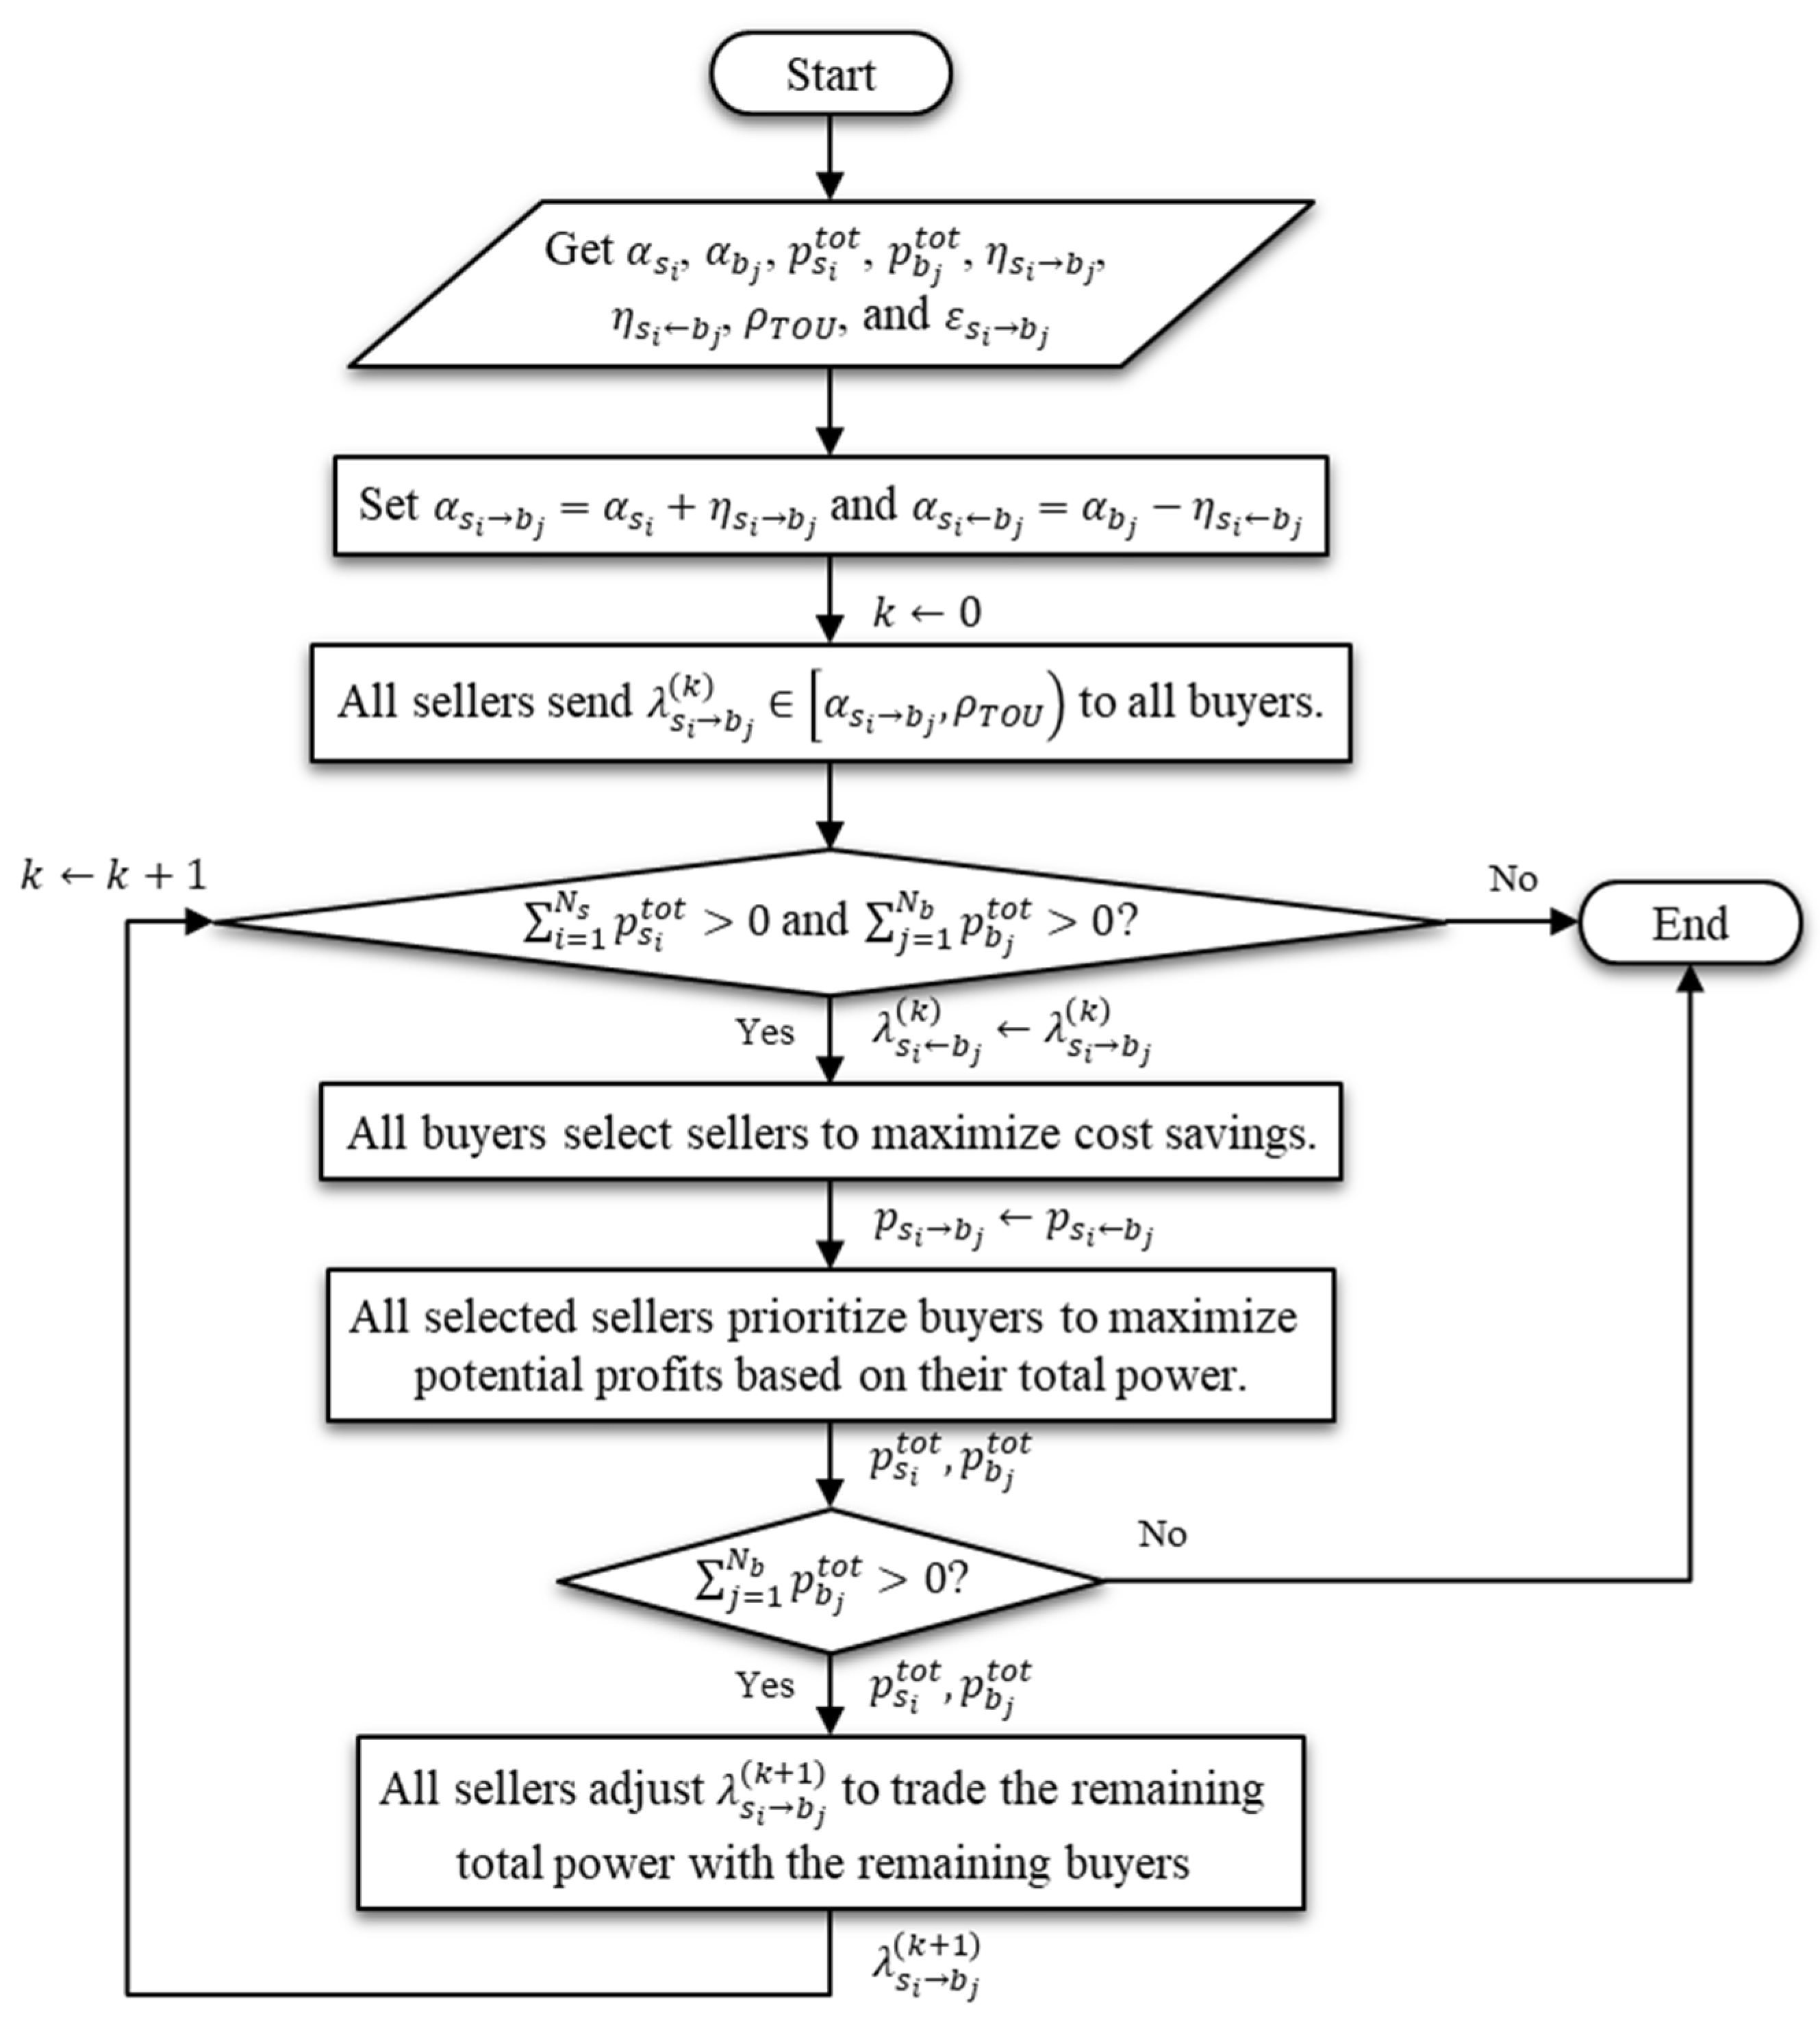
In order to solve the two problems involving profit maximization and cost-saving maximization in a decentralized manner, as depicted in Figure 3, this paper develops an algorithm for interactions between sellers and buyers. The algorithm uses a decentralized method of problem solving to align with the problem formulation. In other words, while direct problem-solving approaches are feasible, they are not appropriate for the current problem formulation. The algorithm, however, employs the perspective of direct optimization problem-solving in the interaction between sellers and buyers at each step. This algorithm design was based on two main reasons: (1) the complex nature of participant interactions and (2) the need for a transparent and easily understandable solution process that aligns with real-world decision-making processes. For example, after a buyer has chosen a seller, the sellers select the buyer who maximizes their benefits. Buyers, on the other hand, choose sellers who provide the greatest value in terms of cost savings. This problem-solving strategy is integrated into the algorithm to optimize the interaction between sellers and buyers, ensuring optimal outcomes for both parties. Because the method is decentralized, the responses are typically of a local optimal nature. Some buyers and sellers, on the other hand, may receive responses that are globally optimal for them. In this paper, sellers are designated as the price makers, directing the algorithm by offering trading prices to buyers who are designated as followers and respond with trading power. The fundamental concept of the P2P energy market allows sellers and buyers to contact each other directly for purposes of buying and selling, as well as to negotiate their submitted orders regarding both trading price and trading power, while maximizing the benefits for both the seller and the buyer. In order to achieve results that are consistent with the P2P concept, the market forces from governmental intervention are ignored.
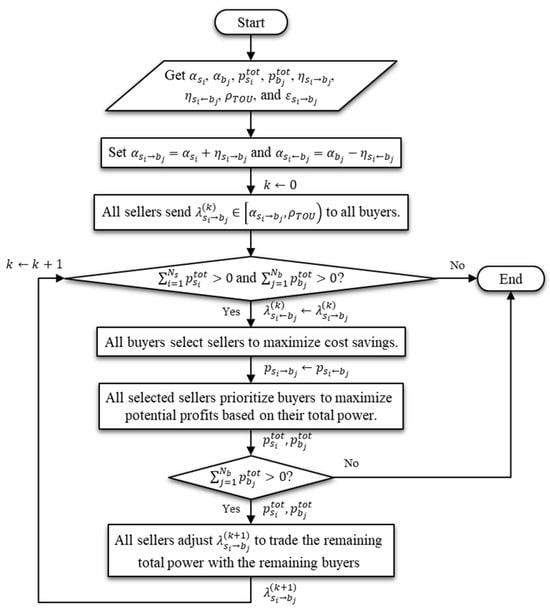
Figure 3.
Flowchart representing the algorithm for the interaction between sellers and buyers.
The P2P market rules used in this study require sellers to independently determine the offer prices for all participating buyers. This approach is similar to general commodity trading, in which sellers set prices prior to any transactions. It is worth noting that the sellers’ offer prices are not predetermined selections or matches with specific buyers. Buyers have the option to accept or reject these offers. As a result, the selection process gives buyers direct authority to select a seller. Following the selection, sellers can then submit new offer prices to buyers who have not yet made a decision, until the available electricity trading capacity is depleted.
Initially, the seller sends the buyer the trading price . According to the maximization of profits, the trading price is set above the price . However, it should not exceed the price at which the buyers buy energy from the DSO, such as the time-of-use (TOU) rate. When it exceeds the TOU rate, buyers typically return to trading energy with the DSO. Therefore, the price limits for trading between sellers and buyers are shown in (8). Because the TOU rate is set according to the time periods known to the buyer, as part of the basic electricity tariff used in purchasing electricity from the DSO, before considering the operational conditions of the distribution system, it is more appropriate for the buyer to utilize the TOU rate in submitting the trading price to the P2P energy trading platform for purchasing electricity from the seller. This remains true even within the scope of this research, where the operational conditions of the distribution system are considered alongside the electricity prices, potentially leading to the development of a DLMP based on the bus location to which the buyer is connected for purchasing electricity from the DSO.
where is the TOU rate.
As a response to receiving the trading prices from sellers, the buyers then select a seller. Based on the maximization of cost savings, the buyer will choose the seller who maximizes the value of the term , as depicted in Figure 4. In this case, the buyer agrees to trade with the seller by setting the total power to the trading power . In contrast, if a buyer does not choose a seller, the trading power is set to zero by the buyer. After the selection, the trading power of the buyers is returned to the chosen sellers.
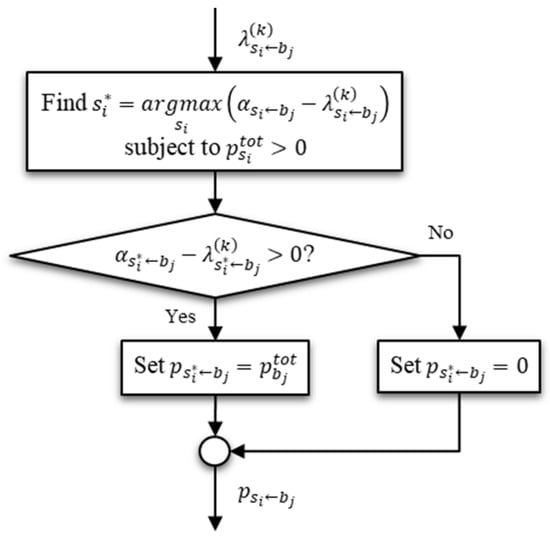
Figure 4.
Flowchart representing the algorithm for maximizing the cost savings of buyers.
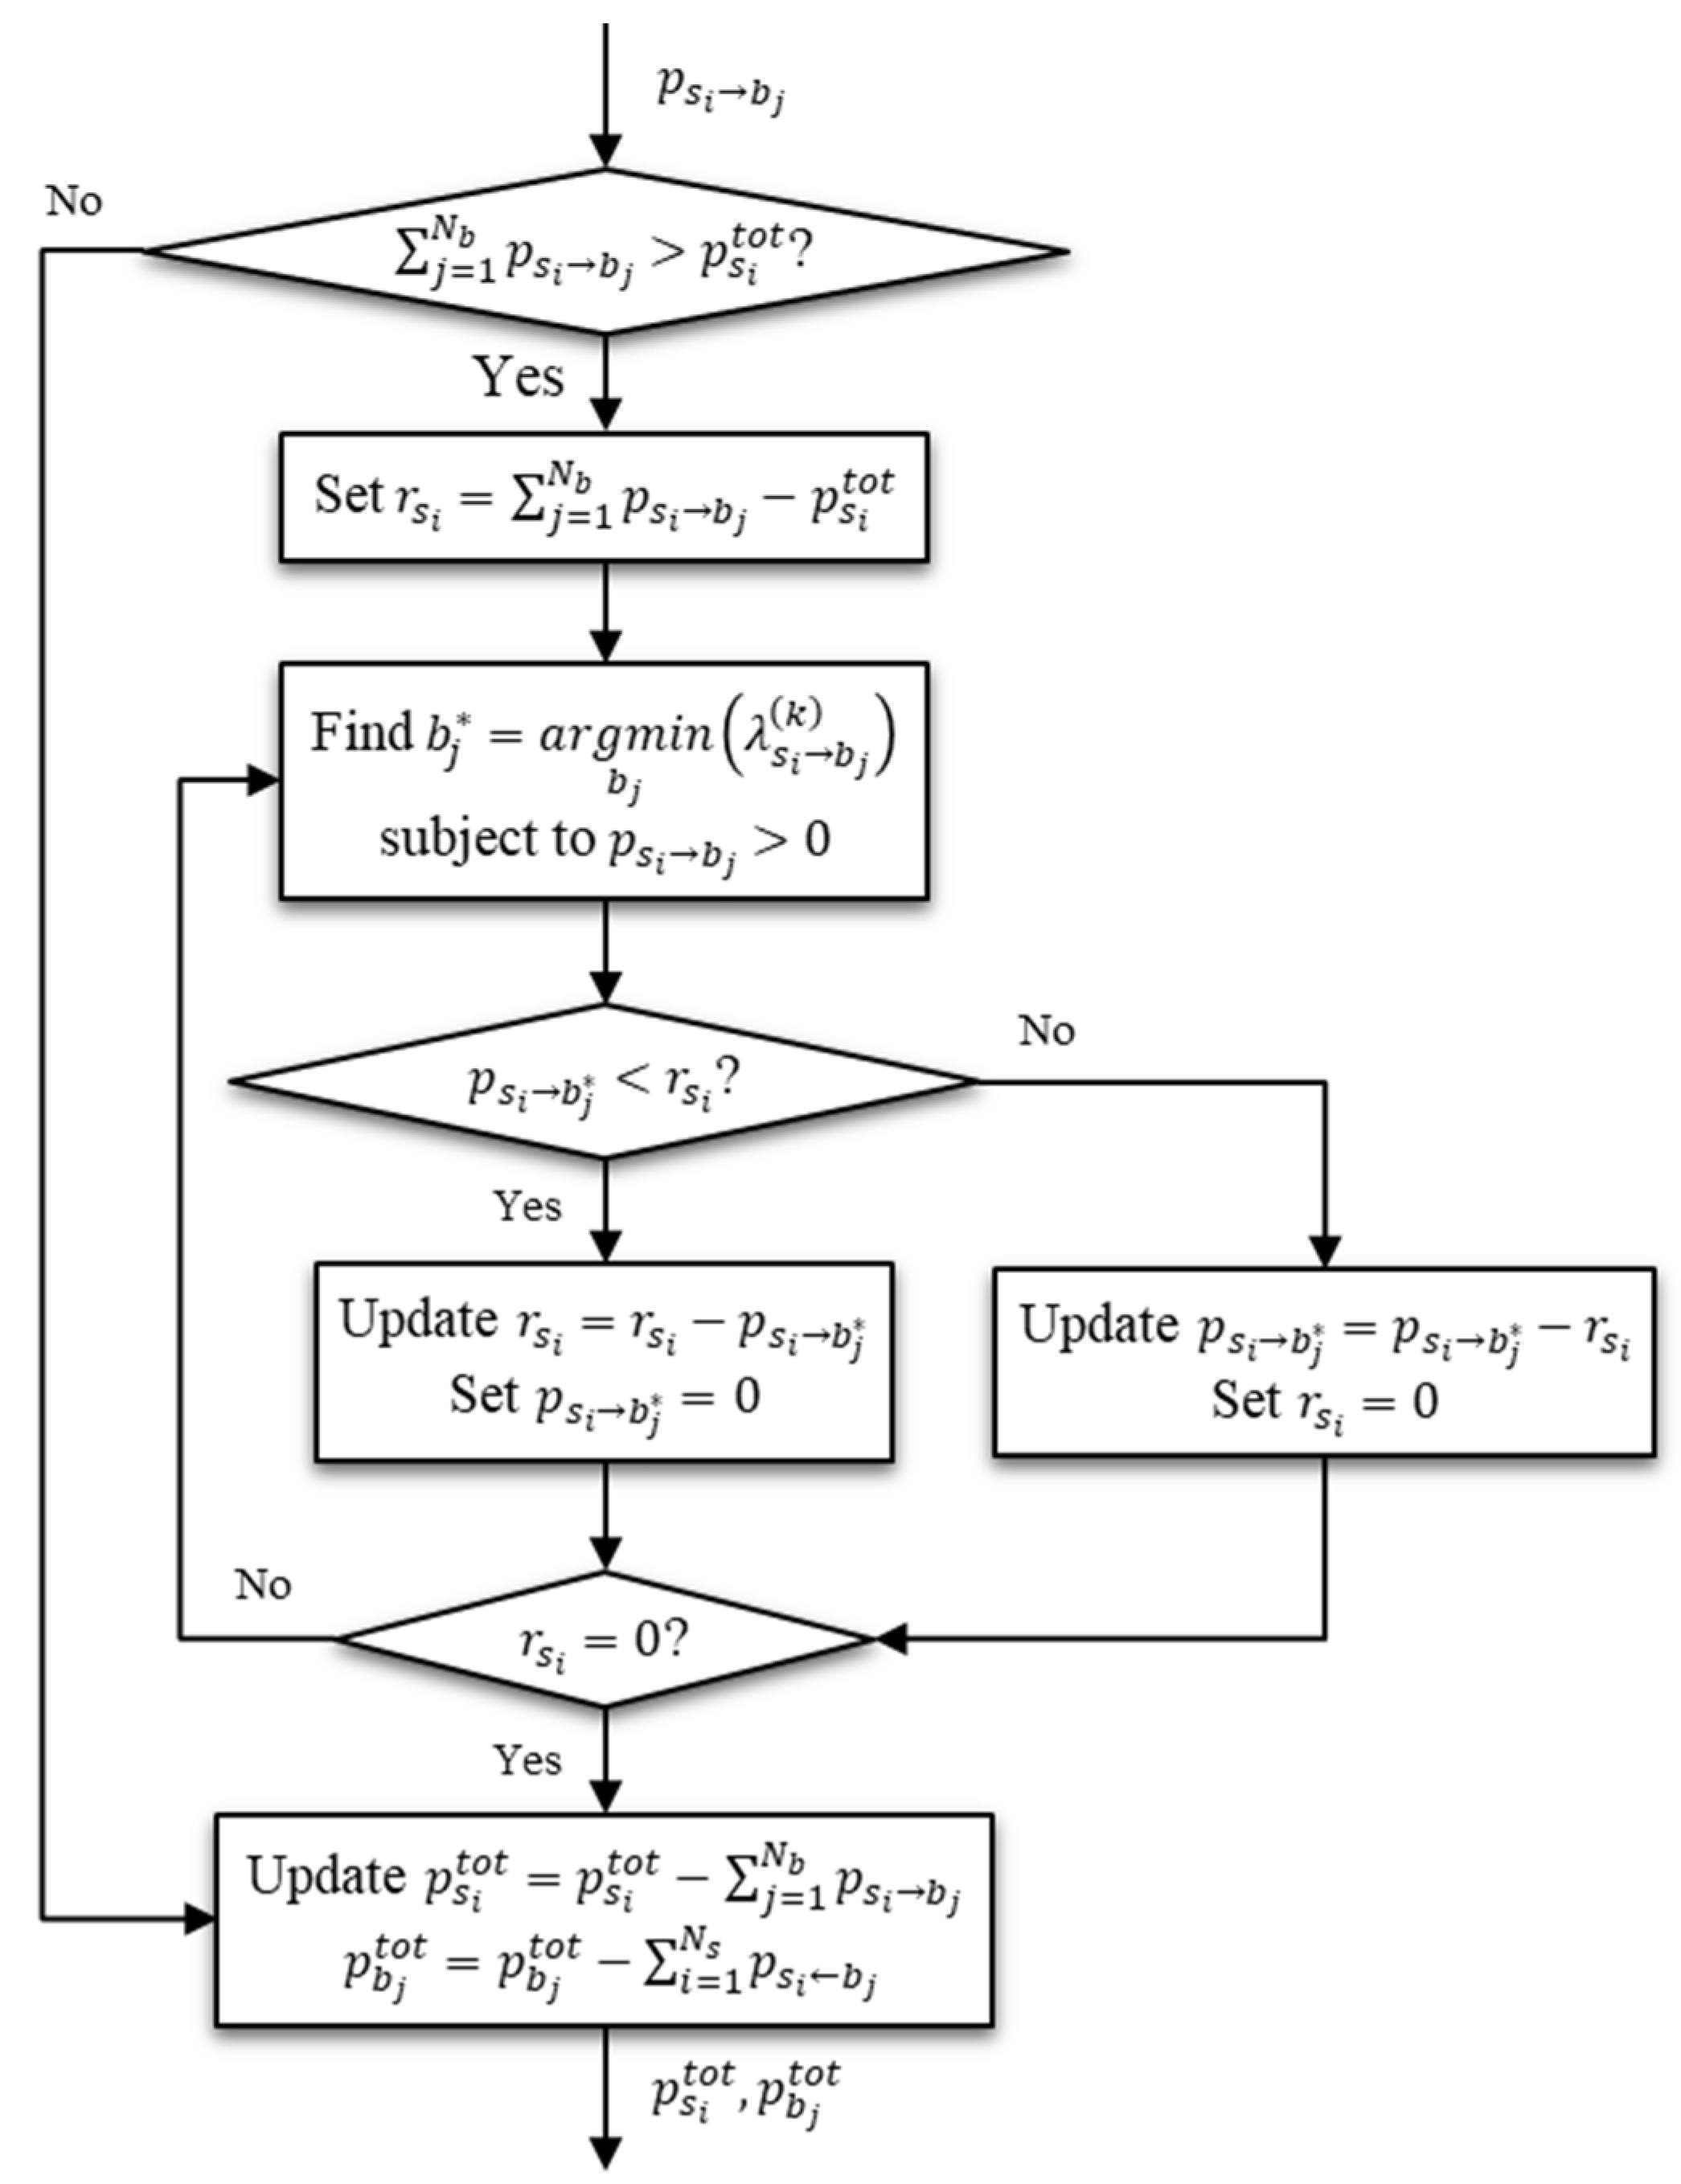
After sellers are chosen and informed of the trading power, they must determine whether their total power is sufficient to support the total amount of trading power, as depicted in Figure 5. If it is insufficient, the sellers will prioritize the buyers according to the criteria of maximum profit. By doing so, the trading power will be diminished by ranking the trading prices from low to high until the total trading power equals the total power owned by the sellers. In contrast, if there is a sufficient supply of trading power, the sellers will sell it to any buyer who chooses them. Finally, the sellers will update the remaining total power and inform the buyers to do the same.
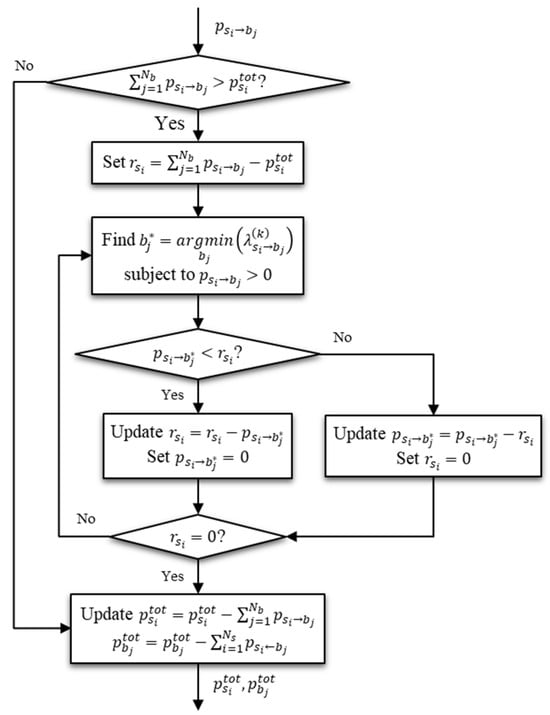
Figure 5.
Flowchart representing the algorithm for determining whether the total power of sellers is sufficient to support the total trading power.
If there are still buyers remaining after updating the total power, the remaining sellers will have the opportunity to negotiate with these buyers for the remaining trading power. This negotiation occurs when the sellers can still achieve the highest possible profit, as illustrated in Figure 6. Occasionally, the sellers may not be selected because their trading price is not sufficiently competitive and appealing. Consequently, they may adjust the trading price based on the remaining total power, as shown in (9), or at least sell the trading power at the lowest price they are willing to trade, i.e., at the price .
where is a relatively small positive value and is the trading price at any iteration .
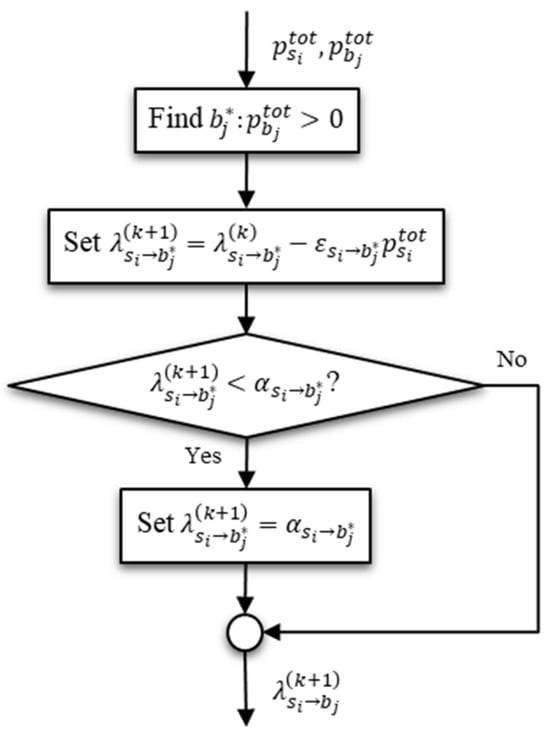
Figure 6.
Flowchart representing the algorithm for negotiating with the buyers regarding the remaining trading power.
Following the conclusion of negotiations, the remaining sellers and buyers continue trading energy until the total power of either party depletes, whether that be an individual depletion or simultaneously. When all of the electricity has been traded, that round of trading on the P2P energy market will conclude.
Finally, if there is no available seller or buyer, untraded sellers or buyers can choose whether to trade energy in the following round on the P2P energy market or on the DSO’s traditional energy market.
5.4. MTP and Corresponding DLMP Determination
The DSO is tasked with assessing the technical impacts on the operations of a distribution system, including the amount of power loss in the distribution system. The total power submitted by sellers and buyers is the only basic data used in the impact evaluation. The goal is to determine whether or not the total power is appropriate for the operations of the distribution system.
Furthermore, due to intermittent sources, such as solar PV systems, the DSO must ensure that the RTP of sellers and buyers does not violate network constraints during power exchange periods. Little research has been conducted to ensure that network constraints are not violated during power exchange periods. Therefore, this paper proposes assigning the DSO to determine the MTP of sellers and buyers, which helps identify the possible total power error levels. This saves the DSO time when evaluating the technical impacts of the power flow in the distribution system.
In the final sequence, the DSO calculates the DLMPs in the event that sellers and buyers sell and buy the MTP with the DSO. These DLMPs are then used to determine NUCs when sellers and buyers trade the MTP to recoup the DSO’s operational cost.
The optimization problem, as shown in (10), is formulated to calculate the MTP and corresponding DLMP of sellers and buyers as follows:
subject to
where is assumed to be the slack bus, and are constant, and is the price at which the DSO is willing to trade power with sellers (if : buy-back rate (BBR)) and buyers (if ) at the slack bus [33,34].
In optimization problem (10), the relationship between nodes and energy trading is expressed in (11) and (20) for sellers, and (12) and (21) for buyers. Specifically, if the seller connects to bus and submits the trading power equal to , then for . Conversely, if the buyer connects to the bus and submits the trading power equal to , then for .
In this paper, the equality constraints (13) and (16) represent the bus active power and reactive power at bus , where neither a seller nor a buyer connects. This type of bus is called an intermediate bus. For this reason, they can be written as for and for , respectively. As for the equality constraints (14) and (15), they refer to the bus reactive power at bus , where either a seller or a buyer connects. In this research, it is assumed that both sellers and buyers do not engage in transactions involving reactive power, and the power factors in the form of the power angles and for each seller and buyer are assumed to be constant. Specifically, the seller can either supply or absorb reactive power from the distribution system, whereas the buyer can only absorb reactive power. With the relationship , they can be written as for and for , respectively.
The decision variables of the optimization problem (10) are the scaling factors and , as well as the voltage angles and magnitudes. The MTP of sellers and buyers can be determined by evaluating how much maximum power generation and load consumption can be injected into and consumed from the distribution system without violating the network constraints. The maximum scaling factors that do not cause the distribution system to violate the network constraints are referred to as the limits of the scaling factors and . For this reason, multiplying the limits of the scaling factors by the total power of the sellers and buyers represents the MTP.
The MTP is calculated separately and not incorporated directly in the seller/buyer optimization problems (1) and (5). This would require considering the two following cases: (1) when the MTP is greater than the total power of participants, and , and (2) when the MTP is less than the total power of participants. In the first case, where the MTP is greater, the total trading power of participants and cannot exceed their MTP, so adding the MTP as a constraint would have no effect on the solutions. Conversely, in the second case, where the MTP is less, the total trading power of participants can be, at most, equal to the MTP, significantly impacting the solutions. However, analyzing the solutions would be straightforward because the objective function is linear in the variables of trading power and . For example, the trading power of participants could be proportionally reduced until the total trading power equals the MTP. Adding the MTP as a constraint would therefore limit the ability of participants to optimize their benefits.
The dual variables or Lagrange multipliers corresponding to the equality constraints (11) and (12) represent the DLMPs corresponding to the MTP of sellers and buyers, respectively [35,36]. Solving the optimization problem using all of the decision variables and the Lagrange multipliers concurrently could take a considerable amount of time. Consequently, this paper divides the process of solving the optimization problem into two steps: first, determining the limits of the scaling factors along with the voltage angles and magnitudes, then substituting them into the optimization problem in order to determine the Lagrange multipliers.
A proposed algorithm for determining the MTP of sellers and buyers Is depicted in Figure 7. First, a parameter is created, which is a ratio between the scaling factors and , as shown in (24).
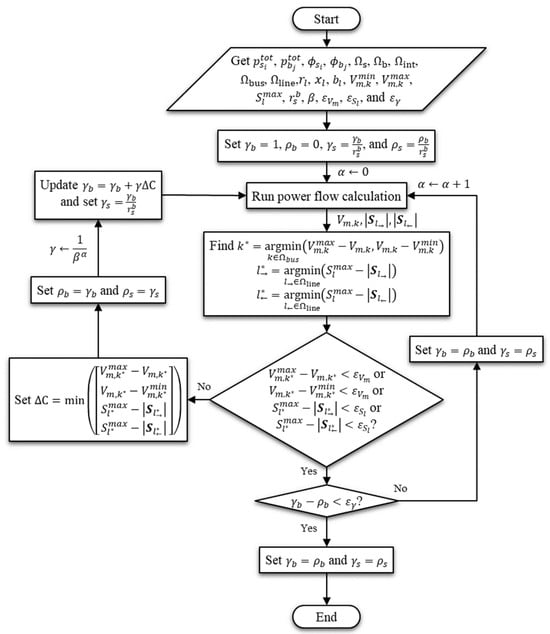
Figure 7.
Flowchart representing the algorithm for determining the MTP of sellers and buyers on the P2P energy market.
Following this, the parameter is given a value greater than zero. The scaling factor is set to 1, and the scaling factor is set in accordance with (24). After determining a set of the initial values, a power flow analysis is performed to examine the voltage magnitudes at all buses and the apparent power flowing through all distribution lines. If all of the values are within acceptable ranges, the scaling factors and are updated.
The updated scaling factors are converted to the total power of sellers and buyers. Then, the power flow analysis is repeated to ensure that all voltage magnitudes and line apparent powers are within the acceptable ranges. When one of the values examined in the power flow analysis falls outside of the ranges, the iteration for updating the scaling factors terminates.
Since the updated scaling factors at the final iteration are meaningless, the scaling factors before the final iteration are used to increase the searching order to obtain more accurate answers. The higher the order, the more precise the answer, but the longer it takes to calculate. The difference between the updated scaling factor at the final iteration and the previous iteration indicates the correct answers. It must be sufficiently small.
In this paper, sellers receive the same scaling factor , and buyers receive the same scaling factor . This is performed in order to achieve equality in terms of the amount of power used in trading, i.e., not to depend on the bus location of sellers and buyers in the distribution system. Furthermore, the parameter is evaluated for a variety of values, such as from 1 to 7, in the study of the network constraints, the voltage and line capacity limits. The scaling factors and are determined using traditional methods, as demonstrated in [9,26]. However, these scaling factors may lack practical accuracy, especially when considering the uncertainty associated with PV generation and load consumption. To address this issue, this paper provides a more practical and accurate method of determining the MTP of sellers and buyers on P2P energy trading markets. This proposed method involves plotting the scaling factors against the parameter on a graph, thus allowing the determination of the limits of the scaling factors and of sellers and buyers, respectively. This ensures that none of the network constraints are violated during power exchange periods. Because the proposed algorithm employs an iterative method and displays results for each iteration via graph plotting, it aims to analyze trends and identify patterns in the most suitable solutions. It is acknowledged that each iteration may or may not result in a solution. Using the graph plotting method, on the other hand, has advantages in studying emerging patterns. The advantages of studying the emerging patterns, which are used in this paper, include trend predictions and decision-making adjustments.
After the scaling factors, the voltage angles, and magnitudes are obtained, the corresponding DLMPs can be determined by substituting the scaling factors as well as the voltage angles and magnitudes into the constraints and solving the optimization problem (10). Because the optimization problem belongs to the multivariable nonlinear programming problem, it can be solved in MATLAB with the fmincon optimization toolbox solver (version R2022b). This step takes less time because the decision variables are already known. The corresponding DLMPs of sellers and buyers can be expressed as in (25) and (26), respectively.
As illustrated in (25) and (26), the DLMPs of sellers and buyers are calculated as changes in power loss, voltage magnitude, and line apparent power with respect to the power injected or consumed at the same bus. The results of DLMPs are similar to [37].
The strength point of the proposed method is that the DLMPs of sellers and buyers can be simplified when the limits of the scaling factors are applied because the voltage and line capacity limits are not violated, i.e., , , , and are zero. If this is the case, the expressions of the DLMPs of sellers and buyers can be written as shown in (27) and (28).
When it comes to power exchange periods, the DLMPs and corresponding to the ATP and and the DLMPs and corresponding to the MTP and are used to estimate the DLMPs and corresponding to the RTP and using linear estimation, as shown in (29) and (30).
The calculation of the DLMPs corresponding to the RTP saves the DSO time during the exchange of trading power because sellers and buyers can calculate their own DLMPs based on the RTP. In addition, their RTP must be less than their MTP; otherwise, distribution system failure is probable.
5.5. Justification for the NUC Derivation
When power exchange periods have been reached, the DLMPs of sellers and buyers are updated using (29) and (30), respectively. The updated DLMPs are then used to calculate the NUCs to recoup the DSO’s operational cost for distribution line usage. If network constraints are not violated, the DSO’s operational cost is typically represented as a change in power loss. Multiplying the power loss by can calculate the DSO’s operational cost across all distribution line usages. It can be linearly estimated as follows:
where represents the amount of power loss in the distribution system before the opening of the P2P energy market and represents the amount of power loss after the opening of the P2P energy market. The partial derivative is equivalent to the loss sensitivity factors [38].
The DSO’s operational cost is calculated in (32) to show that the additional cost for power loss compensation paid by the DSO equals the difference between the DLMPs of sellers and buyers. As a result, the DLMP difference can be denoted by the NUCs. Although the negative difference reduces the DSO’s operational cost, the DSO should pay those who can reduce power loss in the distribution system.
As aforementioned, this paper uses the absolute value of the DLMP difference to estimate the NUCs of sellers and buyers, as illustrated in (33).
6. Results and Discussion
This section demonstrates the simulation results based on the procedures for operating the P2P energy market. The results include the determination of the ATP, MTP, and corresponding DLMPs of sellers and buyers on the P2P energy market based on the total power of sellers and buyers, and the effectiveness of the proposed method, ensuring that exchanging the RTP between sellers and buyers during power exchange periods does not violate the network constraints.
6.1. Simulation Data
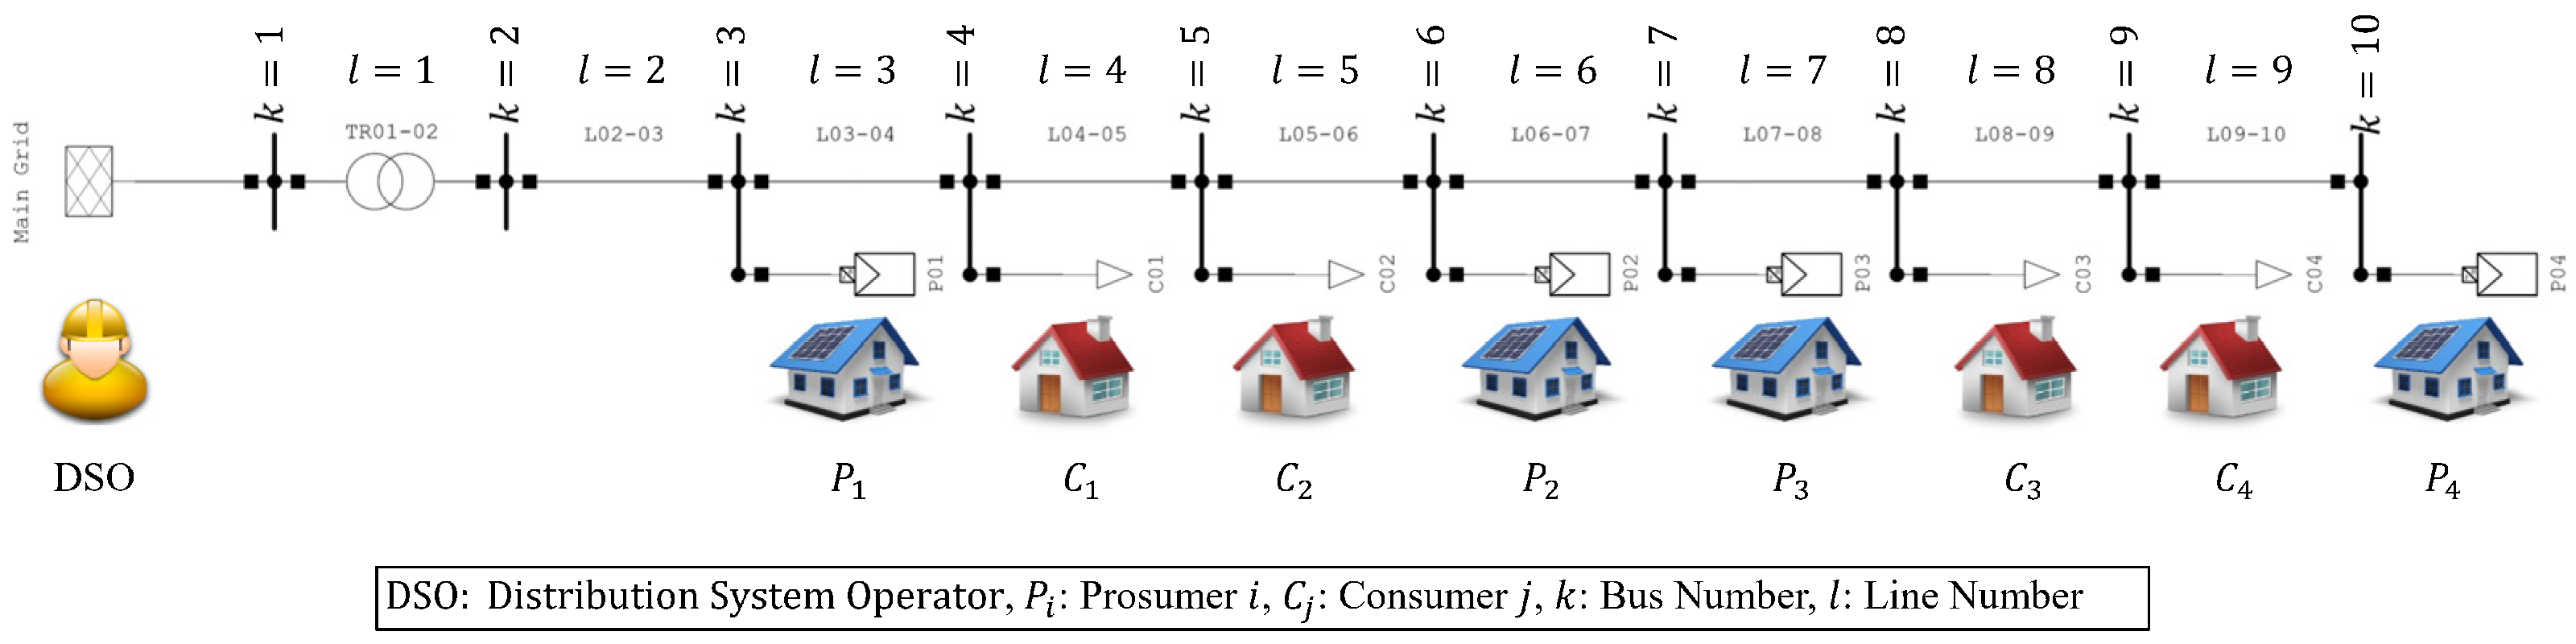
The simulation is performed on typical Thai 400 V radial distribution system with four prosumers and four consumers, as shown in Figure 8. The Metropolitan Electricity Authority (MEA) of Thailand assisted with the distribution system data [39].
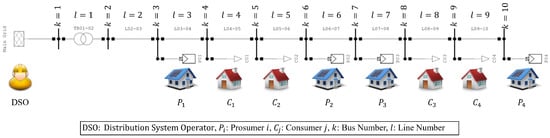
Figure 8.
Thailand’s typical radial 400 V distribution system.
The standard network constraint criteria for the simulation are as follows: the voltage angle and magnitude at the slack bus and are set to 0 deg and 400 V; the minimum and maximum voltage magnitudes and are 371 V and 410 V for all buses ; the capacity of a transformer is 150 kVA; and the capacity of each distribution line is 76.21 kVA. The trading prices and at which the DSO is willing to trade energy with the remaining sellers and buyers on the traditional energy market are 2.20 THB/kWh and 5.80 THB/kWh, respectively. These technical data relating to the distribution system are used in determining the MTP and DLMPs.
Furthermore, to demonstrate the effectiveness of the proposed method, this paper only considers one trading period, which includes the bidding and power exchange periods. The data submitted by sellers and buyers to a P2PETP are listed in Table 1. Based on the simulation data and the proposed algorithm, all the simulations are conducted in the MATLAB R2022b environment with an Intel Core i7-10510U CPU @1.80 GHz and 16 GB RAM.

Table 1.
Data of prices and total power of sellers and buyers.
6.2. Determination of ATP, MTP, and DLMPs of Sellers and Buyers
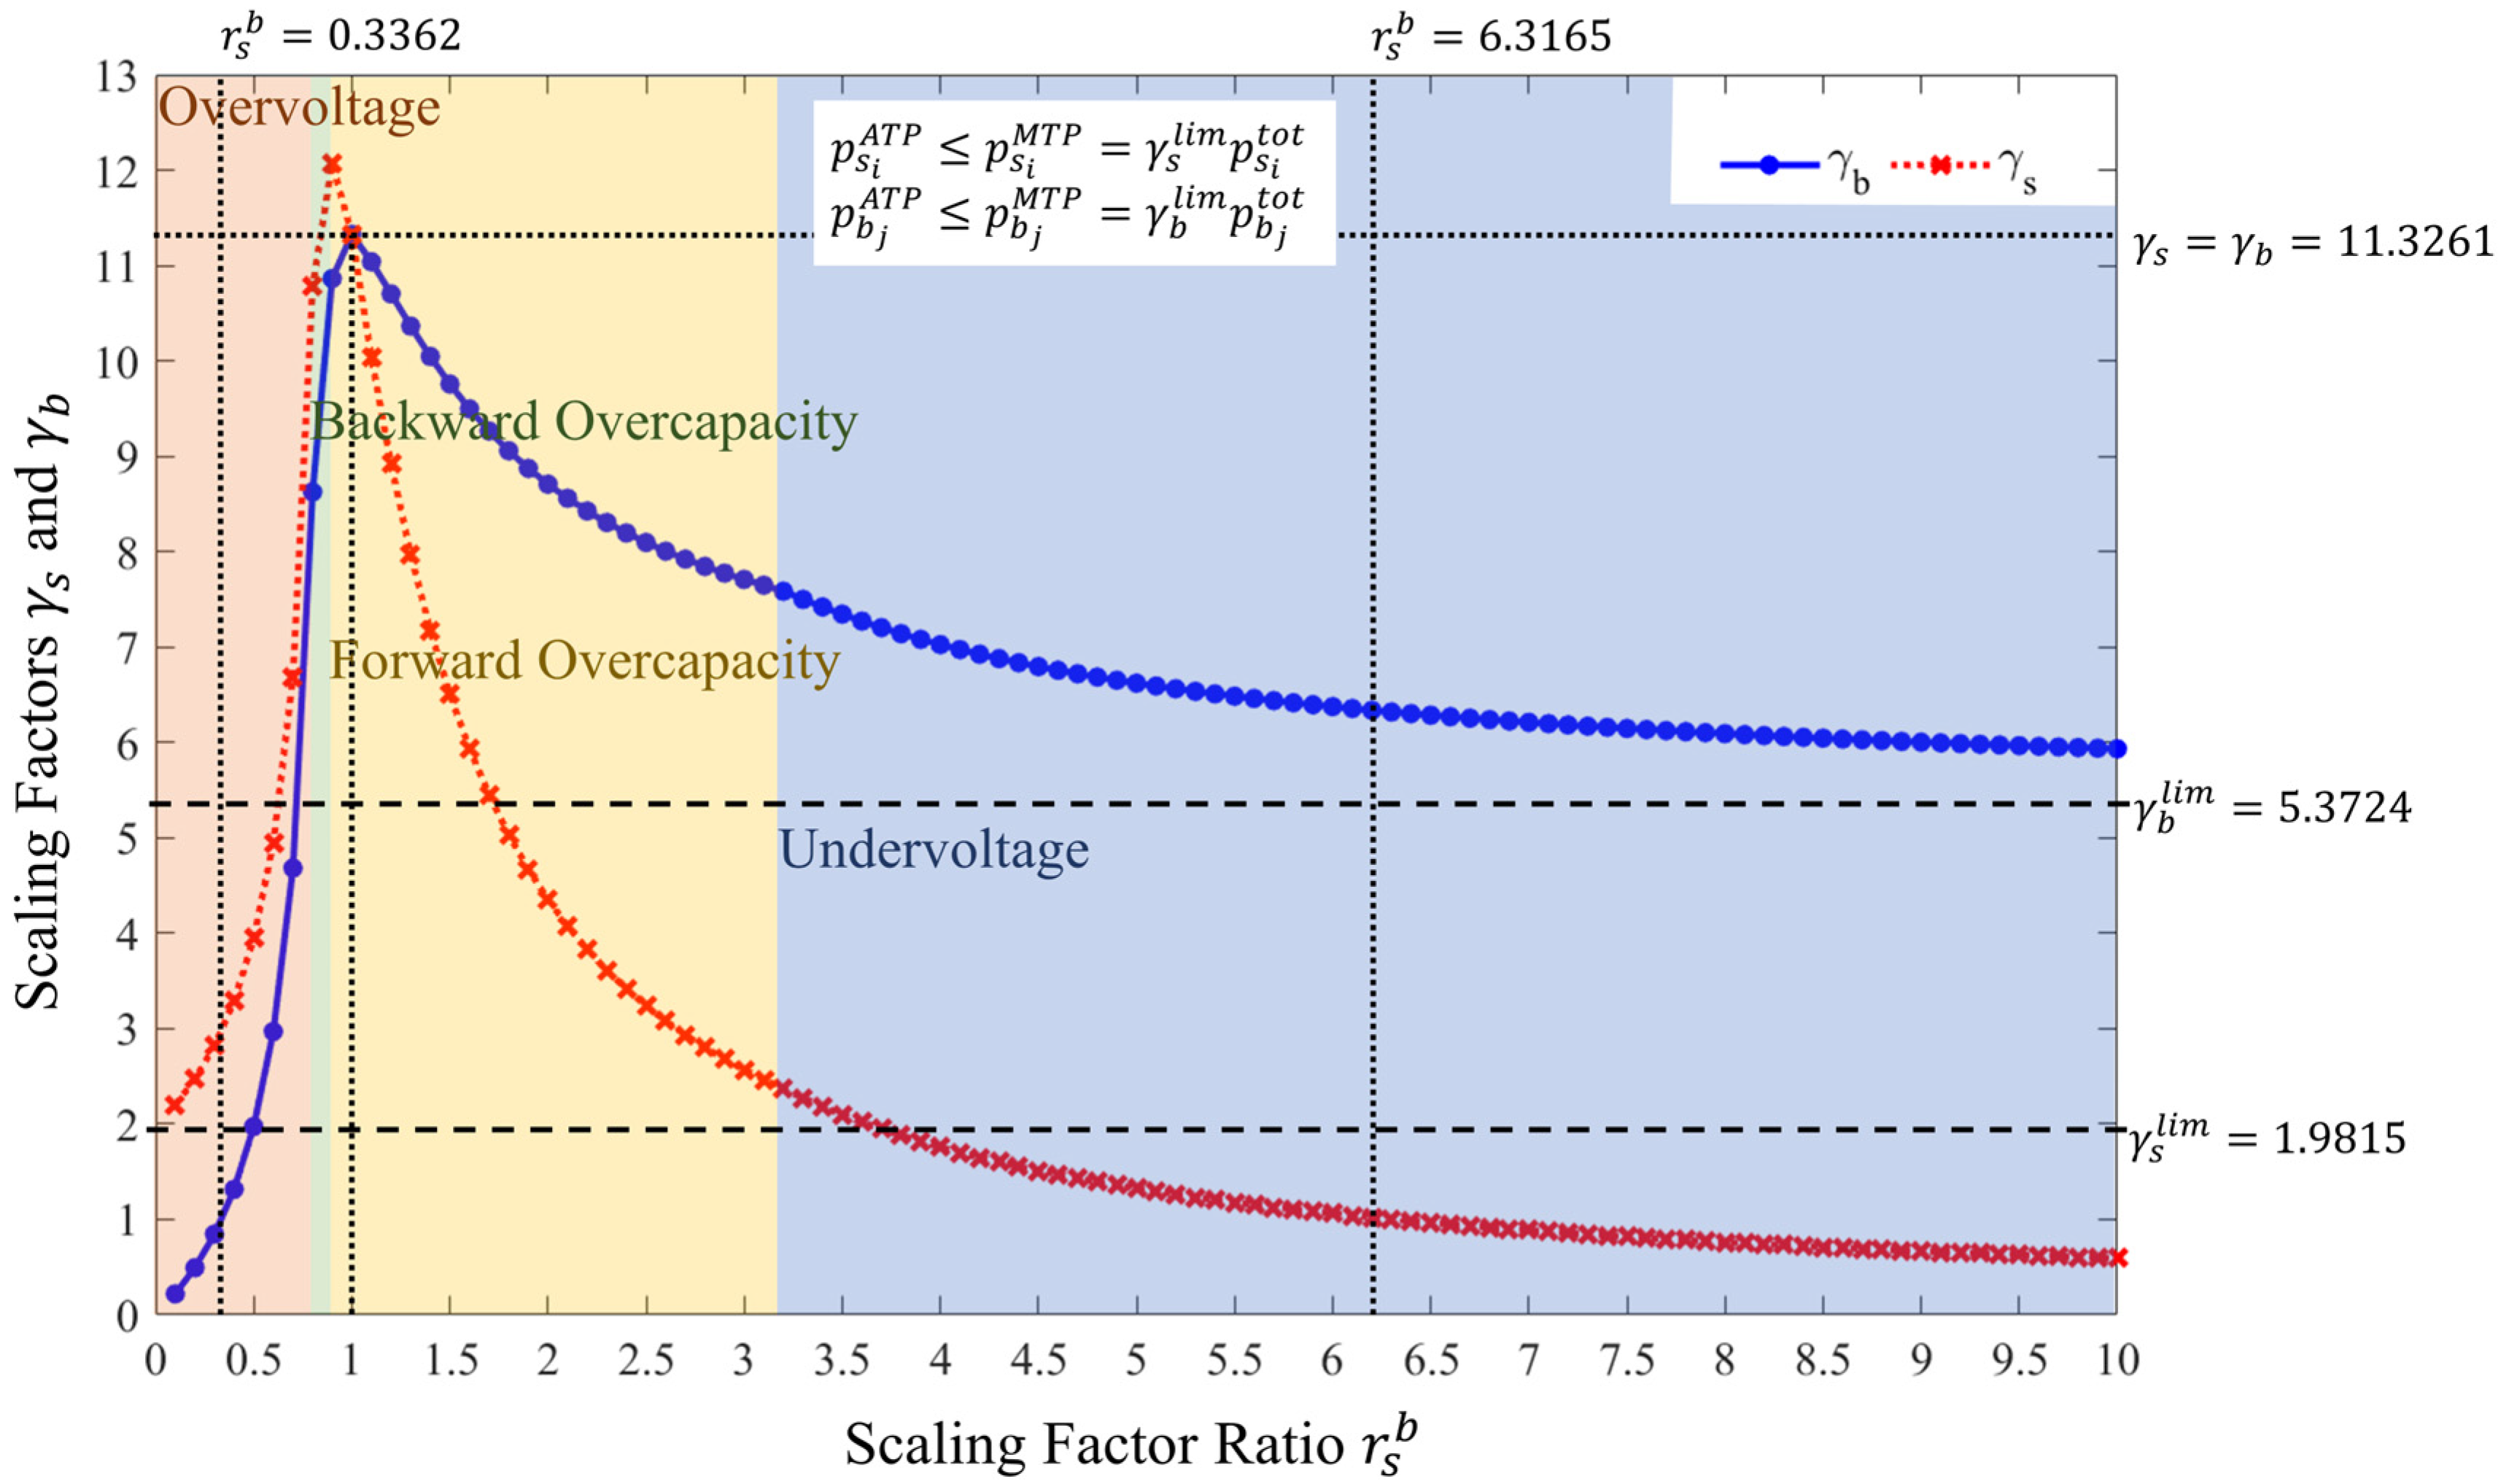
To compute the allowable MTP via the determination of the scaling factors and of sellers and buyers, the deterioration rate is set to 10, the stopping criteria for bus voltage magnitudes and line apparent power and are set to 10−10, the stopping criteria for scaling factors are set to 10−6, and the scaling factor ratio is considered in the range of 0–10. The results of the scaling factors are shown in Figure 9.
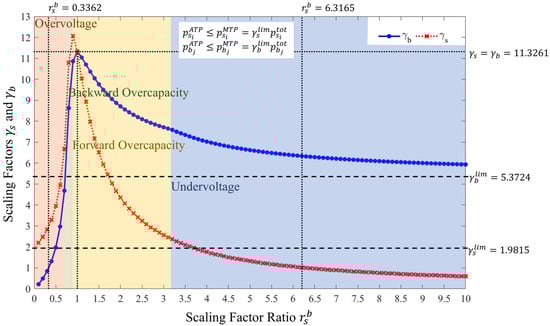
Figure 9.
Graphical interpretation: The scaling factors and versus the scaling factor ratio to determine the allowable MTP. In this representation, the following color-coded associations are used: “red” represents “overvoltage”, “green” represents “backward overcapacity”, “yellow” represents “forward overcapacity”, and “blue” represents “undervoltage”.
According to the results, the scaling factors at a given scaling factor ratio indicate the extent to which trading power can be increased or decreased without violating the network constraints. Furthermore, they demonstrate a proclivity for technical impacts on distribution system operations when the trading power of sellers is greater than and the trading power of buyers is less than the total power multiplied by their respective scaling factors, or vice versa. This is the proposed study on the voltage and line capacity limits that lead to the prevention of network constraint violations during power exchange periods.
At the scaling factor ratio of 0.3362, the scaling factor of sellers is 2.9742, and that of buyers is 1. This indicates that if the total power of buyers during power exchange periods does not change, the total power of sellers during power exchange periods can change by up to 2.9742 times their total power during bidding periods. In other words, the overvoltage impact occurs when one or more buyers consume less power than their total power, or when one or more sellers generate more than 2.9742 times their total power.
At the scaling factor ratio of 6.3165, the scaling factor of sellers is 1, and that of buyers is 6.3165. At this ratio, the undervoltage impact can occur when one or more buyers consume more power than 6.3165 times their total power, or when one or more sellers generate less power than their total power. Furthermore, this indicates that if the total power of sellers during power exchange periods does not change, the total power of buyers during power exchange periods can change by up to 6.3165 times their total power during bidding periods.
At the scaling factor ratio of 1, the scaling factors of sellers and buyers are identical and equal to 11.3261. This indicates that, during power exchange periods, sellers and buyers can trade no more than 11.3261 times their total power; otherwise, the line capacity limit in the forward direction () would be exceeded. This circumstance implies that the line capacity limit in the forward direction will likely be exceeded if the trading power of sellers and buyers increases by the same scaling factor. When the scaling factors of sellers and buyers are both high, but the scaling factor of sellers is greater than that of buyers, the line capacity limit in the backward direction () may be exceeded more frequently than in the forward direction. Nevertheless, the simulation results indicate that the probability of exceeding the line capacity limit in the backward direction is lower than in the forward direction. In terms of Figure 9, this is a comparison between the green and yellow shaded areas.
To avoid network constraint violations during power exchange periods, the limits of the scaling factors and of sellers and buyers are determined. Since the total power of sellers and buyers could be zero due to uncertainty, the zero scaling factors are highlighted. It can be seen that the scaling factor of sellers approaches 1.9815 as the scaling factor ratio approaches zero. In this case, the scaling factor of buyers also approaches zero. Furthermore, the scaling factor of buyers approaches 5.3724 as the scaling factor ratio approaches infinity. In this situation, the scaling factor of sellers approaches zero. This implies that limiting the trading power of sellers and buyers at these scaling factors ensures that the network constraints are not violated during power exchange periods. That is, if the trading power of buyers is limited to 5.3724 times their total power, then increasing the trading power of sellers by no more than 1.9815 times their total power will not violate the network constraints. Alternatively, if the trading power of sellers is limited to 1.9815 times their total power, then increasing the trading power of buyers by no more than 5.3724 times their total power will not violate the network constraints. As a result, the limits of the scaling factors of sellers and buyers should be 1.9815 and 5.3724, respectively.
As aforementioned, to demonstrate the effectiveness of this proposed method, benchmark studies, comparing it with existing methods for determining the MTP, are conducted. Typically, the MTP of participants is determined based on network constraints, such as the capacity of distribution lines or the acceptable range of the bus voltage. However, the proposed MTP is selected to guarantee that the RTP of participants will not violate the network constraints during the power exchange period. This occurs when both network constraints are not at their limits, because, if they are at the limit in the planning condition, it is highly possible to violate them in the operating condition due to uncertainties in power generation and consumption. To compare the proposed method, benchmark studies are established using the scaling factors and for the existing method and the limits of scaling factors and for the proposed method.
Since the limits of the scaling factors of both sellers and buyers are greater than 1, their total power can be traded or is appropriate for being traded on the P2P energy market. The ATP of sellers and buyers is less than their MTP, according to the results shown in Table 2.
Table 2.
ATP and MTP of Sellers and Buyers.
To obtain the DLMPs corresponding to the ATP and MTP of sellers and buyers, three combinations of the scaling factors are specified in the optimization problem (5). First, the scaling factors and are substituted to compute the DLMPs corresponding to the ATP and because the DSO allows sellers and buyers to trade their total power. Second, based on the results of the limit of the scaling factor of sellers, the scaling factors and are substituted to compute the DLMPs corresponding to the MTP of sellers . Third, based on the results of the limit of the scaling factor of buyers, the scaling factors and are substituted to compute the DLMPs corresponding to the MTP of buyers . The results of the corresponding DLMPs of sellers and buyers are displayed in Table 3.
Table 3.
Corresponding DLMPs of Sellers and Buyers.
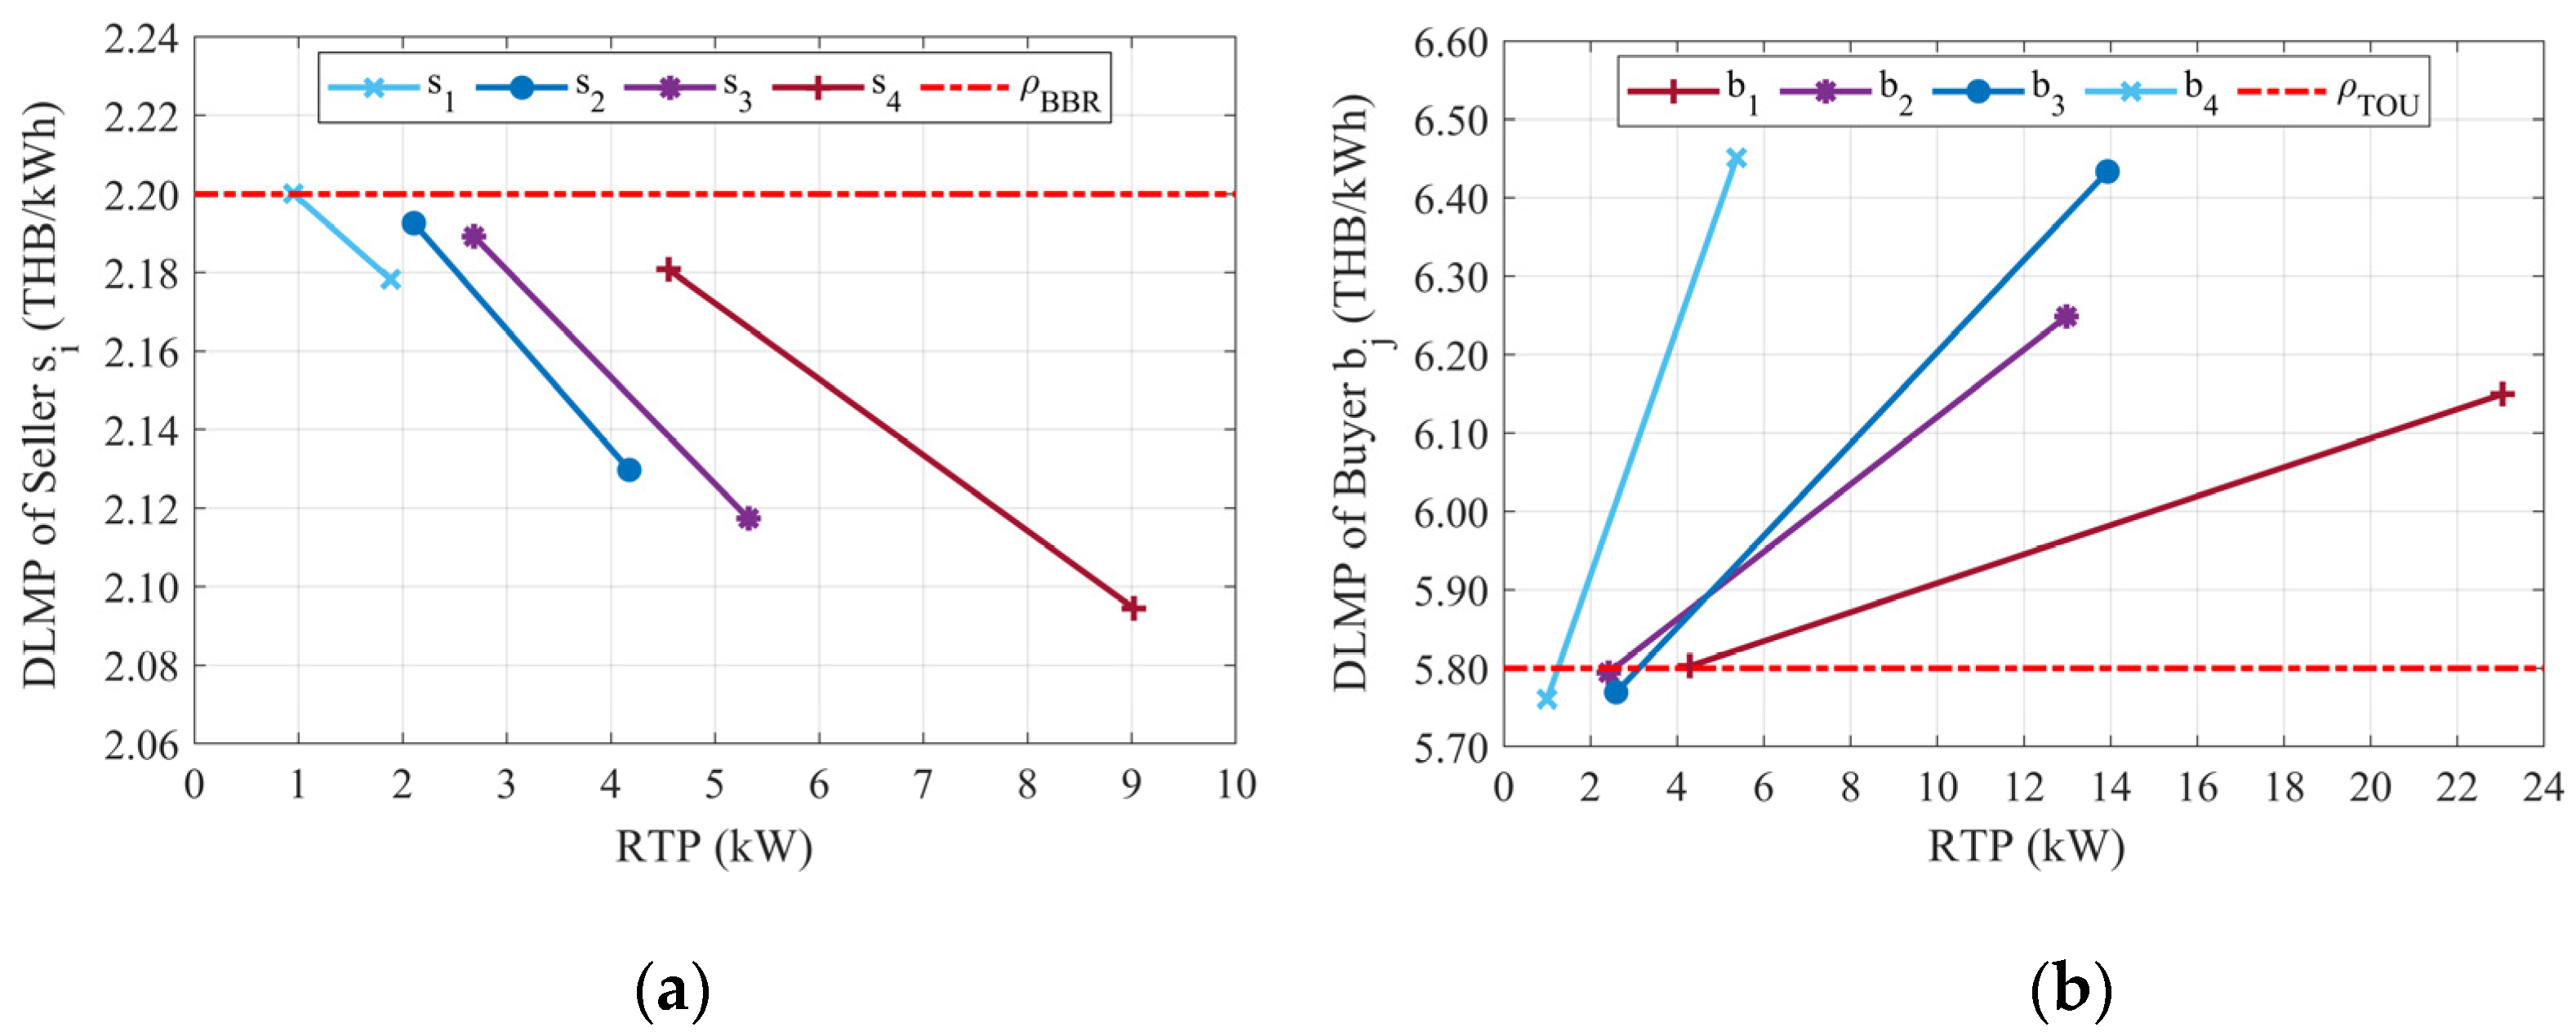
Based on the results of the ATP, MTP, and corresponding DLMPs of sellers and buyers, linear estimation is used to determine the DLMPs corresponding to their RTP during power exchange periods, as illustrated in Figure 10.
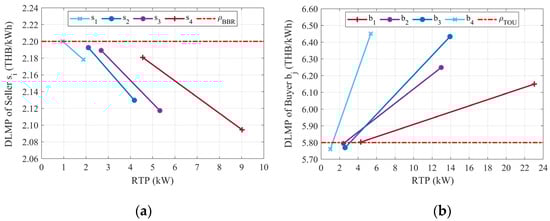
Figure 10.
Linear estimation for determining the DLMPs corresponding to the RTP of (a) sellers and (b) buyers.
6.3. Determination of NUCs and Their Effects on Matching Process
After the DSO determines the DLMPs based on the total power of sellers and buyers, the NUCs of sellers and buyers on the P2P energy market are calculated as in (33). Using the DLMPs corresponding to the ATP of sellers and buyers, the NUCs of all possible matches between sellers and buyers are shown as follows:
| Sellers | |||||
| Buyers | 0.0025 | 0.0223 | 0.0312 | 0.0534 | |
| 0.0057 | 0.0141 | 0.0231 | 0.0452 | ||
| 0.0310 | 0.0113 | 0.0023 | 0.0198 | ||
| 0.0397 | 0.0200 | 0.0110 | 0.0111 | ||
According to the results of the calculation, the NUCs of sellers and buyers will be lower when sellers and buyers are matched based on either their proximity or the power flow in the forward direction from sellers to buyers. The NUC between seller and buyer , for example, is lower than that between seller and buyer because, although the power flows from seller to both buyers and are in the forward direction, buyer is located closer to seller . Another example includes the NUC between seller and buyer , which is lower than that between seller and buyer , even though buyer is located closer to seller . This is because the power flow from seller to buyer is in the forward direction, whereas the power flow from seller to buyer is in the backward direction. Due to the relationship between the NUC and the change in the active power loss, it is possible to state that the power flow in the forward direction results in less active power loss in the distribution system than the power flow in the backward direction.
When the NUCs of sellers and buyers are calculated, a comparison of the matching process between sellers and buyers with and without the NUC consideration to investigate the effects of the NUCs on the matching process is displayed as follows:
| With the NUC Consideration | |||||
| Sellers | |||||
| Buyers | x | x | x | ||
| x | x | ||||
| x | |||||
| x | |||||
| Without the NUC Consideration | |||||
| Sellers | |||||
| Buyers | x | x | |||
| x | x | ||||
| x | |||||
| x | x | ||||
| The symbol ‘x’ signifies the matching between seller and buyer . | |||||
The results of the matching process indicate that the NUCs of sellers and buyers affect the matching process. In the event that the NUCs are not considered, sellers and buyers are matched based on the prices at which they are willing to trade energy, i.e., the prices and . However, when the NUCs are considered, sellers and buyers are matched based on the prices adjusted by their NUCs, i.e., the prices and . Therefore, the pattern of matches between sellers and buyers may be changed. When the NUCs are not considered, for example, seller and buyer are matched; however, when the NUCs are considered, seller may be matched with buyer .
Notably, there are some sellers and buyers who are unable to be matched in this manner; this is because they encounter other sellers and buyers offering more reasonable prices and being matched with the lower NUCs until their trading power is insufficient for trading. For example, both buyers and do not have the sufficient trading power to be matched with seller , despite having the relatively low NUCs.
6.4. Effectiveness of the Proposed Method: Exchanging RTP between Sellers and Buyers during Power Exchange Periods
The RTP of sellers and buyers is randomized to demonstrate the effectiveness of the proposed method. The forecast error data of PV generation and load consumption are used as the arguments of randomness. The former is between 10% and 23%, while the latter is 3%. This dataset is also used to update the DLMPs of sellers and buyers during power exchange periods. Table 4 displays the RTP of sellers and buyers during power exchange periods, ranging from their ATP to MTP. Furthermore, the DLMPs corresponding to the RTP are updated based on the results of linear estimation.
Table 4.
RTP and updated DLMPs of sellers and buyers.
The updated DLMPs affect the NUCs of sellers and buyers, resulting in changing the matches between sellers and buyers, as shown below.
| Sellers | |||||
| Buyers | x | x | x | ||
| x | x | ||||
| x | |||||
| x | |||||
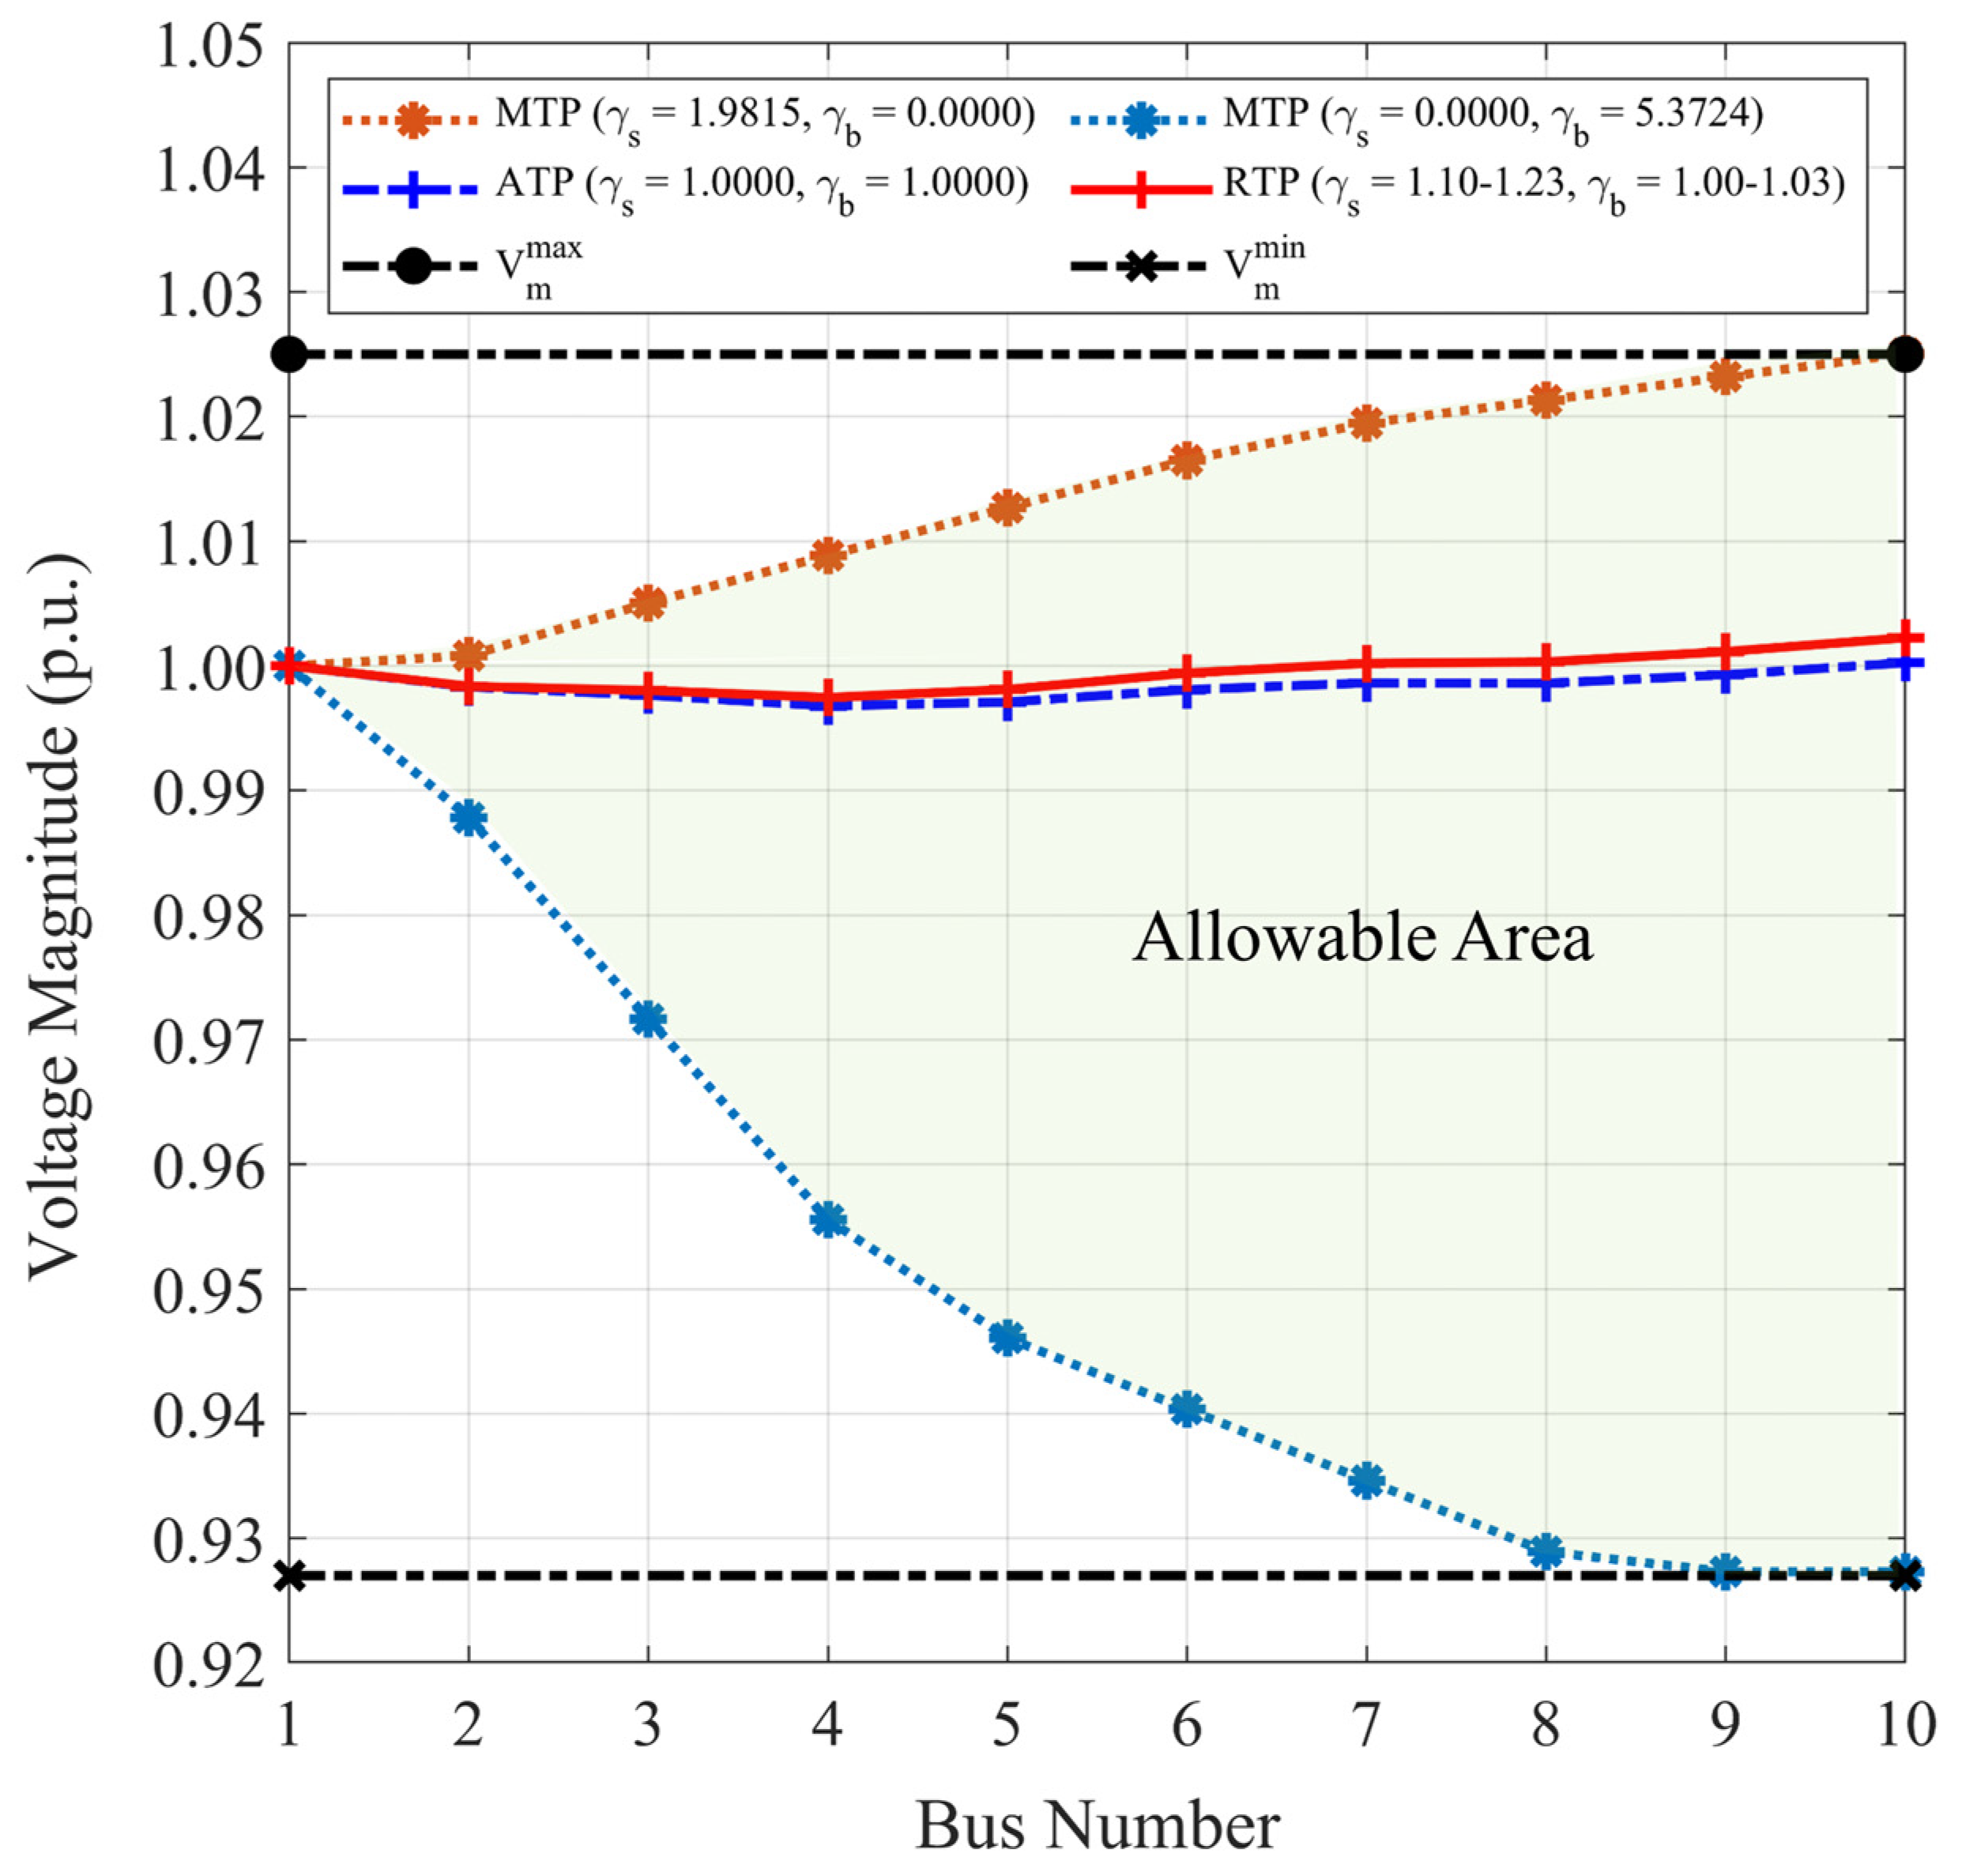
Because the RTP of sellers and buyers exceeds their ATP, sellers and buyers can trade their remaining power at the updated DLMPs on the DSO’s traditional energy market. To illustrate the technical effects on the distribution system operations, the voltage magnitudes from the trading power of sellers and buyers on the P2P energy market and the DSO’s traditional energy market are depicted in Figure 11. The fact that the distribution system operations are not violated while sellers and buyers exchange their RTP demonstrates the effectiveness of the proposed method. In the event that the RTP of sellers and buyers exceeds their MTP, their surplus will be curtailed to reduce the risk of network constraint violations.
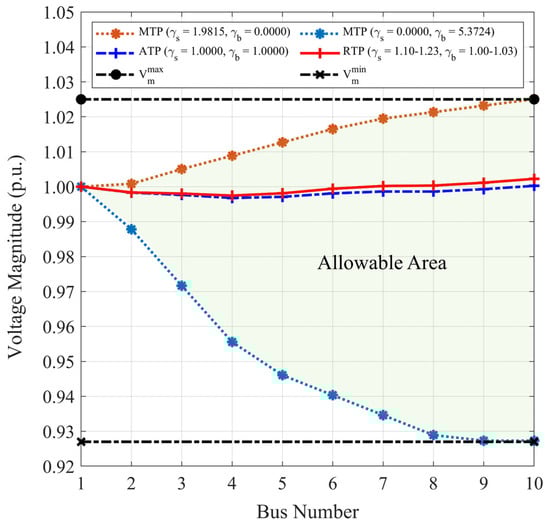
Figure 11.
Voltage magnitude comparison between the ATP, MTP, and RTP.
7. Conclusions
This paper proposes a method to operate a P2P energy market under the network constraints. The simulation results and discussion highlight the determination of the ATP, MTP, and corresponding DLMPs for sellers and buyers on the P2P energy market. The proposed method effectively ensures that exchanging the RTP during power exchange periods does not lead to network constraint violations. Moreover, the simulation results, conducted on a typical Thai distribution system, demonstrate the practicality of the proposed method, considering various factors, including the scaling factors of the trading power, voltage limit, line capacity limit, and NUCs, providing a thorough analysis of the impacts on distribution system operations. The investigation into the matching process reveals that considering NUCs significantly influences the selection of matches between sellers and buyers. The randomized RTP scenarios further validate the robustness of the proposed method, demonstrating its ability to handle forecast errors and maintain effective distribution system operations. Overall, the proposed method successfully balances the interests of sellers and buyers, optimizing the power exchange under network constraints. The effectiveness is particularly evident in the exchange of RTP between sellers and buyers during power exchange periods, where the system demonstrates resilience, even when the RTP exceeds the allowable MTP. This study contributes valuable insights for the implementation of P2P energy markets, emphasizing the importance of considering network constraints for sustainable and reliable operations. That is, the DSO is unconcerned with the amount of power injected and consumed traded on the P2P energy market and the DSO’s traditional energy market, saving the DSO time to analyze the power flow during power exchange periods. The proposed method for determining the allowable MTP can benefit from further development and validation through additional empirical studies and practical implementations. Additionally, incorporating more advanced estimation techniques, such as nonlinear estimation, can improve the accuracy of DLMP updates. Ensuring scalability and robustness for larger distribution systems and more participants is a key challenge. This paper addresses these challenges through further research and development in P2P energy markets, particularly focusing on larger distribution systems and a higher number of participants.
Author Contributions
P.A. performed the literature review, developed the formulation, coded the model in MATLAB, conducted simulations, and wrote the paper. S.C., as subject matter experts, advised and supervised the research, reviewed the entire work to ensure practicability and contributions to the field. All authors have read and agreed to the published version of the manuscript.
Funding
This work was supported by the Ratchadaphiseksomphot Endowment Fund of Chulalongkorn University, the 100th Anniversary Chulalongkorn University Fund for Doctoral Scholarship, the 90th Anniversary Chulalongkorn University Fund (Ratchadaphiseksomphot Endowment Fund), Thailand Science Research and Innovation Fund Chulalongkorn University.
Data Availability Statement
Data are contained within the article.
Acknowledgments
This work was supported by the Metropolitan Electricity Authority (MEA) for the technical data.
Conflicts of Interest
The authors declare no conflicts of interest.
Nomenclature
| Abbreviations | |
| ATP | Appropriate trading power. |
| BBR | Buy-back rate. |
| DLMP | Distribution locational marginal price. |
| DSO | Distribution system operator. |
| ETP | Energy trading platform. |
| MEA | Metropolitan Electricity Authority. |
| MTP | Maximum trading power. |
| NUC | Network usage charge. |
| P2P | Peer-to-peer. |
| PV | Photovoltaic. |
| RTP | Real trading power. |
| TOU | Time-of-use. |
| Indices and Sets | |
| , | Index and set of sellers. |
| , | Index and set of buyers. |
| , | Index and set of buses. |
| , | Index and set of lines. |
| Set of intermediate buses. | |
| Parameters | |
| , | Number of sellers and buyers. |
| , | Prices of seller and buyer [THB/kWh]. |
| , | Power angles of seller and buyer [deg]. |
| , | Total power of seller and buyer [kW]. |
| Scaling factor ratio. | |
| , | Minimum and maximum of voltage magnitudes at bus [V]. |
| Capacity of line [kVA]. | |
| Variables | |
| , | Prices adjusted by the NUCs of seller and buyer . [THB/kWh]. |
| , | Scaling factors of sellers and buyers. |
| , | Limits of the scaling factors of sellers and buyers. |
| DLMPs at bus [THB/kWh]. | |
| DLMPs of seller and buyer [THB/kWh]. | |
| Trading price of seller and buyer [THB/kWh]. | |
| , | Total trading power of seller and buyer [kW]. |
| , | Trading power of seller and buyer [kW]. |
| Active power loss [kW]. | |
| NUCs of seller and buyer [THB/kWh]. | |
| , | Voltage angle and magnitude at bus [V]. |
| , | Vector of voltage angles and magnitudes [V]. |
| , | Forward and backward apparent power of line [kVA]. |
References
- IRENA. Innovation Landscape Brief: Peer-to-Peer Electricity Trading; IRENA: Abu Dhabi, United Arab Emirates, 2020. [Google Scholar]
- Parag, Y.; Sovacool, B.K. Electricity market design for the prosumer era. Nat. Energy 2016, 1, 16032. [Google Scholar] [CrossRef]
- Liu, Y.; Wu, L.; Li, J. Peer-to-peer (P2P) electricity trading in distribution systems of the future. Electr. J. 2019, 32, 2–6. [Google Scholar] [CrossRef]
- Mengelkamp, E.; Gärttner, J.; Rock, K.; Kessler, S.; Orsini, L.; Weinhardt, C. Designing microgrid energy markets A case study: The Brooklyn Microgrid. Appl. Energy 2018, 210, 870–880. [Google Scholar] [CrossRef]
- Pinyo, A.; Bangviwat, A.; Menke, C.; Monti, A. Decentralized P2P Electricity Trading Model for Thailand. Sensors 2021, 21, 7413. [Google Scholar] [CrossRef]
- Junlakarn, S.; Kokchang, P.; Audomvongseree, K. Drivers and Challenges of Peer-to-Peer Energy Trading Development in Thailand. Energies 2022, 15, 1229. [Google Scholar] [CrossRef]
- Zhang, J.; Hu, C.; Zheng, C.; Rui, T.; Shen, W.; Wang, B. Distributed Peer-to-Peer Electricity Trading Considering Network Loss in a Distribution System. Energies 2019, 12, 4318. [Google Scholar] [CrossRef]
- Azim, M.I.; Tushar, W.; Saha, T.K. Investigating the impact of P2P trading on power losses in grid-connected networks with prosumers. Appl. Energy 2020, 263, 114687. [Google Scholar] [CrossRef]
- Khorasany, M.; Mishra, Y.; Ledwich, G. A Decentralized Bilateral Energy Trading System for Peer-to-Peer Electricity Markets. IEEE Trans. Ind. Electron. 2020, 67, 4646–4657. [Google Scholar] [CrossRef]
- Ai, X.; Wu, J.; Hu, J.; Yang, Z.; Yang, G. Distributed congestion management of distribution networks to integrate prosumers energy operation. IET Gener. Transm. Distrib. 2020, 14, 2988–2996. [Google Scholar] [CrossRef]
- Paudel, A.; Khorasany, M.; Gooi, H.B. Decentralized Local Energy Trading in Microgrids with Voltage Management. IEEE Trans. Ind. Inf. 2021, 17, 1111–1121. [Google Scholar] [CrossRef]
- Liu, Y.; Sun, C.; Paudel, A.; Gao, Y.; Li, Y.; Gooi, H.B.; Zhu, J. Fully Decentralized P2P Energy Trading in Active Distribution Networks with Voltage Regulation. IEEE Trans. Smart Grid 2023, 14, 1466–1481. [Google Scholar] [CrossRef]
- Renani, Y.K.; Ehsan, M.; Shahidehpour, M. Optimal Transactive Market Operations with Distribution System Operators. IEEE Trans. Smart Grid 2018, 9, 6692–6701. [Google Scholar] [CrossRef]
- Liu, Y.; Wu, L.; Li, J. A two-stage peer-to-peer energy trading model for distribution systems with the participation of the utility. CSEE J. Power Energy Syst. 2021, 7, 893–902. [Google Scholar] [CrossRef]
- Angaphiwatchawal, P.; Chaitusaney, S. Centralized Optimal Operations of Local Energy Trading Market in Distribution System. IEEE Access 2022, 10, 36753–36765. [Google Scholar] [CrossRef]
- Morstyn, T.; Teytelboym, A.; Hepburn, C.; McCulloch, M.D. Integrating P2P Energy Trading with Probabilistic Distribution Locational Marginal Pricing. IEEE Trans. Smart Grid 2020, 11, 3095–3106. [Google Scholar] [CrossRef]
- Haggi, H.; Sun, W. Multi-Round Double Auction-Enabled Peer-to-Peer Energy Exchange in Active Distribution Networks. IEEE Trans. Smart Grid 2021, 12, 4403–4414. [Google Scholar] [CrossRef]
- Mohammadi, S.; Hesamzadeh, M.R.; Bunn, D.W. Distribution Locational Marginal Pricing (DLMP) for Unbalanced Three-Phase Networks. IEEE Trans. Power Syst. 2021, 37, 3443–3457. [Google Scholar] [CrossRef]
- Lu, Z.; Bai, L.; Wang, J.; Wei, J.; Xiao, Y.; Chen, Y. Peer-to-Peer Joint Electricity and Carbon Trading Based on Carbon-Aware Distribution Locational Marginal Pricing. IEEE Trans. Power Syst. 2023, 38, 835–852. [Google Scholar] [CrossRef]
- Umer, K.; Huang, Q.; Khorasany, M.; Amin, W.; Afzal, M. A novel prosumer-centric approach for social welfare maximization considering network voltage constraints in peer-to-peer energy markets. Int. J. Electr. Power Energy Syst. 2023, 147, 108820. [Google Scholar] [CrossRef]
- Sheng, H.; Wang, C.; Dong, X.; Meng, K.; Dong, Z. Incorporating P2P Trading into DSO’s Decision-Making: A DSO-Prosumers Cooperated Scheduling Framework for Transactive Distribution System. IEEE Trans. Power Syst. 2023, 38, 2362–2375. [Google Scholar] [CrossRef]
- Ullah, M.H.; Park, J.-D. Peer-to-Peer Energy Trading in Transactive Markets Considering Physical Network Constraints. IEEE Trans. Smart Grid 2021, 12, 3390–3403. [Google Scholar] [CrossRef]
- Yorino, N.; Taenaka, H.; Bedawy, A.; Sasaki, Y.; Zoka, Y. Novel agent-based voltage control methods for PV prosumers using nodal price. Electr. Power Syst. Res. 2022, 213, 108407. [Google Scholar] [CrossRef]
- Chen, Y.; Zhao, C.; Low, S.H.; Wierman, A. An Energy Sharing Mechanism Considering Network Constraints and Market Power Limitation. IEEE Trans. Smart Grid 2023, 14, 1027–1041. [Google Scholar] [CrossRef]
- Wang, L.; Wang, Z.; Li, Z.; Yang, M.; Cheng, X. Distributed optimization for network-constrained peer-to-peer energy trading among multiple microgrids under uncertainty. Int. J. Electr. Power Energy Syst. 2023, 149, 109065. [Google Scholar] [CrossRef]
- Kim, J.; Dvorkin, Y. A P2P-Dominant Distribution System Architecture. IEEE Trans. Power Syst. 2020, 35, 2716–2725. [Google Scholar] [CrossRef]
- Zhang, K.; Troitzsch, S.; Hanif, S.; Hamacher, T. Coordinated Market Design for Peer-to-Peer Energy Trade and Ancillary Services in Distribution Grids. IEEE Trans. Smart Grid 2020, 11, 2929–2941. [Google Scholar] [CrossRef]
- Samende, C.; Cao, J.; Fan, Z. Multi-agent deep deterministic policy gradient algorithm for peer-to-peer energy trading considering distribution network constraints. Appl. Energy 2022, 317, 119123. [Google Scholar] [CrossRef]
- Doan, H.T.; Cho, J.; Kim, D. Peer-to-Peer Energy Trading in Smart Grid Through Blockchain: A Double Auction-Based Game Theoretic Approach. IEEE Access 2021, 9, 49206–49218. [Google Scholar] [CrossRef]
- Sampath, L.P.M.I.; Paudel, A.; Nguyen, H.D.; Foo, E.Y.S.; Gooi, H.B. Peer-to-Peer Energy Trading Enabled Optimal Decentralized Operation of Smart Distribution Grids. IEEE Trans. Smart Grid 2022, 13, 654–666. [Google Scholar] [CrossRef]
- Ullah, M.H.; Park, J.-D. A Two-Tier Distributed Market Clearing Scheme for Peer-to-Peer Energy Sharing in Smart Grid. IEEE Trans. Ind. Inf. 2022, 18, 66–76. [Google Scholar] [CrossRef]
- Moghadam, A.Z.; Javidi, M.H. Designing a two-stage transactive energy system for future distribution networks in the presence of prosumers’ P2P transactions. Electr. Power Syst. Res. 2022, 211, 108202. [Google Scholar] [CrossRef]
- MEA. My Energy MEA. Available online: https://myenergy.mea.or.th/ (accessed on 29 March 2023).
- MEA. Type 1 Residential Service. Available online: https://www.mea.or.th/en/our-services/tariff-calculation/other/hyMgQIdZCXop (accessed on 29 March 2023).
- Li, Z.; Lai, C.S.; Xu, X.; Zhao, Z.; Lai, L.L. Electricity trading based on distribution locational marginal price. Int. J. Electr. Power Energy Syst. 2021, 124, 106322. [Google Scholar] [CrossRef]
- Saraiva, F.O.S.; Paucar, V.L. Locational Marginal Price Decomposition Using a Fully Distributed Slack Bus Model. IEEE Access 2022, 10, 84913–84933. [Google Scholar] [CrossRef]
- Song, Y.-H.; Wang, X.-F. (Eds.) Operation of Market-oriented Power Systems. In Power Systems; Springer: London, UK, 2003. [Google Scholar] [CrossRef]
- Zhu, J. Optimization of Power System Operation, 2nd ed.; Wiley: Hoboken, NJ, USA, 2015. [Google Scholar]
- Angaphiwatchawal, P.; Chaitusaney, S. Maximization of PV Size for Its Limitation in MEA Grid Code by Considering Overvoltage and Increased Active Power Loss Criteria. In Proceedings of the 2019 7th International Electrical Engineering Congress (iEECON), Hua Hin, Thailand, 6–8 March 2019; pp. 1–4. [Google Scholar] [CrossRef]


Disclaimer/Publisher’s Note: The statements, opinions and data contained in all publications are solely those of the individual author(s) and contributor(s) and not of MDPI and/or the editor(s). MDPI and/or the editor(s) disclaim responsibility for any injury to people or property resulting from any ideas, methods, instructions or products referred to in the content. |
© 2024 by the authors. Licensee MDPI, Basel, Switzerland. This article is an open access article distributed under the terms and conditions of the Creative Commons Attribution (CC BY) license (https://creativecommons.org/licenses/by/4.0/).