
Electromagnetic Vibration and Noise Analysis of Linear Phase-Shifting Transformer

Abstract
:1. Introduction
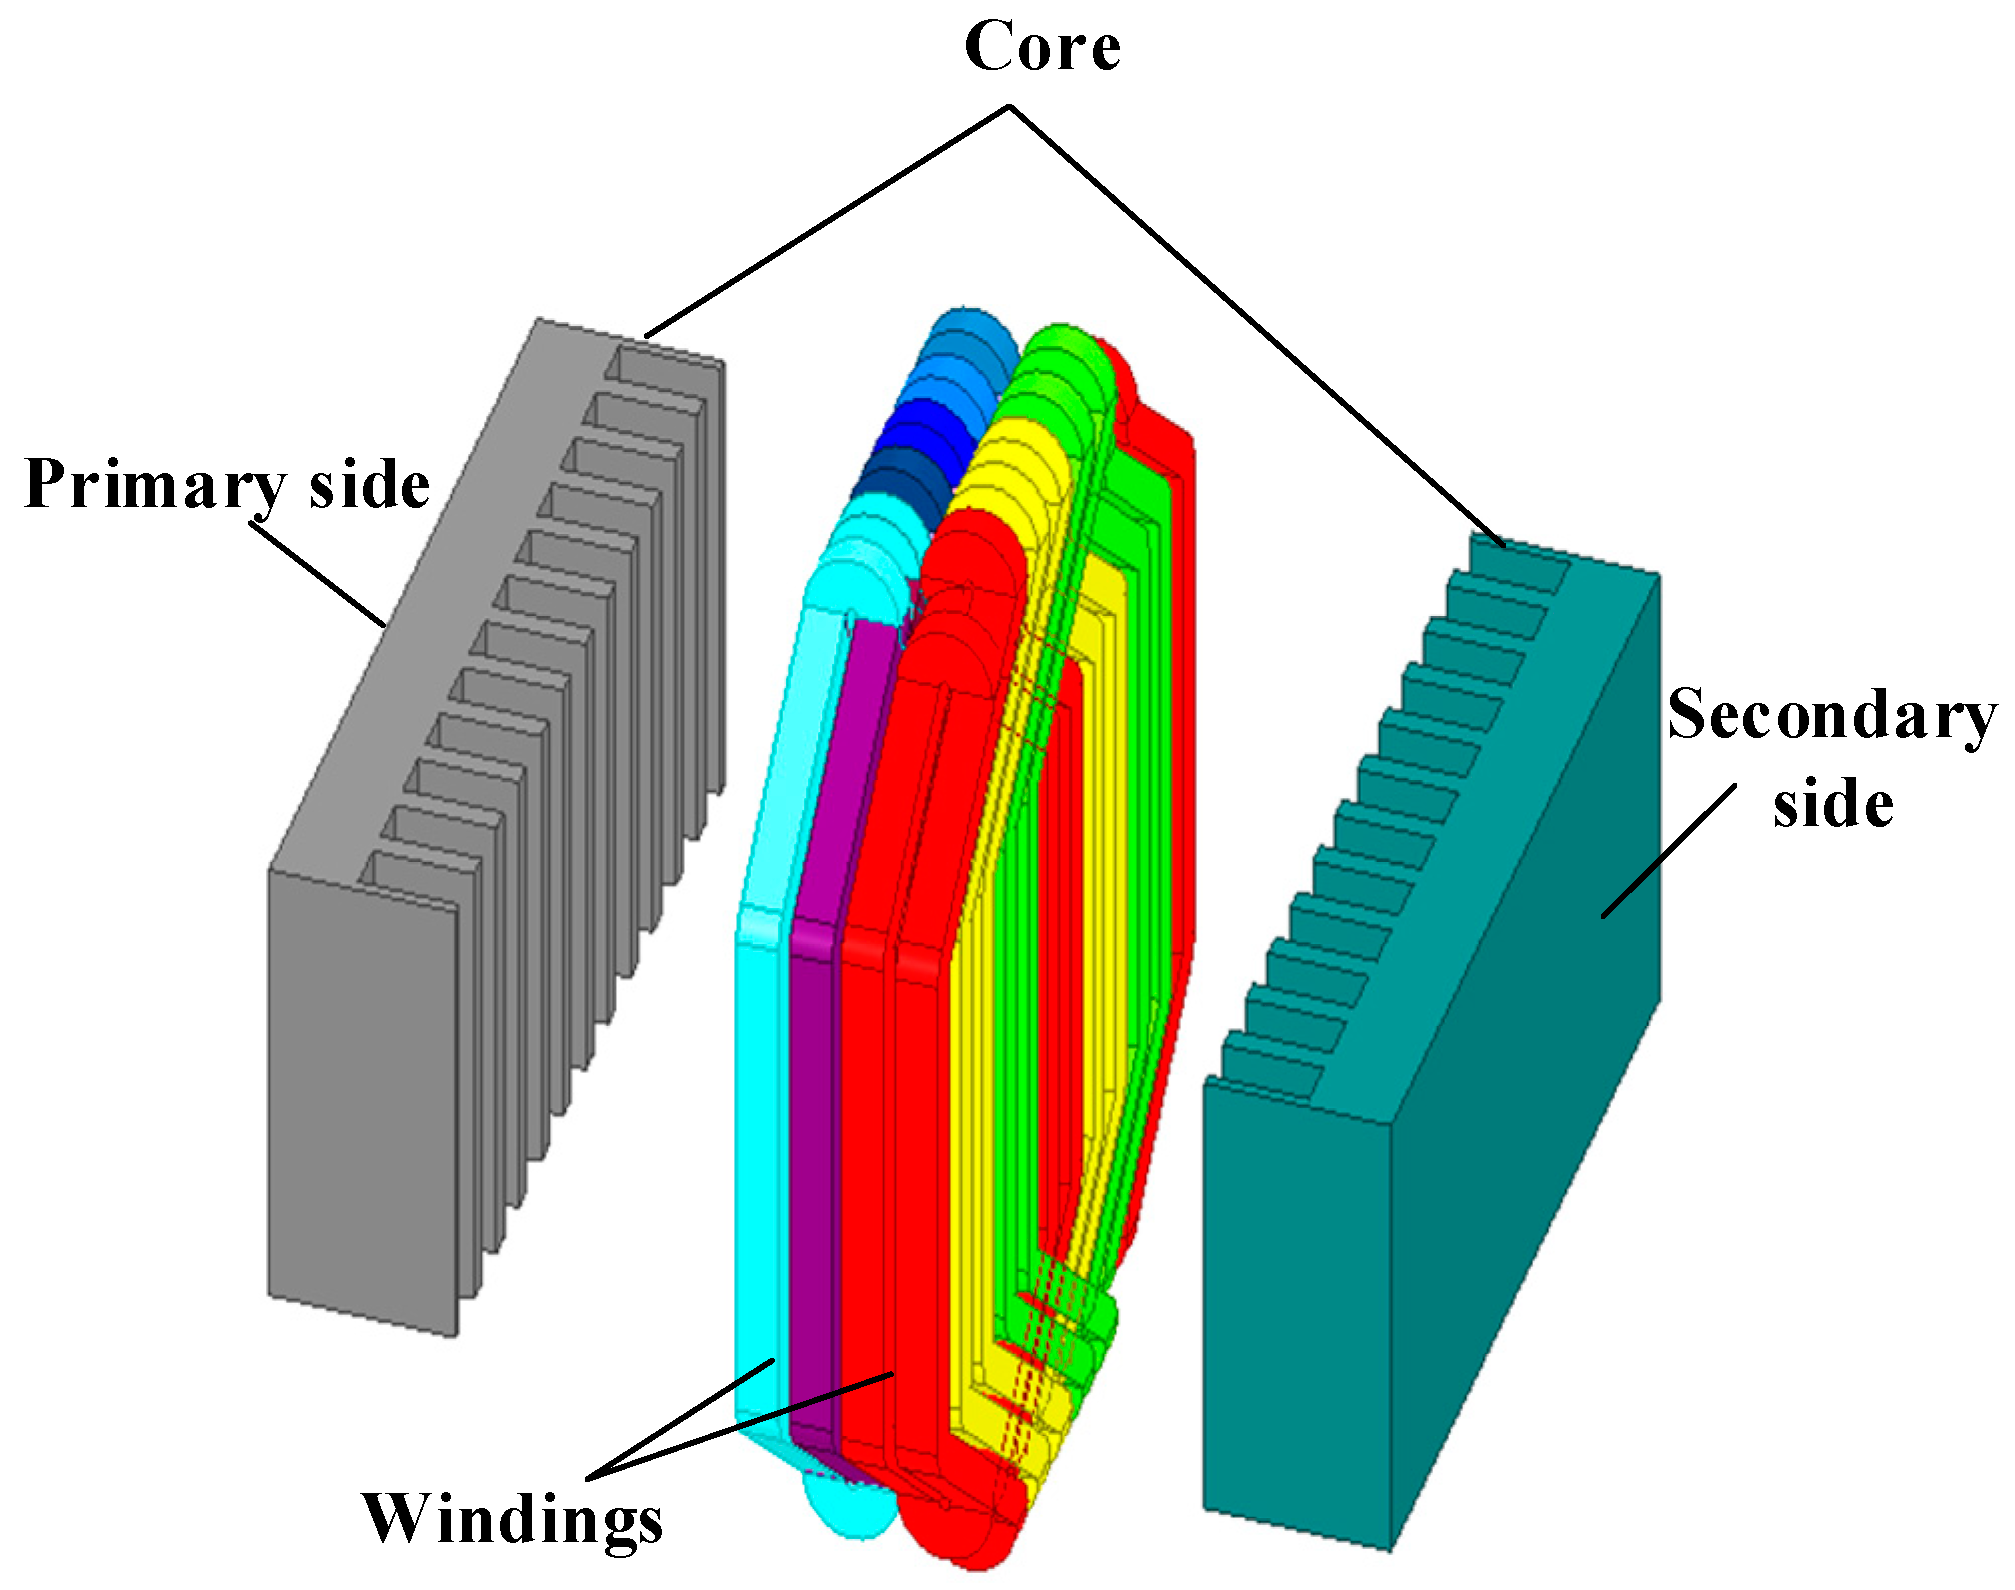
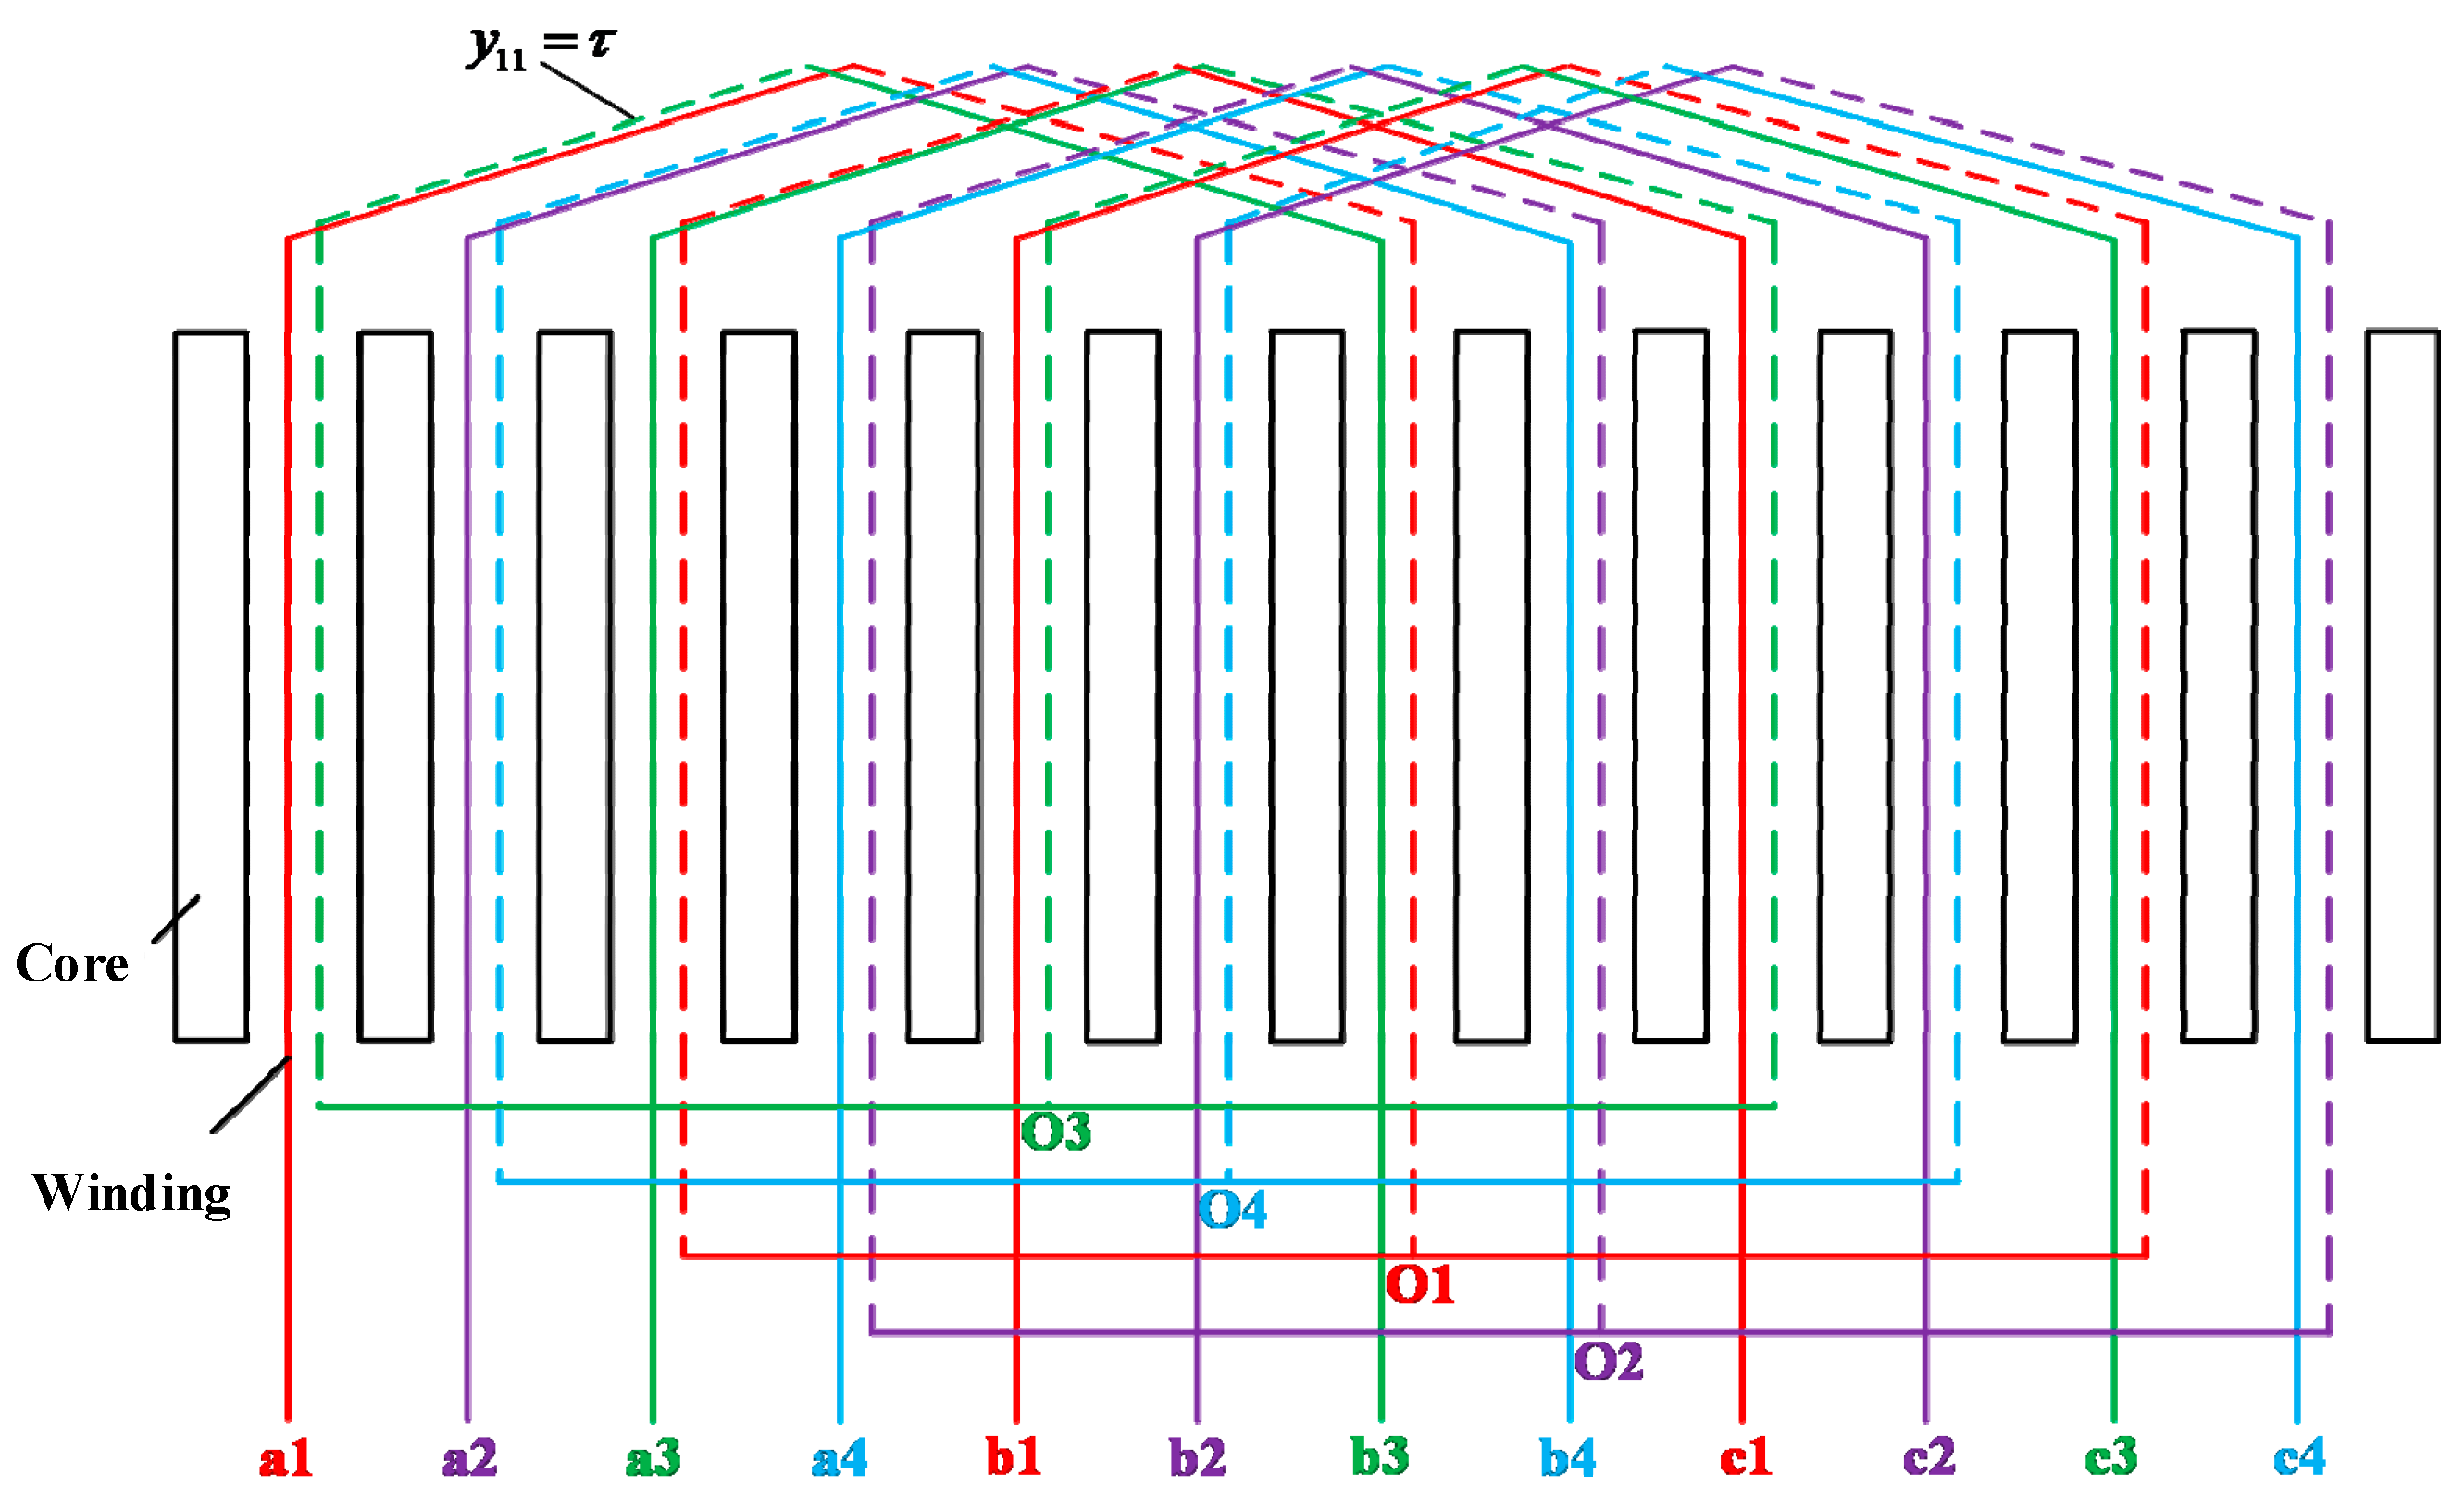
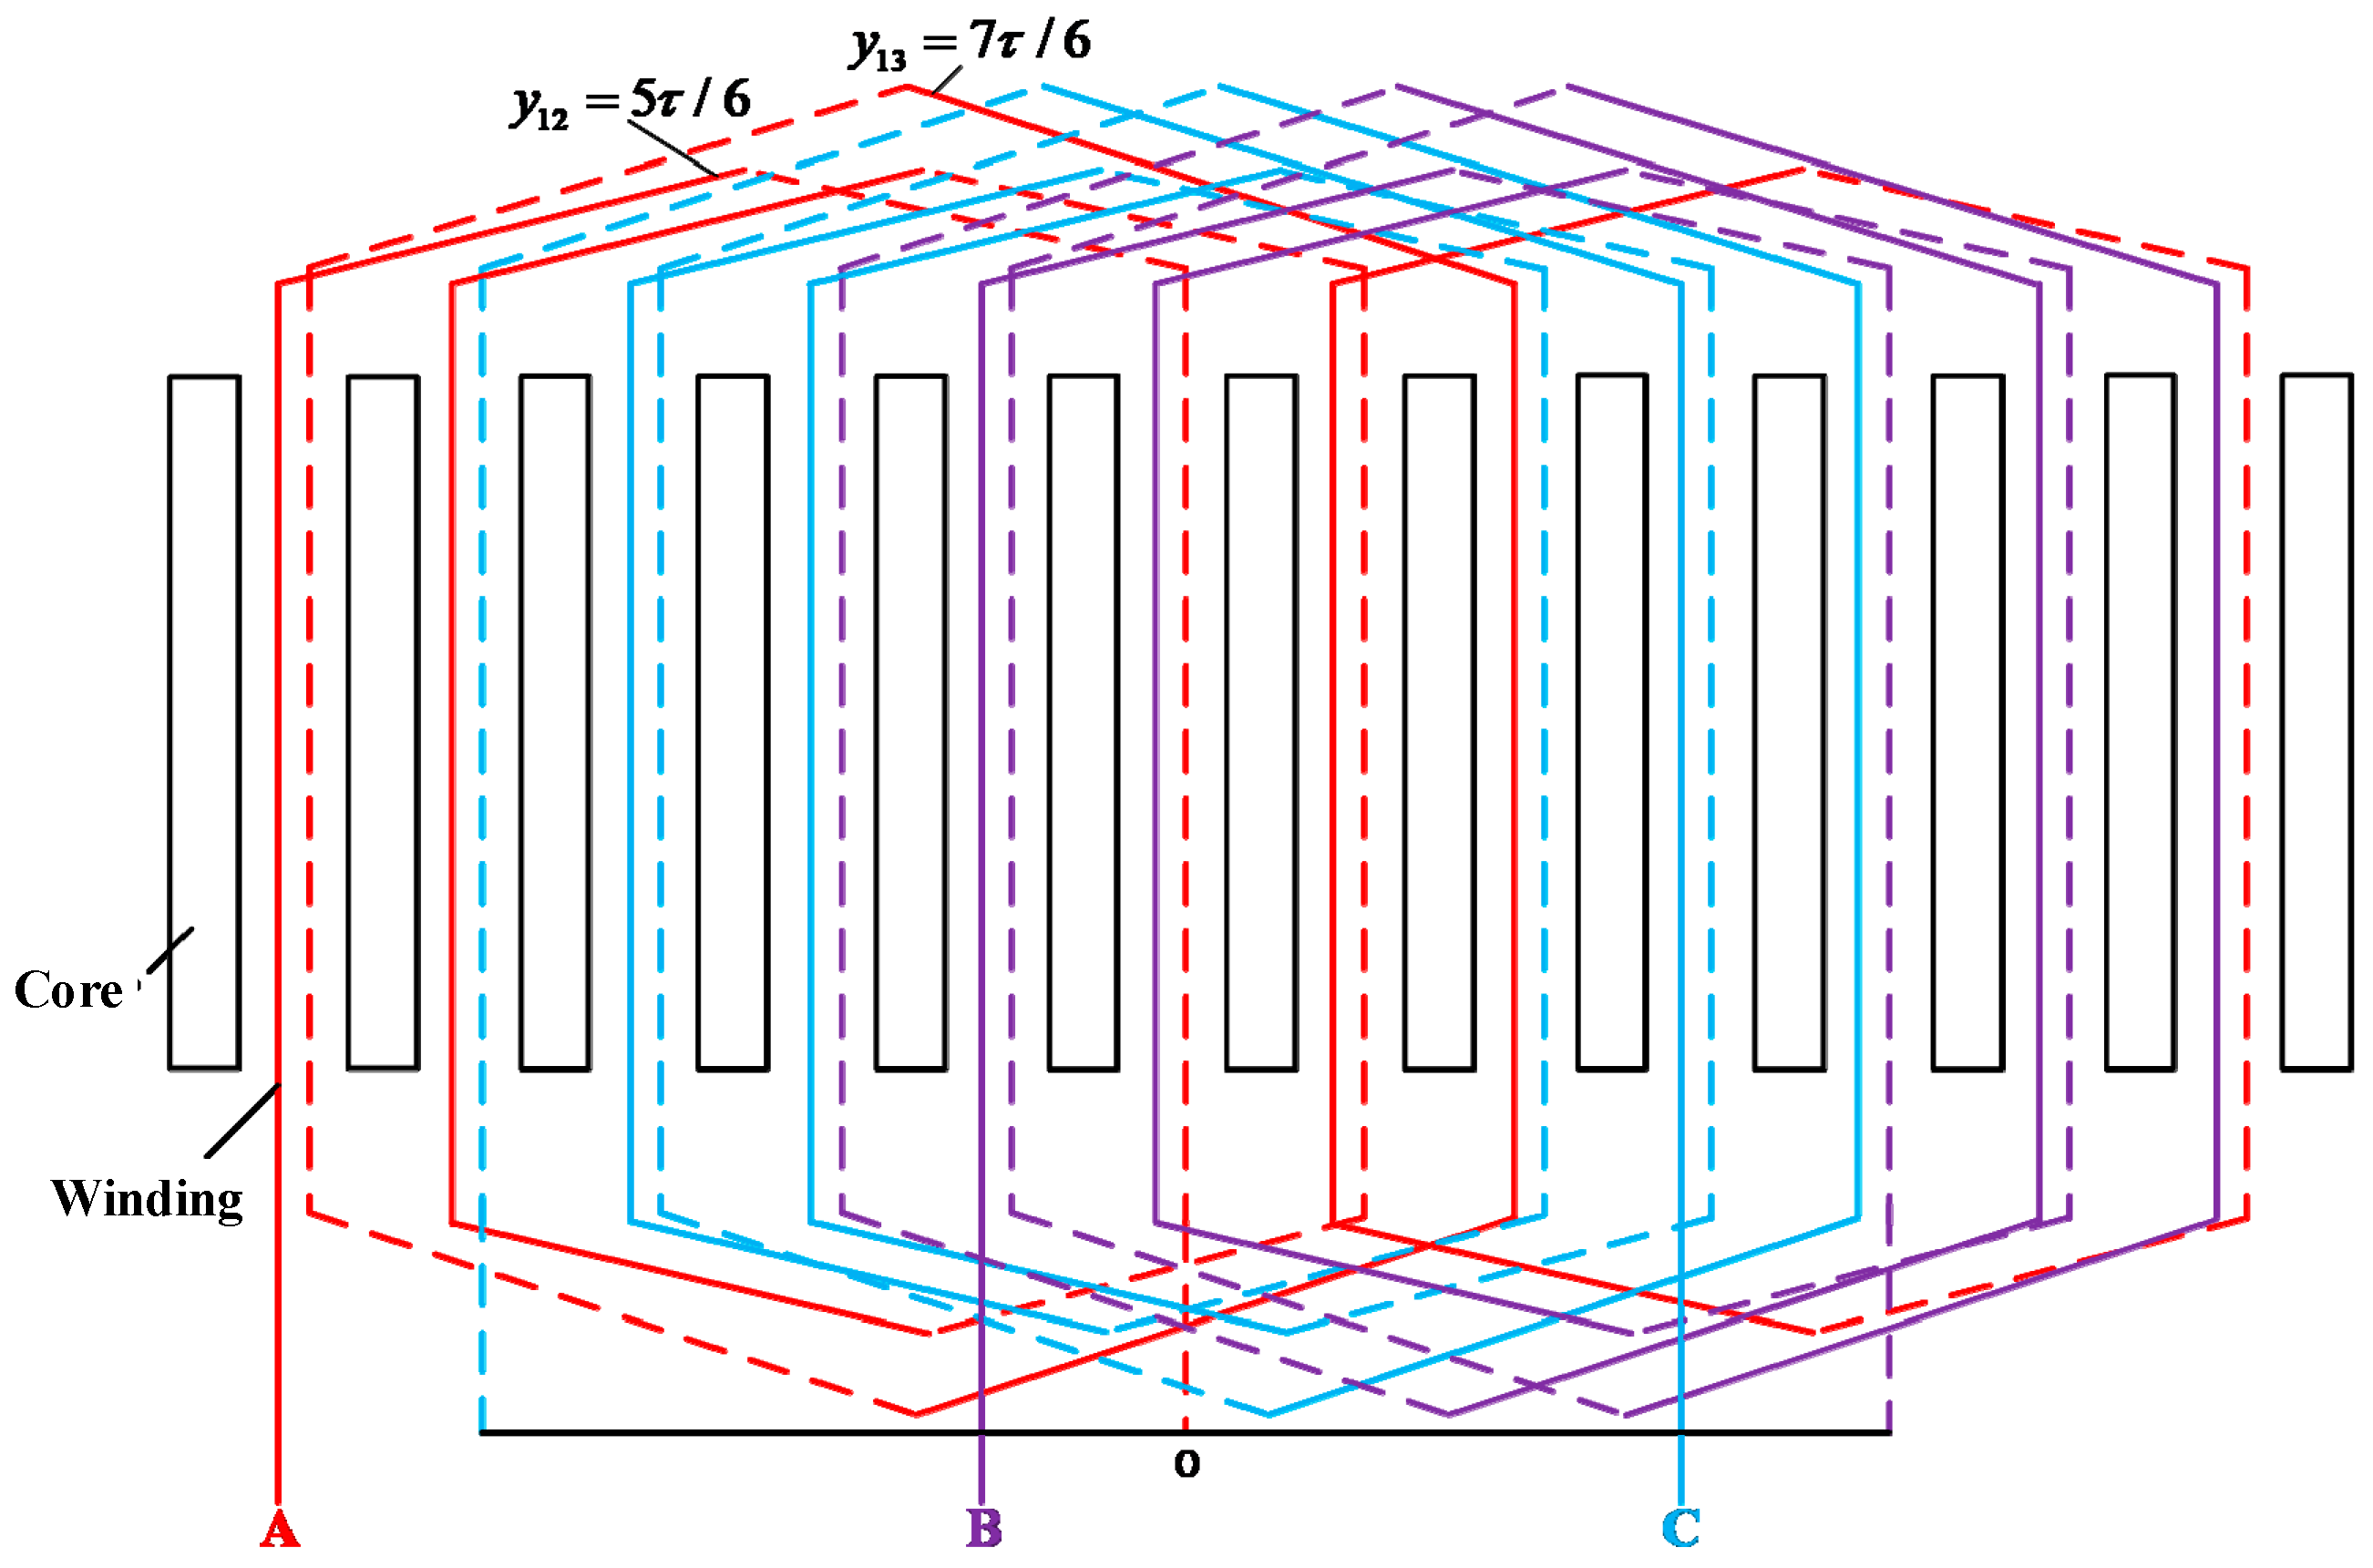
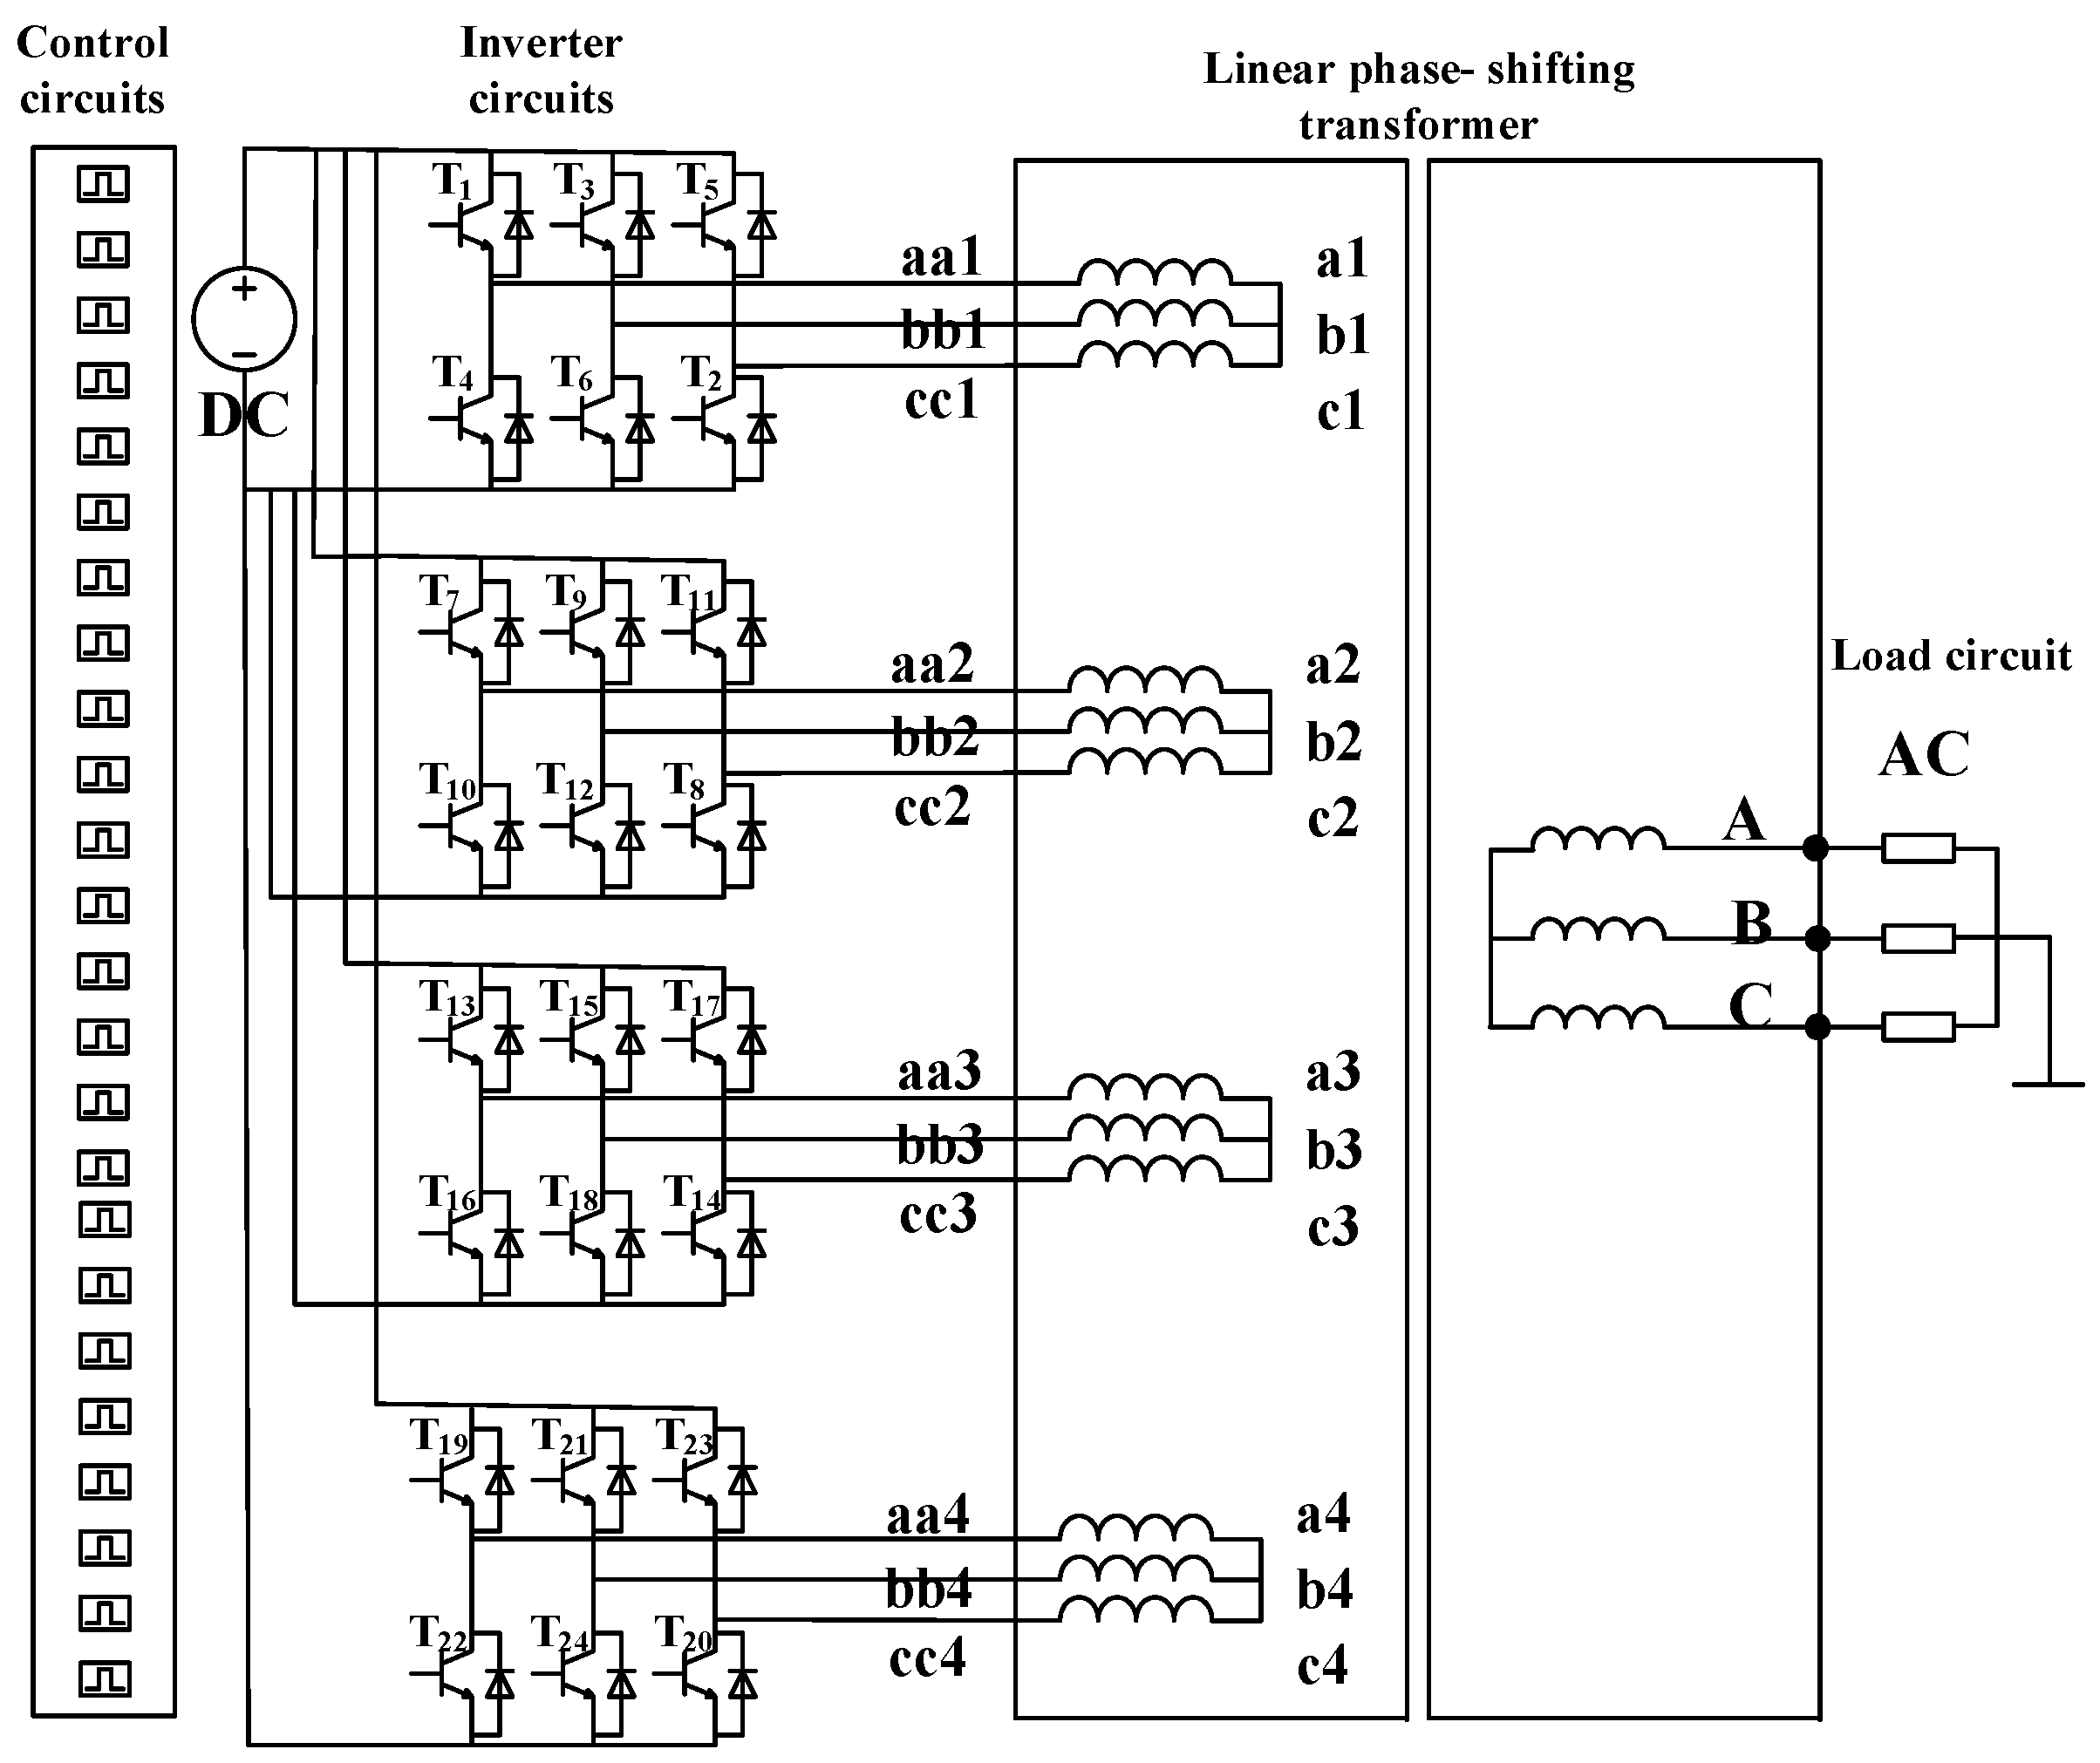
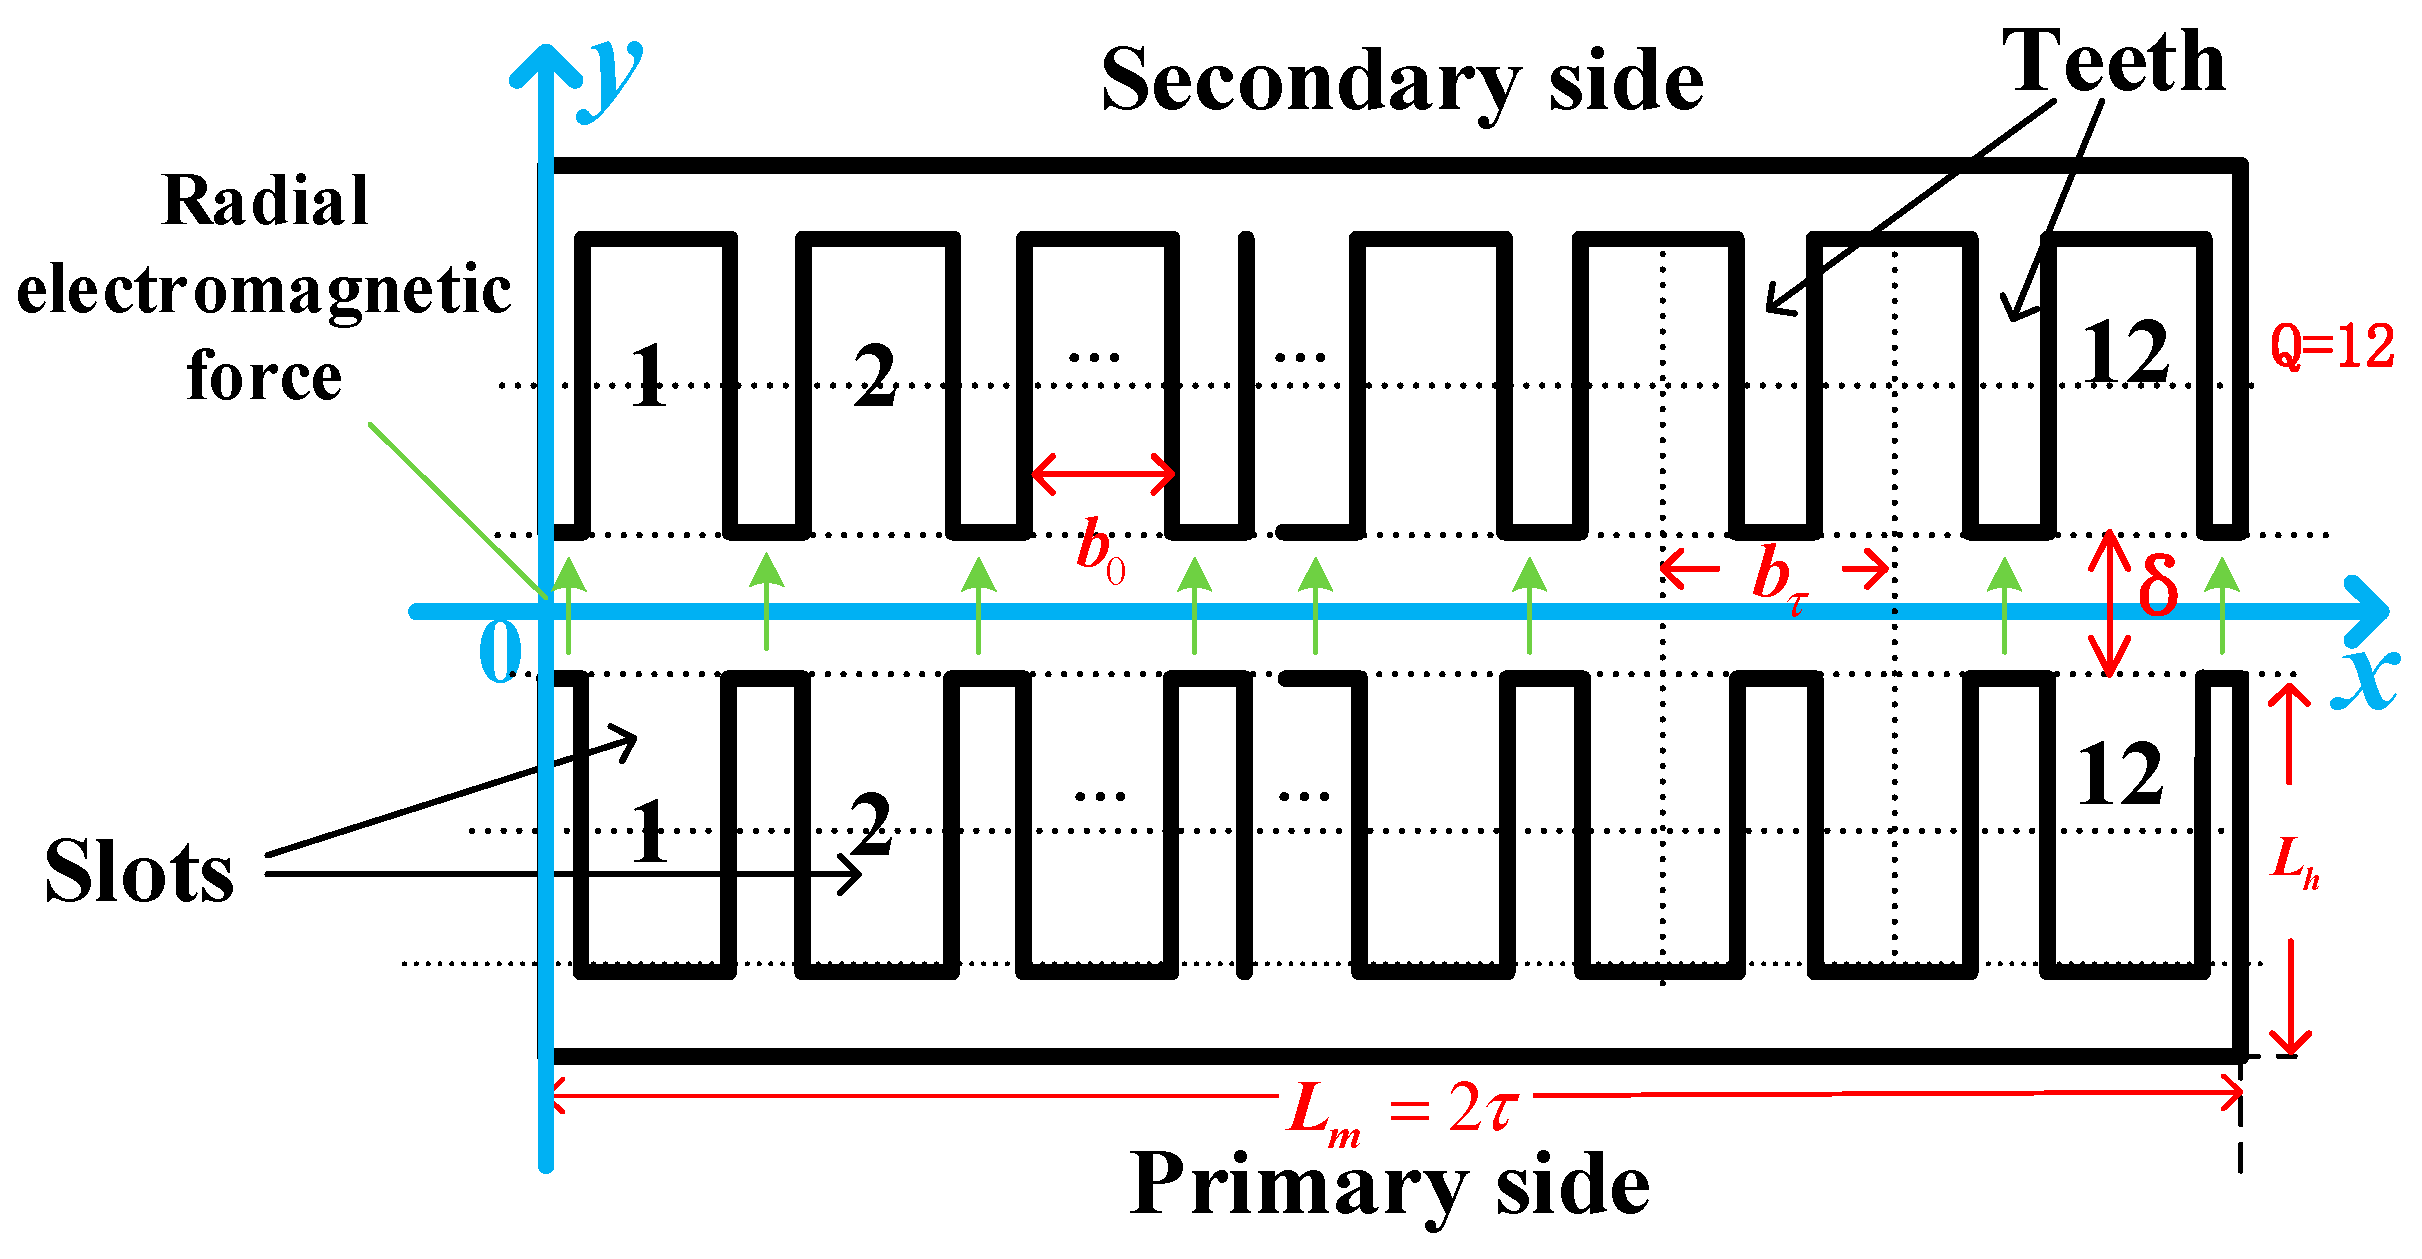
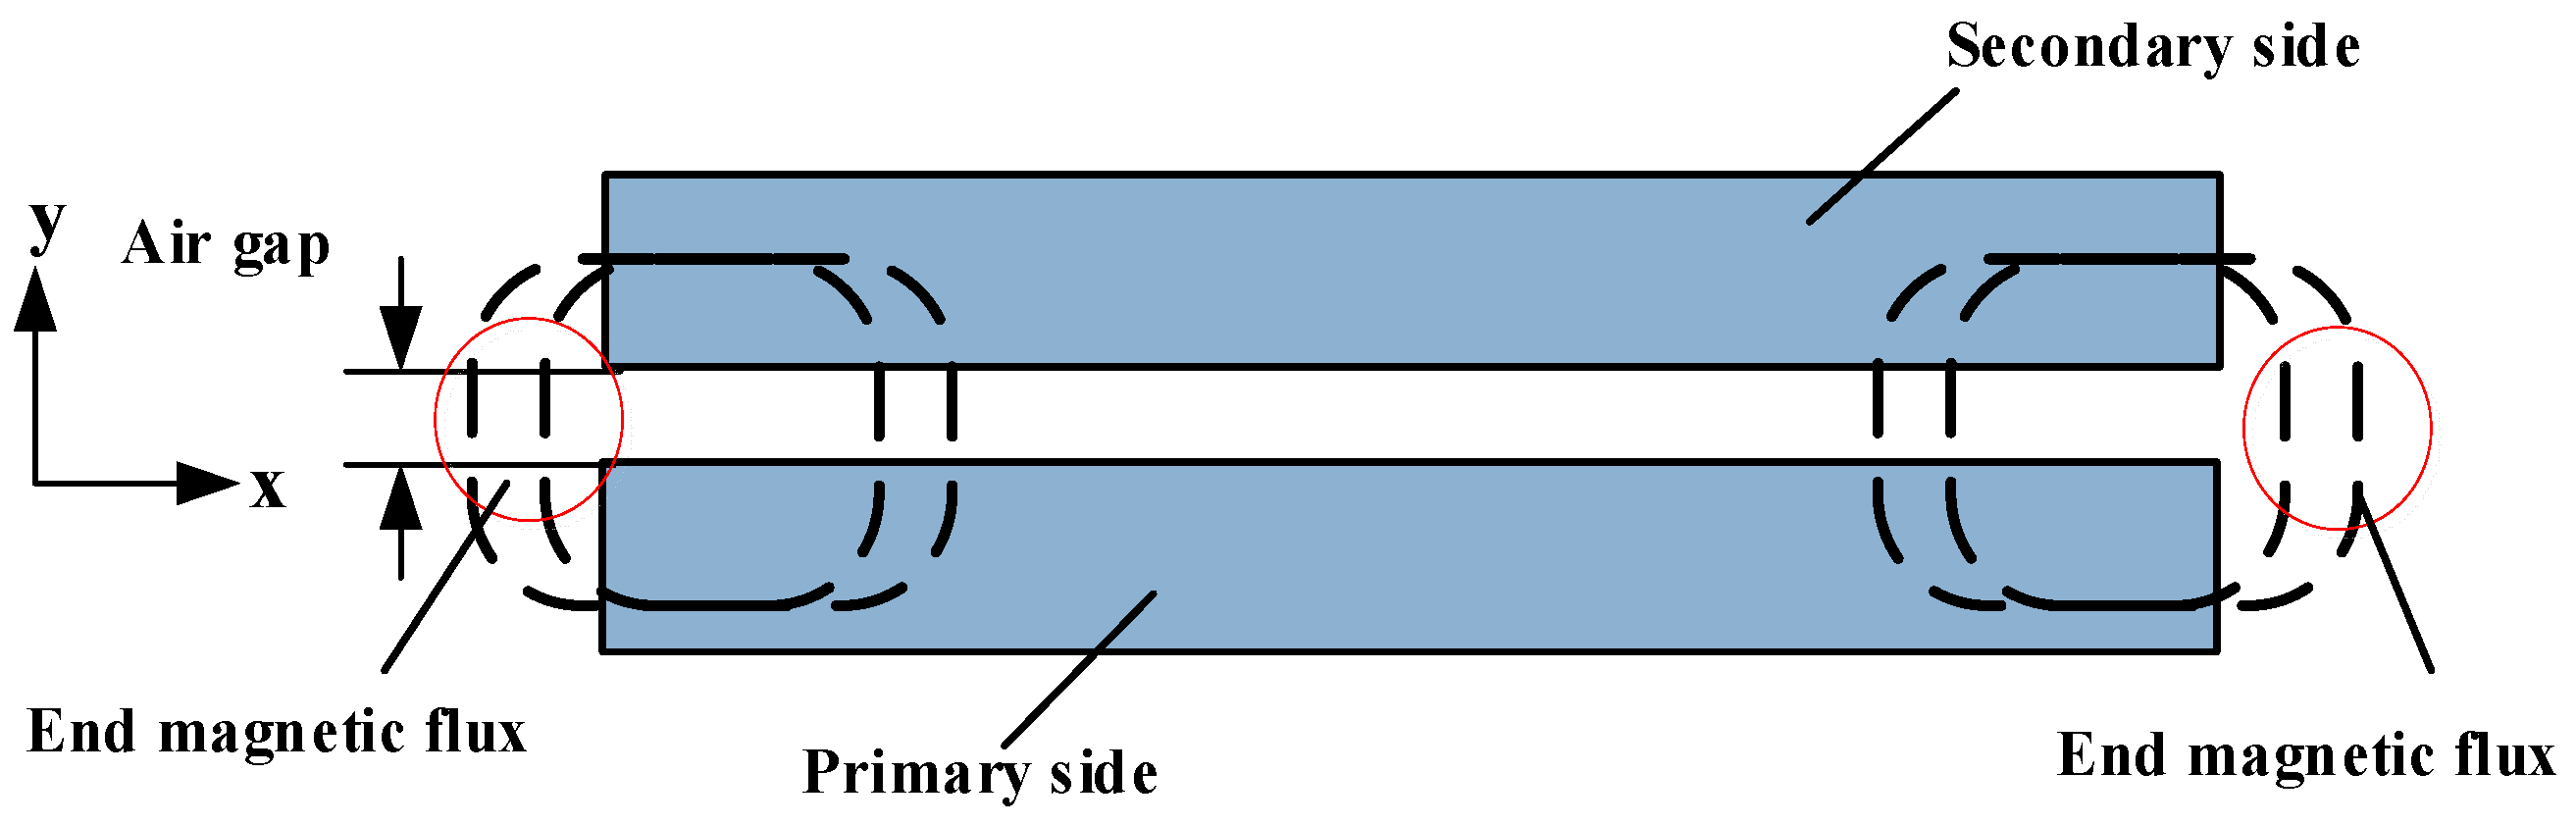
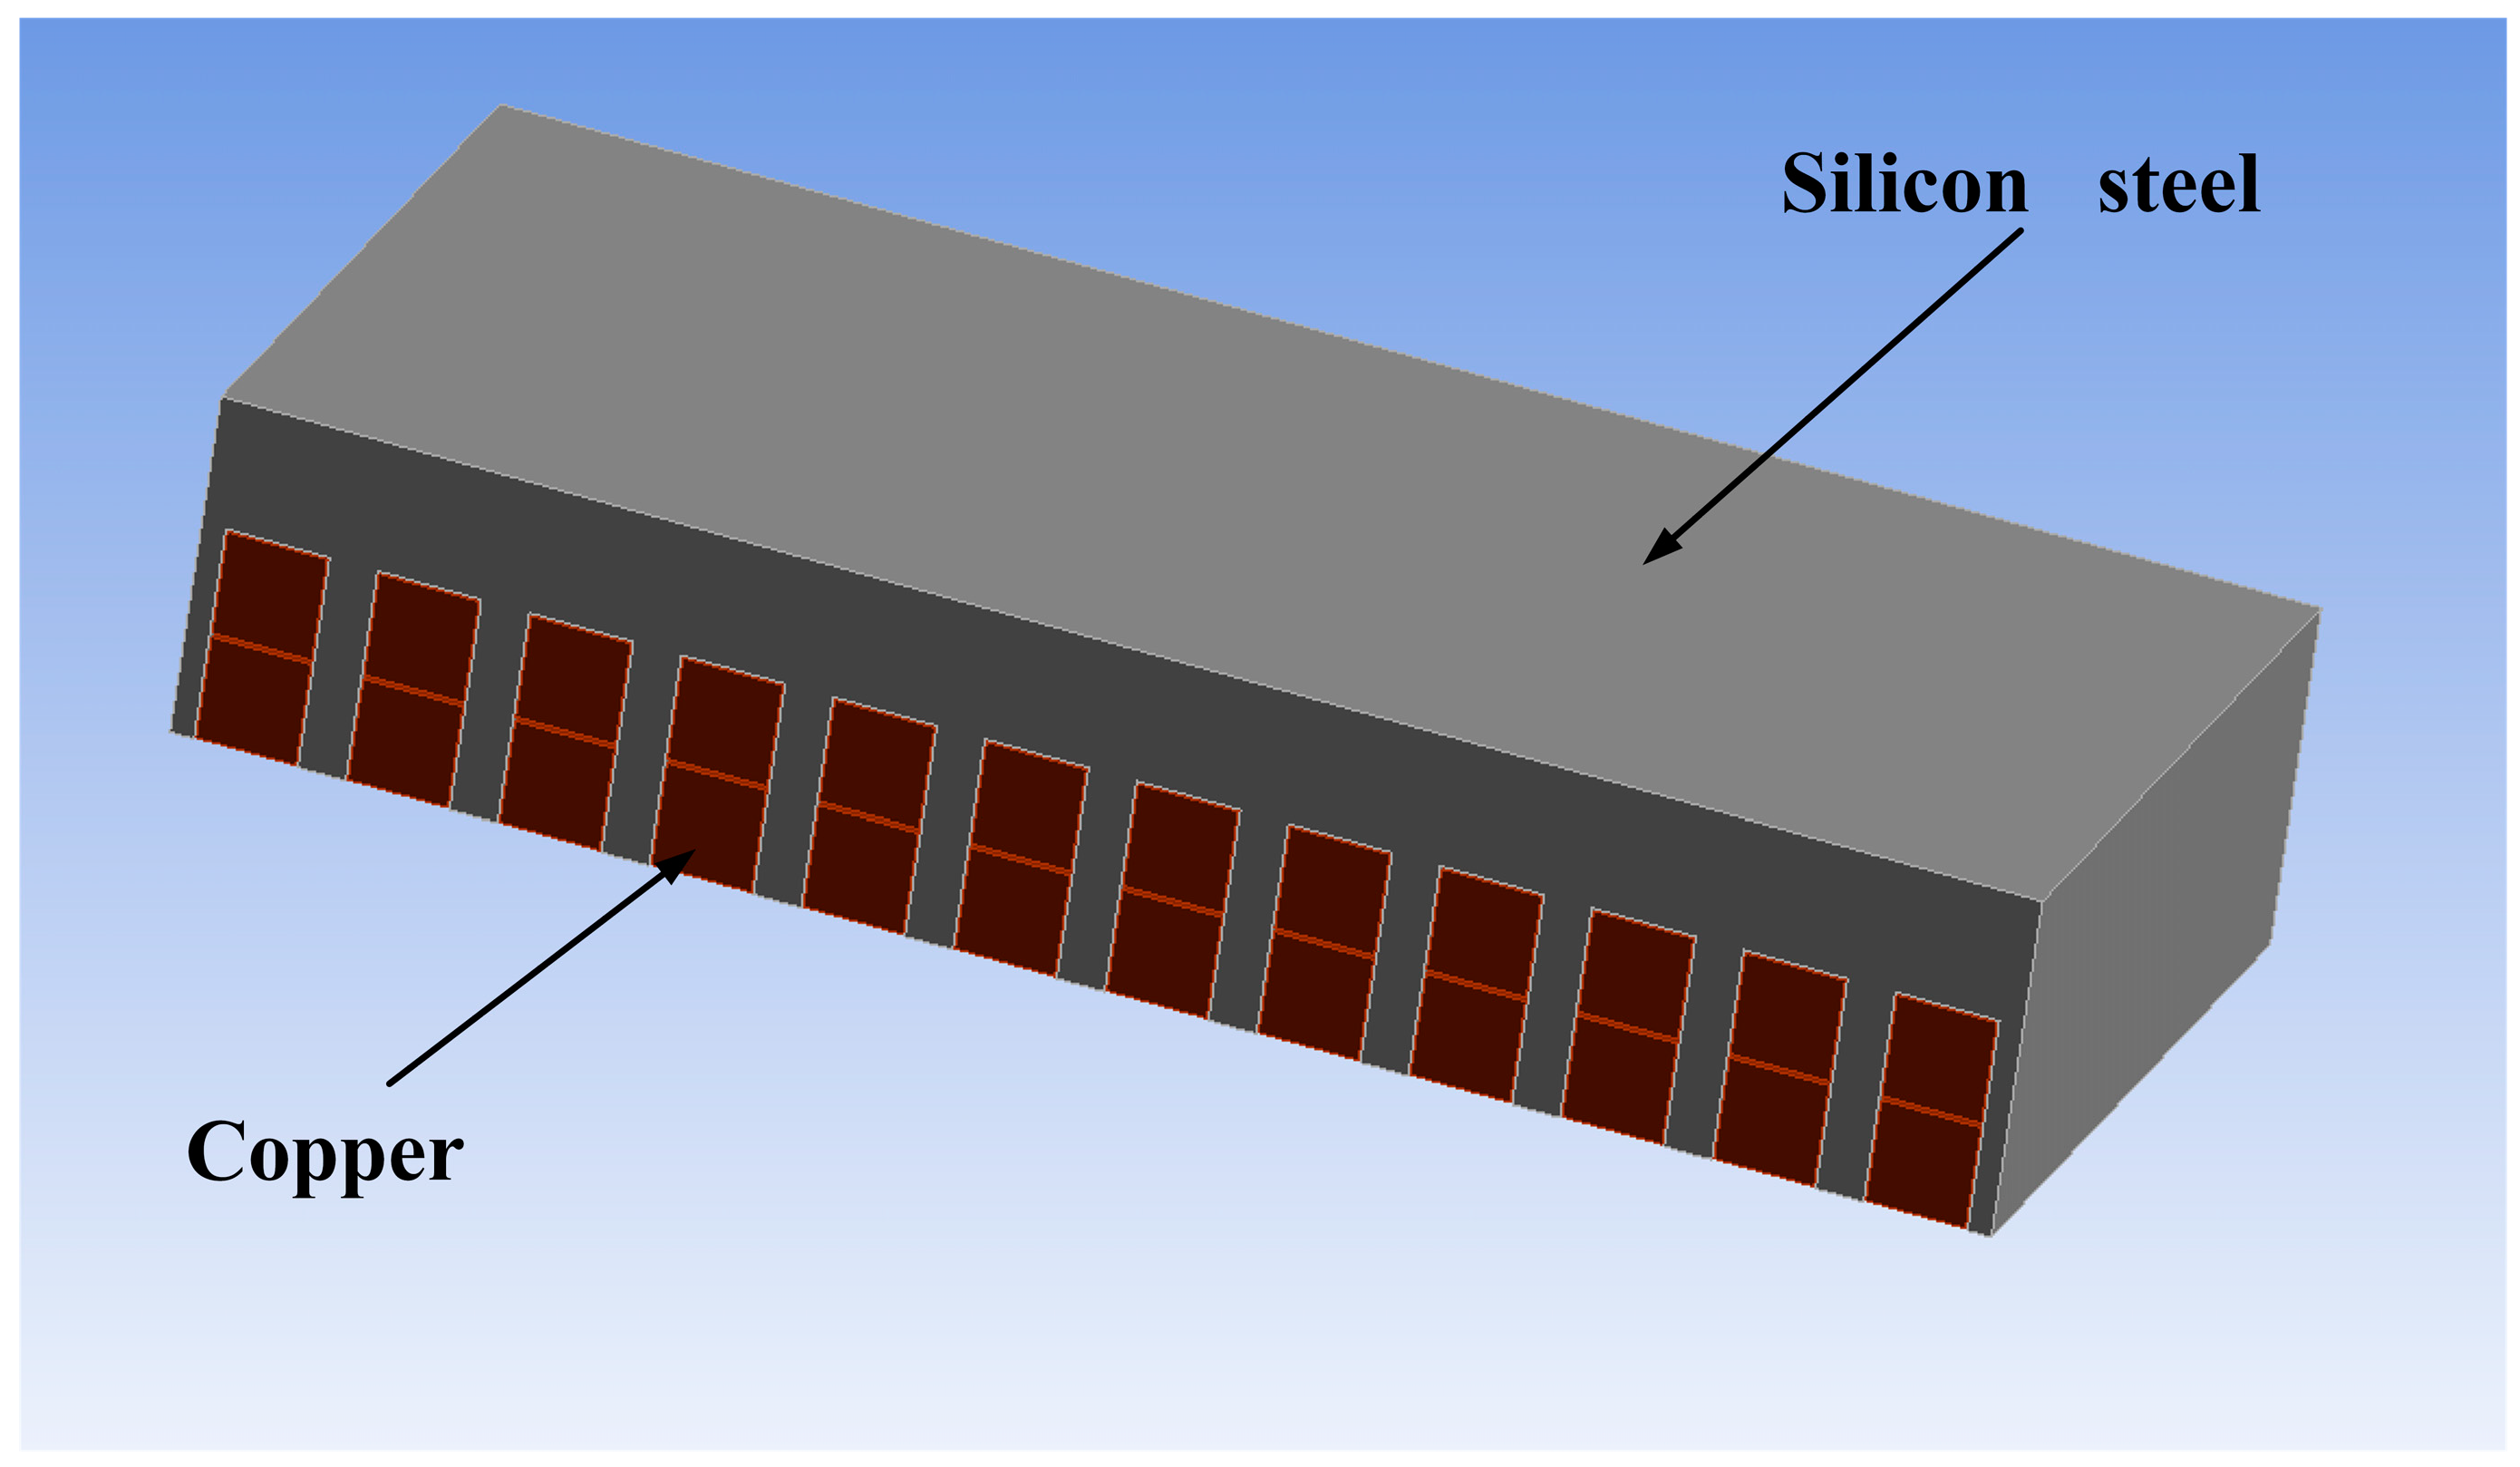
2. Structure and Operating Principle of Linear Phase-Shifting Transformer
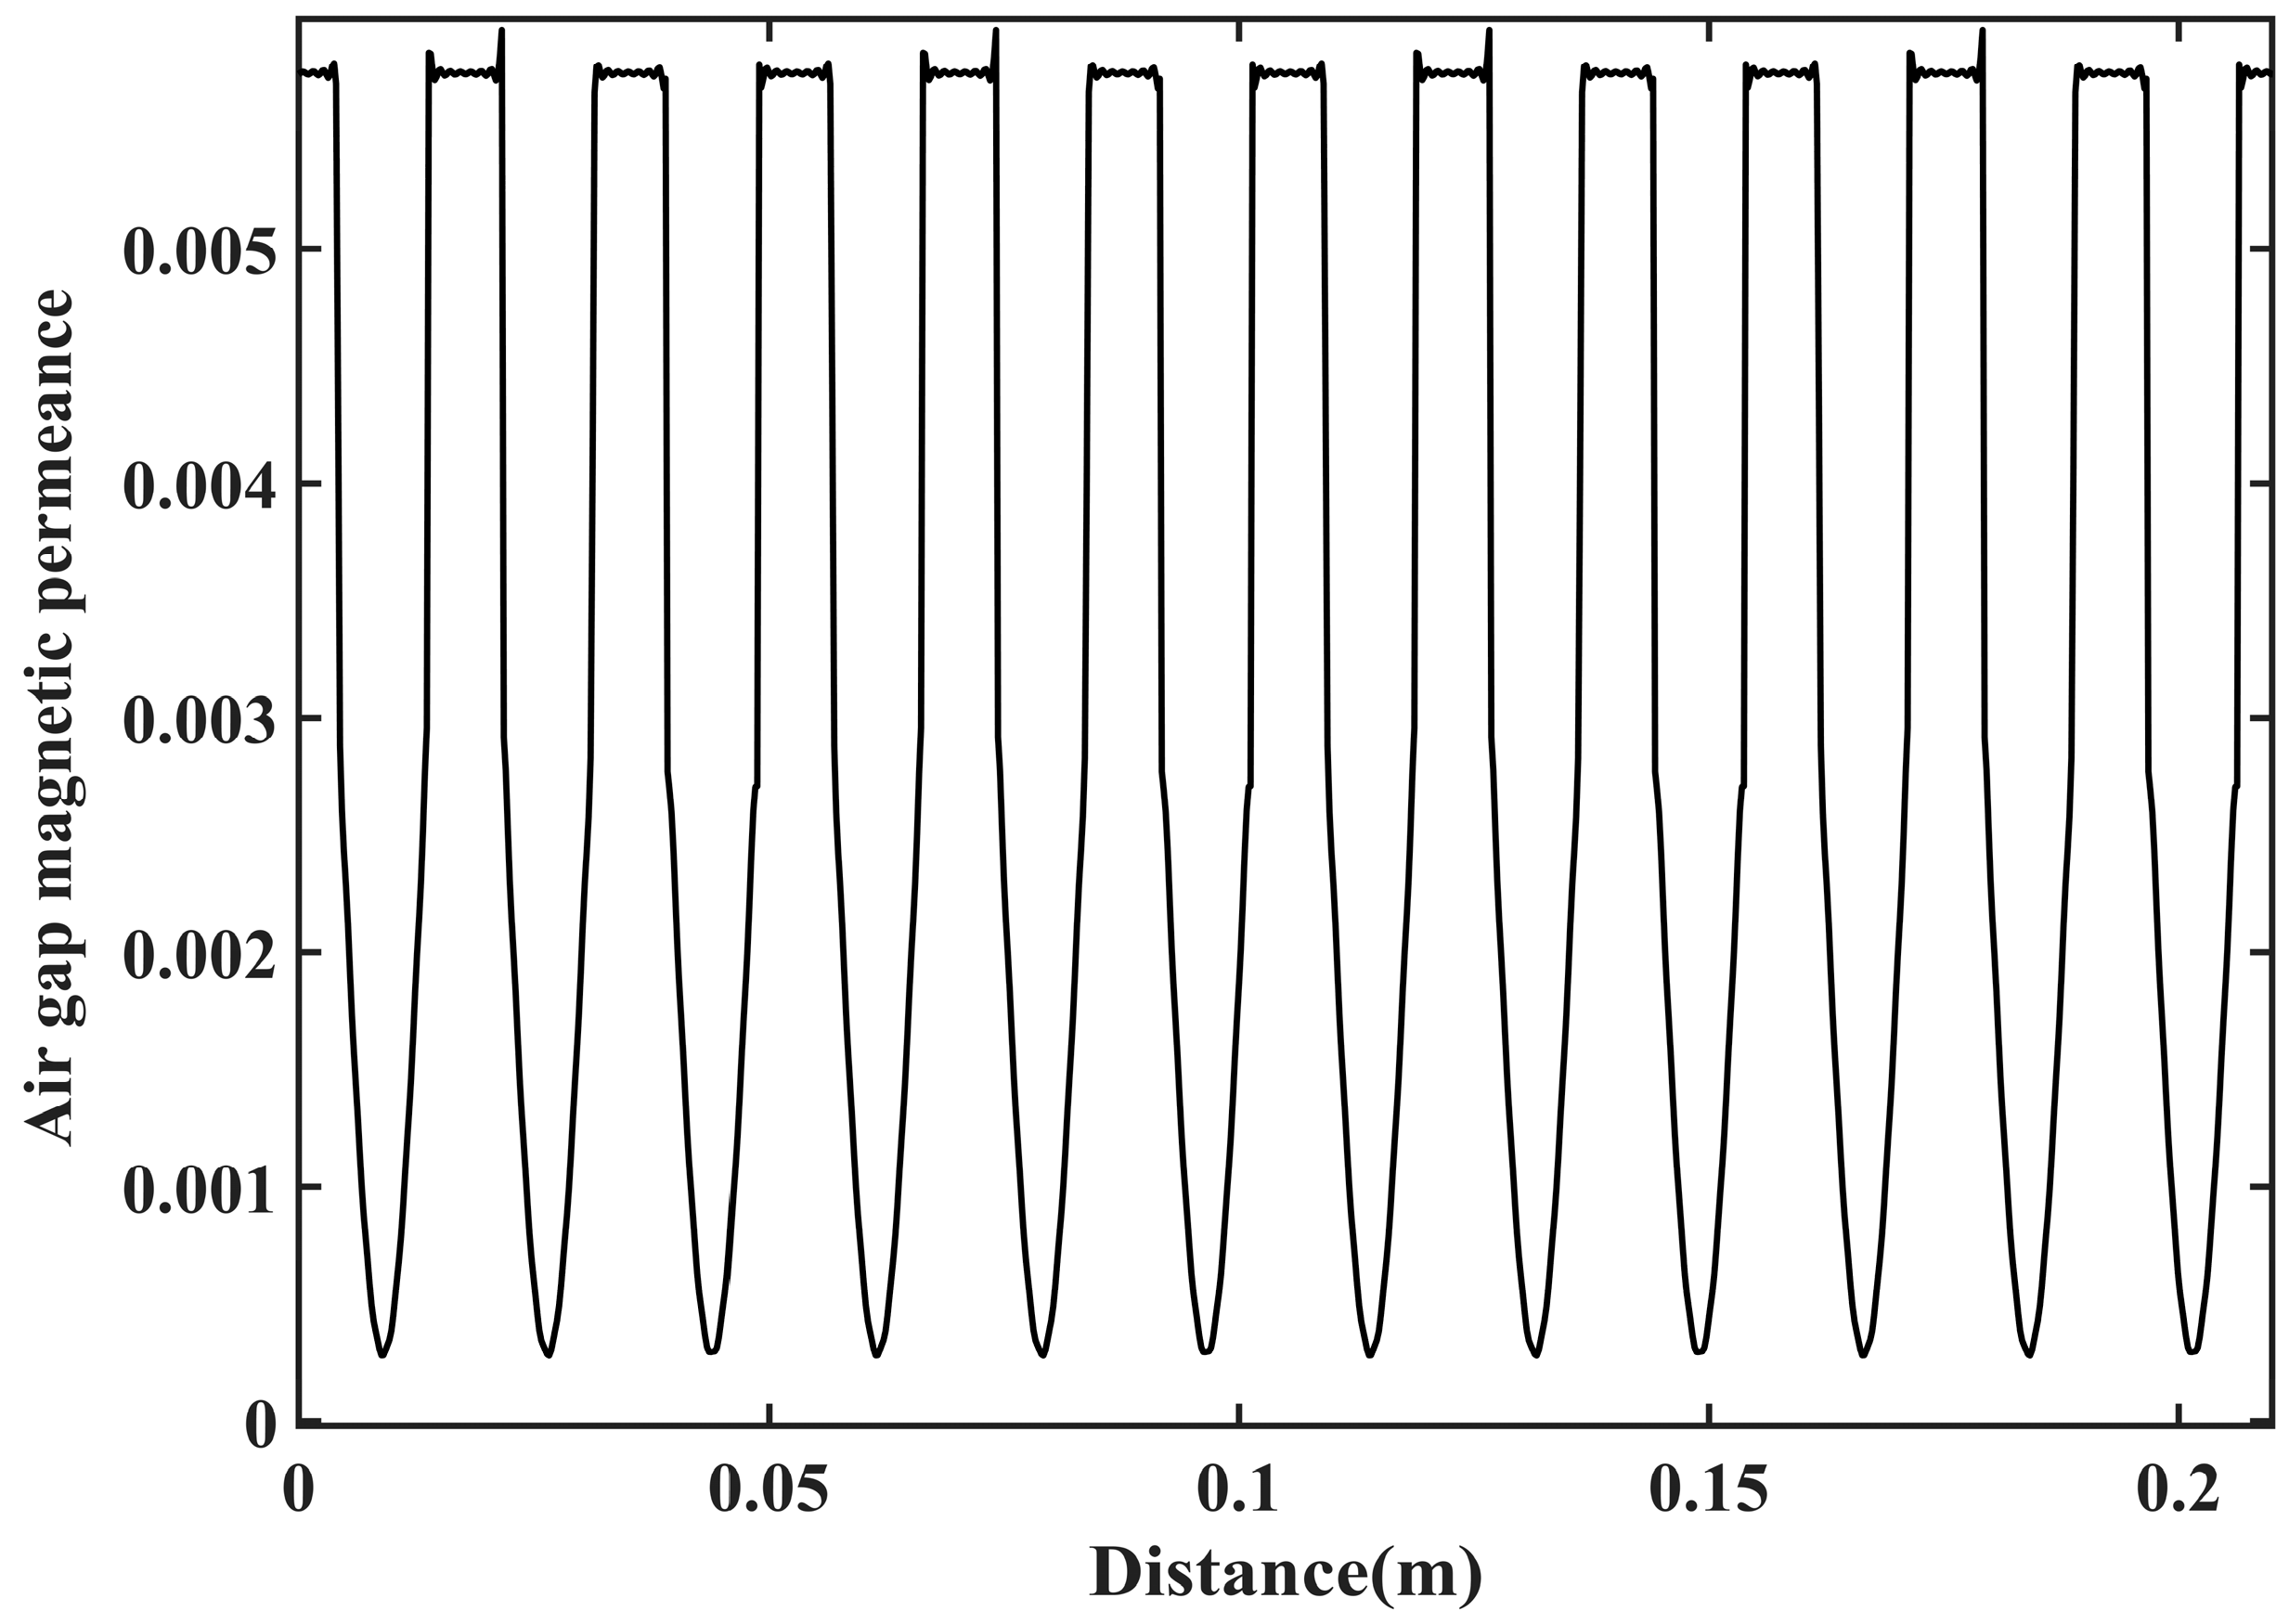
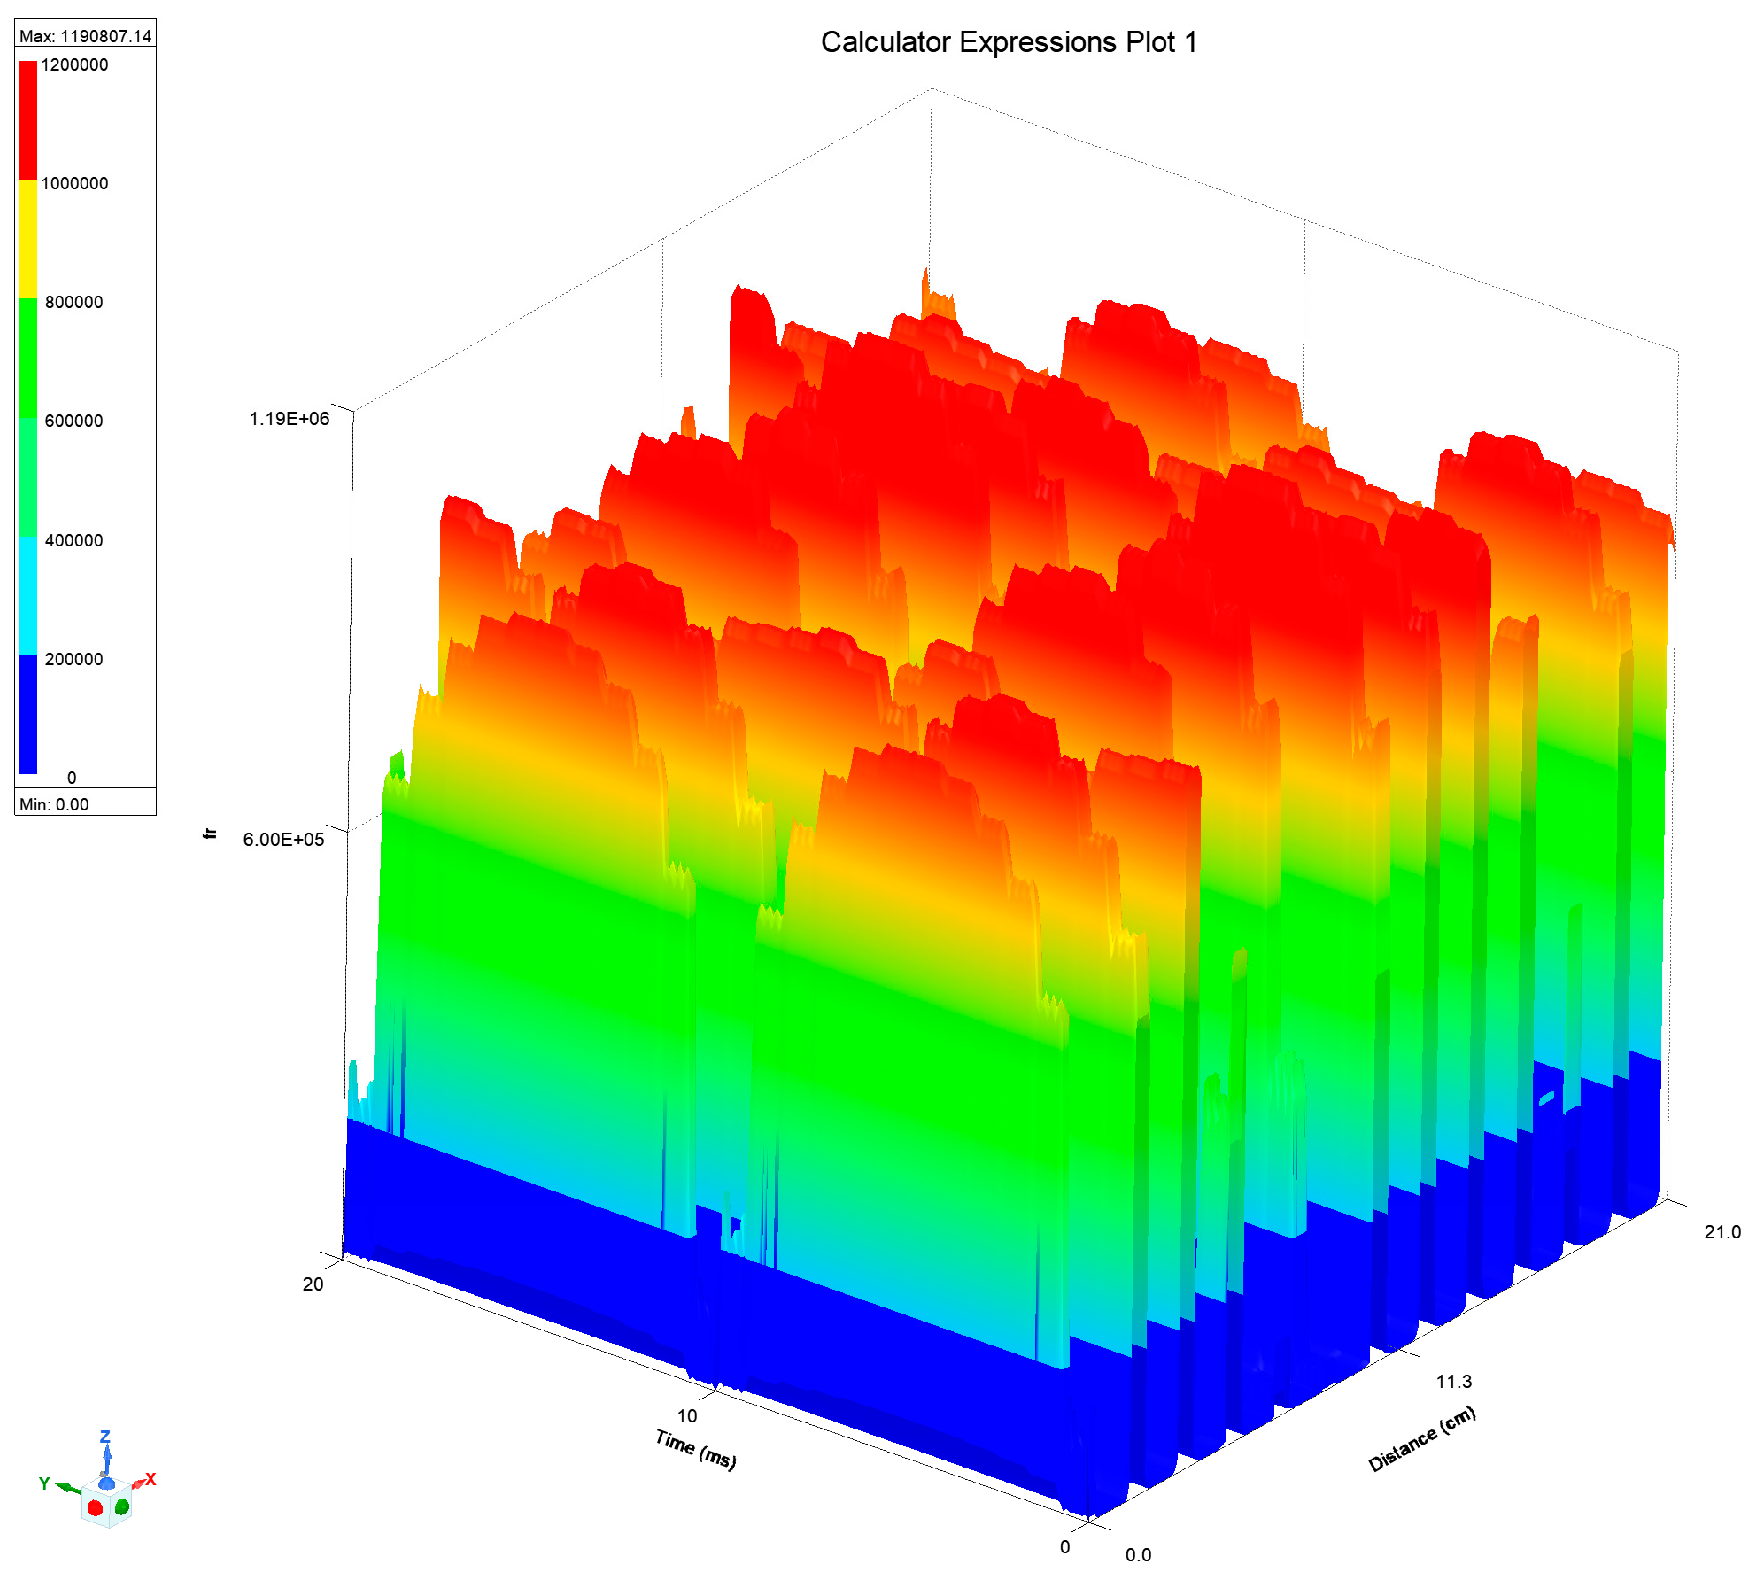
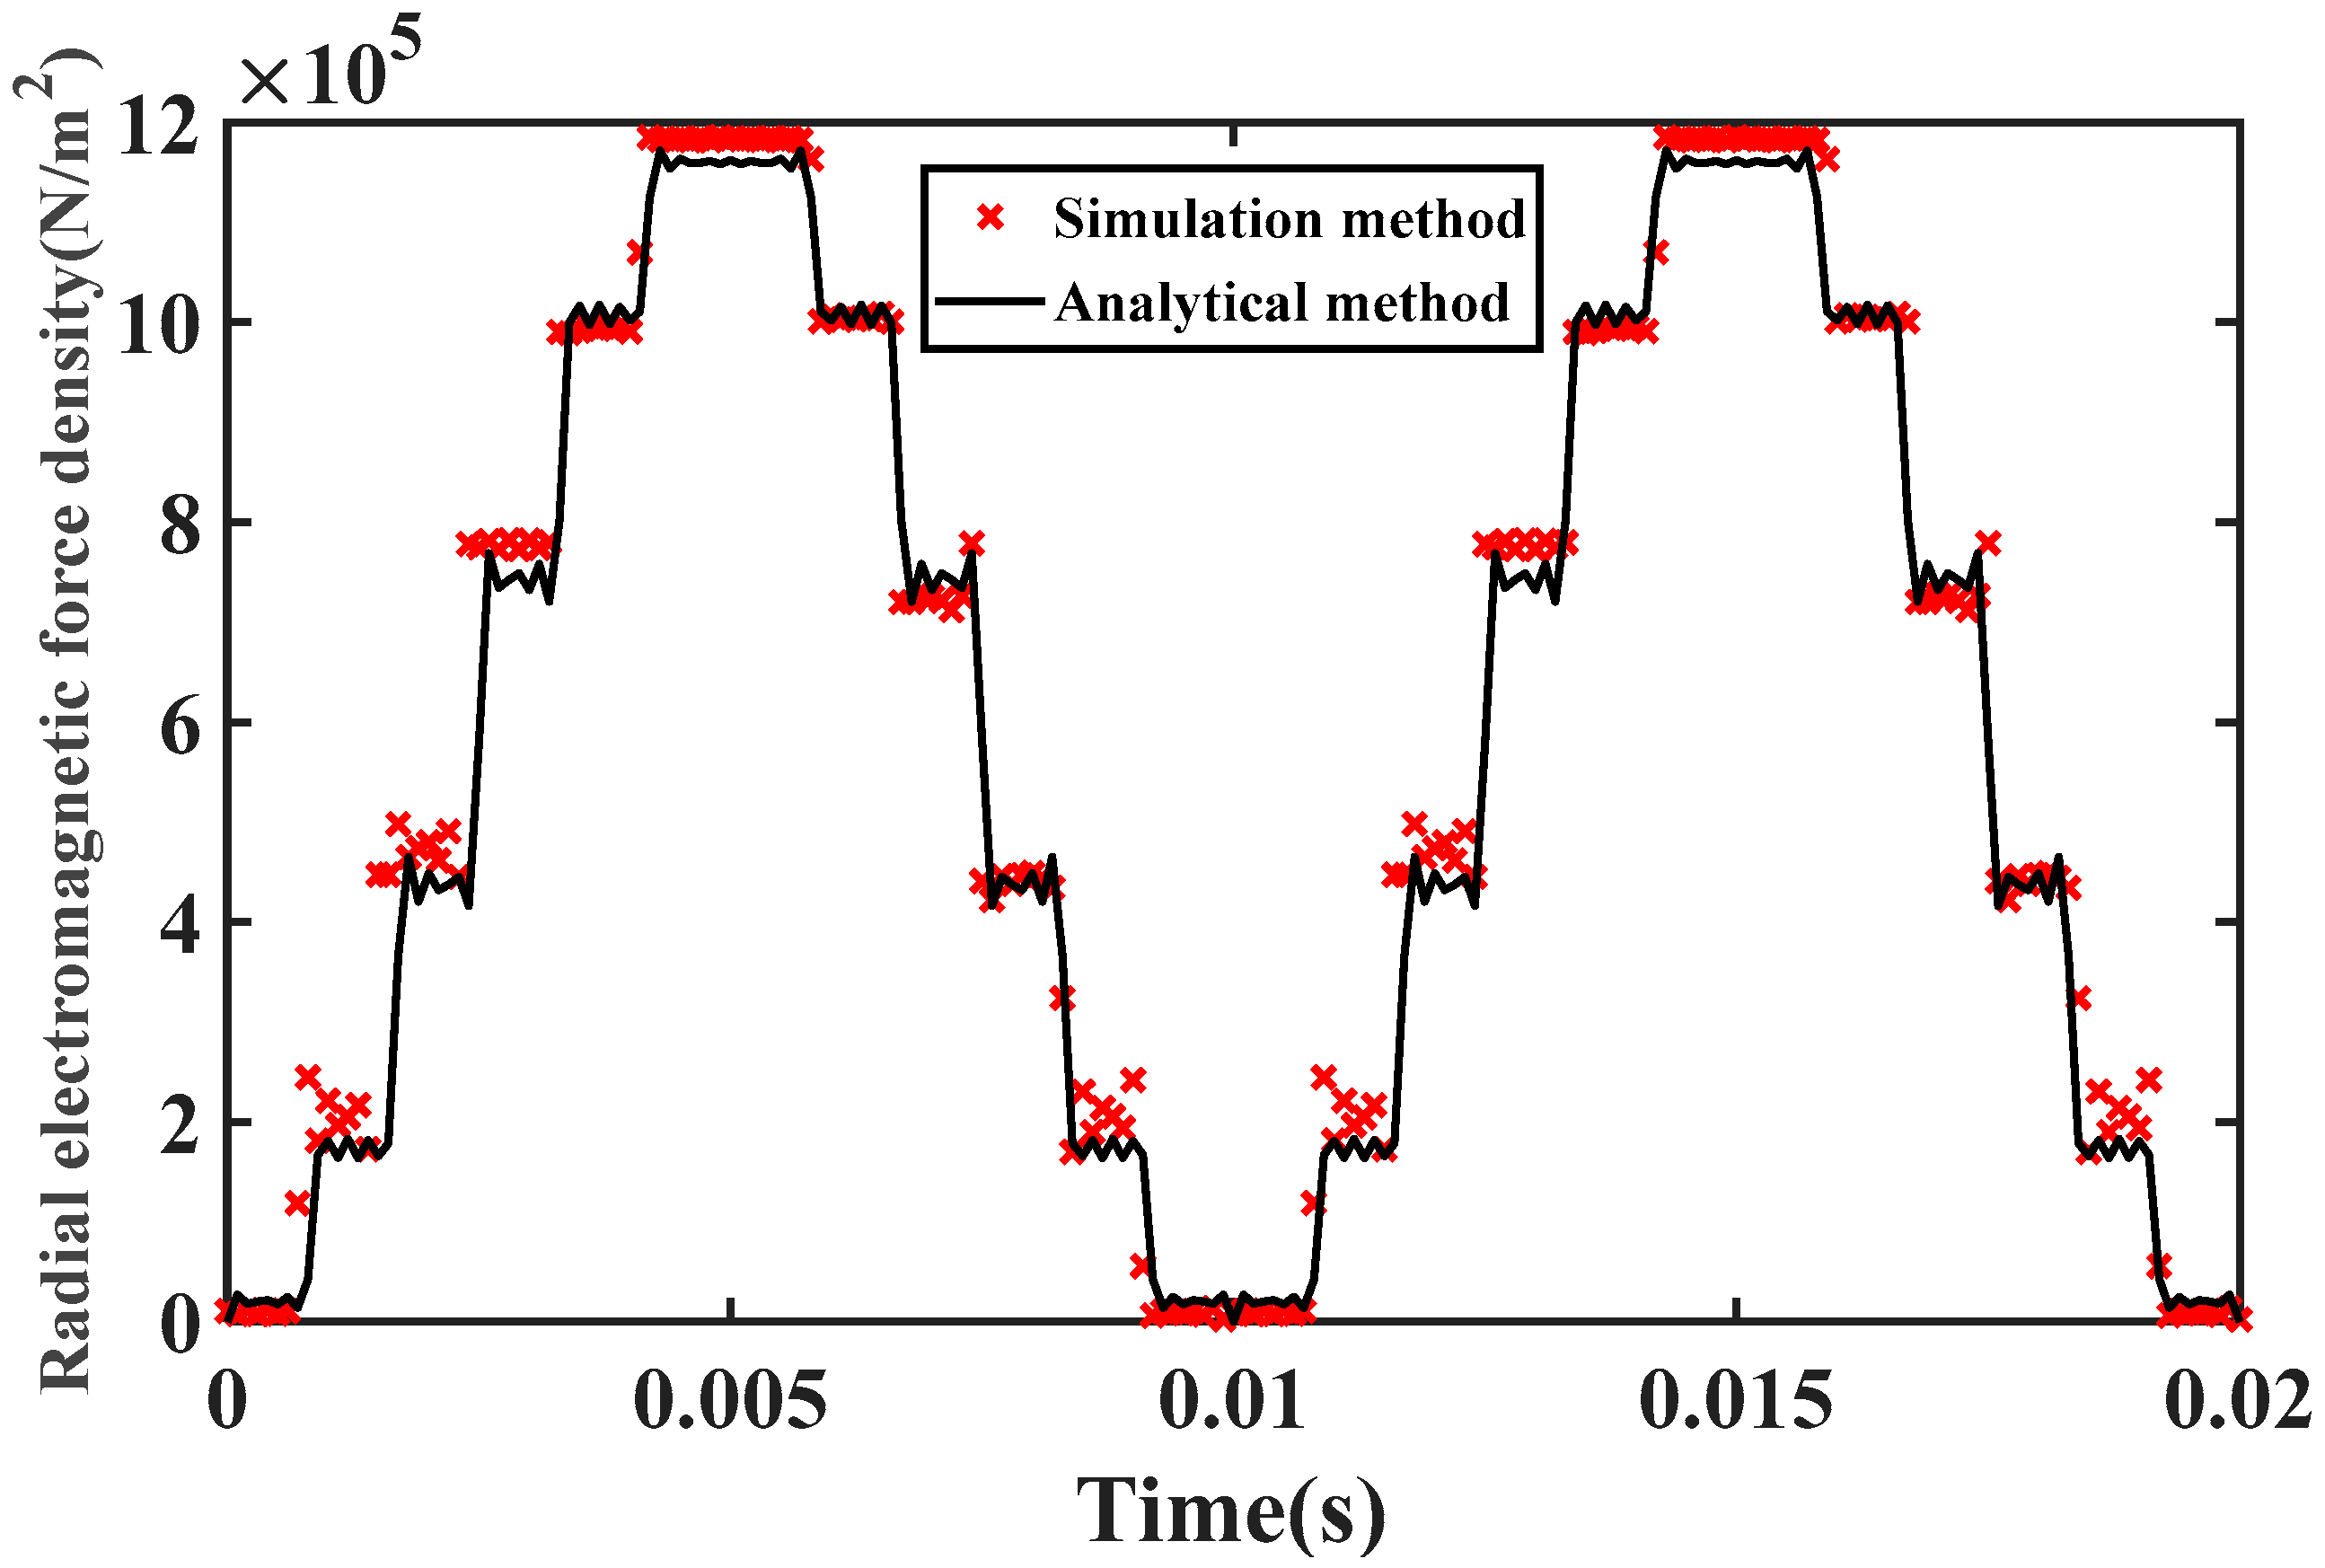
3. Radial Electromagnetic Force Calculation
- (1)
- Ignore the impact of core saturation;
- (2)
- The permeability of the iron core is regarded as infinity;
- (3)
- It is considered that the air gap magnetic field is constant in the thickness direction of the transformer.
- (4)
- The Cartesian coordinate system and the direction of the radial electromagnetic force of the LPST are shown in Figure 6.
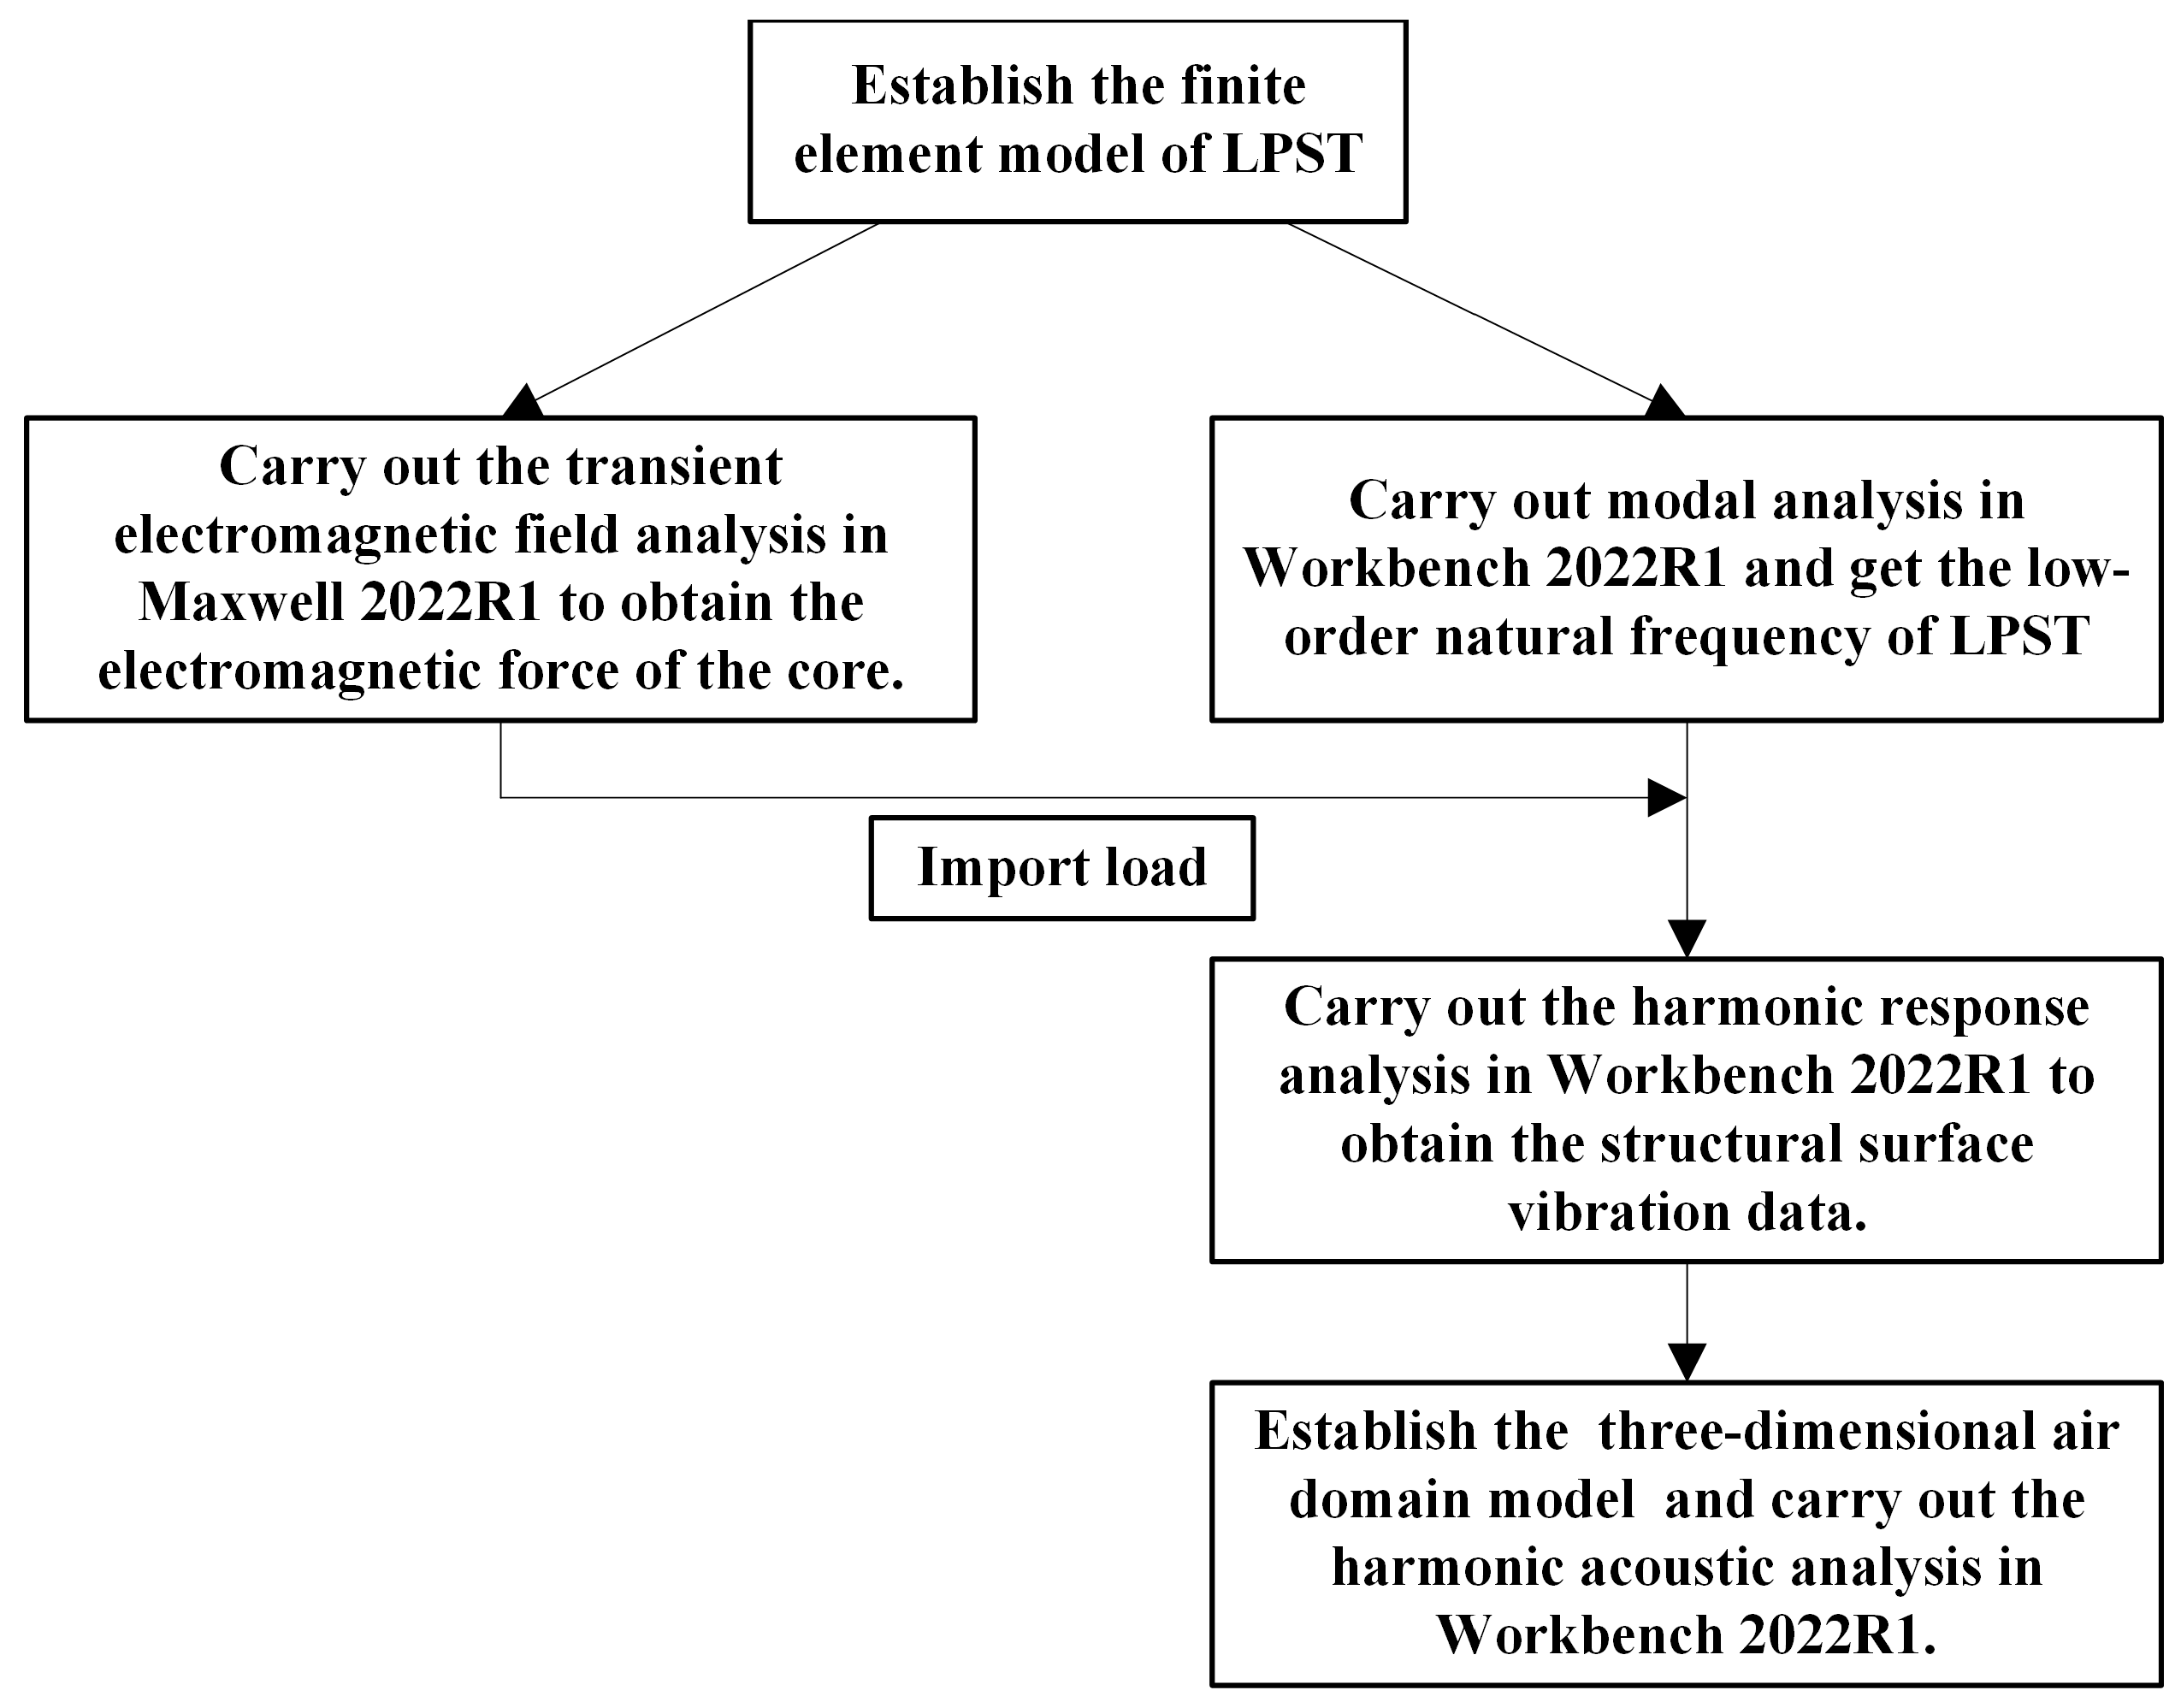
4. Finite Element Analysis of Electromagnetic Vibration and Noise of LPST
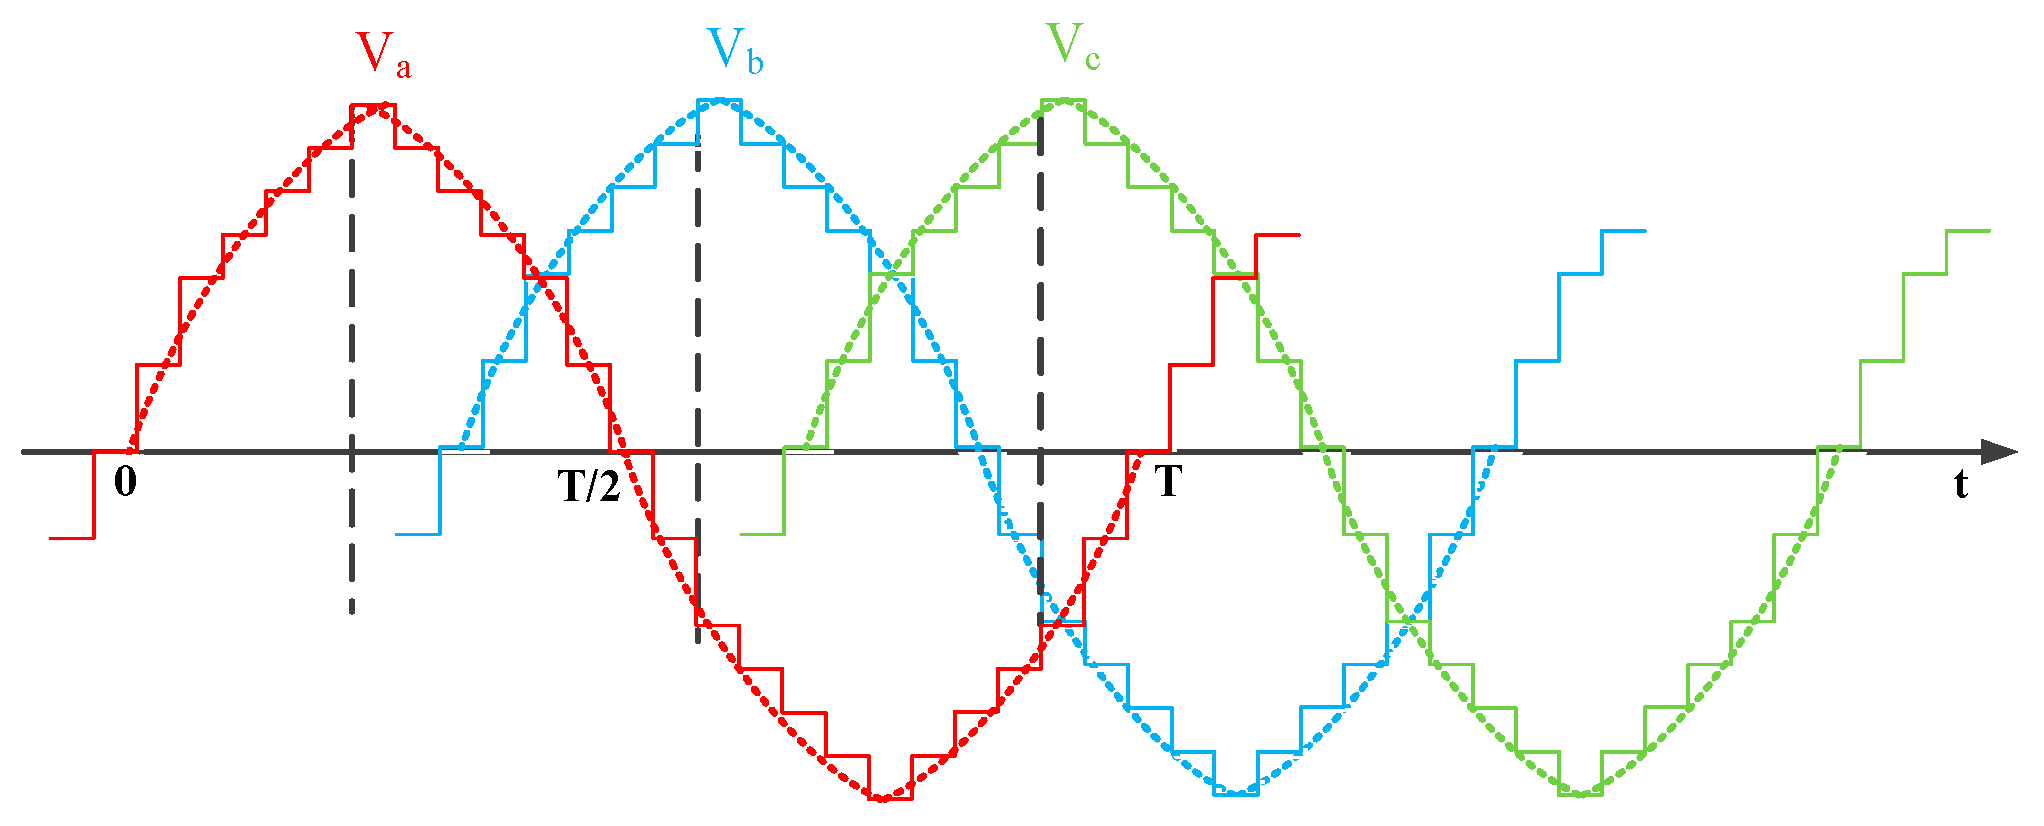
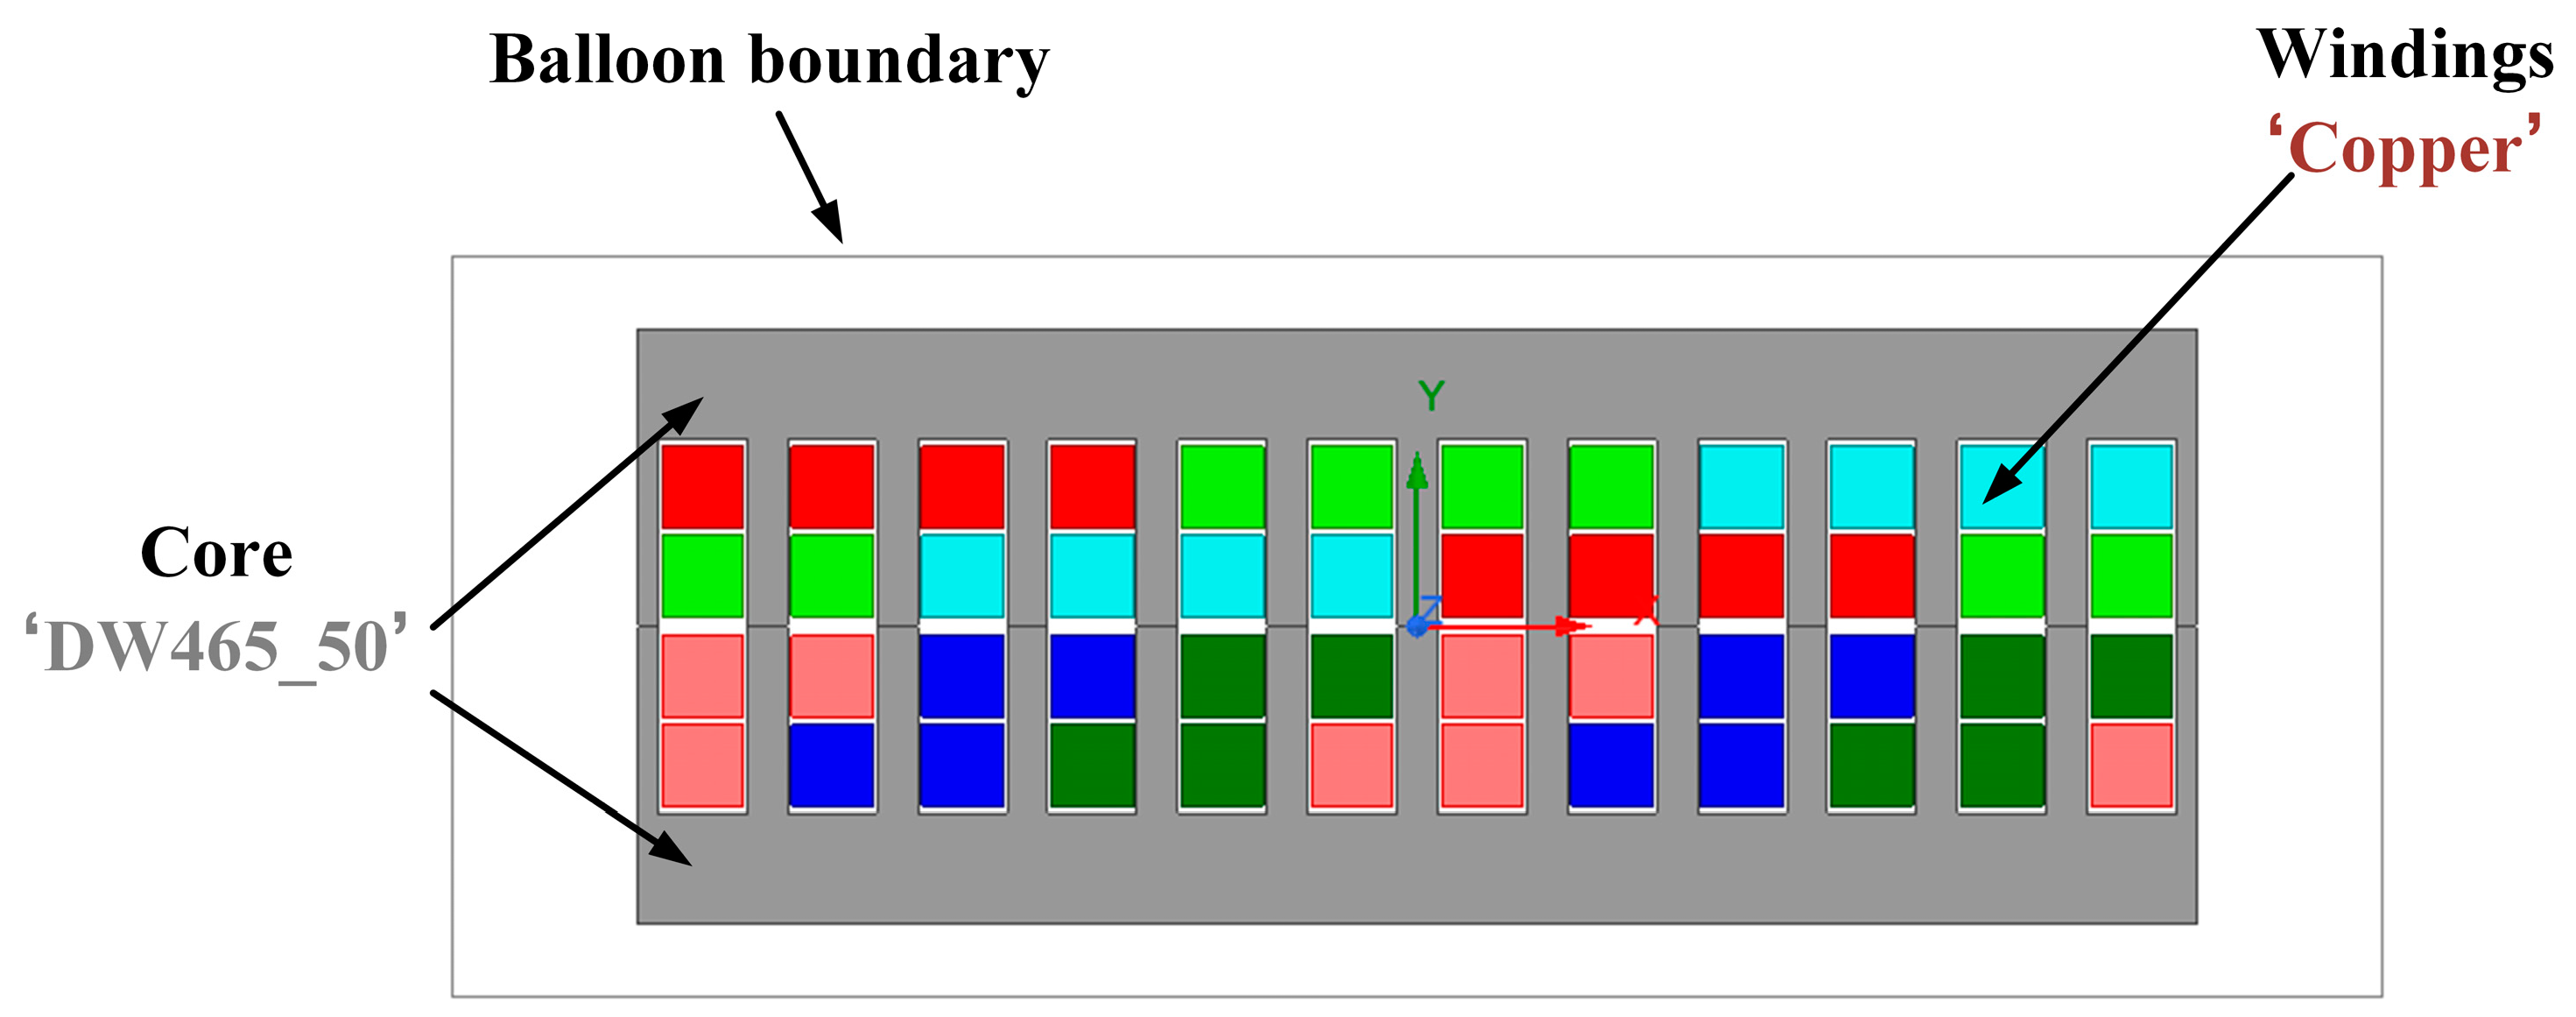
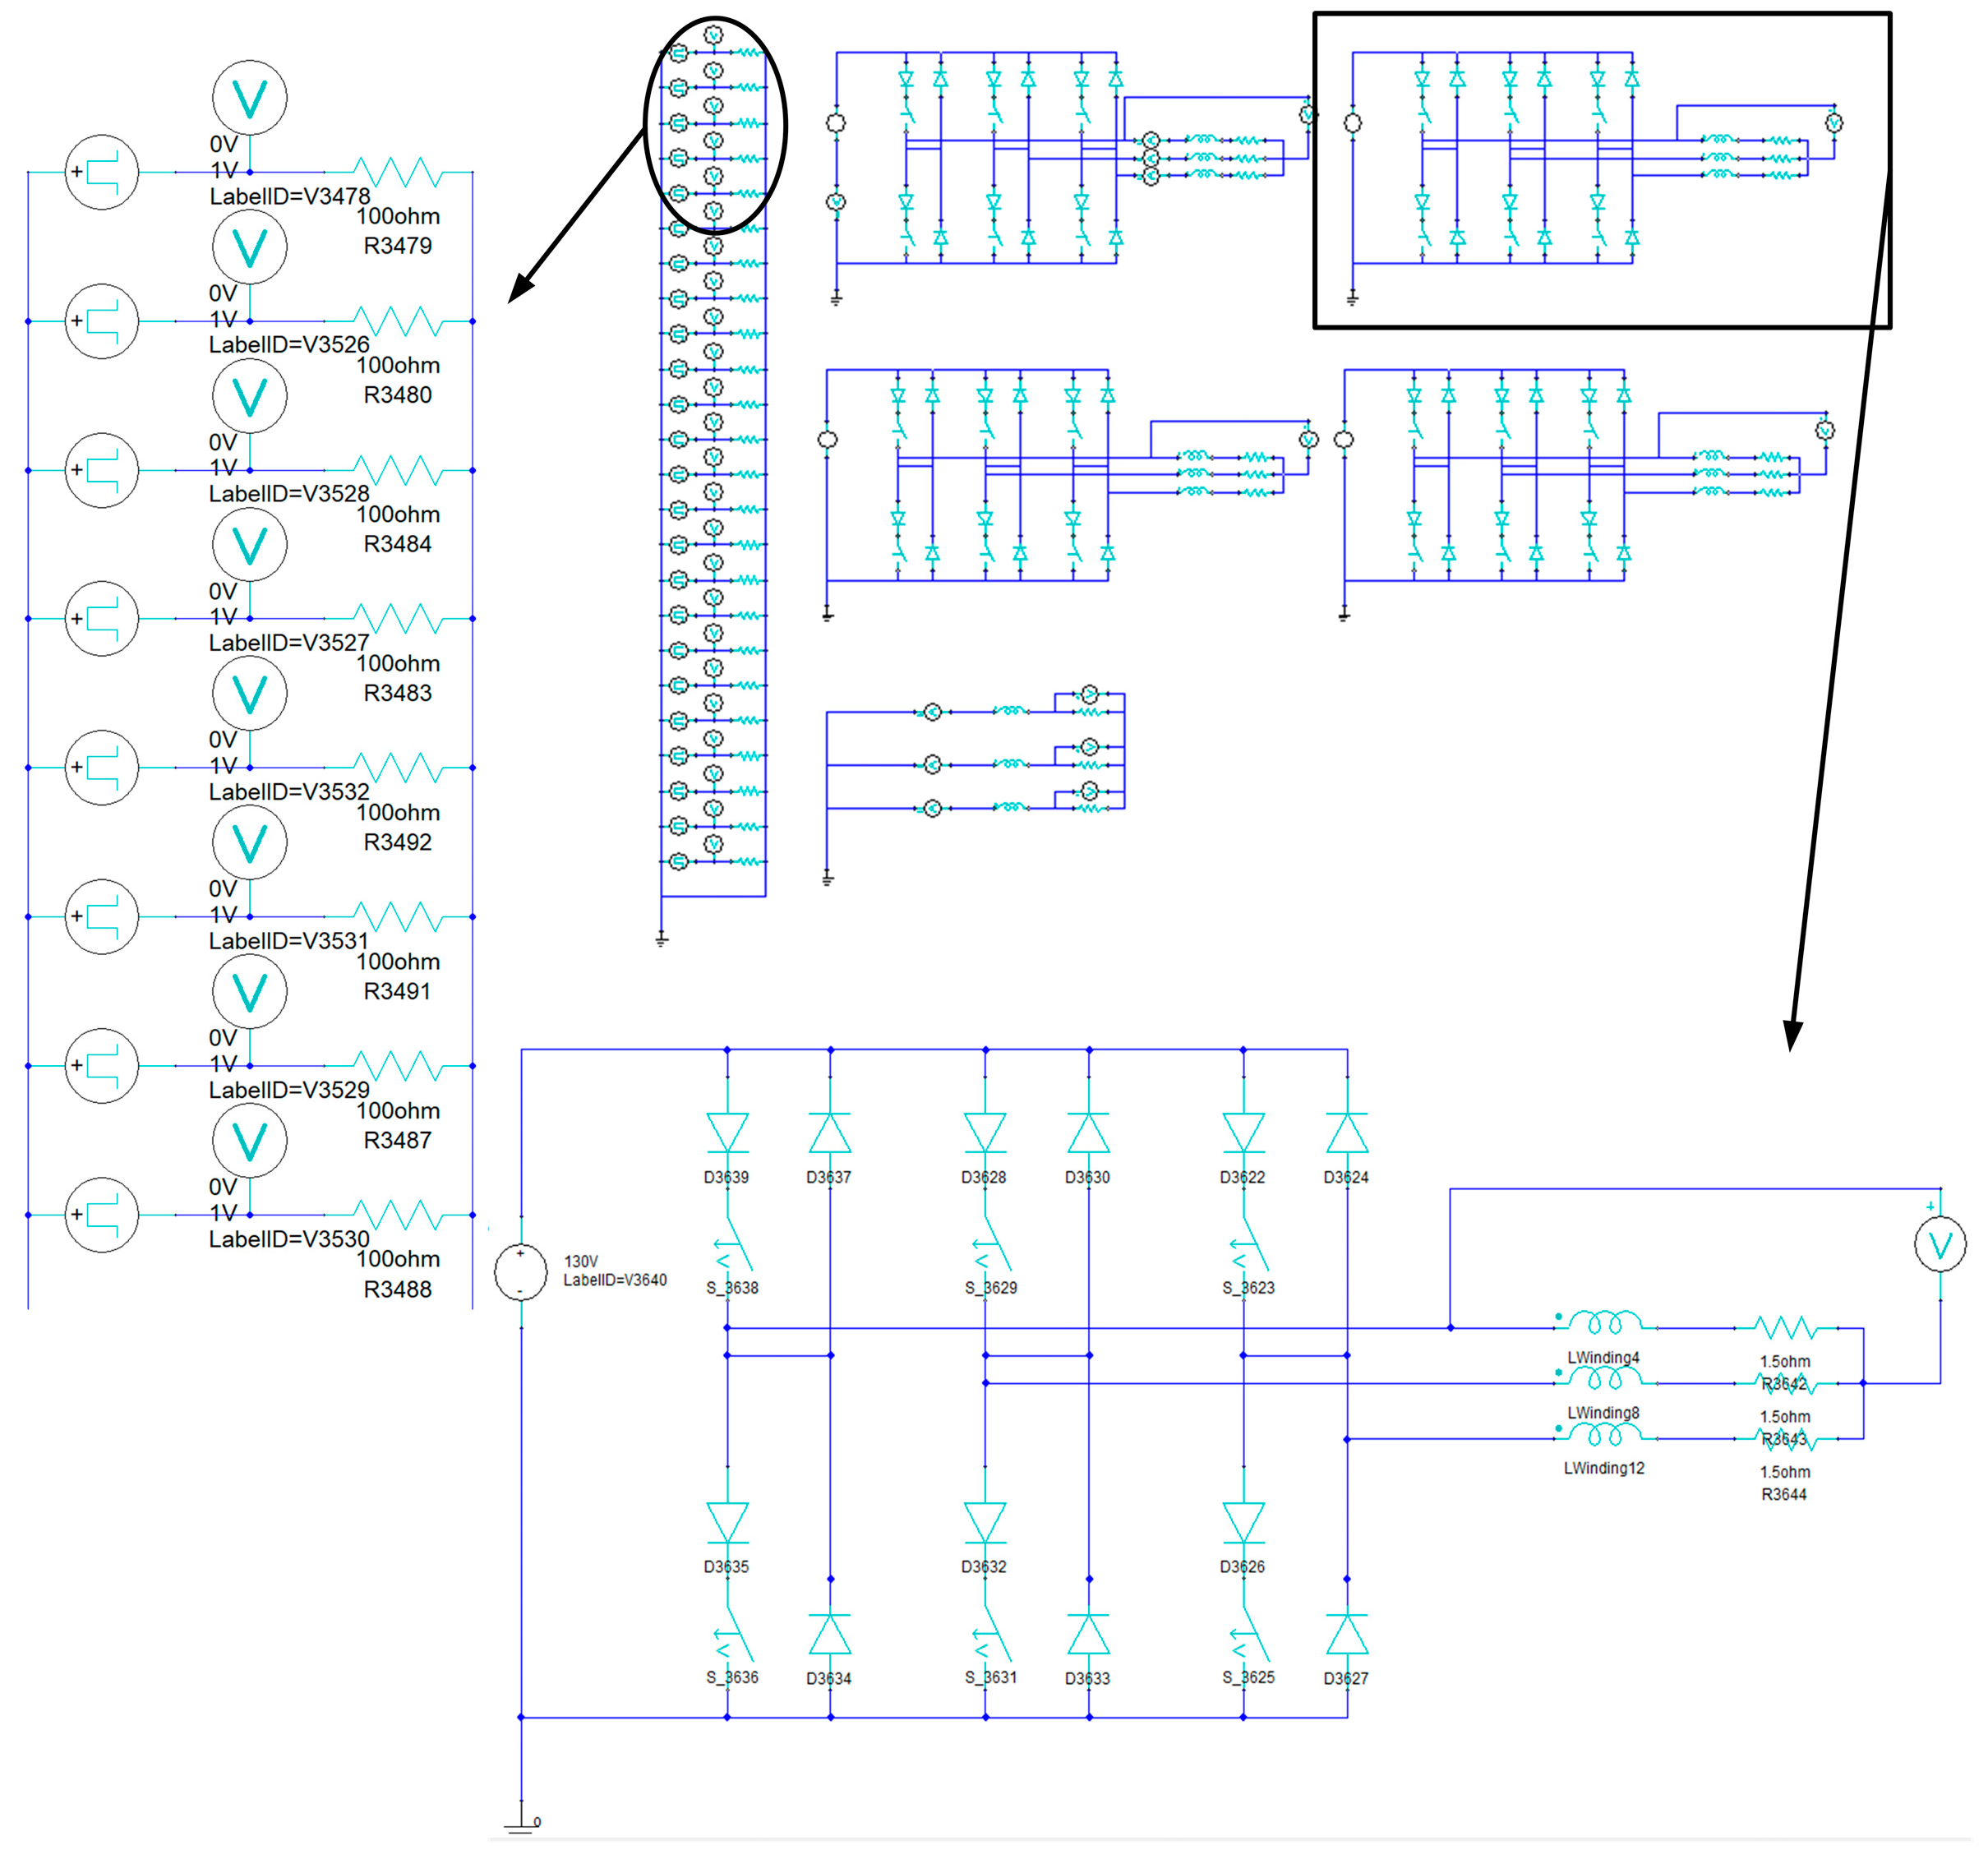
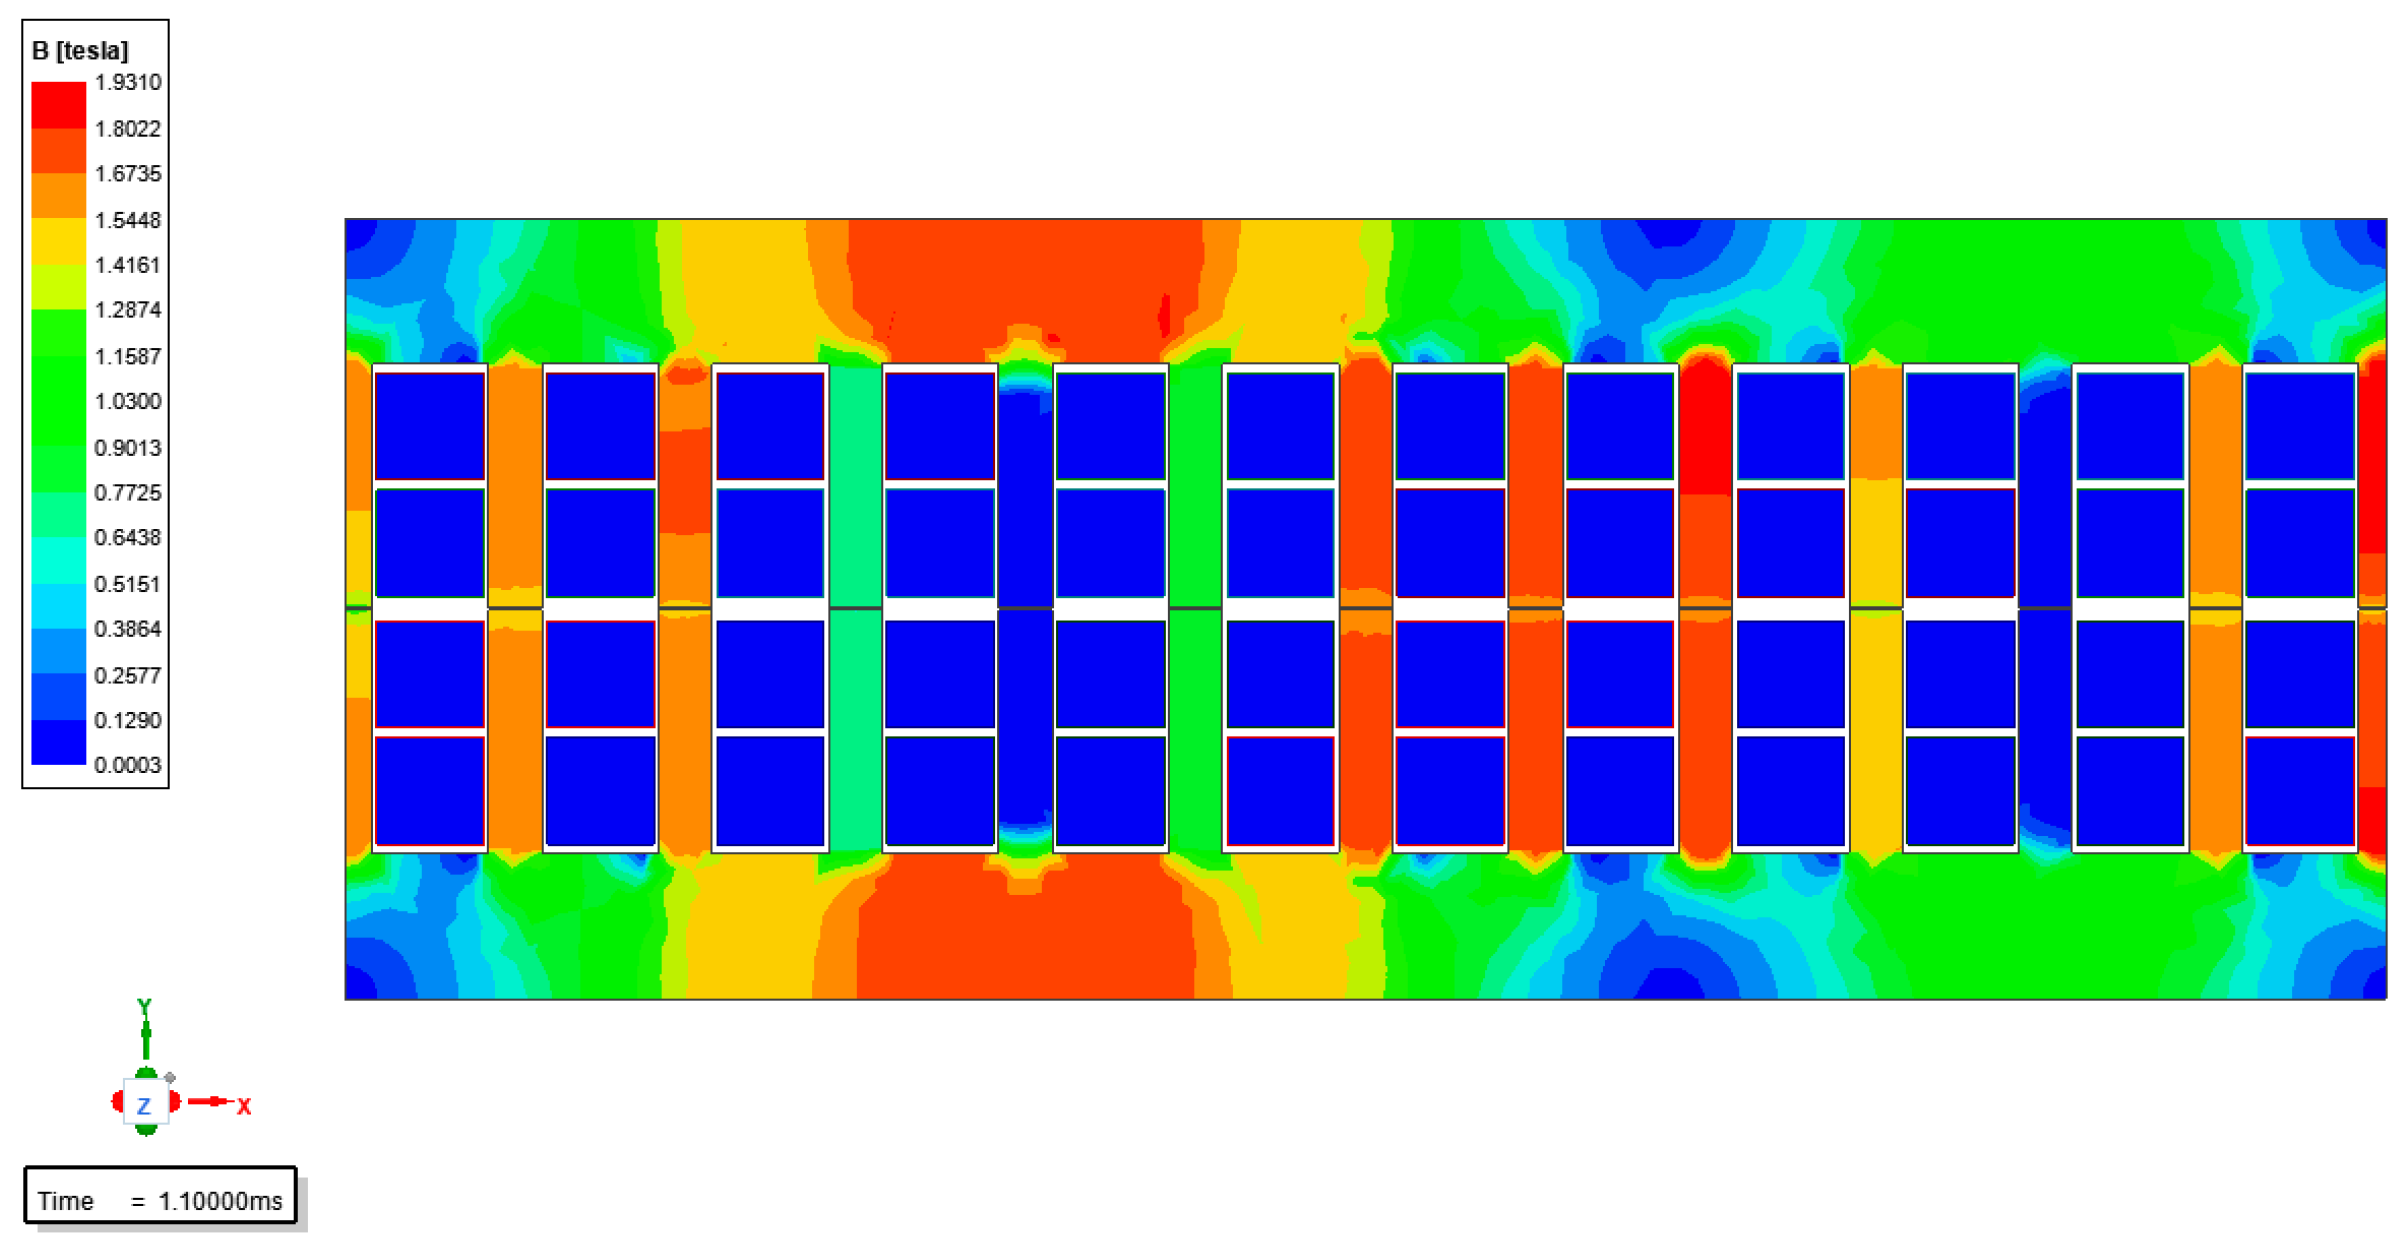
4.1. Finite Element Simulation of Transient Electromagnetic Field of LPST
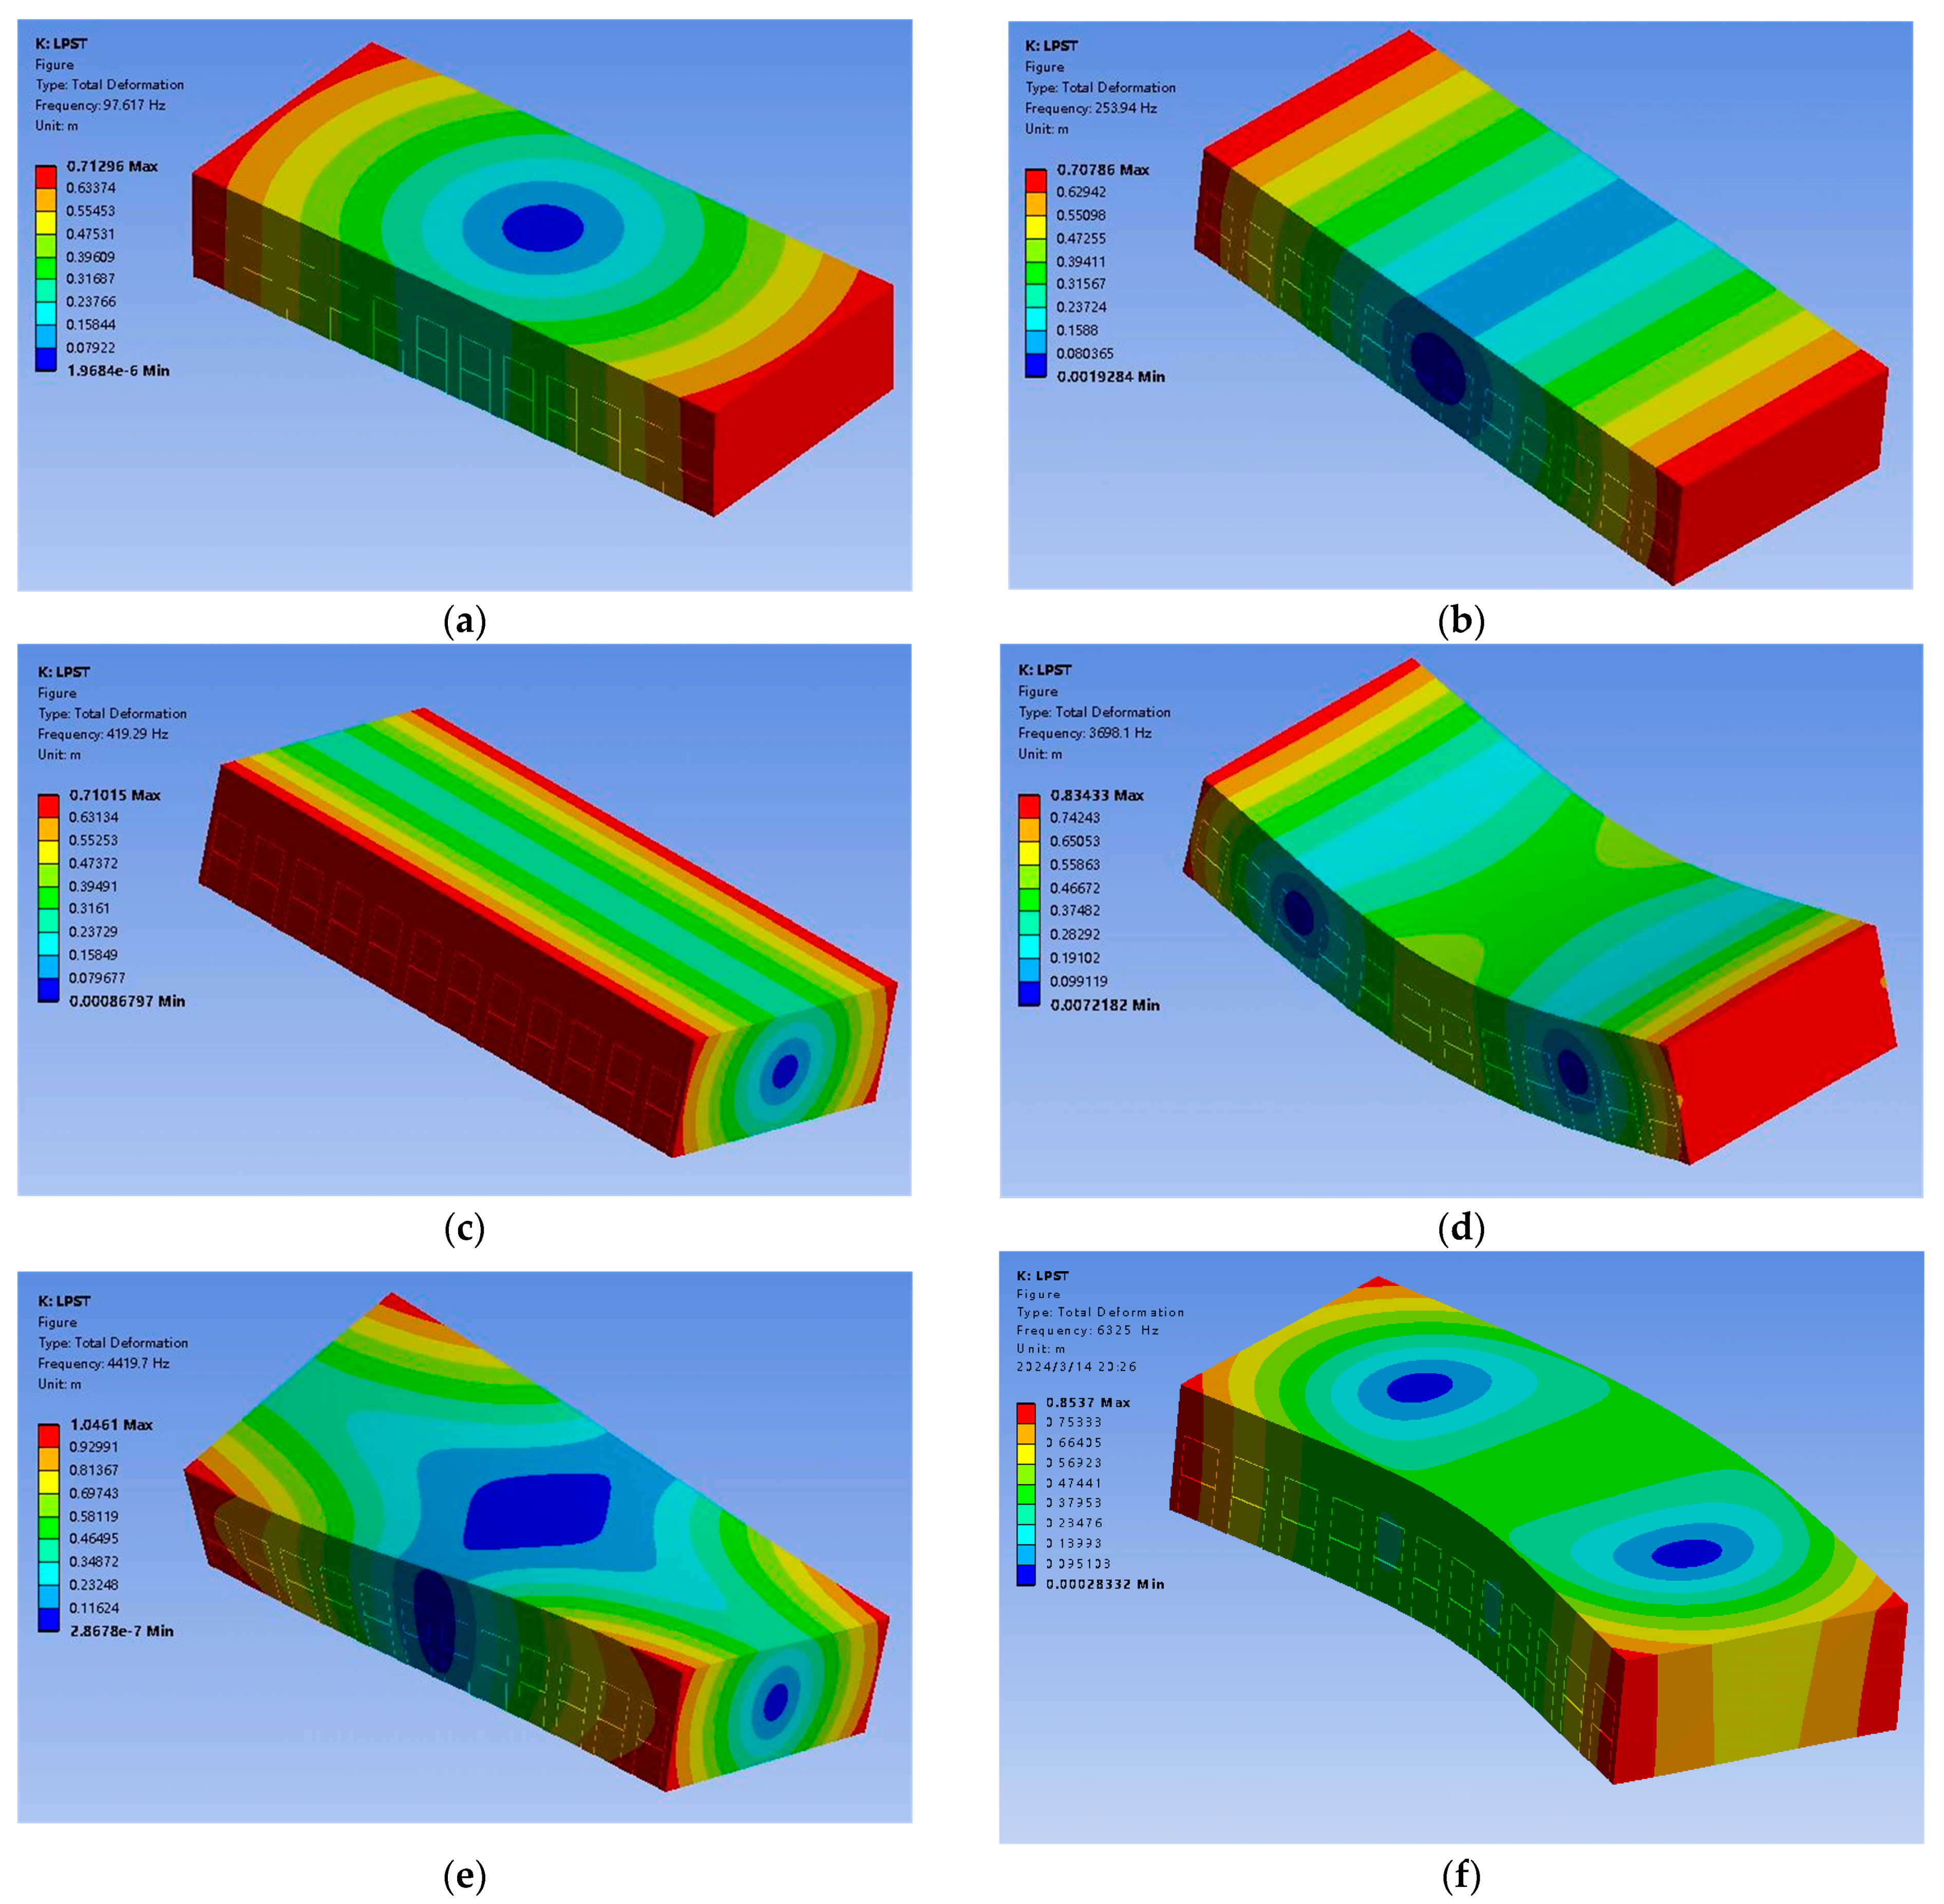
4.2. Modal Analysis of LPST
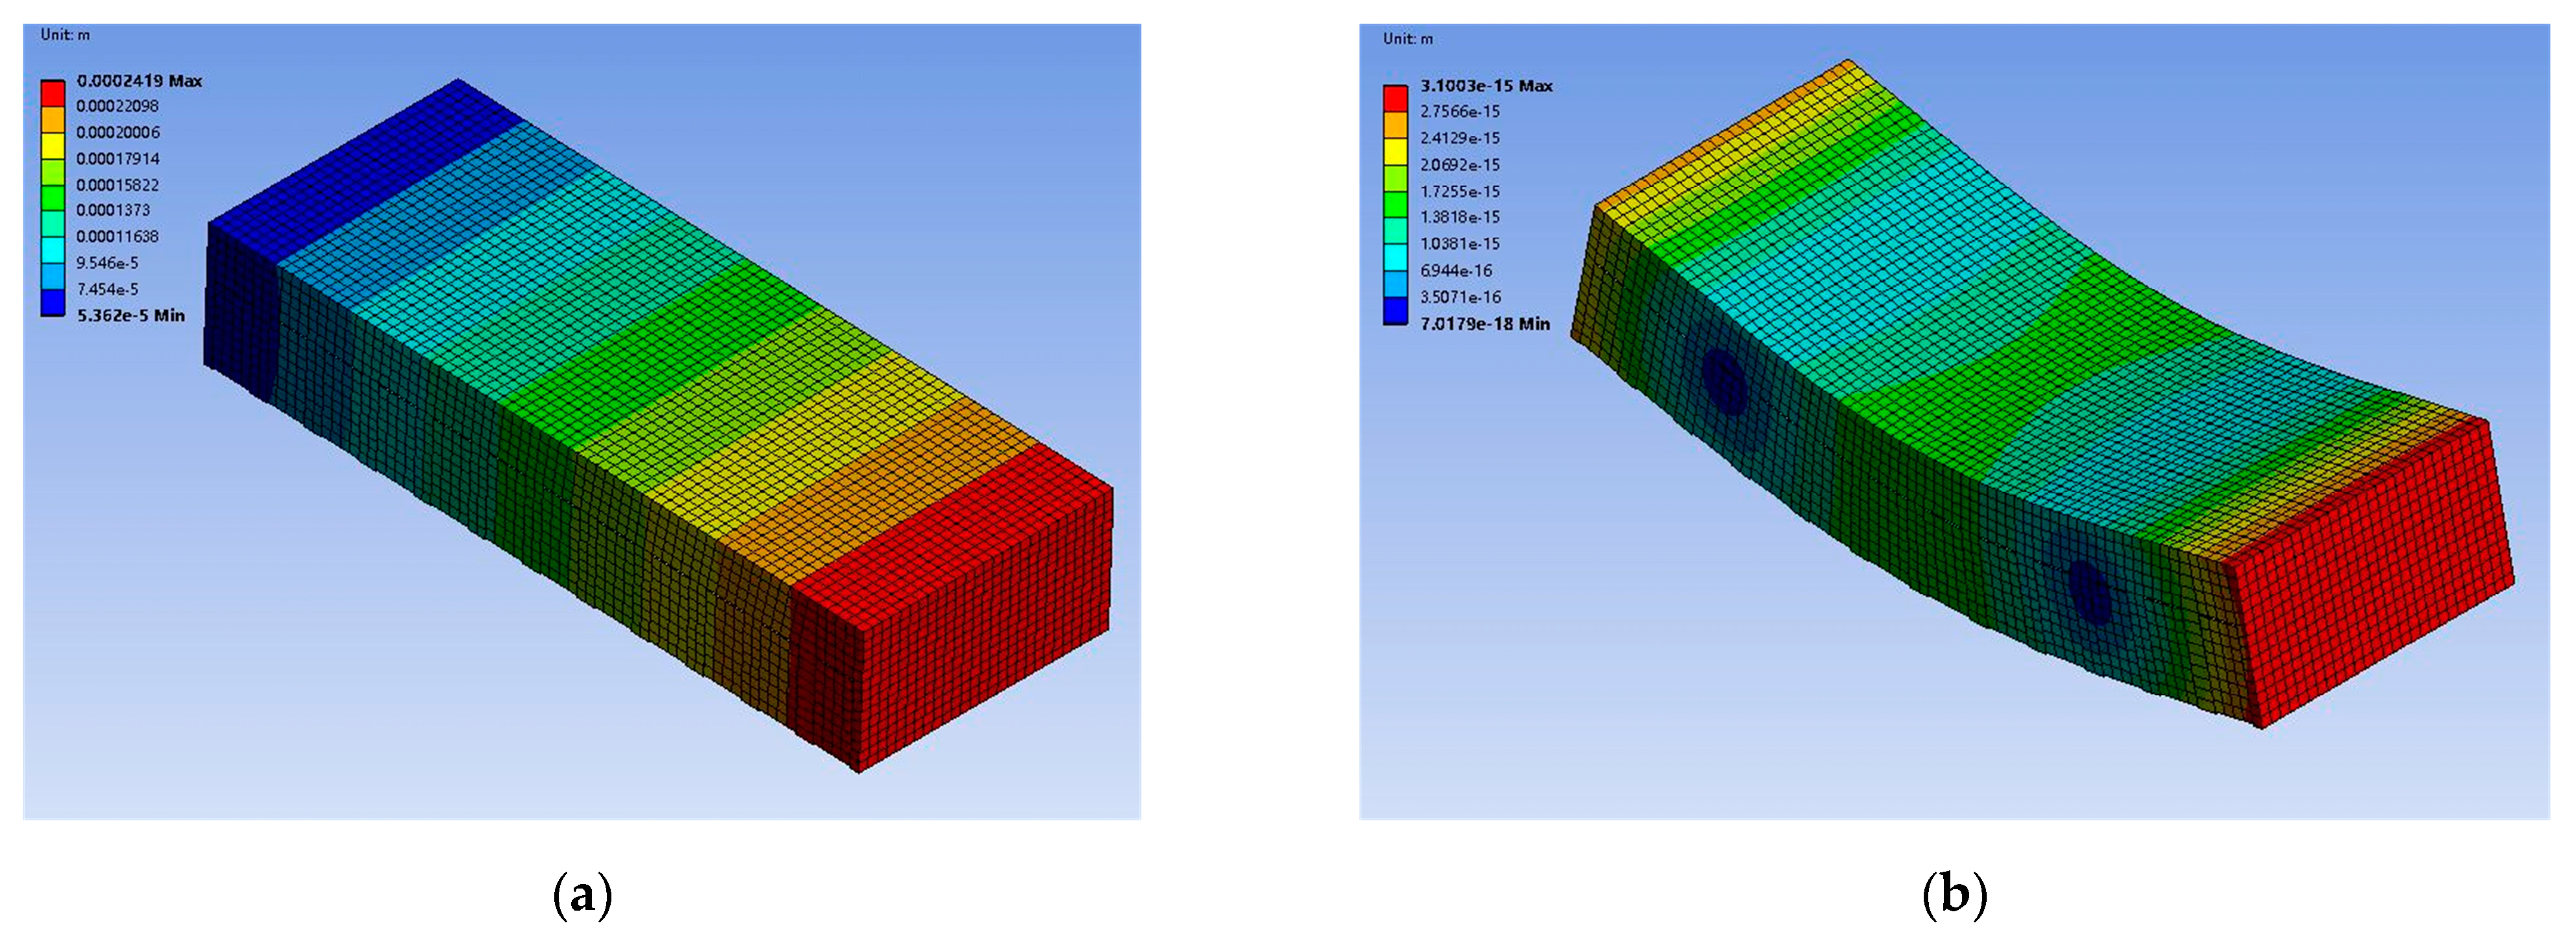
4.3. Harmonic Response Analysis of LPST
4.4. Sound Field Analysis of LPST
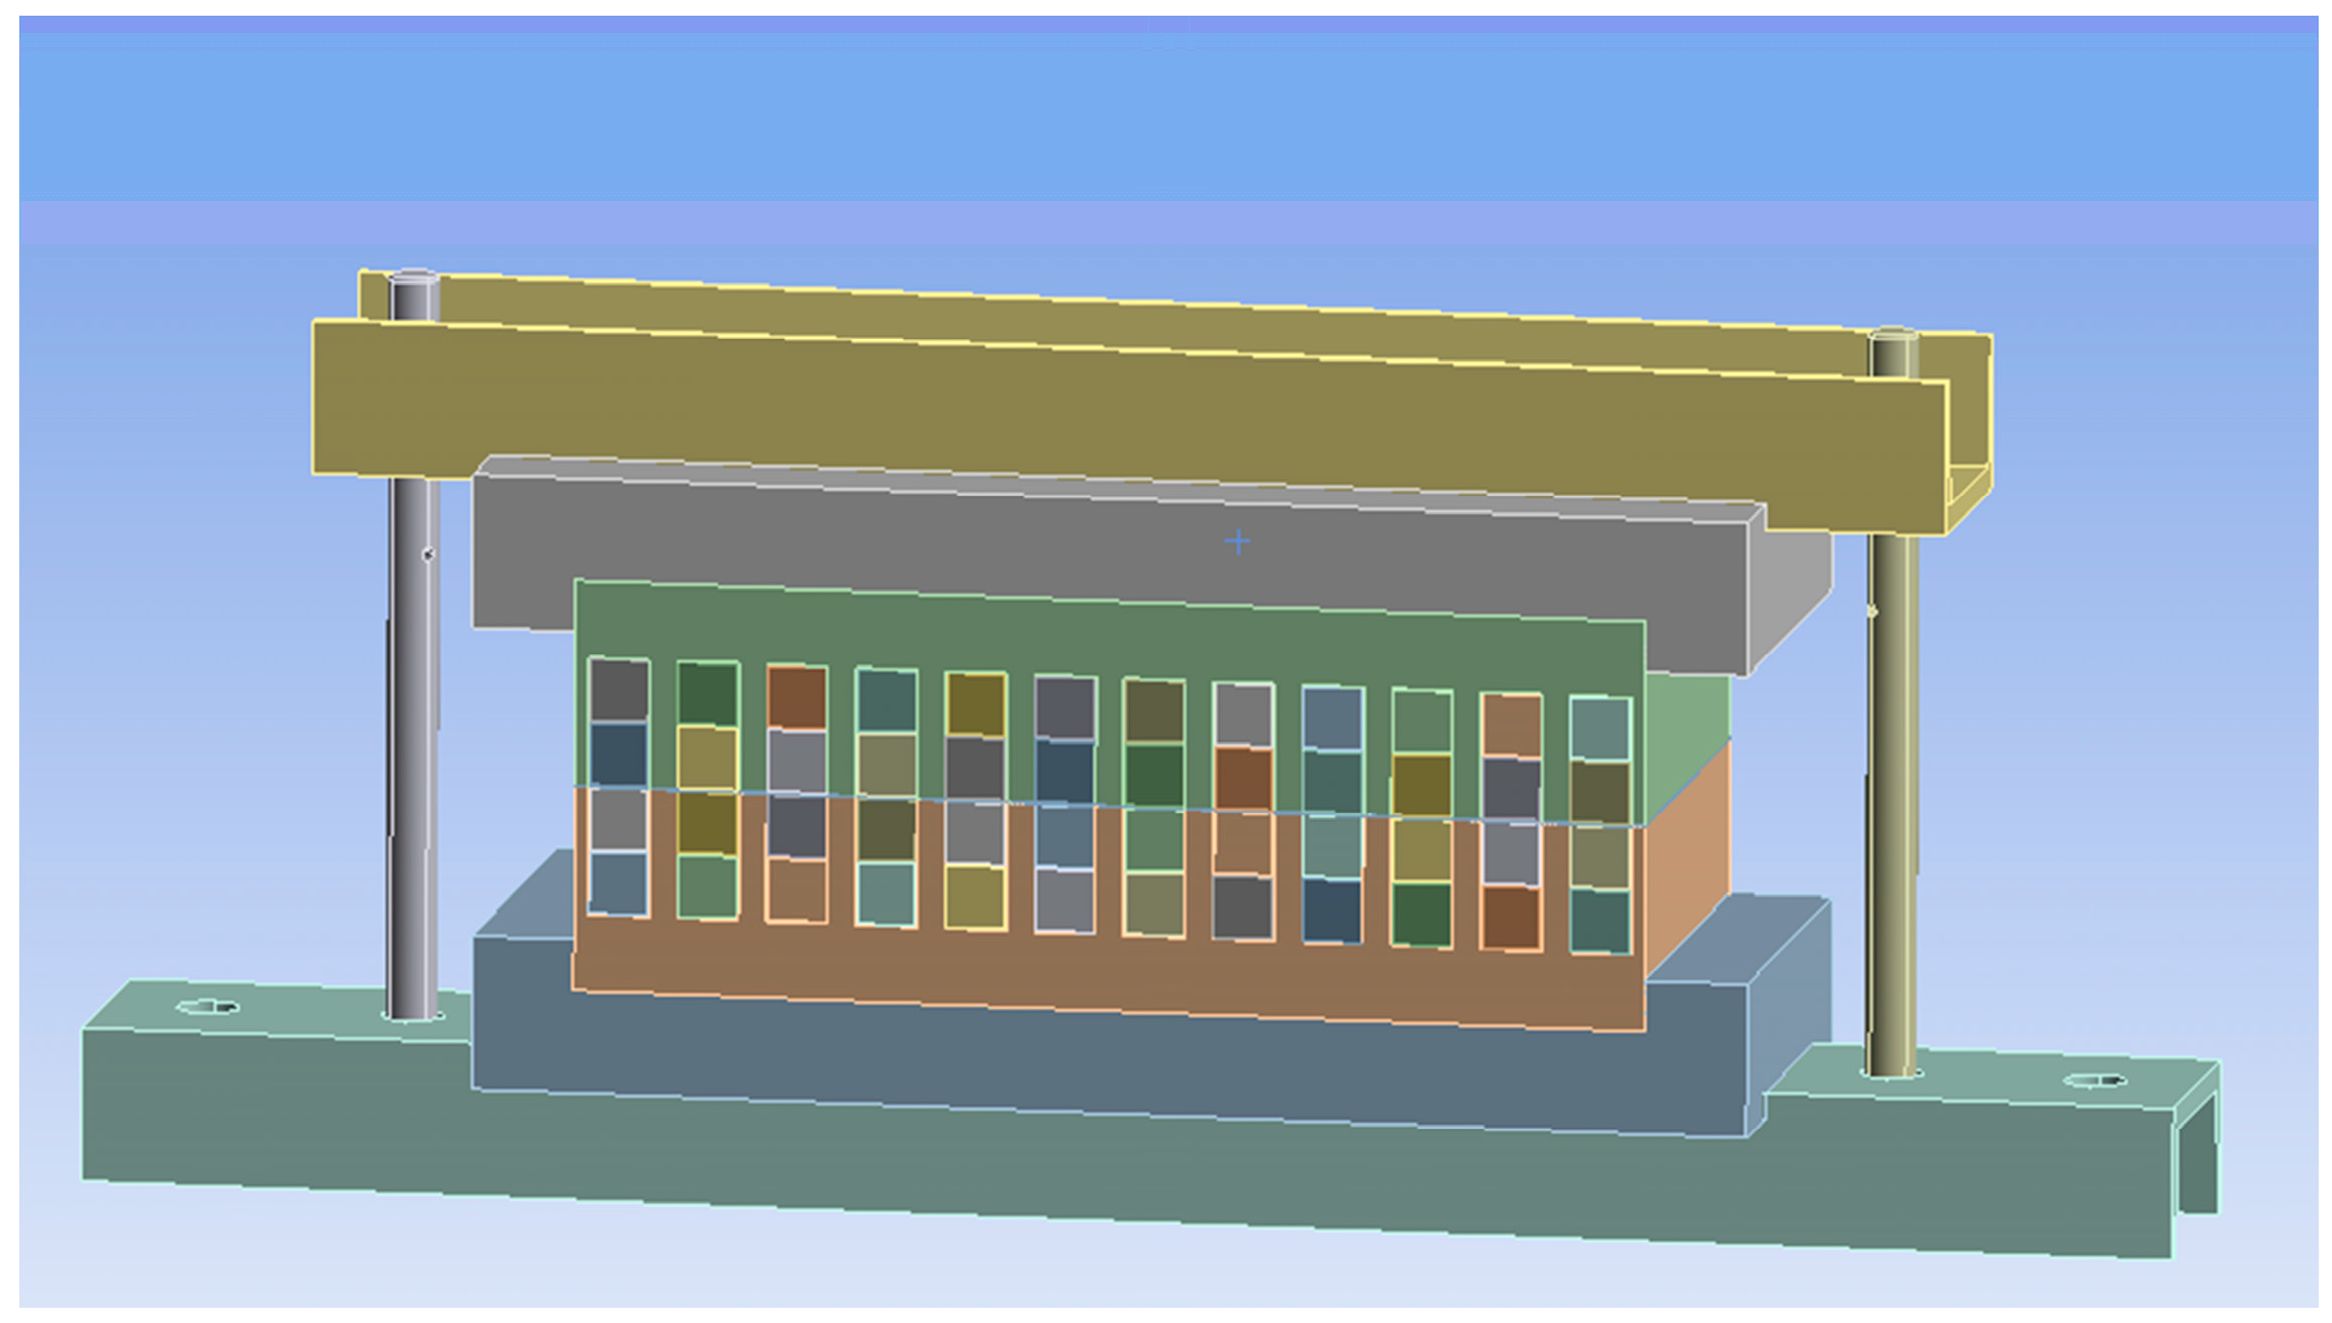
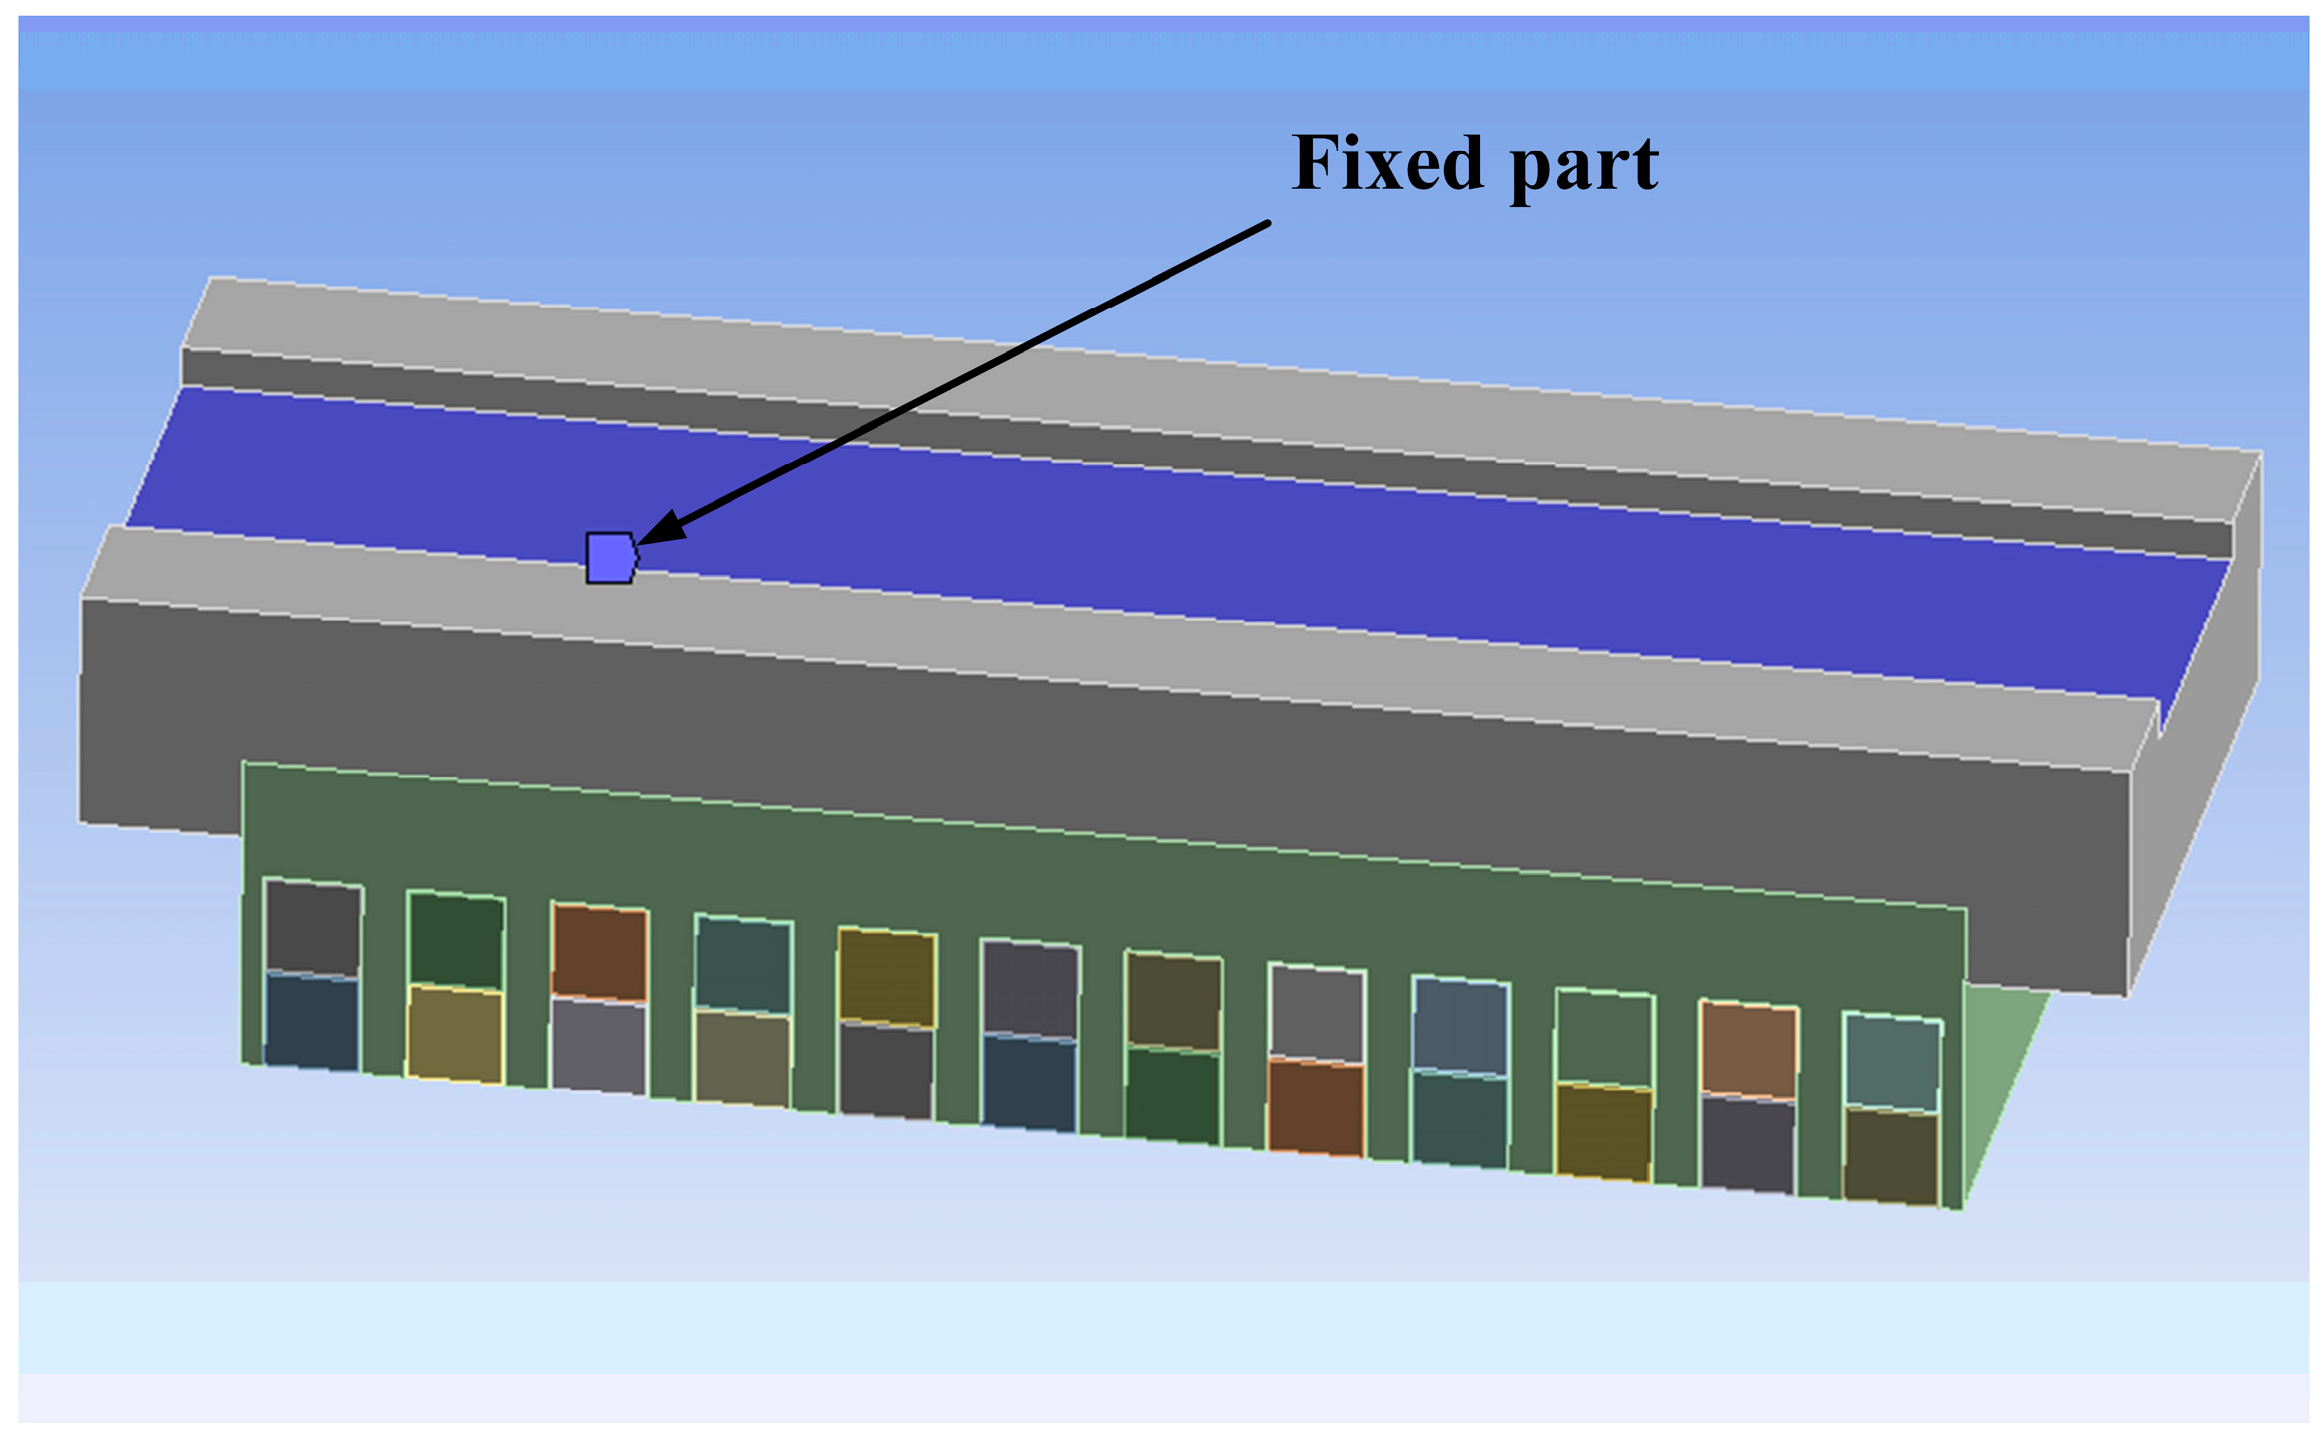
4.5. The Influence of Fixed Components on the Vibration and Noise of the LPST
5. Conclusions
- (1)
- The expression of the radial electromagnetic force wave was established theoretically, and the spectral and spatial distribution properties of the radial force wave were examined. The accuracy of the statement was then confirmed once more by establishing the LPST finite element simulation model. The maximum frequency of the radial electromagnetic force wave content when the LPST is operating at no load is 100 Hz, which is double the power frequency, and the harmonic content at 1100 Hz, 1300 Hz, 2300 Hz, 2500 Hz, 3500 Hz, 3700 Hz is also more prominent than the surrounding frequency.
- (2)
- The Ansys Workbench 2022R1 platform was used to conduct the joint electromagnetic, mechanical, and acoustic field simulation of the LPST. The response of the LPST’s electromagnetic vibration and the distribution of ambient noise were then examined. According to the results, the body will resonate at frequencies of 100 Hz and 3700 Hz due to the radial electromagnetic force of the LPST operating in a no-load state. The high-frequency noise at 3700 Hz, which reaches a maximum of 80.75 dBA, is the primary source of noise that is perceived by the human ear.
- (3)
- The impact of the core’s fixed components on its electromagnetic vibration and noise was investigated. According to the finite element modeling results, there is an 82% and 19% reduction in vibration and noise, respectively. These findings demonstrate that core resonance may be successfully avoided and that the magnitude of vibration and noise can be significantly reduced by setting the right limits.
Author Contributions
Funding
Data Availability Statement
Conflicts of Interest
References
- Zhou, C.; Zhao, J.; Wang, H.; Yan, S.; Yan, D. Harmonic Analysis and Cancellation of Inverter Systems with Linear Phase-Shifting Transformer. IEEJ Trans. Electr. Electron. Eng. 2023, 18, 1617–1625. [Google Scholar] [CrossRef]
- Wang, X.; Li, N.; Yu, T.; Li, T. Study on the Effect of Suspension Windings on the Electromagnetic Vibration and Noise of Ultra-High-Speed Bearingless Permanent Magnet Synchronous Motor for Air Compressor. IEEJ Trans. Electr. Electron. Eng. 2023, 18, 129–138. [Google Scholar] [CrossRef]
- Hou, P.; Ge, B.; Tao, D.; Wang, Y.; Pan, B. Coupling Analysis of Electromagnetic Vibration and Noise of FeCo-Based Permanent-Magnet Synchronous Motor. Energies 2022, 15, 3888. [Google Scholar] [CrossRef]
- Lin, F.; Zuo, S.; Wu, X. Electromagnetic Vibration and Noise Analysis of Permanent Magnet Synchronous Motor with Different Slot-pole Combinations. IET Electr. Power Appl. 2016, 10, 900–908. [Google Scholar] [CrossRef]
- Kim, C.-M.; Choi, M.-I.; Kim, Y.-S.; Bang, S.-B.; Shong, K.-M. Analysis on Characteristics of Core and Winding Vibration in Cast Resin Transformer. J. Korean Inst. Illum. Electr. Install. Eng. 2012, 26, 52–59. [Google Scholar] [CrossRef]
- Zhu, L.; Yang, Q. Research on Vibration and Noise of Power Transformer Cores Including Magnetostriction Effects. Trans. China Electrotech. Soc. 2013, 28, 1–6+19. (In Chinese) [Google Scholar] [CrossRef]
- Hu, J.; Liu, D. Analysis of Transformer Electromagnetic Vibration Noise Based on Finite Element Method. Trans. China Electrotech. Soc. 2016, 31, 81–88. (In Chinese) [Google Scholar] [CrossRef]
- Yang, H.; Chen, Y.; Deng, Z. Electromagnetic Vibration of PM Synchronous Motors with Different Combinations of Slot and Pole Number. Trans. China Electrotech. Soc. 2011, 26, 24–30. (In Chinese) [Google Scholar] [CrossRef]
- Hao, Q.; Hu, Y. Contribution Analysis of Magnetostriction in Motor Electromagnetic Vibration. Electr. Mach. Control. Appl. 2011, 38, 31–35. (In Chinese) [Google Scholar] [CrossRef]
- Li, J.; Cho, Y. Investigation into Reduction of Vibration and Acoustic Noise in Switched Reluctance Motors in Radial Force Excitation and Frame Transfer Function Aspects. IEEE Trans. Magn. 2009, 45, 4664–4667. [Google Scholar] [CrossRef]
- Xiao, Y.; Song, J. The Effect of Harmonics on Electromagnetic Vibration and Noise Characteristic in Inverter-Duty Motor. Trans. China Electrotech. Soc. 2021, 36, 2607–2615. (In Chinese) [Google Scholar] [CrossRef]
- Zhao, M.; Zhao, J. Analysis of Electromagnetic Vibration Characteristics of Transverse Flux Permanent Magnet Linear Motor. Trans. China Electrotech. Soc. 2024, 39, 168–181. (In Chinese) [Google Scholar] [CrossRef]
- Yue, F.; Li, Z. Vibration Mode Calculation and Analysis of U-Type Ironless Linear Motor. Electr. Appl. 2018, 117–122. (In Chinese) [Google Scholar] [CrossRef]
- Duan, X.; Zhao, T.; Liu, J.; Zhang, L.; Zou, L. Analysis of Winding Vibration Characteristics of Power Transformers Based on the Finite-Element Method. Energies 2018, 11, 2404. [Google Scholar] [CrossRef]
- Kubiak, W.; Witczak, P. Vibration Analysis of Small Power Transformer. COMPEL Int. J. Comput. Math. Electr. Electron. Eng. 2010, 29, 1116–1124. [Google Scholar] [CrossRef]
- Miao, X.; Jiang, P.; Pang, F.; Tang, Y.; Li, H.; Qu, G.; Li, J. Numerical Analysis and Experimental Research of Vibration and Noise Characteristics of Oil-Immersed Power Transformers. Appl. Acoust. 2023, 203, 109189. [Google Scholar] [CrossRef]
- Javorski, M.; Cepon, G.; Slavic, J.; Boltezar, M. A Generalized Magnetostrictive-Forces Approach to the Computation of the Magnetostriction-Induced Vibration of Laminated Steel Structures. IEEE Trans. Magn. 2013, 49, 5446–5453. [Google Scholar] [CrossRef]
- Jiang, P.; Zhang, Z.; Dong, Z.; Yang, Y. Vibration Measurement and Numerical Modeling Analysis of Transformer Windings and Iron Cores Based on Voltage and Current Harmonics. Machines 2022, 10, 786. [Google Scholar] [CrossRef]
- Liu, Z.; Yang, Z.; Wang, X.; Yu, P.; Li, Z. Design of Multi-phase Permanent Magnet Synchronous Motor with Fractional-slot Windings for Electromagnetic Vibration Reduction Considering Stator Teeth Modulation. IET Electric Power Appl. 2023, 17, 1123–1135. [Google Scholar] [CrossRef]
- Xue, J.; Zhao, J.; Yan, S.; Wang, H.; Zhou, C.; Yan, D.; Chen, H. Modeling and Analysis of New Power Devices Based on Linear Phase-Shifting Transformer. Processes 2022, 10, 1596. [Google Scholar] [CrossRef]
- Zhao, J.; Xu, H. Research on Two Kinds of Longitudinal Side Effects of Linear Phase-Shifting Transformer. Trans. China Electrotech. Soc. 2021, 36, 984–995. (In Chinese) [Google Scholar] [CrossRef]
- Chen, C.; Feng, H. Simulation Analysis of Radiation Noise Characteristics of 220kV Power Transformer. J. Electr. Power 2020, 35, 515–521. (In Chinese) [Google Scholar] [CrossRef]
- Li, R.; Li, C.; Peng, X.; Wei, W. Electromagnetic Vibration Simulation of a 250-MW Large Hydropower Generator with Rotor Eccentricity and Rotor Deformation. Energies 2017, 10, 2155. [Google Scholar] [CrossRef]
- Ling, X.; Tao, J.; Li, B.; Qin, C.; Liu, C. A Multi-Physics Modeling-Based Vibration Prediction Method for Switched Reluctance Motors. Appl. Sci. 2019, 9, 4544. [Google Scholar] [CrossRef]
- Du, J.; Li, Y. Analysis on the Variation Laws of Electromagnetic Force Wave and Vibration Response of Squirrel-Cage Induction Motor under Rotor Eccentricity. Electronics 2023, 12, 1295. [Google Scholar] [CrossRef]
- Liu, Z.; Zhu, L.; Zhong, S.; Wang, Y.; Zhang, J. Active Noise Reduction Analysis and Experimental Research on Electromagnetic Vibration Noise of Transformer. JAE 2022, 70, 501–513. [Google Scholar] [CrossRef]


| Symbol | Meaning | Value | Unit |
|---|---|---|---|
| Q | Slot number | 12 | - |
| N1 | Number of primary side windings | 300 | - |
| N2 | Number of secondary side windings | 240 | - |
| Lm | Core length | 210 | mm |
| Lb | Core stack thickness | 90 | mm |
| Lh | Core height | 40 | mm |
| δ | Air gap length | 0.3 | mm |
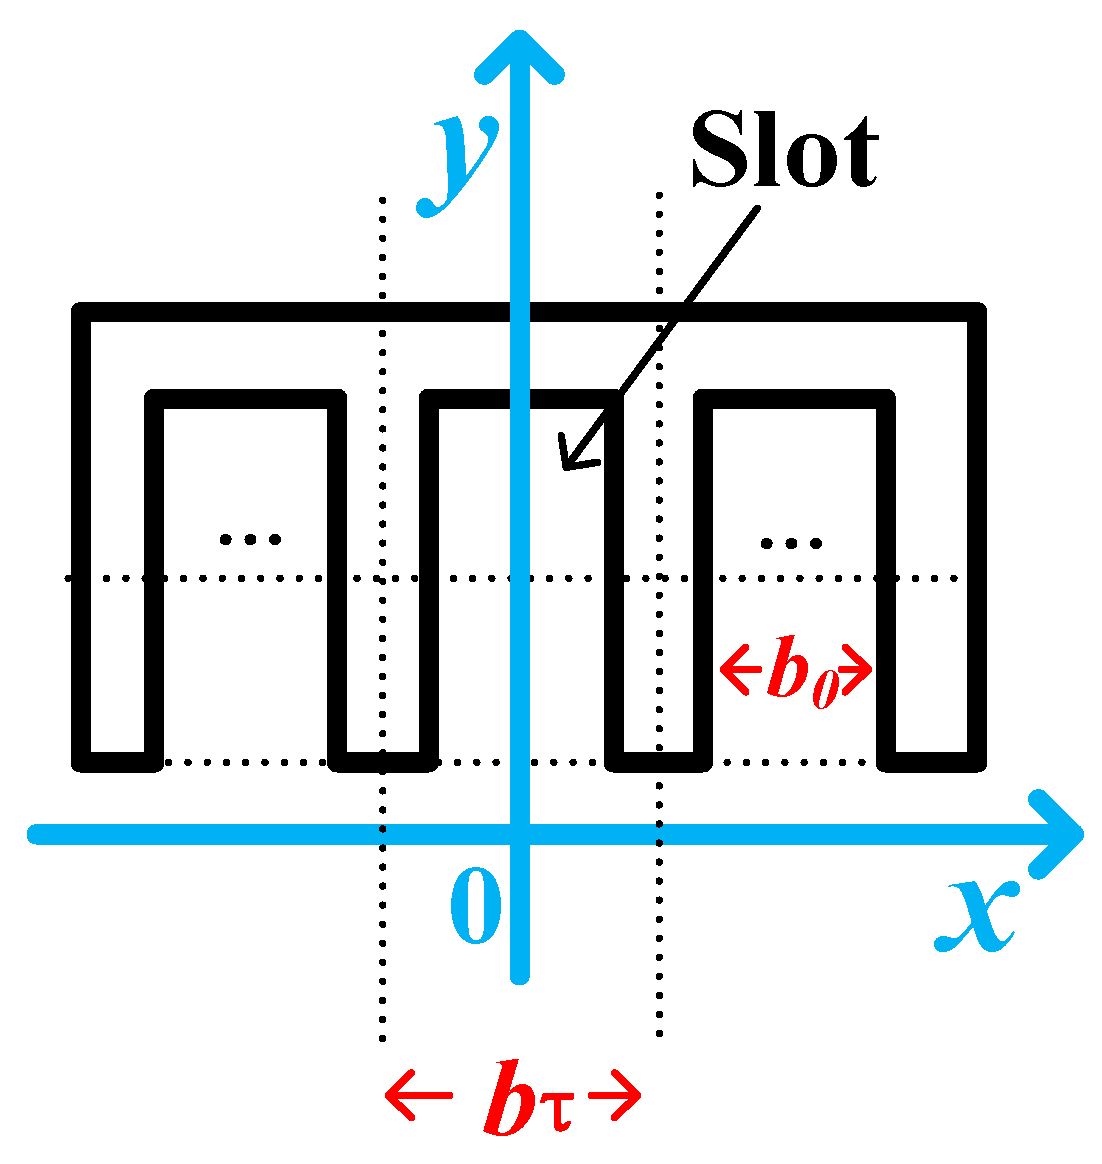
| b0 | Slot width | 12 | mm |
| bτ | Tooth pitch | 17.5 | mm |
| p | Number of pole pairs | 1 | - |
| τ | Polar distance | 105 | mm |
| Parameters | Value | Unit | Remark |
|---|---|---|---|
| DC bus voltage | 130 | V | - |
| Switching frequency | 50 | Hz | - |
| Rated power | 0.8 | kVA | - |
| Load | 0 | Ω | No-load condition |
| 50 | Ω | Load condition |
| Material Name | Model | Density (kg/m3) | Young’s Modulus (GPa) | Poisson Ratio |
|---|---|---|---|---|
| Silicon steel | DW465_50 | 7700 | 170 | 0.260 |
| Copper | C10100 | 8942 | 126 | 0.345 |
| Modal Number | Natural Frequency (Hz) |
|---|---|
| 4 | 98 |
| 5 | 254 |
| 6 | 419 |
| 7 | 3698 |
| 8 | 4419 |
| 9 | 6325 |
| Constraint Conditions | Maximum Vibration Response (m/s2) | Maximum Noise Response (dBA) |
|---|---|---|
| Free | 3.6725 | 80.75 |
| Fixed | 0.6642 | 64.864 |
Disclaimer/Publisher’s Note: The statements, opinions and data contained in all publications are solely those of the individual author(s) and contributor(s) and not of MDPI and/or the editor(s). MDPI and/or the editor(s) disclaim responsibility for any injury to people or property resulting from any ideas, methods, instructions or products referred to in the content. |
© 2024 by the authors. Licensee MDPI, Basel, Switzerland. This article is an open access article distributed under the terms and conditions of the Creative Commons Attribution (CC BY) license (https://creativecommons.org/licenses/by/4.0/).
Share and Cite
Yan, D.; Zhao, J.; Yan, S.; Wang, H.; Zhou, C. Electromagnetic Vibration and Noise Analysis of Linear Phase-Shifting Transformer. Energies 2024, 17, 1448. https://doi.org/10.3390/en17061448
Yan D, Zhao J, Yan S, Wang H, Zhou C. Electromagnetic Vibration and Noise Analysis of Linear Phase-Shifting Transformer. Energies. 2024; 17(6):1448. https://doi.org/10.3390/en17061448
Chicago/Turabian StyleYan, Dongao, Jinghong Zhao, Sinian Yan, Hanming Wang, and Changduo Zhou. 2024. "Electromagnetic Vibration and Noise Analysis of Linear Phase-Shifting Transformer" Energies 17, no. 6: 1448. https://doi.org/10.3390/en17061448