Article

An Ethane-Based CSI Process and Two Types of Flooding Process as a Hybrid Method for Enhancing Heavy Oil Recovery

1
Faculty of Engineering and Applied Science, University of Regina, Regina, SK S4S 0A2, Canada
2
Novus Energy Inc., Calgary, AB T2P 3J4, Canada
*
Author to whom correspondence should be addressed.
Energies 2024, 17(6), 1457; https://doi.org/10.3390/en17061457
Submission received: 28 February 2024 / Revised: 10 March 2024 / Accepted: 14 March 2024 / Published: 18 March 2024
(This article belongs to the Section H1: Petroleum Engineering)

Abstract

:
Combining multiple secondary oil recovery (SOR)/enhanced oil recovery (EOR) methods can be an effective way to maximize oil recovery from heavy oil reservoirs; however, previous studies typically focus on single methods. In order to optimize the combined process of ethane-based cyclic solvent injection (CSI) and water/nanoparticle-solution flooding, a comprehensive understanding of the impact of injection pressure, water, and nanoparticles on CSI performance is crucial. This study aims to provide such understanding through experimental evaluation, advancing the knowledge of EOR methods for heavy oil recovery. Three approaches (an ethane-based CSI process, water flooding, and nanoparticle-solution flooding) were applied through a cylindrical sandpack model with a length of 95.0 cm and a diameter of 3.8 cm. Test 1 conducted an ethane-based CSI process only. Test 2 conducted a combination approach of CSI–water flooding–CSI–nanoparticle-solution flooding–CSI. Specifically, the injection pressure of the first CSI phase in Test 2 was gradually increased from 3500 to 5500 kPa. The second and the third CSI phases had the same injection pressure as Test 1 at 5500 kPa. The CSI process ceased once the oil recovery was less than 0.5% of the original oil in place (OOIP) in a single cycle. Results show that the ethane-based CSI process is sensitive to injection pressure. A high injection pressure is crucial for optimal oil recovery. The first CSI phase in Test 2, where the injection pressure was increased gradually, resulted in a 2.9% lower oil recovery and five times as much ethane consumption compared to Test 1, which applied a high injection pressure. It was also found that water flooding improved the oil recovery in the CSI process. In Test 2, the oil recovery factor of the second CSI phase increased by 57% after the water flooding process, which is likely due to the formation of water channels and a dispersed oil phase that increased the contact area between ethane and oil. Although the nanoparticle-solution flooding only had 0.3% oil recovery, after that the third CSI phase stimulated another 10.8% of OOIP even when the water saturation achieved more than 65%. This demonstrated that the addition of nanoparticles can maintain the stability of the foam and enhance the transfer of ethane to the heavy oil. Finally, Test 2 reached a total oil recovery factor of 76.1% on a lab scale, an increase of 45% compared to the single EOR method, which proved the combination process is an efficient method to develop a heavy oil field.

1. Introduction

Unconventional oil reservoirs, including heavy oil, account for 70% of total crude oil reserves worldwide [1,2,3]. Heavy oil is characterized by a viscosity exceeding 100 cP and a gravity below 22.3 API [4]. The spotlight on heavy oil resources has intensified as a result of surging oil demands coupled with the slow processes of conventional oil extraction [5]. In Canada, up to 80% of heavy oil reserves are predominantly located in thin pay zones [6,7,8,9]. The thinness of these pay zones and the significant heat loss to the upper and lower layers make them unsuitable for thermal-based enhanced heavy oil recovery methods [10]. Non-thermal enhanced heavy oil recovery (EHOR) techniques refer to methods used to improve the recovery of heavy oil without relying on thermal processes such as steam injection. These techniques typically involve the use of chemical, mechanical, or biological methods to reduce the viscosity of heavy oil, improve its flow characteristics, or enhance sweep efficiency in the reservoir. Some examples of non-thermal EHOR techniques include solvent injection (such as CSI), polymer flooding, and surfactant flooding [11,12]. CSI emerges as a promising method for augmenting heavy oil recovery in thin heavy oil reservoirs, primarily due to its lower investment cost and reduced formation damage [13]. It typically requires lower capital expenditure compared to more complex methods like polymer or surfactant flooding [14]. Additionally, cyclic solvent injection may cause less formation damage due to the fact that solvent can easily pass through the pore throat, contributing to the long-term stability of the reservoir [15]. The CSI process comprises three sequential stages: injection, soaking, and production. Initially, a solvent is injected into the formation via the well, elevating the reservoir pressure. After well shutdown, the solvent dissolves into the heavy oil, reducing viscosity and swelling it. During production, solvent and gas phases are initially produced, followed by diluted heavy oil, driven by pressure depletion. This cycle continues until it becomes uneconomical [10,16,17,18,19,20,21,22]. Compared to steam-based EHOR processes, solvent-based CSI processes require significantly less surface construction and consume 97% less energy, resulting in lower capital investment and operating costs [23]. In addition, because the mixture of solvent and heavy oil may contribute to asphaltene precipitation, the heavy oil produced has better quality due to in situ deasphalting underground [24]. Furthermore, the CSI process is more environmentally friendly as it does not require large amounts of water or generate significant greenhouse gas emissions to produce steam [25,26].
The factors influencing the CSI process mainly focus on solvent selection, operational parameters, and reservoir properties [14,27]. Solvent selection involves considering the physical and chemical properties, solubility, availability, and environmental impact of the solvent to ensure its suitability for a target reservoir [28,29]. Operational parameters include optimization of key factors such as injection pressure, soaking time, and pressure depletion rate, to maximize the diffusion and adsorption effects of the solvent in the reservoir [11,25,30]. Reservoir properties mainly consider porosity, permeability, oil saturation, and water saturation [31]. A comprehensive consideration of these aspects is crucial for research on the cyclic solvent injection process. Lim et al. [32] first experimentally investigated the efficiency and practicability of the ethane-based CSI process by applying a three-dimensional scaled physical model. Ethane has been proved to be an effective solvent for deasphalting and producing bitumen. Moreover, the study found that the production rate doubled in the first CSI cycle and improved by 25% in the remaining cycles. In addition, ethane is able to extract more heavy oil at supercritical conditions than subcritical conditions. Anderson et al. [33] conducted several oil sands core flood experiments to assess different solvents for potential use in CSI field trials. The tested solvents included various blends such as methane/propane, carbon dioxide/propane, methane/ethane, pure ethane, and nitrogen. Among these, the pure ethane test showed the most promising results, achieving the highest oil recovery and solvent recovery in the fewest cycles. Qazvini Firouz and Torabi [34] performed 14 groups of CSI processes to investigate the effects of the injection solvent composition, pressure, and soaking time by using four different solvent gases (carbon dioxide, methane, propane, and butane). According to the results, for all types of solvent, higher injection pressure leads to a higher oil recovery factor and lighter produced oil (in terms of density and viscosity). It is also found that a longer soaking time improved the oil production of the first cycle, but it did not noticeably increase the ultimate oil recovery factor. Zhou et al. [22] summarized successful lab tests of the CO2-based CSI process. They found that despite variations in permeability across tested models (ranging from 30 mD to 24,200 mD), the process’s effectiveness in heavy oil reservoirs remained consistent, as evidenced by a steady recovery factor. Additionally, the tests demonstrated the process’s suitability for reservoirs with low oil saturation levels, (as low as 40.6%), indicating its potential for application in reservoirs with higher water saturation.
While the CSI process has demonstrated its effectiveness, particularly in heavy oil reservoirs with thin pay zones, several challenges persist. These include limited understanding of the impact of pressure during the injection stage, uncertainties regarding water saturation effects, decreased performance after multiple cycles, and consistently low recovery factors observed across laboratory and pilot tests [34,35].
This study aims to investigate the synergistic role of water and nanoparticles in enhancing the performance of an ethane-based CSI process for heavy oil recovery. The approach integrates ethane-based CSI, water flooding, and nanoparticle-solution flooding experiments. Ethane is selected as the solvent for several reasons: firstly, its high solubility in heavy oil enables effective dissolution and extraction of lighter components, thereby reducing heavy oil viscosity. Secondly, its widespread availability and relative affordability compared to other solvents make it economically feasible for large-scale operations [36,37,38].
The research objectives include examining the impact of injection pressure during the CSI stage; evaluating the influence of water on CSI performance; assessing the efficiency of this hybrid enhanced oil recovery (EOR) method; optimizing process parameters; establishing a theoretical framework; comparing it with conventional techniques; and assessing scalability for various field applications. By integrating these approaches, the study seeks to advance heavy oil recovery through a comprehensive and innovative strategy.

2. Experimental Methodology

This study aims to investigate the potential for optimizing the ethane-based CSI process through the use of water flooding and nanoparticle-solution flooding to improve the oil recovery factor.

2.1. Materials

Glass beads employed in the sandpack model are sourced from Mod-U-Blast® (Edmonton, AB, Canada), a reputable Canadian company situated in Edmonton. These beads possess a grain size ranging from 90 to 150 μm.
A sample of heavy oil from Manatokan in western Canada (LaCorey, AB, Canada) was selected for analysis. The oil was considered dead, as it had been exposed to ambient conditions for an extended period of time before experimentation. The SARA analysis results and the properties of the dead oil are presented in Table 1.
Ethane and N2 with purities of 99.99 mol% were supplied by Praxair Canada Inc. (Mississauga, ON, Canada). Ethane was used for the CSI process while N2 was used for the cleaning process and pressure test.
Deionized water was utilized to measure the sandpack properties, including porosity, permeability, and oil saturation. Additionally, it was employed for water flooding experiments and nanoparticle-solution preparation.
Hydrophilic-300 (Aladdin, Shanghai, China) was used in the process of nanoparticle-solution flooding. This nanoparticle is produced by Aladdin, a well-known supplier of chemical reagents. Hydrophobic-300 is a hydrophilic gas-phase nanoscale silica material with a high purity of over 99.8%, a metal substrate, a particle size range of 7–40 nanometers, and a specific surface area of up to 300 square meters per gram.

2.2. Experiment Setup

Figure 1 illustrates the experimental setup in this chapter, comprising three primary components: an injection unit, a sandpack model, and an ethane and oil production unit. The schematic diagram provides a clear representation of the experimental arrangement employed in the study.
The preparation processes consisted of essential steps. Firstly, containers and pipelines were thoroughly cleaned using toluene, kerosene, and ethanol, followed by careful drying with compressed air. Secondly, the sandpack model’s inner wall was coated with electrical tape to increase roughness, reducing the wall effect, and facilitating fluid flow [39]. Lastly, pressure tests were conducted by injecting N2 at 6000 kPa for 24 h to assess pressure loss and ensure a leak-free system.
The injection unit was divided into three sections: ethane injection, water injection, and nanoparticle-solution injection. A syringe pump was utilized to transport the corresponding gas or liquid from three transfer cylinders to the sandpack model. The ethane was injected into the sandpack from the right side of the sandpack model; however, the water and nanoparticle fluid were injected into the sandpack model at the other end of the tube.
The sandpack model used in this study was a cylindrical tube, 95 cm long with a 3.8 cm diameter, and equipped with six ports, filled with the same kind of glass beads to ensure consistent porosity and permeability. The sand filling weight and vibration duration were controlled with less than 1% error. Porosity was measured using the imbibition method, while permeability was determined with de-ionized water following Darcy’s law. Table 2 provides the sandpack model parameters, including porosity, permeability, oil saturation, and irreducible water saturation. Pressure monitoring points, equipped with pressure transducers (PXM409-070BG10V, OMEGA Engineering Inc., Richmond Hill, ON, Canada), were evenly spaced on one side. Pressure signals were recorded using LabVIEW 2012 software (NI CompactDAQ, National Instruments Corporation, Austin, TX, USA). The model was horizontally placed. An EquiliBAR pressure regulator (EB1ZD1-SS316, Fletcher, NC, USA) controlled the outlet pressure at the right-hand side which was managed using an additional syringe pump.
The ethane and oil production unit consisted of two parts: the oil collection section and the gas measurement section. The oil collection section was linked to the back pressure regulator (BPR), comprising several cone-shaped tubes. After each CSI cycle, the cone-shaped tube was centrifuged for 60 min to ensure the oil and water were separated thoroughly. The volumes of oil and water were recorded separately. The gas measurement section employed a gas flow meter (Ritter, Bochum, Germany) connected to the cone-shaped tubes. In addition, to ensure safety, ethane discharged after the gas flow meter was directed to the ventilation line.

2.3. Experimental Procedure

The formal experimental procedures for two tests are listed in Table 3.
Test 1 involved the ethane CSI process (base test) and followed the following steps. Ethane was injected from a cylinder into the sandpack model using one of two syringe pumps. The injection rate was 50 cc/min, and the pressure was monitored by a gauge connected to the sandpack model. The injection valve was turned off when the pressure reached 5500 kPa, and the soaking process began. This period lasted 1 h, during which the pressure decline variation of the sandpack was recorded via four pressure transducers. After the soaking process, the other syringe pump was connected to the BPR to control the decline rate (6 kPa/min) of each CSI test. It should be noted that the same port was used for both ethane injection and production. The produced oil and gas were measured by the ethane and oil production unit.
Test 2 was divided into five parts: the first ethane-based CSI process, then water flooding; the second ethane-based CSI process, then nanoparticle flooding; and the third ethane-based CSI process. The steps were as follows: ethane was injected into the sandpack from the ethane cylinder to carry out the ethane CSI process, with the pressure gradually increasing from 3500 kPa to 5500 kPa. Once the pressure reached the designed criteria, the ethane injection process stopped, and the soaking period began. Two types of soaking periods were used: 1 h and 24 h. After soaking, the production process was applied, and the depletion rate (6 kPa/min) was controlled using the syringe pump connected to the outlet BPR. Each ethane CSI process consisted of several injection cycles and was completed once the recovery factor was less than 0.5% of the OOIP in a single cycle. The ethane injection and production used the same port at the end of the right side of the sandpack. The oil and water produced were collected for each injection and production cycle and centrifuged for 1 h in a cone-shaped tube, which had a scale for separate measurement of oil and water volume. The produced ethane volume was measured using a gas flow meter, and the tail gas was discharged to the fume hood. Water flooding and nanoparticle flooding followed the same procedures. Water or nanoparticle solution was injected from the respective cylinder via a syringe pump, with the fluid injection direction opposite to that of the ethane injection. The injection rate was 0.1 cc/min, and a graduated measuring cylinder was connected to the outlet to measure the volume of produced water/nanoparticle solution and oil. The total injection volume of fluid was 1.5 pore volume each.

3. Results and Discussion

3.1. Overview

Table 4 presents production data from both Test 1 and Test 2. Test 1 resulted in a cumulative oil recovery factor of 31.1%. In Test 2, a comprehensive approach was employed, combining ethane-based CSI with water/nanoparticle-fluid flooding across five distinct stages. This integrated strategy achieved a remarkable total oil recovery factor of 76.1%, surpassing Test 1 by 35%. Notably, both the initial and secondary CSI stages within Test 2 demonstrated comparable oil recovery factors, each around 28%. The water flooding phase contributed an additional 8.7% to the overall recovery, while subsequent nanoparticle-fluid flooding further enhanced the CSI process, yielding an extra 10.8% of oil through the third ethane-based CSI process.

3.2. Experimental Studies of Ethane-Based Cyclic Solvent Injection in Test 1

The oil production of the ethane-based CSI process (blank test) are showed in Figure 2. There are five cycles; each cycle has a one-hour soaking period and the depletion rate is 6 kPa/min. Oil recovery increases nearly constantly for the first 3 cycles, then decreases at a relatively rapid speed at cycle 4 and finally it drops very quickly in cycle 5. Cycle 3 has the highest oil recovery factor of 10.1%.
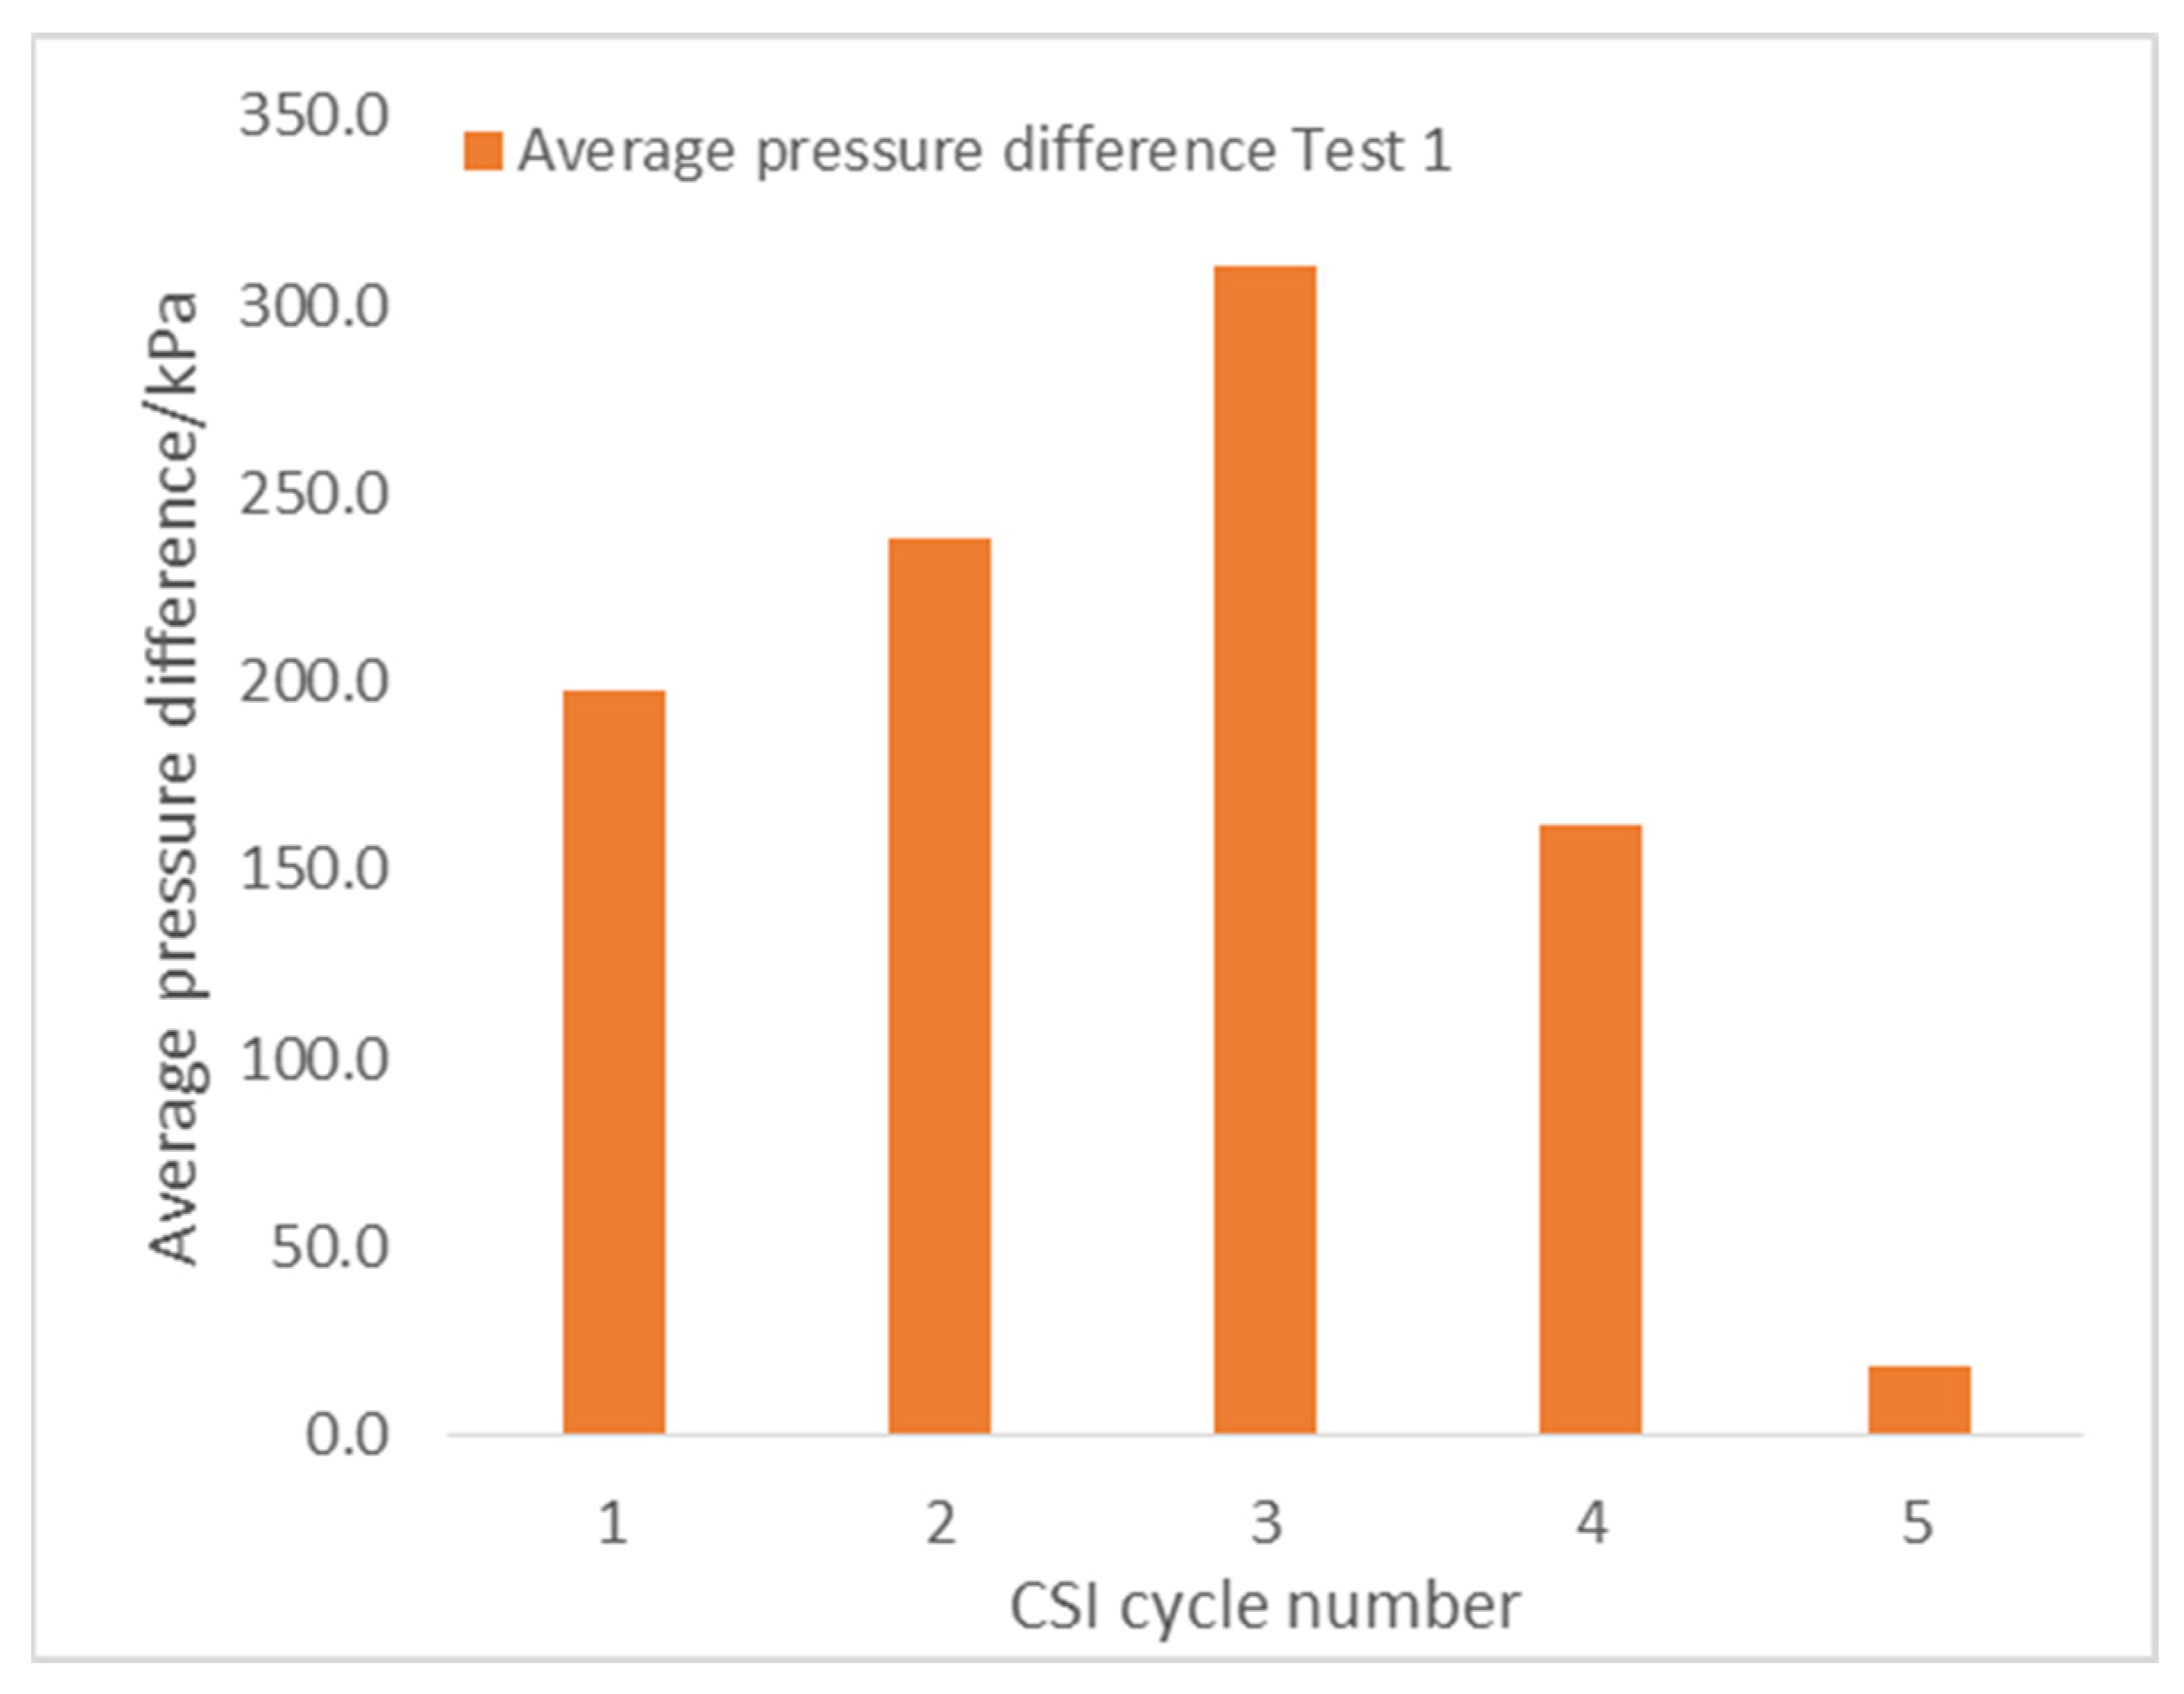
The average pressure difference between the four monitoring ports (P0 to P3) and the BPR for each cycle in the CSI process of Test 1 is illustrated in Figure 3. P0 is situated farthest away, while P3 is the closest to the BPR. As the production pressure reaches the pseudo bubble point pressure, pressure differences start to manifest within the pressure transducers. This phenomenon is attributed to the presence of dispersed gas bubbles in the viscous foamy heavy oil, which help to maintain the reservoir pressure. The average pressure difference represents the mean value of the pressure discrepancies between each pressure monitoring port and the BPR. It is evident from Figure 2 and Figure 3 that there is consistency in the results. In each cycle, a higher average pressure difference indicates a stronger foamy oil flow, leading to a higher oil recovery factor. Notably, at cycle 5, the pressure difference is significantly low, resulting in a dramatic drop in oil production.
Figure 4 illustrates the iGOR (instantaneous gas oil ratio) for each cycle during the base test. Hourly records of oil and gas production were made. Broadly, each cycle exhibits three distinct phases. Initially, post-soaking, iGOR commences at a heightened level due to ethane remaining undissolved during the soaking phase, leading to prompt production of free gas alongside heavy oil upon opening the producer. In the subsequent phase, iGOR moderately declines before progressively rising as the bottom hole pressure decreases. This stage is governed by controlled gas mobility during foamy-oil flow, while rapid heavy oil production arises from oil swelling. The final phase sees a significant iGOR surge, resulting from continuous coalescence of dispersed gas bubbles into free gas. Meanwhile, heavy oil production plunges drastically due to foam oil depletion. Notably, cycles 1 to 5 reveal an improving iGOR trend as injected ethane quantities increased.

3.3. Experimental Studies of Combined Ethane-Based CSI Process and Water Flooding/Nanoparticle-Solution Flooding Process

3.3.1. The First Ethane-Based CSI Process

The ethane injection pressure is gradually increased from 3500 kPa to 5500 kPa; once the recovery factor of each single CSI cycle is less than 0.5% of the OOIP, the injection pressure of next CSI cycle will increase 500 kPa. At injection pressures of the 3500 kPa, 4000 kPa, 4500 kPa, 5000 kPa, and 5500 kPa stages, there are three, six, five, one, and four CSI cycles, respectively. For cycles 1 to 18, the pressure depletion rate remains constant at 6 kPa/min. A CSI cycle with a depletion rate of 12 kPa/min is designed for cycle 19.
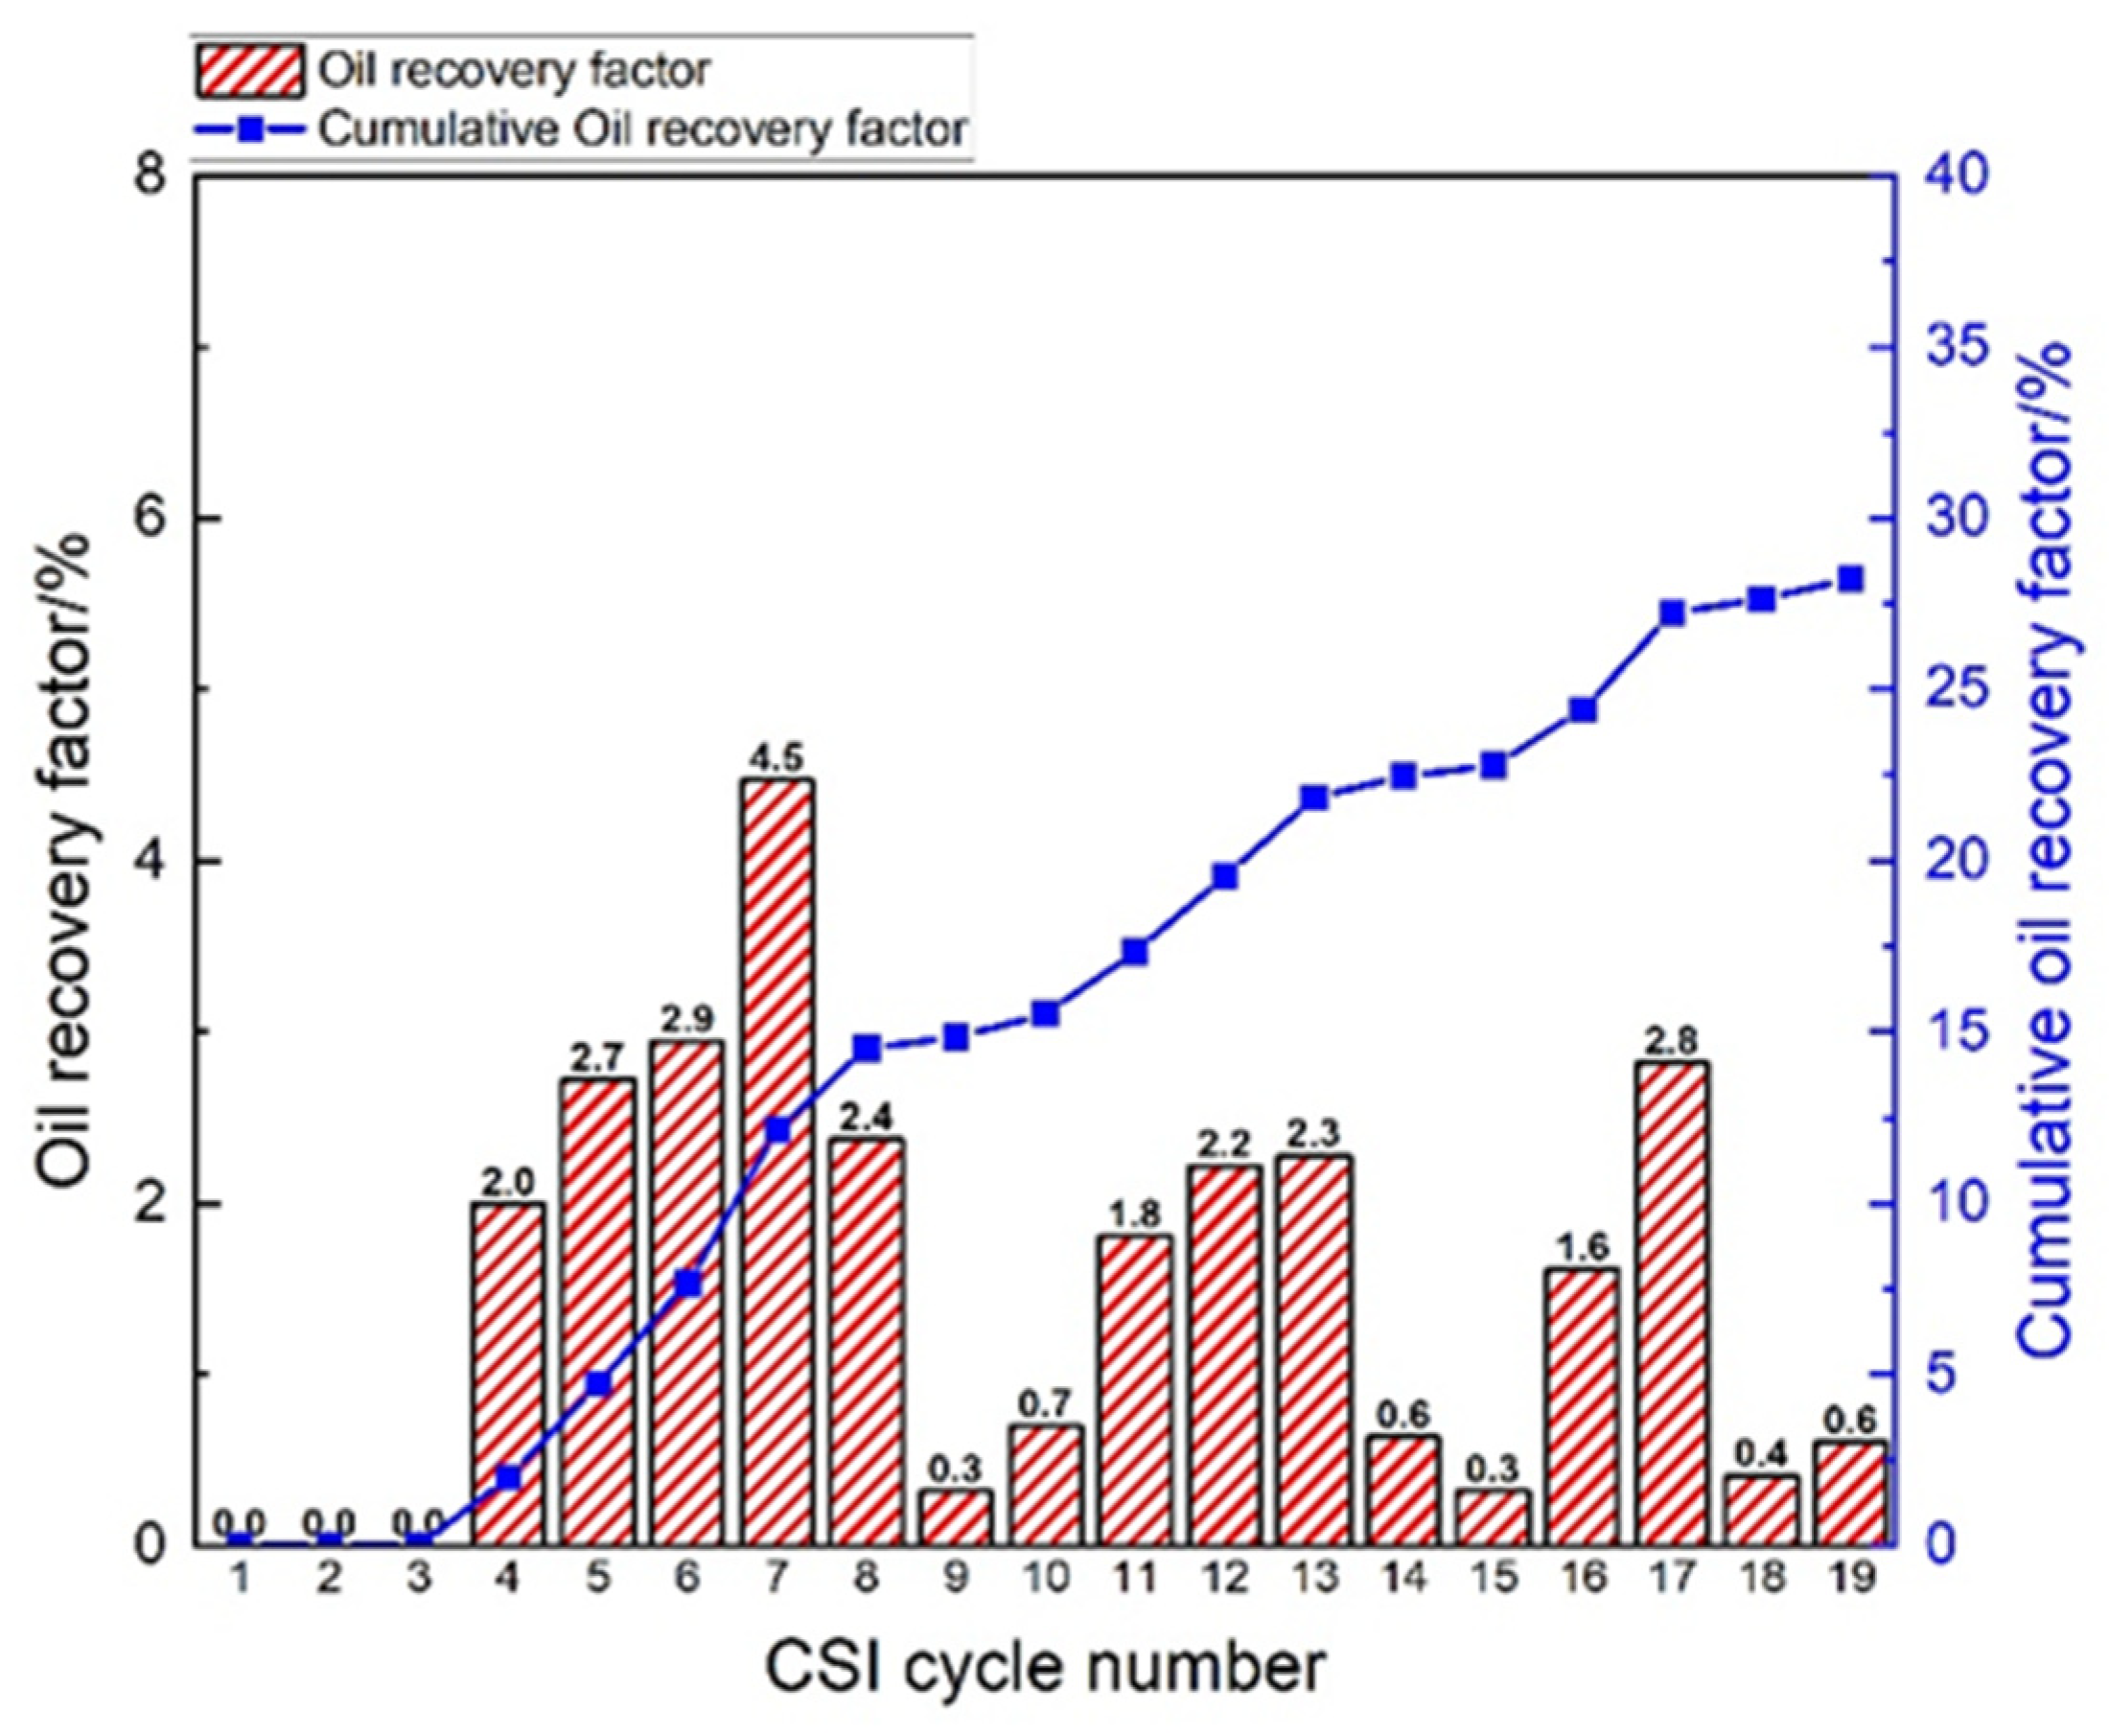
Figure 5 illustrates the oil production performance of the first ethane-based CSI process in Test 2. The cumulative oil recovery factor is 28.24% according to 19 CSI cycles. The initial three cycles (3500 kPa) yield no oil. Cycle 4 to 9 (4000 kPa) are the peak of heavy oil production. The 4500 kPa (cycle 10–14), 5000 kPa (cycle 15), and 5500 (cycle 16–19) kPa stages show lower oil production compared to the 4000 kPa stage. During Cycle 16 an error occurred, leading to an injection pressure of 5500 kPa instead of the intended 5000 kPa. As a result, the subsequent CSI cycles were maintained at 5500 kPa. Cycle 19 applies a depletion rate twice that of prior cycles, yet oil recovery growth remains insufficient.
The iGOR of each cycle at different pressure stages in the first CSI process of Test 2 is depicted in Figure 6. The iGOR typically rises with higher injection pressure due to two key factors: (1) higher injection pressure means a higher volume of injected ethane; (2) a growing space is available for ethane injection in the sandpack with heavy oil production. For each cycle, iGOR has a similar trend as the base test. The iGOR initially rises during the production period due to free ethane gas, followed by a slight decrease as oil production rates increase; however, weakened foamy oil flow with decreasing pressure subsequently leads to decreased oil production rates and an increase in iGOR.

3.3.2. Water Flooding Process

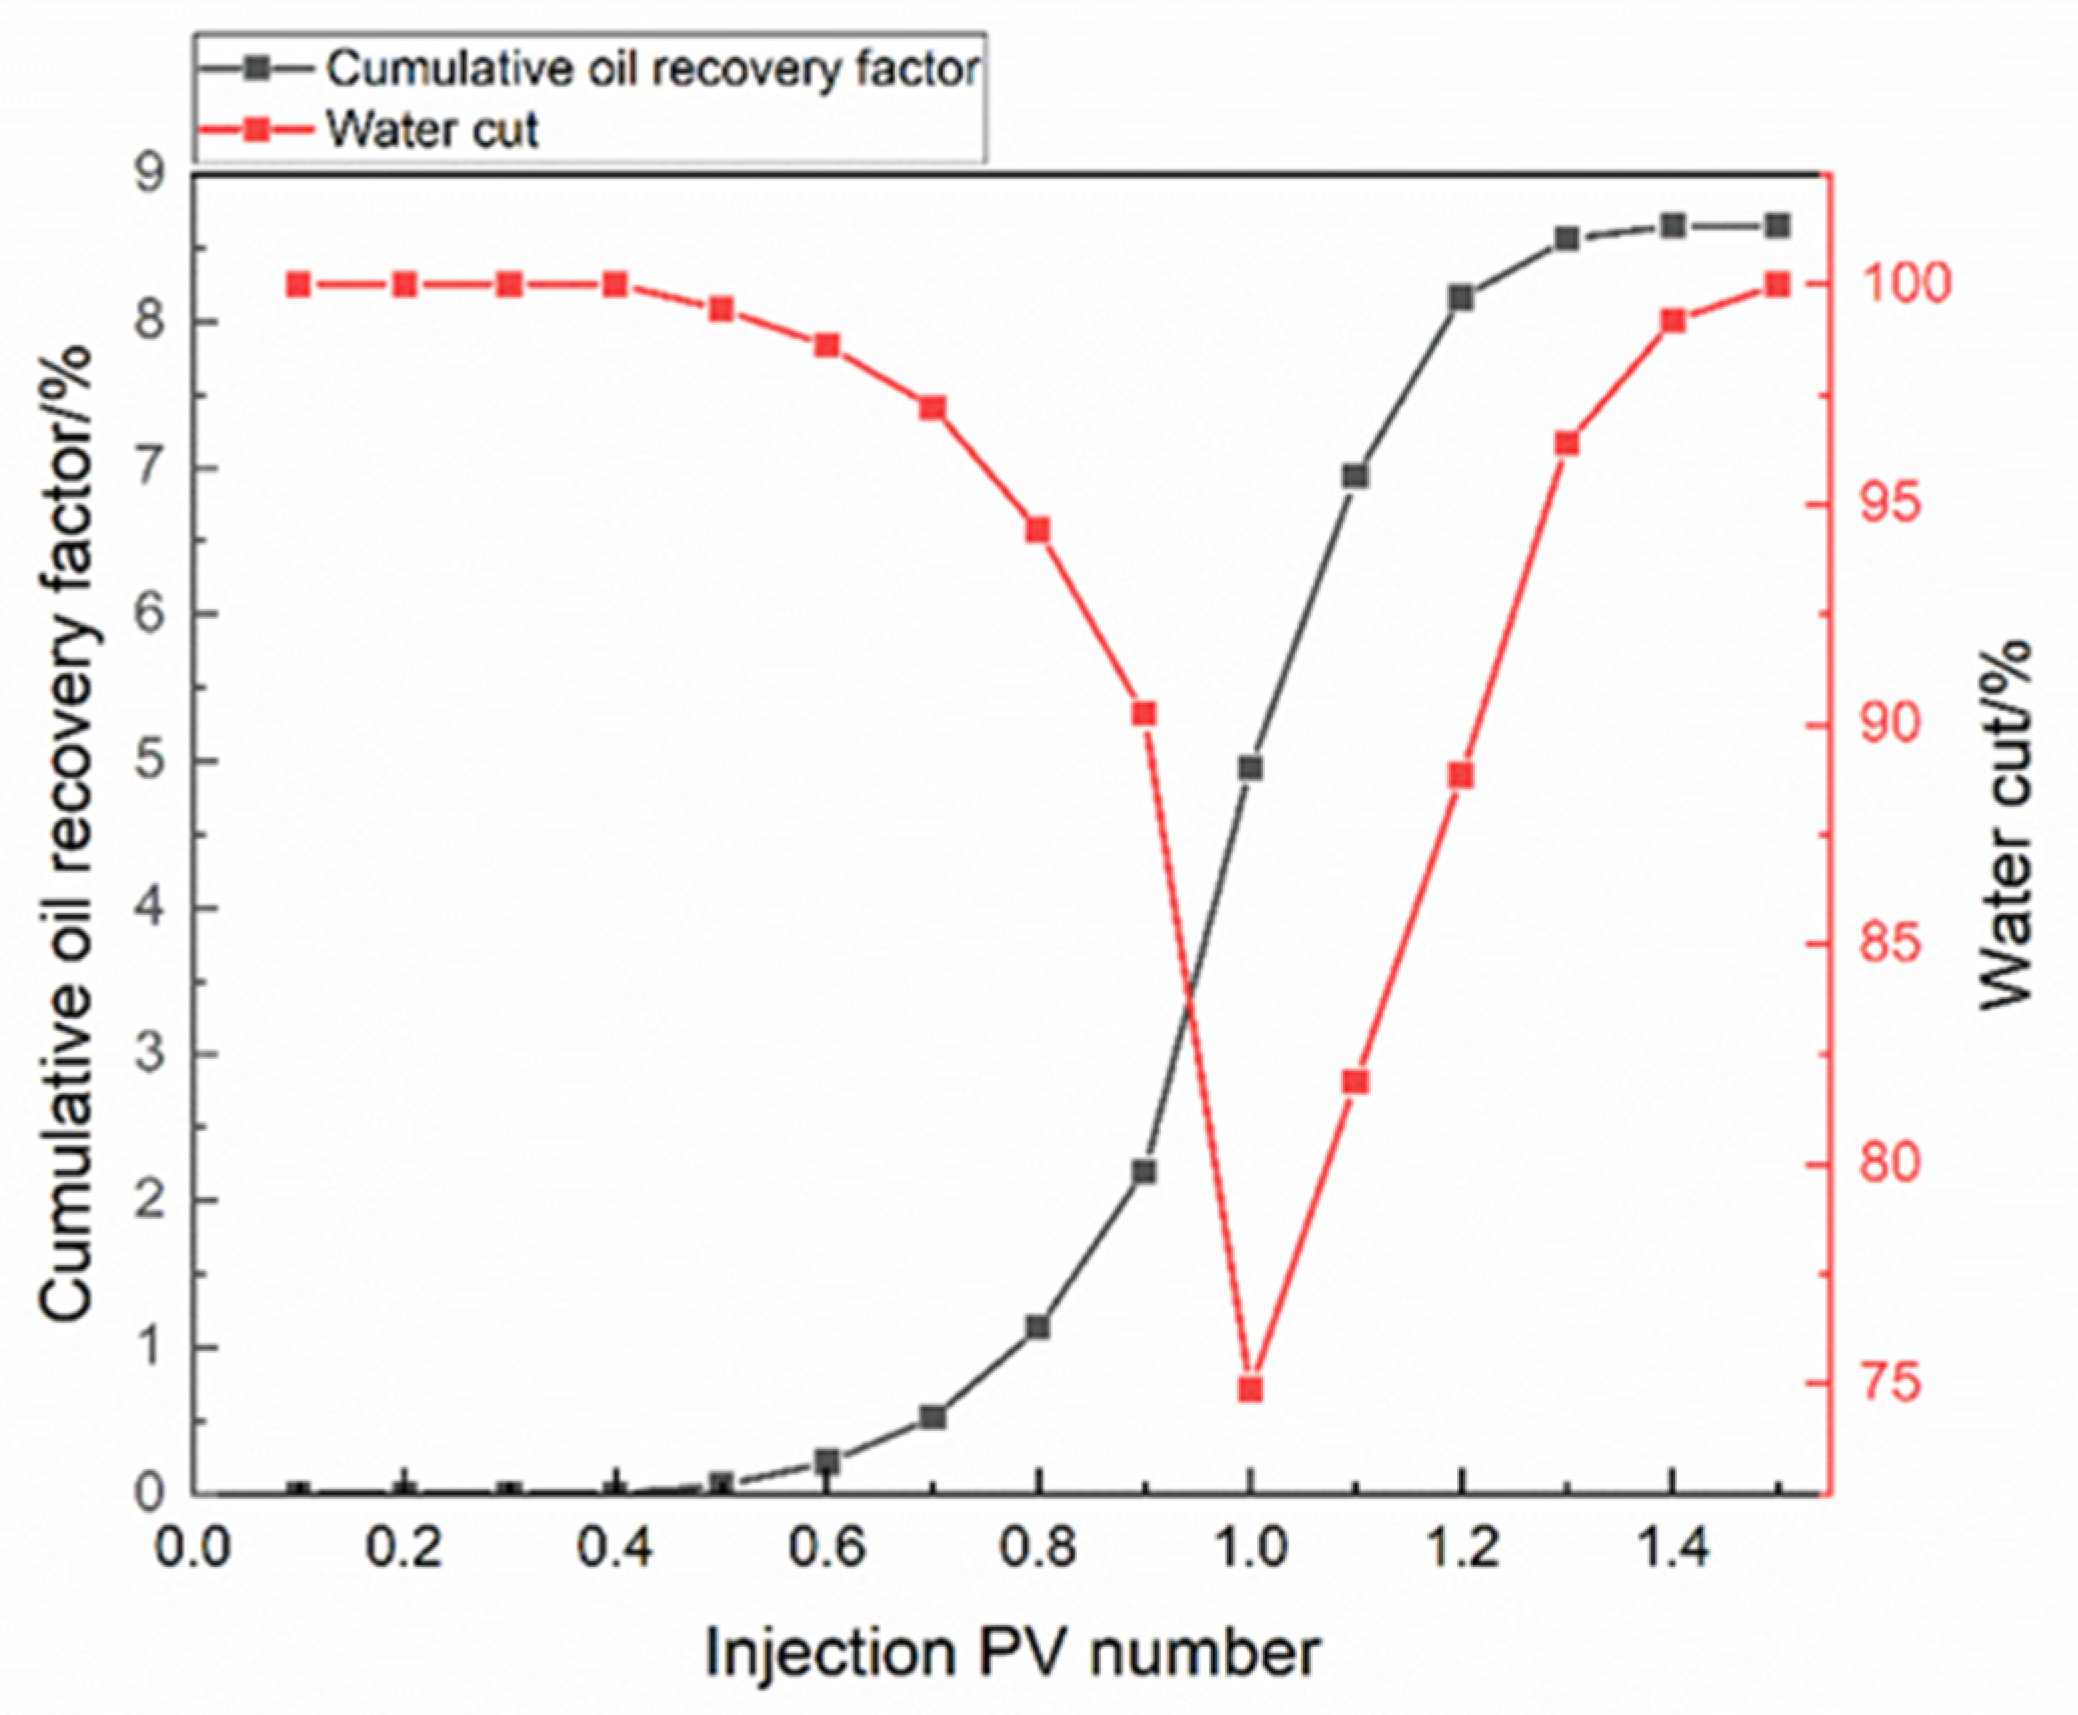
The oil production and water cut of the heavy oil water flooding process is depicted in Figure 7. The x-axis represents the injection pore volume (PV) during the water flooding process, while the primary and secondary y-axes represent the cumulative oil recovery factor and water cut, respectively. The water cut initially decreases, and then rises due to the ethane-based CSI process effectively extracting nearby heavy oil, resulting in no initial oil yield for the first 0.4 PV injection. As water is injected at a gradual rate, it displaces deeper oil towards the well, leading to increased oil production rates and decreased water cut. As the water flooding process nears its end, the formation of water channels facilitates efficient water passage, causing a decline in oil production and a return to water cut levels exceeding 90%. Overall, the cumulative oil recovery factor totals 8.7%.

3.3.3. The Second Ethane-Based CSI Process

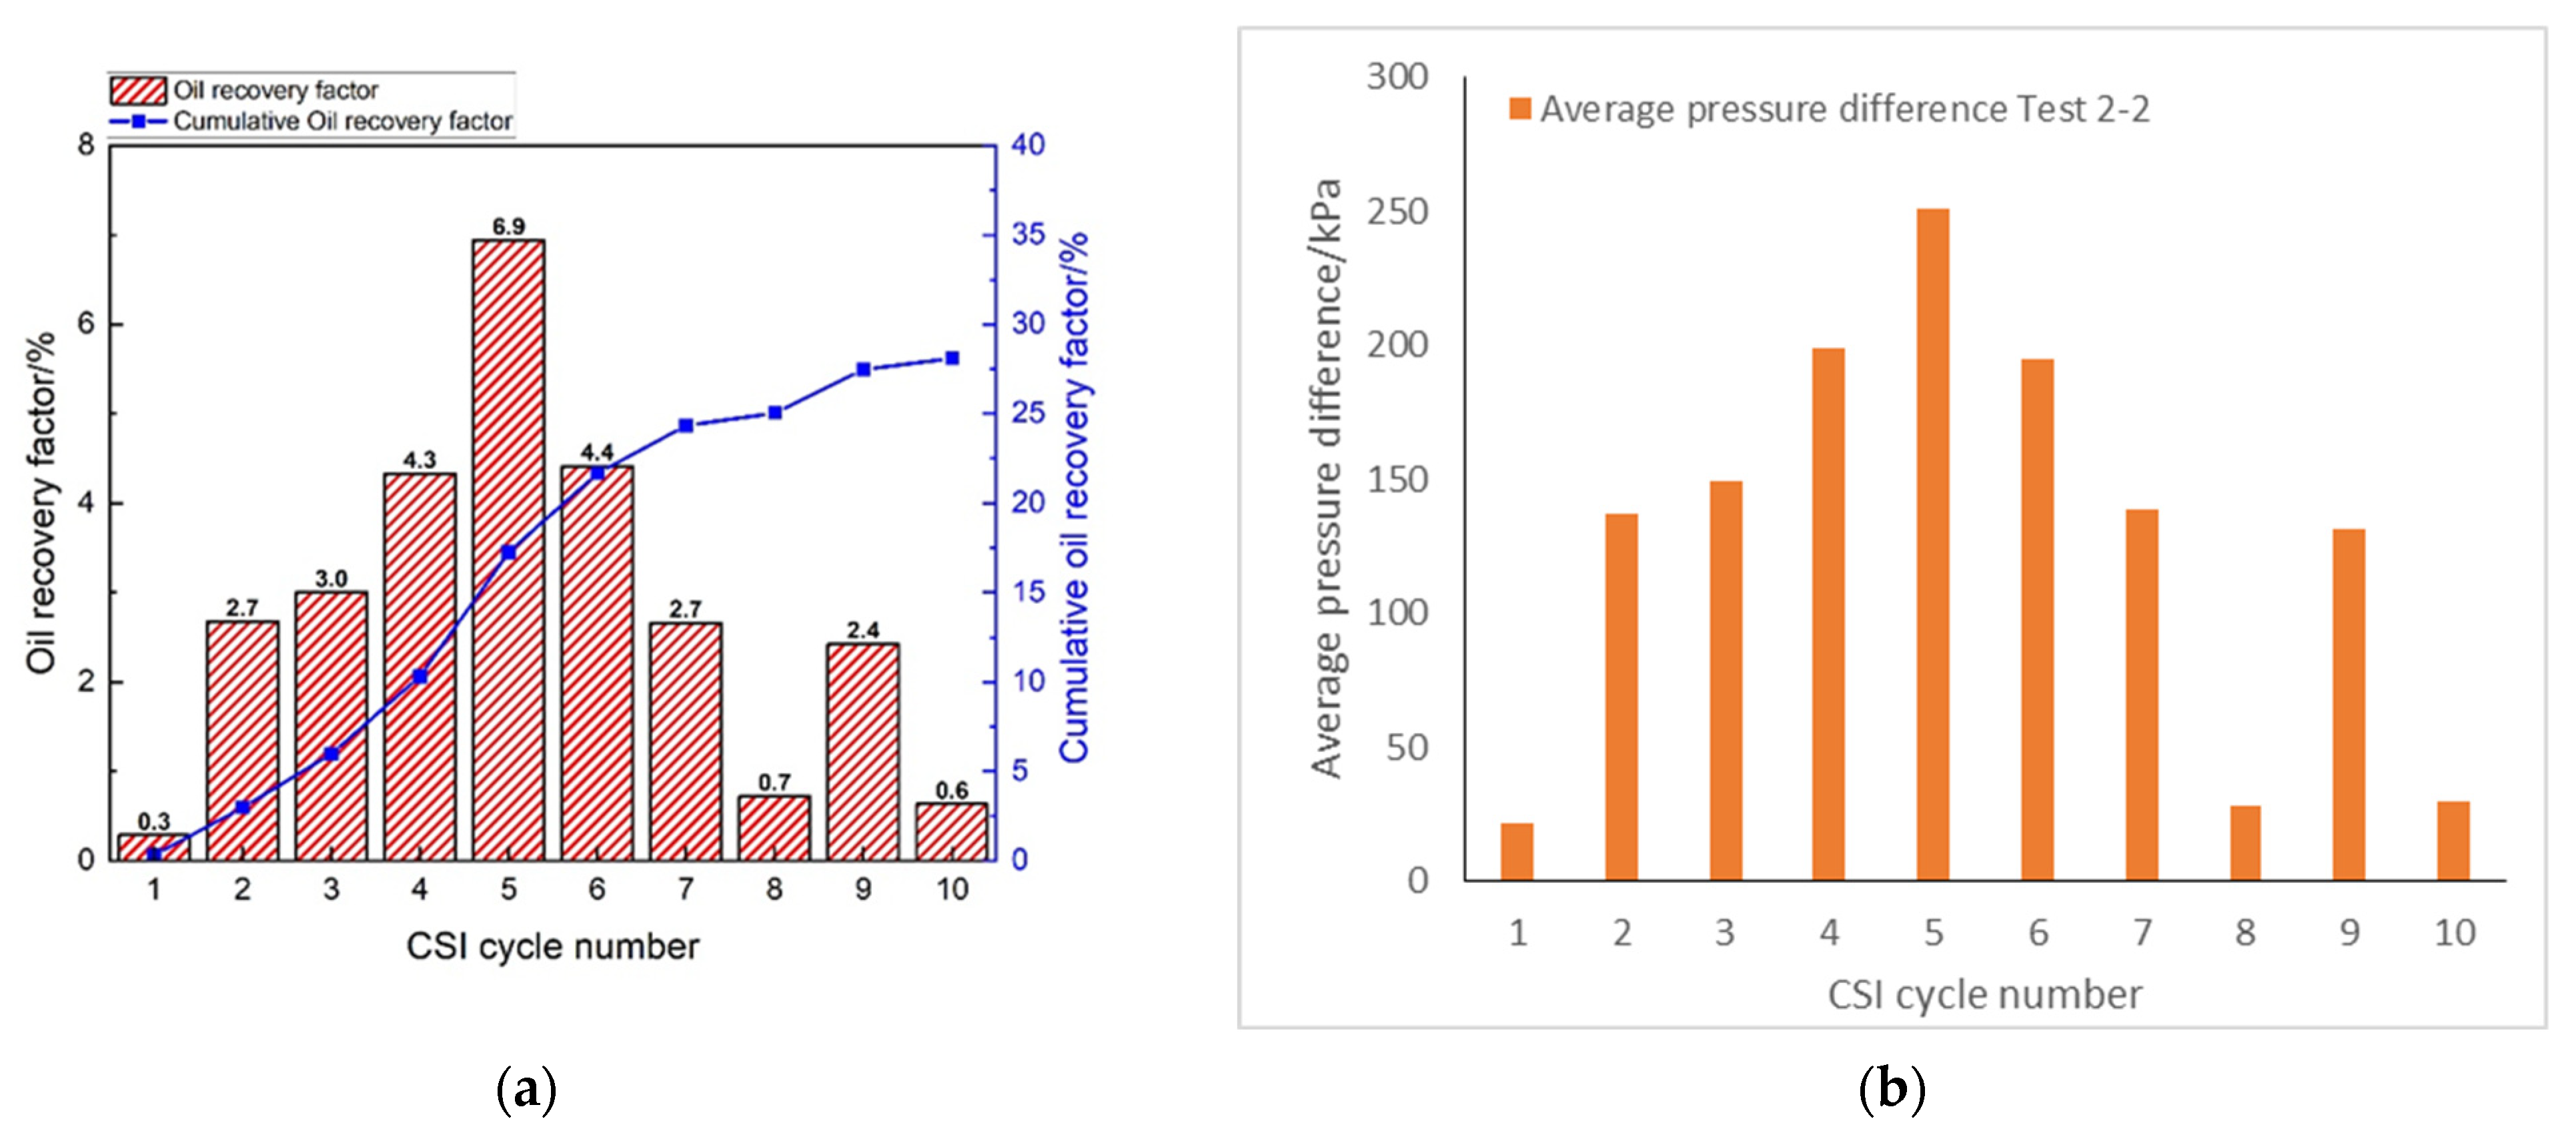
The oil production performance and average pressure difference of the second ethane-based CSI process is listed in Figure 8. The initial cycle, hindered by high water saturation and a limited ethane injection, achieves a mere 0.3% oil recovery factor. Subsequent cycles witness a gradual and consistent increase in oil recovery, followed by a notable acceleration in cycle 5, achieving its peak recovery factor of 6.9%. Notably, extended soaking periods reignite oil production, particularly evident in cycles 9 and 10 with 24 h soaking, resulting in recoveries of 2.4% and 0.6%, respectively. The average pressure difference exhibits a parallel trend to the oil production performance, demonstrating an ascent until cycle 5 followed by a decline from cycles 6 to 8. The inclusion of an extended soaking period in cycle 9 revitalized the average pressure differential, while cycle 10 experienced a significant drop. This observed trend provides compelling evidence that pressure differentials reliably indicate the intensity of foamy oil flow, thereby serving as a reliable indicator of the oil recovery factor.
Figure 9 showed the iGOR (a) and iWOR (b) for each cycle of the second CSI process in Test 2. With oil production, the iGOR changes remarkably. The iGOR is around 2000 sc cm3/cm3 during the main oil production period, which is cycle 3 to cycle 7. The iGOR trend of each cycle is similar to the base test and the first ethane-based CSI process. It should be noted that although the oil recovery factor in cycle 9 is improved again due to the long soaking time, the iGOR is still at a high value. The reason is the growing available space obtained in the oil bank with the extraction of oil and water production, requiring large amounts of ethane to be injected to maintain the system pressure. Following water flooding, a notable observation is the emergence of water production during the second and third CSI processes. This phenomenon is likely attributed to increased water saturation near the producer. Notably, there is a direct proportional relationship between water production and gas injection volume. For instance, cycle 1 shows no water production, likely due to minimal ethane injection. Furthermore, despite both cycle 8 and cycle 10 yielding similar oil production, the higher ethane injection in the latter results in increased water entrainment, leading to a higher iWOR compared to the former. Amidst high oil production, cycles 2 to 7 and cycle 9 maintain iWOR levels below 0.5.

3.3.4. Nanoparticle-Fluid Flooding Process

The low oil recovery factors (only at 0.31%) observed in nanoparticle-fluid flooding, can be attributed to the formation of water channels created by the preceding water flooding process. However, after this process, the ethane CSI process has a reasonable performance which is descried in the next section.

3.3.5. The Third Ethane-Based CSI Process

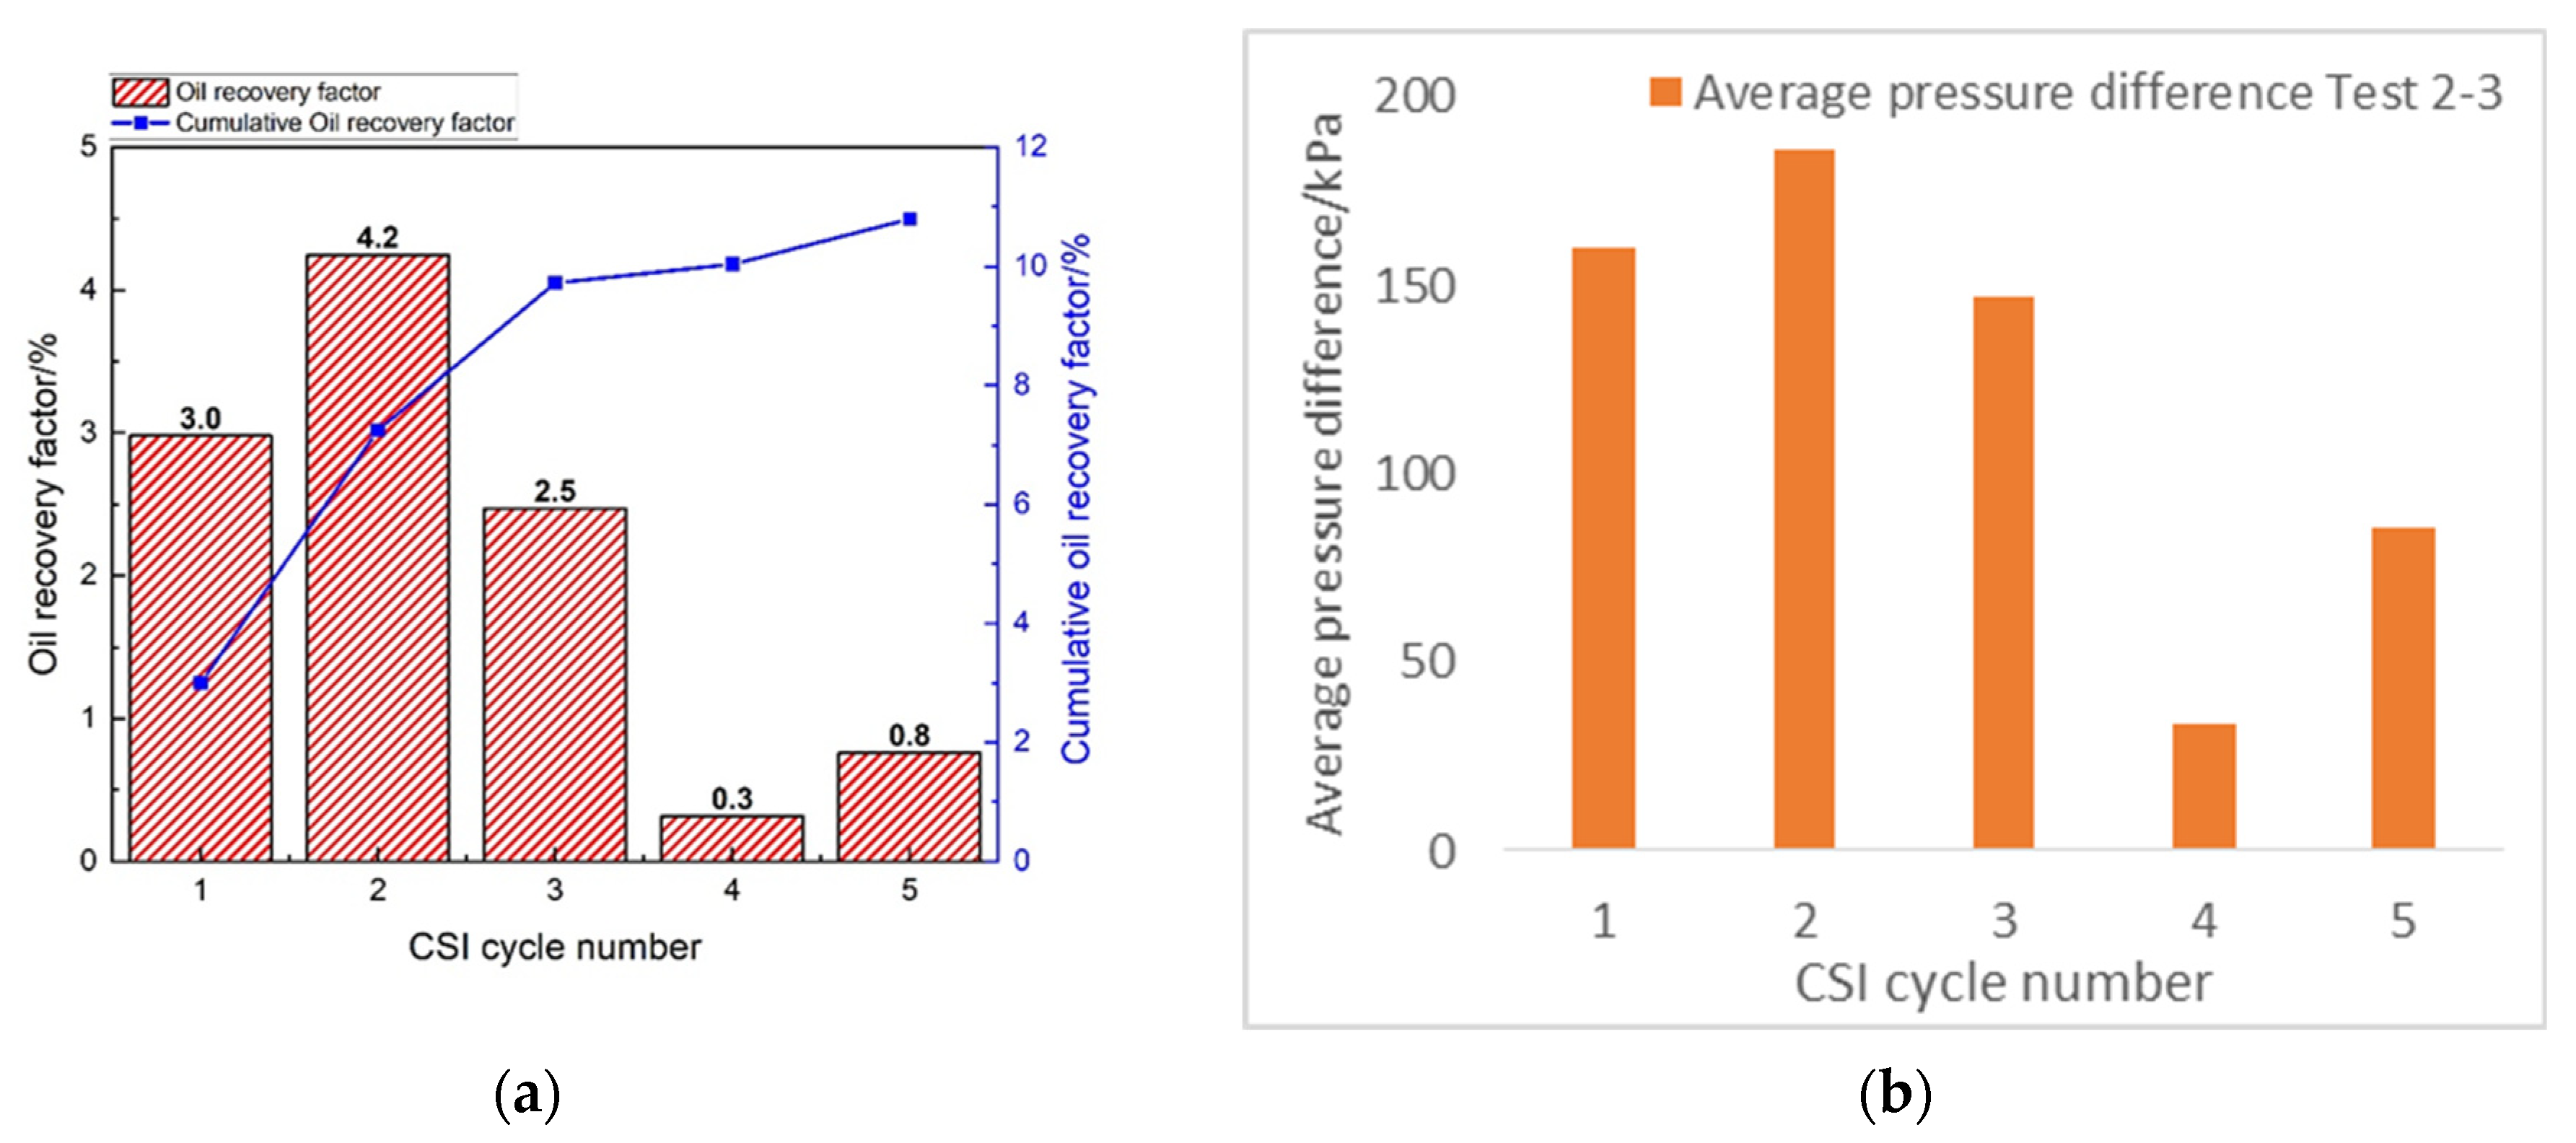
The oil production performance and average pressure difference of the third ethane-based CSI process in test 2 is listed in Figure 10. The peak of the oil production happens on cycle 2 with an oil recovery factor of 4.2%. The long soaking-time procedure (cycle 5) can boost the oil production, but not very much. The average pressure difference is highly consistent with the production performance.
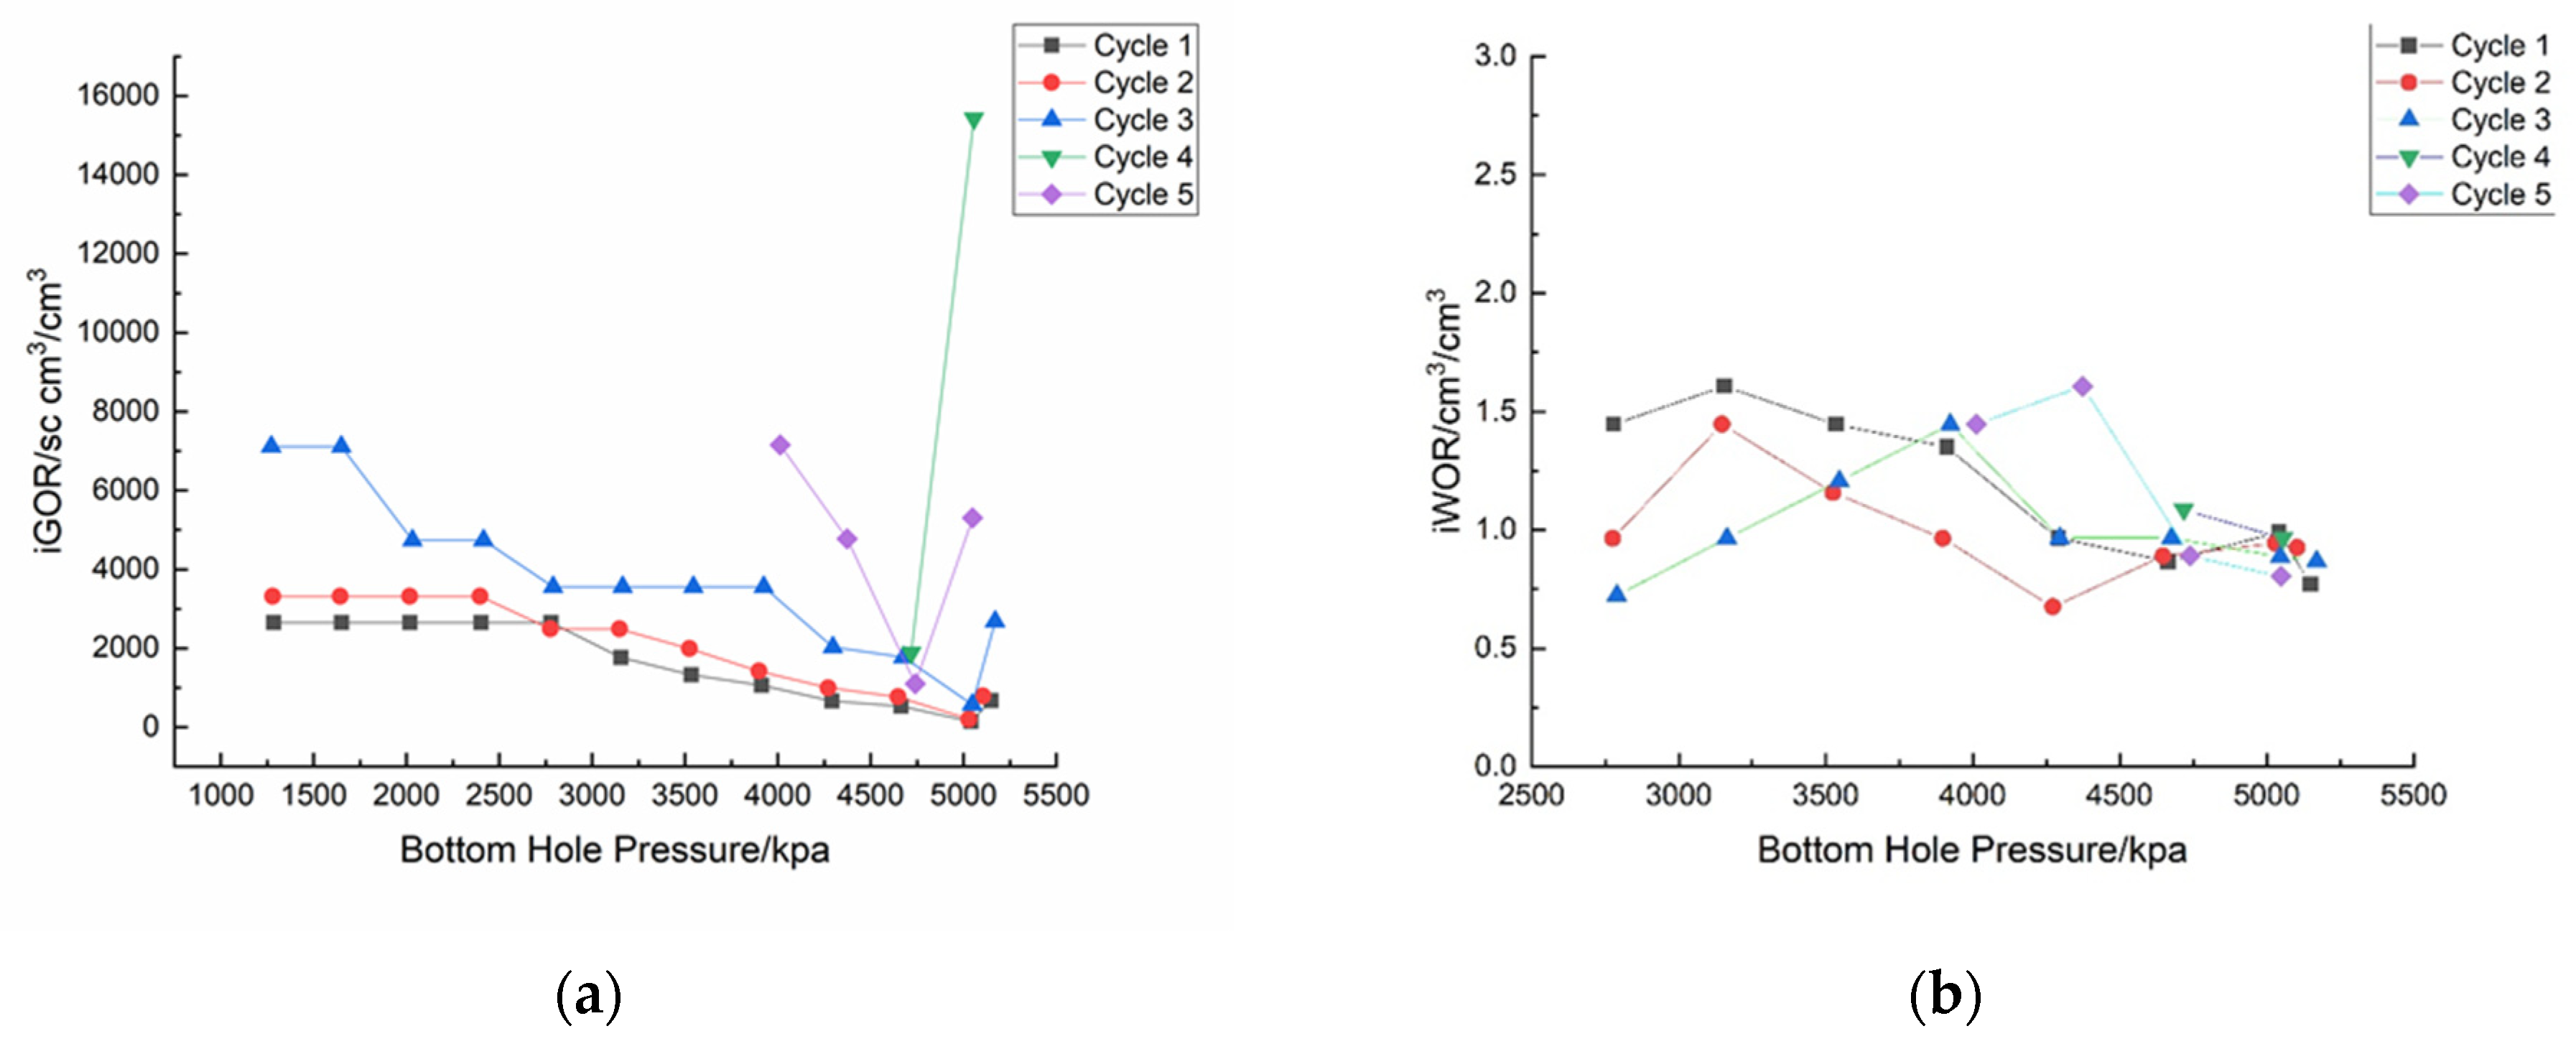
Figure 11 illustrates the iGOR (a) and iWOR (b) for each cycle in the third CSI process of Test 2. For iGOR, the main trend is similar to the previous CSI test. For each cycle, the iGOR is decreased rapidly and then increases near the end. Due to the high water production rate, the magnitude of iWOR is twice, even three times, more than the previous ethane-based CSI process. Moreover, the value of iWOR distribution is chaotic due to the oil production dropping sharply at cycle 4 and 5.

4. Discussion

Figure 12 shows the oil recovery comparison of the CSI process at Test 1 and Test 2.
According to Test 1 (base test) and Test 2-1 (gradually increasing the injection pressure), the oil recovery factor of Test 2-1 is 3% less than the base test. However, the CSI cycle and injection amount of ethane are much more than base test. Moreover, although the pressure at the late stage reached the pressure of the base test, the oil recovery factor at the 5500 kPa stage in Test 2-1 is much lower than in Test 1. Injecting at high pressure during the initial cycle of cyclic solvent injection is crucial for overcoming reservoir barriers, improving sweep efficiency, and ensuring optimal contact between the solvent and the oil. This process enhances penetration, displacement, and dissolution of heavy oil components, thereby leading to improved oil recovery. Therefore, the selection of the initial injection pressure for CSI is a crucial decision, as the success of this process largely depends on it. It is advisable to set a higher injection pressure at the beginning of the CSI process to maximize its effectiveness.
Comparing the ethane-based CSI processes of Test 1 and Test 2-2, both conducted at the same injection pressure of 5500 kPa, reveals that after the water flooding process, the ethane-based CSI process in Test 2-2 features three additional production cycles, indicating a longer production time. Furthermore, the ethane-based CSI process proves to be more effective after water flooding, primarily due to the lower initial oil saturation in Test 2-2. Notably, Test 1 exhibits a 35% higher initial oil saturation compared to Test 2-2. The introduction of water flooding, resulting in higher water saturation, positively impacts the subsequent CSI process, significantly enhancing its efficiency. One possible explanation for this enhanced efficiency is that water flooding facilitates the formation of water channels and dispersed oil droplets, consequently increasing the contact area between the gas and oil phases. This, in turn, allows injected ethane to penetrate the reservoir and contact the residual oil more effectively, ultimately resulting in a higher recovery factor.
After nanoparticle-solution flooding, the subsequent ethane-based CSI process led to an additional 10.8% recovery of OOIP. This result underscores the nanoparticles’ ability to consistently enhance foam stability, even if the oil saturation is less than 35%.
The fast depletion rate can spur the oil recovery factor a little (0.2%), and a long soaking period can stimulate heavy oil production on higher oil saturation at the beginning of the CSI process only.

5. Conclusions

This study introduced a successful combined process for enhanced oil recovery in heavy oil reservoirs at the lab scale. A comprehensive understanding of the intricate relationship between water flooding, foam stabilization using nanoparticles, and the performance of ethane-based CSI processes was gained through two designed tests.
(1) The integration of ethane-based CSI with water/nanoparticle-fluid flooding yielded impressive outcomes, resulting in a total oil recovery factor exceeding 76%. These results highlight the efficacy and promise of this approach in substantially boosting oil recovery from heavy oil reservoirs. The combination of ethane-based CSI and water/nanoparticle-fluid flooding presents encouraging opportunities for enhancing oil production and improving the overall performance of EOR processes.
(2) The selection of the initial injection pressure for CSI is a critical decision. This decision significantly influences the effectiveness of each cycle and ultimately impacts the overall oil recovery factor. Moreover, selecting the right pressure can lead to a reduction in the number of cycles required to achieve desired production targets.
(3) The beneficial influence of water flooding on the ethane-based CSI process was clearly observed in Test 2-2. The outcome revealed that implementing water flooding prior to the ethane-based CSI process led to notably higher cumulative oil recovery factors and prolonged production cycles compared to conducting the ethane CSI process alone. These results emphasize the effectiveness of water flooding as a valuable approach to augment the overall efficacy of the ethane-based CSI process, and optimize oil recovery in heavy oil reservoirs.
(4) After nanoparticle-solution flooding, the subsequent CSI phase led to an additional 10.8% oil recovery. This demonstrates the consistent ability of nanoparticles to improve foam stability, even after undergoing multiple SOR/EOR processes. These results emphasize that nanoparticles as a foam stabilizer have broad application prospects.
To date, the study has only been conducted on a laboratory scale. It is evident that the efficiency of water flooding and nanoparticle-solution flooding is very low. The next step could involve researching methods to enhance the efficiency of these techniques. Additionally, future work could include numerical simulations followed by scaling up to field production.

Author Contributions

Methodology, Y.L.; Validation, Y.L.; Investigation, Y.L.; Data curation, B.W.; Writing—original draft, Y.L.; Writing—review & editing, Z.D.; Supervision, J.D. and F.Z. All authors have read and agreed to the published version of the manuscript.

Funding

This research was funded by Petroleum Technology Research Centre (PTRC) grant number [INCB-UR-02-2019].

Data Availability Statement

The raw data supporting the conclusions of this article will be made available by the authors on request.

Conflicts of Interest

Author Jiasheng Ding was employed by the company Novus Energy Inc. The remaining authors declare that the research was conducted in the absence of any commercial or financial relationships that could be construed as a potential conflict of interest.

References

  1. Alshmakhy, A.S.; Maini, B.B. Heavy oil: A review. J. Pet. Eng. Technol. 2012, 2, 37–56. [Google Scholar]
  2. Jin, F.-Y.; Gao, H.; Chen, Y.-F.; Wei, B.; Li, Y.-B.; Dong, H.; Pu, W.-F. Low temperature oxidation characteristics analysis of ultra-heavy oil by thermal methods. J. Ind. Eng. Chem. 2017, 48, 249–258. [Google Scholar]
  3. Ma, H. Optimum Cyclic Solvent Injection (CSI) and Waterflooding/Gasflooding in the Post Cold Heavy Oil Production with Sand (Chops) Reservoirs. Ph.D. Dissertation, Faculty of Graduate Studies and Research, University of Regina, Regina, SK, Canada, 2017. [Google Scholar]
  4. Bannerjee, D. Oil Sands, Heavy Oil and Bitumen: From Recovery to Refinery; Pennwell Corp.: Tulsa, OK, USA, 2012. [Google Scholar]
  5. Canadian Association of Petroleum Producers (CAPP). Fast Facts: Canada’s Oil and Natural Gas Industry. 2023. Available online: https://www.capp.ca/wp-content/uploads/2023/11/BMO_Symposium_Brochure_V13.pdf (accessed on 28 February 2024).
  6. Bowers, B.; Drummond, K.J. Conventional crude oil resources of the western Canada sedimentary basin. J. Can. Pet. Technol. 1997, 36, 56–63. [Google Scholar] [CrossRef]
  7. Huang, S.S.; Pappas, E.S.; Jha, K.N. The Carbon Dioxide immiscible recovery process and its potential for Saskatchewan reservoirs. In Proceedings of the Technical Meeting/Petroleum Conference of the South Saskatchewan Section, Regina, SK, Canada, 6–8 October 1987. [Google Scholar]
  8. Srivastava, R.; Huang, S.; Dong, M. Comparative effectiveness of CO2 produced gas, and flue gas for enhanced heavy-oil recovery. SPE Reserv. Eval. Eng. 1999, 2, 238–247. [Google Scholar] [CrossRef]
  9. Zhao, D.W.; Wang, J.; Gates, I.D. Thermal recovery strategies for thin heavy oil reservoirs. Fuel 2014, 117, 431–441. [Google Scholar] [CrossRef]
  10. Srivastava, R.K.; Huang, S.S.; Mourits, F.M. A laboratory evaluation of suitable operating strategies for enhanced heavy oil recovery by gas injection. J. Can. Pet. Technol. 1997, 36, 33–41. [Google Scholar] [CrossRef]
  11. Jiang, T.; Zeng, F.; Jia, X.; Gu, Y. A new solvent-based enhanced heavy oil recovery method: Cyclic production with continuous solvent injection. Fuel 2014, 115, 426–433. [Google Scholar] [CrossRef]
  12. Lee, J.; Babadagli, T. Mitigating greenhouse gas intensity through new generation techniques during heavy oil recovery. J. Clean. Prod. 2021, 286, 124980. [Google Scholar] [CrossRef]
  13. James, L.; Rezaei, N.; Chatzis, I. VAPEX, warm VAPEX, and hybrid VAPEX–The state of enhanced oil recovery for in situ heavy oils in Canada. In Proceedings of the 8th Canadian International Petroleum Conference, Calgary, AB, Canada, 12–14 June 2007. [Google Scholar]
  14. Alvarez, J.; Han, S. Current overview of cyclic steam injection process. J. Pet. Sci. Res. 2013, 2, 116–127. [Google Scholar]
  15. Song, C.; Ghanizadeh, A.; Younis, A.; Clarkson, C.R. Experimental evaluation of the impact of induced fractures on cyclic solvent injection performance in low-permeability hydrocarbon reservoirs. Fuel 2023, 354, 129327. [Google Scholar] [CrossRef]
  16. Abedini, A.; Torabi, F. Oil recovery performance of immiscible and miscible CO2 huff-and-puff processes. Energy Fuels 2014, 28, 774–784. [Google Scholar] [CrossRef]
  17. Murray, M.D.; Frailey, S.M.; Lawal, A.S. New approach to CO2 flood: Soak alternating gas. In Proceedings of the SPE Permian Basin Oil and Gas Recovery Conference, Midland, TX, USA, 15–17 May 2001. [Google Scholar]
  18. Sayegh, S.G.; Maini, B.B. Laboratory evaluation of the CO2 huff-n-puff process for heavy oil reservoirs. J. Can. Pet. Technol. 1984, 23. [Google Scholar] [CrossRef]
  19. Shen, C. Experimental Study of Foamy Oil Characteristics and Post-CHOPS CSI Processes Based on CO2-C3H8 Mixture Solvent. Ph.D. Dissertation, The University of Regina, Regina, SK, Canada, 2020. [Google Scholar]
  20. Simpson, M.R. The CO2 huff “n” puff process in a bottomwater-drive reservoir. J. Pet. Technol. 1988, 40, 887–893. [Google Scholar] [CrossRef]
  21. Spivak, A.; Chima, C.M. Mechanisms of immiscible CO2 injection in heavy oil reservoirs, Wilmington Field, CA. In Proceedings of the SPE Enhanced Oil Recovery Symposium, Tulsa, OK, USA, 15–18 April 1984. [Google Scholar]
  22. Zhou, X. Enhanced Heavy Oil Recovery Using CO2 Huff’N’Puff Process. Ph.D. Dissertation, Faculty of Graduate Studies and Research, University of Regina, Regina, SK, Canada, 2019. [Google Scholar]
  23. Singhal, A.K.; Das, S.K.; Leggitt, S.M.; Kasraie, M.; Ito, Y. Screening of reservoirs for exploitation by application of steam assisted gravity drainage/VAPEX processes. In Proceedings of the International Conference on Horizontal Well Technology, Calgary, AB, Canada, 18–20 November 1996. Paper SPE 37144. [Google Scholar]
  24. Ma, H.; Yu, G.; She, Y.; Gu, Y. A parabolic solvent chamber model for simulating the solvent vapor extraction (VAPEX) heavy oil recovery process. J. Pet. Sci. Eng. 2017, 149, 465–475. [Google Scholar] [CrossRef]
  25. Du, Z.; Peng, X.; Zeng, F. Comparison analyses between the linear and non-linear pressure-decline methods in cyclic solvent injection (CSI) process for heavy oil recovery. Fuel 2018, 224, 442–450. [Google Scholar] [CrossRef]
  26. Lin, L.; Ma, H.; Zeng, F.; Gu, Y. A critical review of the solvent-based heavy oil recovery methods. In Proceedings of the SPE Canada Heavy Oil Conference, Calgary, AB, Canada, 10–12 June 2014; p. D021S006R001. [Google Scholar]
  27. Dong, X.; Liu, H.; Chen, Z.; Wu, K.; Lu, N.; Zhang, Q. Enhanced oil recovery techniques for heavy oil and oilsands reservoirs after steam injection. Appl. Energy 2019, 239, 1190–1211. [Google Scholar] [CrossRef]
  28. Ahadi, A.; Torabi, F. Effect of light hydrocarbon solvents on the performance of CO2-based cyclic solvent injection (CSI) in heavy oil systems. J. Pet. Sci. Eng. 2018, 163, 526–537. [Google Scholar] [CrossRef]
  29. Jamaloei, B.Y.; Dong, M.; Yang, P.; Yang, D.; Mahinpey, N. Impact of solvent type and injection sequence on Enhanced Cyclic Solvent Process (ECSP) for thin heavy oil reservoirs. J. Pet. Sci. Eng. 2013, 110, 169–183. [Google Scholar] [CrossRef]
  30. Hong, S.Y.; Zeng, F.; Du, Z. Characterization of gas-oil flow in Cyclic Solvent Injection (CSI) for heavy oil recovery. J. Pet. Sci. Eng. 2017, 152, 639–652. [Google Scholar] [CrossRef]
  31. Zhang, M.; Du, Z.; Zeng, F.; Xu, S. Upscaling Study of Cyclic Solvent Injection Process for Post-CHOPS Reservoirs through Numerical Simulation. In Proceedings of the SPE Canada Heavy Oil Conference, Calgary, AB, Canada, 10–12 June 2014; p. D031S022R003. [Google Scholar]
  32. Lim, G.B.; Kry, R.P.; Harker, B.C.; Jha, C.K. Cyclic stimulation of Cold Lake oil sand with supercritical ethane. In Proceedings of the SPE International Thermal Operations and Heavy Oil Symposium, Calgary, AB, Canada, 19–21 June 1995; p. SPE-30298. [Google Scholar]
  33. Anderson, M.; Badamchizadeh, A.; Kantzas, A.; Bryan, J. Solvent Screening Study for a Post CHOPS Cyclic Solvent Injection Pilot. In Proceedings of the SPE Annual Technical Conference and Exhibition, Calgary, AB, Canada, 30 September–2 October 2019; p. D031S045R001. [Google Scholar]
  34. Qazvini Firouz, A.; Torabi, F. Feasibility study of solvent-based huff-n-puff method (cyclic solvent injection) to enhance heavy oil recovery. In Proceedings of the SPE Canada Heavy Oil Conference, Calgary, AB, Canada, 10–12 June 2012; p. SPE-157853. [Google Scholar]
  35. Ivory, J.; Chang, J.; Coates, R.; Forshner, K. Investigation of cyclic solvent injection process for heavy oil recovery. J. Can. Pet. Technol. 2010, 49, 22–33. [Google Scholar] [CrossRef]
  36. Ganapathi, R.; Henni, A.; Shirif, E. Solubility of carbon dioxide and ethane in Lloydminster heavy oil: Experimental study and modelling. Can. J. Chem. Eng. 2022, 100, 1235–1243. [Google Scholar] [CrossRef]
  37. Marufuzzaman, M. Solubility and Diffusivity of Carbon Dioxide, Ethane and Propane in Heavy Oil and Its SARA Fractions; Faculty of Graduate Studies and Research, University of Regina: Regina, SK, Canada, 2011. [Google Scholar]
  38. Yang, C.; Gu, Y. Diffusion coefficients and oil swelling factors of carbon dioxide, methane, ethane, propane, and their mixtures in heavy oil. Fluid Phase Equilibria 2006, 243, 64–73. [Google Scholar] [CrossRef]
  39. Wu, M.; Lu, X.; Zhou, X.; Lin, Z.; Zeng, F. Experimental study on the temperature effects of foamy oil flow in porous media. Fuel 2020, 271, 117649. [Google Scholar] [CrossRef]
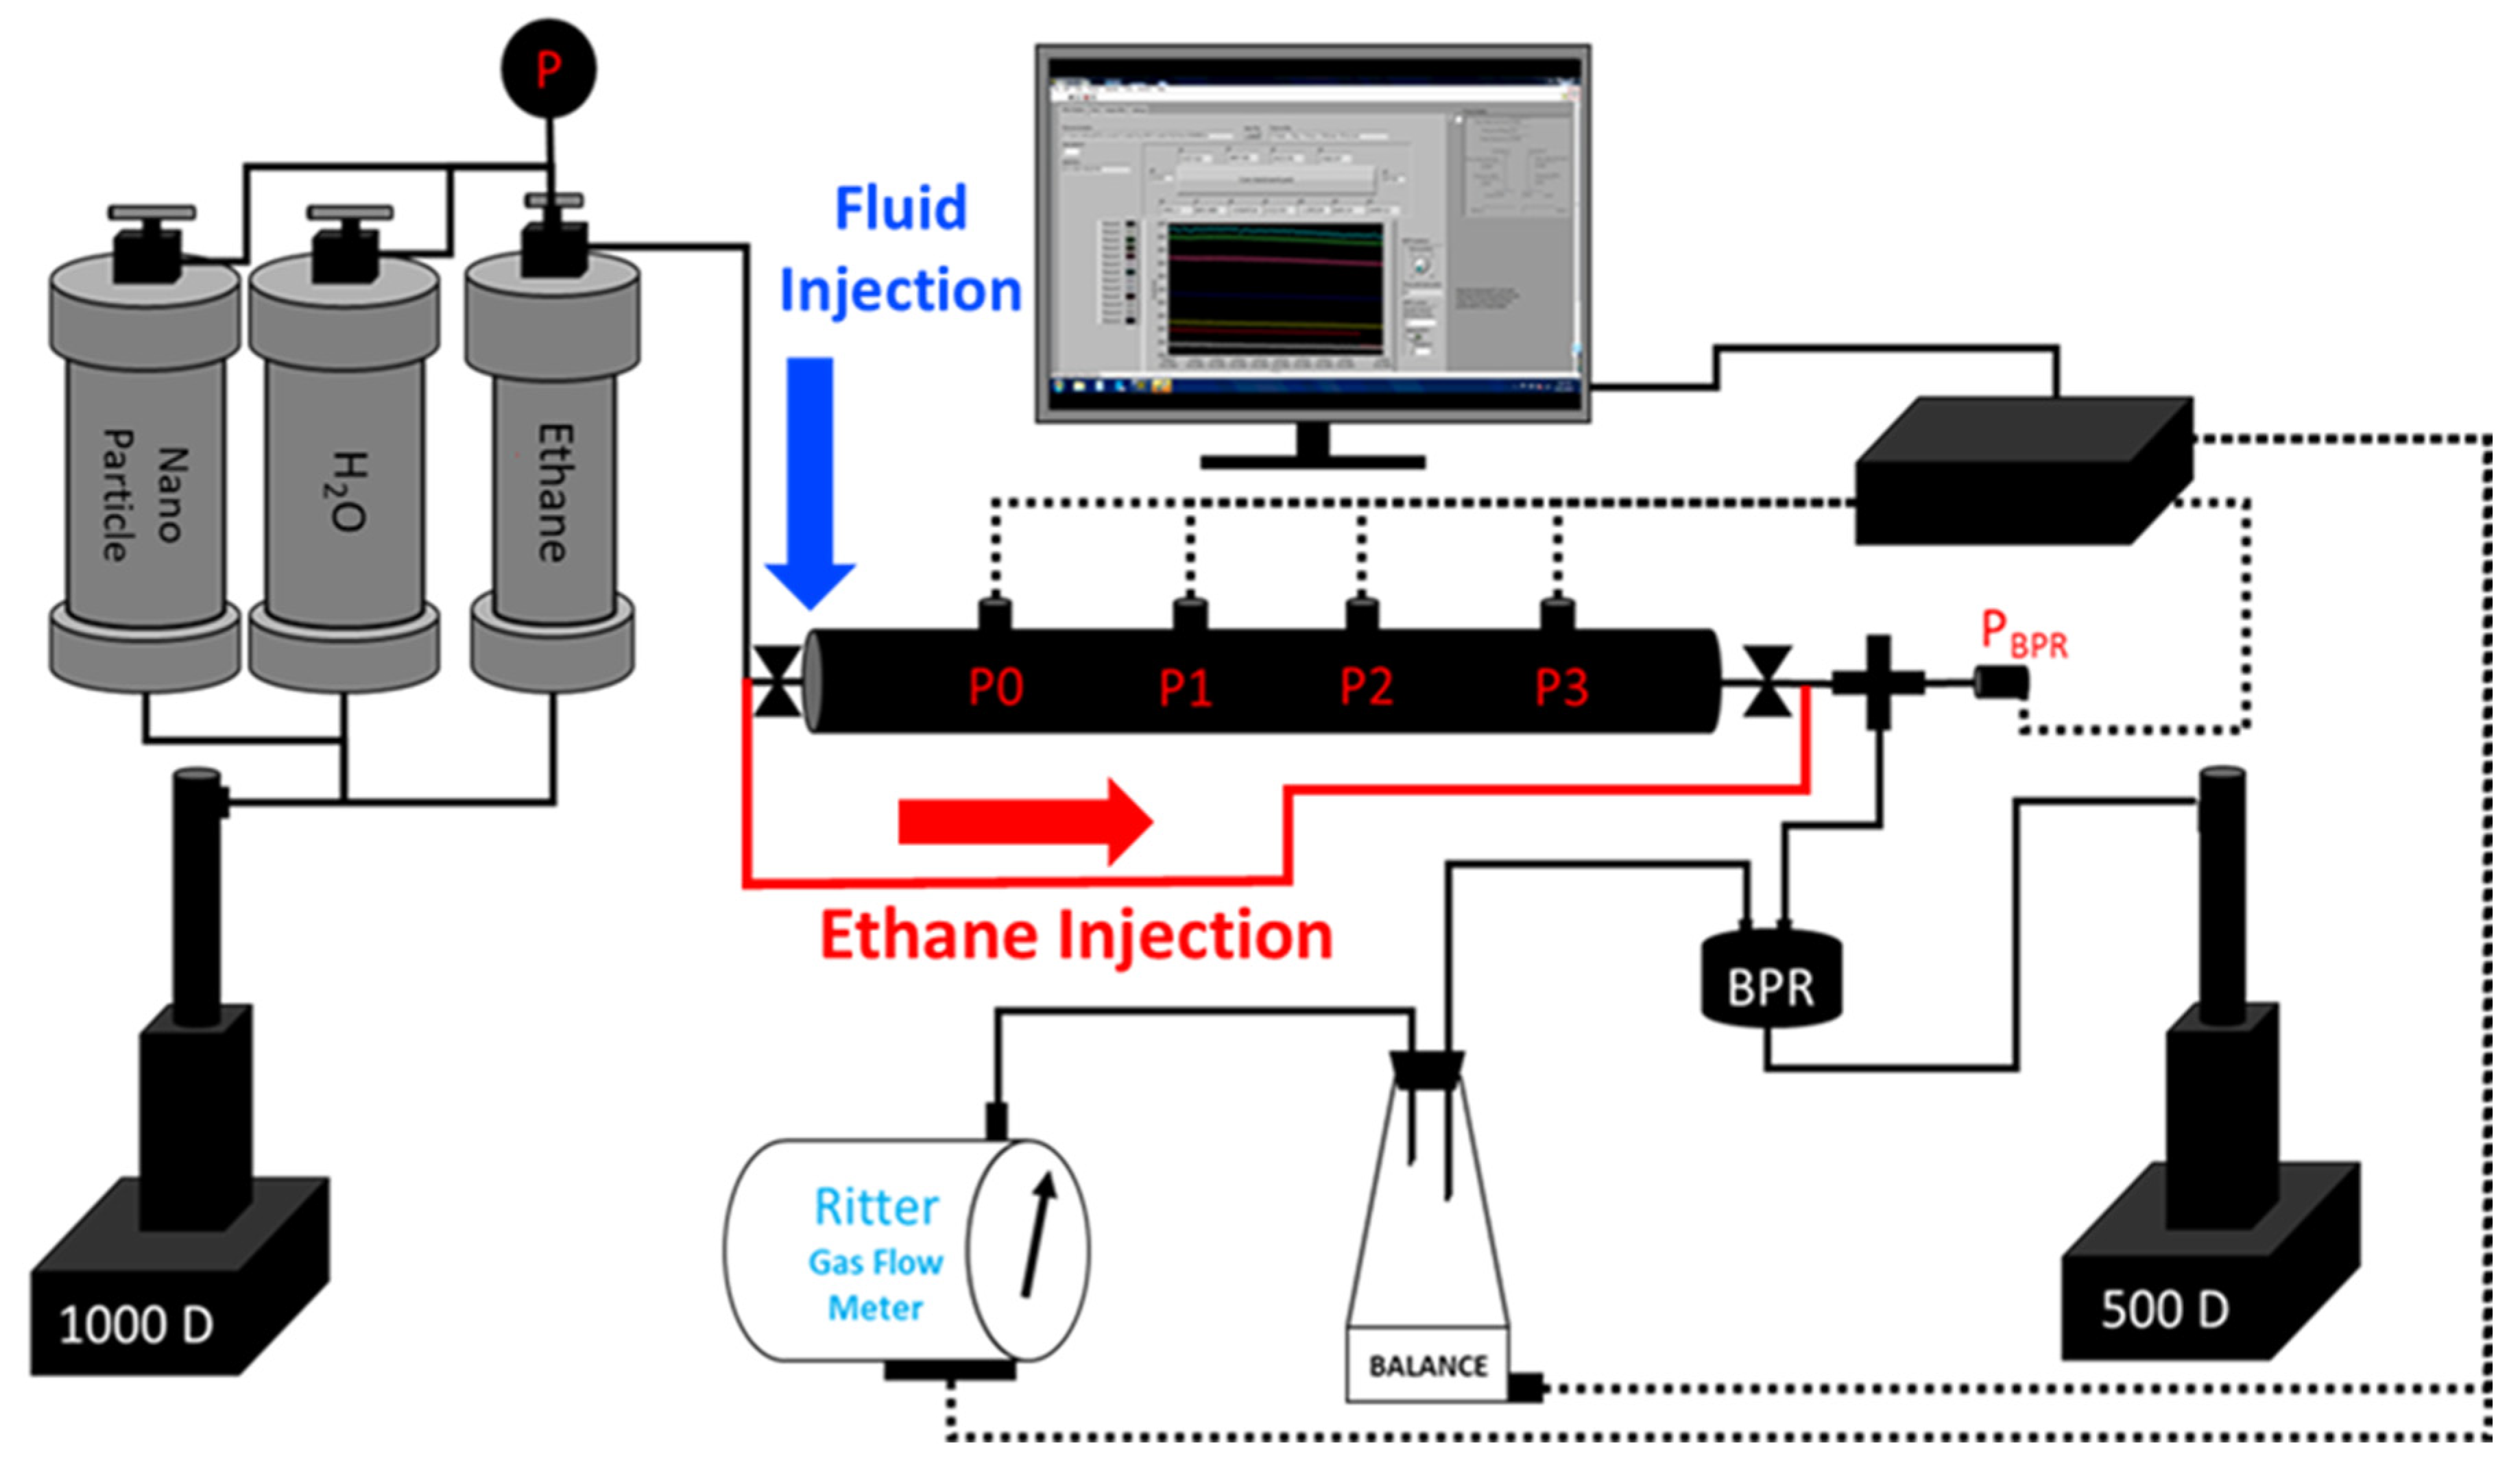
Figure 1. Schematic of combined ethane-based CSI and water/NP fluid flooding process.
Energies 17 01457 g001
Figure 2. Oil production of Test 1 (base test).
Energies 17 01457 g002
Figure 3. Average pressure differences for Test 1.
Energies 17 01457 g003
Figure 4. The iGOR of each cycle (base test).
Energies 17 01457 g004
Figure 5. Oil production of the first ethane-based CSI process in Test 2.
Energies 17 01457 g005
Figure 6. The iGOR of each cycle in the Test 2-1 CSI process (a) 4000 kPa (b) 4500 kPa (c) 5500 kPa.
Energies 17 01457 g006
Figure 7. Oil production and water cut of water flooding process in Test 2.
Energies 17 01457 g007
Figure 8. Oil production (a) and average pressure difference (b) of Test 2-2 CSI process.
Energies 17 01457 g008
Figure 9. iGOR (a) and iWOR (b) of each cycle of Test 2-2 CSI process.
Energies 17 01457 g009
Figure 10. Oil production (a) and average pressure difference (b) of Test 2-3 CSI process.
Energies 17 01457 g010
Figure 11. iGOR (a) and iWOR (b) of each cycle of Test 2-3 CSI process.
Energies 17 01457 g011
Figure 12. Oil recovery comparison of CSI process at Test 1 and Test 2.
Energies 17 01457 g012
Table 1. The properties and SARA analysis results of a Manatokan heavy oil sample.
Manatokan Heavy Oil PropertiesTemperatureDensityViscosityCompressibilityMolecular Weight
(°C)kg/m3mPa·S1/(kPa)g/mol
21964.322005.5 × 10−7389
SARA Analysis ResultsSaturatesAromaticsResinsAsphaltenesUnrecovered
mole%mole%mole%mole%mole%
28.427.022.514.87.3
Table 2. Reservoir characteristics of the sandpack model.
Testρo @
1 Atm
(g/cm3)
SolventPorosity, %Permeability, DOil Saturation, %Water Saturation, %
10.9643Ethane32.957.5691.558.45
20.9643Ethane33.287.4891.298.71
Table 3. Experimental procedures.
Test No.ProcedureInjection Pressure, kPa
1Ethane CSI (base test)5500
2Ethane CSI→Water flooding→2nd Ethane CSI→NP fluid flooding→3rd Ethane CSI1st Ethane CSI From 3500 to 5500
2nd Ethane CSI 5500
3rd Ethane CSI 5500
Table 4. Summary of experimental results.
Test No.ProcedureOil Recovery Factor, %Total, %
1Ethane CSI31.131.1
2Ethane CSI→Water flooding→Ethane CSI→NP fluid flooding→Ethane CSI28.28.728.10.310.876.1
Disclaimer/Publisher’s Note: The statements, opinions and data contained in all publications are solely those of the individual author(s) and contributor(s) and not of MDPI and/or the editor(s). MDPI and/or the editor(s) disclaim responsibility for any injury to people or property resulting from any ideas, methods, instructions or products referred to in the content.