Article

Method for Spatiotemporal Solar Power Profile Estimation for a Proposed U.S.–Caribbean–South America Super Grid under Hurricanes †

1
Electrification and Energy Infrastructures Division, Oak Ridge National Laboratory, 1 Bethel Valley Rd, Oak Ridge, TN 37830, USA
2
Department Energy and Automation, University of São Paulo, Av. Prof. Luciano Gualberto, Travessa 3 nº 380, São Paulo 05508-010, Brazil
*
Author to whom correspondence should be addressed.
Acknowledgments: This manuscript has been authored by UT-Battelle, LLC, under contract DE-AC05-00OR22725 with the U.S. Department of Energy (DOE). The publisher, by accepting the article for publication, acknowledges that the U.S. government retains a nonexclusive, paid-up, irrevocable, worldwide license to publish or reproduce the published form of this manuscript, or allows others to do so, for U.S. government purposes. The DOE will provide public access to these results of federally sponsored research in accordance with the DOE Public Access Plan (https://www.energy.gov/doe-public-access-plan, accessed on 22 March 2023).
Energies 2024, 17(7), 1545; https://doi.org/10.3390/en17071545
Submission received: 13 February 2024 / Revised: 13 March 2024 / Accepted: 20 March 2024 / Published: 23 March 2024
(This article belongs to the Section A: Sustainable Energy)

Abstract

:
Solar photovoltaic (PV) generation technology stands out as a scalable and cost-effective solution to enable the transition toward decarbonization. However, PV solar output, beyond the daily solar irradiance variability and unavailability during nights, is very sensitive to weather events like hurricanes. Hurricanes nucleate massive amounts of clouds around their centers, shading hundreds of kilometers in their path, reducing PV power output. This research proposes a spatiotemporal method, implemented in MATLAB R2023b coding, to estimate the shading effect of hurricanes over a wide distribution of PV solar plants connected to a high-voltage power infrastructure called the U.S.–Caribbean–South America super grid. The complete interconnection of the U.S., the Caribbean, and South America results in the lowest power valley levels, i.e., an overall percentual reduction in PV power output caused by hurricane shading. The simulations assess the impact of hurricanes in 10 synthetic trajectories spanning from Texas to Florida. The Caribbean would also experience lower power valleys with expanded interconnectivity schemes. The U.S.–Caribbean–South America super grid reduces Caribbean variability from 37.8% to 8.9% in the case study. The proposed spatiotemporal method for PV power profile estimation is a valuable tool for future solar power generation expansion, transmission planning, and system design considering the impact of hurricanes.

1. Introduction

1.1. Background

Anthropogenic-induced climate change has been linked to increased magnitudes of hurricanes and precipitation in the Atlantic and Gulf coasts, Hawaii, and Puerto Rico [1]. The causes of the increasing number of major hurricanes in the North Atlantic are credited to both climate change (higher ocean heat, sea surface temperature, and cloud cover moisture) and climatic variability (El Niño–Southern Oscillation and the Atlantic Multidecadal Oscillation) [1].
Regardless of the causes and underlying mechanisms still under investigation from weather and atmospheric scientists, this research focuses on the effects of hurricanes. Hurricanes cause major impacts on electrical grids, specifically on the large-scale PV solar power generation capacity. The overall systemic impact of hurricanes on large-scale PV capacity integrated in high-voltage super grids is not very well understood yet.

1.2. Literature Review

This brief review of the technical literature explores primarily two multidisciplinary domains: the impact of hurricane shading on a PV solar power profile and the grid integration facilitated by large-scale power interconnectivity schemes, namely, super grids. Notably, these domains are seldom investigated together in the existing literature. Consequently, this concise review adopts a distinct approach to provide a clear understanding of the context within the current body of literature, addressing identified gaps to be covered in this research.

1.2.1. Hurricane Shading on PV Power

In 2020, Cole et al. estimated the shading impact of hurricanes on a PV power plant in the U.S. by collecting spatial-temporal weather data of the National Solar Radiation Database and applying a software tool called the System Advisor Model (SAM) [2]. They observed a reduction in PV power of 18 to 60% during the hurricane. Their simulations are specific to estimations of Hurricane Ike’s (category 4) impact on an assumed 200 MW PV plant in Galveston, Texas, with fixed-tilt angle of 20 degrees and azimuth orientation of 180 degrees [2]. Their data-driven estimation included the effect of hurricane winds in cooling the PV array and supposedly improving energy-conversion performance. They observed 5 days’ hurricane impact with major decay around 72 h of the passage of the hurricane eye and suggested such a period for specification of battery autonomy for critical loads [2].
In 2021, Ceferino et al. elaborated on a stochastic modeling of solar irradiance during hurricanes. They compiled data from the revised Atlantic hurricane database (HURDAT2) of 22 historical hurricanes crossing the Caribbean and the Gulf of Mexico and making landfall on the south coast of the U.S. [3]. They proposed four different parametric models of solar decay of a PV solar power plant and demonstrated the consistency of the best one in comparison with the power density obtained by Cole et al. in 2020 [2]. While the association of hurricanes and impacts on wind power is direct due to the strong kinetic energy released in a hurricane, the association of hurricane shading and solar power is not much noticed. The literature about hurricane shading and PV solar is very scarce.

1.2.2. Super Grids

The worldwide expansion of transmission systems is very critical as clean energy transitions progress. New transmission lines are needed to be added or refurbished by 2040 to support nations in achieving their targets for greenhouse emissions reduction by renewables [4]. Super grids are high-voltage transmission interconnectivity schemes for GW-scale cross-border power trading among countries and territories [5]. Super grids have been in ongoing or recent construction in Europe [6], Southeast Asian countries [7], interregional China [8,9], and the Euro-Asia interconnector [10]. Super grids have been proposed and investigated for interconnection of Europe–North America [11], Mongolia–Russia–Japan–South Korea–China [12], China–South Korea–Japan [13], Japan–Taiwan–Philippines [14], Australia–Indonesia–Singapore [15], U.S.–Caribbeans–South America [16], Latin America [17], interregional North America [18], and Africa [19].
Super grids find application and value proposition; for example, in situations where two or more intermittent renewable sources are complementary but distant from each other, the demand is not flexible and energy storage is poorly available. Also, super grids have been investigated for enhancement of energy security between nations.

1.3. Research Gaps and Motivation

Research gaps are observed in the interdisciplinary space between hurricane shading on PV plants and systemic impact on large-scale super grids. The research gaps can be summarized into three classes.
The first one is the need for a tool to assess the impact of hurricanes on a multitude of PV power plants. The estimation method proposed by Cole et al. in 2020 focused just on one PV plant [2]. For being case-specific, their findings cannot be extrapolated for several PV power plants, in different fixed-tilts, located at different distances from the hurricane trajectory, possibly not covered by the database. What also remain to be addressed are the non-critical loads, represented by power customers who cannot afford power backup systems. Such case-specific limitations do not blur the merits of their findings, which are still very relevant for the validation of the order of magnitude of the results of this research. However, such a limitation is an important gap explored in this research.
The second gap is derived from Ceferino et al. [3]. One of the limitations of Ceferino’s model, similarly to Cole et al. [2], is that it does not extend the analysis to large-scale renewable power grids. This limitation is addressed in this research with the increment of quantity and distribution of PV solar plants along the countries served by the proposed U.S.–Caribbean super grid with and without extension to South America.
The third gap is the assessment of hurricane shading impact on PV power variability in super grids. Despite vast literature, to the best of the authors’ knowledge, super grids have never been investigated with an exclusive interdisciplinary focus on the impact of hurricane shading on PV solar power plants. This is relevant because PV solar is in accelerated ongoing expansion. This is the research gap that is explored by this research.

1.4. Challenges

This research proposes a method for estimation of PV solar power profiles aggregated into a super grid with the impact of hurricane shading. This research analyzes different options of large-scale interconnectivity schemes for the proposed U.S.–Caribbean–South America super grid. A large amount of PV capacity concentrated along the hurricane trajectory (such as in the U.S. contiguous territory) causes high aggregated power valleys. In this research, a power valley is the magnitude of the drop of the power profile of PV plants caused by hurricanes.
From the perspective of solar irradiance, major hurricanes attract to its center eye large amounts of clouds, barring the full penetration of clear-sky solar energy to the Earth’s surface. Given that its size does not rarely exceed 500 km radius, it causes significant spatiotemporal shading along its track over PV solar power plants for an extended period and coverage [3].
From the perspective of power grid integration, the current endeavor to expedite the deployment of renewables in the energy transition away from fossil fuel is pushing for a much-needed large-scale interconnection of local high-voltage power grids. According to the IEA, transmission line length needs to be doubled in the U.S. and expanded 2.4 times worldwide, from the 2021 status until 2050 in the announced-pledges scenario [4] for renewables expansion. Power transmission lines do not just allow efficient power flow from renewable power generation to consumers but also support the balancing of supply-and-demand power transactions by cutting the intermittent renewables power peak in one geographical location to fill the power valley in other sections of the integrated power grid [20]. However, overhead aerial transmission lines are extremely vulnerable to hurricane wind forces [21], and the aesthetics of towers and lines are perceived as having a negative influence on the landscape by land property owners and residents [22]. Given this challenging context, power transmission based on submarine subsea cables, which is inherently resilient to hurricanes and immune to land property compensation or blockade, demonstrates a value proposition to support fast and mass deployment of intermittent renewables [16]. The main challenge of this research is to envision a realistic scenario with renewable PV, propose and implement an innovated method for PV power estimation under hurricanes, and deliver a tool to bridge the interdisciplinary gap between extreme weather science and electrical power systems with real-world application for super grid transmission system planning, design, and large-scale power systems simulations.

1.5. Contribution

This research investigates the impact of hurricane shading on PV solar power plants within a U.S.–Caribbean–South America super grid topology. Originally proposed for interconnecting wind power plants in [16], this super grid addresses the challenge of reducing power variability during extreme weather events. The study makes significant contributions by proposing a novel spatiotemporal method for estimating PV power profiles under hurricanes, filling gaps in the literature. Simulation results demonstrate reduced PV power variability when the Caribbean super grid is connected to the U.S. or South America. This comprehensive and versatile method proves essential for future transmission systems planning, design, and power flow simulations of renewables under extreme weather conditions. The research explores different interconnectivity schemes, emphasizing the benefits of the U.S.–Caribbean–South America super grid. This study paves the way for future investigations into feasibility, cost–benefit analysis, and power estimation under non-hurricane conditions across the super grid.

1.6. Paper Organization

This work is organized as follows: Section 2 proposes a spatiotemporal method to quantify the magnitude of hurricane shading impact on PV solar power plants; Section 3 presents simulation results using the proposed method and a comparative analysis of power profile variability under different scenarios; Section 4 presents an analysis of the consistency of the method; Section 5 concludes the work, discussing scope restrictions, merits, limitations, and future work.

2. Materials and Methods

The materials in this research include specific technical publications that played a critical role in establishing the input parameters for the modeling and simulation process.
The proposed spatiotemporal method for estimating PV solar power profile in super grids under hurricane shading integrates models and outlines a potential expansion of PV solar capacity as a case scenario. The method was implemented in MATLAB R2023b coding to model the components of the algorithm and generate the simulation results. The proposed method integrates the following components:
  • Model of global irradiance on the tilted PV module [23], formulated in Appendix A.
  • Model of irradiance decay by the hurricane shading effect [3].
  • Conversion of irradiance on a PV module into a power profile, as formulated in [24].
  • Model of the hurricane movement over a synthetic parabolic trajectory.
  • Model of future PV solar capacity expansion along the U.S.–Caribbean–South America super grid.
  • Spatiotemporal estimation of PV solar power profile of super grids under hurricane shading.

2.1. Model of Global Irradiance on the Tilted PV Module

Global irradiance on the tilted PV module is a model for the estimation of solar radiation peak power (kW/m2) and energy (kWh/m2) in any given latitude and day of the year. By selecting a specification of PV module technology, quantity, size of the PV cell, tilt angle, and azimuth orientation, the model also generates the power profile from the PV solar plant. The details and the equations of the global irradiance model in [23] are described in Appendix A.
The model is used to generate the solar irradiance profiles of each PV plant for a 14-day period. The coordinates of the PV plants are inputs for the estimation of solar irradiance.

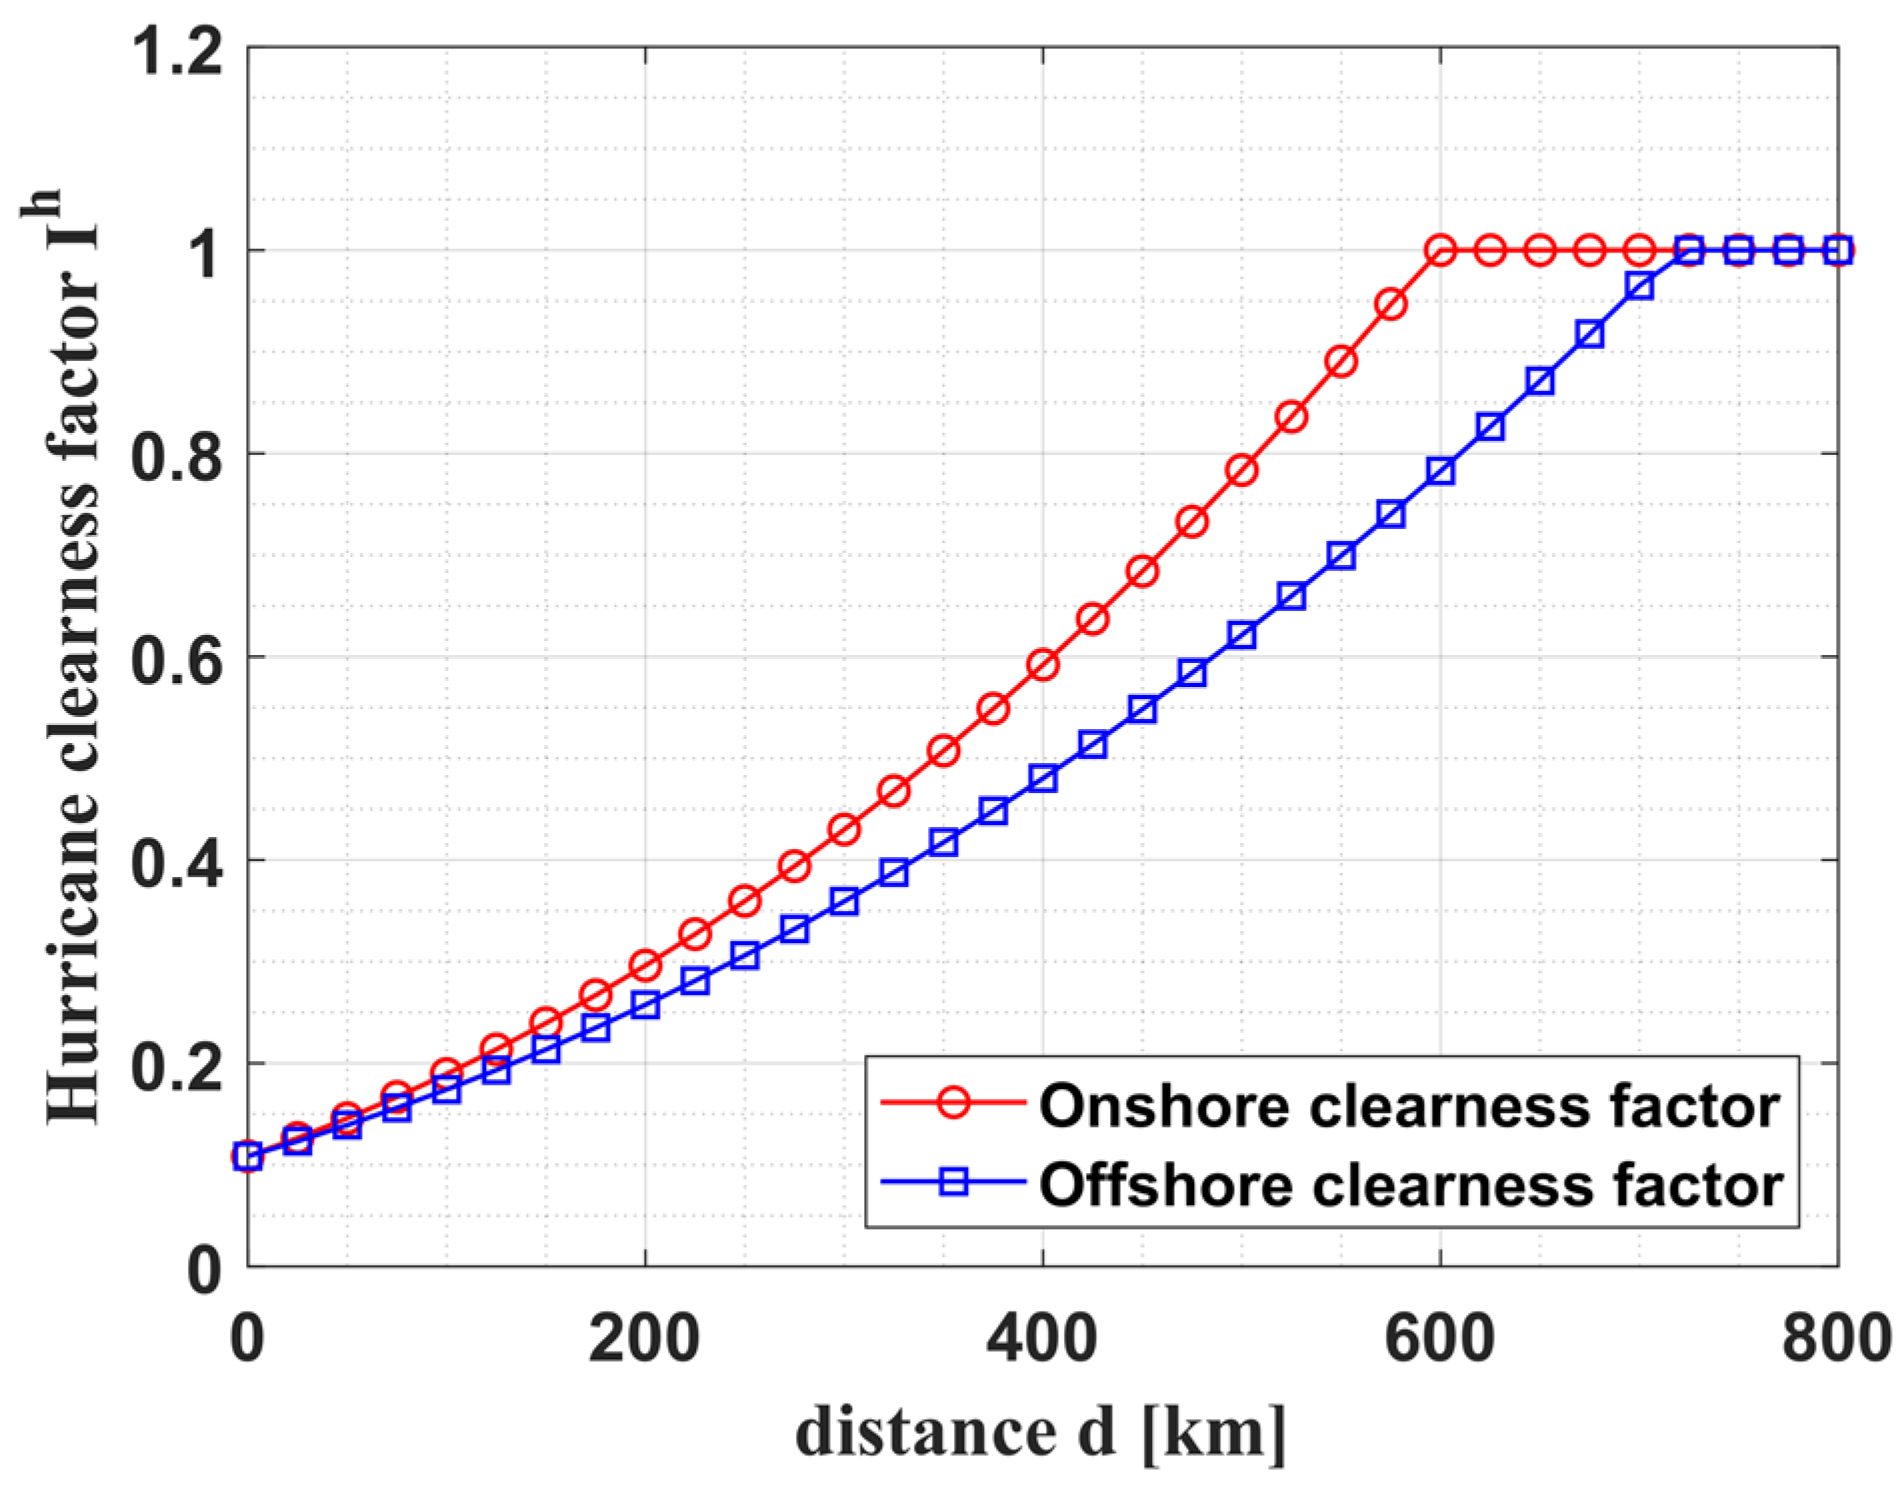
2.2. Model of the Hurricane Shading Effect

In 2021, Ceferino et al. elaborated on the modeling of irradiance decay during hurricanes in the function of certain parameters. Table 1 also shows such parameters, their values and descriptions, and the sources of the literature.
From data obtained from the U.S. National Oceanic and Atmospheric Administration (NOAA), the radii of the outermost closed isobar (ROCI) value is not directly proportional to the hurricane category [25,26,27]. It is important to note that ROCI is associated with the extent of shading of solar irradiance, as observed in [3]. Table 1 shows a category-4 hurricane, Charley (2004) [26], with smaller ROCI value than category-5 hurricane Michael (2018) [25] and category-3 hurricane Wilma (2005) [27]. The data from NOAA imply that a high-category hurricane does not always produce more shading than a low-category hurricane.
This research makes use of the parameter-based equations elaborated on by Ceferino et al. to represent the shading effect of hurricanes on a PV solar plant. The parametric equation proposed and validated by Ceferino et al. in 2021 is as follows [3]:
I h = I × e f R , C
f R , C = a 2 C + a 1 × l n R + b 2 C + b 1 c 2 C + c 1     ,     i f   R + ( b 2 C + b 1 ) < c 2 C + c 1   0                                                                                                     ,       i f   R + ( b 2 C + b 1 ) c 2 C + c 1  
R = d / R O C I
where I h is the clearness factor during a hurricane, and I is made equal to the unity in this research for per-unit calculation. The remaining parameters are described in Table 1.
Figure 1 shows the implementation of the hurricane exponential clearness factor implemented in MATLAB R2023b coding and based on the parametric Equations (1)–(3) for the parameters of hurricane Wilma (2005) with onshore R O C I of 463 km, as shown in Table 2. There are two clearness factor curves because the R O C I of a hurricane in an onshore trajectory may be slightly different from one in an offshore trajectory, according to the data of hurricanes tracked by NOAA [25,26,27]. The shading effect radii (600 and 720 km in Figure 1) extends beyond the R O C I radii of 463 km and 556 km for onshore and offshore conditions, respectively. This overextension of shading corroborates the findings of Ceferino et al., who also observed decay extending to approximately 1.3 × R O C I [3].
The hurricane shading effect values that are less than the unity means that the irradiance absorbed by the PV cells is partially blocked by the hurricane clouds, reducing its power generation in proximity to the hurricane center. In this model, the hurricane’s clouds do not shade PV power plants located more than 600 km and 720 km away from its eye over onshore and offshore locations, respectively.

2.3. Conversion of Solar Energy into Alternating Current Electric Power

Table 2 shows the PV cell data and environmental parameters for the conversion of solar irradiation into a PV solar power profile.
Hurricane cloud shading reduces the total solar irradiation absorbed by the PV plants by the clearness factor during hurricane I h t . This research assumes that the PV plants have power capacity values ( P P V ,   r a t e d ) referred to as alternating current output and are adequately sized to absorb the full peak irradiance on the PV solar plant on 15 September at noon. This date is conveniently selected in the middle of the U.S. hurricane season, from 1 June to 30 November. The instantaneous power in each PV plant is calculated by [3]:
P P V t = P P V ,   r a t e d · I h t · G T , β t
where P P V t is the instantaneous power profile of each PV plant, P P V ,   r a t e d is the power capacity referred to as alternating current output, I h is the clearness factor, and   G T , β is total solar irradiation absorbed by a fixed tilted PV module.

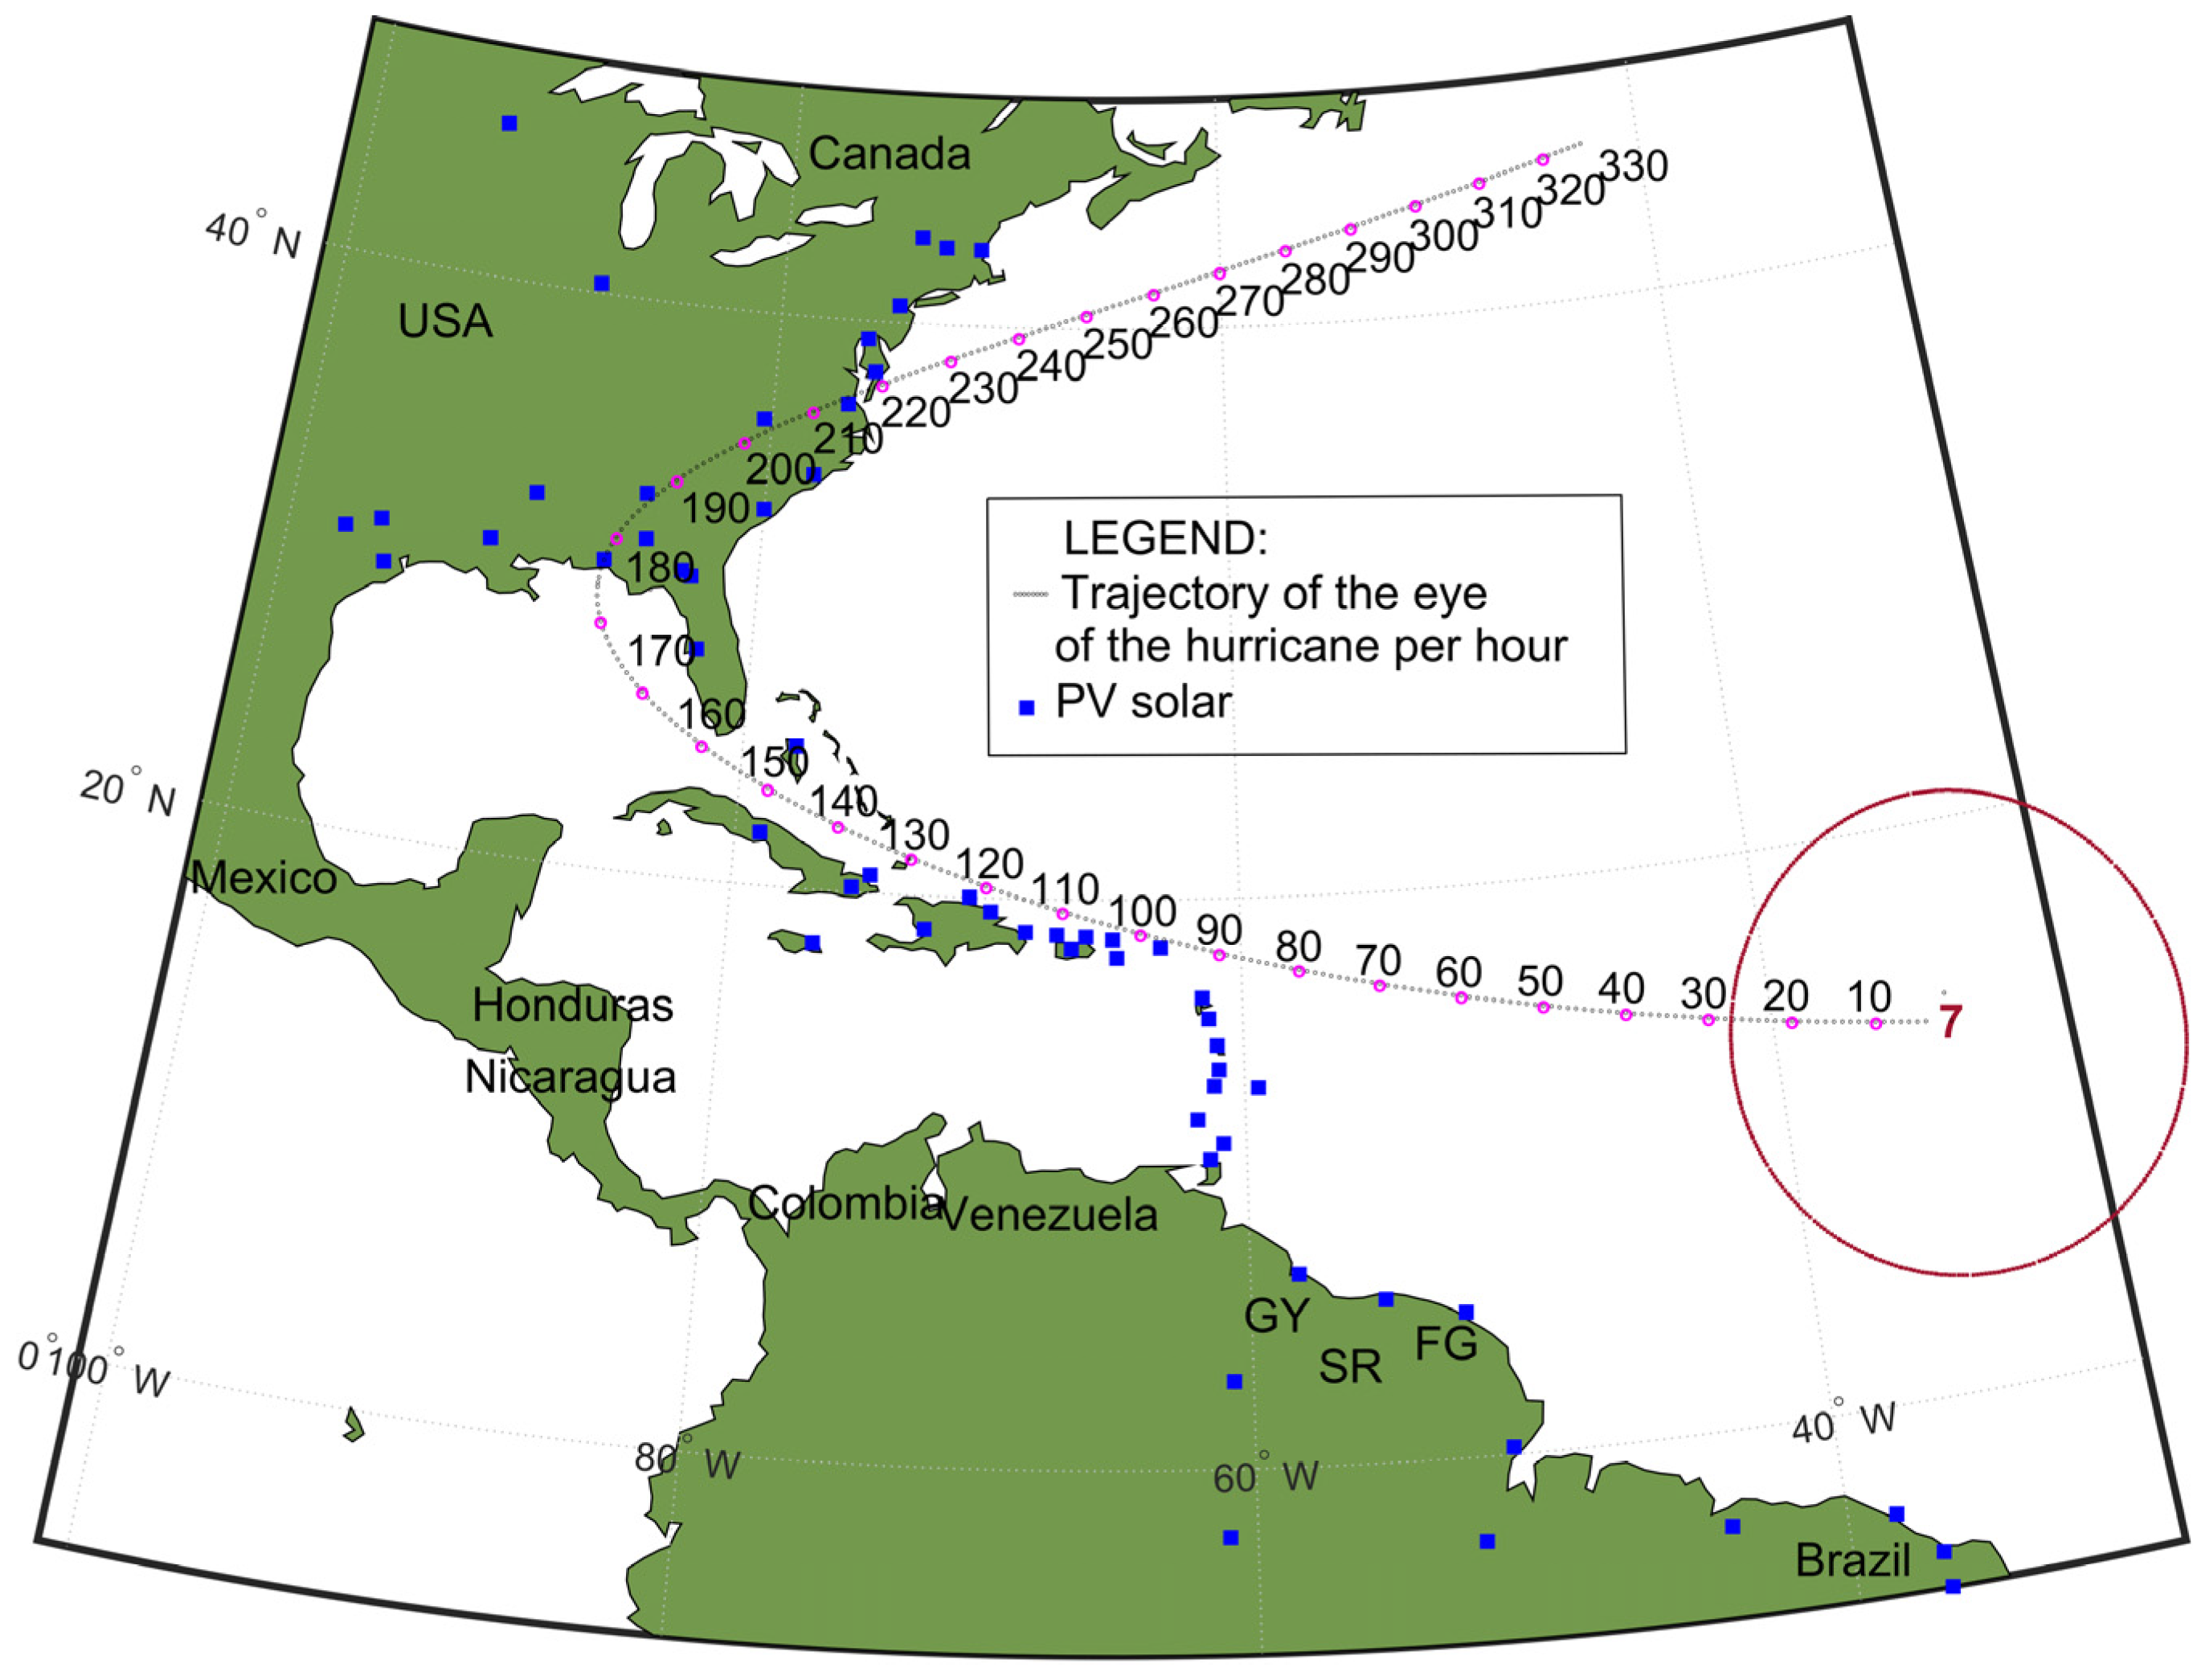
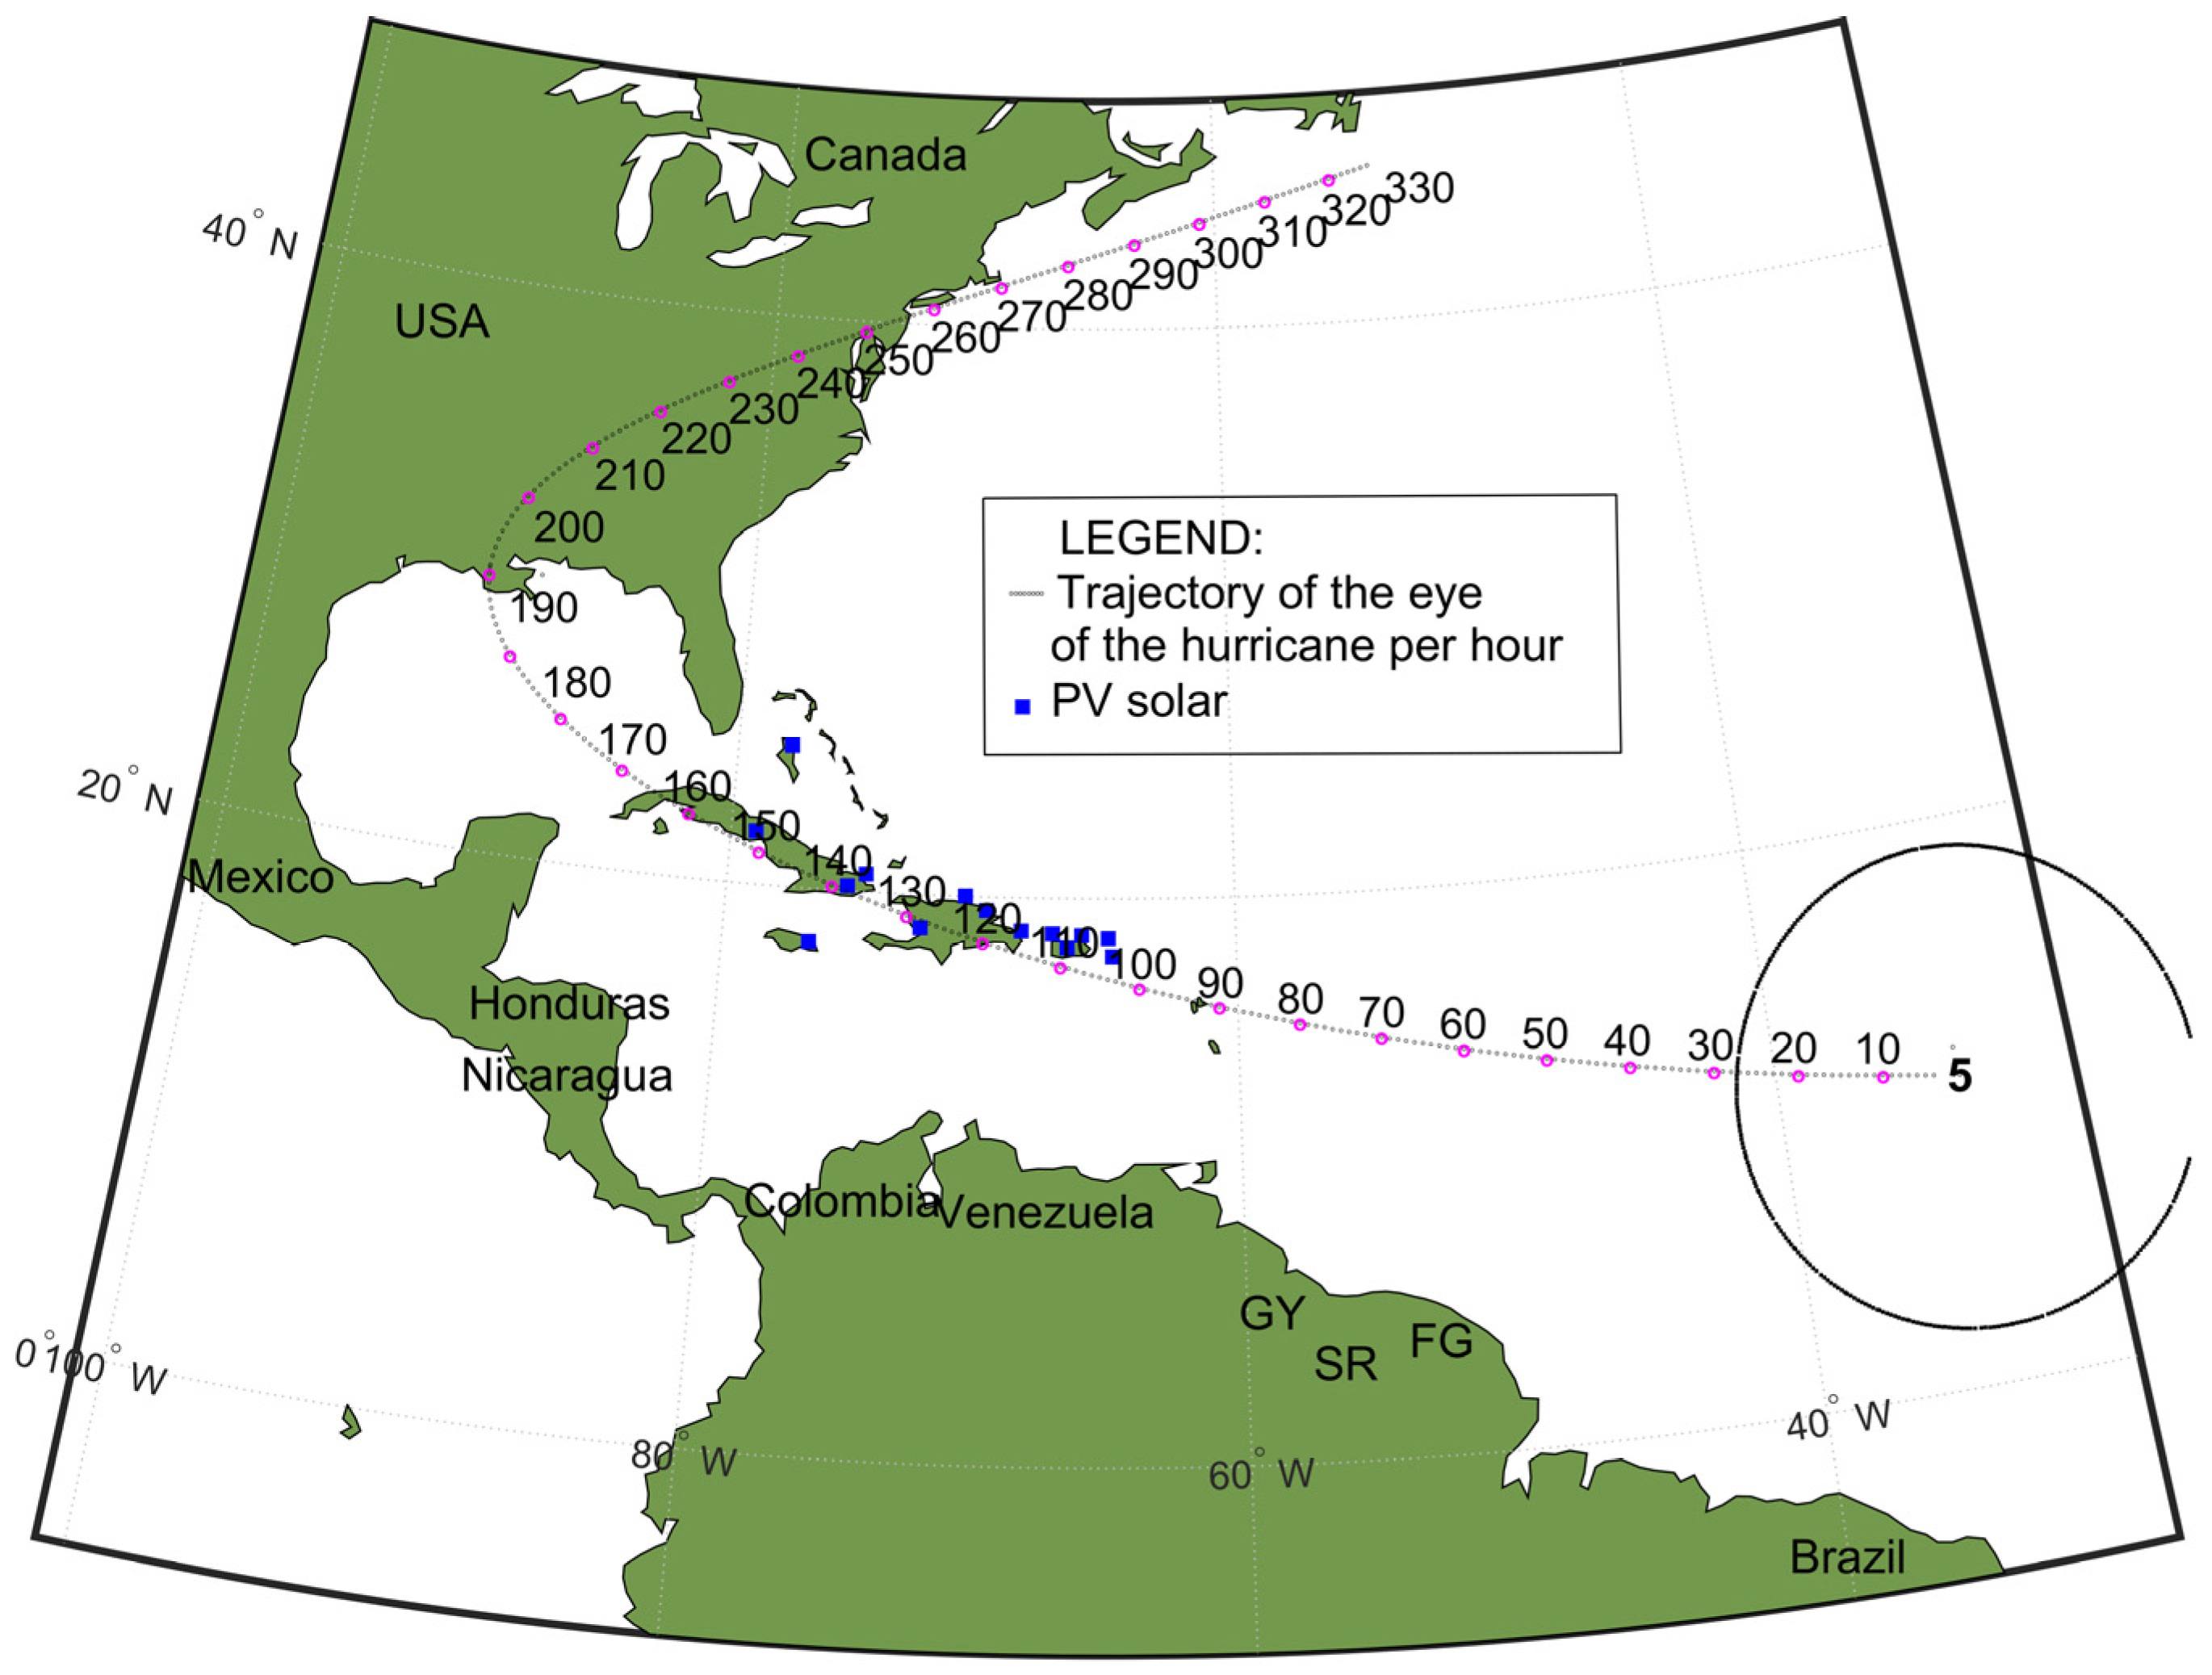
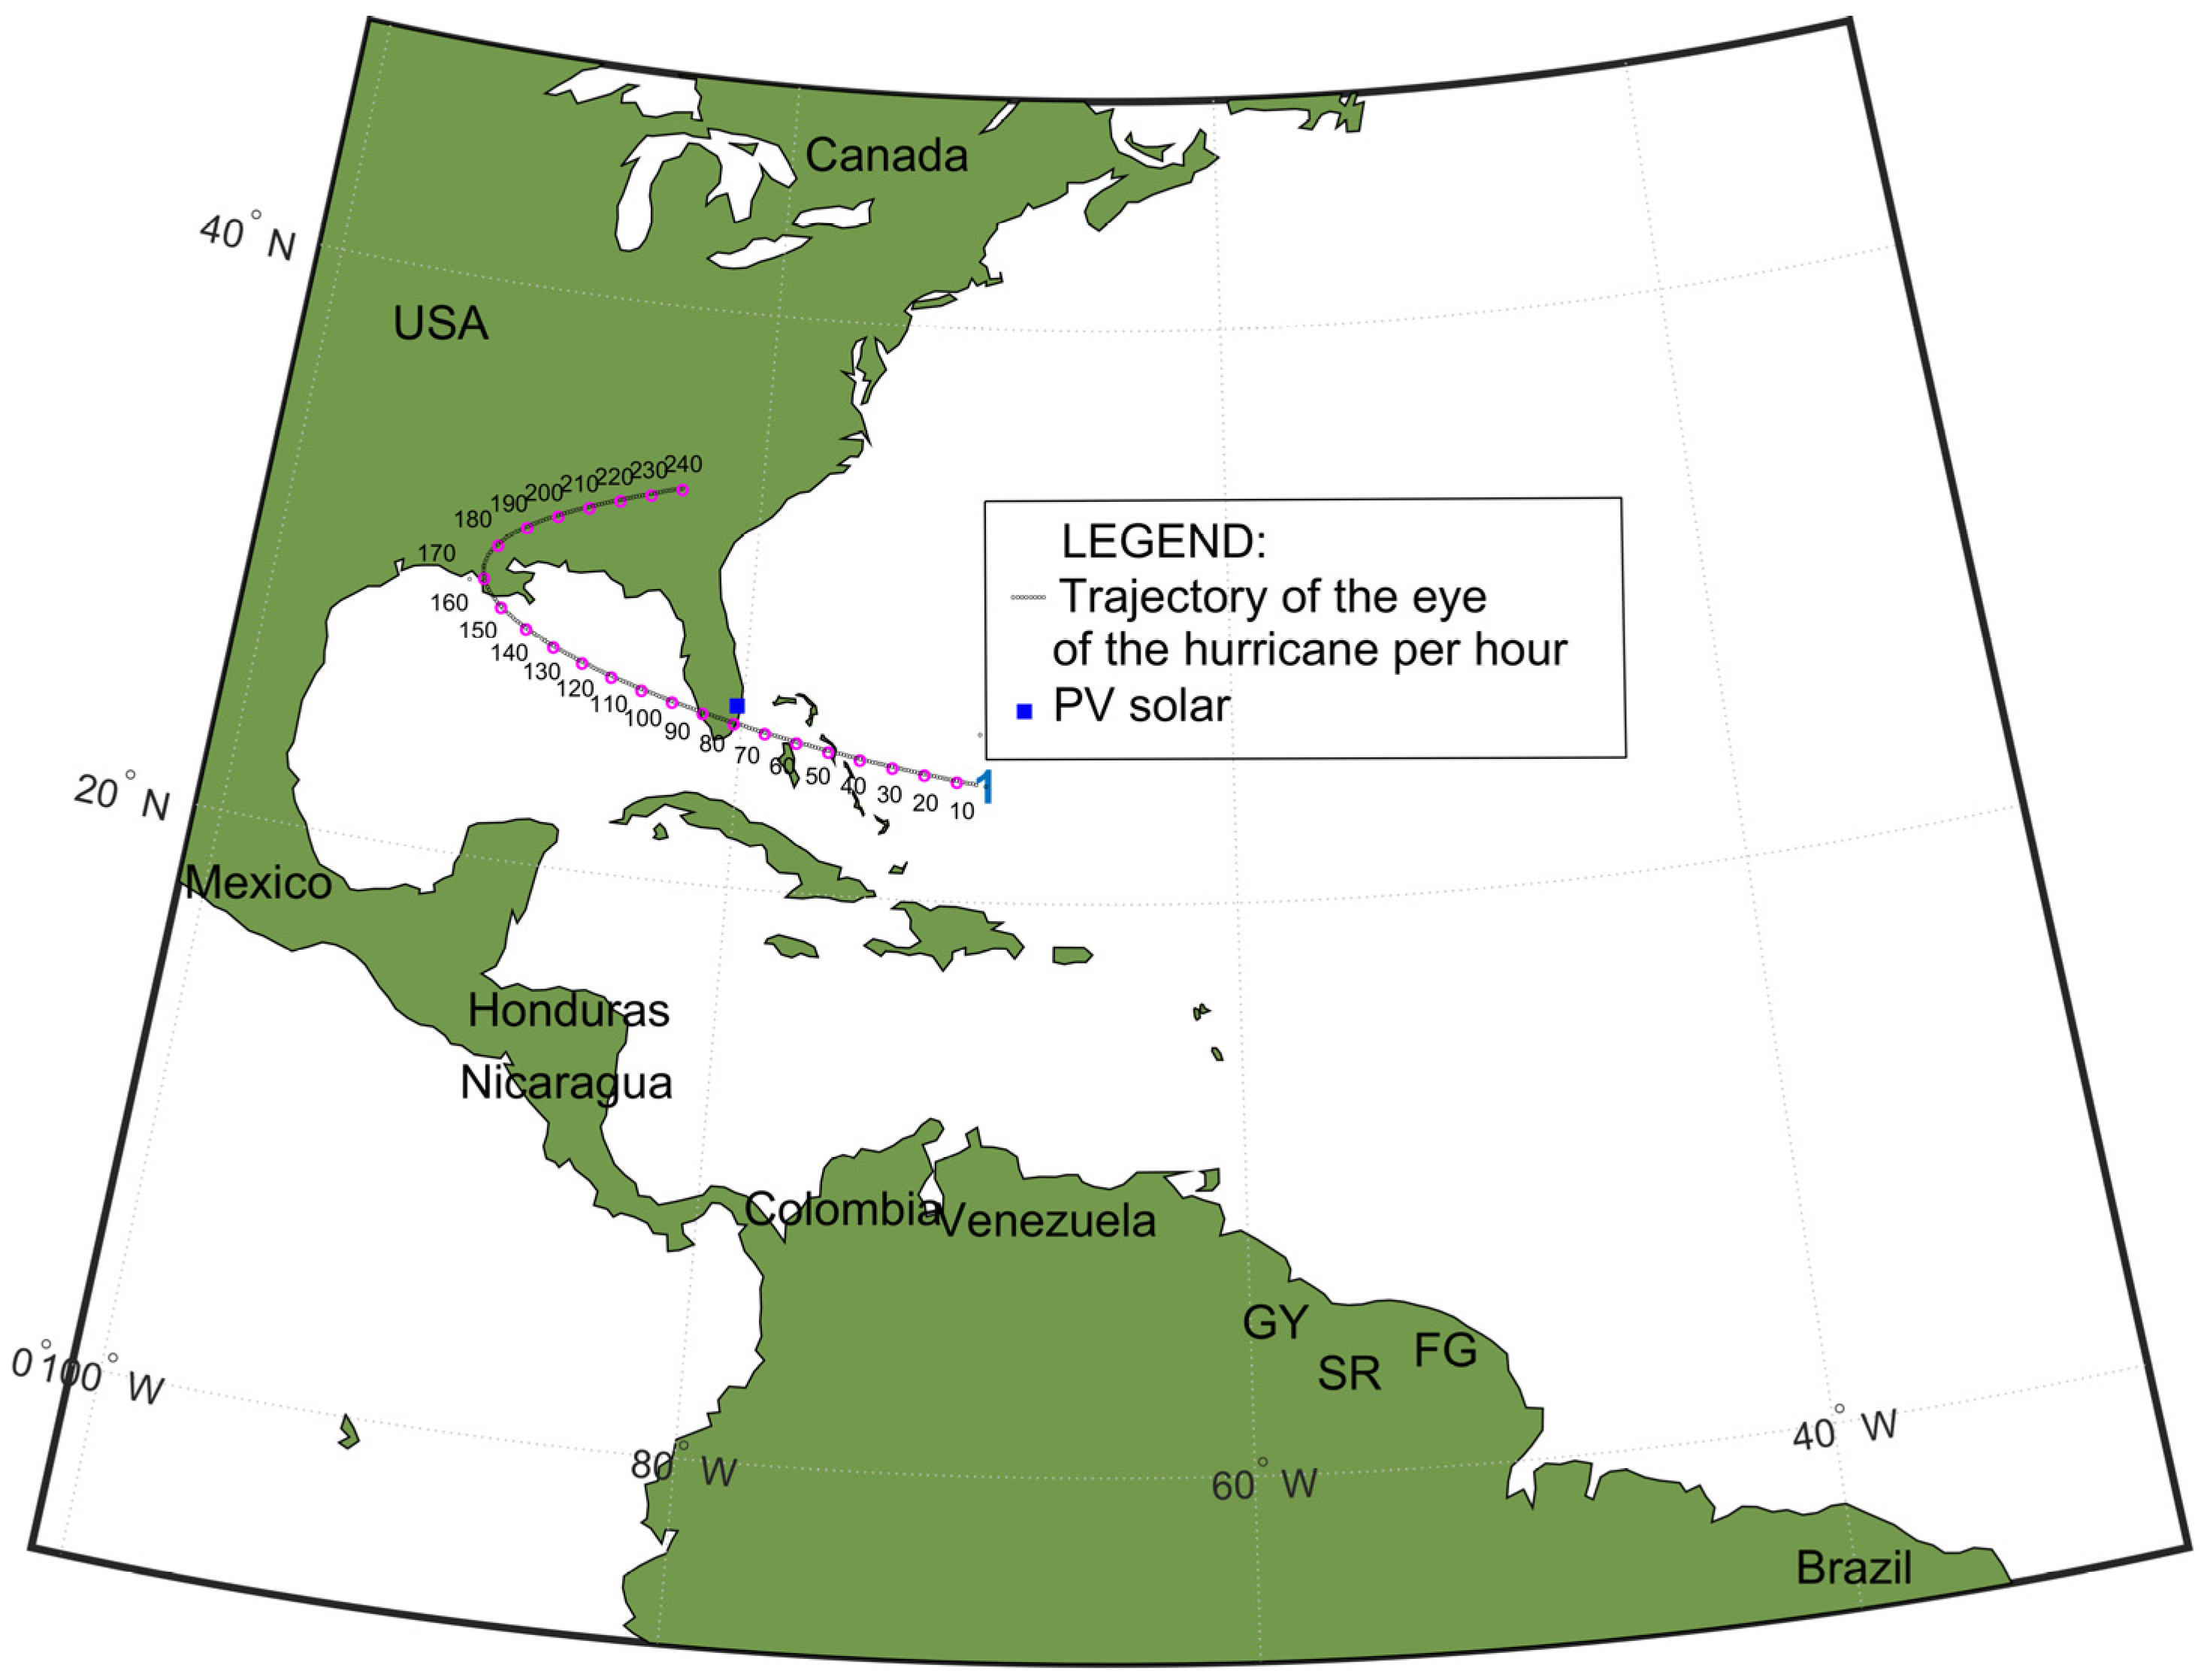
2.4. Model of the Hurricane Movement over a Synthetic Parabolic Trajectory

This subsection describes the first major contribution of this research: a synthesis of hurricane trajectories.
Historical hurricanes tracked by NOAA [25,26,27] leave a trail of likely trajectories, forming a corridor of hurricanes. This corridor covers vast portions of the Caribbean Sea, the Gulf of Mexico, and contiguous U.S. territory. Aiming at being comprehensive enough to obtain the worst-case scenario of a PV power drop on a PV solar plant from hurricanes in all positions inside the corridor, this research modeled the hurricane movement over a band of 10 parabola-shaped trajectories covering the entire observed corridor. The reasoning for pursuing the worst-case scenario is that a power grid status should be maintained at high levels of operational continuity and resilience even in extreme weather conditions. This research does not simulate a hurricane over a specific historical trajectory because there is no guarantee that it is the worst-case scenario and that a future hurricane would exactly pass over a same specific historical trajectory. Also, the approximation of hurricane trajectories by parabolas has been traditionally proposed in the existing literature [16,20].
The equations for parabola-shaped trajectories for hurricanes representation are [20]:
y = a 3 x 2 + b 3 x + c 3
where y   is longitude, x is latitude of the eye of the hurricane, and a 3 , b 3 , and c 3 are the parabola’s coefficients.
The North Atlantic hurricane corridor changes the direction with the vertex at latitude x of 30° degrees and longitude y from Texas to offshore Florida, as observed on the NOAA’s hurricane tracking system [NOAA et al.]. Assuming 10 equidistant parabola vertex points ( x v e r t e x ,   y v e r t e x )   in such a segment, coefficients b 3 , a 3 , and c 3 for each parabola trajectory can be calculated by [20]:
b 3 = 2 a 3 · x v e r t e x  
a 3 = x x v e r t e x y y v e r t e x
c 3 = y a 3 x 2 b 3 x
where y   is longitude, x is latitude of the eye of the hurricane, x v e r t e x is the latitude vertex of the parabola, and y v e r t e x is the longitude vertex of the parabola.
From 10 equidistant parabola origin points ( x o r i g i n ,   y o r i g i n )   covering the hurricane corridor on the NOAA hurricane tracking map [28], the latitude and longitude of the synthetic parabolic trajectory ( x k + 1 , y k + 1 ) is calculated by [20]:
x k + 1 = x k + Δ S t e p ·   s i n θ
y k + 1 = a 3 x k + 1 2 + b 3 x k + 1 + c 3
where Δ S t e p is the angle step of 1 h hurricane movement over the surface of the Earth, and angle θ is [20]:
θ = π 2 arctan 2 a 3 · x k + b 3
where a 3 and b 3 are parabola coefficients, and x k is the latitude of hurricane eye in each step.
Table 3 shows the input coordinates for the synthetic modeling of the hurricane trajectory as a parabola, taking into consideration the hurricane’s corridor formed by historical trajectories tracked by NOAA [28].
Figure 2 shows the synthetic parabolic trajectories of hurricanes. This multicolor band of 10 parabolic trajectories covers most of the historical hurricanes’ trajectories tracked by the National Hurricane Center [28]. This band of trajectories aims at encompassing the hurricane corridor. Any future hurricane trajectory is expected to be a combination of two or more synthetic trajectories within the hurricane corridor.
The band of parabolic trajectories shown in Figure 2 covers all U.S. southern states between Texas and Florida and all countries, and territories in the Caribbean. Also, hurricanes in latitudes lower than trajectory #1 are very rare, according to the NOAA repository of historical hurricane trajectories [28].

2.5. Model of Future PV Solar Capacity Expansion in the U.S., Caribbean, and South America

This subsection describes the second major piece of contribution of this research: a scenario of future PV solar capacity expansion based on a compilation of demographic data and existing fossil fuel power capacity to be gradually displaced by renewables.
Table 4 shows some of those data supporting a possible scenario of renewable PV solar power capacity. This research assumes a scenario that future PV power capacity ( P P V c a p ) would substitute half ( F e = 50 % ) of the fossil dependence :
P P V c a p = P t o t a l × F d × F e
where P t o t a l is the total power capacity (including fossil) of the country or territory, F d is the fossil dependence, and F e is the PV expansion factor.
This PV sharing factor of 50% is an assumption of this research considering that the other 50% is assumed to be supplied by other renewable energy sources, such as wind power, in the future.
The actual commitment and execution of each country and territory in the Americas and the Caribbean for the expansion of PV solar carries innumerous uncertainties. Some uncertainties are not predictable, e.g., the willingness of government officials to keep supporting strategic plans for renewables. Due to a lack of available data, the PV solar power capacity of Anguilla in 2050 (8 MW), by proportionality of its population, was assumed to be half that of the British Virgin Islands (16 MW). The error associated with this PV capacity estimate of Anguilla is not representative in the face of the total PV power capacity encompassed by this simulation (1,072,283 MW).
Despite uncertainties, a cumulative PV sharing factor of 50% of PV solar over total existing power capacity does not lead to an overestimation of results since the total existing power capacity is a realistic reference cap, which is also assumed to be adequately supplying an existing power demand. This work assumes that none of the small countries and territories in Table 4 will become a major exporter of PV solar power, i.e., with renewable capacity far exceeding its previous local total power capacity and demand. The primary function of the U.S.–Caribbean–South America SG is to smooth power variability by the instantaneous spatiotemporal power support of islands experiencing power valleys or peaks caused by extreme weather events. Some previous targets for renewables expansion in these Caribbean countries in general shows modest numbers: Antigua and Barbuda (15% by 2030), Bahamas (30% by 2030), Barbados (29% by 2029), Belize (50% by no specific date), Cuba (24% by 2030), Dominica (100% by no specific date), Dominican Republic (20% by 2016), Grenada (20% by 2020), Guyana (90% by no specific date), Haiti (50% by 2020), Jamaica (30% by 2020), St. Kitts and Nevis (20% by 2015), St. Lucia (35% by 2020), St. Vincent and the Grenadines (60% by 2020), and Trinidad and Tobago (100 MW of wind by no specific date and no specific share for PV solar) [29].
This work simulates the impact of hurricane shading in 2050 on PV solar generation sized to cover 50% of the total existing power capacity (including fossil power) in case of small islands or territories without publicly available official government targets for PV expansion.
Table 4. Demographics and fossil fuel dependence in the U.S., the Caribbean, and South America.
Countries or TerritoriesPopulationTotal Capacity [MW]Fossil Dep.
( F d )
2050 Cumulative PV [MWac]PV Latitude, and Longitude [°]Ref.
USA339,665,1181,143,266
(est. 2020)
59.9%1,000,000Appendix B[30,31]
The Bahamas358,50857899.8%28824.698981, −77.789604[30]
Cuba10,985,974747995.5%357121.598426, −78.974099;
19.907734, −75.218468;
20.358009, −74.504742
[30]
Haiti11,470,261345385.8%148118.576618, −72.296021[30]
Jamaica2,820,982121687.5%53217.876148, −76.582014[30]
Dominican Republic10,790,744567493.4%265019.755237, −70.564617;
19.267622, −69.730425;
18.568692, −68.348547
[30]
Puerto Rico3,057,311618094.8%292918.494859, −67.135248;
18.010464, −66.563032;
18.436395, −66.002171
[30]
Virgin Islands (U.S.)104,91732198.9%15917.699028, −64.797495[30]
British Virgin Islands39,3693398.8%1618.339107, −64.966938[30]
Anguilla19,0791698.8%818.043635, −63.113343[30]
Guadeloupe390,70455168.9%19016.269481, −61.526794[32,33]
Dominica74,6564274.8%1615.545482, −61.300085[30]
Martinique371,24643885.1%18614.595778, −61.000148[32,33]
St Lucia167,5919299.1%4613.736792, −60.949993[30]
St Vincent and Grenadines100,8044973.5%1813.163664, −61.151563[30]
Grenada114,2995598.3%2712.007409, −61.785788[30]
Barbados303,43131195.9%14913.080299, −59.488530[30]
Trinidad & Tobago 1,407,460212399.9%106010.601978, −61.339610;
11.152808, −60.839655
[30]
Guyana791,73938097.4%1856.504099, −58.252893[30]
Suriname639,75954240.5%2205.456538, −55.199946[30]
French Guiana301,09928137%524.822596, −52.364161[34]
Brazil 218,689,757195,03711.8%58,500Appendix B[30,35]
Total602,392,3001,368,117-1,072,283--
The basis for estimation of the projected utility-scale PV solar power capacity of the U.S. and Brazil in 2050, being 98.7% of the PV capacity interconnected by the U.S.–Caribbean–South America SG, was obtained from studies and plans elaborated on by the U.S. National Laboratories for the DOE and the Brazilian Energy Research Company [31,35]. The projected 2050 PV capacity of the U.S. and Brazil is detailed separately in Appendix B.
Figure 3 shows the U.S.–Caribbean–South America super grid originally proposed by Itiki et al. in 2023 to support the expansion of wind power [16]. Over the same super grid topology, this research also proposes a physical distribution of PV power capacity in the U.S., the Caribbean, and South America.
The purpose of the original proposal of the U.S.–Caribbean–South America super grid is to provide a comprehensive power grid infrastructure for a massive expansion of wind power capacity in the region [16]. This super grid infrastructure can smooth the percentual power variability caused by intermittent renewable energy sources, particularly during hurricanes [16]. In contrast, the focus of this research is exclusively on PV power variability generated by hurricanes in the super grid.
For the purpose of simulations, this research assumes that this proposed U.S.–Caribbean–South America super grid would be operationally ready in 2050. The projection of 2050 PV capacity expansion in the U.S. and Brazil is consolidated based on existing plans and studies [31,35].
In the United States, a comprehensive plan for expansion of solar power capacity was elaborated on by the National Renewable Energy Laboratory (NREL) in 2021 [31]. Three scenarios of solar power capacity were projected for the U.S. in 2050: (a) the Decarb+E scenario with 1600 GW, (b) the Decarb scenario with 1000 GW, and (c) a reference scenario with 600 GW. In 2022, the PV capacity in the U.S. was around 109 GW, according to Appendix A. For simulation purposes, this work adopts the Decarb scenario with 1000 GW in 2050, which is the mean-average scenario. The U.S. PV capacity values shown on Appendix B are multiplied by 9.17 times for the simulations of the future 2050 scenario of 1000 GW in the U.S.
In Brazil, the Brazilian Energy Research Company, a Brazilian federal-owned organization, issued the National Energy Plan 2050 (PNE). The centralized PV generation capacity (excluding residential or commercial PV) is estimated to reach between 27 and 90 GW in 2050 [35]. In 2022, the centralized PV generation capacity in Brazil was around 18.13 GW, according to Appendix A. For simulation purposes, this work adopts the mean-average scenario of 58.5 GW in 2050. The Brazilian PV capacity values shown in Appendix B are multiplied by 3.23 times for the simulations of the future 2050 scenario of 58.5 GW in Brazil.
This research assumes, as a simulation scenario, that a proposed U.S.–Caribbean–South America super grid does not restrain in 2050 the cross-country high-voltage power trading and operations in the U.S., Caribbean, and South American region.

2.6. Proposed Spatiotemporal Algorithm for Estimation of PV Solar Power under Hurricane Shading

The proposed algorithm processes all modeling described in previous subsections and generates an estimated aggregated power profile from all PV solar plants. Figure 4 shows such a proposed algorithm for the estimation of PV power under hurricane shading.
The algorithm was initially developed to estimate the PV power profile under a hurricane in a single parabolic trajectory as shown in Figure 4a. The purpose was to analyze the evolution of a PV power profile while a hurricane crosses the Caribbean islands and makes landfall in the contiguous U.S.. This algorithm is used to investigate trajectory #7, shown in Figure 2, because of the proximity to large density of PV solar plants in the Caribbean and in the U.S. and the combination of four simulation scenarios of super grid connectivity. Figure 4a has seven blocks: block 1 receives the input parameters of the selected hurricane (e.g., radius) and the PV solar plants’ characterizations (e.g., location and power capacity). In block 2, the user selects the interconnectivity scheme. Block 3 plots the input data on a map to visually characterize the simulation scenario, the PV plants’ locations, and the selected hurricane trajectory. Block 4 implements the modeling of the hurricane shading in the function of the distance according to Equations (1)–(3). Block 5 integrates several steps: the modeling of the clear sky irradiance over each PV plant in pre-hurricane conditions for 14 days, the modeling of the translational movement of the hurricane over a parabola trajectory for 14 days period, the calculation of the distance between each PV plant to the hurricane eye, the application of the hurricane shading effect based on the distance of the plant to the eye, and the conversion of shaded irradiance into a PV power profile in each plant based on its rated capacity. Block 6 delivers the plotting of four curves, leading to the final estimations of PV power profiles under hurricanes. Block 7 exports the simulation curves “Total PV solar power profile”, ”Shaded PV power capacity”, and “Average distance of all plants to the eye” in text format.
With the necessity of empowering the method with generic capability and coverage of the entire hurricane corridor, not just an individual and specific trajectory #7, the algorithm was complemented with another set of blocks shown in Figure 4b. The comparative analysis of the PV power profiles in 10 trajectories allows visual identification of the trajectory causing the deepest power valley in each connectivity scheme. Since the hurricane trajectory cannot be diverted by humans, the power grid resilience must be designed, in principle, to withstand the worst-case trajectory and to mitigate the deepest power valley. One of the possible solutions to smooth power valleys is proposed in this research with large-scale interconnectivity schemes by super grids. Even disregarding super grids as a solution to reduce power variability for whatever reason, the proposed method to estimate the profile depth of a power valley is still an important parameter for the sizing of the capacity of the energy storage systems (batteries, or even pumped hydro) to fill the valley. The extended blocks shown in Figure 4b aim to support such an assessment and future design.

2.7. Assumptions

This research assumes that the PV solar power plant integrity would not be damaged by the high winds of hurricanes by the time this proposed U.S.–Caribbean–South America super grid becomes a physically constructed reality in the next few decades ahead. This assumption is reasonable because a PV power plant damaged by recurrent impacts of hurricanes would be upgraded with hurricane-proof PV modules or an equivalent protection device to keep economic feasibility.
This research also assumes that batteries are not affordable in the short term and in mass scale for most of the impoverished islands of the Caribbean. This research disregards large-scale power retrieval from batteries.
The simulation scenarios are projected for the year 2050, assuming a massive deployment of PV solar capacity in the U.S., the Caribbean, and South America. Also, it is assumed that the proposed Caribbean super grid, with its variants of interconnectivity schemes, would be ready for operation in 2050, overcoming the phases of regulatory approval, international agreements with involved countries, engineering, procurement, construction, commissioning, and final approval for operation.
Since the focus of this research is the exclusive impact of hurricanes on PV shading and power valleys, the pre-hurricane conditions are assumed to be clear-sky conditions. This assumption aims at eliminating uncertainties about weather conditions in pre-hurricane conditions. This method is not focused on reproducing historical hurricanes or estimating weather systems in 2050 based on probabilistic average clearness conditions in 2023. In other words, this work does not propose to incorporate projections about climate change, weather, and ambient variables in 2050.
The daily solar irradiance profile over the PV plant is assumed to be the same in the first and last days of the 10-day hurricane simulation. Ten consecutive days is not considered long enough to cause seasonal irradiance variability. Instead, the 14-day hurricane shading dynamics is assumed to carry more significant impact on the PV power generation. This research disregards shading due to topography (mountains) or other obstructions (trees and tall buildings). Future studies may also address this topic.

3. Results

The simulations were carried out in four scenarios of power grid topology impacted by a hurricane over trajectory #7:
  • Standalone contiguous U.S. power grid;
  • Standalone Caribbean super grid;
  • U.S.–Caribbean super grid;
  • U.S.–Caribbean–South America super grid.
Also, two scenarios were simulated with hurricanes in all 10 synthetic trajectories over the U.S.–Caribbean–South America super grid and over the standalone Caribbean super grid.
Figure 5 shows the geospatial scenario with a category-3 hurricane over synthetic parabolic trajectory # 7 impacting the PV solar plants in the U.S.–Caribbean–South America super grid. The trajectory of the hurricane eye is marked every 10 h until 330 h (approximately 14 days). The PV plants under consideration are those indicated in Table 4 and Appendix B.
In the scenario of the standalone contiguous U.S. power grid, the hurricane impacts only 36 PV solar plants. The PV plants in the Caribbean and South America are not interconnected and aggregated in this scenario.
In the scenario of the standalone Caribbean super grid, the hurricane impacts 14 turbines in the northern part of the Caribbean islands. The PV plants in the contiguous U.S. grid and southern Caribbean and South America are not interconnected and aggregated in this scenario.
In the scenario of the U.S.–Caribbean super grid, 50 PV solar plants are interconnected and aggregated in the super grid.
In the scenario of the U.S.–Caribbean–South America super grid, the simulations cover all 90 PV plants, most of them shown on Figure 5, and some others in the U.S. West Coast states and Brazil’s southern states, as indicated in Appendix B.

3.1. Standalone Contiguous U.S. Power Grid

In this scenario, the simulation covers the impact of a hurricane on PV solar power plants in the contiguous U.S. power grid. It excludes Hawaii, Alaska, and the U.S. Caribbean territories of Puerto Rico and U.S. Virgin Islands. It is assumed that in 2050, the Texas power grid will be operating interconnected with the contiguous U.S. power grid. In this scenario, there is no Caribbean super grid or any interconnection of it with the U.S. and South America.
Figure 6a shows the total PV power profile generated by the PV power plants in the contiguous U.S. power grid under the spatiotemporal impact of hurricane shading. The impact of the hurricane depends on the time in which it approaches the PV solar power plant. The impact of hurricane shading on the PV solar power profile is higher during the day period. There is no power-dropping impact from hurricane shading on PV solar during the night period.
Figure 6b shows the shading effect during the passage of the hurricane in Florida and the U.S. East Coast. The power valley represents the local shading on the PV solar plants due to the proximity of hurricane clouds. This profile is decoupled from the variable radiance of the sun to show the exclusive impact of hurricane shading on the aggregate PV plant capacity.
Figure 6c shows the mean geometric distance of all PV solar plants to the hurricane eye. This curve indicates how close the PV solar plants are on average to the hurricane. The less the distance, the greater the magnitude of the power valleys in Figure 6b and the more modest the total PV solar power profile in Figure 6a.
Figure 6d shows one of the PV solar plants with the closest distance from the hurricane eye. The continuous tracking of each hurricane is necessary because the shading effect depends on the distance between the hurricane eye and each PV solar plant. In this case, the hurricane almost touches the PV power plant in west Florida at time 185 h as observed in Figure 5, corroborating the observation of the minimum distance in Figure 6d at the same time.
Figure 7 shows the individual power profiles of PV solar plants in the contiguous U.S. Figure 7 also shows in black color the aggregated power profile of all PV solar plants connected to the U.S. contiguous power grid.
Figure 8 shows the per-unit normalized power in each PV solar plant. Shading of the hurricane causes a spatiotemporal capacity reduction in each PV solar plant. The values are normalized to the unit reference to show the relative impact of the hurricane shading on each PV solar power plant. The shading effect on the clearness index intensifies while the hurricane is moving between time 150 and 265 h over Florida and the U.S. East Coast. This temporal effect matches the translational movement of the hurricane eye shown in Figure 5.
Notably, in Figure 8, four PV plants experience an equivalent capacity reduction up to 88% of their rated values during two days of hurricane shading. For the purposes of this research, it is assumed that these PV plants are all grid-connected. However, setting aside the consideration of grid connectivity and assuming each PV plant functions as a microgrid without an external grid connection, a hurricane-induced power valley of up to 88% for two days holds significant implications for the design of the energy storage system backing up the power shortage. Super grids, on the other hand, effectively mitigate such percentual power variability, and the assessment of this reduction is investigated in the simulations.

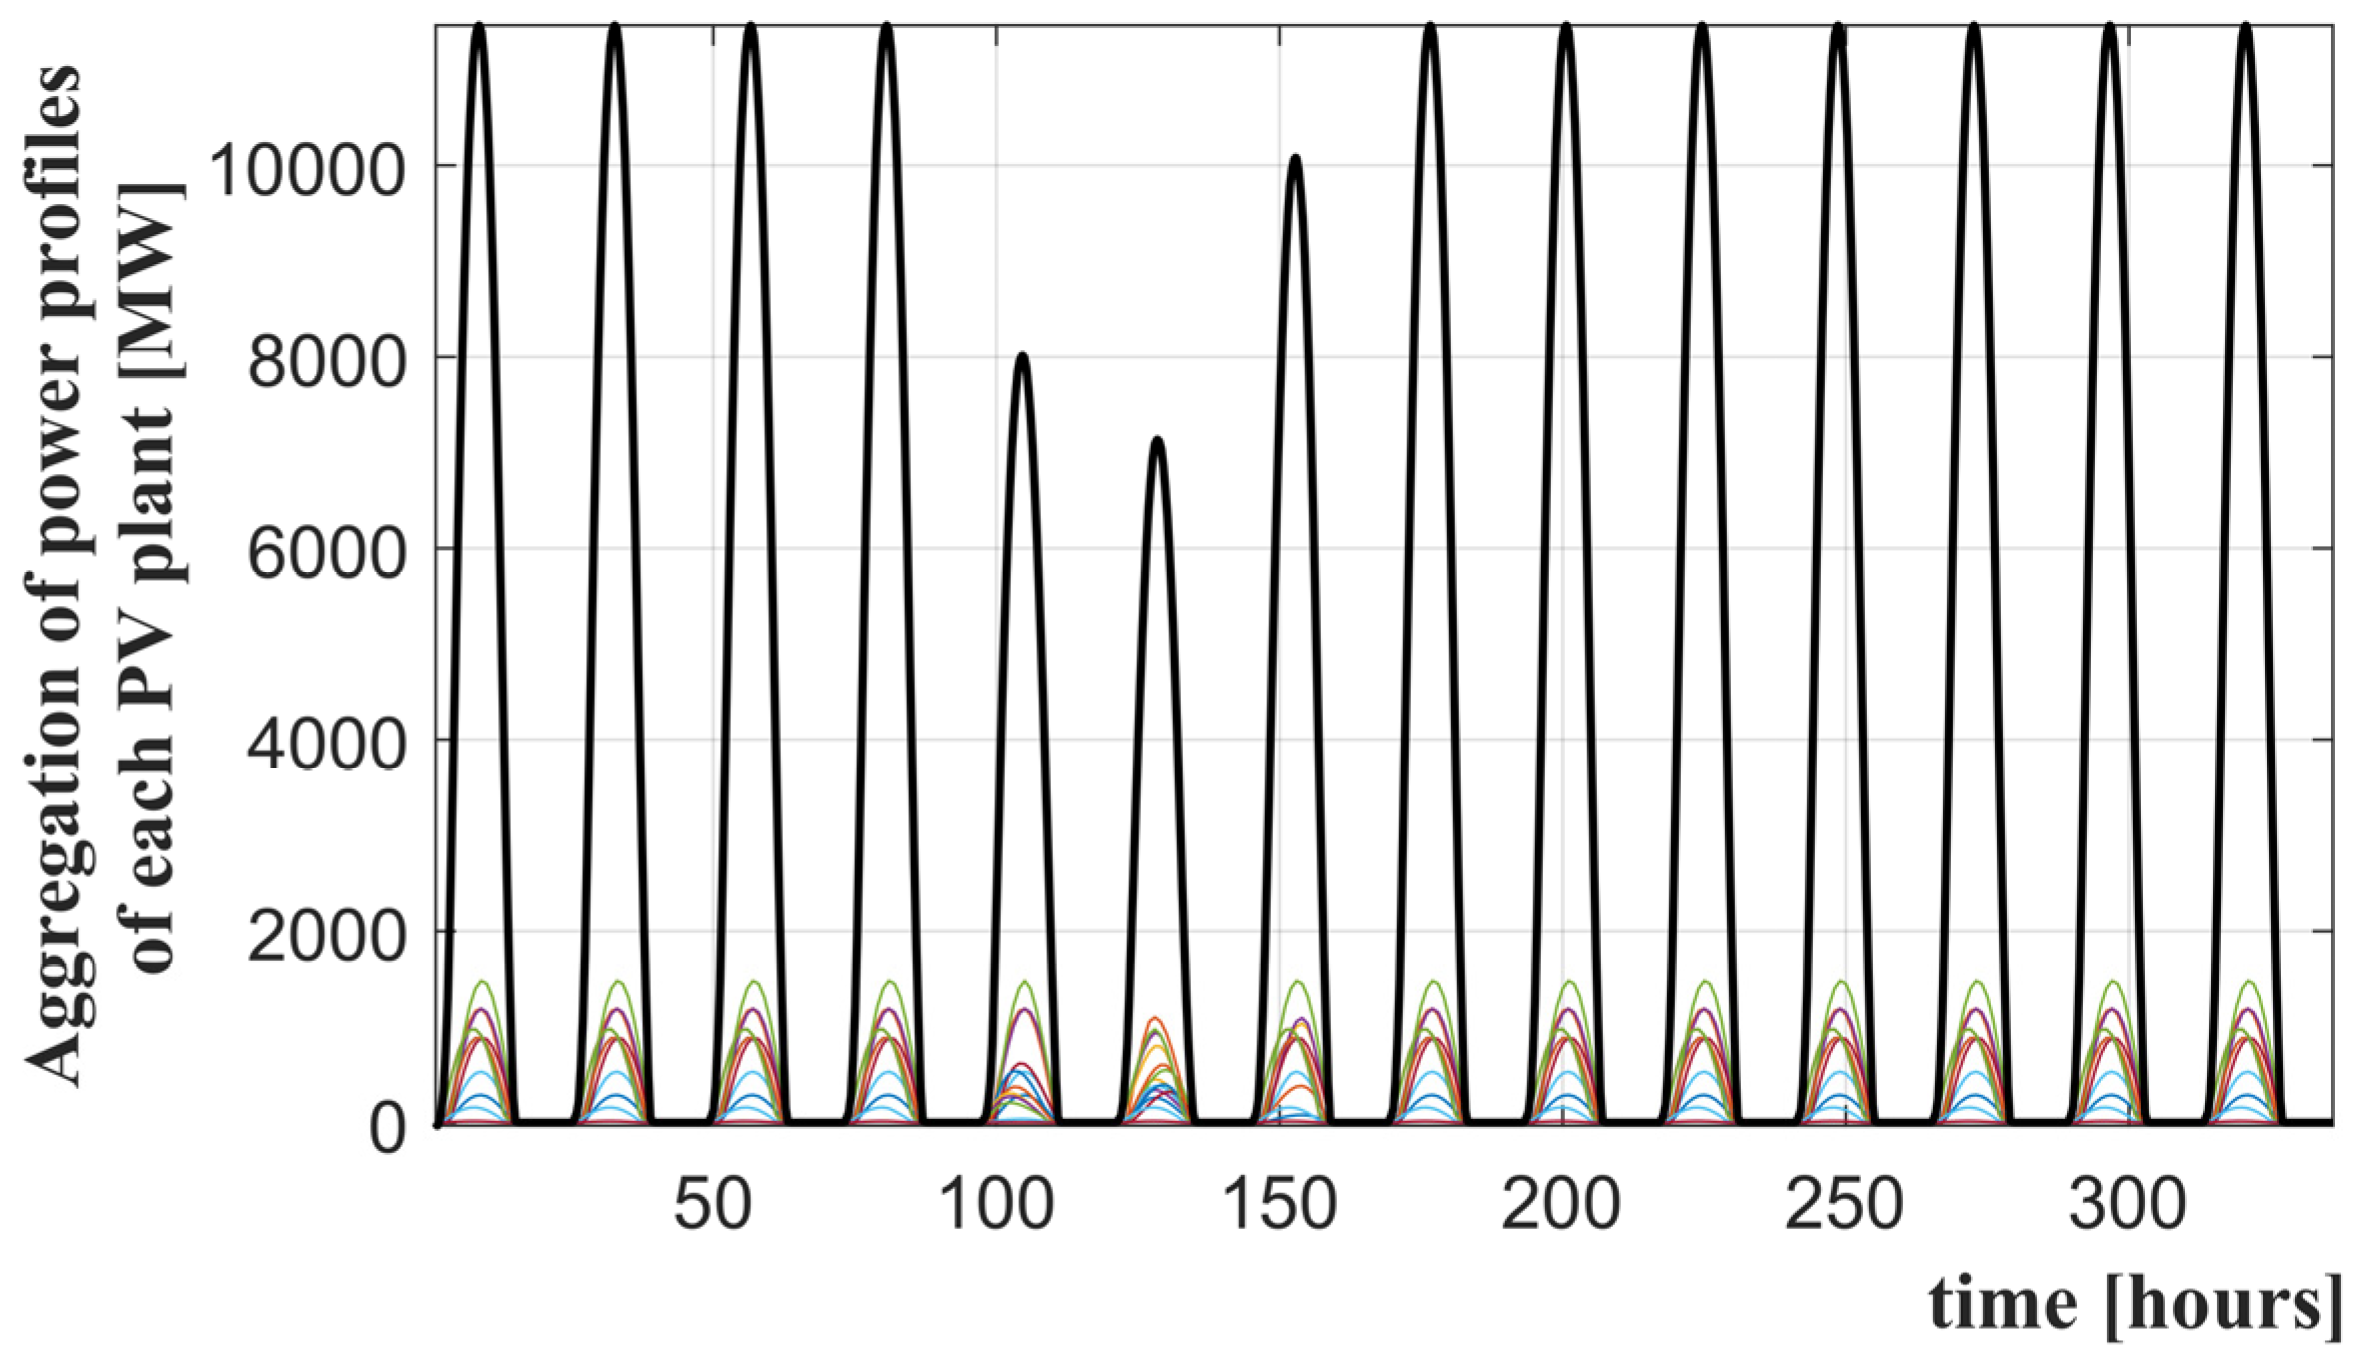
3.2. Standalone Caribbean Super Grid

In this scenario, the simulation covers the impact of hurricanes on PV solar power plants on the standalone Caribbean super grid, including the U.S. territories of Puerto Rico and U.S. Virgin Islands. It excludes the contiguous U.S. and the southern islands of the Caribbean. It is assumed that, in 2050, the Caribbean super grid will be operationally ready but without any interconnection with the U.S., the southern Caribbean, and South America.
Figure 9a shows the total PV power profile generated by the PV power plants in the standalone Caribbean super grid under the spatiotemporal impact of hurricane shading.
Figure 9b shows the shading effect during the passage of a hurricane over the U.S. Virgin Islands, Puerto Rico, the Dominican Republic, Haiti, Cuba, and The Bahamas, i.e., the northern and central Caribbean. The local shading on the PV solar plants occurs between times 85 h and 170 h while the hurricane is passing over such islands.
Figure 9c shows the mean geometric distance of all PV solar plants to the hurricane eye. This curve indicates how close the PV solar plants are on average to the hurricane. The less the distance, the greater the magnitude of the power valleys in Figure 9b. After time 180 h, the hurricane parabolic trajectory reaches its negative longitudinal apex. After the hurricane turns eastward, its mean average distance to the PV plants sustains a 2000 km distance. However, this distance is outside the hurricane shading and does not produce a power valley after time 170 h.
Figure 9d shows the PV power plant in the British Virgin Islands with the closest distance from the hurricane eye at time 105 h.
Figure 10 shows the individual power profiles of the PV solar plants in the standalone Caribbean super grid. The black color curve is the aggregated power profile of all PV solar plants, i.e., the same profile shown in Figure 9a.

3.3. U.S.–Caribbean Super Grid

In this scenario, the simulation covers the impact of hurricanes on PV solar power plants with the contiguous U.S. power grid interconnected to the Caribbean super grid. This scenario is thus called the U.S.–Caribbean super grid and requires a submarine power interconnector between Florida and The Bahamas and the extension of the grid until the U.S. overseas territories of Puerto Rico and the U.S. Virgin Islands. The purpose of this scenario is to assess the potential benefit of large-scale integration of standalone power grids in reducing the overall spatiotemporal power variability.
Figure 11a shows the total power profile generated by the PV power plants of the U.S.–Caribbean–South America super grid under the spatiotemporal impact of hurricane shading. The impact of the hurricane is observed between times 160 h and 260 h.
Figure 11b shows the reduction in PV power capacity due to the hurricane shading effect between times 160 h and 260 h. The power valley from the hurricane over the Caribbean is relatively negligible as compared to over Florida and the U.S. East Coast because the power capacity in the U.S. East Coast is more robust than in the Caribbean.
Figure 11c shows the mean geometric distance of all PV solar plants to the hurricane eye. This curve indicates how close on average the PV solar plants are to the hurricane.
Figure 11d shows the PV solar plant in west Florida with the closest distance from the hurricane eye at time 189 h.
Figure 12 shows the individual power profiles of the PV solar plants in the U.S.–Caribbean super grid. The black color curve is the aggregated power profile of all PV solar plants. This arithmetical aggregation of individual PV power profiles is only possible assuming that all PV plants of the central and northern Caribbean islands and the contiguous U.S. territory are injecting power into the same interconnected U.S.–Caribbean super grid.

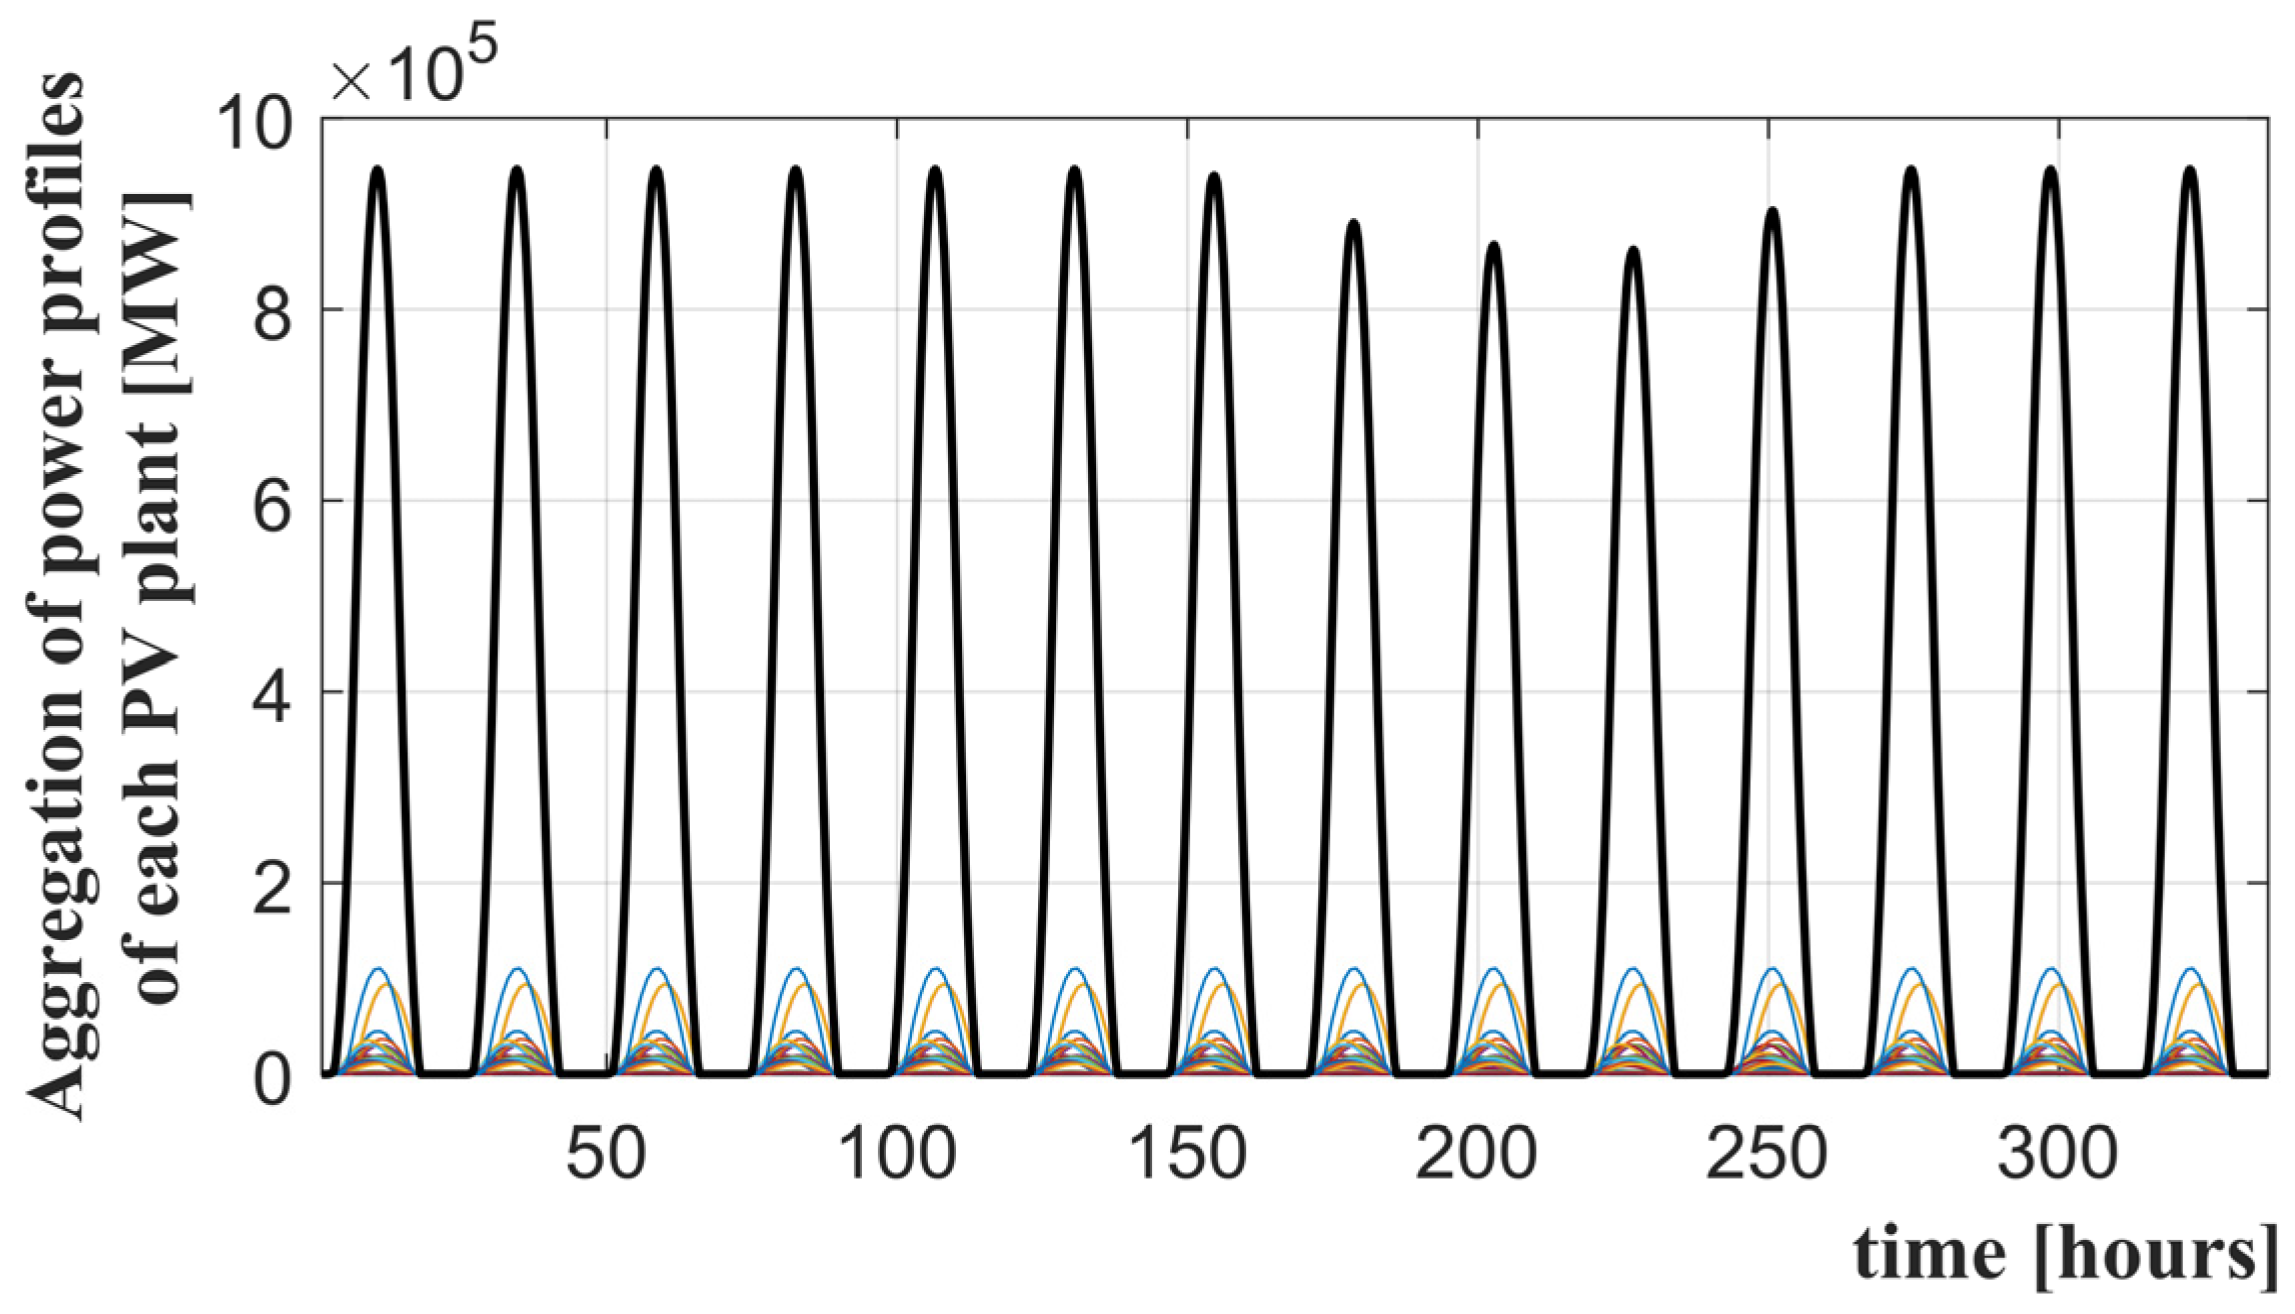
3.4. U.S.–Caribbean–South America Super Grid

In this scenario, the simulation covers the impact of hurricanes on PV solar power plants with the U.S.–Caribbean super grid extended to South America. This scenario is thus called the U.S.–Caribbean–South America super grid and requires a submarine power interconnector between Florida and The Bahamas and the extension of the U.S.–Caribbean super grid from Puerto Rico to the islands of the southern Caribbean and reaching to South America. Trinidad and Tobago are connected to Guyana by a high-voltage power interconnector. The purpose of this scenario is to assess the potential extra benefits of large-scale integration of the Caribbean super grid with both the U.S. and South America. This work aims at assessing the overall reduction in spatiotemporal power variability and ultimately comparing the power-smoothing performance.
Figure 13a shows the total power profile generated by the PV power plants of the U.S.–Caribbean–South America super grid under the spatiotemporal impact of hurricane shading. The impact of the hurricane is observed mostly between times 160 h and 260 h in the PV plants located in the contiguous U.S. However, a very small power variability is also observed between times 75 h and 140 h.
Figure 13b shows the reduction in PV power capacity due to the hurricane shading effect, mostly between times 160 h and 260 h. The power valley from the hurricane over the Caribbean remains relatively negligible as compared to over Florida and the U.S. East Coast because the power capacity in the U.S. East Coast is more robust than in the Caribbean.
Figure 13c shows the mean geometric distance of all PV solar plants to the hurricane eye. This curve indicates how close on average the PV solar plants are to the hurricane.
Figure 13d shows the PV solar plant in west Florida with the closest distance from the hurricane eye at time 189 h.
Figure 14 shows the individual power profiles of the PV solar plants in the U.S.–Caribbean–South America super grid. The black color curve is the aggregated power profile of all PV solar plants. This arithmetical aggregation of individual PV power profiles is only possible assuming that all PV plants are injecting power into the same interconnected U.S.–Caribbean–South America super grid.

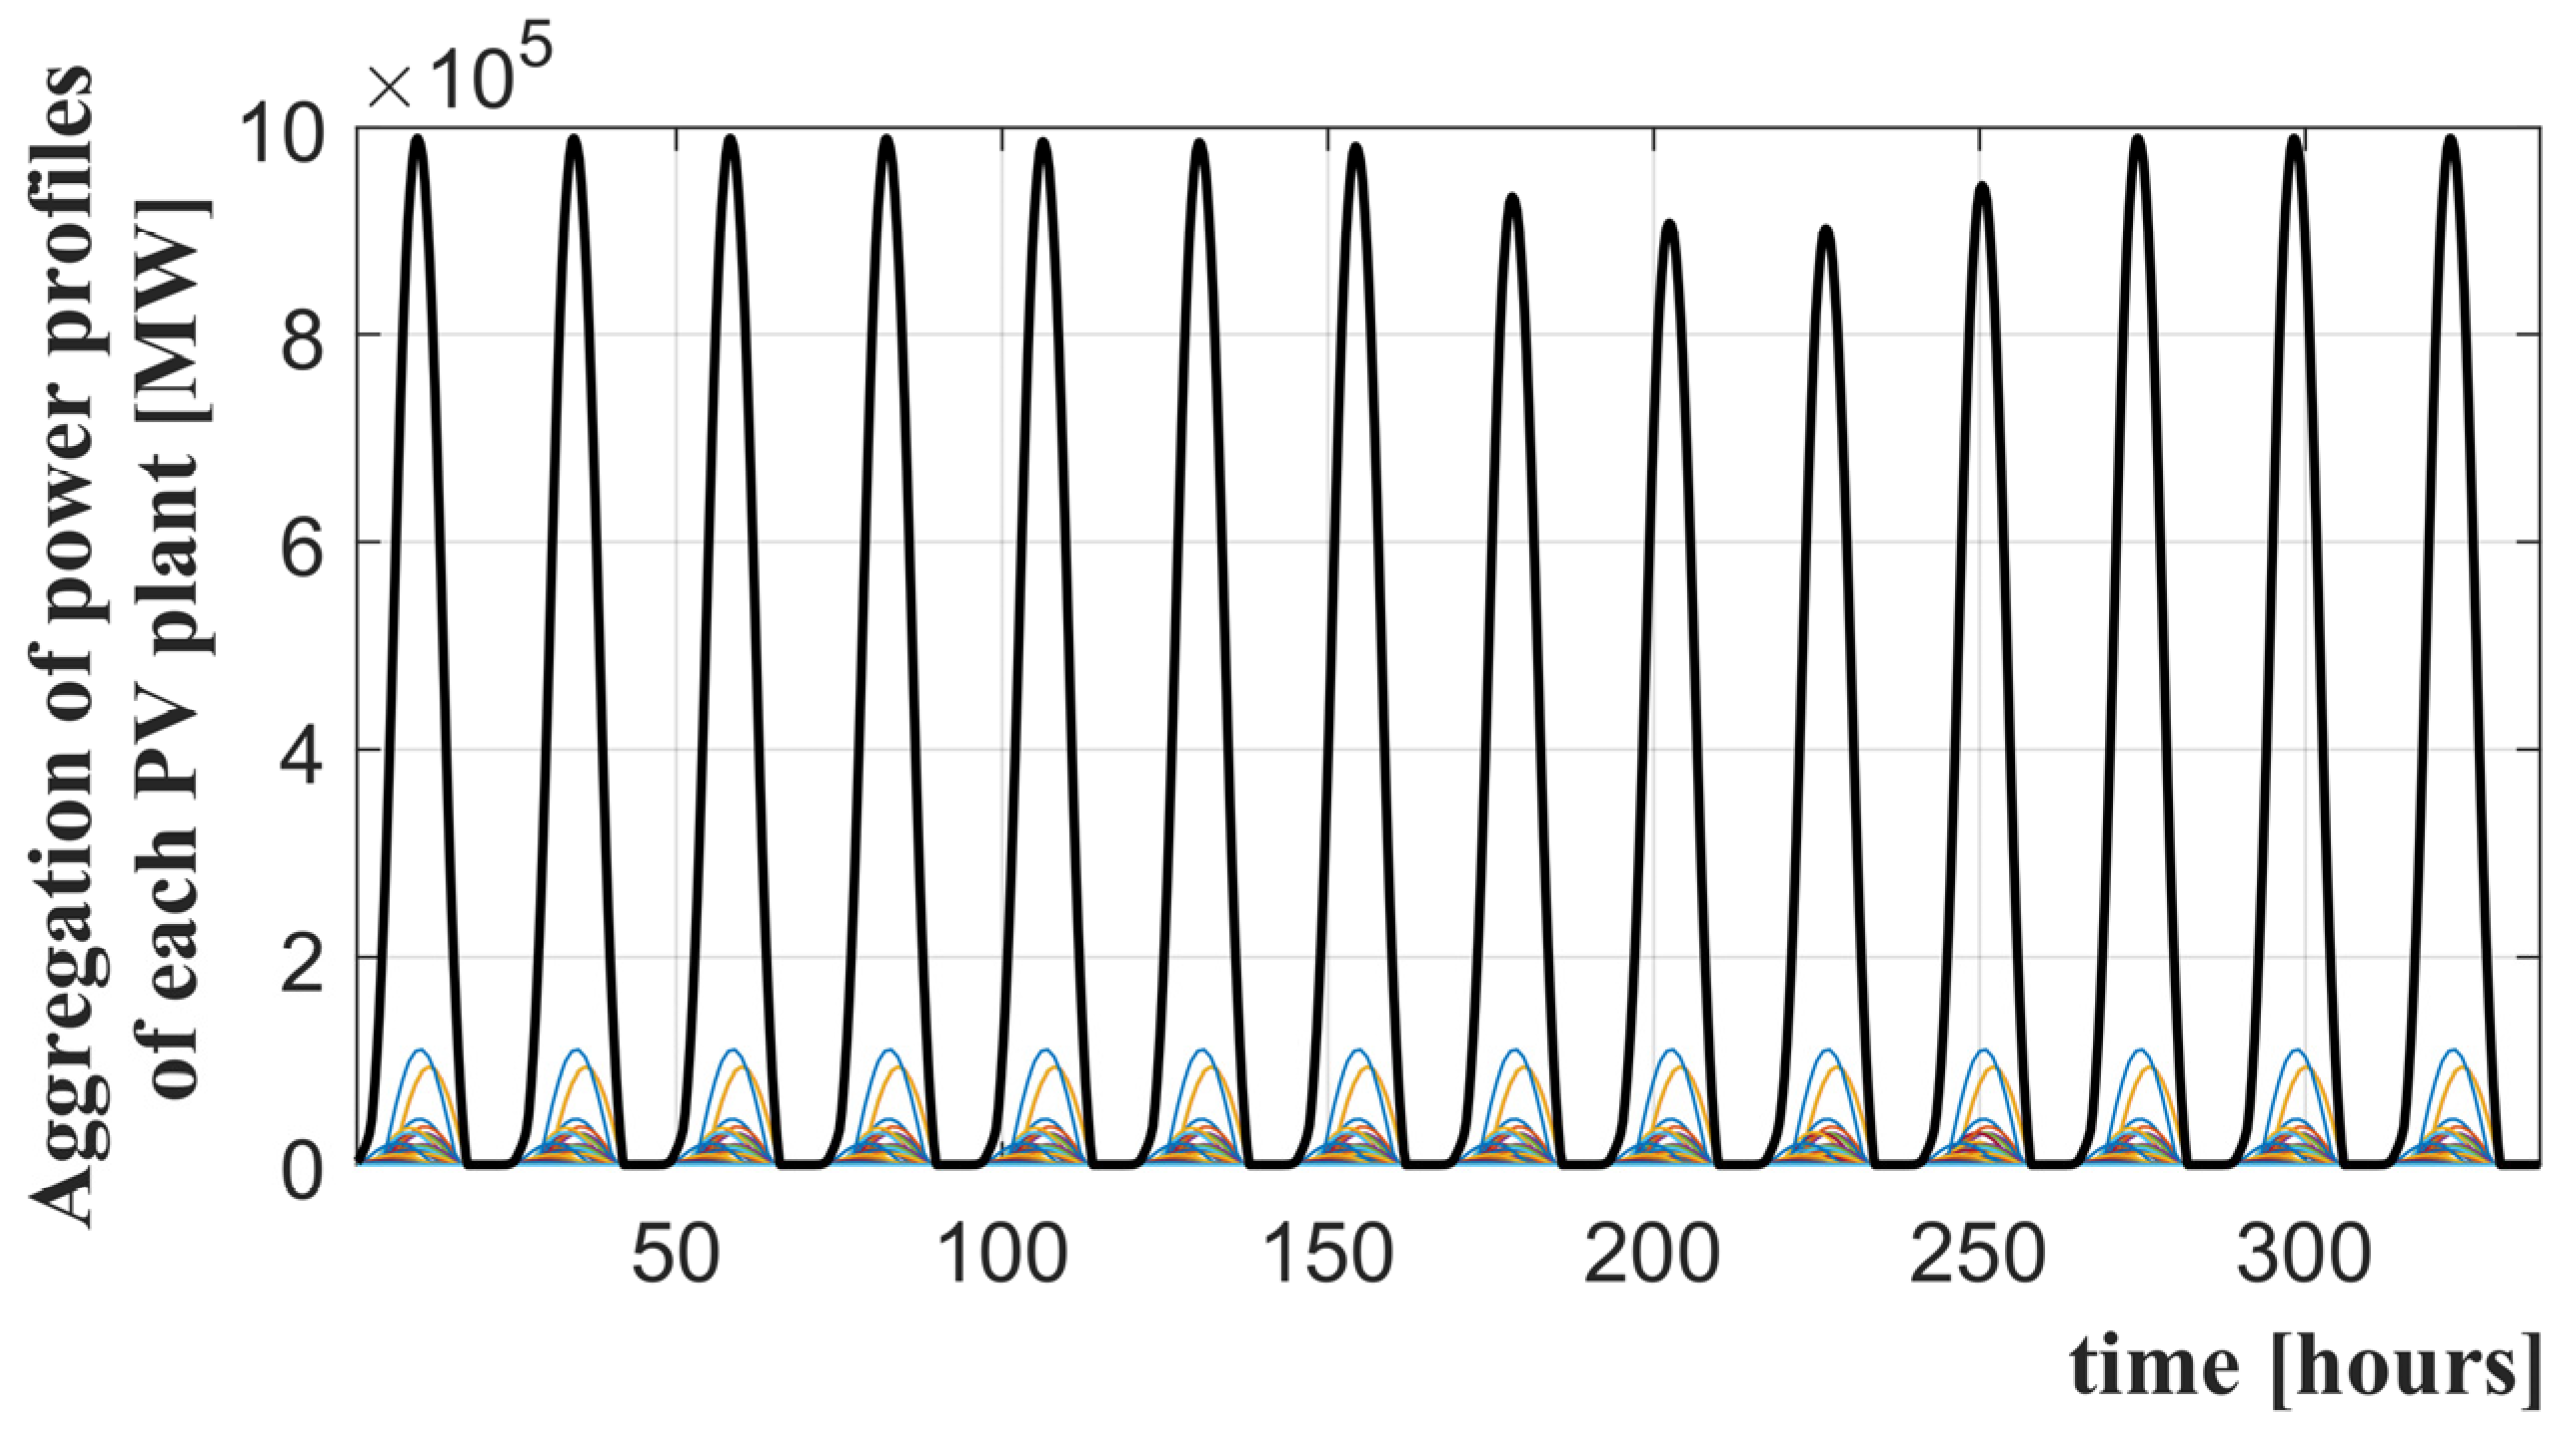
3.5. All Trajectories into the U.S.–Caribbean–South America Super Grid

In this scenario, the PV power plants in the U.S.–Caribbean–South America super grid are impacted by all 10 parabolic synthetic hurricane trajectories, as shown in Figure 2. The purpose of this scenario is to identify the trajectory with the higher peak power variability. To plot the PV solar power, shading, and power valley profile curves of all 10 trajectories, an algorithm was implemented in MATLAB to open the data files of the simulation results and plot them all together in a single figure. The algorithm was detailed in Figure 4b, and the all-trajectories curves are shown in Figure 15 and Figure 16.
Figure 15a shows the power profiles of all PV power plants in the U.S., the Caribbean, and the southern countries of South America in 10 different synthetic hurricane trajectories. Figure 15b shows the hurricane shading effect on the total PV power capacity. Figure 15c shows the magnitude of the power valley for each hurricane trajectory. A power valley occurs when the hurricane is spatially close to a high density of PV power capacity, maximizing the shading as shown in Figure 15b, and the irradiance is instantaneously in its maximum at noon, as shown in Figure 15a. For example, a hurricane passing over PV plants at midnight will not produce a power valley, since at midnight, there is no expected PV solar power. The power valley in Figure 15c was obtained by searching the local minimum of the overall power profile presented in Figure 15a.
The power profiles and shaded capacities of PV plants located in the Caribbean and South America are negligible because the total PV capacity in the Caribbean is very small as compared to in the contiguous U.S. power grid and because South America is outside the hurricane corridor.
This work is restricted by a set of assumptions and scope limitations to make feasible a study of a large-scale grid under a multitude of intermittent and unpredictable variables. The simulation results in this subsection, associated to a specific scenario, are comparatively discussed in Section 3.7 together with other scenarios.

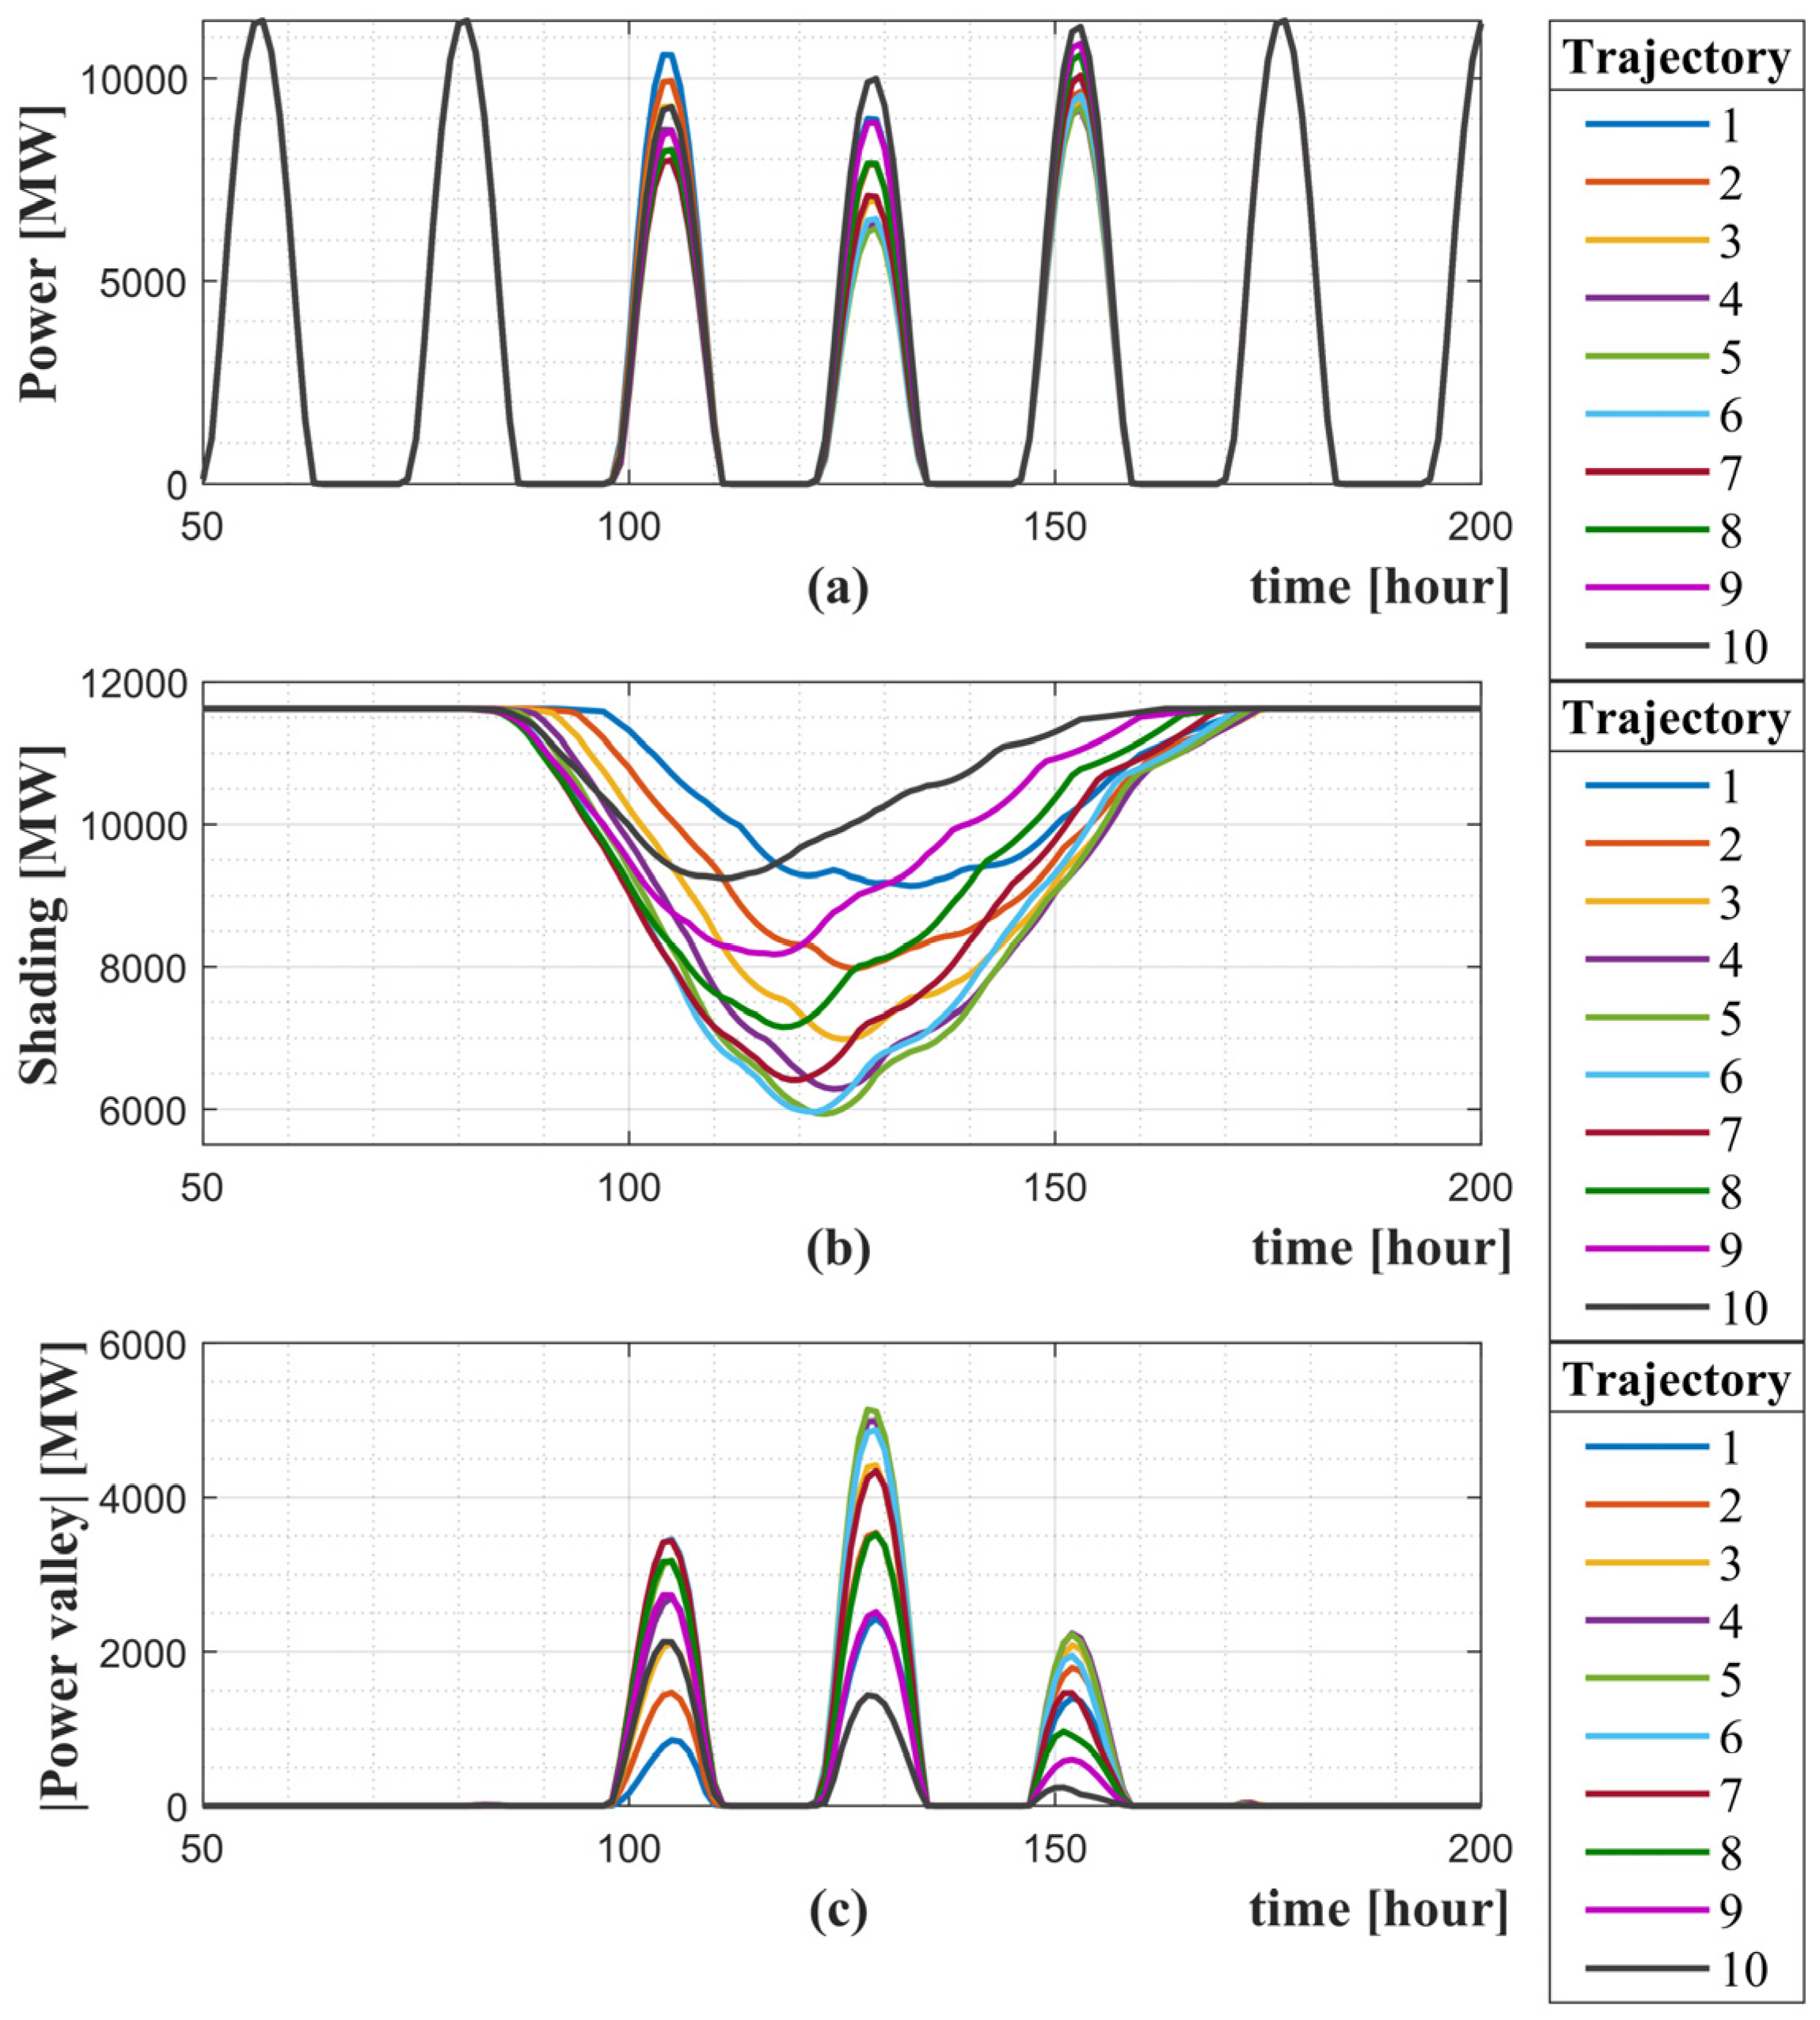
3.6. All Trajectories into Standalone Caribbean Super Grid

In this scenario, the PV power plants in the Caribbean super grid are impacted by all 10 parabolic synthetic hurricane trajectories, as shown in Figure 2. This scenario includes neither the PV plants in the contiguous U.S. power grid nor the extension to the southern Caribbean islands and South America. The simulation results were obtained using the algorithm shown in Figure 4b. The purpose of this scenario is to assess the magnitude of power variability exclusively on the standalone Caribbean super grid to allow later comparison of the smoothing performance with the U.S.–Caribbean–South America super grid investigated in the previous scenario.
Figure 16a shows the power profiles of all PV power plants in the standalone Caribbean super grid in 10 different synthetic hurricane trajectories. Figure 16b shows the hurricane shading effect on the total PV power capacity. Figure 16c shows the magnitude of the power valley for each hurricane trajectory. A power valley occurs when the hurricane is spatially close to a high density of PV power capacity, maximizing the shading as shown in Figure 16b, and the irradiance is instantaneously in its maximum at noon every 24 h, as shown in Figure 16a. The power valley in Figure 16c was obtained by searching the local minimum of the overall power profile presented in Figure 16a.
The shaded capacity in PV plants located in the Caribbean reduces more significantly from 11,600 MW (100%) to 6000 MW (52%) over trajectory #5 than the 9250 MW (80%) power capacity valley in trajectory #10. The reason for this strong power decay can be explained by Figure 17, which shows trajectory #5 in proximity to most of the PV plants in the Caribbean between times 90 h and 170 h.
The simulations presented the practical capabilities of the proposed spatiotemporal method for PV power profile estimation, investigated the impact of hurricanes on PV plants connected in four schemes of super grid interconnectivity, and generated a multitude of PV power profile curves in single or multiple hurricane trajectories. However, a deep understanding of the power variability impact of the hurricane on each super grid scheme demands the consolidation of results for a comparative analysis of scenarios.

3.7. Comparative Analysis of Scenarios

The power variability is defined and estimated by the following indicators [20]:
Δ P m i n = P p r e h u r r i c a n e P m i n P p r e h u r r i c a n e     .
where P p r e h u r r i c a n e is the peak power at the first noon, while the hurricane has not shaded PV power plants, and P m i n is minimum local peak of the power profile under hurricane shading.
Table 5 shows the power variability of PV plants under shading caused by a hurricane over trajectory #7 in four scenarios of super grid interconnectivity. The power values are obtained from Figure 6, Figure 9, Figure 11 and Figure 13. Minimum local peak P m i n occurs on two occasions: (a) over the Caribbean from time 90 h to 160 h and (b) over the contiguous U.S. territory from time 150 h to 330 h. A PV power valley does not occur over South America because this region is far away from the hurricane corridor.
Table 5 consolidates the assessment of power variability Δ P m i n to support the comparison of the scenarios of super grid interconnectivity. In the standalone Caribbean super grid scenario, the power valley Δ P m i n is 37.8%. In the U.S.–Caribbean super grid and the U.S.–Caribbean–South America super grid scenarios, the power valley Δ P m i n significantly reduces to 0.4% and 0.4%, respectively. The reason for the high percentual power valley in the standalone Caribbean super grid as compared to in the U.S.–Caribbean super grid and U.S.–Caribbean–South America super grid can be explained by the large hurricane shading area covering the entire small area of the standalone Caribbean super grid in the same instant. In this scenario, there is no interconnection with the U.S. and South American power grids, which would otherwise collectively absorb part of the impact of hurricane shading in the Caribbean. It can be concluded that the central and northern Caribbean islands (including the U.S. territories of Puerto Rico and the U.S. Virgin Islands) have much to benefit from interconnection with the contiguous U.S. grid or both contiguous U.S. and South America grids. With such interconnections, the northern Caribbean islands can access PV power from areas not within the hurricane corridor. For example, the most western American states (California, Oregon, Nevada, and Utah) and South America are not on the route of the hurricane corridor.
In the scenarios of the standalone U.S. power grid, the U.S.–Caribbean super grid, and the U.S.–Caribbean–South America super grid, the power valley Δ P m i n in the contiguous U.S. is lower than 9%. The power valley in the contiguous U.S. is dominantly determined by the large PV power capacity of the contiguous U.S. projected to 2050, which is approximately 14 times the total PV capacity of the other countries and territories in the Caribbean super grid and the extension to South America.
Table 6 shows the power valley produced by hurricanes in all 10 trajectories. In general, U.S. states with higher geospatial densities of PV capacity have higher power valleys because they have more PV capacity to be shaded by the hurricane. Trajectory #10, for example, has the second lowest power valley because the trajectory passes off the coast of Florida. The western part of Texas is on trajectory #1 and is not much populated with PV power capacity, as shown in Figure 2 and Figure 5. For this reason, a hurricane over trajectory #1 produces moderate power variability. Such an interpretation based on spatial PV density by U.S. states should be used with caution because ROCI onshore is 463 km in the simulations, possibly shading two or more U.S. states. Column 4 in Table 6 shows the minimum instantaneous power valley of Figure 15c of hurricanes in 10 synthetic parabolic trajectories. An instantaneous power valley includes the daily variability of the solar irradiance cycle. The time (night or day) that the hurricane passes over the PV plant plays an important role in the magnitude of the instantaneous power valley. For example, a hurricane over a PV plant at night does not produce a shading impact on a PV plant since the output is zero at night anyway.
The power capacity valley is the equivalent reduction in PV capacity due to hurricane shading, disregarding the effect of the solar cycle. The power capacity variability during hurricanes is shown in Figure 15b.
Table 6 organizes the power valleys in ascending order, placing their ordering values in parentheses in columns 4 and 5. Table 6 shows that a strong decline in capacity power due to hurricane shading does not mean that the instantaneous power valley is also deep. Louisiana State, hit by a hurricane in trajectory #5, experiences a relatively shallow instantaneous power valley despite having the second deepest capacity power valley. The reason for the shallow instantaneous power valley is the hurricane approaching the PV plants at midnight, alleviating the impact of shading during the day before and after, as show in trajectory #5 of Figure 18. At midnight, the instantaneous power valley is zero because the hurricane shading cannot reduce the PV power that is already at zero due to the lack of solar irradiance. The percentual capacity power valley also calculated in reference to the pre-hurricane peak power P p r e h u r r i c a n e is 989,600 MW in Figure 15a.
Counterintuitively, a hurricane hitting Alabama, the state with the lowest spatial density of PV plants, causes a stronger shading impact on PV plant capacity than in other states. A plausible explanation for this is because a hurricane with a shading impact radius of approximately 1.3 times ROCI (1.3 × 463 km) hitting Alabama, in the middle of the U.S. South Coast, can cover large portions of PV plants to the east (Florida and Georgia) and some plants to the west (Louisiana).
An important insight of this analysis is that the spatial planning for PV plant siting regarding hurricane conditions should consider locations with minimum capacity power valleys, not spatial density by U.S. state and not instantaneous power valleys. The time that the hurricane approaches a PV power plant, which defines the shape of the instantaneous power valley, is not a variable under human control. Being conservative in practice, instantaneous power valleys incorporating the solar cycle are not useful for planning or design, which should focus on the worst-case scenario.
The next analysis focuses on the impact of all 10 trajectories of hurricane shading on the standalone Caribbean super grid. The standalone Caribbean super grid takes a much smaller geospatial footprint than the U.S.–Caribbean–South America super grid. The density of PV capacity by each island is not very relevant since they are small as compared to the dimensions of the hurricane and are surrounded by vast portions of the Caribbean Sea. Being a spatially remote island but also electrically interconnected to a super grid are major advantages because the power valley locally generated on the island is punctually well absorbed by the super grid.
Table 7 shows the magnitude of power valleys from the simulation curves of Figure 19. The deepest power valley occurs on trajectory #5. Most western and eastern trajectories, trajectories #1 and #10, respectively, produce less of a power valley due to the long distances to the PV power plants. The percentual capacity power valley also calculated in reference to the pre-hurricane peak power P p r e h u r r i c a n e is 11,463 MW in Figure 16a.
Table 7 shows a capacity power valley up to 48.2% in the standalone Caribbean super grid. Comparing with a non-grid connected PV plant under the hurricane shading analyzed in Figure 18, presenting a power capacity valley of 88%, the interconnection of the islands of the Caribbean in a super grid would produce a significant reduction in power variability.
In general, there are not many options to improve the geospatial distribution of PV plants in the Caribbean islands. PV plants are normally installed onshore and most of the islands are close to each other. However, plenty of geospatial distribution possibilities are available in the vast contiguous U.S. territory.
For PV planning purposes, the capacity power valley is the most appropriate reference for the planning and design of super grids or energy storage capacities since it is not sensitive to the time that a hurricane is expected to pass over the PV power plants, i.e., a stochastic variable modeling the instantaneous power valley profile.
Comparing Table 7 and Table 6, the capacity power variability is 48.2% in the standalone Caribbean super grid as compared to just 10.3% in the U.S.–Caribbean–South America super grid. From an exclusive power variability perspective, the interconnection of the standalone Caribbean super grid to the U.S. and South America is advantageous to the Caribbean.
The comparative analysis confirms that large-scale interconnectivity schemes such as the proposed U.S.–Caribbean–South America super grid sustain lower power variability than local interconnectivity schemes.
A spatiotemporal method dedicated to assessing the impact of hurricanes on PV solar power generation was proposed, and its functionalities were demonstrated in case studies of four possible future scenarios for a large-scale interconnectivity scheme in the Caribbean region.
The four interconnectivity schemes investigated in this research are:
  • Standalone contiguous U.S. power grid: the U.S. is projected to reach 1,000,000 MW in 2050, significantly exceeding the forecasted 72,335 MW for the Caribbean and northern countries and states in South America. In this scenario, the power variability of the standalone contiguous U.S. power grid is not sensitive to hurricanes over the Caribbean.
  • Standalone Caribbean super grid: without interconnection to the U.S. or South America grid for power valley filling, a standalone Caribbean super grid would endure the most significant power valley among all schemes. This is primarily due to the arrangement of PV plants on a chain of closely situated islands nearly entirely covered by the shading caused by hurricanes. Additionally, the trajectories of hurricanes typically align parallel to the axis of the Caribbean island chain, prolonging the duration of their impact. Given the projected Caribbean PV capacity by 2050, which is negligible compared to that of the U.S., the Caribbean region would derive substantial benefits from either a U.S.–Caribbean interconnector or a Caribbean–South America interconnector.
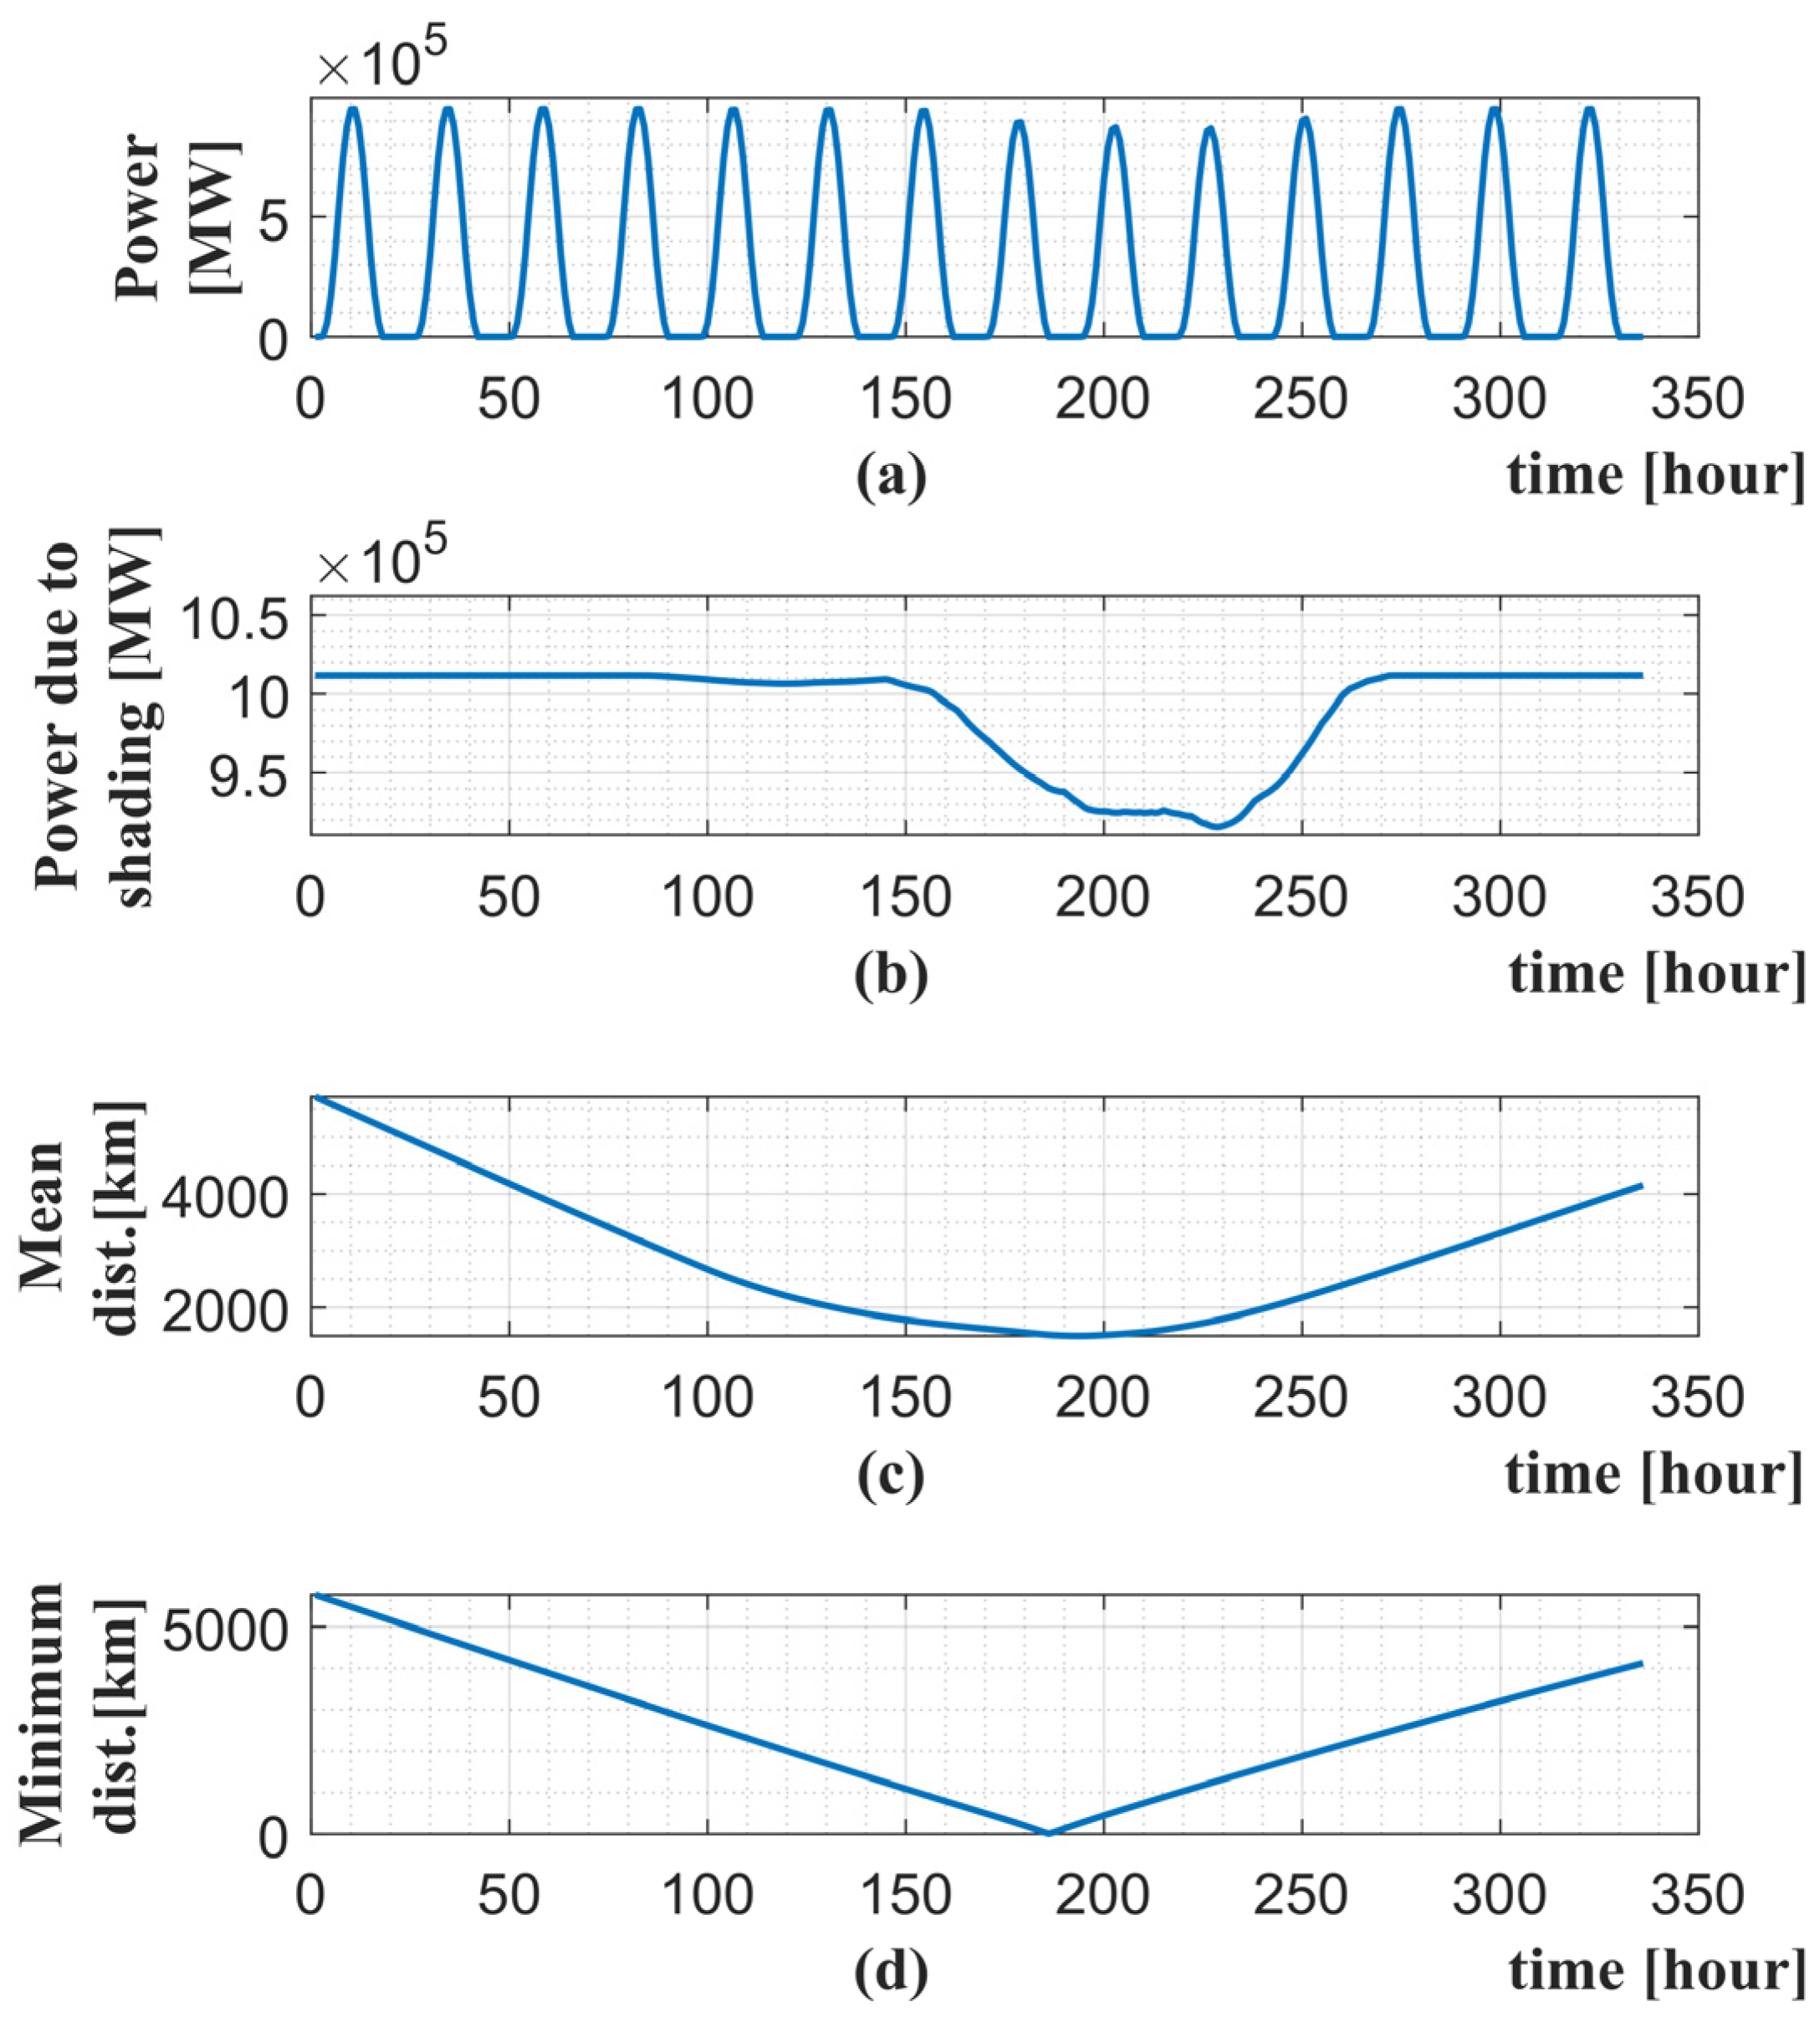
  • U.S.–Caribbean super grid: the U.S.–Caribbean super grid significantly reduces power variability during hurricanes passing over the Caribbean. The integration of the overseas U.S. territories of Puerto Rico and the U.S. Virgin Islands into an integrated U.S.–Caribbean super grid proves beneficial in mitigating local power valleys.
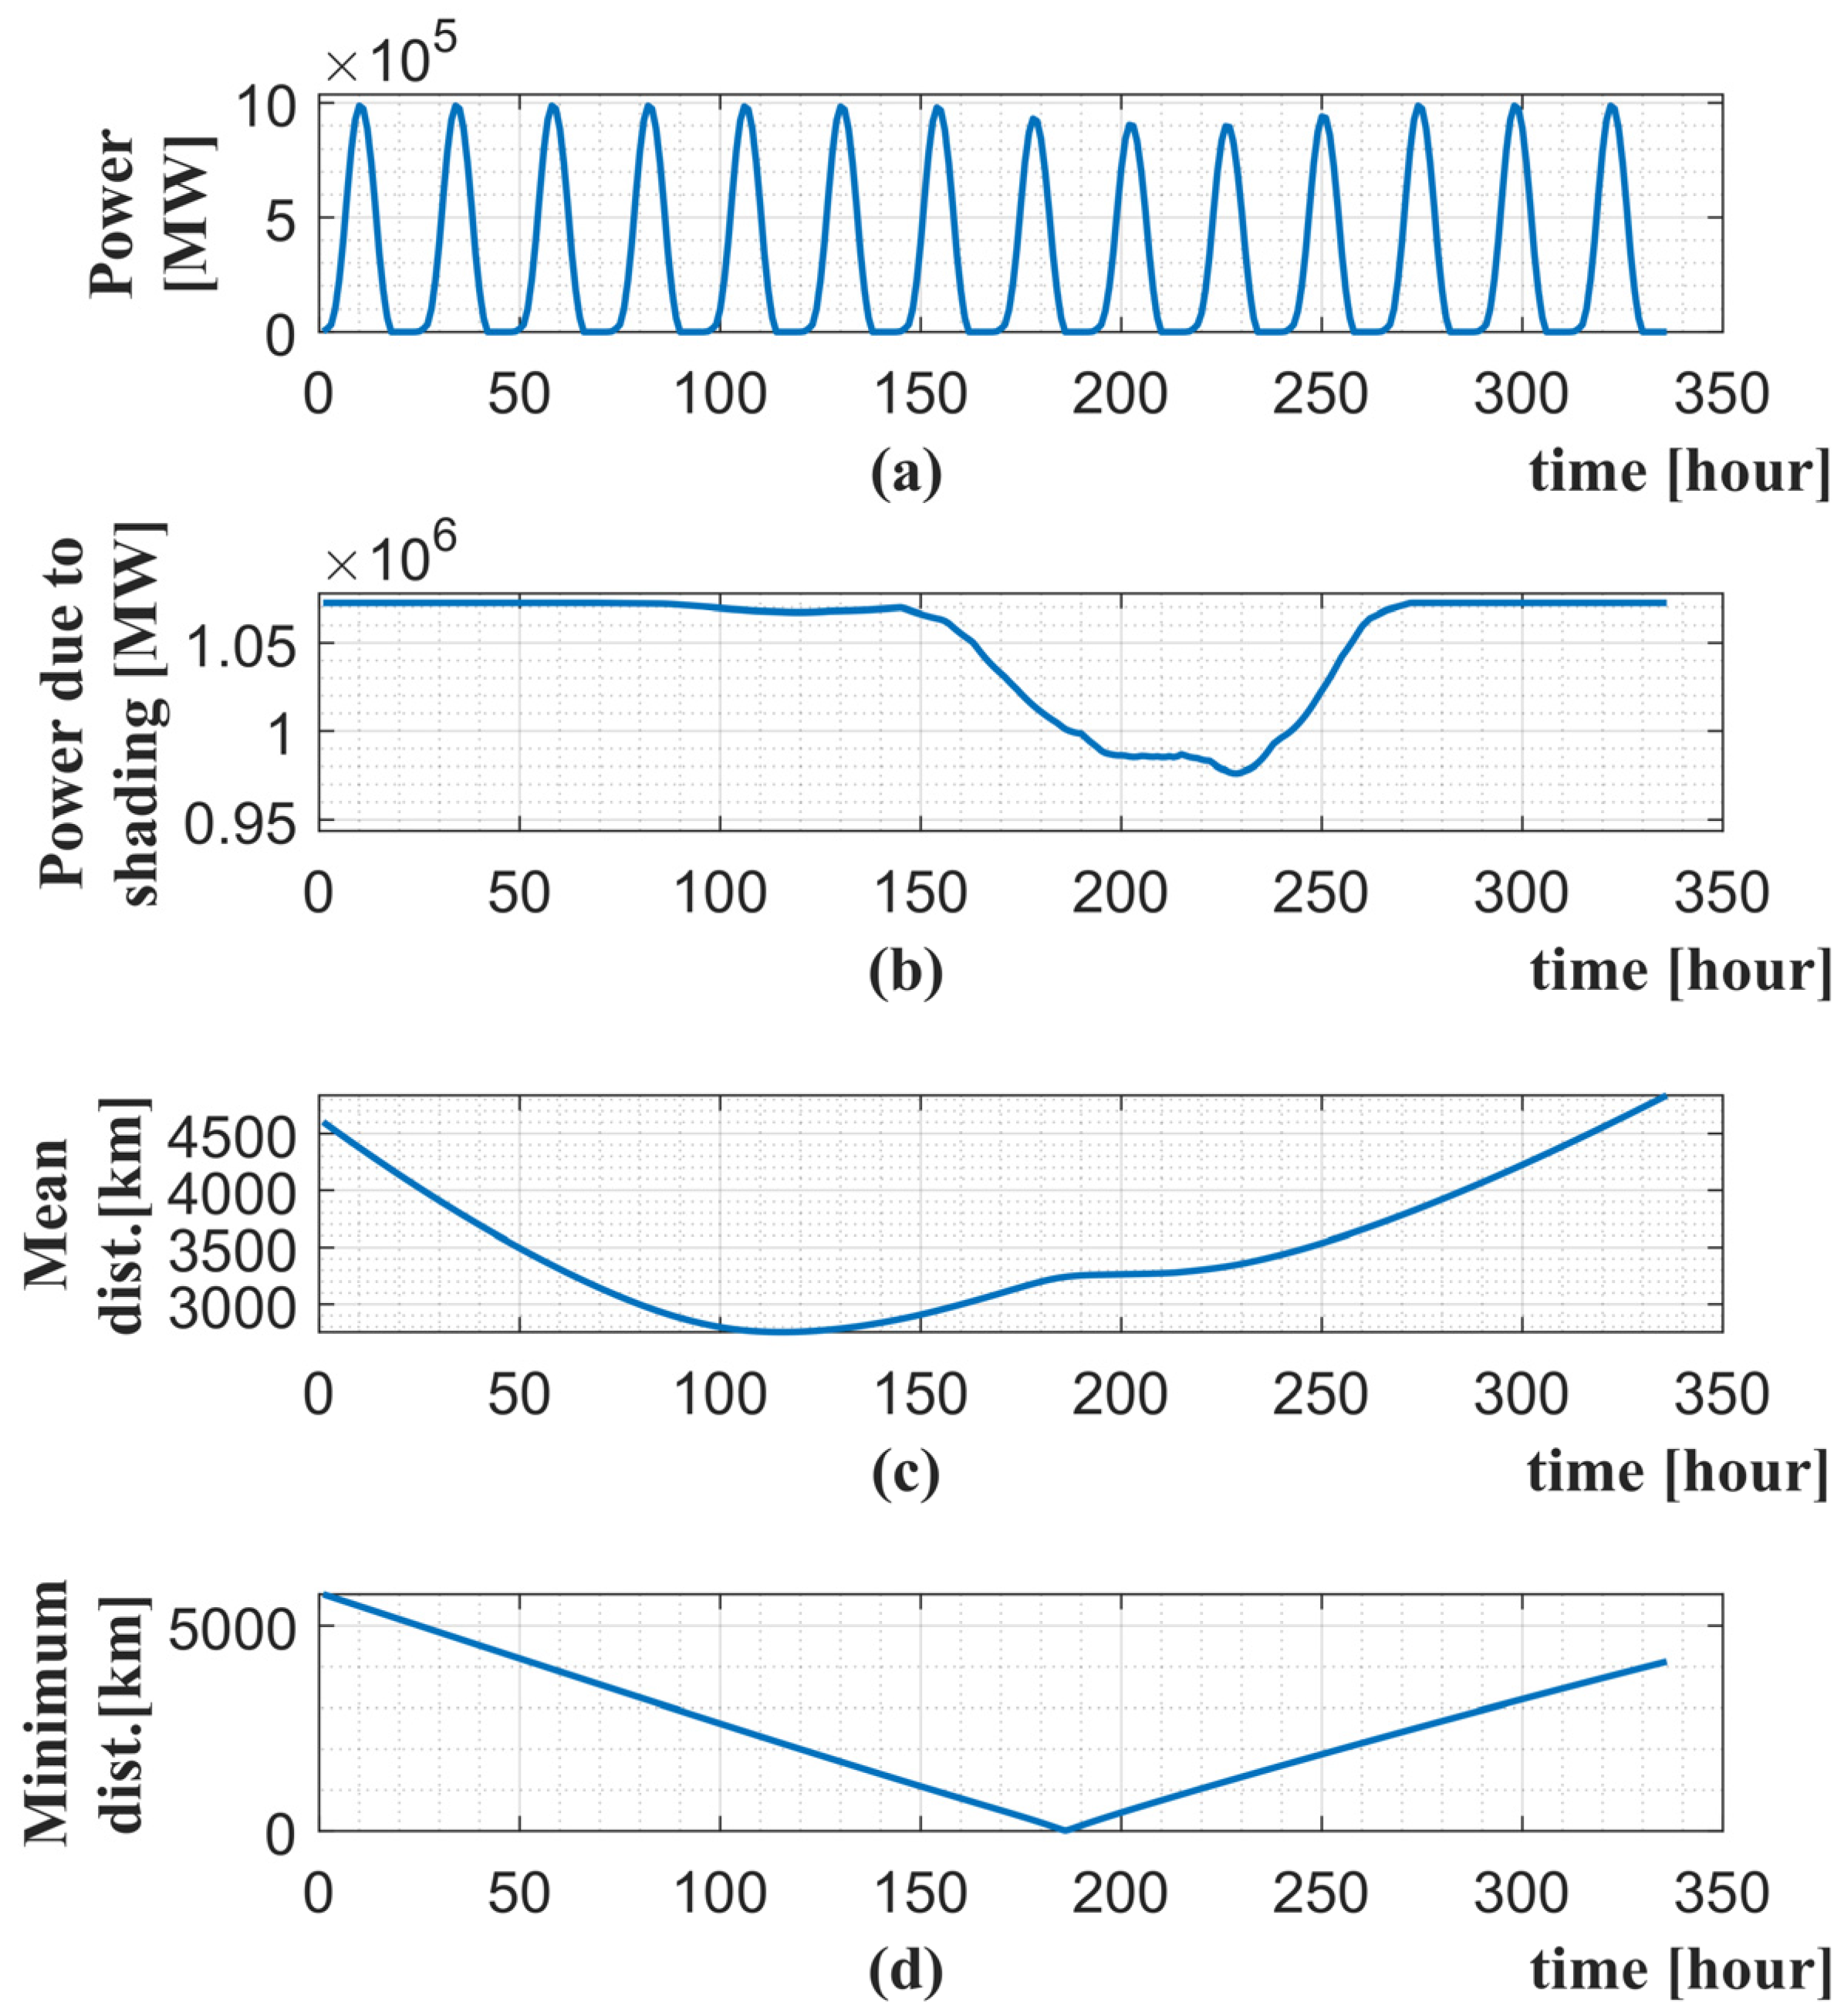
  • U.S.–Caribbean–South America super grid: this interconnectivity scheme adds approximately 60,712 MW of PV capacity, primarily from Brazil (58,500 MW), situated outside the hurricane corridor. Extending the U.S.–Caribbean super grid does not significantly reduce the overall relative power variability. More PV solar power capacity or other renewable energy sources (e.g., wind or hydropower) in South America would be needed to significantly smooth the power variability in hurricane-prone areas. Connecting the U.S.-Caribbean super grid to South America would provide energy security by an alternative power supply in the event of the disconnection of a segment of the Caribbean super grid.
The analysis of the geospatial scenario with all hurricane trajectories reveals that the proposed spatiotemporal method for PV power profile estimation is a valuable tool for PV solar power planning, forecasting, and design because it provides a generalized, flexible, long-distance, long-term, and multi-variable comprehensive understanding of the impact of hurricanes.

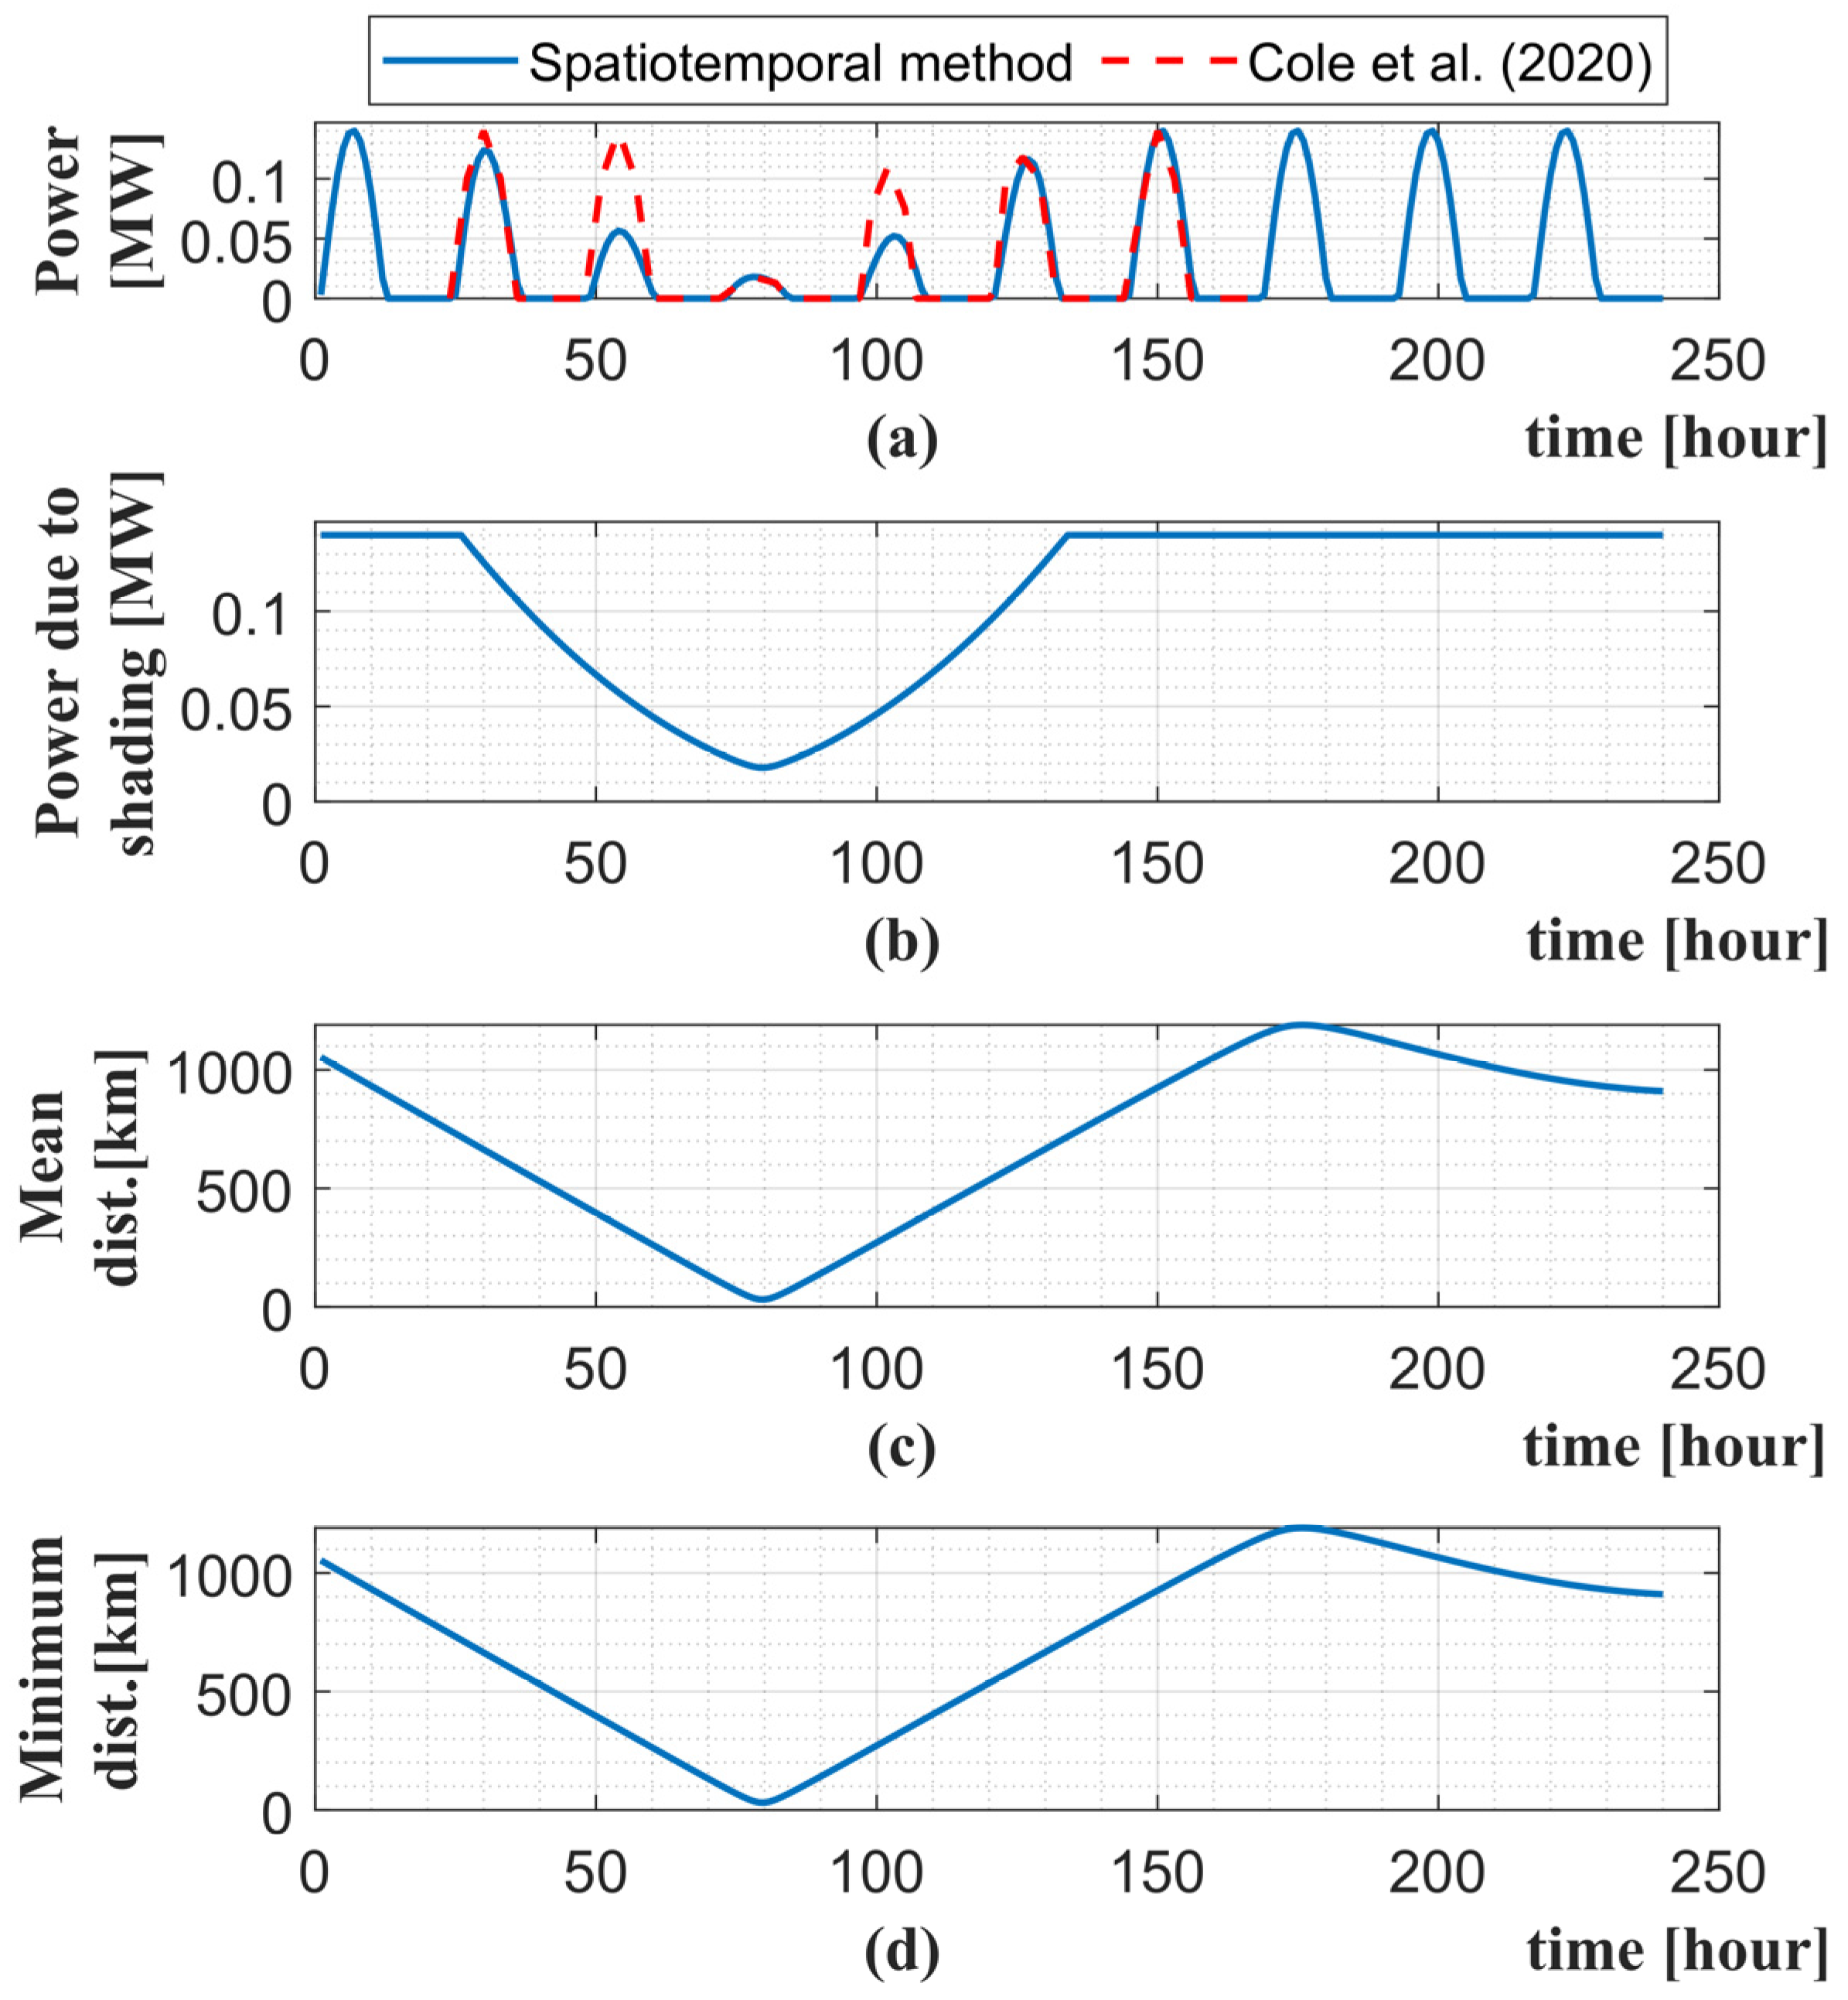
4. Analysis of Consistency

This research adopts Ceferino’s model for hurricane shading, which was previously validated in [3]. Then, this research builds upon Ceferino’s model a complementary method to address the need of forecasting PV solar generation in large-scale super grids. The focus of this research is primarily the delivery of a method to forecast the PV solar generation profile under hurricanes with the integration of islanded high-voltage grids into different topologies of super grids.
However, this proposed algorithm for spatiotemporal estimation of a power profile was shrunk from MW to kW in magnitude in this analysis to confirm the consistency of the estimated power profile with power measurements in a 200 kW scale PV plant in Fort Lauderdale, FL, hit by Hurricane Katrina (2005), as investigated in [2]. According to Cole et al., during hurricanes, the resulting PV solar power profile reduces to between 18% and 60% of the initial clear sky conditions [2].
Figure 18 shows in black color the power profile estimation using the spatiotemporal method proposed in this research for Hurricane Katrina, making first landfall in Florida. The red-dashed profile is the power profile measured by Cole et al. [2]. Hurricane Katrina made landfall initially near the Miami-Dade/Broward County line as a category-1 during the evening of 25 August 2005 at 22:00 h, according to reports of the National Hurricane Center and the National Centers for Environmental Information [36,37]. The y-axis was intentionally maintained in MW so as to not modify the scale of the spatiotemporal algorithm, which was originally designed to simulate large-scale super grids.
The rated power capacity in direct current kW (the PV module’s capacity) in practice is higher than the alternating current PV solar plant rated capacity by a factor called the inverter load ratio. The inverter load ratio of the 200 kW dc PV generation studied by Cole et al. can be calculated by [2]:
I L R = P d c   r a t e d P a c   r a t e d = 200   kWdc 140   kWac = 1.43
The spatiotemporal method for PV solar power profile estimation proposed in this research, which utilizes alternating current rated power, was simulated assuming a P a c   r a t e d of 140 kW ac to obtain the peak power at noon in pre-hurricane conditions.
Table 8 shows the parameters of hurricane Katrina for the spatiotemporal power profile estimation.
Figure 19 shows the synthetic parabolic trajectory simulating the point of impact of hurricane Katrina (2005) using the spatiotemporal estimation method proposed in this research.
Figure 20 shows simulations of a 140 kW ac PV plant in Fort Lauderdale. Figure 20a shows the spatiotemporal solar power estimation profile in blue color, obtained by the spatiotemporal method, and the measurements of power on a PV plant in Fort Lauderdale in a red dashed line, as provided by Cole et al. [2]. Figure 20b shows the power capacity valley caused by the hurricane’s passage. Figure 20c,d have similar distance profiles as the hurricane approaches the PV plant because the mean distance in this specific scenario is calculated over a single PV plant.
Table 9 presents an analysis of consistency of the proposed spatiotemporal method for the estimation of PV power profiles under hurricanes in reference to Cole et al.’s measurements [2].
The 5-day average power obtained from these research simulations reached a 52% average power drop from pre-hurricane conditions, which is in the range of the 18% to 60% reported by Cole et al. [2]. Also, the minimum power drop obtained by the spatiotemporal simulations reached 18.1 kW, which is identical to Cole et al.’s measurements, which indicated 18 kW minimum.
Unfortunately, the exact coordinates (latitude and longitude) of the PV power plant were not indicated in Cole et al.’s simulations [2]. For this reason, the comparison of day-by-day peak power does not reflect the same spatiotemporal conditions. However, the modeling of hurricane shading using Ceferino’s model, formulated in Equation (2), leads to a 360° symmetrical shape of hurricane shading, also observed in Figure 1 and Figure 8. This symmetry is not observed in Cole et al.’s simulations [2].
The spatiotemporal method estimated 5 days of shading while the Cole et al. simulations [2] indicate just 3 days during the passage of Hurricane Katrina over a PV plant in Fort Lauderdale, FL. The number of shaded days is also related to the time the hurricane stays over the PV plant, which is dependent on the translational speed of the hurricane. The simulations of this research adopted the speed values from NOAA [37].
The spatiotemporal method for the estimation of PV power profiles under hurricanes is based on empirical shading equations with a 360° symmetric shape, as show in Figure 1 and Equations (1)–(3). The formulated proposal and validation of the shading Equations (1)–(3) were demonstrated by Ceferino et al. in 2021 by observation of the best proposed equation fitting producing the minimum Akaike Information Criterion (AIC) score [3]. Despite selection of the best fitting, the stochastic simulation of GHI under hurricanes showed differences between Ceferino’s model and Cole’s model [2,3].
In contrast to Ceferino’s model [3], which admittedly supports the spatiotemporal forecasting of irradiance only, this research focuses on forecasting a PV solar power generation profile, which is useful to support electrical power engineering studies, specifically a time-series power flow of super grids. However, this spatiotemporal method for the estimation of a PV power profile does not aim at substituting power-flow methods. This research method is a bridge and facilitates the connection of PV irradiance forecasting into electrical power system studies. It aggregates the power profile of each PV plant connected in a super grid, supporting basic analysis about power variability in large blocks of power. Also, this method is an interdisciplinary tool that generates input (PV solar power profile) for time-series power-flow studies.

5. Conclusions

This section summarizes the contributions and limitations of this research and outlines topics for future investigation.

5.1. The Contributions of this Research

Intermittent renewables operating in extreme weather events produce high variabilities in power generation profiles. The deployment of massive amounts of battery energy-storage systems to dampen local power variability is a very expensive solution. This research instead proposes a large-scale interconnection of local power grids by high-voltage submarine power cables, known as super grids. The simulation results indicate that the PV power variability in the Caribbean super grid under hurricanes is lower when it is connected to the U.S. contiguous power grid or to South America. Reducing intermittent renewable power variability is critical in the transition to the decarbonization of the power sector because power consumers expect high levels of service without power interruptions. This research demonstrates that the U.S.–Caribbean–South America super grid or U.S.–Caribbean super grid are alternative solutions to address the power variability in PV power plants under hurricanes.
Another contribution of this research is that the proposed spatiotemporal method for the estimation of PV power profiles covers a gap in the complete understanding of the impact of hurricanes on renewables. The most significant weather-dependent renewables are wind and PV power. While the methods to estimate wind power under the impact of a hurricane have been investigated [16,20], the estimation of large-scale PV power under hurricanes has been poorly studied. This proposed method for PV estimation covers this gap in the literature.
The proposed spatiotemporal method for estimating PV power profiles is both comprehensive and versatile. It was implemented in MATLAB R2023b coding and programmed to generate the curves and the map of the hurricane trajectory. By synthesizing a set of 10 parabolic trajectories, the method effectively encompasses a significant portion of the hurricane corridor extending from the Caribbean Sea to the Gulf of Mexico. By modeling the hurricane trajectory over a period of 10 to 14 days, the method more accurately captures the long-distance physical reality of a hurricane. The application of this method yields outcomes with international implications. In essence, the method is specifically tailored for studies on large-scale super grids. Such versatility and comprehensiveness are not normally found in data-driven methods.
One important merit of this work is that the proposed method is an indispensable tool for future time-series power-flow simulations of large-scale PV systems under extreme hurricanes. It is indispensable because it provides spatiotemporal PV power profile estimations that can be injected into bus nodes for comprehensive power system simulations in realistic extreme weather conditions. Hurricanes cause PV power valleys, but it is unrealistic to assume that the massive expansion of renewables and associated intermittency should be backed up by unlimited production of batteries. Bulk interconnectivity schemes, as proved in the standalone Caribbean super grid scenario study, can reduce PV power valleys during hurricanes from 37.8% to 8.9%, as shown on Table 5. Further methods and software tools are needed to support future comprehensive time-series power flow studies of power systems with high levels of renewables operating in extreme weather conditions.

5.2. Limitations of This Work and Future Work

This method was based on the parametric modeling of hurricane shading, based on equations empirically fitted and validated by Ceferino et al. [3]. The contribution of this proposed method for super grid simulation builds on the parametric equations elaborated on by Ceferino et al. [3] but also adds novel elements, such as the modeling of parabolic multi-trajectories and the simulation of multiple PV plants in the different interconnectivity schemes of a proposed super grid. This research adopts parametric modeling to find the flexibility to study a hurricane in a multitude of trajectories with the aim of obtaining an overall understanding of the spatiotemporal impact of hurricanes on PV generation interconnected to super grids.
Future data-driven methods may find more accurate results studying a specific hurricane hitting a specific spot for the validation of a specific PV power plant. The choice for parametric modeling was made to analyze hurricanes from the broad perspective of large-scale PV capacity distributed in a multitude of countries in the Caribbean and South America and in the U.S. Future alternative data-driven methods can find more accurate power estimations for specific or synthetic hurricane trajectories. This research found little literature available to make feasible the complete validation of the proposed method over a distribution of PV solar capacity over all countries in the Caribbean and some countries of South America and in the U.S. A future data-driven method would be a much-needed effort for the advancement of renewable energy science.
As for the scope limitation, this proposed method for the estimation of PV power profiles does not intend to substitute power flow algorithms. This method intends to support more in-depth and comprehensive conclusions generated by future power flow studies of the Caribbean super grid and possible extended interconnections. A comprehensive analysis of the time-series power flow on the proposed super grid can investigate hybrid systems with other renewable energy sources such as wind power. Wind turbines generate surplus peak power during hurricanes [16].
Another restriction in the scope of this work is the analysis of techno-economic feasibility, since this method is in the incipient phase of basic studies. A comparison of the cost–benefit of the proposed interconnected Caribbean super grid, incorporating wind power assessment versus an alternative topology with large-scale batteries, is a potential topic for future investigations. Uncertainty and sensitivity analyses of different scenarios are potential topics for future research. Further innovative and alternative methods for the technical justification of the U.S.–Caribbean–South America super grid and other scenarios can be investigated by the scientific community in future studies.
Finally, another interesting topic for future studies is the estimation of wind and solar power in the U.S.–Caribbean–South America super grid—also in non-hurricane conditions in all seasons.

Author Contributions

Conceptualization, R.I.; methodology, R.I.; software, R.I.; writing—original draft preparation, R.I.; formal analysis, R.I., N.S., and S.G.D.S.; investigation, R.I.; data curation, R.I.; validation, S.G.D.S.; writing—review and editing, R.I., N.S., T.K., and S.G.D.S.; supervision, N.S. and T.K.; project administration, T.K.; funding acquisition T.K. All authors have read and agreed to the published version of the manuscript.

Funding

This manuscript is based upon work supported by the U.S. Department of Energy, under contract number DE-AC05-00OR22725.

Data Availability Statement

Data are contained within the article.

Conflicts of Interest

The authors declare no conflicts of interest.

Abbreviations

A W/m2Extraterrestrial solar energy flux
a 1 -Hurricane shading slope factor
a 2 -Hurricane shading slope factor
a 3 -Parabola coefficient
ρ -Albedo
A S T hApparent or true solar time
B radEquation of time (relative to the day number N in the year)
b 1 -Hurricane shading short-distance correction factor
b 2 -Hurricane shading short-distance correction factor
b 3 -Parabola coefficient
β ° Tilt angle of PV module
c 1 -Hurricane shading scale factor
c 2 -Hurricane shading scale factor
c 3 -Parabola coefficient
C -Hurricane category
d kmDistance to the hurricane eye.
δ h -Global Horizontal Irradiance (GHI) Decay
δ s ° Angle of declination
Δ P %PV solar power variability
E o T minutesDifference between apparent and mean solar times
f -Functional forms
F d %Fossil fuel dependence factor
F e %PV expansion factor
f P V -Derating factor of PV cell
GHIkW/m2Global Horizontal Irradiance
G B kW/m2Beam solar irradiation by collector on a horizontal surface
G B . n o r m kW/m2Beam solar irradiation in the sky
G D kW/m2Diffuse solar irradiation
G R kW/m2Reflected solar irradiation
G S T C kW/m2Incident radiation at standard test conditions (equal to 1 kW/m2)
G T , β kW/m2Total solar irradiation absorbed by fixed tilted PV module
γ 1/ ° CTemperature coefficient of PV panel (3.5 × 10⁻³ 1/ ° C),
I p.u.Irradiance for per unit calculation in clear sky
I h %Clearness factor
L ° Latitude of the PV plant
L O D ° Longitude of the PV plant
L M S T ° Local mean sidereal time, degrees
N dayDay number in a year
NOAA-National Oceanic and Atmospheric Administration
P p r e h u r r i c a n e MWPV power in pre-hurricane conditions
P m i n MWMinimum instantaneous peak PV power
P P V , r a t e d MWacPhotovoltaic power capacity
P t o t a l MWTotal power capacity of a country
PV-Photovoltaic
R kmRelative distance to the hurricane eye
R O C I kmRadius of outermost closed isobar.
R B %Ratio between global solar energy on a horizontal surface and global solar energy on a tilted surface.
R D %Ratio between diffuse solar energy on a horizontal surface and diffuse solar energy on a tilted surface.
R R %Factor of reflected solar energy on a tilted surface
T a °CAmbient temperature (in °C)
T C °CSolar time correction
T c e l l °CPV cell temperature (in °C)
T c e l l , S T C °CPV cell temperature at standard test conditions (equal to 25 °C)
T G M T hTime difference with reference to GMT
T s r hTime of sunrise with correction
T s s hTime of sunset with correction
ω s °Hour angle degree
ω s r °Sunrise hour angle time
ω s s °Sunset hour angle time
x °Latitude of hurricane eye in parabola trajectory
y °Longitude of hurricane eye in parabola trajectory

Appendix A

The main input parameters and the procedure to obtain the solar irradiance absorbed by fixed tilted PV solar plants in clear-sky conditions are [23]:
  • L : latitude of the PV plant;
  • L O D : longitude of the PV plant;
  • N: day number 258, corresponding to 15 September, in the middle of the U.S. hurricanes season;
  • The remaining variables are described in the list of abbreviations.
Calculation of the time difference with reference to GMT [23]:
T G M T = r o u n d   L O D 15 °
Calculation of angle of declination ( δ s ) [23]:
δ s = 23.45 ° sin 2 π 365 N 81
Calculation of B and E o T [23,38]:
B = 2 π 365 N 81
E o T = 2.292 0.0075 + 0.1868 c o s B 3.2077 s i n B 1.4615 c o s 2 B 4.089     s i n 2 B
Calculation of L M S T [23]:
L M S T = 15 °   T G M T
Calculation of solar time correction ( T C ) [23]:
T C = 4 °   L M S T L O D + E o T ,             i f   L O D 0 °             4 °   L M S T L O D + E o T ,             i f   L O D < 0 °
Calculation of sunrise and sunset hour angle time ( ω s s and ω s r ) [23]:
ω s s = c o s 1 ( tan L ·   tan δ )
ω s r = ω s s
Calculation of sunset solar time with correction ( A S T s s and T s s ) [23]:
A S T s s = ω s s 15 ° + 12 h
T s s = A S T s s + T C
Calculation of sunrise time with correction ( A S T s r and T s r ) [23]:
A S T s r = ω s r 15 ° 12 h
T s r = A S T s r + T C
Calculation of solar time (Ts) [23]:
L S T = L T + T C 60
Calculation of sin α [23]:
sin α = sin L   · sin δ + cos L ·   cos δ · cos ω
Calculation of hour angle degree ( ω s ) [23]:
ω s = 15 °   A S T 12 h
Calculation of extraterrestrial solar energy flux ( A ) [23]:
A = 1160 + 75   s i n 360 365 N 275
Calculation of factors k and C [23]:
k = 0.174 + 0.035   s i n 360 365 N 100
C = 0.095 + 0.04   s i n 360 365 N 100
Calculation of solar irradiation on horizontal surface:
Calculation of available beam radiation in the sky ( G B . n o r m ) [23]:
G B . n o r m = A · e K s i n
G B = G B . n o r m   s i n
Calculation of diffuse solar irradiation ( G D ) [23]:
G D = C   ·   G B . n o r m
Calculation of total irradiation ( G T ) [23]:
G T = G B + G D
Calculation of solar irradiation on tilt surface:
It is assumed that the tilt angle ( β ) is the same as the latitude ( L ) [23].
β = L
Calculation of R B , R D , and R R [23]:
Liu and Jordan model define R B as [23,39]:
R B = cos L β   ·   c o s δ · sin ω s s + ω s s · sin L β · sin δ cos L   ·   c o s δ   · sin ω s s + ω s s · sin L ·   sin δ
The equations commonly adopted for calculation of R D and R R are [23]:
R D = 1 + cos β   2
R R = 1 cos β   2
Calculation of irradiation ( G B , β , G D , β , G R ) [23]:
G B , β = G B × R B
G D , β = G D × R D
G R = G T × ρ × R R
where the ground Albedo ( ρ ) is assumed to be 0.3, as in [23].
Calculation of total irradiation absorbed by fixed tilted PV module ( G T , β ) [23]:
G T , β = G B , β + G D , β + G R
where G B , β is the beam solar irradiation by fixed tilted PV module, G D , β is beam solar irradiation by fixed tilted PV module, and G R is the reflected solar irradiation.

Appendix B

Table A1 shows PV capacity distributed in 48 U.S. states and 26 Brazilian states.
Table A1. PV power capacity of U.S. and Brazil.
U.S. StatesCumulative PV Capacity [MW ac] [40]Latitude, LongitudeBrazil StatesCumulative PV Capacity [MW ac] [41]Latitude, Longitude
California30,73836.232171, −119.916045;
34.795990, −118.446496;
35.382405, −120.058481
Minas Gerais6468−17.127722, −43.844568
Texas13,40431.095329, −102.344823;
30.241752, −97.513868
29.217125, −95.658233
30.706400, −96.068545
Bahia2402−12.598216, −44.106217
Florida783827.763334, −82.234079
30.515422, −86.514052
30.449714, −83.198413
30.289455, −82.777271
Piaui3050−10.098598, −45.258506
North Carolina637136.027904, −80.300748
36.027838, −80.300811
34.223174, −77.945766
Sao Paulo1162−21.295295, −49.935380
Arizona480633.266410, −111.616842Ceara1536−3.988918, −38.393514
Nevada400835.787342, −114.959010Pernambuco1158−9.070659, −38.146141
New York390642.750417, −73.760531Rio Grande do Norte1383−5.566330, −37.028634
Georgia367631.415000, −84.836573
32.999522, −85.035689
Paraiba811−6.840431, −36.930855
New Jersey341340.334604, −74.646582Rio Grande do Sul23−29.663366, −50.589770
Massachusetts325742.445847, −72.622222
42.402297, −71.007982
Mato Grosso22−15.285470, −56.267769
Virginia303236.792318, −76.668125
37.960675, −75.555078
Parana16−25.341358, −49.094838
Colorado215438.626906, −104.663352Para16−3.224113, −52.255189
Utah200139.843394, −111.884718Roraima142.815288, -60.683043
Illinois181540.081691, −88.243801Espirito Santo13−19.402187, −39.990263
South Carolina160232.878153, −79.972821Santa Catarina12−26.824511, −52.221743
Maryland149639.112493, −75.963808Mato Grosso do Sul11−21.927429, −54.867826
Minnesota130945.097138, −93.644808Tocantins6−10.145414, −48.316027
Hawaii-Not contiguous U.S.Rio de Janeiro5−21.266003, −41.761048
New Mexico117335.048635, −106.529196Goias5−15.385015, −49.090919
Louisiana [42]345 30.676825, −91.392683Amapa4−0.002117, −51.083712
Mississippi [42]30030.676447, −91.392408Alagoas4−9.571945, −35.771952
Alabama [42]17530.675551, −91.391077Maranhao2-3.591578, −43.937995
Tennessee [42]15032.510525, −89.730594Roraima22.815280, −60.683045
Others12,03941.233289, −110.753551Acre1−10.010626, −67.759293
Distrito Federal1−15.781504, −48.122397
Amazonas1−2.636500, −60.949138
Sergipe1−10.984704, −37.054391
Total PV 109,008 MWin December 2022 [40,42]Total PV 18,129 MWin October 2023 [41]
Total PV 1,000,000 MWprojected to 2050 [31]Total PV 58,500 MWprojected to 2050 [35]
The locations of the aggregated power capacity of each North American and Brazilian state are distributed to the coordinates indicated. These coordinates were visually obtained using a Google Maps search for the most representative existing “PV solar plants” in each state. This geospatial attribution of coordinates by state was assumed to limit the computational cost and the total simulation processing time, without compromising the accuracy of the power profile results. The PV power capacity of U.S. states located in the path of hurricanes were obtained from [42]. The power capacity of the U.S. state indicated as others is allocated to the state of Wyoming (outside the hurricane corridor), to not interfere as a power valley in the estimation of PV power profiles under hurricane shading.

References

  1. Méndez-Tejeda, R.; Hernández-Ayala, J.J. Links between climate change and hurricanes in the North Atlantic. PLoS Clim. 2023, 2, e0000186. [Google Scholar] [CrossRef]
  2. Cole, W.; Greer, D.; Lamb, K. The potential for using local PV to meet critical loads during hurricanes. Sol. Energy 2020, 205, 37–43. [Google Scholar] [CrossRef]
  3. Ceferino, L.; Lin, N.; Xi, D. Stochastic modeling of solar irradiance during hurricanes. Stoch. Environ. Res. Risk Assess. 2022, 36, 2681–2693. [Google Scholar] [CrossRef]
  4. IEA. Electricity Grids and Secure Energy Transitions; International Energy Agency: Paris, France, 2023; Available online: https://www.iea.org/reports/electricity-grids-and-secure-energy-transitions (accessed on 19 October 2023).
  5. Bompard, E.; Fulli, G.; Ardelean, M.; Masera, M. It’s a Bird, It’s a Plane, It’s a…Supergrid!: Evolution, Opportunities, and Critical Issues for Pan-European Transmission. IEEE Power Energy Mag. 2014, 12, 40–50. [Google Scholar] [CrossRef]
  6. Bastianel, G.; Ergun, H.; Van Hertem, D. A Multi-GW Energy Hub for Southern Europe: The Mediterranean Energy Island Proposal. In Proceedings of the 2023 AEIT HVDC International Conference (AEIT HVDC), Rome, Italy, 25–26 May 2023; pp. 1–6. [Google Scholar] [CrossRef]
  7. Ahmed, T.; Mekhilef, S.; Shah, R.; Mithulananthan, N. Investigation into transmission options for cross-border power trading in ASEAN power grid. Energy Policy 2017, 108, 91–101. [Google Scholar] [CrossRef]
  8. Itiki, R.; Manjrekar, M.; Di Santo, S.G.; Machado, L.F.M. Topology Design Method for Super Grids based on experiences in China and North America. In Proceedings of the 2020 IEEE Power & Energy Society Innovative Smart Grid Technologies Conference (ISGT), Washington, DC, USA, 17–20 February 2020; pp. 1–5. [Google Scholar] [CrossRef]
  9. Xu, Z.; Dong, H.; Huang, H. Debates on ultra-high-voltage synchronous power grid: The future super grid in China? IET Gener. Transm. Distrib. 2015, 9, 740–747. [Google Scholar] [CrossRef]
  10. Ardelean, M.; Minnebo, P. The suitability of seas and shores for building submarine power interconnections. Renew. Sustain. Energy Rev. 2023, 176, 113210. [Google Scholar] [CrossRef]
  11. Purvins, A.; Sereno, L.; Ardelean, M.; Covrig, C.-F.; Efthimiadis, T.; Minnebo, P. Submarine power cable between Europe and North America: A techno-economic analysis. J. Clean. Prod. 2018, 186, 131–145. [Google Scholar] [CrossRef]
  12. Namjil, E.; Komoto, K. Strategies for Implementing of Very Large Scale Solar and Wind Power Plants in the Gobi Desert for the Northeast Asia Regional Energy Market. In Proceedings of the 2022 IEEE 49th Photovoltaics Specialists Conference (PVSC), Philadelphia, PA, USA, 5–10 June 2022; pp. 1179–1181. [Google Scholar] [CrossRef]
  13. Kim, H.; Jung, T.Y. Embarking on the Asia Supergrid: Trade impact of carbon pricing on regional sustainability in northeast Asia. Renew. Sustain. Energy Rev. 2023, 183, 113426. [Google Scholar] [CrossRef]
  14. Itiki, R.; Manjrekar, M.; Di Santo, S.G. Technical feasibility of Japan-Taiwan-Philippines HVdc interconnector to the Asia Pacific Super Grid. Renew. Sustain. Energy Rev. 2020, 133, 110161. [Google Scholar] [CrossRef]
  15. Ramachandran, S.; Siala, K.; de La Rúa, C.; Massier, T.; Ahmed, A.; Hamacher, T. Life Cycle Climate Change Impact of a Cost-Optimal HVDC Connection to Import Solar Energy from Australia to Singapore. Energies 2021, 14, 7178. [Google Scholar] [CrossRef]
  16. Itiki, R.; Manjrekar, M.; Di Santo, S.G. Proposed Extension of the U.S.–Caribbean Super Grid to South America for Resilience during Hurricanes. Energies 2024, 17, 233. [Google Scholar] [CrossRef]
  17. Vera, N.A.; Ríos, M.A. Planning a Latin America SuperGrid: A First Approach. In Proceedings of the 2018 IEEE ANDESCON, Santiago de Cali, Colombia, 22–24 August 2018; pp. 1–5. [Google Scholar] [CrossRef]
  18. MacDonald, A.E.; Clack, C.T.M.; Alexander, A.; Dunbar, A.; Wilczak, J.; Xie, Y. Future cost-competitive electricity systems and their impact on US CO2 emissions. Nature Clim. Chang. 2016, 6, 526–531. [Google Scholar] [CrossRef]
  19. Ndlela, N.W.; Davidson, I.E. Power Planning for a Smart Integrated African Super-Grid. In Proceedings of the 2022 30th Southern African Universities Power Engineering Conference (SAUPEC), Durban, South Africa, 25–27 January 2022; pp. 1–6. [Google Scholar] [CrossRef]
  20. Itiki, R.; Manjrekar, M.; Di Santo, S.G.; Itiki, C. Method for spatiotemporal wind power generation profile under hurricanes: U.S.-Caribbean super grid proposition. Renew. Sustain. Energy Rev. 2023, 173, 113082. [Google Scholar] [CrossRef]
  21. Muhs, J.W.; Parvania, M. Stochastic Spatio-Temporal Hurricane Impact Analysis for Power Grid Resilience Studies. In Proceedings of the 2019 IEEE Power & Energy Society Innovative Smart Grid Technologies Conference (ISGT), Washington, DC, USA, 18–21 February 2019; pp. 1–5. [Google Scholar] [CrossRef]
  22. Sharpton, T.; Lawrence, T.; Hall, M. Drivers and barriers to public acceptance of future energy sources and grid expansion in the United States. Renew. Sustain. Energy Rev. 2020, 126, 109826. [Google Scholar] [CrossRef]
  23. Khatib, T.; Elmenreich, W. Modeling of Photovoltaic Systems Using MATLAB: Simplified Green Codes, 1st ed.; John Wiley & Sons, Incorporated: Newark, NJ, USA, 2016. [Google Scholar]
  24. Shahid, Z.; Santarelli, M.; Marocco, P.; Ferrero, D.; Zahid, U. Techno-economic feasibility analysis of Renewable-fed Power-to-Power (P2P) systems for small French islands. Energy Convers. Manag. 2022, 255, 115368. [Google Scholar] [CrossRef]
  25. Beven II, L.J.; Berg, R.; Hagen, A. Tropical Cyclone Report Hurricane Michael (AL142018) 7–11 October 2018, National Hurricane Center 17 May (2019). Available online: https://www.nhc.noaa.gov/data/tcr/AL142018_Michael.pdf. (accessed on 1 January 2023).
  26. Pasch, R.J.; Brown, D.P.; Blake, E.S. Tropical Cyclone Report Hurricane Charley 9–14 August 2004, National Hurricane Center. Available online: https://www.nhc.noaa.gov/data/tcr/AL032004_Charley.pdf. (accessed on 1 January 2023).
  27. Pasch, R.J.; Blake, E.S.; Cobb III, H.D.; Roberts, D.P. Tropical Cyclone Report Hurricane Wilma 15–25 October 2005, National Hurricane Center, 12 January. Available online: https://www.nhc.noaa.gov/data/tcr/AL252005_Wilma.pdf. (accessed on 1 January 2023).
  28. U.S. Department of Commerce. National Weather Service, North Atlantic Hurricane Tracking Chart 2020. Available online: https://www.nhc.noaa.gov/data/tracks/tracks-at-2020.png (accessed on 17 October 2023).
  29. Dornan, M.; Shah, K.U. Energy policy, aid, and the development of renewable energy resources in Small Island Developing States. Energy Policy 2016, 98, 759–767. [Google Scholar] [CrossRef]
  30. CIA. The World Factbook—Explore All Countries; Central Intelligence Agency. Available online: https://www.cia.gov/the-world-factbook/countries/ (accessed on 17 October 2023).
  31. NREL. Solar Futures Study; National Renewable Energy Laboratory. 2021. Available online: https://www.energy.gov/sites/default/files/2021-09/Solar%20Futures%20Study.pdf (accessed on 6 December 2023).
  32. Rakotoson, V.; Praene, J.P. A life cycle assessment approach to the electricity generation of French overseas territories. J. Clean. Prod. 2017, 168, 755–763. [Google Scholar] [CrossRef]
  33. Notton, G.; Voyant, C.; Duchaud, J.L. Difficulties of Solar PV Integration in Island Electrical Networks—Case Study in the French Islands. E3S Web Conf. 2019, 111, 06028. [Google Scholar] [CrossRef]
  34. Pillot, B.; Al-Kurdi, N.; Gervet, C.; Linguet, L. Optimizing operational costs and PV production at utility scale: An optical fiber network analogy for solar park clustering. Appl. Energy 2021, 298, 117158. [Google Scholar] [CrossRef]
  35. De Sousa, N.M.; Oliveira, C.B.; Cunha, D. Photovoltaic electronic waste in Brazil: Circular economy challenges, potential and obstacles. Soc. Sci. Humanit. Open 2023, 7, 100456. [Google Scholar] [CrossRef]
  36. Knabb, R.D.; Rhome, J.R.; Brown, D.P. Tropical Cyclone Report Hurricane Katrina 23–30 August 2005, National Hurricane Center, 4 January 2023. Available online: https://www.nhc.noaa.gov/data/tcr/AL122005_Katrina.pdf. (accessed on 1 January 2023).
  37. NOAA. 2005 Major Hurricane KATRINA (2005236N23285), International Best Track Archive for Climate Stewardship (IBTrACS), National Centers for Environmental Information. Available online: https://ibtracs.unca.edu/index.php?name=v04r00-2005236N23285 (accessed on 17 November 2023).
  38. Roumpakias, E.; Stamatelos, A. Comparative performance analysis of grid-connected photovoltaic system by use of existing performance models. Energy Convers. Manag. 2017, 150, 14–25. [Google Scholar] [CrossRef]
  39. Liu, B.Y.H.; Jordan, R.C. The long-term average performance of flat-plate solar-energy collectors: With design data for the US its outlying possessions and Canada. Sol. Energy 1963, 7, 53–74. [Google Scholar] [CrossRef]
  40. Feldman, D.; Dummit, K.; Zuboy, J.; Margolis, R. Spring 2023 Solar Industry Update; National Renewable Energy Laboratory: Golden, CO, USA, 27 April 2023. [Google Scholar] [CrossRef]
  41. ANEEL. Installed Capacity by State, Superintendency of Concessions, Permits and Authorizations for Electrical Energy Services (SCE). Available online: https://app.powerbi.com/view?r=eyJrIjoiNjc4OGYyYjQtYWM2ZC00YjllLWJlYmEtYzdkNTQ1MTc1NjM2IiwidCI6IjQwZDZmOWI4LWVjYTctNDZhMi05MmQ0LWVhNGU5YzAxNzBlMSIsImMiOjR9 (accessed on 17 October 2023).
  42. Solar Energy Industry Association. Project Location Map. 2023. Available online: https://www.seia.org/research-resources/major-solar-projects-list. (accessed on 17 October 2023).
Figure 1. Exponential clearness factor I h versus distance d .
Energies 17 01545 g001
Figure 2. Synthetic parabolic trajectories of hurricanes, adapted from [16].
Energies 17 01545 g002
Figure 3. Proposed expansion of the U.S.–Caribbean–South America super grid in 2050, adapted for PV power from [16].
Energies 17 01545 g003
Figure 4. Algorithm for estimation of PV solar power under hurricanes over (a) a single trajectory and (b) 10 trajectories.
Energies 17 01545 g004
Figure 5. Hurricane over trajectory #7 passing through PV plants of the U.S.–Caribbean–South America super grid.
Energies 17 01545 g005
Figure 6. Hurricane over trajectory #7 passing through PV plants in the standalone U.S. contiguous power grid.
Energies 17 01545 g006
Figure 7. Aggregation of power profiles of each PV solar power plant in the standalone U.S. contiguous power grid.
Energies 17 01545 g007
Figure 8. Normalized power in each PV solar power plant in the standalone U.S. contiguous power grid.
Energies 17 01545 g008
Figure 9. Hurricane over trajectory #7 passing over PV plants of the standalone Caribbean super grid.
Energies 17 01545 g009
Figure 10. Aggregation of the power profiles of each PV solar power plant in the standalone Caribbean super grid.
Energies 17 01545 g010
Figure 11. Hurricane over trajectory #7 passing over PV plants of the U.S.–Caribbean super grid.
Energies 17 01545 g011
Figure 12. Aggregation of power profiles of each PV solar power plant in the U.S.–Caribbean super grid.
Energies 17 01545 g012
Figure 13. Hurricane over trajectory #7 passing over PV plants of the U.S.–Caribbean–South America super grid.
Energies 17 01545 g013
Figure 14. Aggregation of power profiles of each PV solar power plant in the U.S.–Caribbean–South America super grid.
Energies 17 01545 g014
Figure 15. (a) Total PV power profile, (b) shading on PV power plant capacity, and (c) power valley.
Energies 17 01545 g015
Figure 16. (a) Total PV power profile, (b) shading on PV power plant capacity, and (c) power valley.
Energies 17 01545 g016
Figure 17. Hurricane over trajectory #5 passing over PV plants of the Caribbean super grid.
Energies 17 01545 g017
Figure 18. Power profile by the spatiotemporal method (in black) and the power measured on a PV plant in Fort Lauderdale, FL, for 22–29 August 2005 [2].
Energies 17 01545 g018
Figure 19. Hurricane simulating first point of impact of Hurricane Katrina (2005) and PV plants in Fort Lauderdale, FL.
Energies 17 01545 g019
Figure 20. Katrina-like hurricane passing over a 140 kW ac PV plant in Fort Lauderdale, FL, Cole et al. [2].
Energies 17 01545 g020
Table 1. Parameters of hurricanes and shading.
ParametersDescriptionMichael (2018) [25]Charley (2004) [26]Wilma (2005) [27]Sources
C hurricane category543[20]
a 1 slope factor1.971.971.97[3]
a 2 slope factor0.09650.09650.0965[3]
b 1 short-distance correction factor1.151.151.15[3]
b 2 short-distance correction factor−0.126−0.126−0.126[3]
c 1 scale factor2.482.482.48[3]
c 2 scale factor−0.139−0.139−0.139[3]
R O C I for onshoreradii of the outermost closed isobar150 nautical miles
(278 km)
100 nautical miles
(185 km)
250 nautical miles
(463 km)
NOAA
[25,26,27]
R O C I for offshoreradii of the outermost closed isobar200 nautical miles
(370 km)
100 nautical miles
(185 km)
300 nautical miles
(556 km)
NOAA
[25,26,27]
d,
R , and
f
absolute distance from hurricane eye, relative distance from hurricane eye, and functional formrecalculated after each steprecalculated
after each step
recalculated after each step[3]
Δ t h simulation time step1 h1 h1 h[20]
V t r hurricane translational speed9.722 m/s12.5 m/s13.333 m/s[20]
Table 2. PV cell data and environmental parameters.
ParametersSpecification and Environment VariablesSources
PV module technologyMonocrystalline[3]
Tilt type Fixed open rack (hurricane resistant)[3]
Tilt angle Made equal to plant latitude (degrees)[3]
Azimuth orientation180 degrees (Northern Hemisphere)
0 degrees (Southern Hemisphere)
[3]
P P V ,   r a t e d PV-rated ac power outputAppendix B
Table 3. Origin and vertex points of parabola for hurricane trajectory modeling.
Track # x o r i g i n [°] y o r i g i n [°] x v e r t e x [°] y v e r t e x [°]
17−69.956330−100.0
28−70.256430−97.7778
39−33.111130−95.5556
410−33.166730−93.3333
511−33.222230−91.1111
612−33.277830−88.8889
713−33.333330−86.6667
814−33.388930−84.4444
915−33.444430−82.2222
1016−33.530−80
Table 5. Power variability during hurricanes in different scenarios of super grid interconnectivity.
ValuesStandalone U.S. Power GridStandalone Caribbean Super GridU.S.–Caribbean Super GridU.S.–Caribbean–South America Super Grid
Trajectory number#7#7#7#7
Total number of PV solar plants36145090
Total PV capacity [MW]1,000,00011,6231,011,6231,072,335
FiguresFigure 6 and Figure 7Figure 9 and Figure 10Figure 11 and Figure 12Figure 13 and Figure 14
Power valley in the Caribbean:----
P p r e h u r r i c a n e [MW]N.A.11,463955,983989,600
P m i n [MW]N.A.7135952,087985,563
Δ P m i n [%]N.A.37.8%0.4%0.4%
Power valley in the contiguous U.S.: ---
P p r e h u r r i c a n e [MW]946,114N.A.955,983989,600
P m i n [MW]861,819N.A.871,316901,893
Δ P m i n [%]8.9%N.A.8.9%8.9%
Table 6. Power valleys produced by hurricanes hitting the U.S.–Caribbean–South America super grid.
Trajectory #StatesSpatial Density of PV Capacity [MW/km2]Instantaneous Power Valley [MW]Capacity Power Valley [MW]Capacity Power Valley [%]
1Texas0.0193 (2)63,156 (2)66,700 (1)6.7%
2Texas0.0193 (2)88,851 (9)79,690 (3)8.1%
3Texas0.0193 (2)85,178 (5)90,150 (4)9.1%
4Louisiana0.0025 (3)88,455 (7)95,130 (5)9.6%
5Louisiana0.0025 (3)78,304 (3)101,850 (9)10.3%
6Alabama0.0013 (4)88,563 (8)102,110 (10)10.3%
7Florida0.0460 (1)87,707 (6)96,090 (6)9.7%
8Florida0.0460 (1)81,970 (4)98,880 (8)10.0%
9Florida0.0460 (1)90,249 (10)98,130 (7)9.9%
10Off the coast of Florida0 (5)55,656 (1)79,310 (2)8.0%
Table 7. Power valley produced by hurricanes hitting standalone Caribbean super grid.
Trajectory #Instantaneous Power Valley [MW]Capacity Power Valley [MW]Capacity Power Valley [%]
12414232520.3%
23543348230.4%
34439447739.1%
45026517745.2%
55145553048.2%
64891550048.0%
74329505144.1%
83515430637.6%
92754328828.7%
102143222319.4%
Table 8. Parameters of hurricane Katrina (2005).
ParametersDescriptionKatrina (2005)Sources
C hurricane category1 (in Florida)[36]
a 1 slope factor1.97[3]
a 2 slope factor0.0965[3]
b 1 short-distance correction factor1.15[3]
b 2 short-distance correction factor−0.126[3]
c 1 scale factor2.48[3]
c 2 scale factor−0.139[3]
R O C I
for onshore
radii of the outermost closed isobar150 nautical miles
(277 km)
[37]
R O C I
for offshore
radii of the outermost closed isobar130 nautical miles
(241 km)
[37]
d ,
R , and
f
absolute distance from hurricane eye, relative distance from hurricane eye, and functional formrecalculated after each hurricane step-
Δ t h simulation time step1 h[16],
V t r hurricane translational speed4.11–5.14 m/s
(8–10 knots)
[37]
-trajectory shapeparabola crossing the border of Broward/Miami-Dade County, FL[16,36]
Table 9. Comparative analysis of proposed spatiotemporal method and existing technical literature.
MethodSpatiotemporal MethodCole et al.’s Measurements [2]Difference:
Number of days under shading532
Pre-hurricane power [kW ac]140 (100%)140 (100%)0
Day 1’s noon peak power [kW ac]123.8 (88%)140 (100%)−16.2
Day 2’s noon peak power [kW ac]56.5 (40%)140 (100%)−83.5
Day 3’s noon peak power [kW ac]18.1 (13%)18 (13%)0.1
Day 4’s noon peak power [kW ac]52.1 (37%)110 (79%)−57.9
Day 5’s noon peak power [kW ac]113.2 (81%)118 (84%)−4.8
Peak average [kW ac]72.7 (52%)82.0 (59%)−9.3 (−6.6%)
Disclaimer/Publisher’s Note: The statements, opinions and data contained in all publications are solely those of the individual author(s) and contributor(s) and not of MDPI and/or the editor(s). MDPI and/or the editor(s) disclaim responsibility for any injury to people or property resulting from any ideas, methods, instructions or products referred to in the content.

