Article

Analysis of Thermal Management Strategies for 21700 Lithium-Ion Batteries Incorporating Phase Change Materials and Porous Copper Foam with Different Battery Orientations

Department of Vehicle Engineering, National Pingtung University of Science and Technology, Neipu Township, Pingtung 91201, Taiwan
*
Author to whom correspondence should be addressed.
Energies 2024, 17(7), 1553; https://doi.org/10.3390/en17071553
Submission received: 24 February 2024 / Revised: 14 March 2024 / Accepted: 21 March 2024 / Published: 24 March 2024
(This article belongs to the Topic Battery Design and Management)

Abstract

:
The significant amount of heat generated during the discharge process of a lithium-ion battery can lead to battery overheat, potential damage, and even fire hazards. The optimal operating temperature of a battery ranges from 25 °C to 45 °C. Hence, battery thermal management cooling techniques are crucial for controlling battery temperature. In this work, the cooling of 21700 lithium-ion batteries during their discharging processes using phase-change materials (PCMs) and porous pure copper foams were simulated. The effects of discharge intensities, battery orientations, and battery arrangements were investigated by observing the changes in temperature distributions. Based on current simulations for a 2C discharge, air-cooled vertical batteries arranged in unidirectional configuration exhibit an increase in heat dissipation by 44% in comparison to the horizontal batteries. This leads to a decrease in the maximum battery temperature by about 10 °C. The use of either PCMs or copper foams can effectively cool the batteries. Regardless of the battery orientation, the maximum battery temperature during a 2C discharge drops dramatically from approximately 90 °C when air-cooled to roughly 40 °C when the air is replaced by PCM cooling or when inserted with a copper foam of 0.9 porosity. If the PCM/copper foam approach is implemented, this maximum temperature further decreases to slightly above 30 °C. Although not very significant, it has been discovered that crossover arrangement slightly reduces the maximum temperature by no more than 1 °C. When a pure copper foam with a porosity ranging from 0.90 to 0.97 is saturated with a PCM, the excellent thermal conductivity of pure copper, combined with the PCM latent heat absorption, can best help maintain the battery pack within its range of optimal operating temperatures. If the porosity of the copper foam decreases from 0.95 to 0.5, the volumetric average temperature of the batteries may increase from 30 °C to 31 °C.

1. Introduction

The use of fossil fuels in vehicles has long been associated with global warming and climate change. As a remedy, electric vehicles that use lithium-ion batteries (Li-ion batteries) as their power source have been developed as a more environmentally friendly alternative. Li-ion batteries provide high voltage, significant energy and power densities, extended lifespan, and minimal self-discharge. Unfortunately, this kind of battery generates a substantial quantity of heat during its charging and discharging processes. This heat may impact the lifespan and safety of the battery. For this reason, the need for a Battery Thermal Management System (BTMS) arises to control and manage the internal temperature of the battery, ensuring optimal performance and user safety. The four primary types of BTMS in the electric vehicle (EV) industry include air-cooled, liquid-cooled, Phase Change Materials (PCMs), and thermo-electric BTMS [1]. Hybrid BTMS involve combining at least two different BTMS techniques to further enhance its overall performance. By integrating these techniques, one can leverage the advantages of each approach to achieve improvement in overall BTMS effectiveness. In addition to the above common BTMS techniques, Khan, et al. [2] introduced the latest machine-learning BTMS, designed for various battery energy storage systems, including those using Li-ion batteries.
The thermal balance equation that Bernardi, et al. [3] established in 1985 for general batteries has served as the foundation for subsequent research on battery self-heating phenomena. In 1993, Yao, et al. [4] used a mathematical model to explore heat generation during battery discharge. Later, Al-Hallaj, et al. [5] and Sato [6] further contributed to understanding transient heat characteristics and thermal behavior in Li-ion batteries through mathematical models and experiments. Based upon these models, the thermal effects during the charge/discharge of Li-ion batteries were further investigated by Jeon and Baek [7] and Liu, et al. [8]. Recognizing the significance of addressing heat generation in Li-ion batteries during operation, researchers are actively exploring BTMS. Heat pipes and fins have been found to be effective cooling devices for BTMS [9,10,11,12,13,14,15,16,17]. Other approaches include using thermoelectric cooling techniques [18,19,20,21], manifold [22,23,24,25,26], cell arrangement [27], battery pack layout within the battery cabin [28], cooling channels [29,30,31,32,33], cold plates [34,35], and nanofluids [36,37,38,39]. On the other hand, Khateeb, et al. [40], Duan and Naterer [41], Li, et al. [42], and Wilke, et al. [43] have experimentally confirmed that PCMs offer a significant improvement to BTMS. PCMs are commonly recognized as highly effective materials for BTMS in Li-ion batteries, attributed to their favorable thermal conductivity, notably low melting temperature, and low viscosity [44]. Talele, et al. [45] provided a thorough overview of research on Li-ion battery BTMS using heat pipes, liquid cooling, and a PCM, both in active and passive systems. To our knowledge, Lakhotia and Kumar [46] have quite recently come out with one of the most complete classifications of BTMS.
Although integrating a PCM with liquid cooling as a hybrid thermal management seems to yield good outcomes, Zhou, et al. [47] noted that the use of PCMs increases the overall weight of the battery pack and raises other battery safety concerns, especially regarding fire risks. Over the past few years, there has been a concerted effort to mitigate PCM flammability. Chen, et al. [48] suggested that one of the solutions might lie in the incorporation of polymers and nanomaterials to improve PCMs’ structural stability and mechanical properties. This approach includes the addition of flame retardants into PCMs, as well as the encapsulation of PCMs with flame-retardant shells or coatings.
Sabbah, et al. [49] and Kizilel, et al. [50] numerically compared the performance of air and PCMs in Li-ion battery BTMS. They found that the effectiveness of pure air-cooling struggled to keep battery temperatures within a safe range during moderate discharge rates and elevated ambient temperatures. Ramandi, et al. [51] proposed a dual-layer PCM BTMS that offered better temperature control due to its higher cooling efficiency. Ling, et al. [52] and Jiang, et al. [53] investigated the thermal management effectiveness of expanded graphite composite PCMs with different thermophysical properties. Bai, et al. [54] established a promising thermal management system model for square lithium iron phosphate batteries sandwiched by PCM/water-cooled plates with the upper portion being the water-cooled plates and the lower portion being the PCM. Not long ago, Zhao, et al. [55] introduced a phase change hydrogel pad based on a polyurethane foam skeleton. Not only is this PCM-based material effective in thermal management, but it also improves its anti-vibration capability. So far, the different PCMs experimentally tested have also included paraffin wax [52,56,57,58,59], PEG1000 [60], RT-4 [61], and even nanoparticle-enhanced PCMs [62]. Some numerical studies considered the addition of nanoparticles or nanoplatelets into PCMs for better performance [63,64,65,66,67]. Most recently, Weragoda, et al. [68] proposed the use of the capillary-driven evaporative cooling method with a wick structure on the battery surface. In their experiment, copper foam was attached to a simulated battery, while ethanol and Novec 7000 were used as the cooling fluids. It was found that the maximum cell surface temperature remained at around 40 °C even after the simulated battery was continuously heated with 50 W for 20 mins.
Haghighi and Moghaddam [69] employed the Computational Fluid Dynamics (CFD) approach to simulate the cooling of a 21700 battery pack under various conditions, including heat pipe cooling, baseplate cooling, and natural cooling. Their results indicated that heat pipe cooling exhibited the best cooling performance. Although baseplate cooling was not as effective as heat pipe cooling, its structure is simpler, and it receives widespread industrial applications. Singh, et al. [70] also numerically investigated a BTMS based on the combination of encapsulated PCMs with forced convective air cooling on SONY 18,650 type Li-ion batteries arranged in an inline or a staggered manner.
Many numerical studies have explored the potential enhancement of hybrid BTMS by integrating PCMs with metal fins attached to the surface of cylindrical batteries. These investigations have considered a variety of fin designs, including: (a) straight fin [71,72], (b) circular fin [73,74], (c) arc fin [72], (d) helical fin [75], (e) triangular fin [76,77], (f) I-shape fin [76], (g) Y-, N-, and Z-shape fins [78]. Re-investigating some of the simple fin designs mentioned above, Liu, et al. [79] also explored the impact of other more complicated aluminum fin designs on PCM thermal performance improvement. They found that bifurcated fin structures, especially the 2-branch design, caused the temperature to drop the most. While increasing the number of fins might reduce the temperature, altering the thickness of the PCM layer might not necessarily affect thermal performance significantly. Later, Wu, et al. [80] considered similar fin designs on PCM performance, particularly under different gravitational conditions.
Rashidi, et al. [81] performed an extensive review on the use of porous materials in BTMS for Li-ion batteries. Their review identified a gap in research concerning the thermal behavior of battery cells and PCM/metal foam composites when battery temperature increases. Recognizing the significance of addressing this gap, the authors suggested that some further studies should focus on the understanding of this hybrid passive BTMS technique. In fact, prior to Rashidi et al.’s review, Ranjbaran, et al. [82] had explored the use of copper foam as a conductive additive in paraffin wax (a pure PCM) to improve the thermal conductivity of traditional PCMs. Their numerical findings indicate that the inclusion of metal foam significantly affects the time evolution of PCM liquid fraction within a cylindrical cell surrounded by a shell. In the same year, Bamdezh, et al. [83] had introduced a hybrid BTMS, in which a 18,650 Li-ion battery was radially covered with an aluminum foam saturated with paraffin and inserted with 8 water cooling channels. The study shows that higher axial thermal conductivity helps control the maximum temperature difference across the cell. However, increasing radial thermal conductivity surprisingly raises this temperature difference. Perhaps, the presence of the cooling channels in the PCM/foam layer could explain this peculiar phenomenon.
Sudhakaran, et al. [84] conducted a study to investigate the impact of PCM type, PCM thickness, and foam porosity on BTMS. They analyzed the performance of capric acid, RT-35, RT-42, and RT-55 as PCM materials, along with copper foam with porosity in the range of 0.93 to 0.99. Their numerical analysis suggested that the most significant factors influencing BTMS cooling performance, ranked in order of importance, were the PCM, thickness, and foam porosity. Liu, et al. [85] experimentally and numerically investigated how non-uniform copper foams affect the phase transition of paraffin wax. They set up a horizontal shell-and-tube latent thermal energy storage test system specifically designed for solar energy storage. They also compared the PCM melting rate in the copper foams of different foam porosity gradients.
Kurşun, et al. [86] studied the impact of outer container shape on battery temperature when the space was filled using copper foam saturated with PCM. They analyzed five different container shapes and found that the triangular container yielded the lowest battery temperature during discharge. The findings suggest that the outer container shape only played a crucial role in battery thermal management if convection heat transfer was low and heat generation was high.
According to the literature review and to the best of our knowledge, there are numerous studies focusing on hybrid BTMS based on the PCM technique. However, rarely has anyone considered the effect of battery orientation, and the effect of battery arrangement has never been investigated at all. For this reason, the current numerical study aimed to understand the heating process of various 21700 Li-ion battery packs under different combinations of very basic orientations and arrangements. By examining different heat removal strategies and battery orientations, the heat generation due to the discharge process of the Li-ion battery was simulated. The main novelty of the current study lies in providing fundamental BTMS insights to the battery industry for designing effective thermal management so that the batteries work well at the right temperature and last longer.

2. Materials and Methods

Similar to Haghighi and Moghaddam [69], the current work also considered 21700 Li-ion batteries. The specifications of the batteries were based on the experimental data provided by Haghighi and Moghaddam [69], and these parameters are listed in Table 1. The battery discharge current investigated ranged from 1C to 2C, with 1C being 3.2 A. Its internal resistance was 53 mΩ and its terminal voltage was 3.56V. Although the Li-ion battery generated heat during both its charging and discharging stages, it was proven that more heat was generated during its discharging state than during its charging state. For this reason, the present study only considered the case of discharging a Li-ion battery at rates of 1C, 1.5C, and 2C.
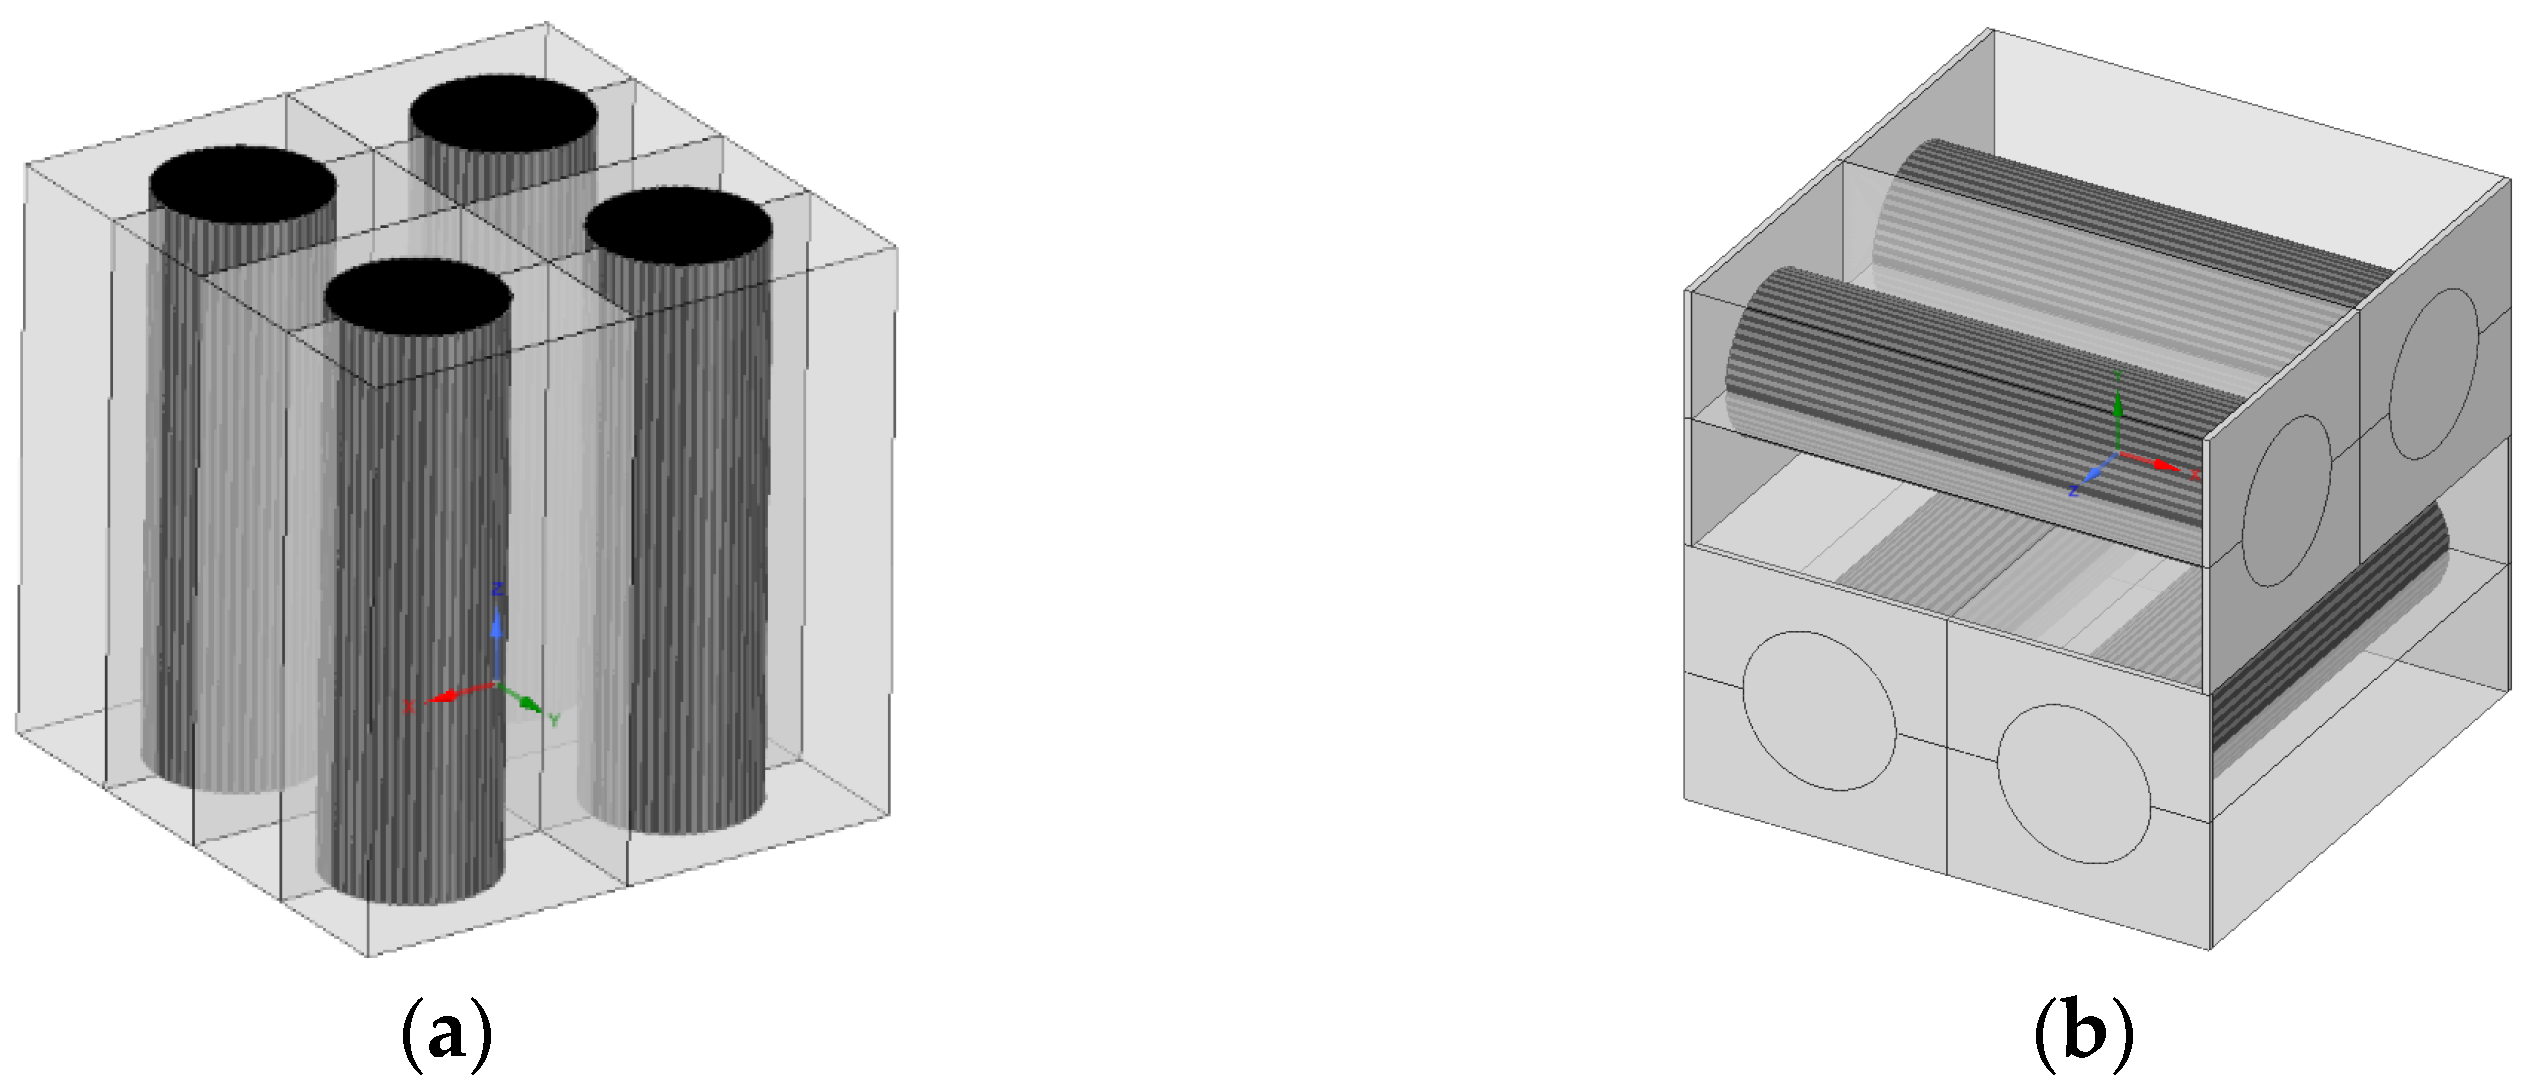
The current study assumed the battery to be a homogeneous cylindrical heater, placed in an aluminum casing (as illustrated in Figure 1), and filled with air, metal foam, or a PCM, all of whom are kept at an initial temperature of 25 °C. The aluminum casing is 1 mm thick. It is cooled down through an external natural convection with a heat transfer coefficient of 25 W/m2·K in air of 25 °C. Since the battery and its casing are small in size, the buoyant air flow within travels at relatively low velocities; the flow is assumed laminar and can be verified later. The effects of horizontal and vertical orientations of a four-battery pack were also investigated, along with two different kinds of layer arrangements, i.e., unidirectional and crossover. Figure 2a illustrates how four batteries are placed vertically and unidirectionally in their battery pack, while Figure 2b shows a horizontal orientation with crossover arrangement.
The conservation equations of mass, momentum, and energy in the vector form being solved simultaneously are as follows:
ρ t + · ρ V = 0 ,
ρ V t + V · V = P + g + μ 2 V + S ,   and
ρ c p T t + V · T = · λ · T + q ˙ .
These equations are typical and therefore are not further discussed here for the sake of brevity. In the case of air as the fluid filling the battery casing, it can be reasonably assumed that air behaves as an ideal gas, and hence its density can be calculated through the equation of state. If the air in the battery casing is entirely replaced by a PCM, its thermal properties, including its density, are assumed to increase linearly between 25 °C and 50 °C. These values are listed in Table 2. It is worth mentioning that the PCM’s dynamic viscosity was estimated using the following equation [63]:
μ = 9 × 10 4 T 2 0.6529 T + 119.94 × 10 3 .
In the momentum equations, S denotes the external forces in the x, y, and z directions. These external forces, S, are all zero if the battery casing is filled with air or a PCM. If the space between the battery and its casing is filled with a porous foam, these external forces represent the additional flow resistance the porous matrix creates and take the following forms:
S = 1 ρ μ K V + C 2 · 1 2 ρ V V ,
where K is the permeability of the porous foam, and C2 is the internal resistance to fluid entering the porous foam. Since the flow in the battery pack is very slow, it was reasonable to assign 0 to the value of C2. It is important to note that, when porous media are considered, the velocity V that appears in Equations (1)–(3) and (5) is the intrinsic average velocity [87]. It is related to the Darcy velocity v through the Dupuit-Forchheimer relationship, i.e., v = ϕ V. The porous foam investigated in this study is made of pure copper and is assumed saturated with either air or a PCM. The material properties of pure copper and air are listed in Table 3. The value of permeability, K, was calculated using the following equations, after some manipulations [88]:
K = ϕ 1 1 ϕ 1 / 3 2 36 β 1 ϕ 1 / 3 1 ϕ β d 0 2 ,   and
d 0 = β 1 1 ϕ 1 / 3 d p ,
where dp is the pore size of 5 mm, ϕ is the porosity of the foam, and β is a shape factor of 1.008528775 when considering a regular polygon with 14 sides. A commercialized copper foam comes in 5 to 120 PPI, corresponding to pore sizes of 0.1 mm to 10 mm. According to Yang, et al. [89], β = 1.00 and 1.05 for a circle and a hexagon, respectively.
The symbol λ in Equation (3) is the symmetric, second-rank thermal conductivity tensor. The rate of heat generation q ˙ in the same equation represents the heat the Li-ion battery generated during its discharging process. These values for the rate of heat generation were experimentally measured by Haghighi and Moghaddam [69] and are presented in Table 4.
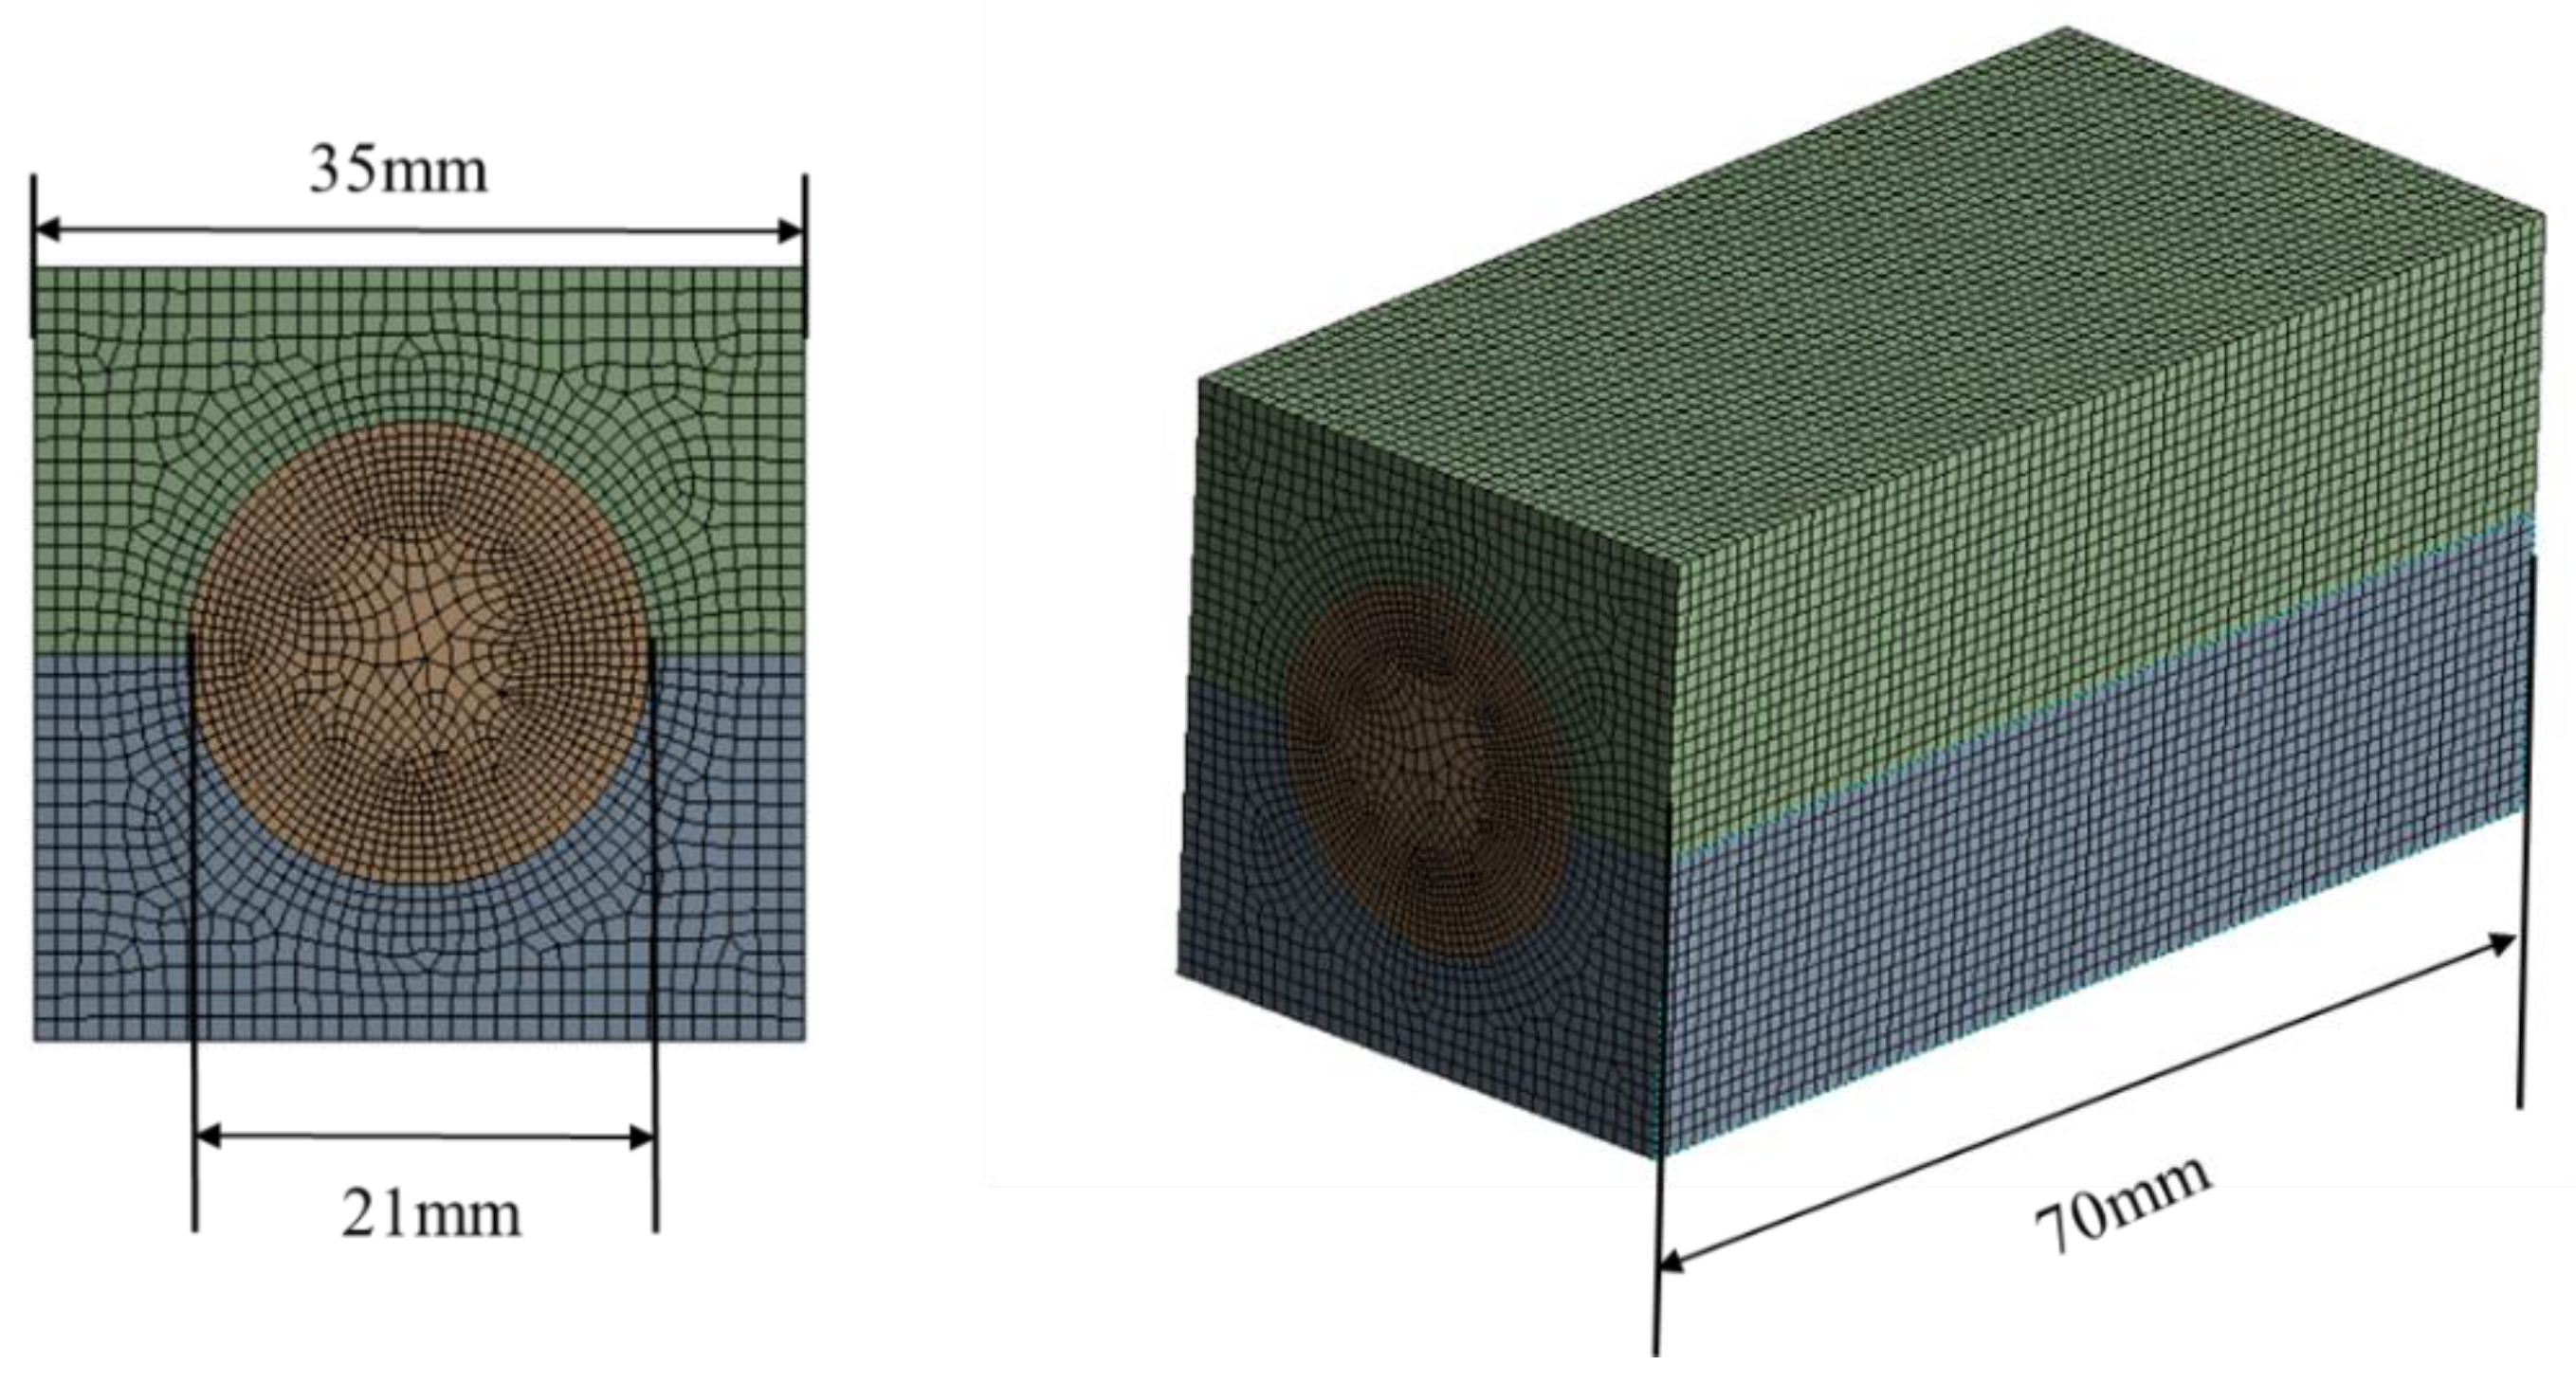
Based on a present grid refinement test ranging from roughly 60,000 to 180,000 cells, it was found that a mesh consisting of 150,000 cells was sufficient for steady-state simulations. The mesh arrangement of the single-battery pack is shown in Figure 3. The four-battery model was meshed in a similar fashion. Since the discharge process of the battery is a transient heating process, the length of the simulation actually depends on the rate of battery discharge. The discharge rates of 1C, 1.5C, and 2C corresponded to 3600 s, 2400 s, and 1800 s. All these values represent the time at which the battery stops its discharging process. In some cases, this situation also refers to a unity Depth of Discharge, i.e., DoD = 100%.
DoD is always used to indicate the percentage of the total capacity that has been discharged from a battery. If a battery has a capacity of 100 Ah and has discharged 50 Ah, the DoD would be 50%. This study examined the time step sizes (ΔT) ranging from 0.05s to 10 s. It was found that a ΔT of 0.5 s was good enough to yield converged numerical results.
To verify if the flow within the casing is laminar, the current study simulated a vertically oriented single-battery pack discharged at a rate of 2C. The maximum air velocity obtained was about 8 cm/s. This value was then used to calculate the Reynolds number of the airflow. Based on an air temperature of 80 °C, the Reynolds number was about 69 if its characteristic length, L, was represented by the width of the battery casing. If the height of the battery casing was chosen as the characteristic length L, the Reynolds number was 371. Either case implies that the airflow is unlikely to start its transition into the turbulent state.
Through experiments, Kitamura, et al. [90] found that fluid flow over a horizontal cylinder begins its transition from laminar to turbulent flow when RaD exceeds 2.1 × 10⁹, where D is the diameter of the cylinder. Based on the aforementioned air temperature, the calculated value for RaD when the battery was placed horizontally was about 160. This value further validates the fact that the airflow in the battery pack will not transition from laminar to turbulent due to the influence of thermal buoyancy.

3. Results and Discussions

This study explores the effectiveness of employing different cooling methods to remove heat from a Li-ion battery pack at various discharge rates by analyzing its heat flow phenomenon. The thermal management strategies investigated include using the following media: (1) pure air, (2) a phase change material (PCM), (3) a copper foam saturated with pure air, and (4) a copper foam saturated with PCM.

3.1. Single-Battery Model

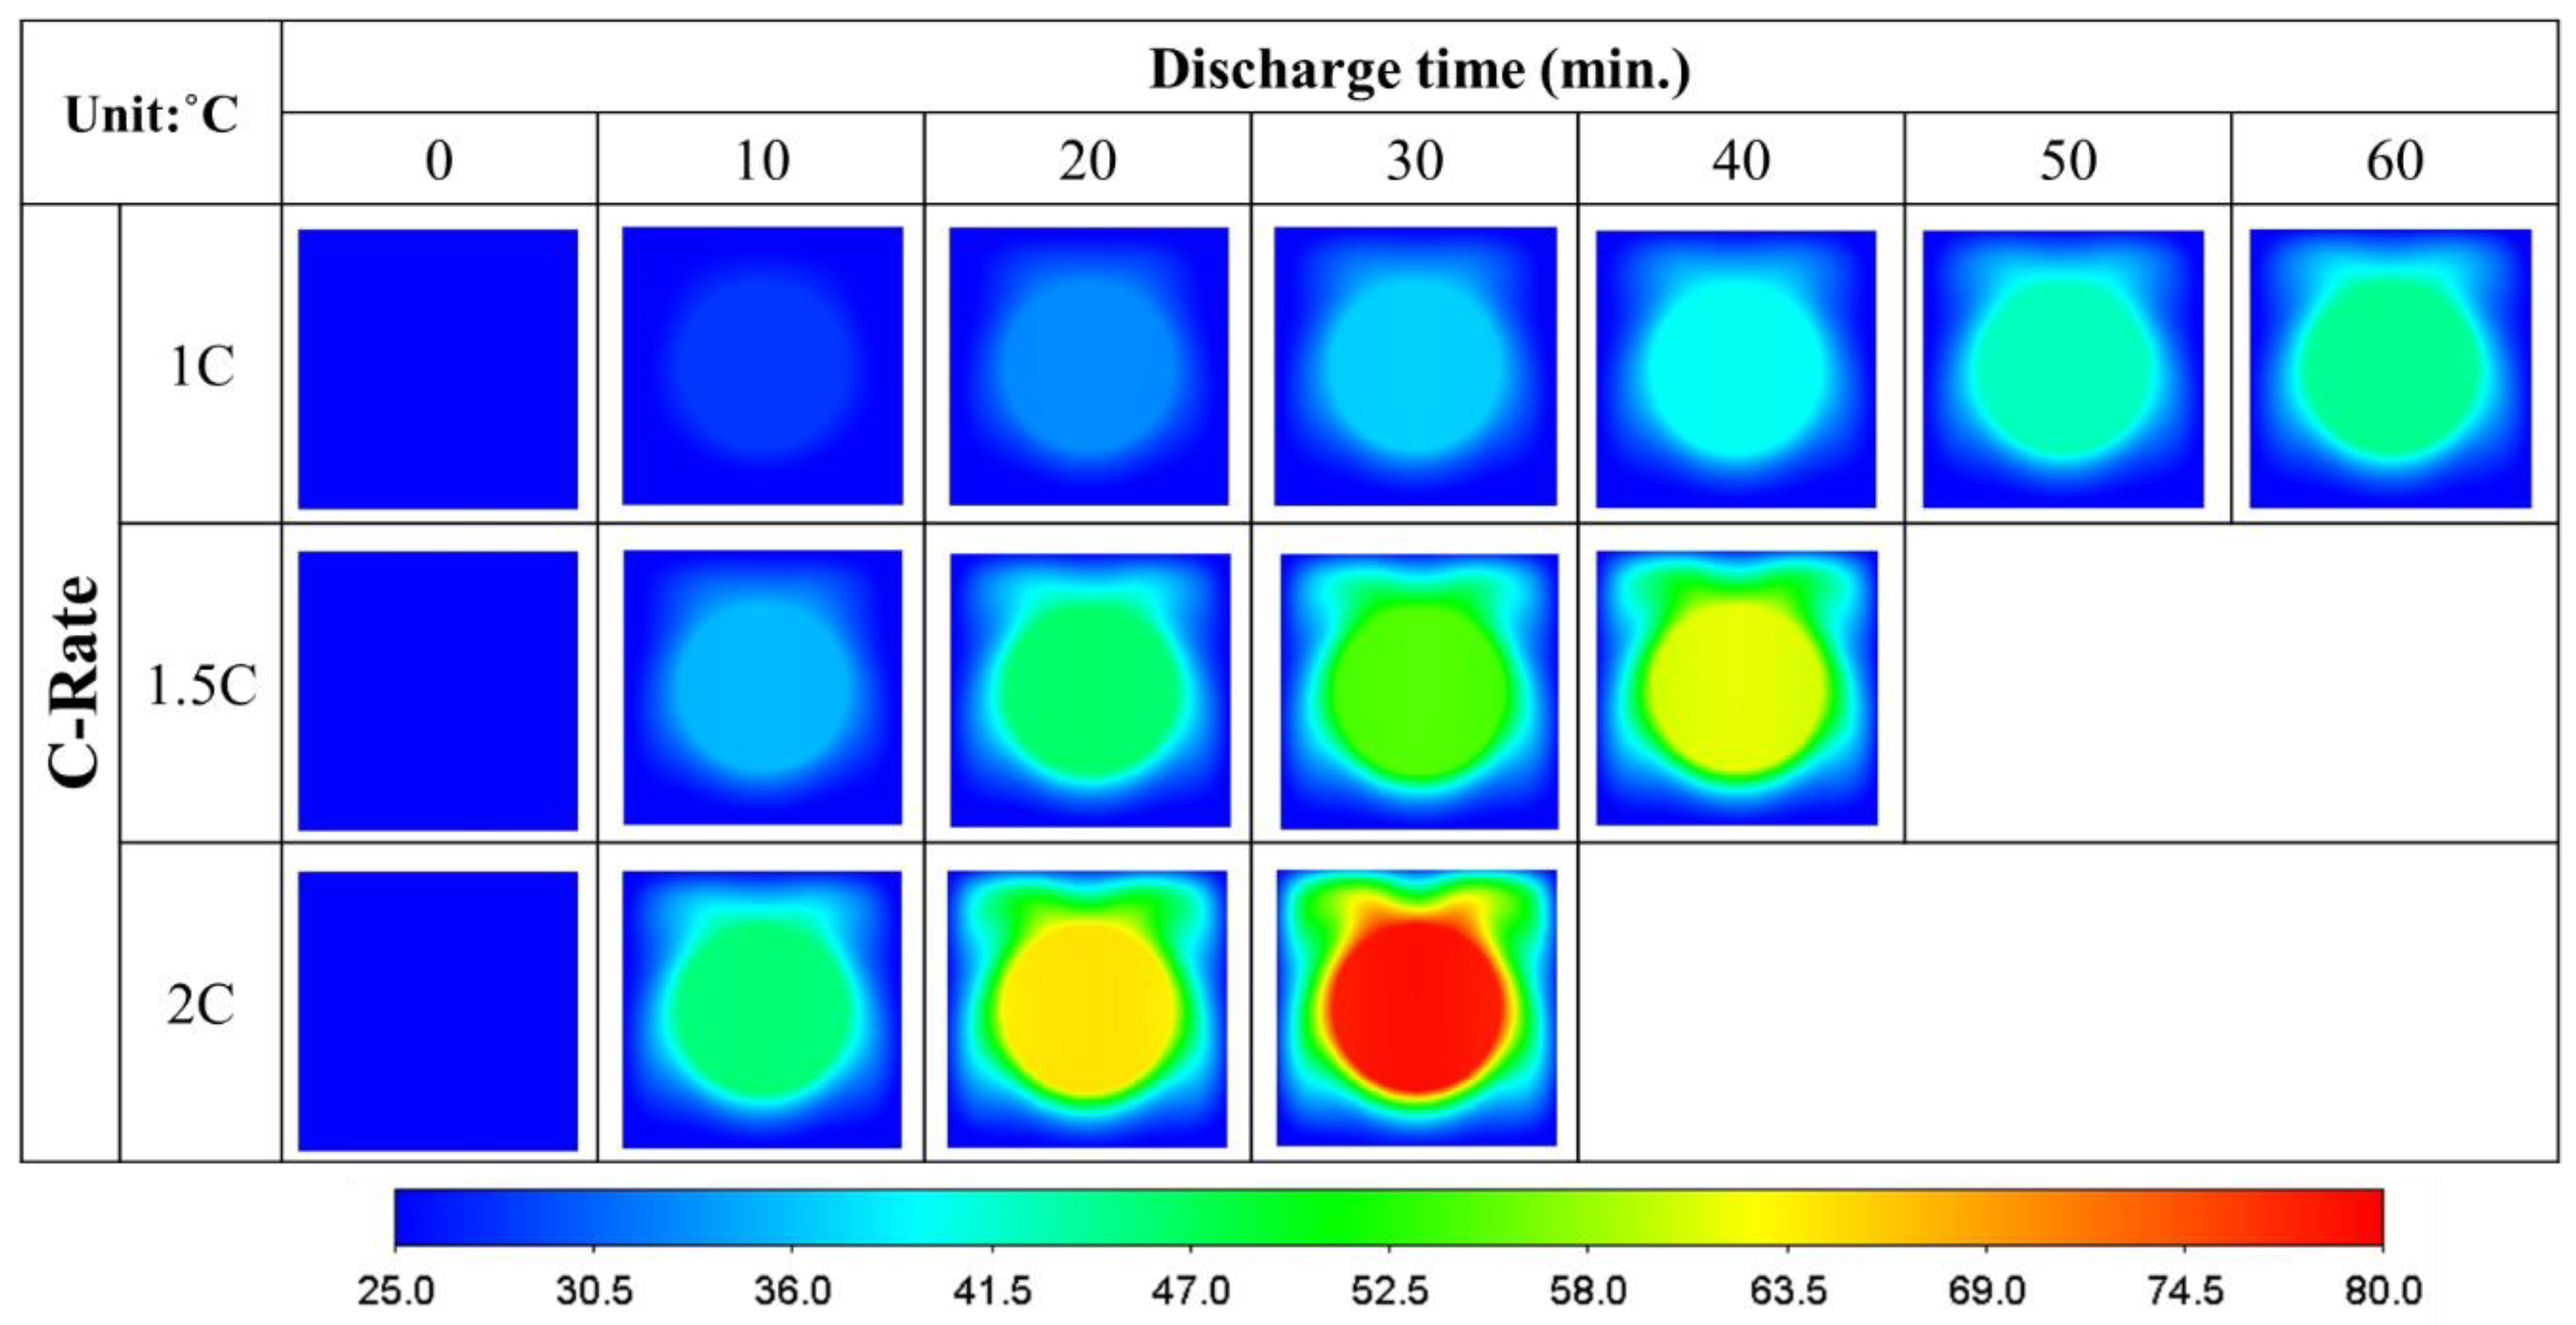
The heat generation rate of a battery increases with its discharge intensity. This eventually results in varying degrees of overall temperature rise for the battery pack. By employing air as the cooling medium for a horizontally placed battery, the temperature distributions on the midplane of the model are shown in Figure 4. When the battery discharges at 1C, the maximum temperature on its central cross-section gradually rises from a uniform 25 °C at the start of the discharge (DoD = 0%) to 45 °C at 60 min (i.e., when the discharge process stops corresponding to DoD = 100%). At a discharge rate of 1.5C, this maximum temperature rises from 60 °C, and it increases to 80 °C for a 2C discharge. During the first 10 minutes of a 1.5C discharge, heat is generated and subsequently conducted to the air surrounding the battery. At 20 min, as more heat is transferred from the battery to its surroundings, there is a gradual outward spread of thermal energy around the battery. The heated air generates thermal buoyancy, ultimately forming a thermal plume at the top of the battery. The top cover of the battery casing restricts the plume from developing further upward and forces the heated air to flow horizontally. In the vicinity of the upper corners of the casing, two distinct plumes are formed. The 25 °C external air cools the aluminum casing through natural convection, thus cooling the high-temperature air inside the casing indirectly. Inside the casing, the air flows downwards along the vertical casing walls, as its temperature continuously decreases. As the battery continues to discharge, the cooler air beneath the battery is repeatedly heated by the battery. This helps the formation of two distinctive convective cells. Even if the casing is subjected to external natural convective cooling, this heat transfer mechanism is incapable of effectively dissipating the heat from the battery. As a result, the temperature of the battery itself gradually increases throughout the entire discharge process. This phenomenon becomes more pronounced at higher discharge intensities. When the battery discharges and releases heat, the air immediately nearby the hot battery surface flows upwards, owing to the decrease in its local density. This form of heat transfer is absent in the area below the battery. Therefore, the air temperature beneath the battery is relatively lower than that above the battery, leading to an uneven temperature distribution throughout the entire battery pack.
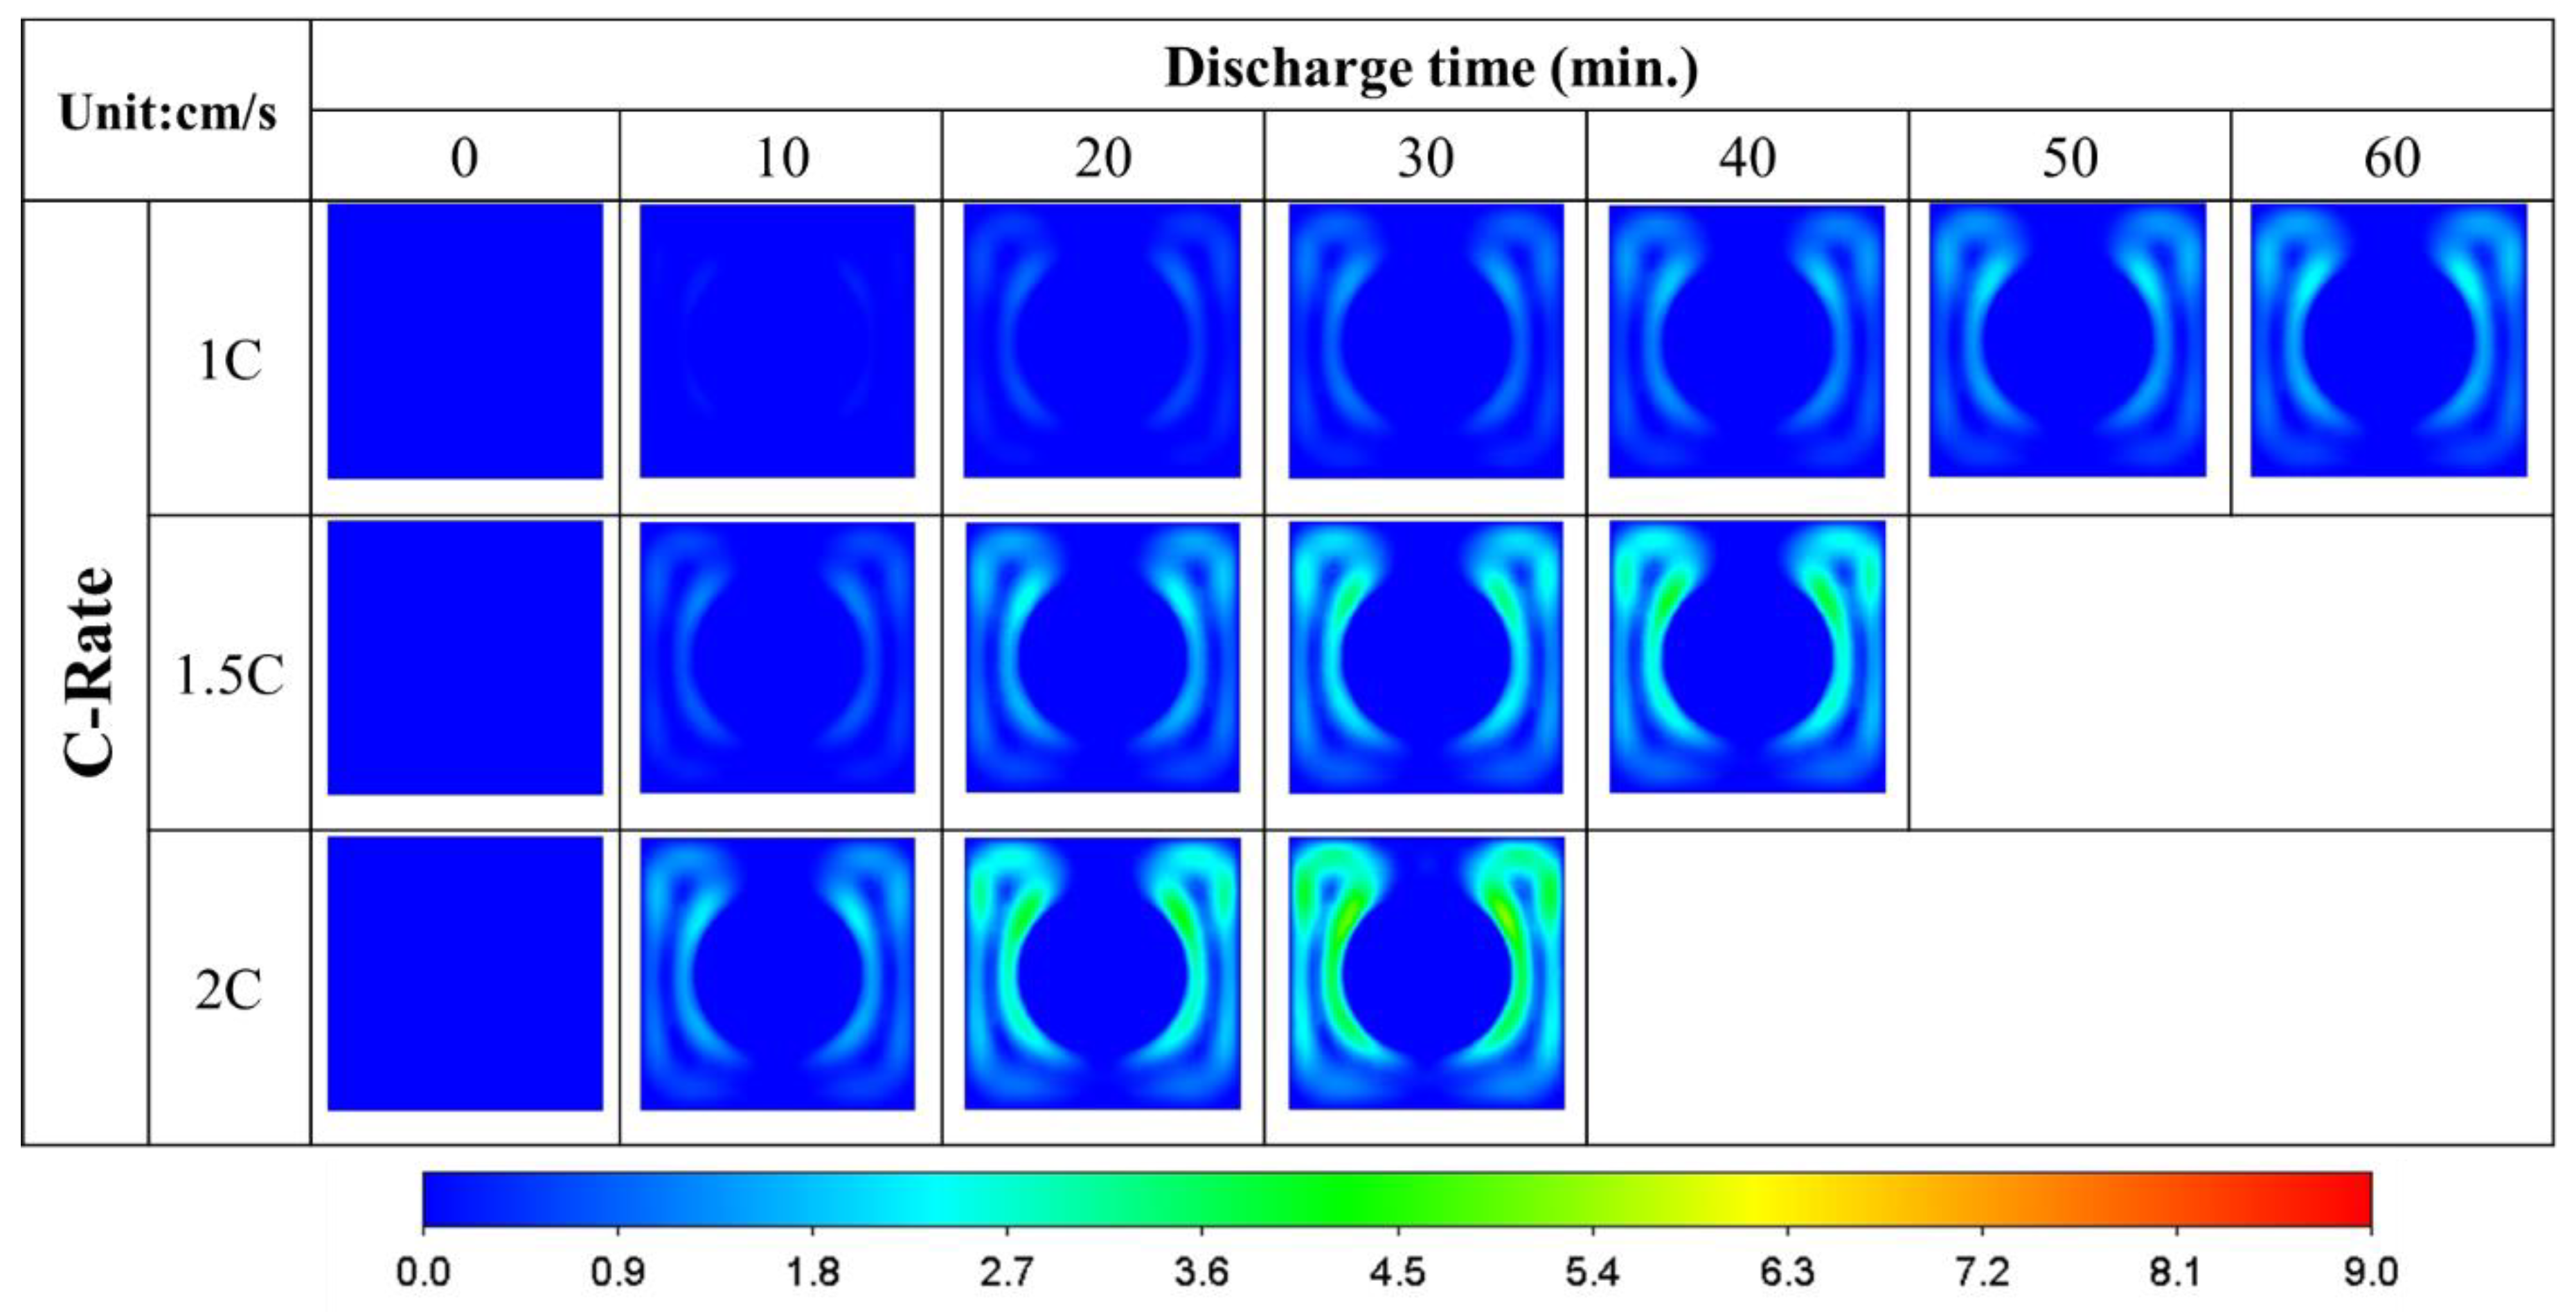
The air velocity distributions in Figure 5 help to explain part of the reasons causing the temperature fields shown in Figure 4 by showing that when the air is heated, the thermal buoyancy effect causes it to rise along the horizontal battery surface. Upon reaching the top cover of the casing, it flows to the upper corners. After being cooled through external natural convection, the air continues to flow down along the casing side walls. At a discharge rate of 1C, the air velocity around the battery increases from 0.5 cm/s at 10 min to 2.5 cm/s at 60 min (i.e., DoD = 100%). If the discharge rate is increased to 1.5C, the air velocity increases to 3 cm/s at 40 minutes (i.e., DoD = 100%). Further increasing the discharge rate to 2C may double the air velocity to 6 cm/s in just 30 min (i.e., DoD = 100%). As the battery discharge intensity increases, the overall heat generation within the battery pack also increases, leading to enhanced thermal buoyancy effects, which accelerate the speed of the rising air inside the battery pack.
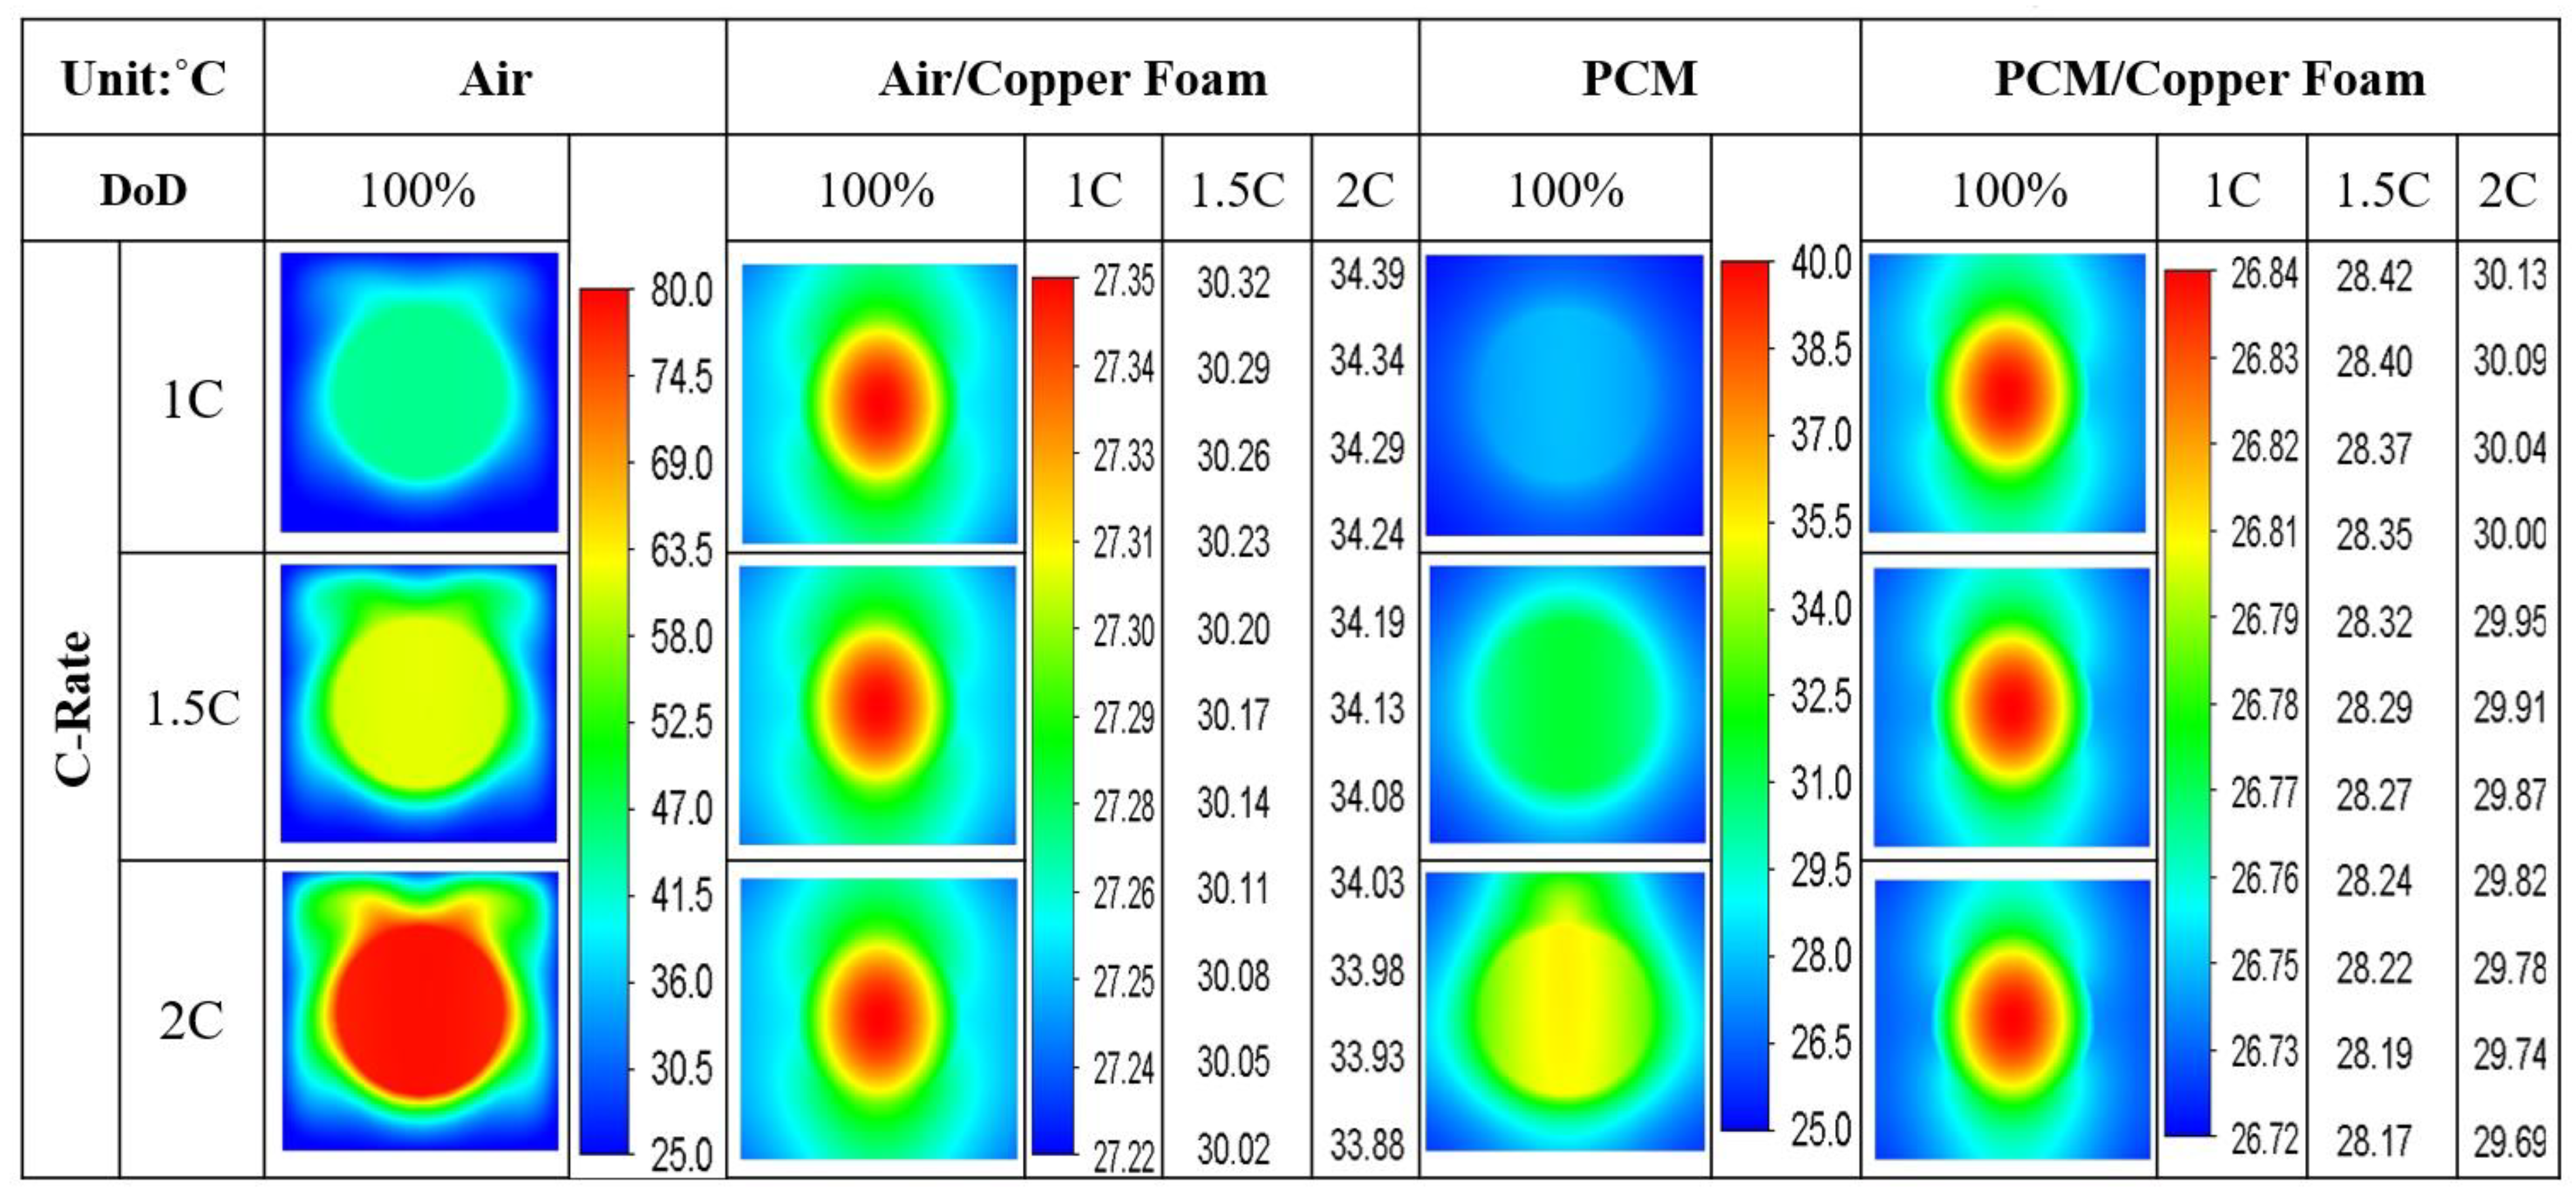
Figure 6 compares the effects of using different mediums to cool the single horizontal battery. When the space in the pack is filled with copper foam that is saturated with air, the porous structure efficiently conducts heat released from the battery to various parts of the battery pack, and ultimately to the casing. Through natural convection outside the casing, the overall battery pack manages to cool down quickly. The maximum battery temperature drops significantly from 80 °C to approximately 35 °C. Cooling with only PCM filling medium results in a maximum temperature of 35.5 °C. If the PCM combines with copper foam, this maximum temperature can be further reduced to 30.1 °C. By adding copper foam to the battery pack, heat can be conducted more effectively. This proves that the installation of copper foam ensures a more even distribution of temperature within the battery pack and allows the battery to operate at a good working temperature.
Figure 7 shows the temperature variations within a single-battery pack if it is placed vertically. As the discharge rate increases, the temperature difference between the highest and the lowest temperatures gradually increases when solely using air or PCM cooling. If air and PCMs are employed in conjunction with copper foam, the temperature difference is ensured to stay within a maximum of 0.5 °C. Comparing these two situations, the maximum temperature associated with using copper foam saturated with air is 4 °C higher than that associated with replacing air with a PCM. When the battery discharges and transfers heat to its surroundings, the copper foam serves to rapidly spread the heat in all directions within the battery pack, reaching the PCM further away from the battery. Once the PCM absorbs the heat energy, and its temperature reaches 25 °C, the absorbed heat is tremendously converted into the PCM latent heat. The overall battery temperature thus substantially decreases.
Regardless of the battery orientation, when heated pure air is influenced by thermal buoyancy, it carries heat along the battery surface and gradually rises, eventually encountering the casing walls, where it is cooled off. This creates a flow circulation. The PCM, on the other hand, is capable of absorbing sufficient heat energy from the battery and onsets its phase change process. The PCM also moves upwards due to thermal buoyancy and cools down through the casing walls, but its circulation effect is far less noticeable. Since the copper foam evenly occupies the space between the batteries, it efficiently conducts the heat generated during battery discharge to the casing, hence improving the heat dissipation efficiency of the system.

3.2. Unidirectional Four-Battery Model

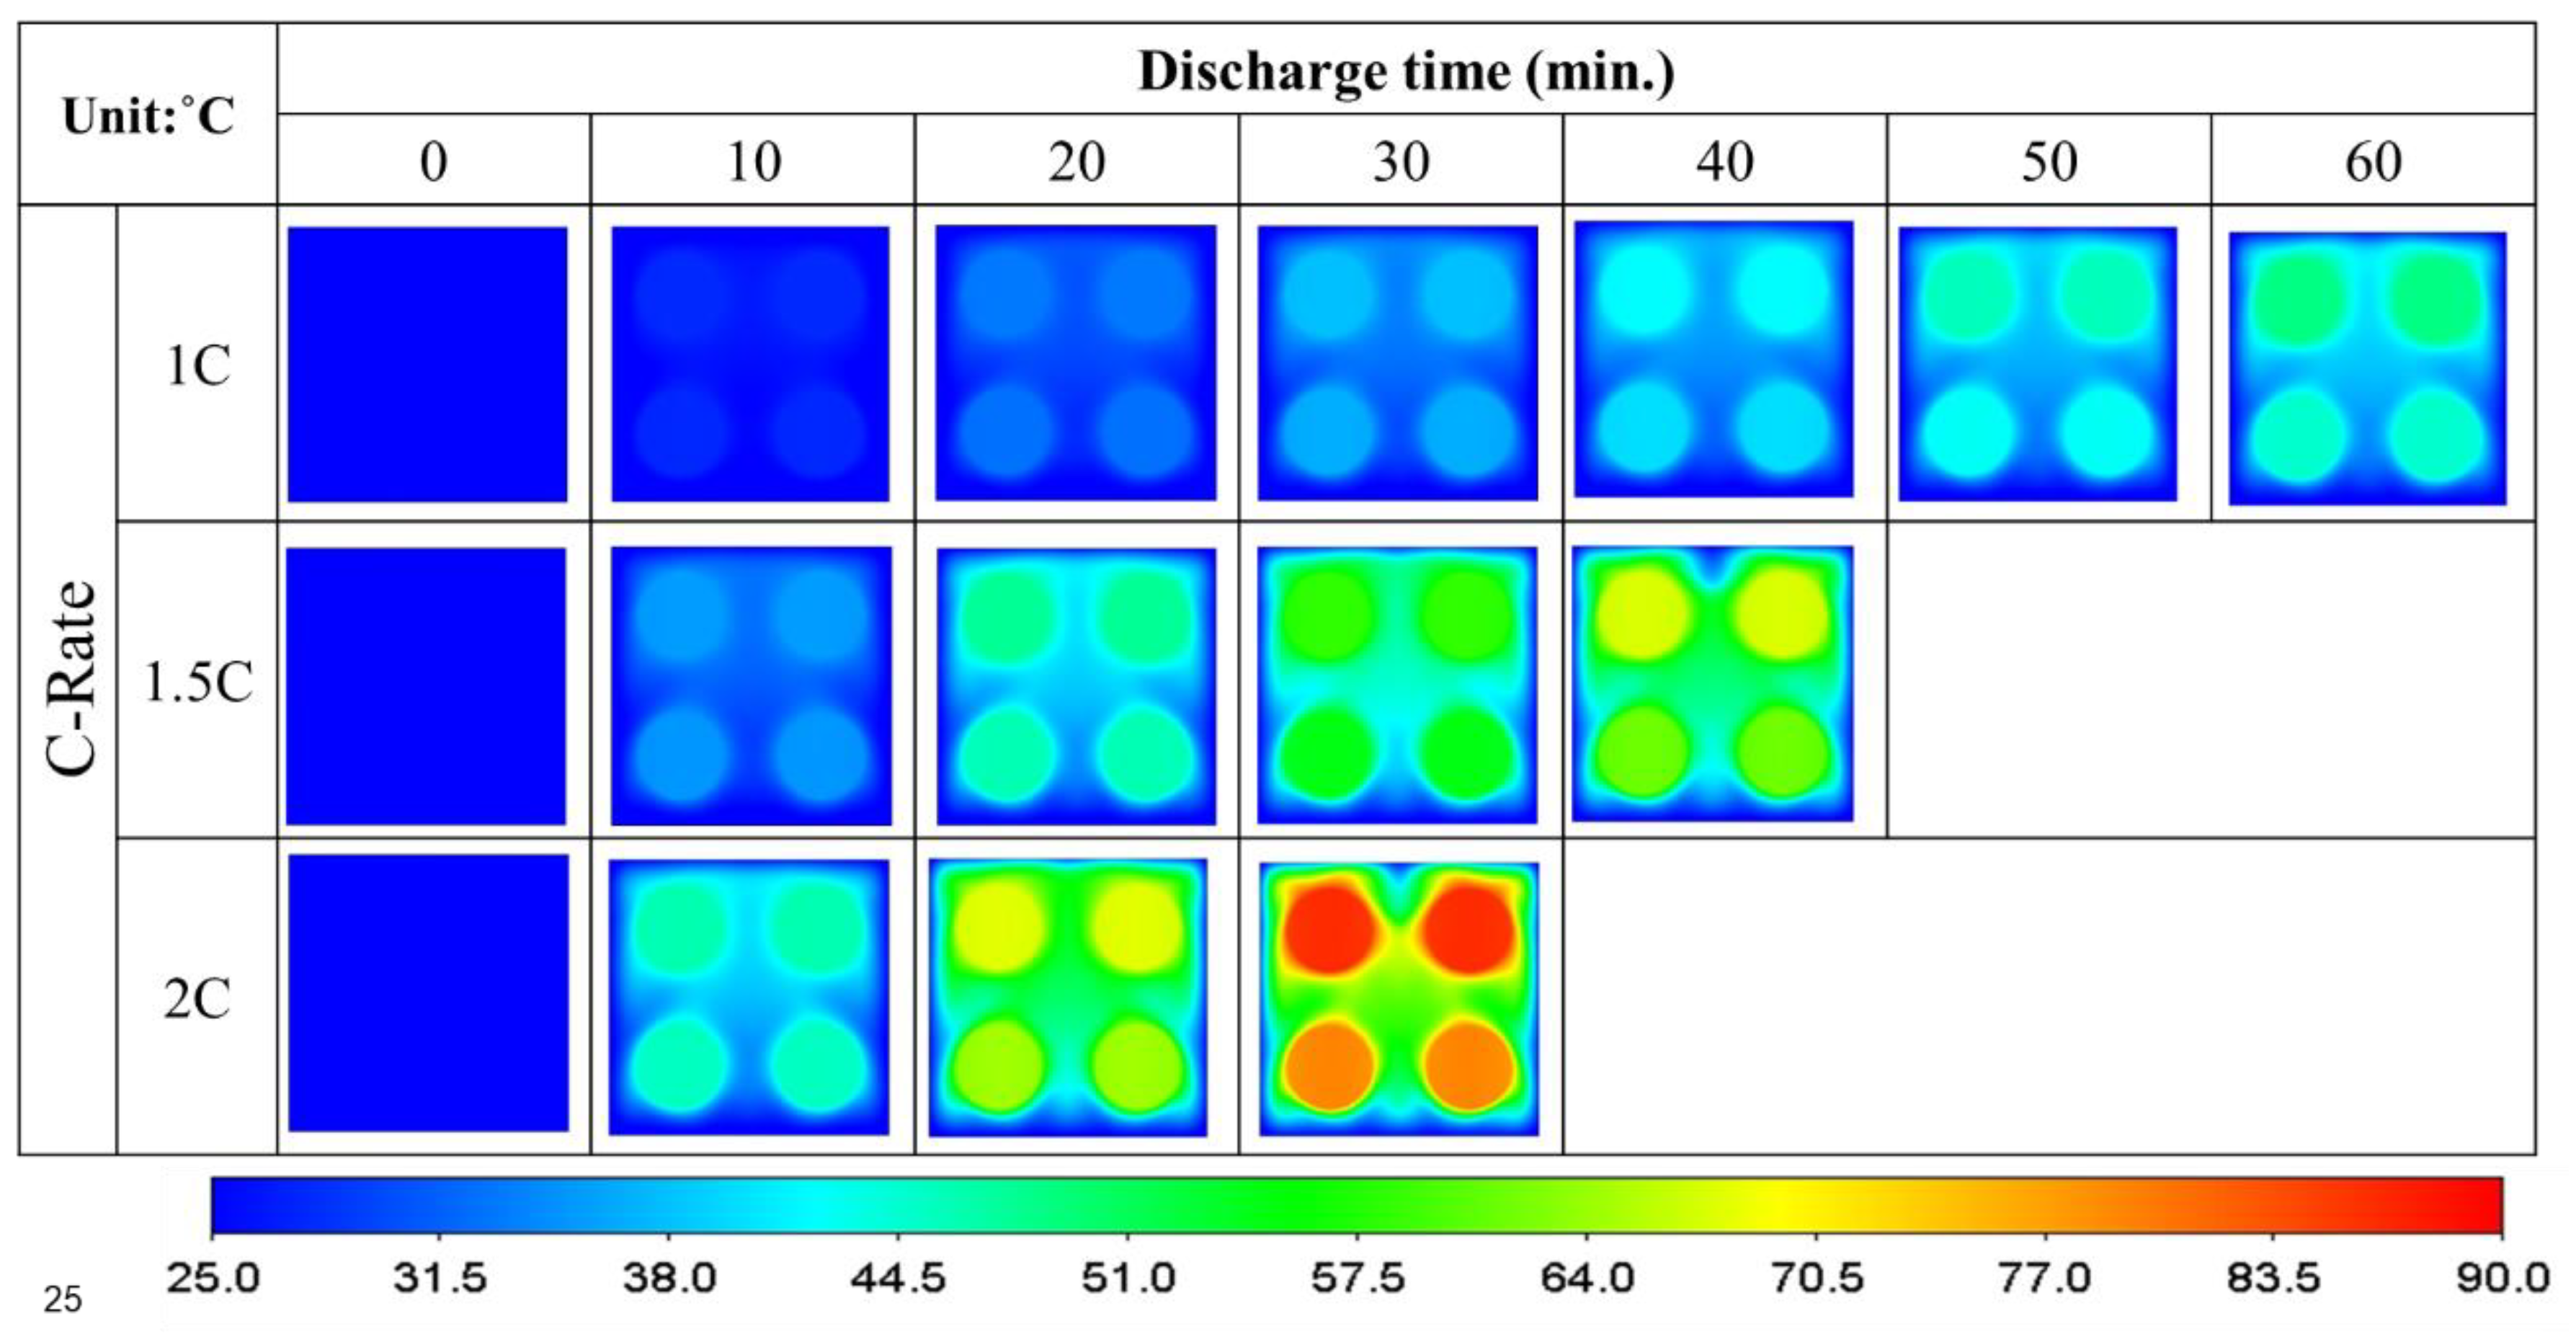
The term ‘unidirectional’ in this section aims to indicate that the four batteries are placed parallel with respect to each other. In a horizontally oriented two-layer unidirectional battery pack that is solely cooled through air, the maximum temperature of the upper-layer batteries gradually increases to 50 °C after being discharged at 1C for 60 min. However, it may reach 90 °C if the batteries are discharged for 30 min at a rate of 2C. The temperature distributions at the mid-plane of the battery pack is shown in Figure 8. There is clear evidence of heat-induced buoyancy in the air surrounding the batteries, particularly the convective currents above each battery. Unlike that of the single-battery pack demonstrated in Figure 4, the lower-layer batteries generate heat, and their presence causes a stronger upward airflow, covering the upper-layer batteries. As a matter of fact, this reduces the heat dissipation effectiveness of the upper-layer batteries and therefore increases their temperature by approximately 8 °C.
The temperature distributions on a vertical plane passing through the axes of two neighboring batteries are shown in Figure 9. It obviously suggests that a vertical orientation of the batteries results in their maximum temperatures of approximately 47 °C, 65 °C, and 80 °C, corresponding to discharge rates of 1C, 1.5C, and 2C. By comparing them with those shown in Figure 8, it is discovered that the maximum temperature difference between horizontally oriented batteries can be as high as roughly 8 °C, while that of those vertically oriented is less than 5 °C. Hence, vertical battery orientation is more advantageous for improving the overall battery temperature uniformity. This is because the air between two neighboring vertical batteries consistently experiences a significant increase in thermal buoyancy and thus a stronger convective effect due to battery surface heating. The greatest air velocity between the two batteries occurs at approximately half the height of the battery. This velocity reaches a maximum of 7 cm/s if the batteries are discharged at a rate of 2C. In comparison, the air between the vertical battery surface and the battery pack casing exhibits a lower local velocity owing to the additional cooling effect caused by the external cooling through the aluminum casing. For brevity, the figures of these less compelling flow patterns are not included in this article.
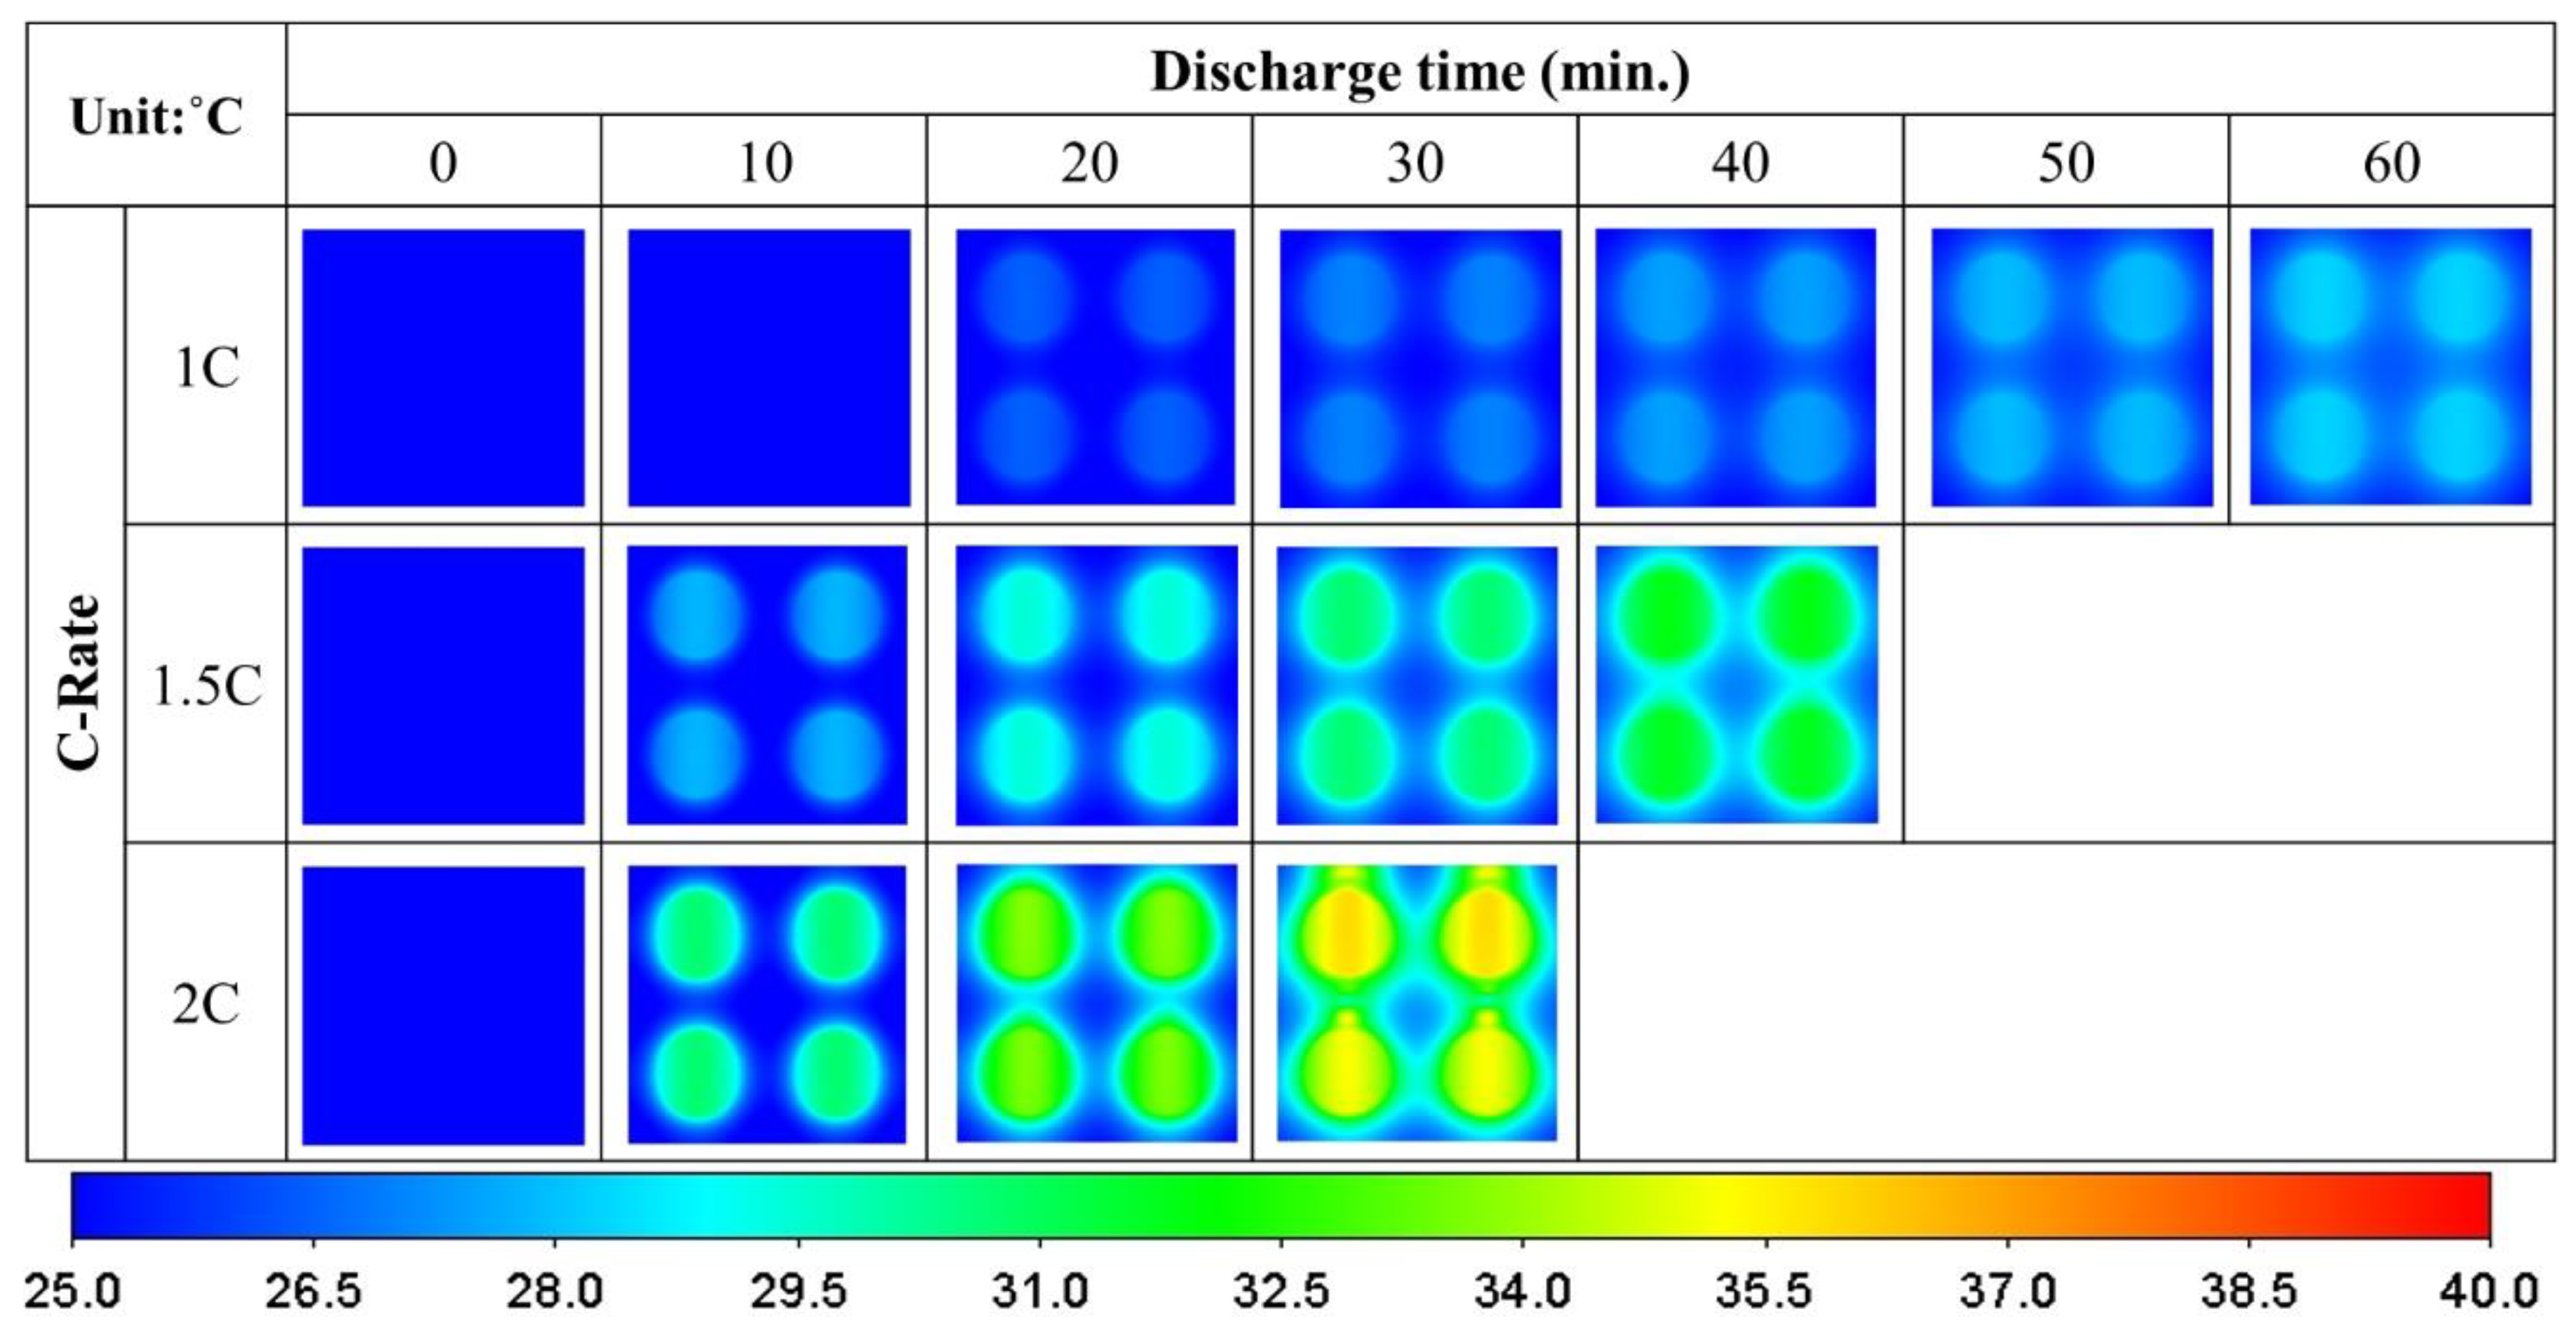
As displayed in Figure 10, all four horizontal batteries, enveloped by the PCM in the pack, experience a gradual temperature increase up to 28 °C after being discharged at 1C for 60 minutes. At this moment, the PCM only experiences a minor exchange of heat, and its phase change phenomenon only takes place in the close vicinity of the batteries. As the discharge intensity increases, the overall temperatures of the batteries begin to rise along with the amount of heat transferred to the PCM. The PCM surrounding the batteries dissipates heat radially outward, approaching the solid PCM located further away. When the batteries discharge their energy at a rate of 2C, the PCM absorbs a more significant amount of the heat the batteries generate. Not only does a higher degree of phase change occur in the battery pack, but the phase change phenomenon also extends to locations further from the battery surfaces. When the temperature of the PCM around the batteries is higher than 25 °C, it undergoes a phase change from solid to a paste-like state. Its new flowable state allows it to drift upwards along the surface of each battery and to form convective currents above the batteries. The velocity of the melted PCM close to the battery surfaces increases remarkably. The flowing PCM next to the lower-layer batteries carries heat upwards to the upper-layer batteries and causes a more noticeable temperature increase in the upper batteries. Based on current simulations, it is estimated that the temperature of the upper batteries may increase by at least 2 °C.
Compared to those associated to air cooling (Figure 8), the use of PCM ensures a more uniform temperature for each battery and also a smaller maximum temperature difference among these batteries. When the local PCM temperature reaches its threshold value, it transitions into a paste-like state that is substantially more viscous than air. The heat from the two lower-layer batteries primarily transfers to the PCM through a heat conduction mechanism, but the flowing PCM does exert a small impact on the temperature of the upper-layer batteries.
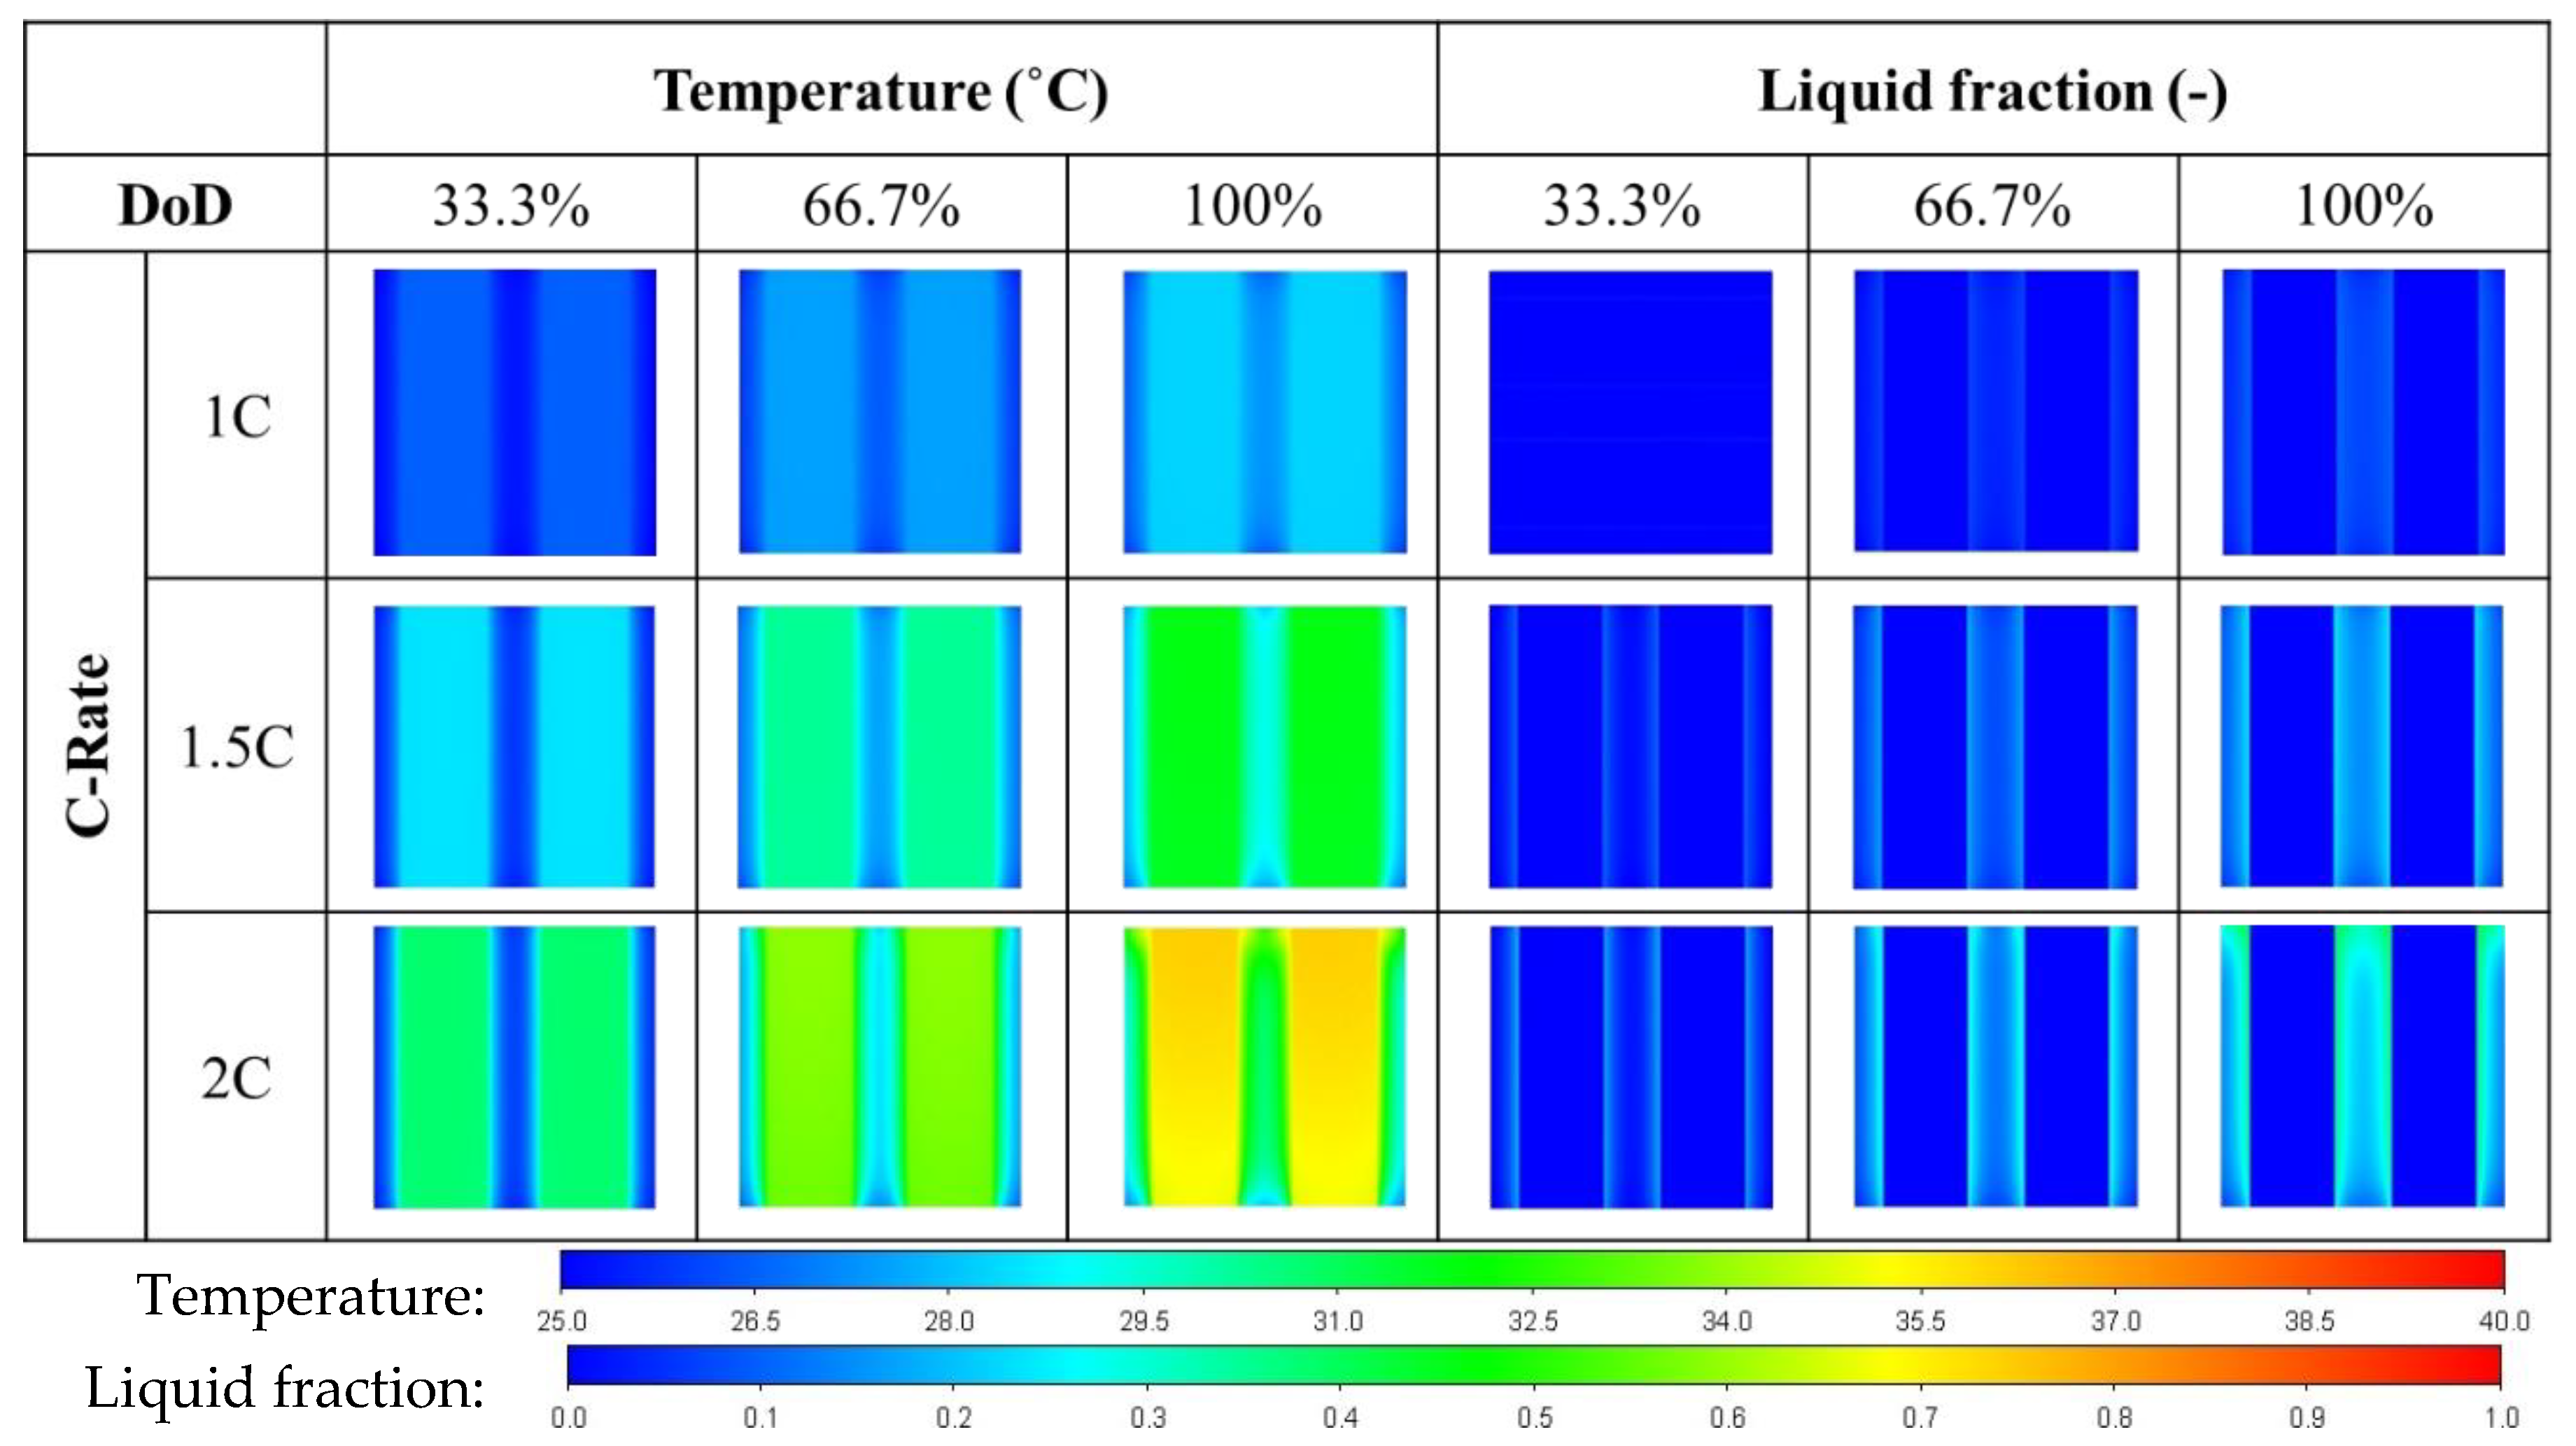
Figure 11 displays the temperature distributions when the battery pack is oriented vertically. Comparing Figure 10 and Figure 11, it is observed that the battery orientation has minimal effect on battery temperature difference if the batteries are cooled using the PCM. When discharged at the rates of 1C and 1.5C, less heat is generated in the batteries. This heat only causes a small and gradual temperature rise in the PCM, initiating a slow phase change process. Even after the discharge process has completed, the temperatures of the batteries remain comparatively uniform, as clearly shown in Figure 11. If the batteries undergo a 2C discharge process, the temperature at the top portion of the batteries is only slightly higher, by about 1 °C, and the heat energy accumulates beneath the aluminum casing cover due to the influence of external heat convection. The liquid fraction distributions of the PCM, also shown in Figure 11, prove that the higher heat energy generated during a 2C discharge prompts the PCM to onset its phase change process earlier. At the end of the discharge process, the PCM, whose liquid fraction corresponds to approximately 0.4, flows upwards at a velocity of 0.027 cm/s and gathers in the region below the casing cover, where heat dissipation is the most prominent.
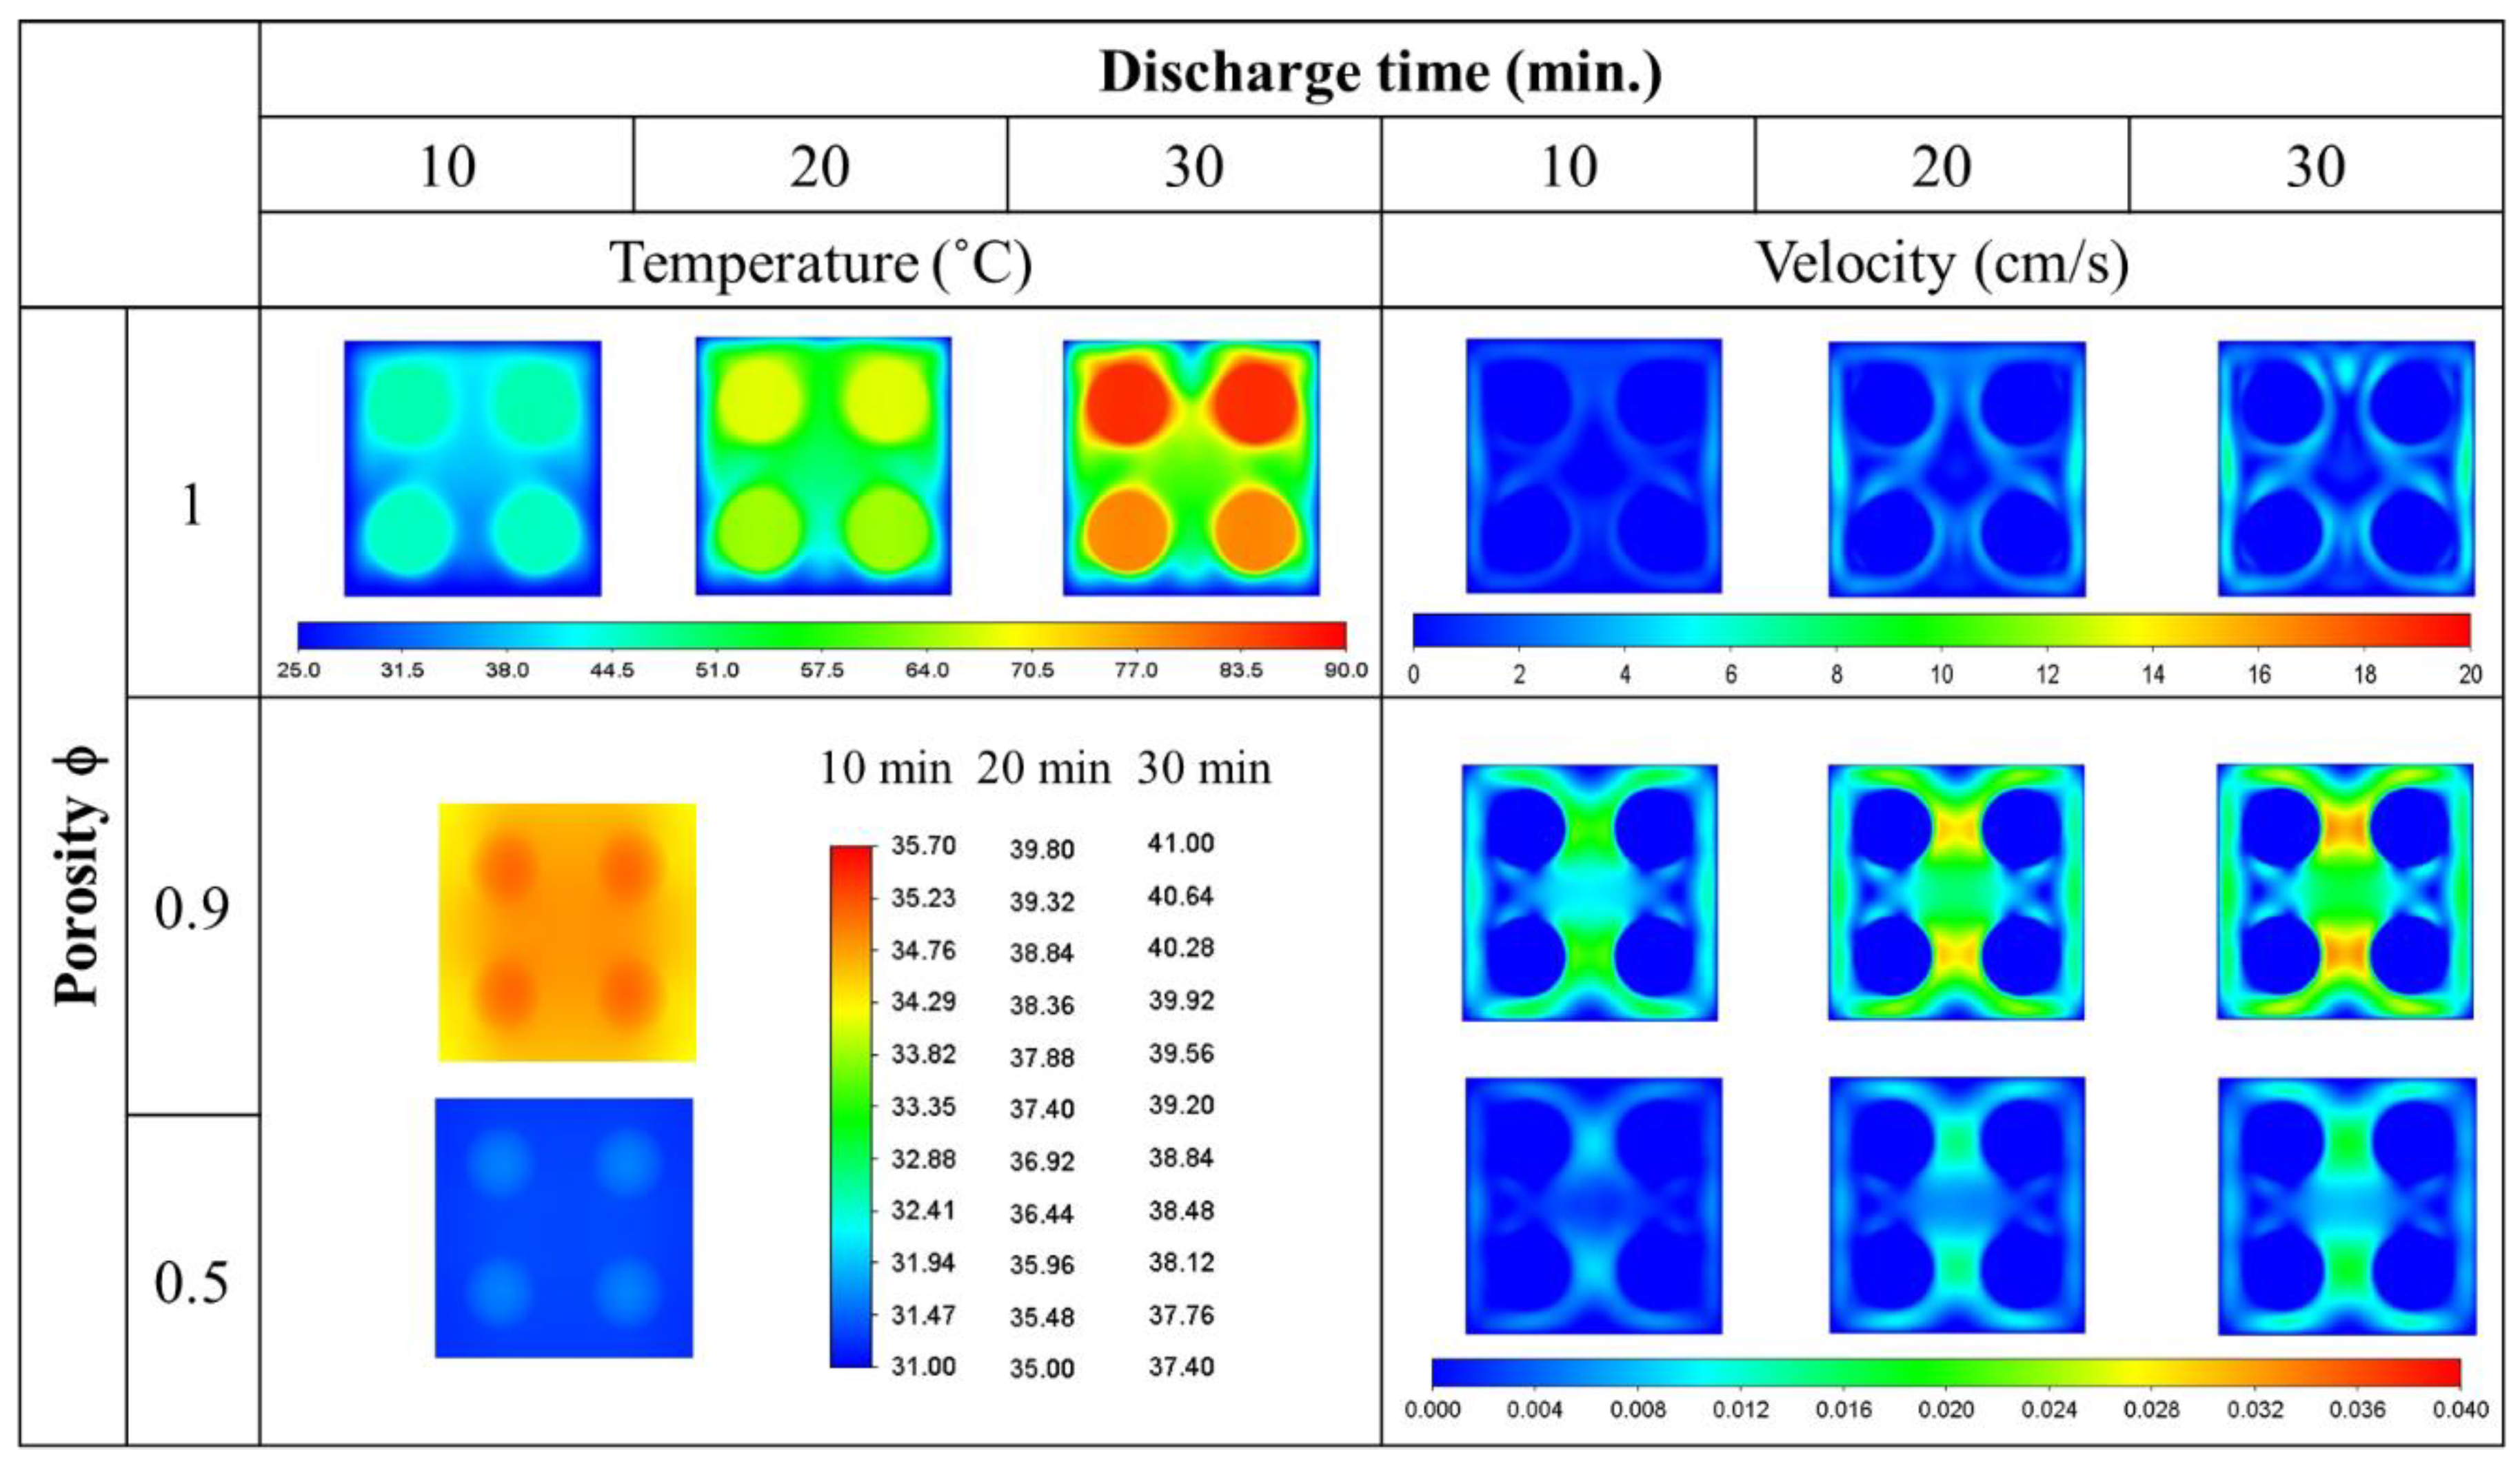
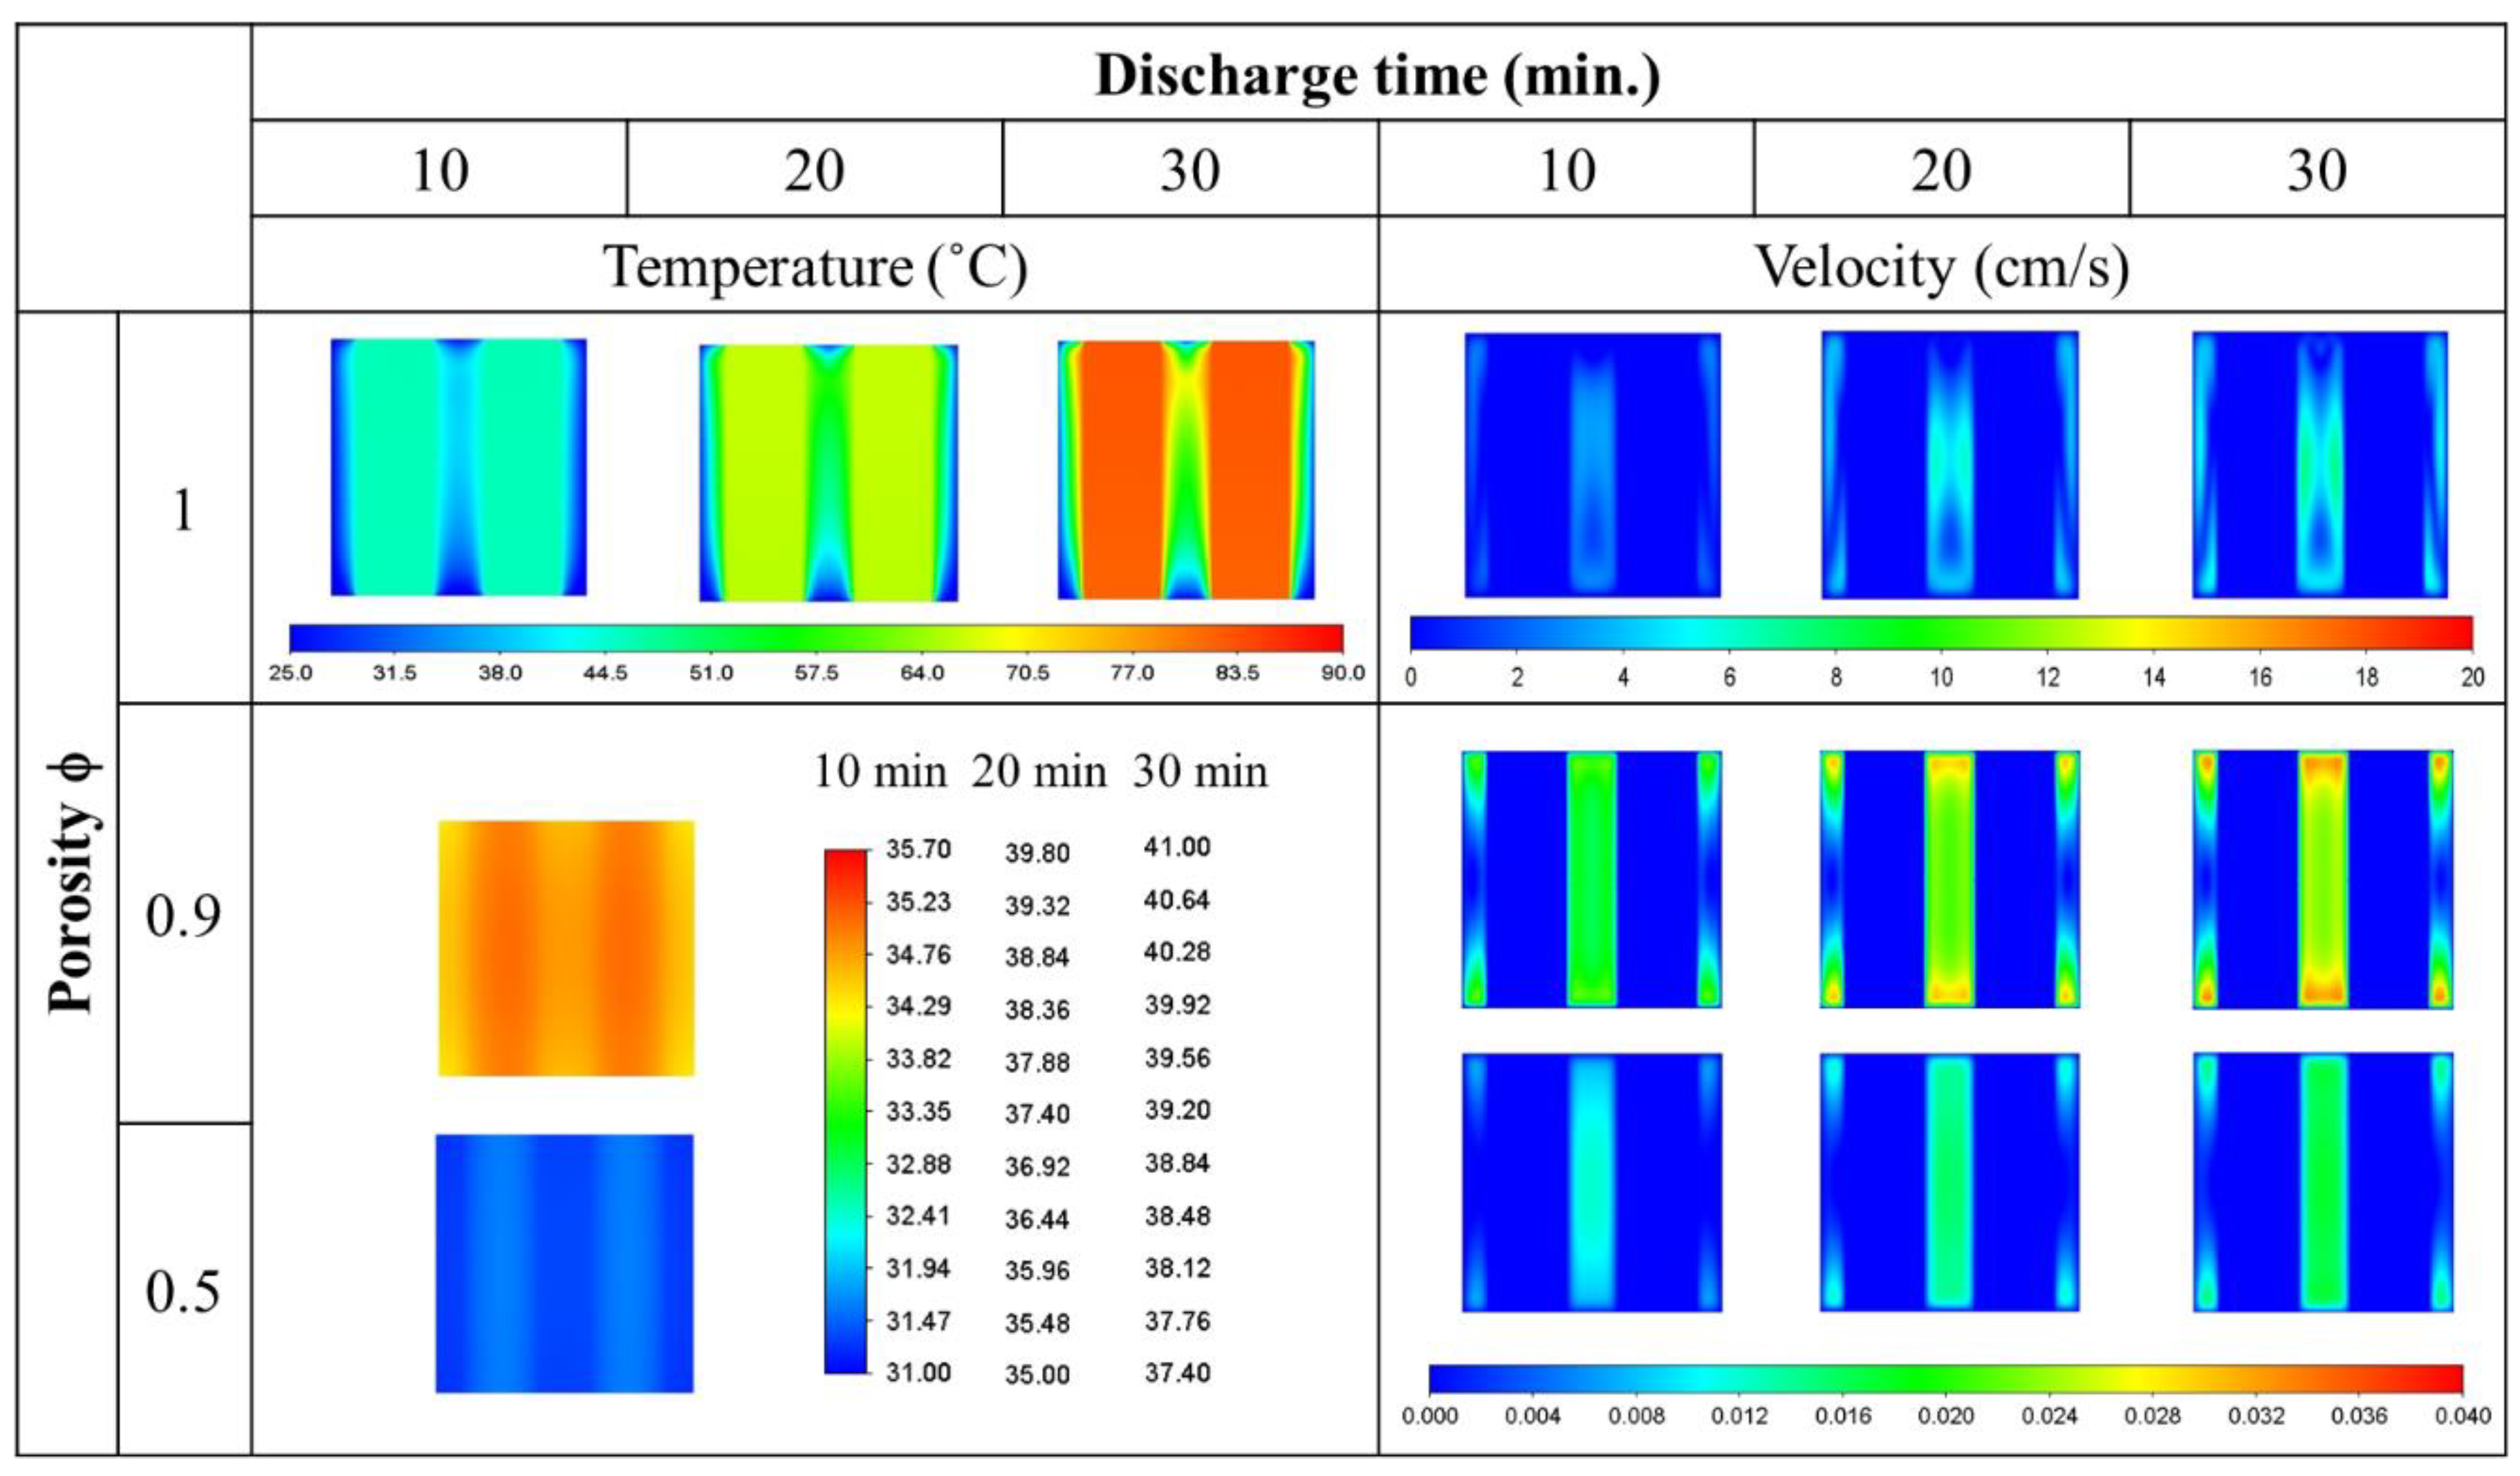
Figure 12 investigates the effect of adding copper foam into the space within the battery pack. If the batteries are enveloped by copper foam with a porosity of 1, this extreme setting essentially means that the volume of copper foam is zero. In other words, the foam is absent, and the battery is completely surrounded by the fluid the foam is saturated with. This figure shows that when the batteries are cooled solely by air (ϕ = 1.0), the temperature can reach up to 90 °C at a discharge rate of 2C. Due to the substantial amount of heat energy inside the battery pack, thermal buoyancy causes the air close to the batteries to flow at a maximum velocity of 7 cm/s. When copper foam saturated with air is fitted into the pack, the superior thermal conductivity of the copper foam serves to effectively distribute heat evenly within the porous structure, conduct the heat emitted by the battery to the casing, and yield a significant reduction in the overall temperature. Apparently, the most remarkable advantage of using copper foam in the battery pack is that the overall temperature distribution of the battery pack is more uniform compared to those cooled merely by pure air or PCMs.
Since the model with a porosity of 0.5 has four times more volume occupied by copper foam than the model with a porosity of 0.9, its heat conduction capability is undoubtedly better. The highest temperature of the battery pack using copper foam with a porosity of 0.5 is 38.4 °C. This is approximately 1.2 °C lower than that associated with a porosity of 0.9. Meanwhile, the permeability of the copper foam with a porosity of 0.9 is greater than that with a porosity of 0.5. The air flowing through the foam structure with a porosity of 0.9 reaches a maximum velocity of 0.036 cm/s. Since it is more spacious in the center of the battery pack, the local air velocity is relatively slower in this region. As the air gradually flows upwards from the center of the battery pack and enters the gap between the two upper-layer batteries, this actually leads to a maximum air velocity at the narrowest gap between the two upper-layer batteries.
Figure 13 shows the effects of copper foam on the temperature and velocity changes in the battery pack when the batteries are vertically oriented. In the case of pure air cooling, the temperature of the battery may rise beyond 80 °C. If copper foam is added to enhance heat conduction, the heat can be quickly dissipated and therefore decreases the overall temperature of the battery by more than 30 °C. As a matter of fact, the maximum temperature difference between the horizontally and vertically oriented batteries is very small. Since adding copper foam significantly increases the flow resistance within the space in the pack, thus reducing the magnitude of the flow field, the velocity distribution is more uniform than that corresponding to the absence of copper foam. Air velocities near the top and bottom of the battery are fastest within the pack, at approximately 0.036 cm/s.
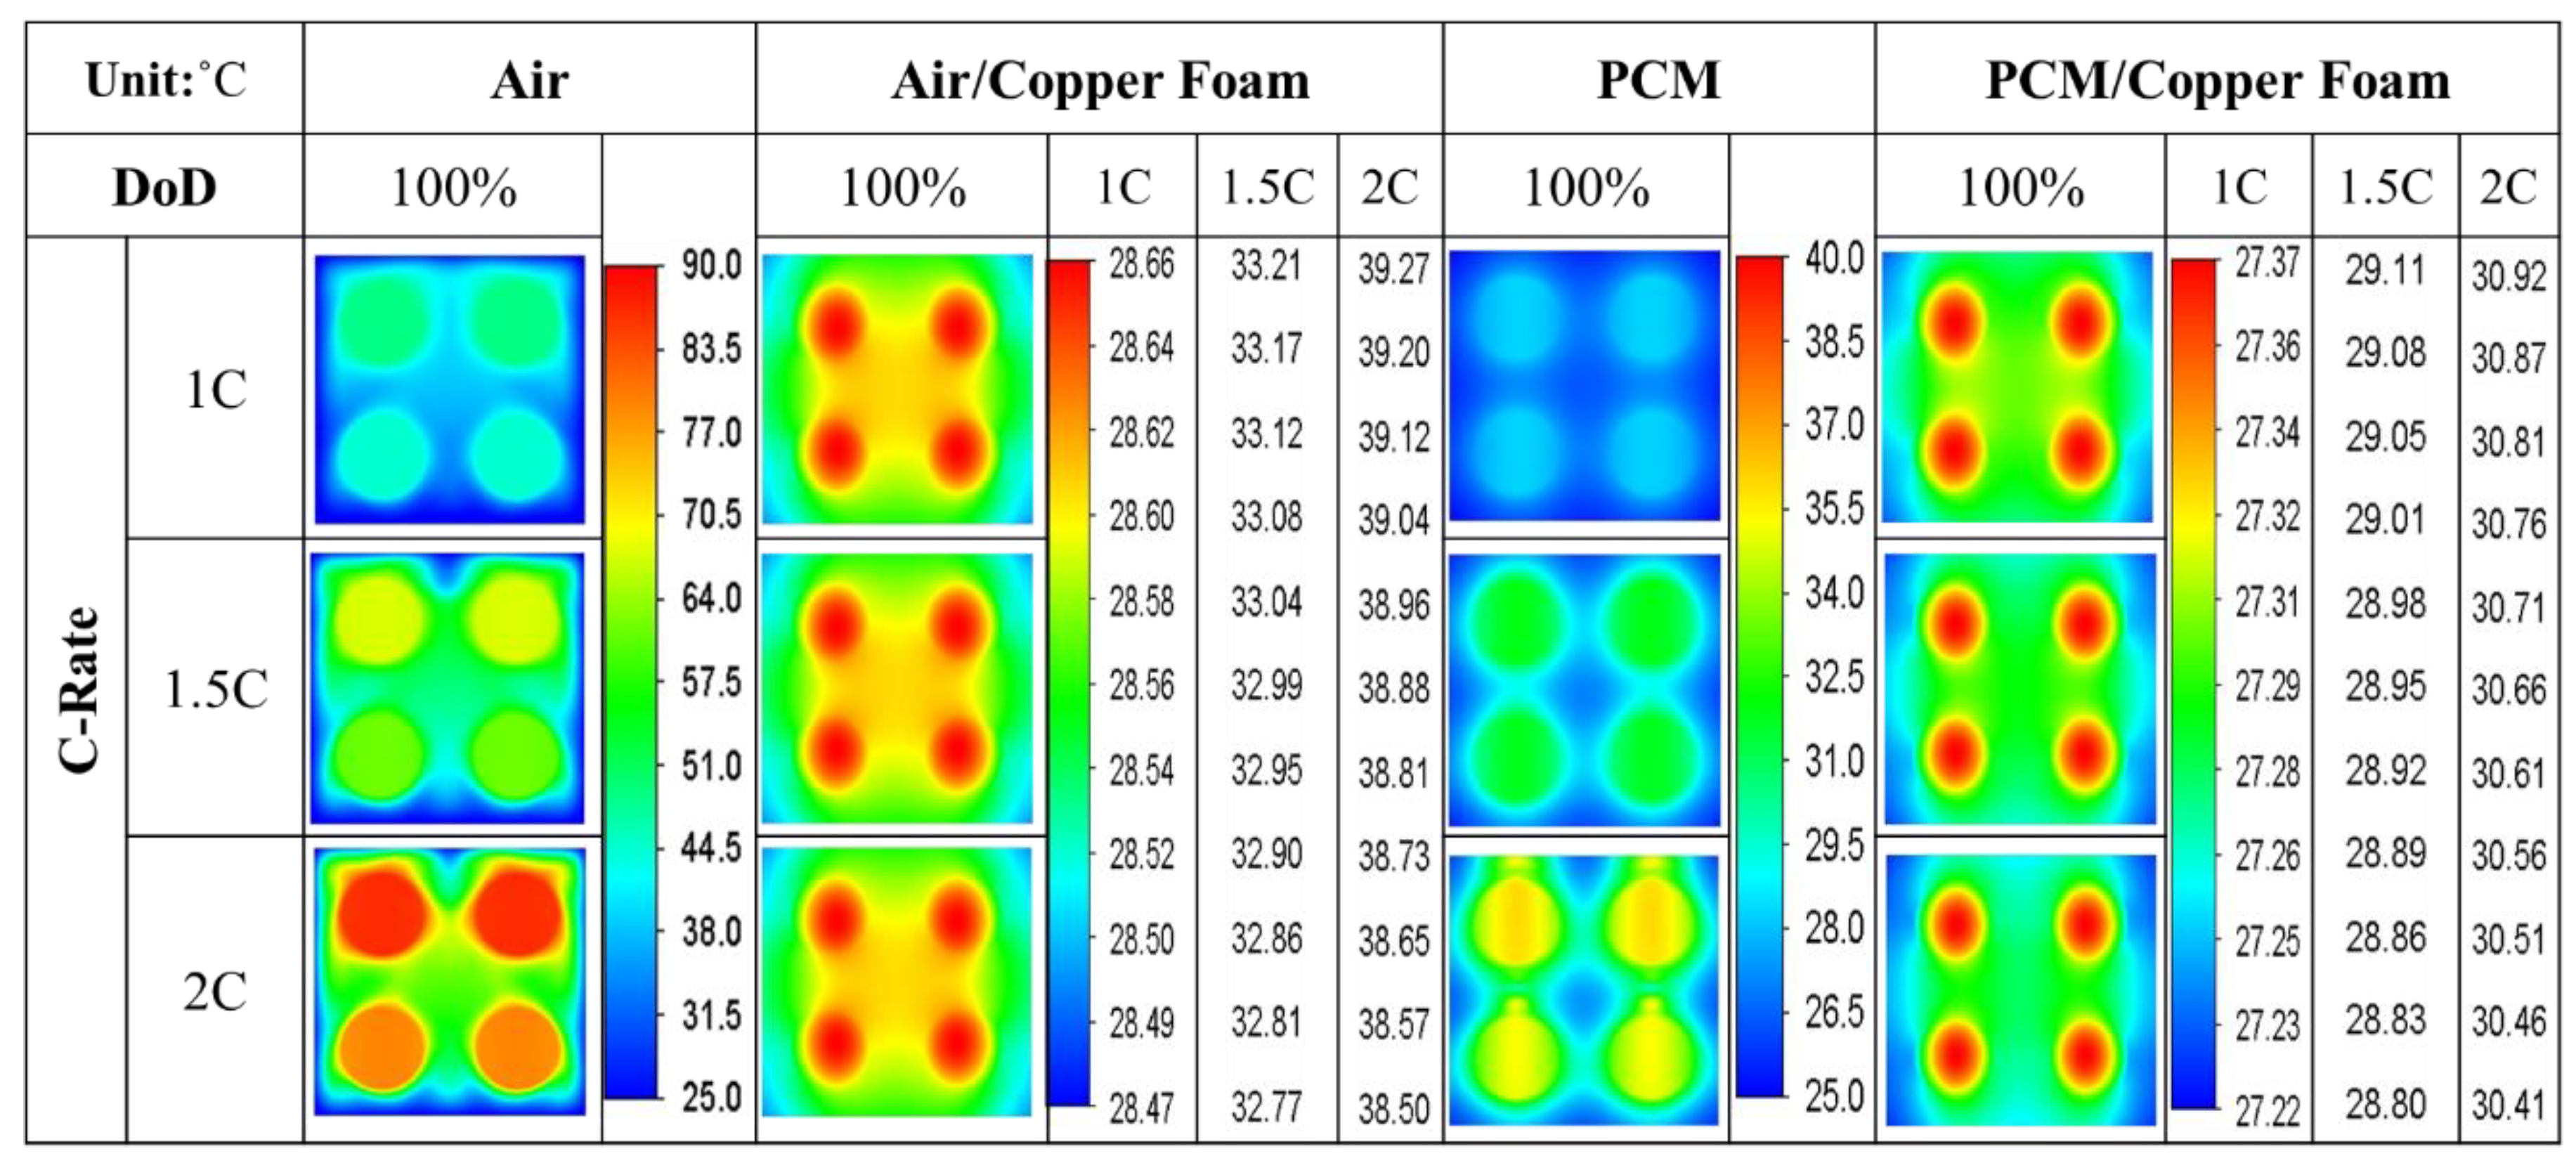
From Figure 14, it can be observed that when the battery relies solely on pure air cooling, the upward heat flow from the lower-layer batteries unavoidably reduces the heat dissipation efficiency of the upper-layer batteries, hence gradually increasing the maximum temperature of the upper-layer batteries. The temperature difference between the batteries increases with the battery discharge rate. At a discharge rate of 2C, the maximum temperature difference of the upper-layer batteries can be around 8 °C. This clearly exceedes the limit of 5 °C during actual battery pack operation, implying that using only air as the cooling medium is not ideal.
When the air is replaced by the PCM for battery cooling, due to the lower heat generation of the 1C discharged battery, the PCM receives less heat energy and barely flows. The temperature of each battery is uniform even when the discharge process terminates. If the battery discharges at 1.5C, the melting of the PCM becomes more obvious and the PCM flows slowly upwards along the battery surface. Although the PCM receives more heat at this battery discharge rate, the melting PCM flows so slowly that it is almost impossible to transfer heat to the PCM adjacent to the upper-layer batteries, as evidenced by visible thermal convection. At a 2C discharge rate, the battery generates enough heat to melt part of the PCM. The heat lowers the PCM viscosity significantly and makes it easy to flow locally. This upward flowing PCM is capable of transferring a considerable amount of heat to the PCM adjacent to the upper-layer batteries, indicating that using a PCM as a battery cooling mechanism can effectively reduce the maximum battery temperature.
When a copper foam is saturated with pure air or PCM and is used to cool the batteries, it can both effectively lower the temperature of the battery pack and keep the maximum temperature difference between batteries within 5 °C. Between the air and the PCM, the one saturated with the PCM yields lower battery temperatures. This is because copper foam conducts the heat from the batteries to various parts of the PCM within the battery pack, and the PCM absorbs a large amount of heat through its latent heat characteristic. It was found that adding copper foam with PCM to the battery pack can further reduce the maximum temperature of the batteries by at least 8 °C.
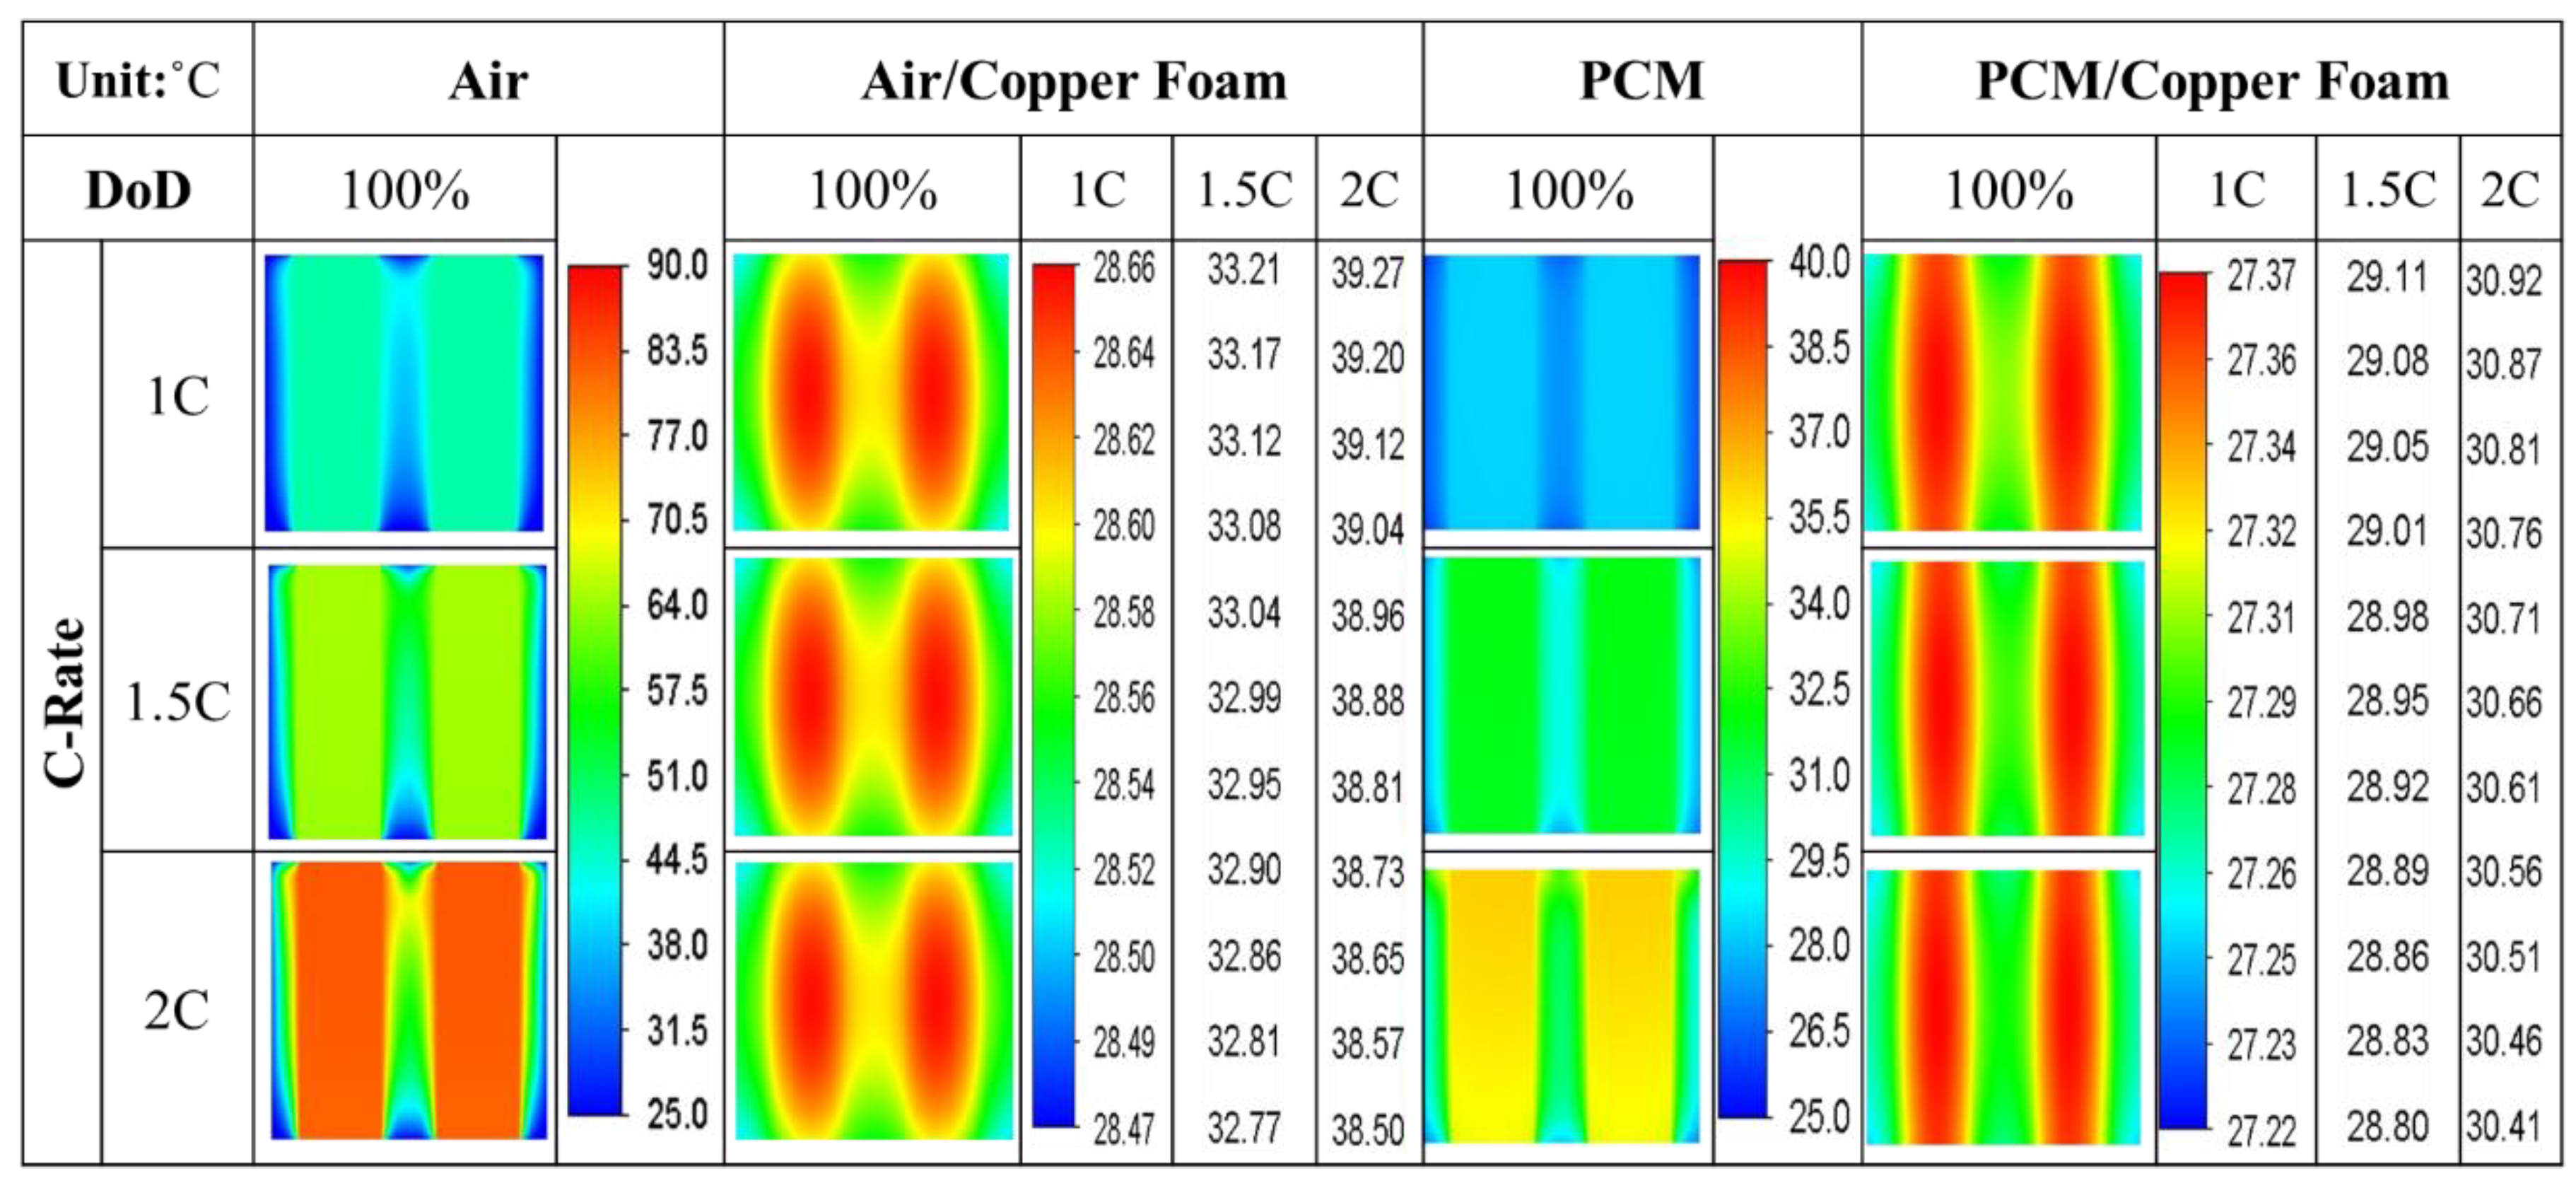
The cooling mechanism for the batteries using pure air depends on the convective air circulation. There is almost no significant temperature difference observed throughout the entire array of batteries oriented vertically, as shown in Figure 15. When PCM is used, the PCM temperature rises above 25 °C after absorbing the heat that the batteries generate, and then flows towards the top, approaching the casing cover. When the space is filled with copper foam saturated with air, the heat generated during battery discharge tends to accumulate between the batteries and is not easily dissipated. If the foam is saturated with PCM, on the other hand, the foam allows the PCM to absorb the heat energy effectively and to reduce the temperature between the batteries efficiently.

3.3. Crossover Four-Battery Model

So far, it has been observed that the heat generated by the bottom-layer batteries significantly increases the temperature of the upper-layer batteries, leading to the broadening of temperature differences between the batteries. In this section, two of the batteries in the same layer are rotated by 90°. This arrangement is hereby referred to as the ‘crossover’ model in this paper. The following paragraphs compare the performance of battery packs with unidirectional and crossover arrangements at different discharge intensities.
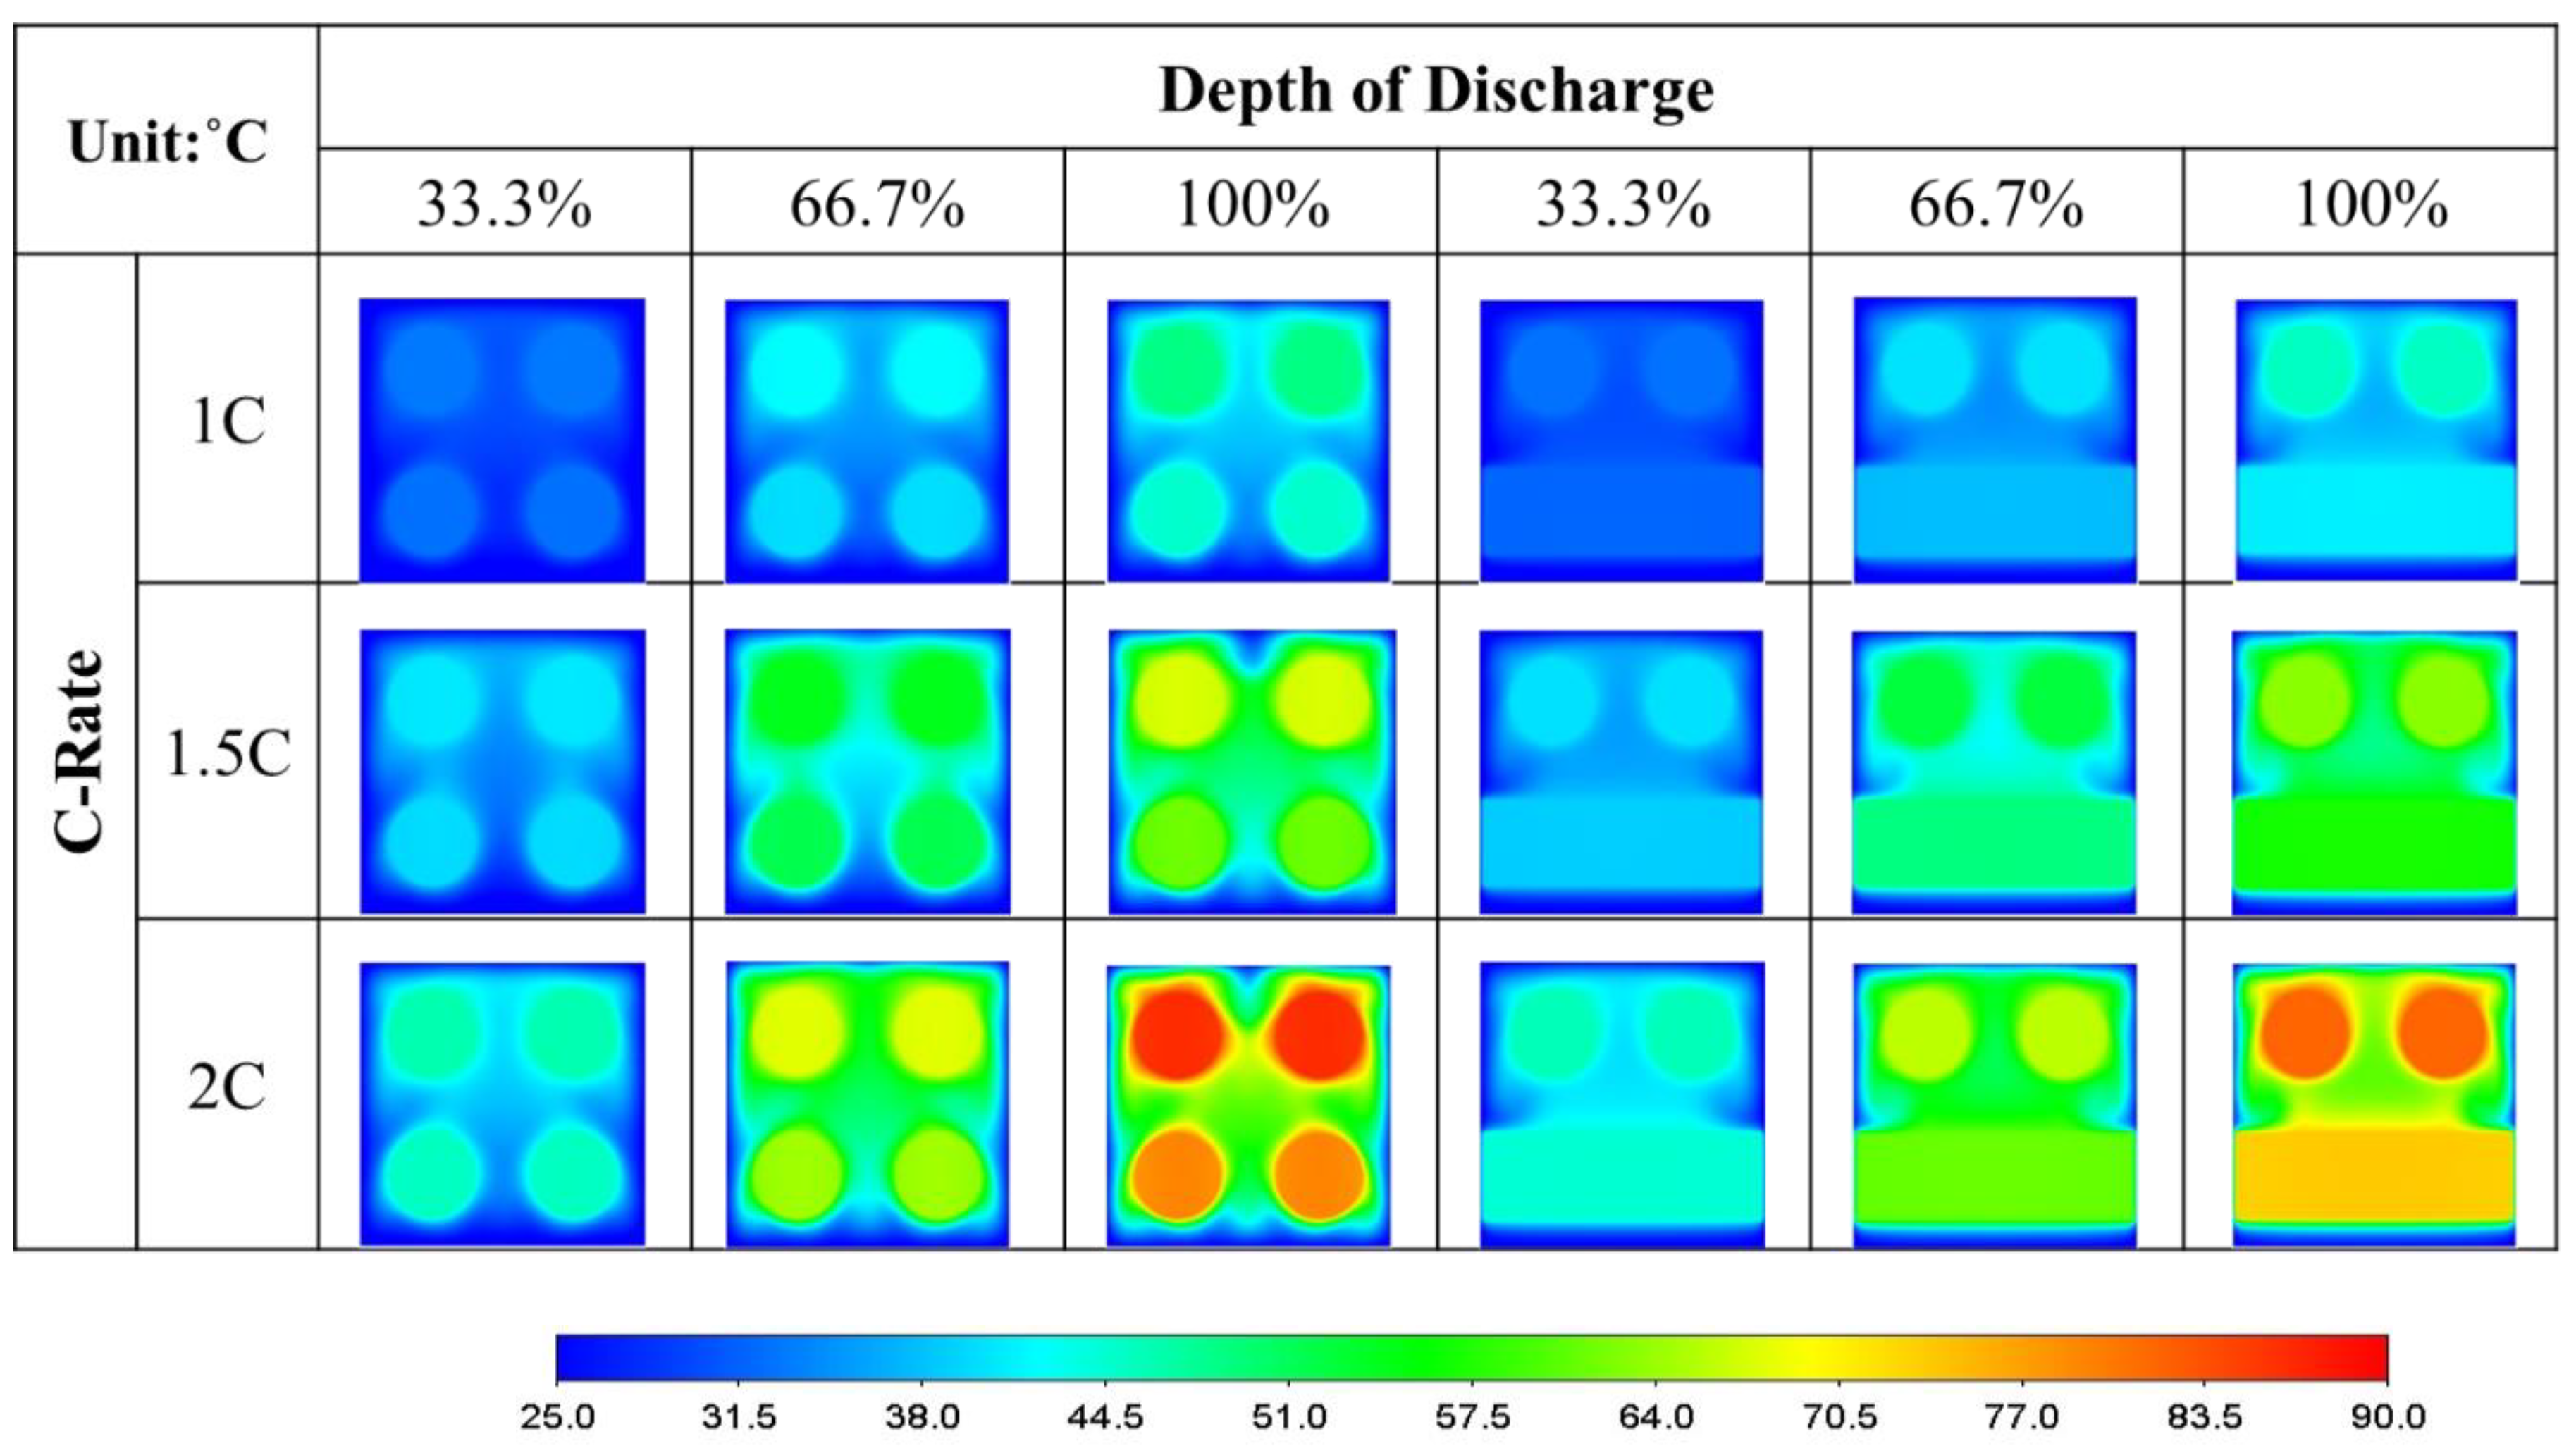
Figure 16 compares the temperature fields of the two-layer horizontal battery pack with either unidirectional or crossover arrangements. Both arrangements exhibit the presence of clear thermal plumes. Under the influence of thermal buoyancy, the heat that the discharging lower-layer batteries generate rises with the moving air. They envelop the upper-layer batteries and thus the cooling efficiency of the upper-layer batteries decreases. In both arrangements, the aforementioned phenomenon is not very prominent, even after a relatively short discharge duration (at DoD = 33.3%). The air velocities, which take place in both arrangements, are very small initially, while the air temperature distributions are quite uniform in the entire battery pack. At DoD = 66.7%, the heat from the lower-layer batteries gradually affects the upper-layer batteries. This reduces the cooling capacity of the air surrounding the upper-layer batteries and therefore causes an increase in battery temperature. At a discharge rate of 2C, the maximum temperature differences between the batteries at DoD = 66.7% are 3 °C and 6 °C for unidirectional and crossover battery models, respectively. At the moment of battery discharge cessation (i.e., DoD = 100%), a significant amount of heat departs from the lower-layer batteries and envelops the upper-layer batteries. At a discharge rate of 2C, the maximum temperature differences between batteries have now increased to 8 °C and 9 °C for unidirectional and crossover battery models, respectively. The reason is that part of the heat generated by the lower-layer batteries in the crossover arrangement battery pack rises through the gap between the two upper-layer batteries, then finally hits the casing top cover. Hence, the temperature difference between the upper-layer and lower-layer batteries in the crossover arrangement is greater than that in the unidirectional arrangement. In contrast, the overall maximum temperature of the unidirectional battery pack is approximately 8 °C higher than that of the crossover arrangement. Regarding the flow field, while the maximum air velocity occurs on both sides of the batteries in the unidirectional battery pack, at about 6 cm/s, the one in the crossover battery pack is about 5 cm/s taking place within the gaps between the upper and lower batteries. In short, these two types of battery arrangements exhibit similar ranges of air velocity magnitude.
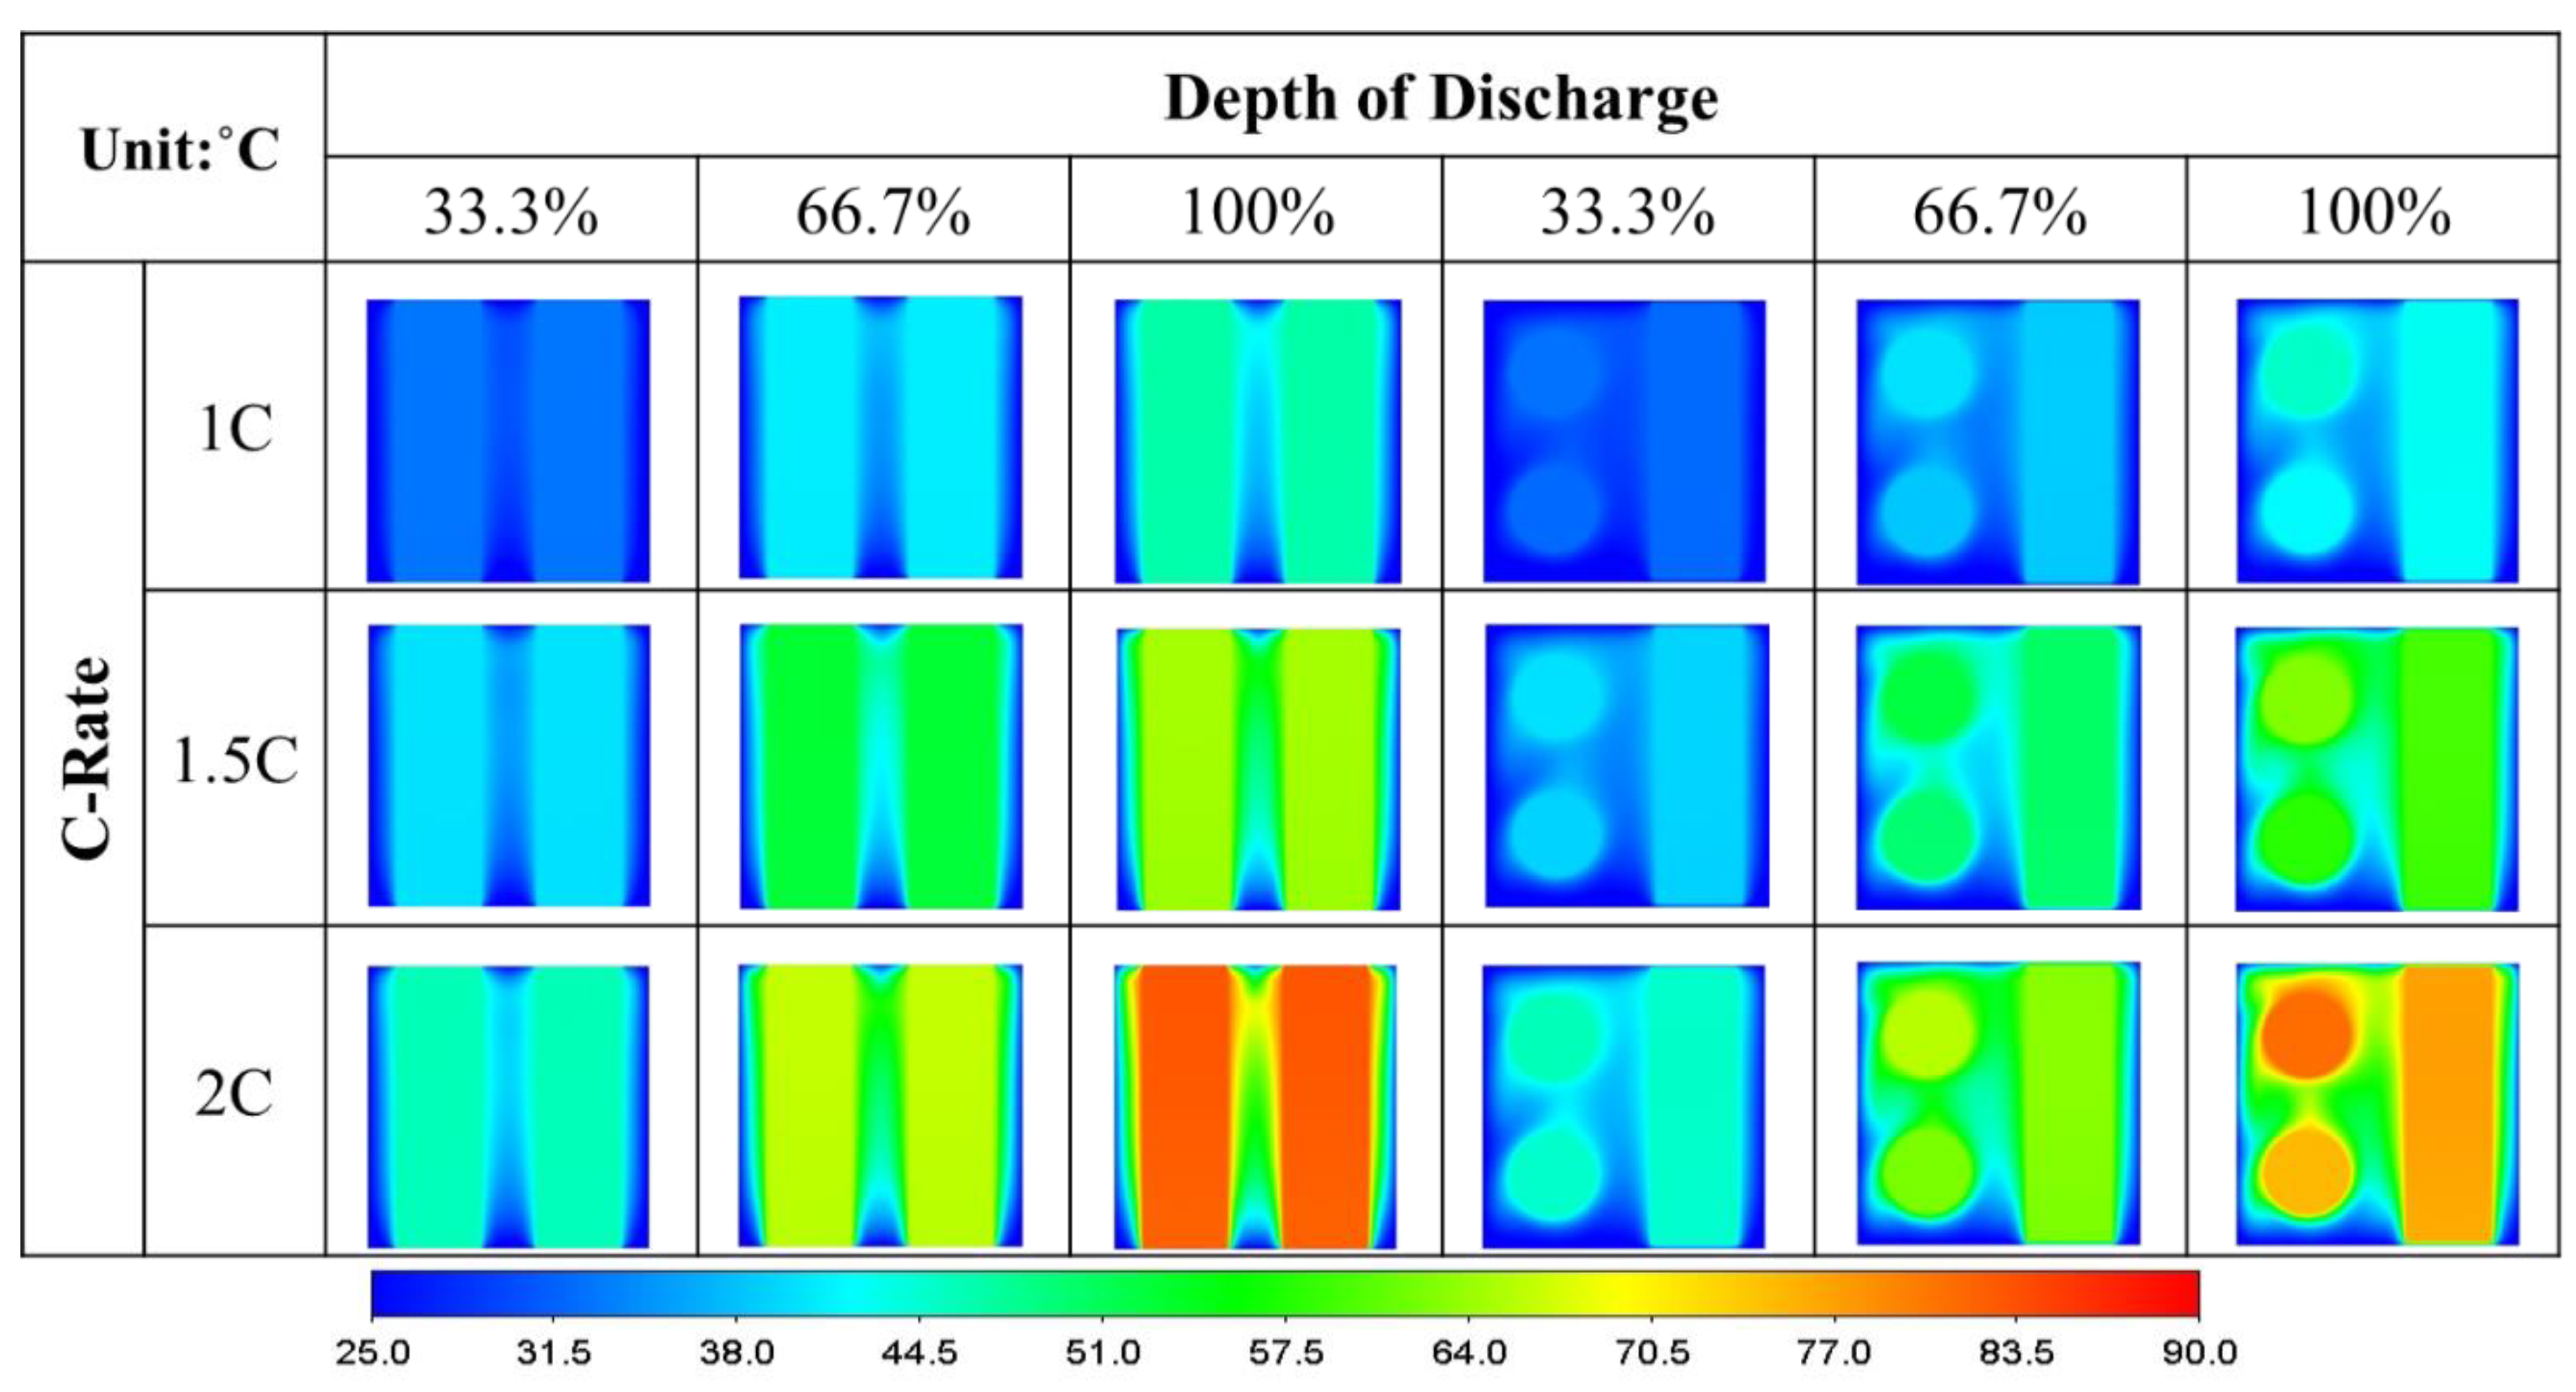
The comparison of the temperature fields of the vertical battery pack with either unidirectional or crossover arrangements is illustrated in Figure 17. The maximum temperature of the batteries in the unidirectional arrangement is about 3 °C higher than that in the crossover arrangement. When DoD = 33.3%, the temperature distributions for both arrangements are relatively uniform, even at different discharge intensities. At this very moment, referring to the crossover arrangement, the lower horizontal battery and the two vertical batteries are clearly transferring heat to the upper horizontal battery. When DoD = 66.7%, the temperatures of the batteries in both arrangements gradually rise. The upper horizontal battery in the crossover arrangement continues to receive more heat, leading to its further increase in temperature. By comparison, the maximum temperature of the lower horizontal battery and that of the two vertical batteries are about 2 °C lower than those in the unidirectional arrangement. When the discharge process stops, the batteries in the unidirectional arrangement reach a maximum temperature of roughly 80 °C, while their maximum temperature difference is less than 1 °C. In the crossover arrangement, the maximum battery temperature is approximately 77 °C, with a maximum temperature difference between batteries of around 5 °C. From these results, it is evident that the temperature uniformity of the unidirectional arrangement is much better than that of the crossover arrangement.
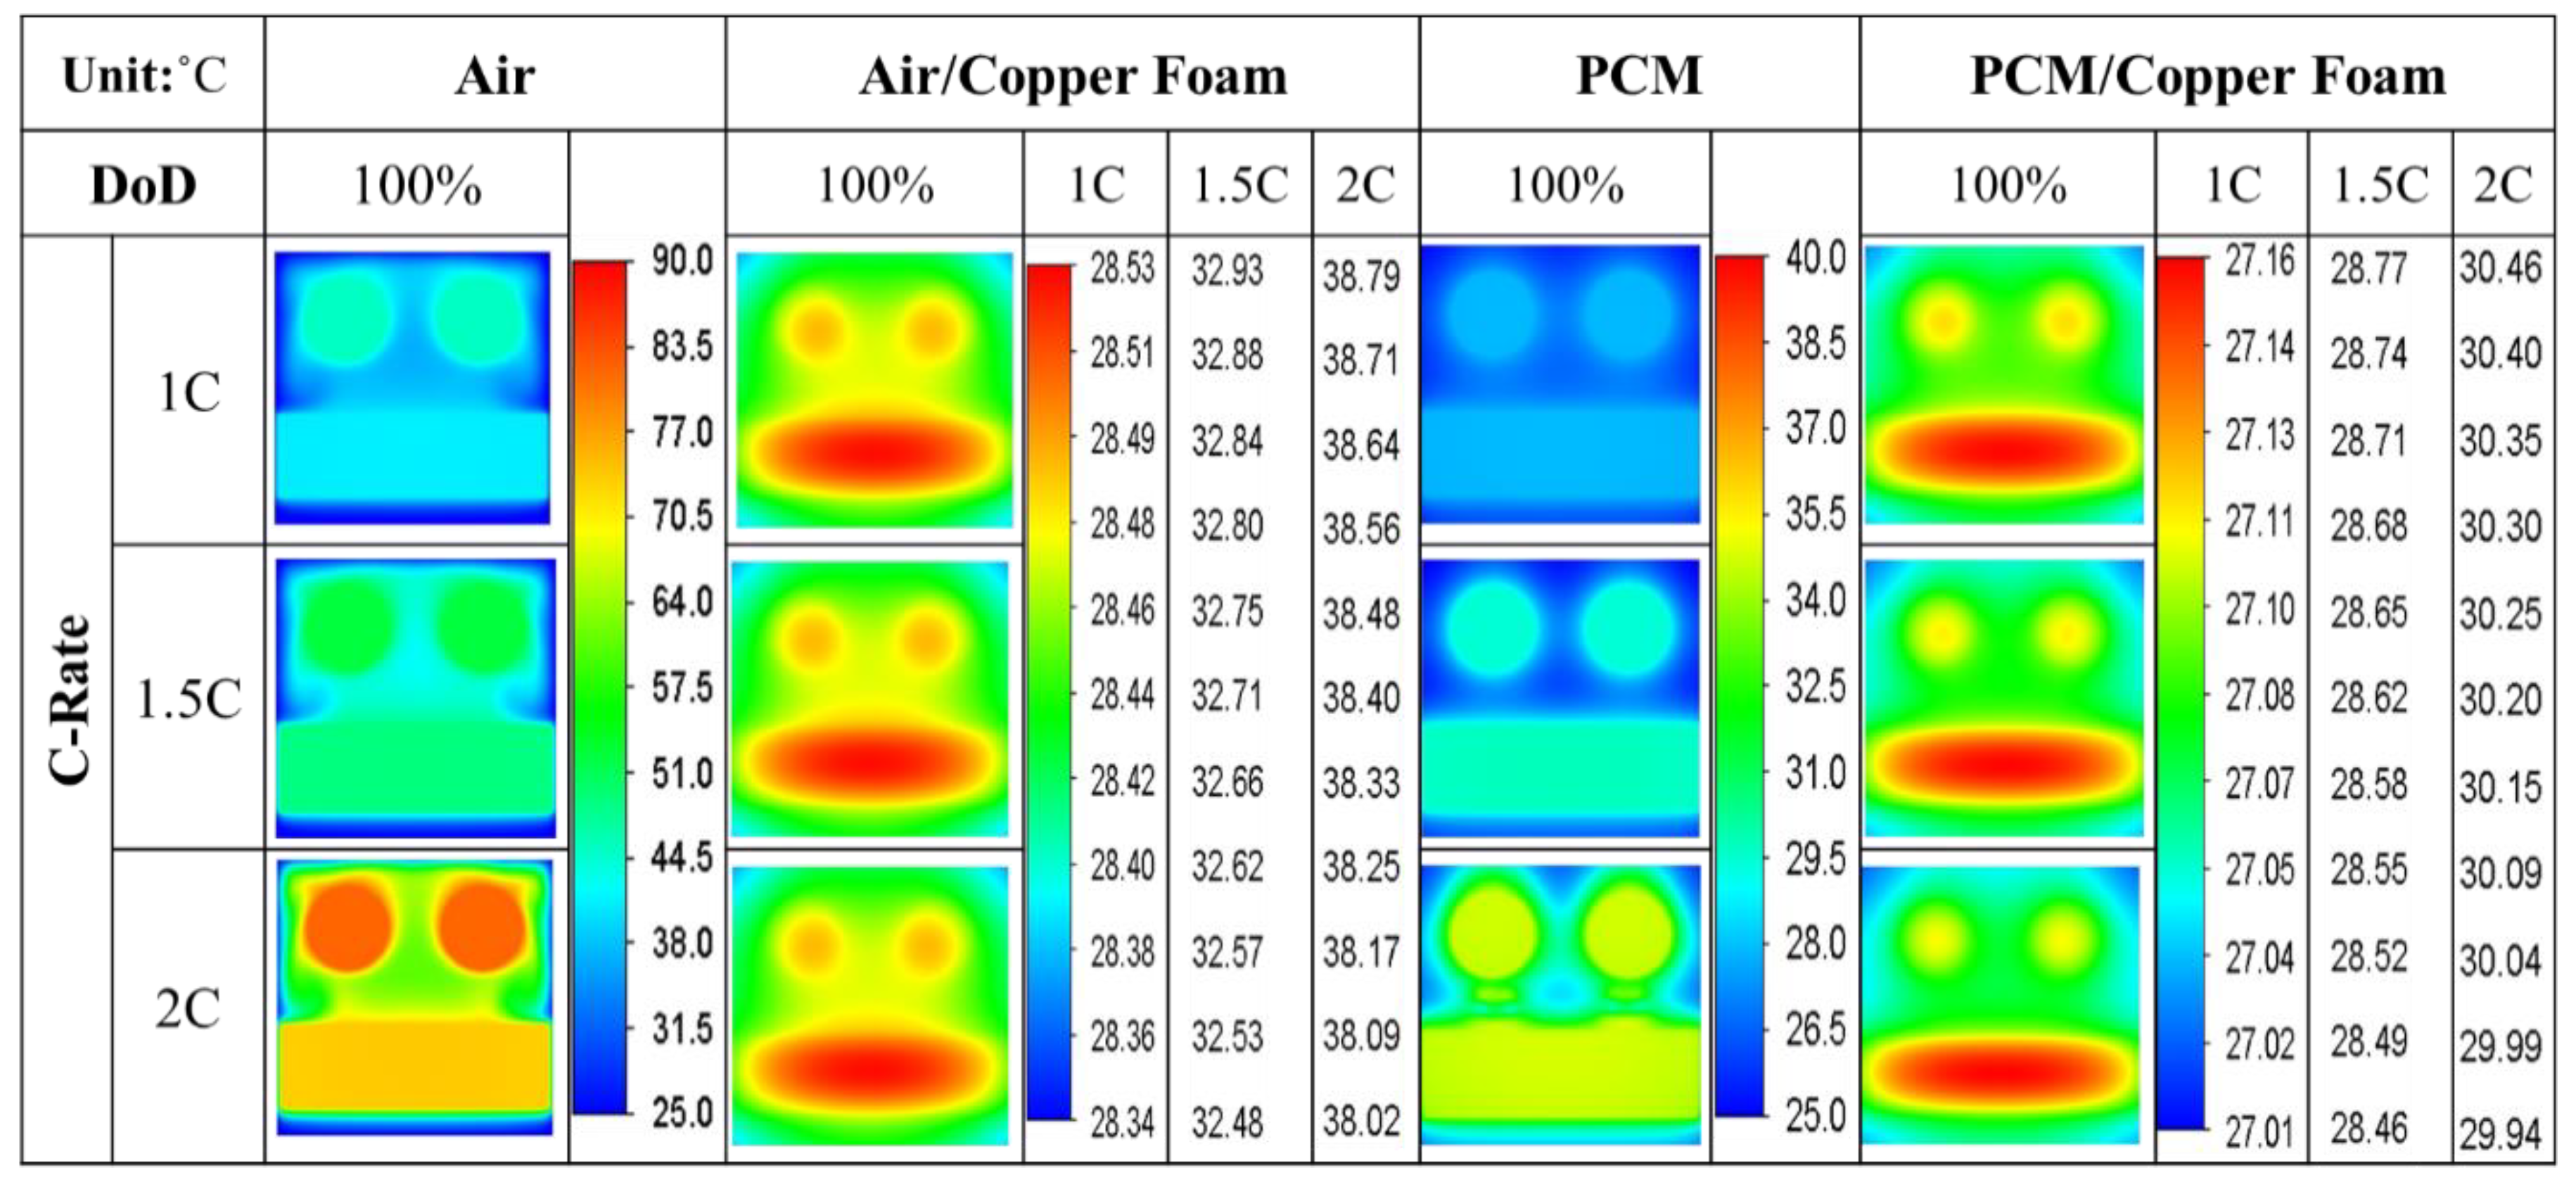
The temperature distributions of the horizontal crossover battery pack with different cooling strategies are depicted in Figure 18. If cooled solely with pure air, some of the heat that the lower-layer batteries generate rises and directly transfers to the surrounding air of the upper-layer batteries, thereby hindering the effective heat dissipation of the upper-layer batteries. When the batteries are discharged at 1C and 1.5C but cooled with PCM, the melting of the PCM is insignificant due to the low heat generation rate. The heat the PCM absorbed cannot be effectively transferred to the vicinity of the upper-layer batteries. At a discharge rate of 2C, the PCM tends to flow upwards after absorbing a sufficient amount of heat, yet it still does not have a significant impact on the temperature of the upper-layer batteries. If the batteries are cooled with copper foam saturated with air, the accumulation of heat between the batteries increases the local temperature. As expected, saturating the copper foam with PCM can further lower the maximum battery temperature by approximately 9 °C when compared to that using copper foam and air.
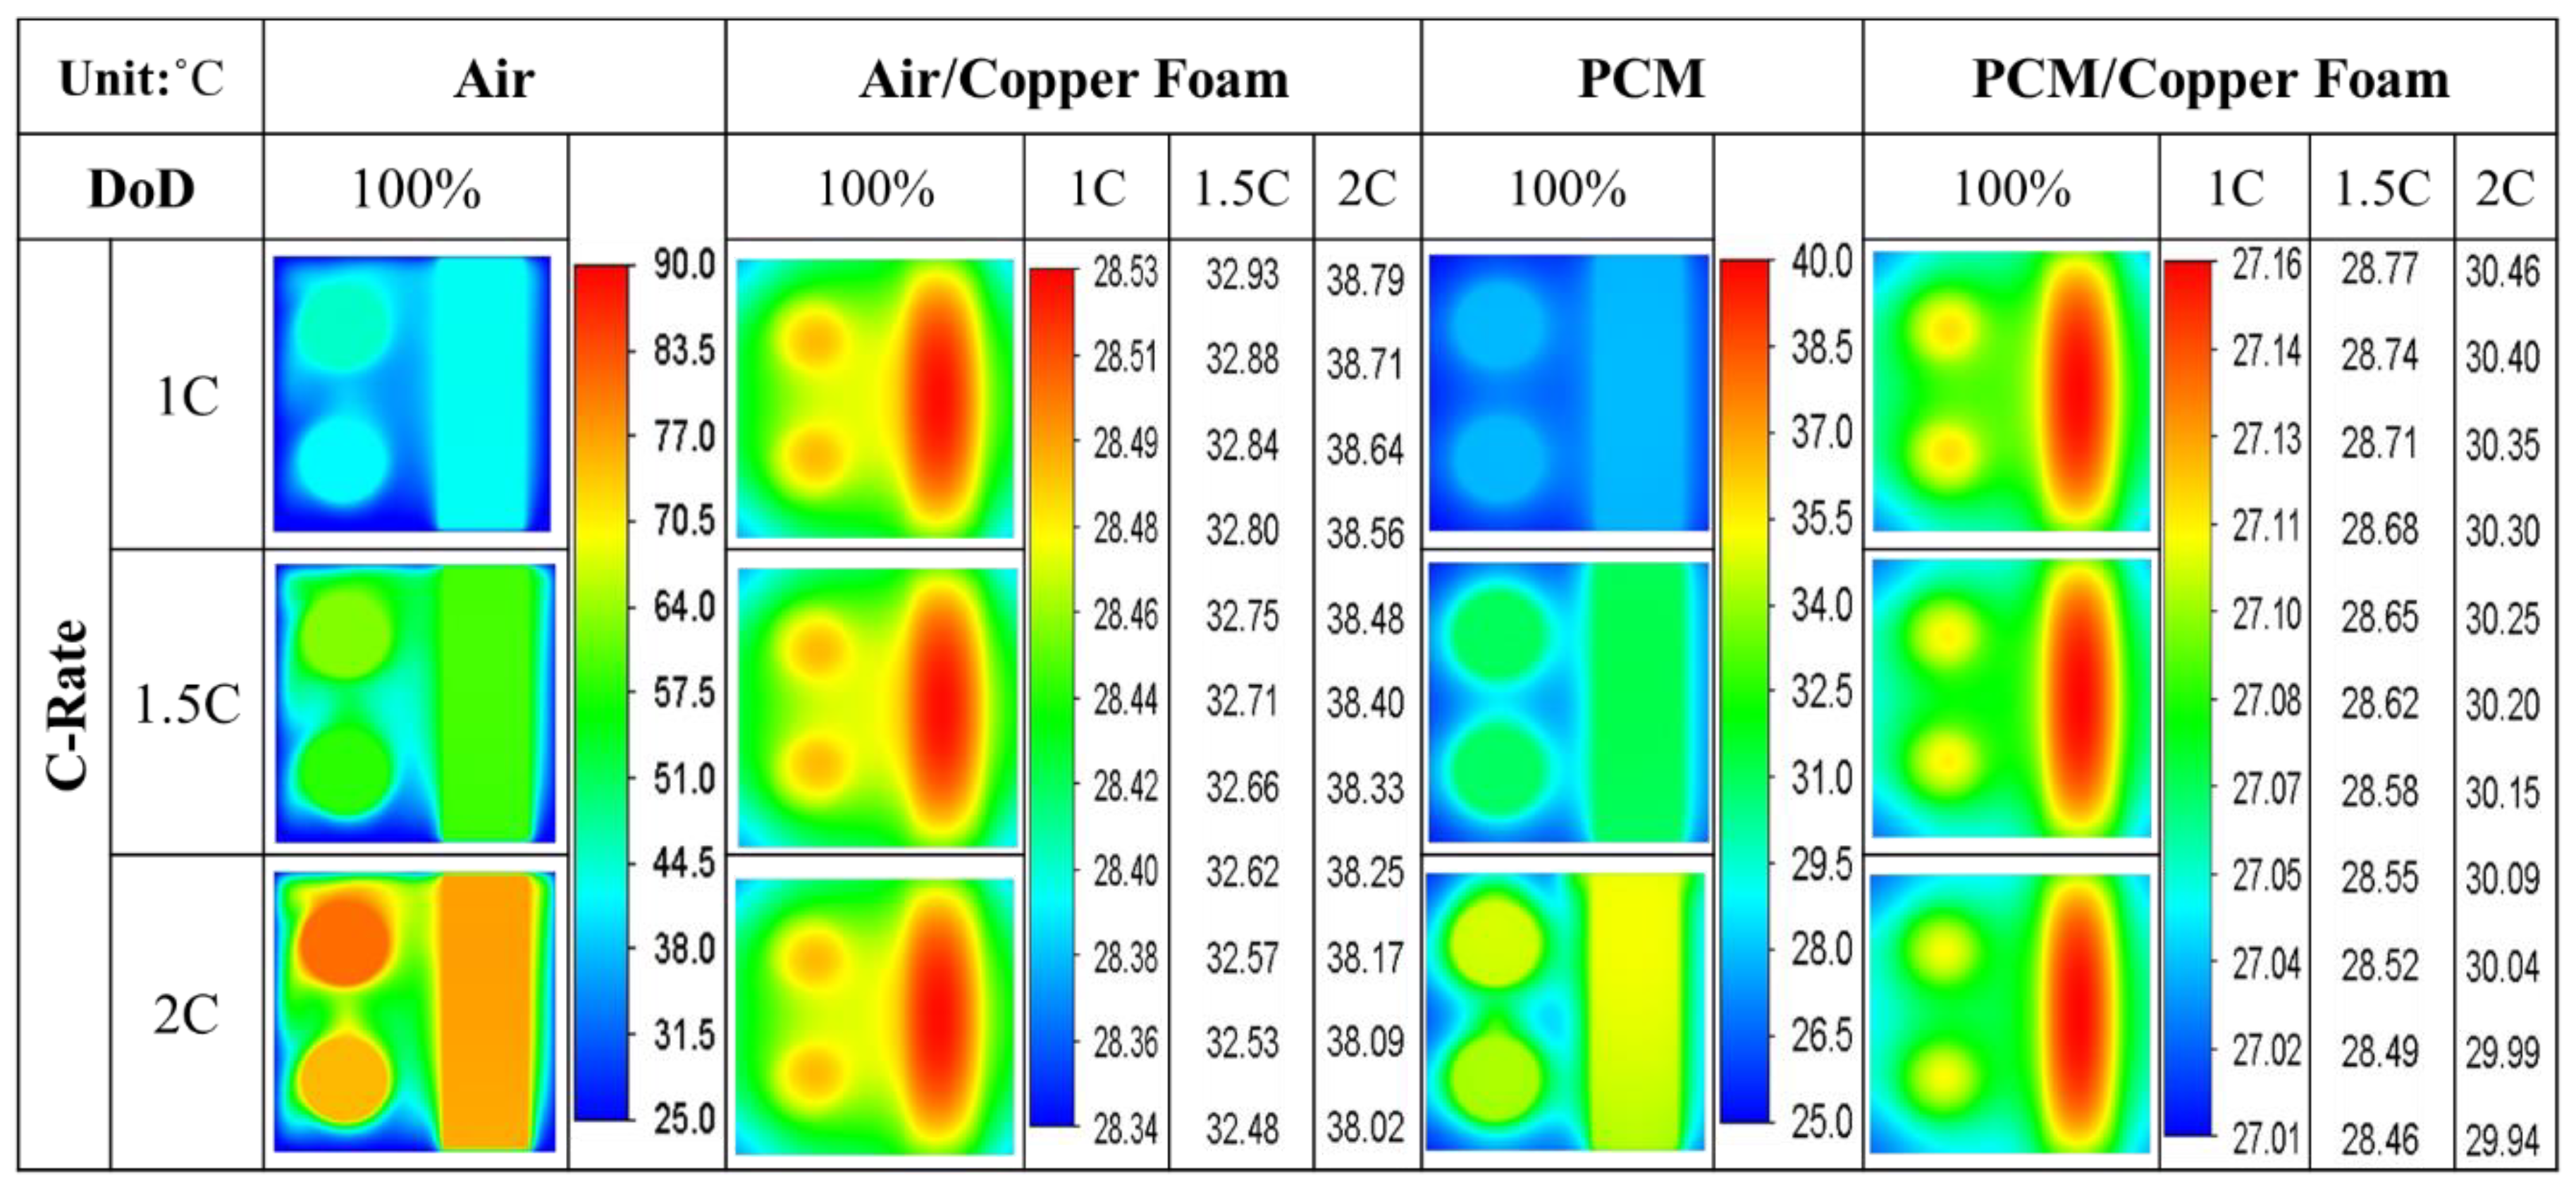
Figure 19 examines the effects of different cooling strategies for a vertical crossover battery pack. When only cooled with air, the heat the lower horizontal and two vertical batteries generate flows upwards along their surfaces. The heat accumulates within the upper portion of the battery pack, reducing the heat dissipation rate of the upper horizontal battery, and thus leading to a continuous increase in temperature. As their discharge intensity increases, the maximum temperature difference between the batteries also increases up to 5 °C. If the air is entirely replaced with PCM, the PCM is capable of absorbing more heat as the battery discharge rate increases. As the PCM flows upwards, it transfers heat to the PCM nearby the upper horizontal battery. The upward heat flow causes more heat to be accumulated at the upper portion of the battery pack and results in a higher temperature in the upper horizontal battery, as well as the upper portion of the vertical batteries. If the space within the battery pack is filled with copper foam saturated either with air or PCM, an improvement in the overall temperature distribution of the battery pack is found. When air is chosen to saturate the foam, the heat generated tends to accumulate in the gaps between the individual batteries. In this case, the heat is more difficult to dissipate and therefore increases the overall battery temperature. On the other hand, if the foam is saturated with PCM, the PCM absorbs the heat between the batteries, significantly reducing the temperatures in that area.

3.4. Heat Flux on Air-Cooled Battery Surfaces

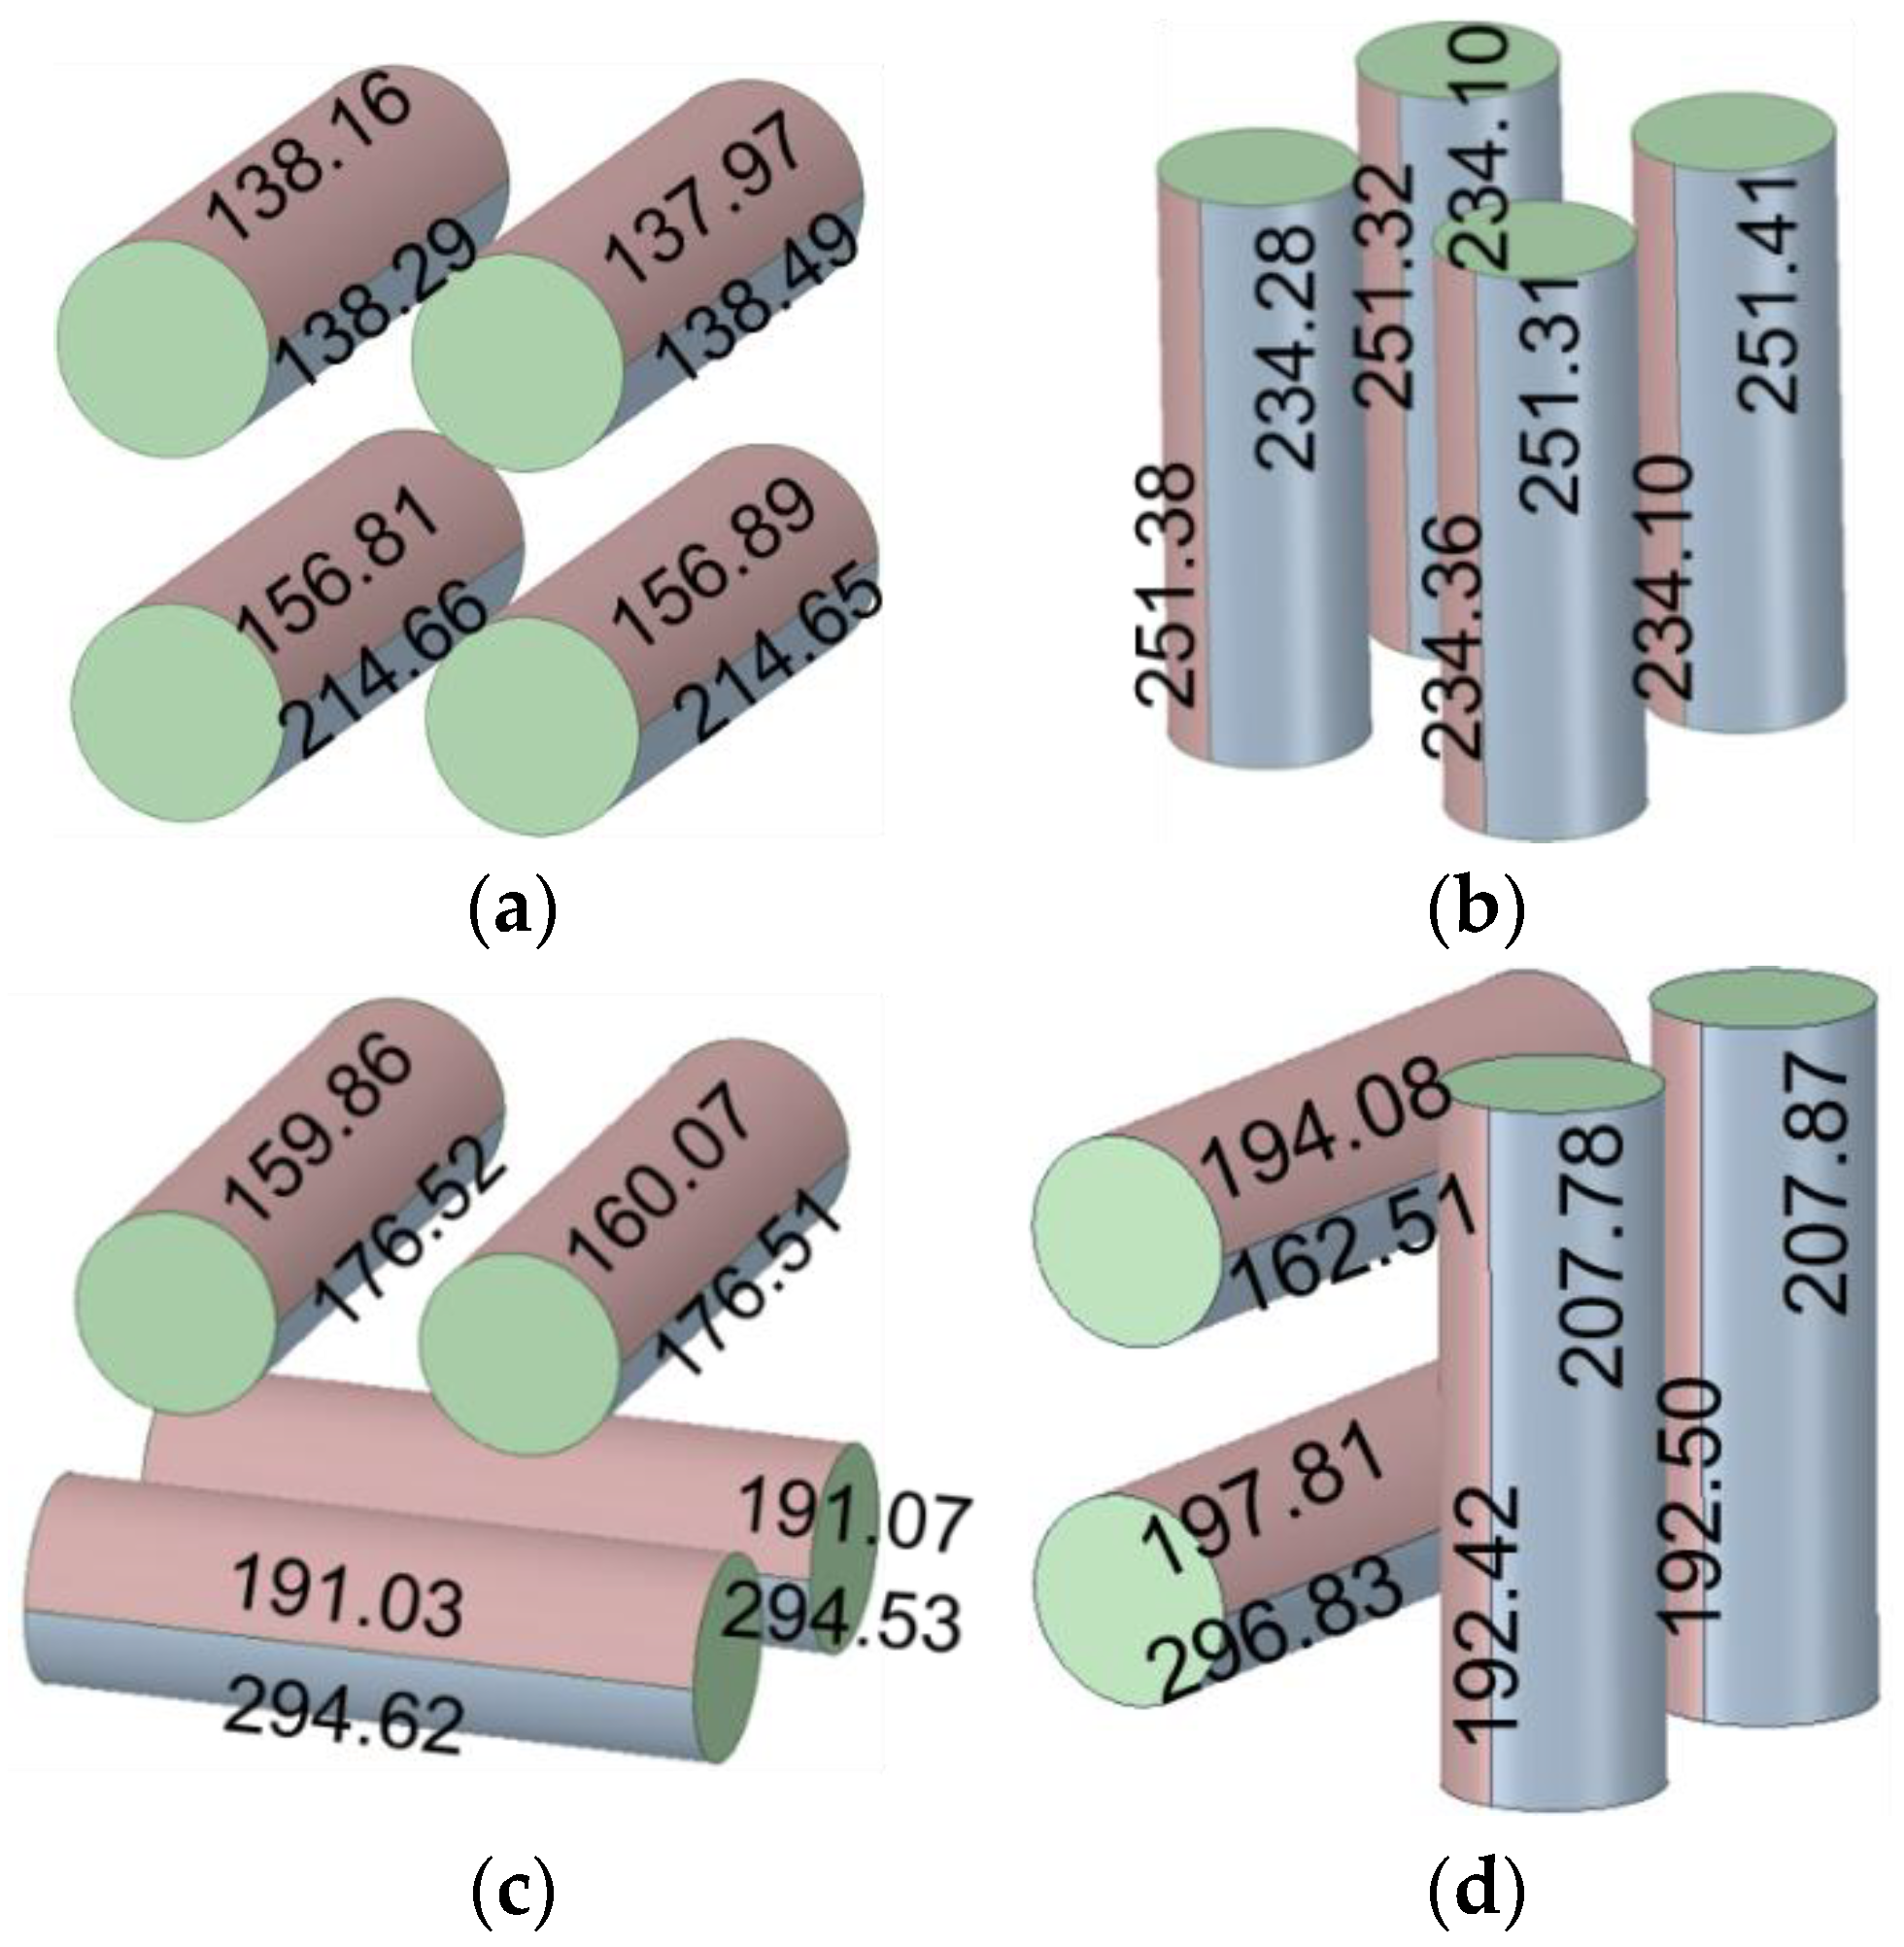
The values shown in Figure 20 represent the average heat flux in W/m2 on specific individual surfaces of each battery when cooled by air and discharged at a rate of 2C. There are noticeable differences in the heat flux on the battery surfaces under different orientations and arrangements. A higher value of heat flux on the battery surface signifies better heat transfer efficiency, indicating that the battery can dissipate heat more easily through that particular surface. This figure quantifies the heat dissipation of battery surfaces under different scenarios.
As shown in Figure 20a, the heat fluxes on the surface of the upper horizontal battery are 137.97 W/m2 and 138.16 W/m2. Theoretically, these values should be the same, due to the symmetrical nature of the problem. It is believed that this minute discrepancy is caused by computational errors. Similar discrepancies are also observed elsewhere. In the discharge process, the heat the lower-layer horizontal batteries generate is conducted to the air. The heated air gradually flows upwards, affecting the upper-layer batteries and minimizing their heat fluxes.
When all four batteries are vertically oriented, the difference in heat flux on the surface of each battery is more uniform (Figure 20b) as compared to the previous case. The unidirectional vertical batteries release heat energy along their surfaces without much interference between the batteries. Even so, the current study found that the portions of the battery surfaces facing the casing correspond to larger heat fluxes. Conversely, their inner surfaces offer less heat transfer capacity due to the accumulation of heat energy within the central space between the batteries and the greater distance from the battery casing.
Based on the heat flux distribution associated to the horizontal crossover battery pack displayed in Figure 20c, it is discovered that the upper-layer batteries continue to be influenced by the heat convected from the lower-layer batteries, as well as the heat they have generated themselves. This is evident from the fact that the heat fluxes on the upper-layer batteries are lower, while those on the lower-layer are higher. Comparing the scenario when all the batteries are horizontally oriented, the heat released from the lower-layer batteries in the unidirectional arrangement completely envelops the batteries directly above them. In the crossover arrangement, the heat envelope only partially overlaps the upper-layer batteries. Therefore, the total heat flux on the batteries in the crossover battery pack is higher than that in the unidirectional one.
Figure 20d depicts the heat flux distribution of the vertical crossover battery pack. The outer side of the vertical batteries, which is closer to the casing, allows indirect cooling of the internal hot air through natural convection outside the casing. This increases the heat flux there. During discharge, the heat both the lower horizontal battery and the vertical batteries generate would accumulate in the space between the four batteries. Consequently, the heat fluxes on the bottom sides of the upper battery are the lowest, followed by those on the inner sides of the vertical batteries.
The total amounts of heat flux for these four different battery arrangements are 162 W/m2, 242 W/m2, 206 W/m2, and 207 W/m2. These figures clearly imply that the batteries in vertical orientation dissipate 50% more heat than those in horizontal orientation. If all four batteries are placed unidirectionally and horizontally, the amounts of heat flux for the upper and lower batteries are 138 W/m2 and 186 W/m2, respectively. This indicates that the lower two batteries dissipate 34% more heat than the upper ones. If the horizontal batteries are arranged in the crossover fashion, the amounts of heat flux for the upper and lower batteries become 168 W/m2 and 243 W/m2, respectively. In this arrangement, the lower two batteries dissipate heat more effectively than the upper ones by 44%.

3.5. Foam Porosity on Battery Temperature

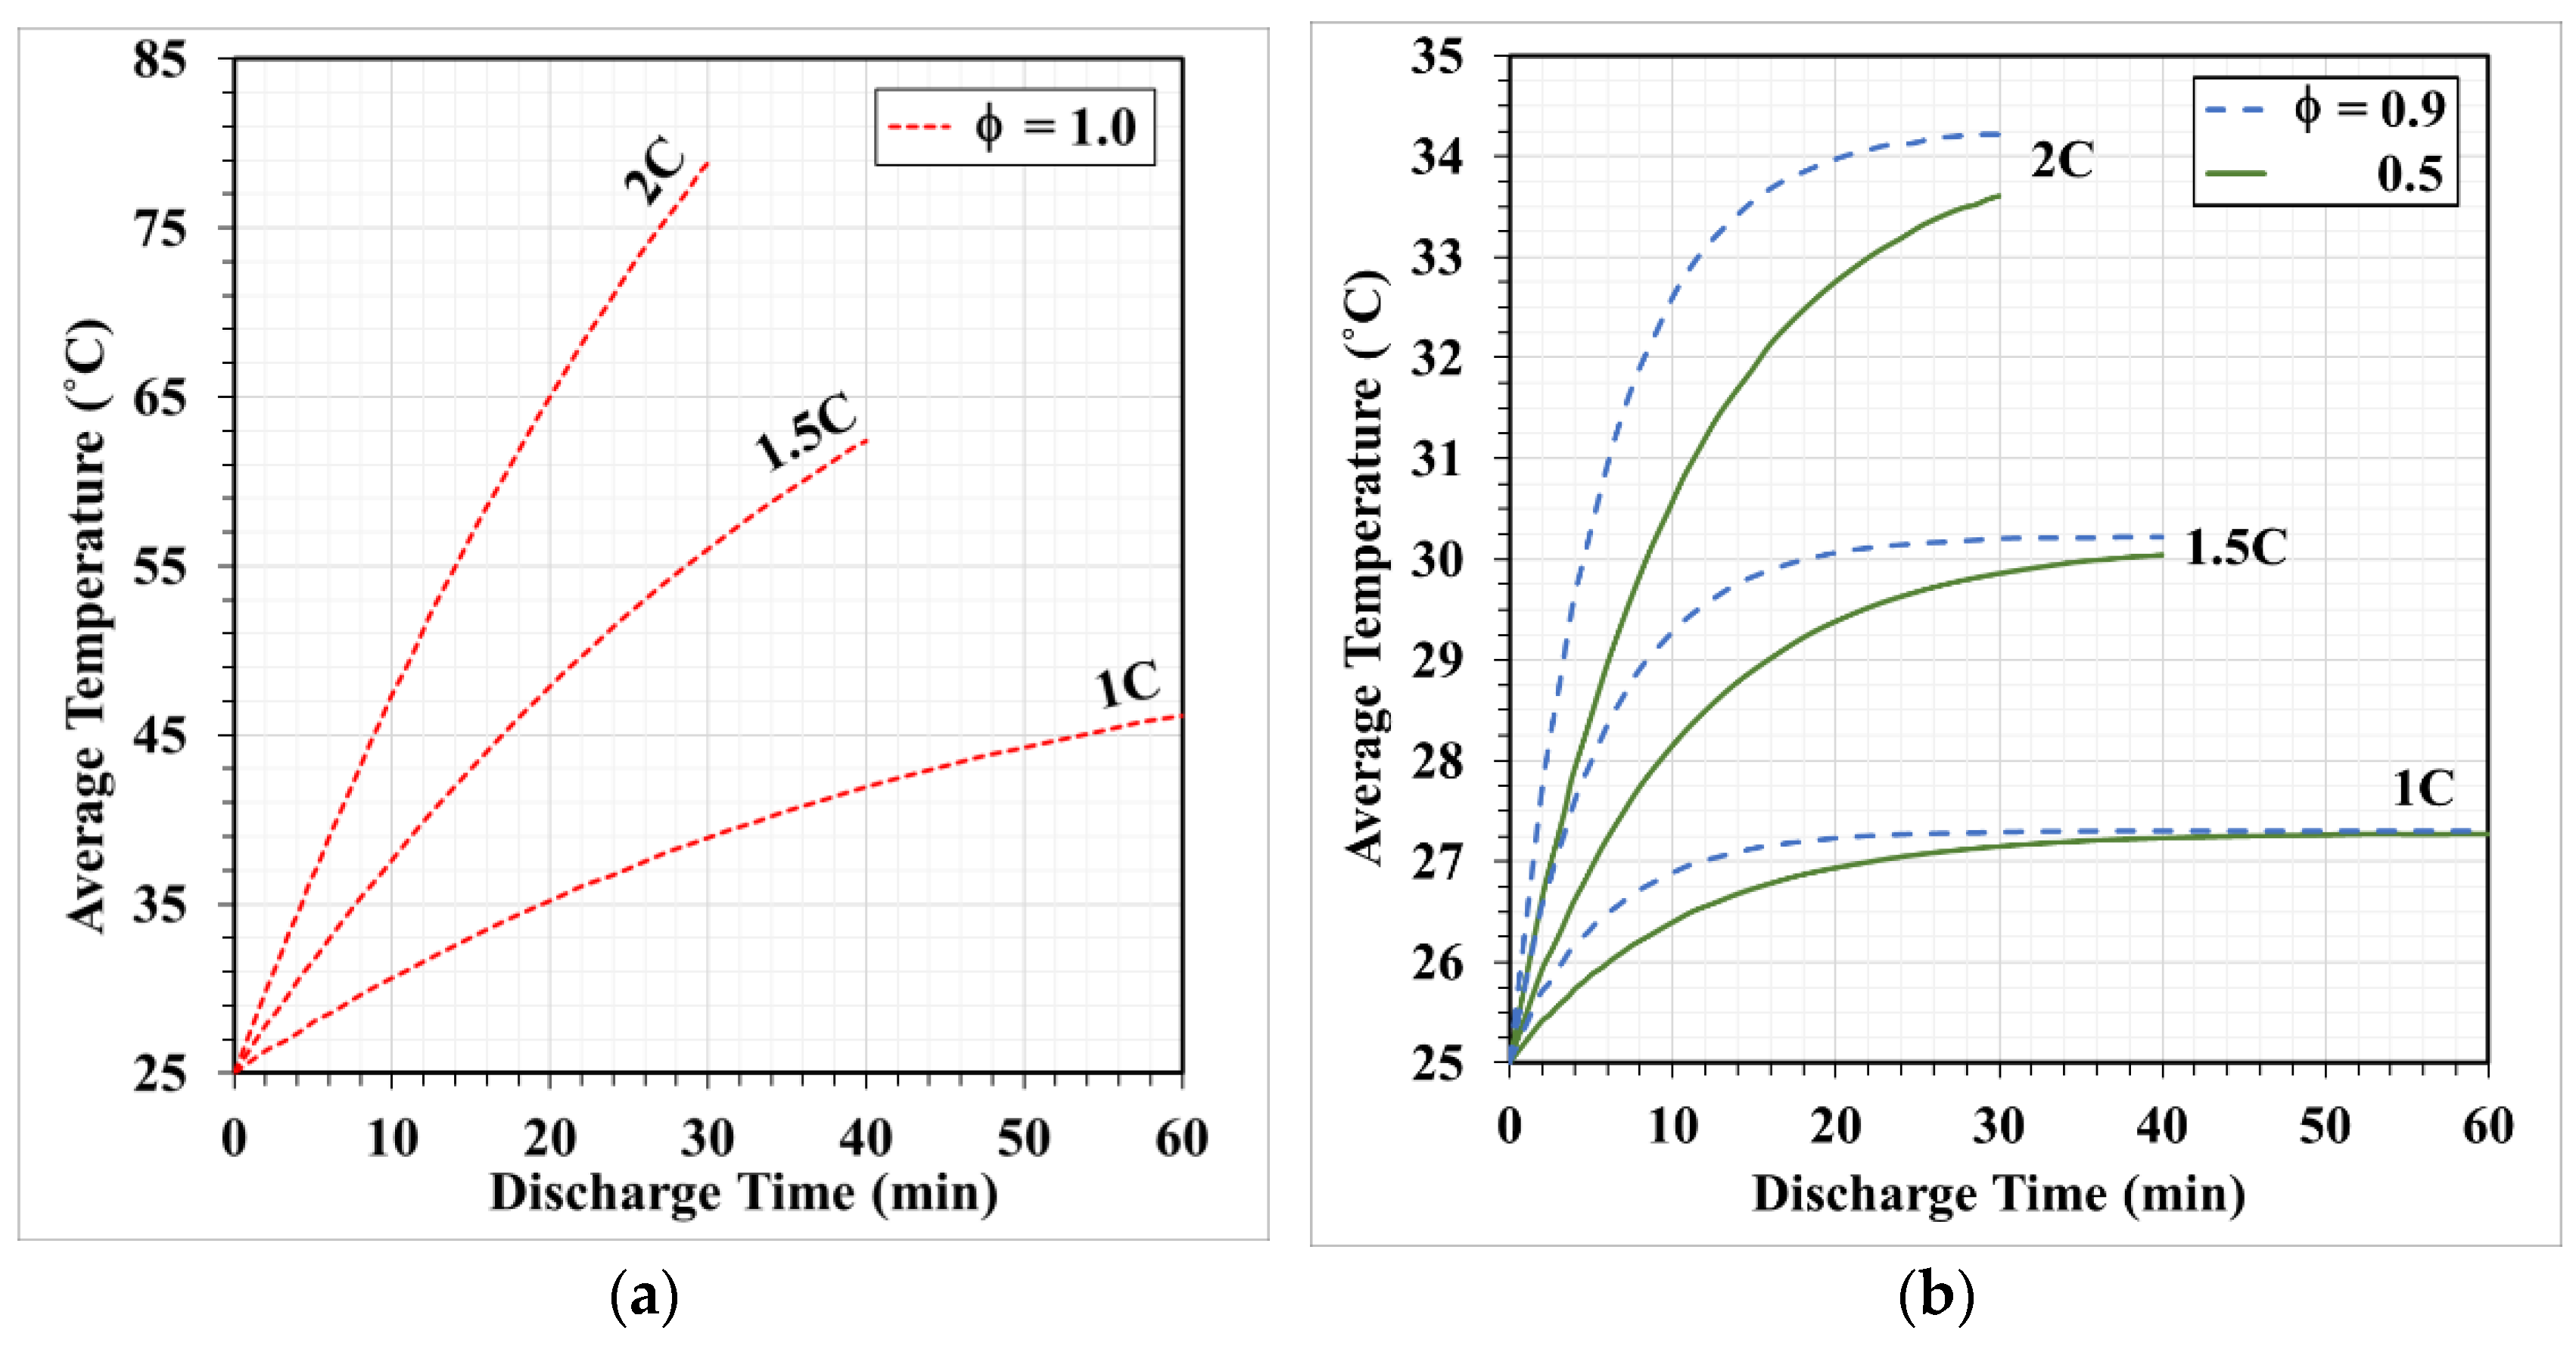
To investigate the effects of copper foam porosity, the variations in the volumetric average battery temperature during the discharge process of the battery in a single-battery pack at the discharge rates of 1C, 1.5C, and 2C are shown in Figure 21. From Figure 21a, it can be observed that the single battery, at a discharge rate of 1C under pure air-cooling (ϕ = 1.0) results in a slow average temperature rise, reaching its maximum slightly above 45 °C at 60 min. At a discharge rate of 1.5C, the average temperature increases more significantly and reaches around 60 °C at 40 min. In less than 20 min, the average temperature of the battery has gone beyond 45 °C, a temperature high enough to cause possible adverse effects on the battery performance and capacity. At a discharge rate of 2C, the combination of air and external natural convection is ineffective to dissipate the heat. The average battery temperature rises sharply to 80 °C in 30 min. The battery users should refrain from this kind of discharging operation to prevent the risk of thermal runaway and potential explosion.
Figure 21b illustrates the results corresponding to the use of copper foam saturated with air. Due to its high thermal conductivity, the copper foam efficiently conducts a considerable amount of the heat the battery generates and remarkably reduces the average battery temperature. The copper foam with a porosity of 0.5 exhibits lower average battery temperatures compared to that with a porosity of 0.9. The reduction in average temperature is found to be proportional to the battery discharge intensity. Since the volume of copper in the foam with a porosity of 0.5 is five times that in a foam with a porosity of 0.9, the foam corresponding to a porosity of 0.5 offers greater heat transfer efficiency, and it also contributes to a more uniform temperature distribution.
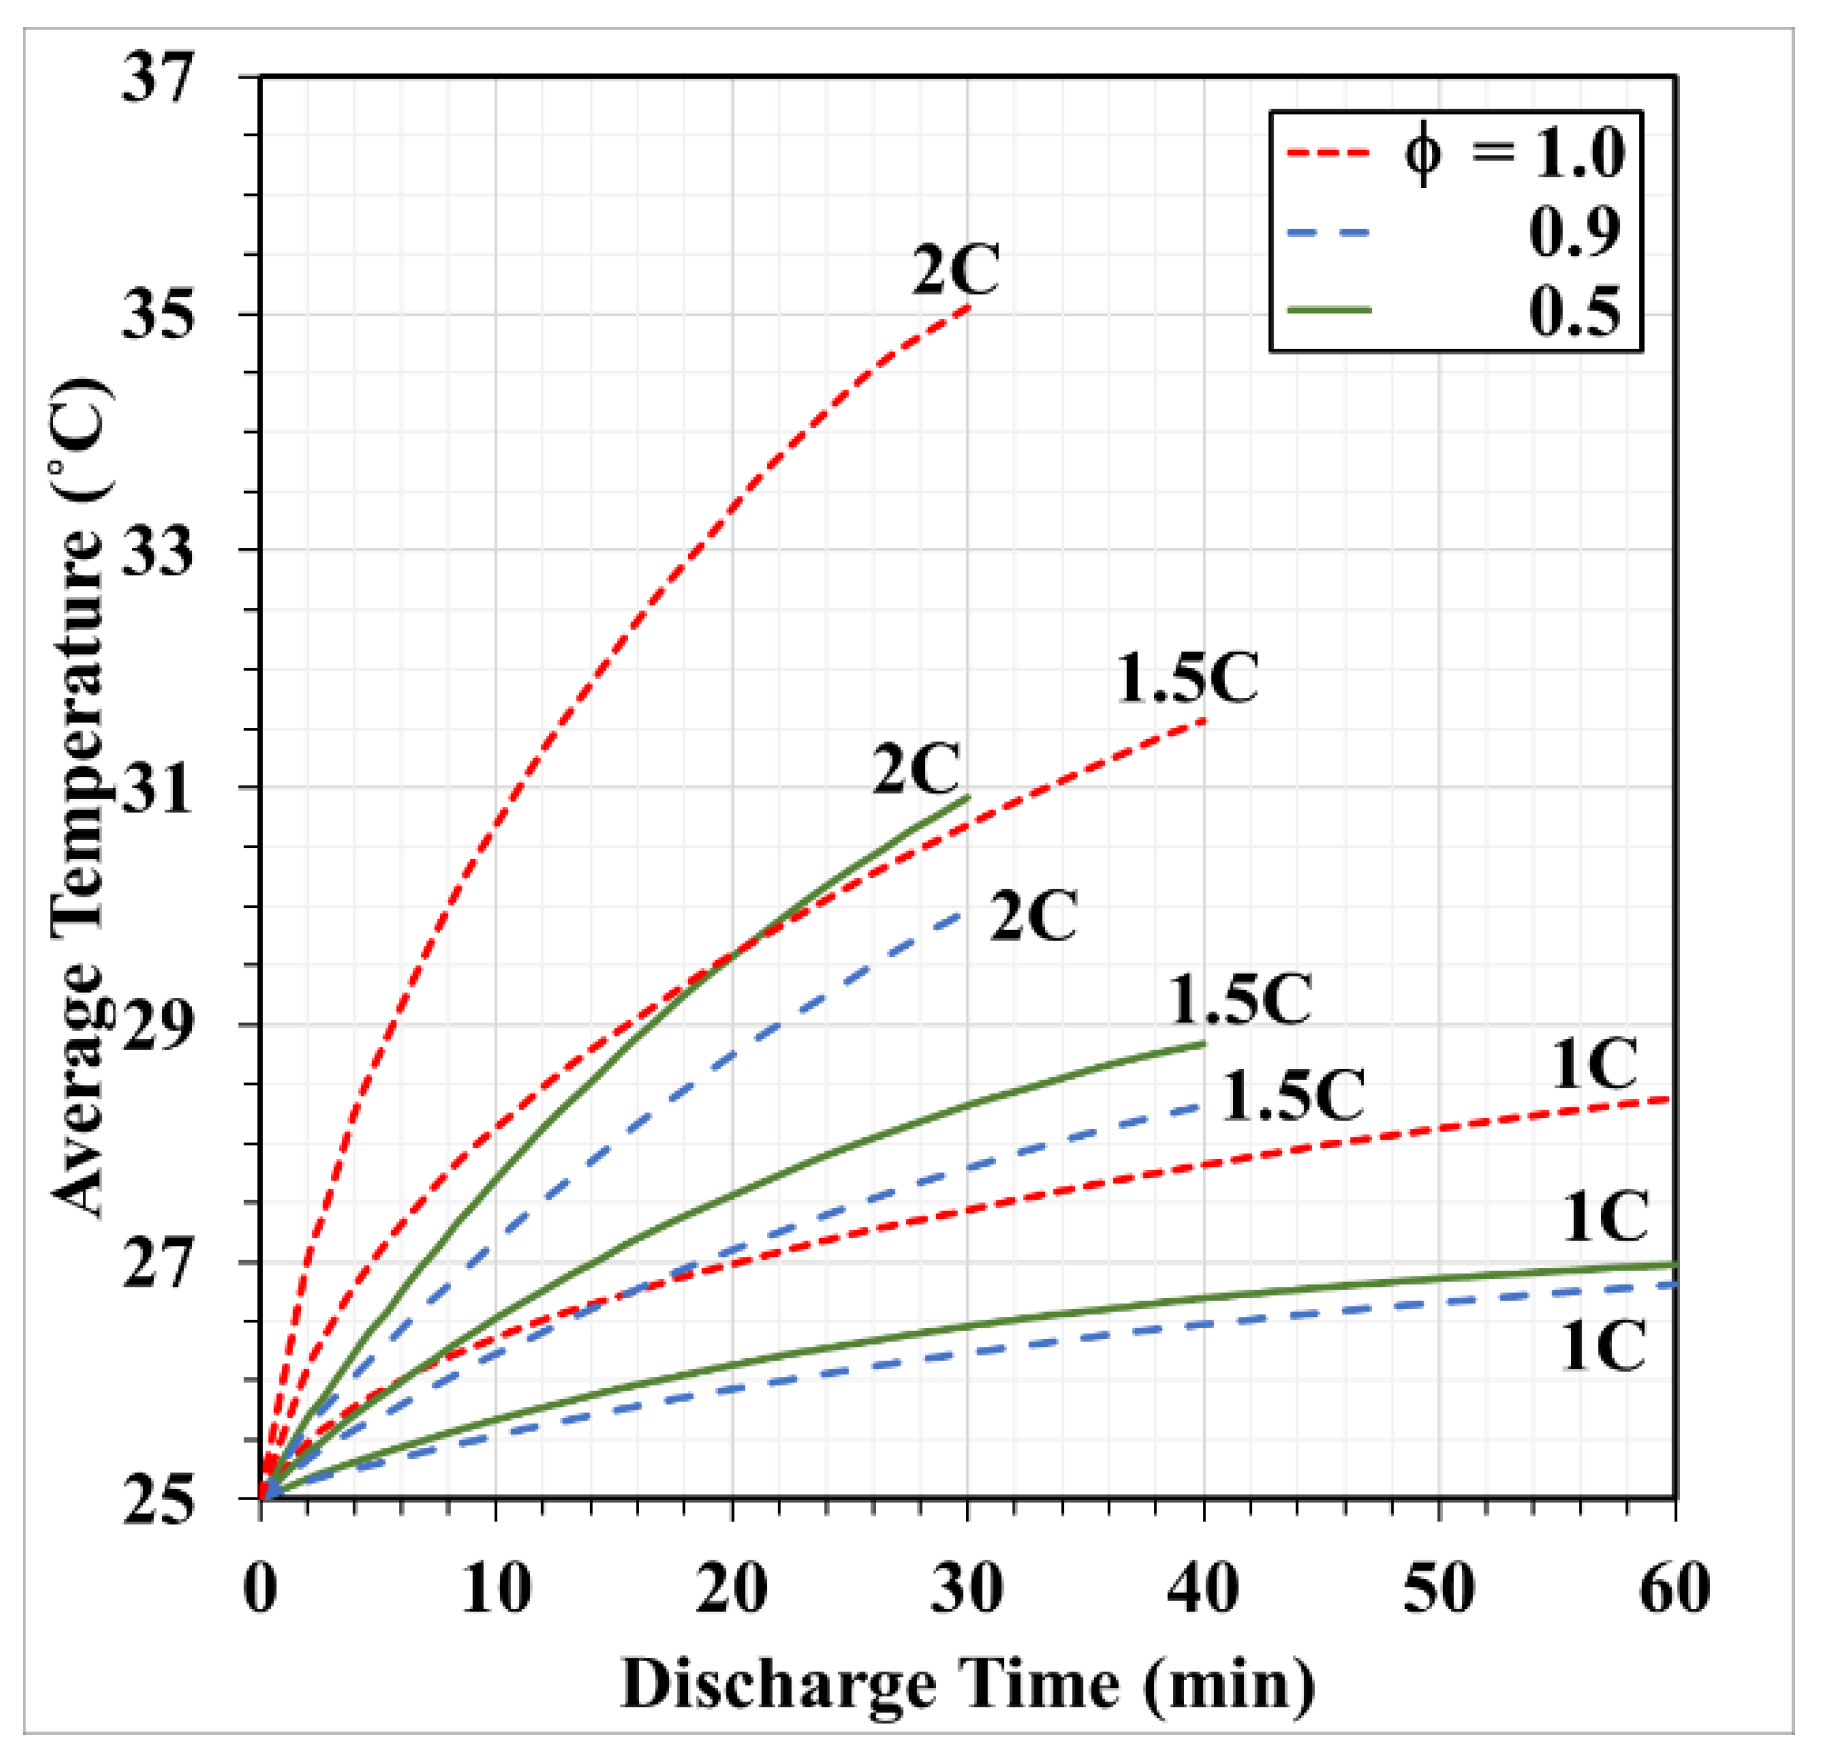
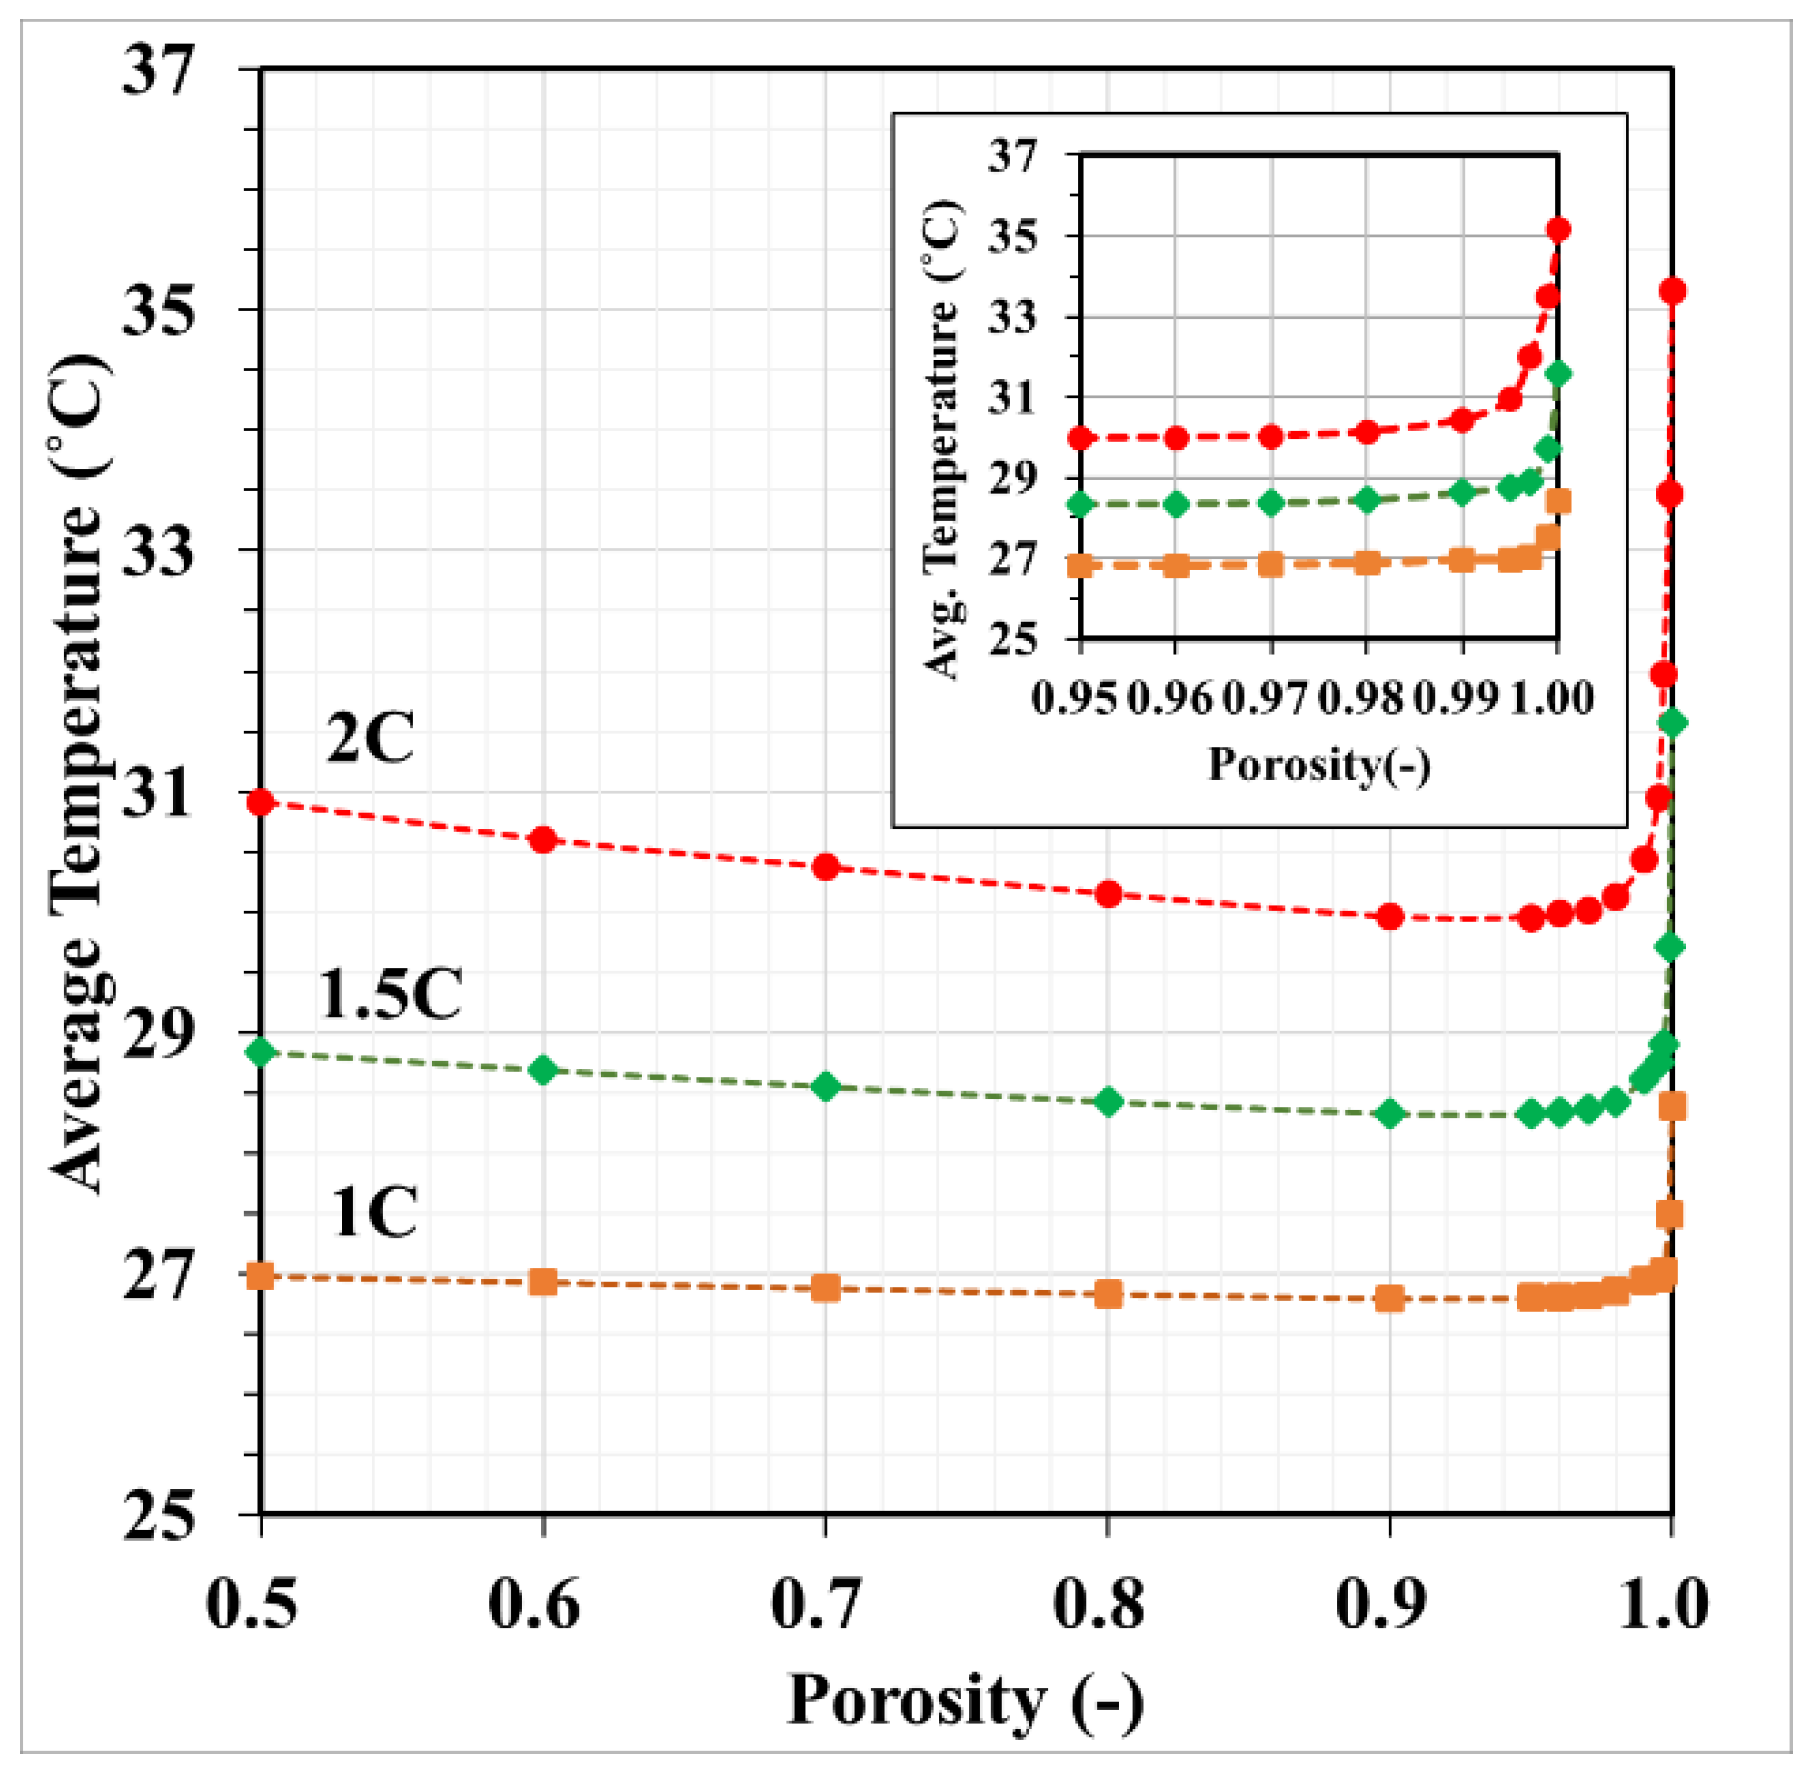
Figure 22 proves that replacing air with PCM in the copper foam can greatly improve the heat dissipation of the battery. When using PCM alone for cooling (i.e., ϕ = 1.0), the average battery temperature increases with the discharge intensity, reaching a maximum of around 35 °C at a discharge rate of 2C. The inclusion of copper foam results in a significant reduction in average battery temperature. Contrary to common expectations, the average battery temperature of copper foam with a porosity of 0.5 is surprisingly higher than that of copper foam with a porosity of 0.9. As shown in Figure 23, the simulation result indicates that a porosity of 0.95 in copper foam seems to be an approximate threshold value, associated with the lowest average battery temperature among the tested porosities. This trend is linked to the exchange or balance between the heat the copper foam conducts and the heat the PCM absorbs. Increasing porosity from 0.95 implies an increase in PCM volume and a decrease in copper foam volume. This reduces the effective heat conduction paths the copper foam is capable of offering, leading to higher average battery temperature. In contrast, as porosity decreases from 0.95, the total volume of copper in the foam increases, therefore providing more effective heat transfer paths. At the same time, the decrease in PCM volume results in its decreased capability to absorb heat. This explains why copper foam with a porosity of 0.5 actually behaves less favorably than that with a porosity of 0.9. Apparently, the improvement in the heat removal capability of copper foam should be matched up with the heat absorption in PCM in order to yield the best outcomes.

4. Conclusions

This work has simulated the temperature and velocity variations inside several 21700 Li-ion battery packs under different discharge intensities and cooling strategies. The results of the current simulations suggest the following:
  • Under the same discharge rate and cooling strategy, the orientation of the single-battery pack has an insignificant effect on the range of the battery temperature. However, the air flows faster in the battery pack when the battery is placed vertically at 8.1 cm/s compared to horizontally at 6 cm/s.
  • The air-cooled lower horizontal batteries dissipate 34% more heat than the upper ones in a unidirectional arrangement. When arranged in a crossover configuration, the lower ones dissipate more heat than the upper ones by 44%.
  • Arranging the air-cooled batteries vertically and in a crossover fashion yields both the lowest maximum battery temperature and volumetric average battery temperature. However, the smallest temperature difference and greatest surface heat flux can only be achieved if the batteries are placed vertically and unidirectionally.
  • The average temperature of a purely air-cooled 21700 battery may reach 79 °C under a 2C discharge. The installation of copper foam may reduce this temperature below 35 °C. If the air in the foam is entirely replaced with PCM, this temperature may be further reduced to approximately 31 °C.
  • Air cooling is only acceptable if the battery discharge rate is less than 1C. If the battery continues discharging at a rate exceeding 1.5C until it is exhausted, either pure PCM or copper foam saturated with air should be used. If there is a need for high temperature uniformity, then copper foam saturated with PCM turns out to be a viable option.
  • Copper foam saturated with PCM performs favorably in enhancing battery cooling effectiveness. The foam porosity is recommended to range between 0.90 and 0.97. Otherwise, the volumetric average temperature of the batteries may increase. When discharged at 2C, decreasing the foam porosity from 0.95 to 0.5 may increase the volumetric average battery temperature from 30 °C to 31 °C.

Author Contributions

Conceptualization, C.-L.W. and J.C.L.; methodology, C.-L.W. and J.C.L.; software, C.-L.W.; data curation, C.-L.W.; writing—original draft preparation, C.-L.W. and J.C.L.; writing—review and editing, J.C.L.; supervision, J.C.L. All authors have read and agreed to the published version of the manuscript.

Funding

This research received no external funding.

Data Availability Statement

The data are contained within the article.

Conflicts of Interest

The authors declare no conflicts of interest.

References

  1. Hwang, F.S.; Confrey, T.; Reidy, C.; Picovici, D.; Callaghan, D.; Culliton, D.; Nolan, C. Review of battery thermal management systems in electric vehicles. Renew. Sustain. Energy Rev. 2024, 192, 114171. [Google Scholar] [CrossRef]
  2. Khan, S.A.; Hussain, I.; Thakur, A.K.; Yu, S.; Lau, K.T.; He, S.; Dong, K.; Chen, J.; Li, X.; Ahmad, M.; et al. Advancements in battery thermal management system for fast charging/discharging applications. Energy Storage Mater. 2023, 65, 103144. [Google Scholar] [CrossRef]
  3. Bernardi, D.; Pawlikowski, E.; Newman, J. A general energy balance for battery systems. J. Electrochem. Soc. 1985, 132, 5–12. [Google Scholar] [CrossRef]
  4. Yao, T.P.; Forman, B.M.; Jiang, Z.; Cherbas, L.; Chen, J.D.; McKeown, M.; Cherbas, P.; Evans, R.M. Functional ecdysone receptor is the product of EcR and Ultraspiracle genes. Nature 1993, 366, 476–479. [Google Scholar] [CrossRef] [PubMed]
  5. Al-Hallaj, S.; Maleki, H.; Hong, J.S.; Selman, J.R. Thermal modeling and design considerations of lithium-ion batteries. J. Power Sources 1999, 83, 1–8. [Google Scholar] [CrossRef]
  6. Sato, N. Thermal behavior analysis of lithium-ion batteries for electric and hybrid vehicles. J. Power Sources 2001, 99, 70–77. [Google Scholar] [CrossRef]
  7. Jeon, D.H.; Baek, S.M. Thermal modeling of cylindrical lithium ion battery during discharge cycle. Energy Convers. Manag. 2011, 52, 2973–2981. [Google Scholar] [CrossRef]
  8. Liu, G.M.; Ouyang, M.G.; Lu, L.G.; Li, J.Q.; Han, X.B. Analysis of the heat generation of lithium-ion battery during charging and discharging considering different influencing factors. J. Therm. Anal. Calorim. 2013, 116, 1001–1010. [Google Scholar] [CrossRef]
  9. Jarrett, A.; Kim, I.Y. Design optimization of electric vehicle battery cooling plates for thermal performance. J. Power Source 2011, 196, 10359–10368. [Google Scholar] [CrossRef]
  10. Tran, T.H.; Harmand, S.; Desmet, B.; Filangi, S. Experimental investigation on the feasibility of heat pipe cooling for HEV/EV lithium-ion battery. Appl. Therm. Eng. 2014, 63, 551–558. [Google Scholar] [CrossRef]
  11. Zhou, R.; Gu, J.J.; Liu, J. An experimental study of heat pipe thermal management system with wet cooling method for lithium-ion batteries. J. Power Source 2015, 273, 1089–1097. [Google Scholar] [CrossRef]
  12. Wang, Z.W.; Zhang, H.Y.; Xia, X. Experimental investigation on the thermal behavior of cylindrical battery with composite paraffin and fin structure. Int. J. Heat Mass Transf. 2017, 109, 958–970. [Google Scholar] [CrossRef]
  13. Ye, X.; Zhao, Y.H.; Quan, Z.H. Experimental study on heat lithium-ion battery based on micro heat pipe array (MHPA). Appl. Therm. Eng. 2018, 130, 74–82. [Google Scholar] [CrossRef]
  14. Yu, Z.; Zhang, J.; Pan, W. A review of battery thermal management systems about heat pipe and phase change materials. J. Energy Storage 2023, 62, 106827. [Google Scholar] [CrossRef]
  15. Han, U.; Jun, Y.J.; Choi, H.; Lee, H. Thermal performance analysis and optimization of heat pipe-assisted hybrid fin structure for lithium battery thermal management for extreme thermal conditions. Int. Commun. Heat Mass Transf. 2023, 149, 107128. [Google Scholar] [CrossRef]
  16. Lin, X.W.; Li, Y.B.; Wu, W.T.; Zhou, Z.F.; Chen, B. Advances on two-phase heat transfer for lithium-ion battery thermal management. Renew. Sustain. Energy Rev. 2024, 189, 114052. [Google Scholar] [CrossRef]
  17. Chaudhari, J.; Singh, G.K.; Rathod, M.K.; Ali, H.M. Experimental and computational analysis on lithium-ion battery thermal management system utilizing air cooling with radial fins. J. Therm. Anal. Calorim. 2024, 149, 203–218. [Google Scholar] [CrossRef]
  18. Lyu, Y.; Siddique, A.R.M.; Majid, S.H.; Biglarbegian, M.; Gadsden, S.A.; Mahmud, S. Electric vehicle battery thermal management system with thermoelectric cooling. Energy Rep. 2019, 5, 822–827. [Google Scholar] [CrossRef]
  19. Lyu, Y.; Siddique, A.R.M.; Gadsden, S.A.; Mahmud, S. Experimental investigation of thermoelectric cooling for a new battery pack design in a copper holder. Results Eng. 2021, 10, 100214. [Google Scholar] [CrossRef]
  20. Liu, X.; Zhang, C.F.; Zhou, J.G.; Xiong, X.; Wang, Y.P. Thermal performance of battery thermal management system using fins to enhance the combination of thermoelectric Cooler and phase change Material. Appl. Energy 2022, 322, 119503. [Google Scholar] [CrossRef]
  21. Hameed, M.M.; Mansor, M.B.; Azau, M.A.M.; Alshara, A.K. Computational design and analysis of LiFePO4 battery thermal management system (BTMS) using thermoelectric cooling/thermoelectric generator (TEC–TEG) in electric vehicles (EVs). J. Energy Storage 2023, 72, 108394. [Google Scholar] [CrossRef]
  22. Park, H. A design of air flow configuration for cooling lithium-ion battery in hybrid electric vehicles. J. Power Source 2013, 239, 30–36. [Google Scholar] [CrossRef]
  23. Liu, Y.; Zhang, J. Design a J-type air-based battery thermal management system through surrogate-based optimization. Appl. Energy 2019, 252, 113426. [Google Scholar] [CrossRef]
  24. Zhang, F.; Lin, A.; Wang, P.; Liu, P. Optimization design of a parallel air-cooled battery thermal management system with spoilers. Appl. Therm. Eng. 2021, 182, 116062. [Google Scholar] [CrossRef]
  25. Chen, J.; Zhao, X.; Wang, B.; Zhang, C.; Xuan, D. Multiobjective optimization of air-cooled battery thermal management system based on heat dissipation model. Ionics 2021, 27, 1307–1322. [Google Scholar] [CrossRef]
  26. Yang, C.; Xi, H.; Wang, M. Structure optimization of air cooling battery thermal management system based on lithium-ion battery. J. Energy Storage 2023, 59, 106538. [Google Scholar] [CrossRef]
  27. Kumar, R.; Singh, L.K.; Gupta, A.K. Evaluating air-cooling performance of lithium-ion-battery module with various cell arrangements. Energy Technol. 2024, 12, 2301061. [Google Scholar] [CrossRef]
  28. Huang, C.-R.; Leong, J.C. Model simplification of lithium-ion battery module heating for electric vehicle. In Proceedings of the 471st International Conference on Heat Transfer and Fluid Flow (ICHTFF), Houston, TX, USA, 23–24 January 2019. [Google Scholar]
  29. Falcone, M.; Palka Bayard De Volo, E.; Hellany, A.; Rossi, C.; Pulvirenti, B. Lithium-ion battery thermal management systems: A survey and new CFD results. Batteries 2021, 7, 86. [Google Scholar] [CrossRef]
  30. Jeon, H.; Hong, S.; Yun, J.; Han, J. Cooling strategy optimization of cylindrical lithium-ion battery pack via multi-counter cooling channels. Energies 2023, 16, 7860. [Google Scholar] [CrossRef]
  31. Isfahani, M.S.; Gharehghani, A.; Saeedipour, S.; Rabiei, M. PCM/metal foam and microchannels hybrid thermal management system for cooling of Li-ion battery. J. Energy Storage 2023, 72, 108789. [Google Scholar] [CrossRef]
  32. Kumar, K.; Sarkar, J.; Mondal, S.S. Multi-scale-multi-domain simulation of novel microchannel-integrated cylindrical Li-ion battery thermal management: Nanoparticle shape effect. J. Energy Storage 2024, 84, 110824. [Google Scholar] [CrossRef]
  33. Li, W.; Wang, Y.; Yang, W.; Zhang, K. Design and optimization of an integrated liquid cooling thermal management system with a diamond-type channel. Therm. Sci. Eng. Prog. 2024, 47, 102325. [Google Scholar] [CrossRef]
  34. Coşkun, T.; Çetkin, E. Cold plate enabling air and liquid cooling simultaneously: Experimental study for battery pack thermal management and electronic cooling. Int. J. Heat Mass Transf. 2023, 217, 124702. [Google Scholar] [CrossRef]
  35. Shahid, S.; Agelin-Chaab, M. Investigation of heat transfer enhancement techniques on a scalable novel hybrid thermal management strategy for lithium-ion battery packs. Batteries 2024, 10, 32. [Google Scholar] [CrossRef]
  36. Tousi, M.; Sarchami, A.; Kiani, M.; Najafi, M.; Houshfar, E. Numerical study of novel liquid-cooled thermal management system for cylindrical Li-ion battery packs under high discharge rate based on AgO nanofluid and copper sheath. J. Energy Storage 2021, 41, 102910. [Google Scholar] [CrossRef]
  37. Kiani, M.; Omiddezyani, S.; Nejad, A.M.; Ashjaee, M.; Houshfar, E. Novel hybrid thermal management for Li-ion batteries with nanofluid cooling in the presence of alternating magnetic field: An experimental study. Case Stud. Therm. Eng. 2021, 28, 101539. [Google Scholar] [CrossRef]
  38. Liao, G.; Wang, W.; Zhang, F.; Jiaqiang, E.; Chen, J.; Leng, E. Thermal performance of lithium-ion battery thermal management system based on nanofluid. Appl. Therm. Eng. 2022, 216, 118997. [Google Scholar] [CrossRef]
  39. Guo, Z.; Wang, Y.; Zhao, S.; Zhao, T.; Ni, M. Investigation of battery thermal management system with considering effect of battery aging and nanofluids. Int. J. Heat Mass Transf. 2023, 202, 123685. [Google Scholar] [CrossRef]
  40. Khateeb, S.A.; Amiruddin, S.; Farid, M.; Selman, J.R.; Al-Hallaj, S.A. Thermal management of Li-ion battery with phase change material for electric scooters: Experimental validation. J. Power Source 2005, 142, 345–353. [Google Scholar] [CrossRef]
  41. Duan, X.; Naterer, G.F. Heat transfer in phase change materials for thermal management of electric vehicle battery modules. Int. J. Heat Mass Transf. 2010, 53, 5176–5182. [Google Scholar] [CrossRef]
  42. Li, W.Q.; Qu, Z.G.; He, Y.L.; Tao, Y.B. Experimental study of a passive thermal management system for high-powered lithium-ion batteries using porous metal foam saturated with phase materials. J. Power Source 2014, 255, 9–15. [Google Scholar] [CrossRef]
  43. Wilke, S.; Schweitzer, B.; Khateeb, S.; Al-Hallaj, S.A. Preventing thermal runaway propagation in lithium ion battery packs using a phase change composite material: An experimental study. J. Power Source 2017, 340, 51–59. [Google Scholar] [CrossRef]
  44. Nasajpour-Esfahani, N.; Garmestani, H.; Rozati, M.; Smaisim, G.F. The role of phase change materials in lithium-ion batteries: A brief review on current materials, thermal management systems, numerical methods, and experimental models. J. Energy Storage 2023, 63, 107061. [Google Scholar] [CrossRef]
  45. Talele, V.; Thorat, P.; Gokhale, Y.P.; Desai, H. Technical review on battery thermal management system for electric vehicle application. In Energy Storage Systems; Springer: Singapore, 2023; pp. 177–225. [Google Scholar]
  46. Lakhotia, V.K.; Kumar, R.S. Review on various types of battery thermal management systems. J. Therm. Anal. Calorim. 2023, 148, 12335–12368. [Google Scholar] [CrossRef]
  47. Zhou, R.; Chen, Y.; Zhang, J.; Guo, P. Research progress in liquid cooling technologies to enhance the thermal management of LIBs. Mater. Adv. 2023, 4, 4011–4040. [Google Scholar] [CrossRef]
  48. Chen, M.; Yu, Y.; Ouyang, D.; Weng, J.; Zhao, L.; Wang, J.; Chen, Y. Research progress of enhancing battery safety with phase change materials. Renew. Sustain. Energy Rev. 2024, 189, 113921. [Google Scholar] [CrossRef]
  49. Sabbah, R.; Kizilel, R.; Selman, J.R.; Al-Hallaj, S.A. Active (air-cooled) vs. passive (phase change material) thermal management of high power lithium-ion packs: Limitation of temperature rise and uniformity of temperature distribution. J. Power Source 2008, 182, 630–638. [Google Scholar] [CrossRef]
  50. Kizilel, R.; Sabbah, R.; Selman, J.R.; Al-Hallaj, S.A. An alternative cooling system to enhance the safety of Li-ion battery packs. J. Power Source 2009, 194, 1105–1112. [Google Scholar] [CrossRef]
  51. Ramandi, M.Y.; Dincer, I.; Naterer, G.F. Heat transfer and thermal management of electric vehicle batteries with phase change materials. Heat Mass Transf. 2011, 47, 777–788. [Google Scholar] [CrossRef]
  52. Ling, Z.Y.; Chen, J.J.; Fang, X.M.; Zhang, Z.G.; Xu, T.; Gao, X.N.; Wang, S.F. Experimental and numerical investigation of the application of phase change materials in a simulative power batteries thermal management system. Appl. Energy 2014, 121, 104–113. [Google Scholar] [CrossRef]
  53. Jiang, G.W.; Huang, J.H.; Fu, Y.S.; Cao, M.; Liu, M.C. Thermal optimization of composite phase change material/expanded graphite for Li-ion battery thermal management. Appl. Therm. Eng. 2016, 108, 1119–1125. [Google Scholar] [CrossRef]
  54. Bai, F.F.; Chen, M.B.; Song, W.J.; Feng, Z.P.; Li, Y.L.; Ding, Y.L. Thermal management performances of PCM/water cooling-plate using for lithium-ion battery module based on non-uniform internal heat source. Appl. Therm. Eng. 2017, 126, 17–27. [Google Scholar] [CrossRef]
  55. Zhao, C.; Li, Y.; Liu, Y.; Zhu, D.; Ma, M.; Yu, W. Polyurethane foam skeleton-based phase change hydrogel for efficient battery thermal management with favorable antivibration performance. ACS Appl. Mater. Interfaces 2023, 15, 49653–49664. [Google Scholar] [CrossRef] [PubMed]
  56. Kiani, M.; Ansari, M.; Arshadi, A.A.; Houshfar, E.; Ashjaee, M. Hybrid thermal management of lithium-ion batteries using nanofluid, metal foam, and phase change material: An integrated numerical–experimental approach. J. Therm. Anal. Calorim. 2020, 141, 1703–1715. [Google Scholar] [CrossRef]
  57. Liu, H.; Shi, G.; Mei, J.; Li, Q.; Wang, Z. Experimental study on the thermal management performance of lithium-ion battery using phase-change material at various ambient temperatures. Energy Technol. 2024, 12, 2300790. [Google Scholar] [CrossRef]
  58. Huo, Z.; Hong, X.; Li, Y.; Chen, Z.; Ruan, D. Numerical study of paraffin and glass fiber composites for thermal management of lithium-ion battery packs. Asia-Pac. J. Chem. Eng. 2024, 19, e2989. [Google Scholar] [CrossRef]
  59. Li, Z.R.; Liang, G.N.; Ding, Y.D.; Liao, Q.; Zhu, X.; Cheng, M. Experimental study on the thermal management performance of lithium-ion battery with PCM combined with 3-D finned tube. Appl. Therm. Eng. 2024, 245, 122794. [Google Scholar] [CrossRef]
  60. Sadrameli, S.M.; Azizi, Y. Thermal management of a LiFEPO4 battery pack in a cold temperature environment using phase change materials (PCMs). JOM 2024, 76, 853–862. [Google Scholar] [CrossRef]
  61. Temel, U.N.; Kilinc, F.; Coskun, S. Thermal protection performances of the macro and/or nano enhanced PCM in a representative battery pack. Nanosc. Microsc. Therm. 2022, 26, 52–66. [Google Scholar] [CrossRef]
  62. Jilte, R.; Afzal, A.; Panchal, S. A novel battery thermal management system using nano-enhanced phase change materials. Energy 2021, 219, 119564. [Google Scholar] [CrossRef]
  63. Mohammad, M.H.; Sepehr, M.; Majid, S. Battery thermal management with thermal energy storage composites of PCM, metal foam, fin and nanoparticle. J. Energy Storage 2020, 28, 101235. [Google Scholar]
  64. Yousefi, E.; Khaboshan, H.N.; Jaliliantabar, F.; Abdullah, A.A. The effect of different enclosure materials and NePCMs on performance of battery thermal management system. Mater. Today Proc. 2023, 75, 1–9. [Google Scholar] [CrossRef]
  65. Malekipour, M.; Sabzpooshani, M.; Houshfar, E. Investigation on the effect of addition of nano-titanium oxide particles to phase change material in a hybrid system for battery cooling under constant heat flux. MEJ 2021, 53, 4379–4396. [Google Scholar]
  66. Jindal, P.; Sharma, P.; Kundu, M.; Singh, S.; Shukla, D.K.; Pawar, V.J.; Wei, Y.; Breedon, P. Computational fluid dynamics (CFD) analysis of graphene nanoplatelets for the cooling of a multiple tier Li-ion battery pack. Therm. Sci. Eng. Prog. 2022, 31, 101282. [Google Scholar] [CrossRef]
  67. Faraji, H.; Yıldız, Ç.; Arshad, A.; Arıcı, M.; Choukairy, K.; El Alami, M. Passive thermal management strategy for cooling multiple portable electronic components: Hybrid nanoparticles enhanced phase change materials as an innovative solution. J. Energy Storage 2023, 70, 108087. [Google Scholar] [CrossRef]
  68. Weragoda, D.M.; Tian, G.; Cai, Q.; Zhang, T.; Lo, K.H.; Gao, Y. Conceptualization of a novel battery thermal management system based on capillary-driven evaporative cooling. Therm. Sci. Eng. Prog. 2024, 47, 102320. [Google Scholar] [CrossRef]
  69. Haghighi, E.B.; Moghaddam, M. Analyzing thermal management methods of Li-ion battery modules. In Proceedings of the IEEE International Telecommunications Energy Conference (INTELEC), Turino, Italy, 7–11 October 2018. [Google Scholar]
  70. Singh, L.K.; Kumar, R.; Gupta, A.K.; Sharma, A.K.; Panchal, S. Computational study on hybrid air-PCM cooling inside lithium-ion battery packs with varying number of cells. J. Energy Storage 2023, 67, 107649. [Google Scholar] [CrossRef]
  71. Fan, R.; Zheng, N.; Sun, Z. Evaluation of fin intensified phase change material systems for thermal management of Li-ion battery modules. Int. J. Heat Mass Transf. 2021, 166, 120753. [Google Scholar] [CrossRef]
  72. Sun, Z.; Fan, R.; Zheng, N. Thermal management of a simulated battery with the compound use of phase change material and fins: Experimental and numerical investigations. Int. J. Therm. Sci. 2021, 165, 106945. [Google Scholar] [CrossRef]
  73. Weng, J.; Ouyang, D.; Yang, X.; Chen, M.; Zhang, G.; Wang, J. Optimization of the internal fin in a phase-change-material module for battery thermal management. Appl. Therm. Eng. 2020, 167, 114698. [Google Scholar] [CrossRef]
  74. Chen, H.; Abidi, A.; Hussein, A.K.; Younis, O.; Degani, M.; Heidarshenas, B. Investigation of the use of extended surfaces in paraffin wax phase change material in thermal management of a cylindrical lithium-ion battery: Applicable in the aerospace industry. J. Energy Storage 2022, 45, 103685. [Google Scholar] [CrossRef]
  75. Dagdevir, T.; Ding, Y. Numerical investigation of battery thermal management by using helical fin and composite phase change material. J. Energy Storage 2024, 75, 109674. [Google Scholar] [CrossRef]
  76. Choudhari, V.G.; Dhoble, A.S.; Panchal, S. Numerical analysis of different fin structures in phase change material module for battery thermal management system and its optimization. Int. J. Heat Mass Transf. 2020, 163, 120434. [Google Scholar] [CrossRef]
  77. Mansir, I.B.; Sinaga, N.; Farouk, N.; Aljaghtham, M.; Diyoke, C.; Nguyen, D.D. Numerical simulation of dimensions and arrangement of triangular fins mounted on cylindrical lithium-ion batteries in passive thermal management. J. Energy Storage 2022, 50, 104392. [Google Scholar] [CrossRef]
  78. Zhang, F.; Lu, F.; Liang, B.; Zhu, Y.; Gou, H.; Xiao, K.; He, Y. Thermal performance analysis of a new type of branch-fin enhanced battery thermal management PCM module. Renew. Energy 2023, 206, 1049–1063. [Google Scholar] [CrossRef]
  79. Liu, H.; Jin, C.; Li, H.; Ji, Y. A numerical study of PCM battery thermal management performance enhancement with fin structures. Energy Rep. 2023, 9, 1793–1802. [Google Scholar] [CrossRef]
  80. Wu, C.; Qiu, C.; Yuan, X.; Yuan, N.; Zhang, B.; Li, Y.; Qin, L.; Shi, H. Numerical study and optimization of battery thermal management systems (BTMS) Based on Fin-Phase change material (PCM) in variable gravity environments. Appl. Therm. Eng. 2024, 224, 122777. [Google Scholar] [CrossRef]
  81. Rashidi, S.; Ijadi, A.; Dadashi, Z. Potentials of porous materials for temperature control of lithium-ion batteries. J. Energy Storage 2022, 51, 104457. [Google Scholar] [CrossRef]
  82. Ranjbaran, Y.S.; Haghparast, S.J.; Shojaeefard, M.H.; Molaeimanesh, G.R. Numerical evaluation of a thermal management system consisting PCM and porous metal foam for Li-ion batteries. J. Therm. Anal. Calorim. 2020, 141, 1717–1739. [Google Scholar] [CrossRef]
  83. Bamdezh, M.A.; Molaeimanesh, G.R.; Zanganeh, S. Role of foam anisotropy used in the phase-change com-posite material for the hybrid thermal management system of lithium-ion battery. J. Energy Storage 2020, 32, 101778. [Google Scholar] [CrossRef]
  84. Sudhakaran, S.; Terese, M.; Mohan, Y.; Thampi, A.D.; Rani, S. Influence of various parameters on the cooling performance of battery thermal management systems based on phase change materials. Appl. Therm. Eng. 2023, 222, 119936. [Google Scholar] [CrossRef]
  85. Liu, G.; Xiao, T.; Wei, P.; Meng, X.; Yang, X.; Yan, J.; He, Y.L. Experimental and numerical studies on melt-ing/solidification of PCM in a horizontal tank filled with graded metal foam. Sol. Energy Mater. Sol. Cells 2023, 250, 112092. [Google Scholar] [CrossRef]
  86. Kurşun, B.; Toklu, E.; Polat, F.; Balta, M. The effect of outer container geometry on the thermal management of lithium-ion batteries with a combination of phase change material and metal foam. J. Energy Storage 2024, 80, 110227. [Google Scholar] [CrossRef]
  87. Nield, D.A.; Bejan, A. Convection in Porous Media, 3rd ed.; Springer: New York, NY, USA, 2006. [Google Scholar]
  88. Du Plessis, P.; Montillet, A.; Comiti, J.; Legrand, J. Pressure drop prediction for flow through high porosity metallic foams. Chem. Eng. Sci. 1994, 49, 3545–3553. [Google Scholar] [CrossRef]
  89. Yang, X.H.; Lu, T.J.; Kim, T. A simplistic model for the tortuosity in two-phase close-celled porous media. J. Phys. D Appl. 2013, 46, 125305. [Google Scholar] [CrossRef]
  90. Kitamura, K.; Kami-iwa, F.; Misumi, T. Heat transfer and fluid flow of natural convection around large horizontal cylinders. Int. J. Heat Mass Transf. 1999, 42, 4093–4106. [Google Scholar] [CrossRef]
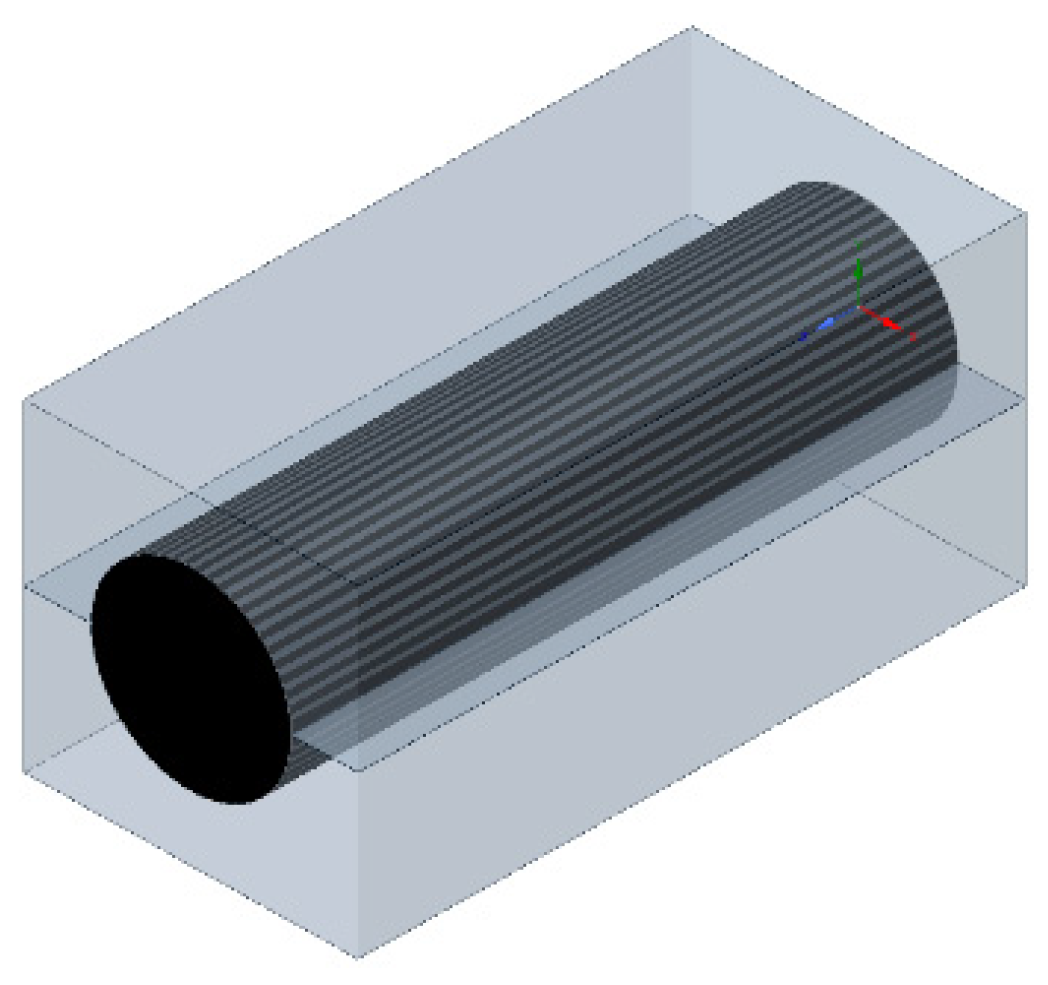
Figure 1. The single 21700 lithium-ion battery model.
Energies 17 01553 g001
Figure 2. The four-battery model: (a) vertical and unidirectional; (b) horizontal and crossover.
Energies 17 01553 g002
Figure 3. Dimensions and mesh arrangement of a single-battery pack.
Energies 17 01553 g003
Figure 4. Temperature field in a horizontally placed single-battery pack filled with air.
Energies 17 01553 g004
Figure 5. Flow field in a horizontally placed single-battery pack filled with air.
Energies 17 01553 g005
Figure 6. Comparison of temperature distribution in a single-battery pack when placed horizontally (foam ϕ = 0.9).
Energies 17 01553 g006
Figure 7. Comparison of temperature distribution in a single-battery pack when placed vertically (foam ϕ = 0.9).
Energies 17 01553 g007
Figure 8. Temperature field in a unidirectional and horizontal battery pack filled with air.
Energies 17 01553 g008
Figure 9. Changes in temperature and velocity in a unidirectional and vertical battery pack filled with air.
Energies 17 01553 g009
Figure 10. Temperature field in a unidirectional and horizontal battery pack filled with PCM.
Energies 17 01553 g010
Figure 11. Changes in temperature and liquid fraction in a unidirectional and vertical battery pack filled with PCM.
Energies 17 01553 g011
Figure 12. The effect of copper foam on the temperature and flow fields in a unidirectional and horizontal battery pack.
Energies 17 01553 g012
Figure 13. The effect of copper foam on the temperature and flow fields in a unidirectional and vertical battery pack.
Energies 17 01553 g013
Figure 14. Comparison of temperature distribution in a unidirectional and horizontal battery pack (foam ϕ = 0.9).
Energies 17 01553 g014
Figure 15. Comparison of temperature distribution in a unidirectional and vertical battery pack (foam ϕ = 0.9).
Energies 17 01553 g015
Figure 16. Comparison of temperature distribution in air-cooled battery packs when placed horizontally and in different arrangements: (left) unidirectional; (right) crossover.
Energies 17 01553 g016
Figure 17. Comparison of temperature distribution in air-cooled battery packs when placed vertically and in different arrangements: (left) unidirectional; (right) crossover.
Energies 17 01553 g017
Figure 18. Comparison of temperature distribution in a crossover and horizontal battery pack (foam ϕ = 0.9).
Energies 17 01553 g018
Figure 19. Comparison of temperature distribution in a crossover and vertical battery pack (foam ϕ = 0.9).
Energies 17 01553 g019
Figure 20. Comparison of heat flux (in W/m2) for different battery arrangements: (a) horizontal and unidirectional; (b) vertical and unidirectional; (c) horizontal and crossover; and (d) vertical and crossover.
Energies 17 01553 g020
Figure 21. The change in volumetric average battery temperature when cooled using copper foam saturated with air at different porosities: (a) ϕ = 1.0 and (b) ϕ ≠ 1.0.
Energies 17 01553 g021
Figure 22. The change in volumetric average battery temperature when cooled using copper foam saturated with PCM.
Energies 17 01553 g022
Figure 23. The influence of porosity in copper foam saturated with PCM on the volumetric average battery temperature at DoD = 100%.
Energies 17 01553 g023
Table 1. The specifications of a 21700 lithium-ion battery [69].
SpecificationValue
Rated discharge capacity (1C-rate)3.2 Ah
Nominal voltage3.56 V
Rated discharge energy11.4 Wh
Density2560 kg/m3
Heat capacity1000 J/kg·K
Radial thermal conductivity1 W/m·K
Axial thermal conductivity25 W/m·K
Tangential thermal conductivity25 W/m·K
Internal resistance53 mΩ
Table 2. The material properties of PCMs [63].
Material ParametersSolid (≤25 °C)Liquid (≥50 °C)
Density ρ (kg/m3)910769
Thermal conductivity λ (W/m·K)0.4230.146
Specific heat capacity Cp (J/kg·K)19262400
Thermal expansion coefficient β (1/K)8.161 × 10−4
Reference temperature Tref (°C)50
Melting point Tm (°C)36.4
Latent heat of fusion L (kJ/kg)248
Table 3. The material parameters of pure copper and air.
Material ParametersPure CopperAir
Density ρ (kg/m3)8978varies 1
Thermal conductivity λ (W/m·K)387.60.0242
Specific heat capacity Cp (J/kg·K)3811006.43
Dynamic viscosity μ (kg/m·s)1.7894 × 10−5
1 Air density varies with temperature and is estimated through the equation of state.
Table 4. The thermal generation rates at different discharge C-rates [69].
C-RateHeat Generation Rate (W)
0.50.16
10.65
1.51.47
22.61
Disclaimer/Publisher’s Note: The statements, opinions and data contained in all publications are solely those of the individual author(s) and contributor(s) and not of MDPI and/or the editor(s). MDPI and/or the editor(s) disclaim responsibility for any injury to people or property resulting from any ideas, methods, instructions or products referred to in the content.