
Design Procedure of Cascaded Multilevel Inverter for High-Power Amplifier in SONAR System


Abstract
1. Introduction
2. Amplifier Topology for SONAR Systems
2.1. SONAR Sensor Characteristics
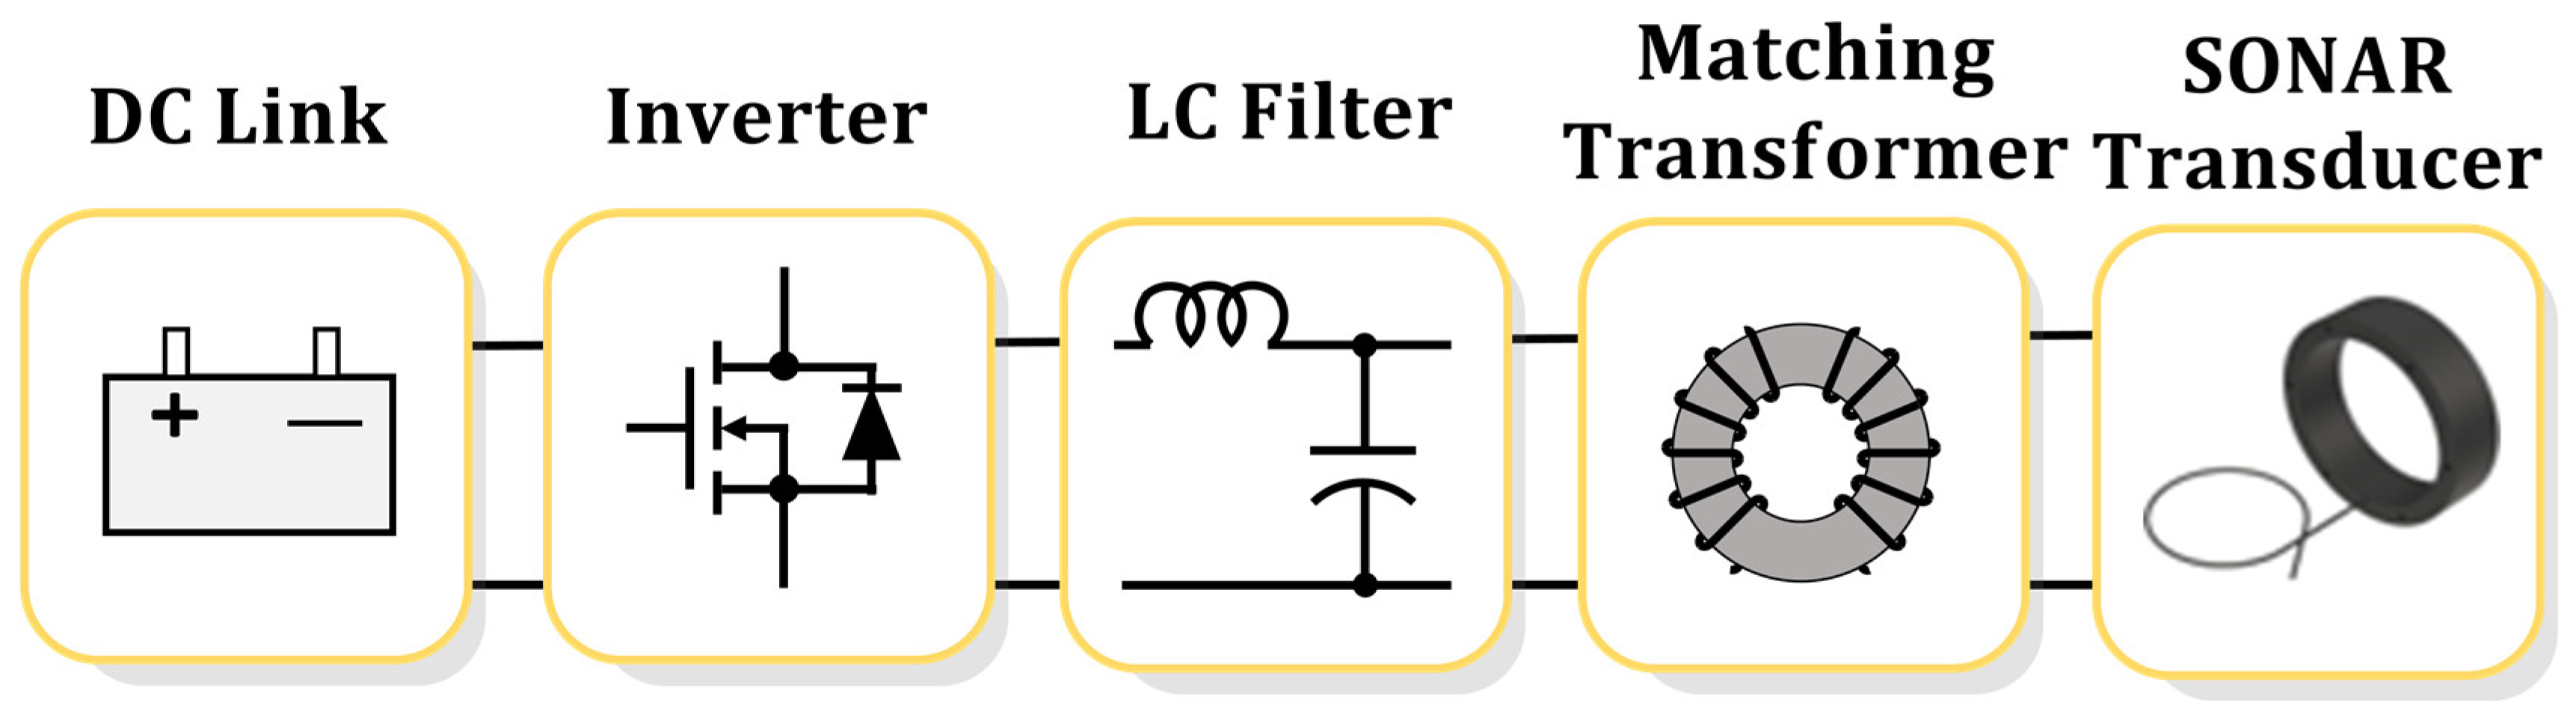
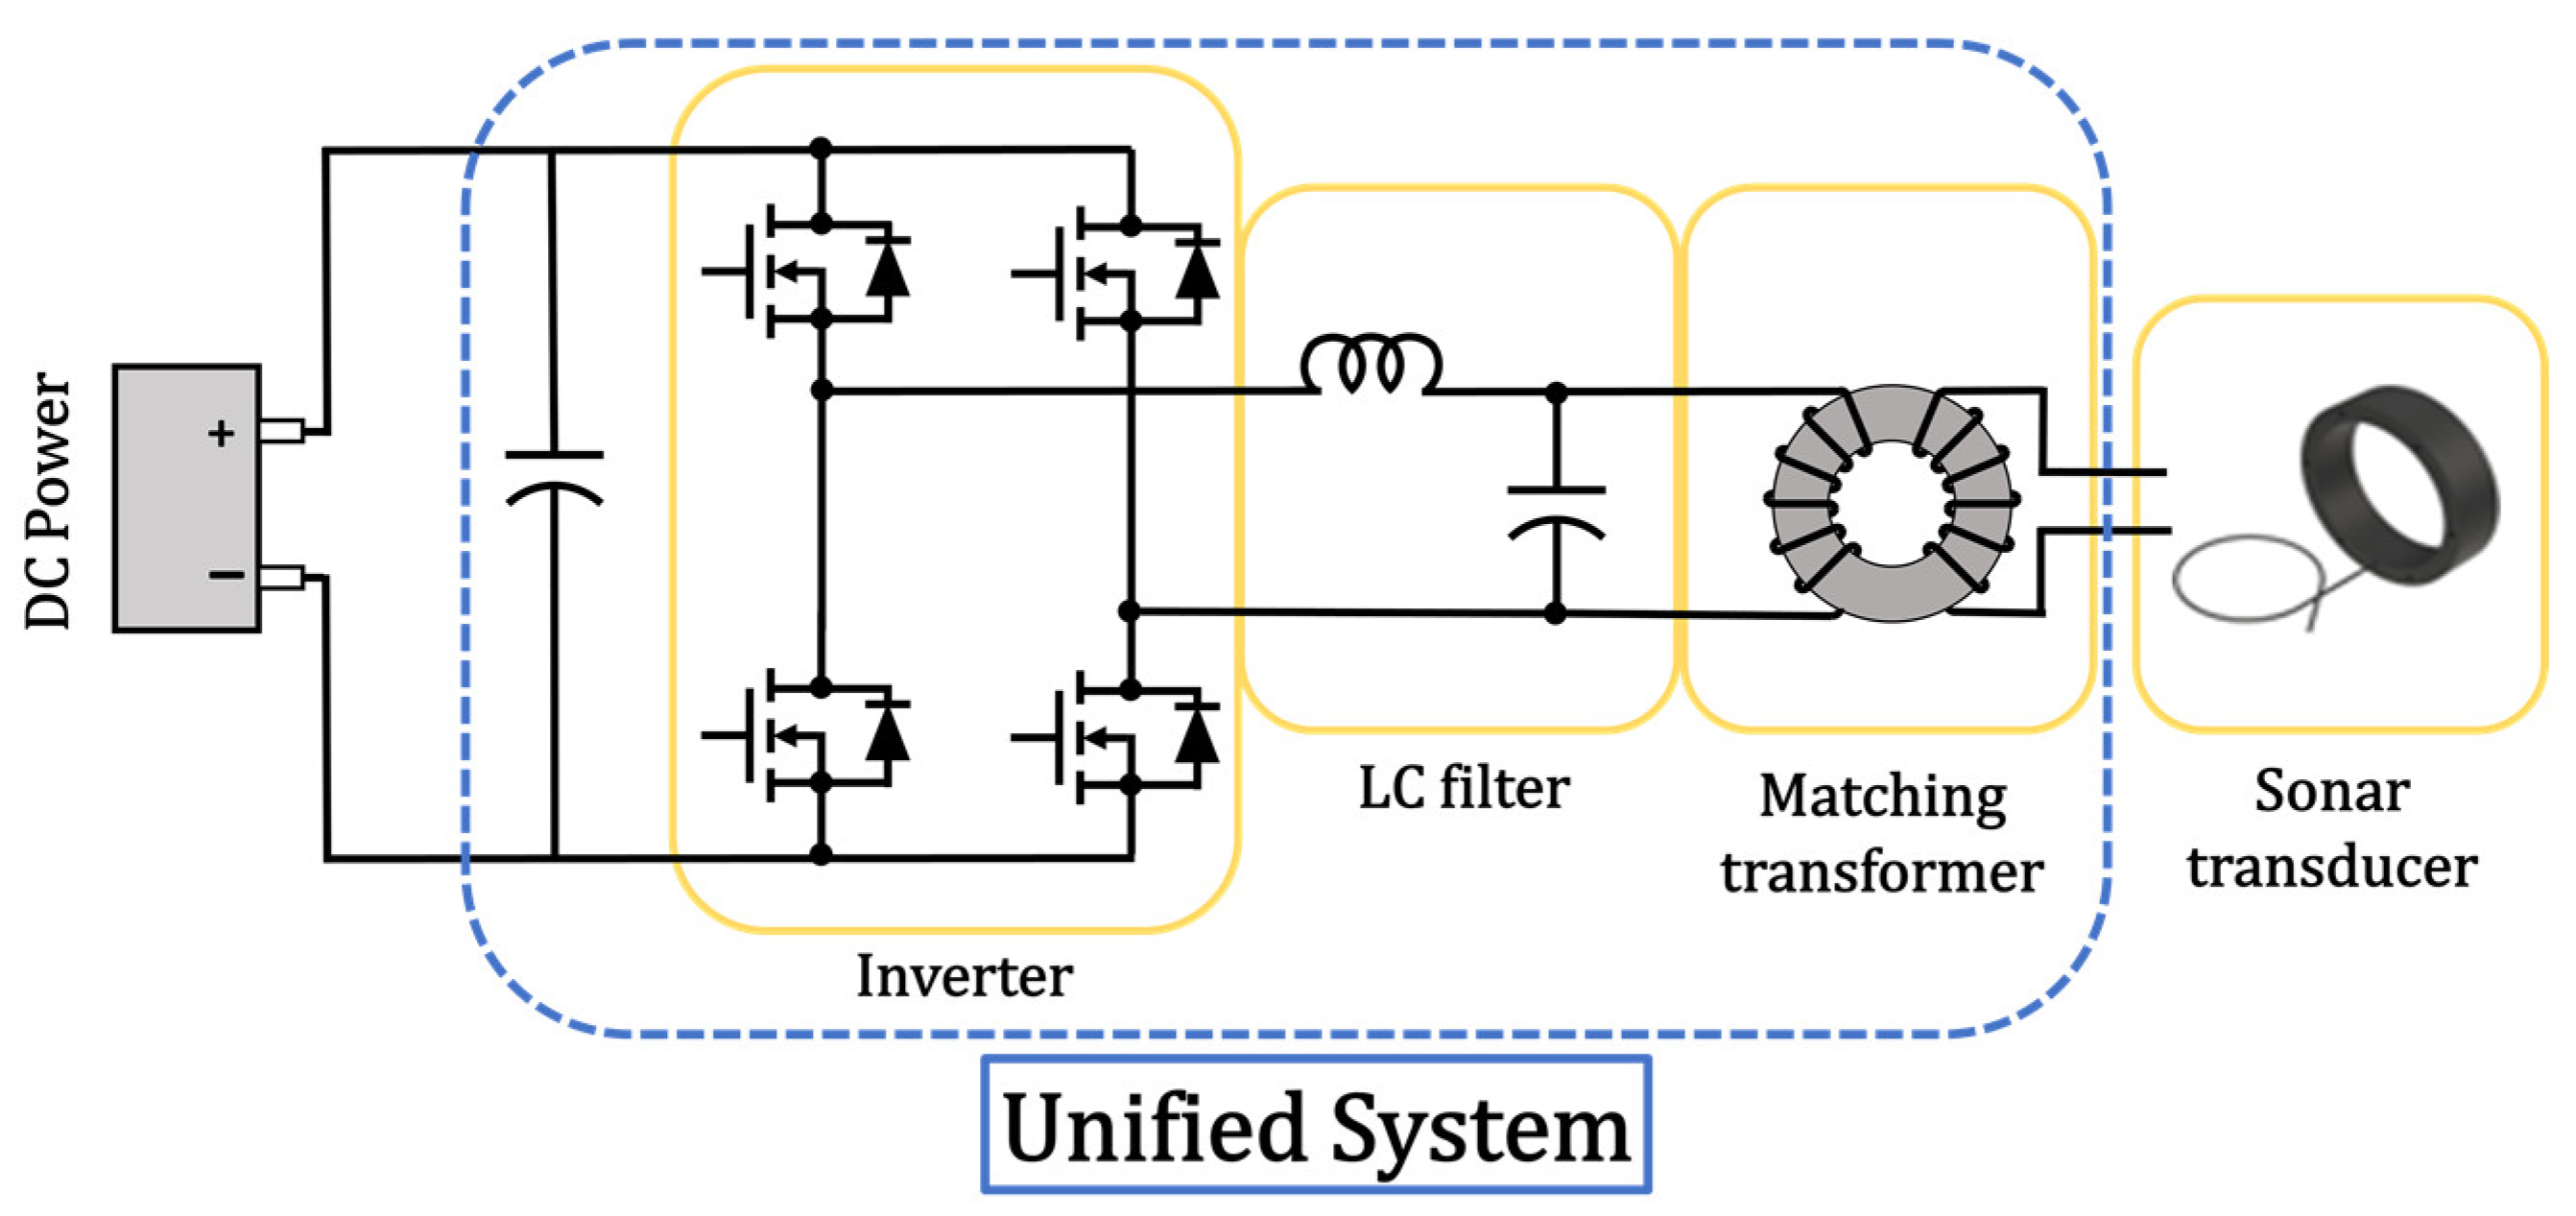
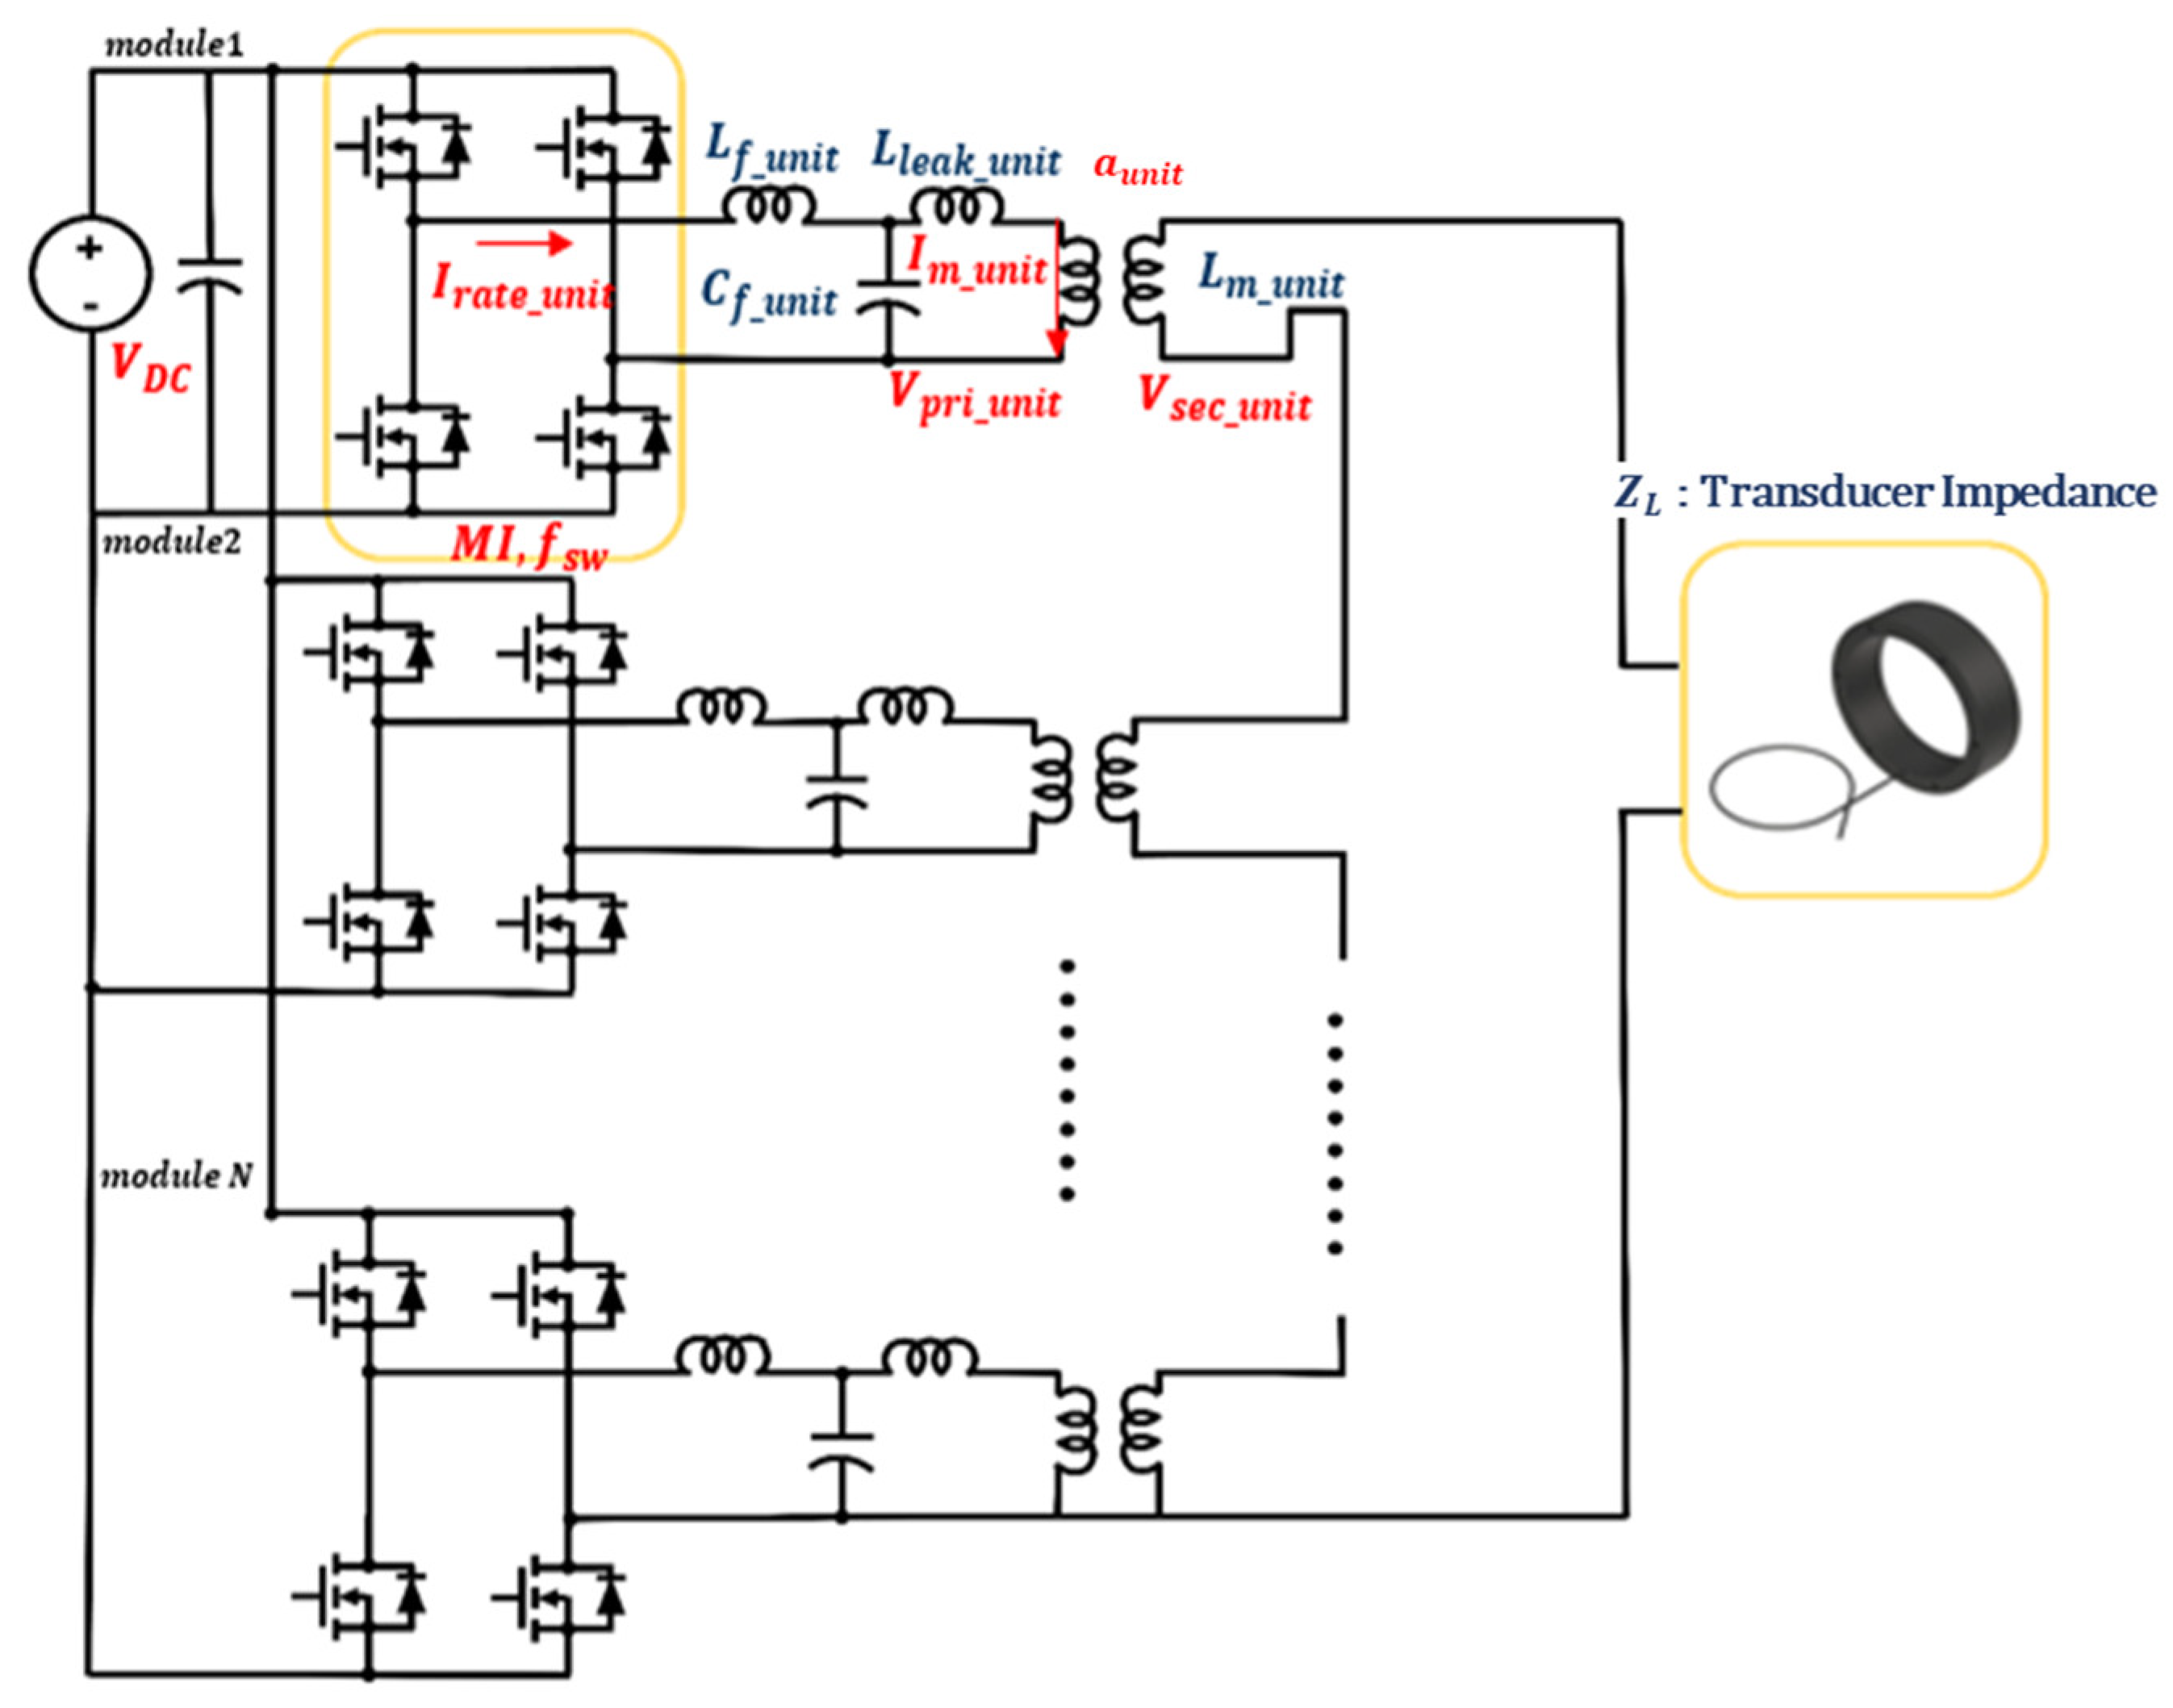
2.2. High-Power Amplifier Topology
- Improvement in harmonic quality owing to the LC filter;
- Increase in power efficiency owing to the reduction in the amplifier reactive power via the matching transformer;
- Prevention of energy sharing between serial modules based on phase delays caused by the LC filter and matching transformer in each serial module;
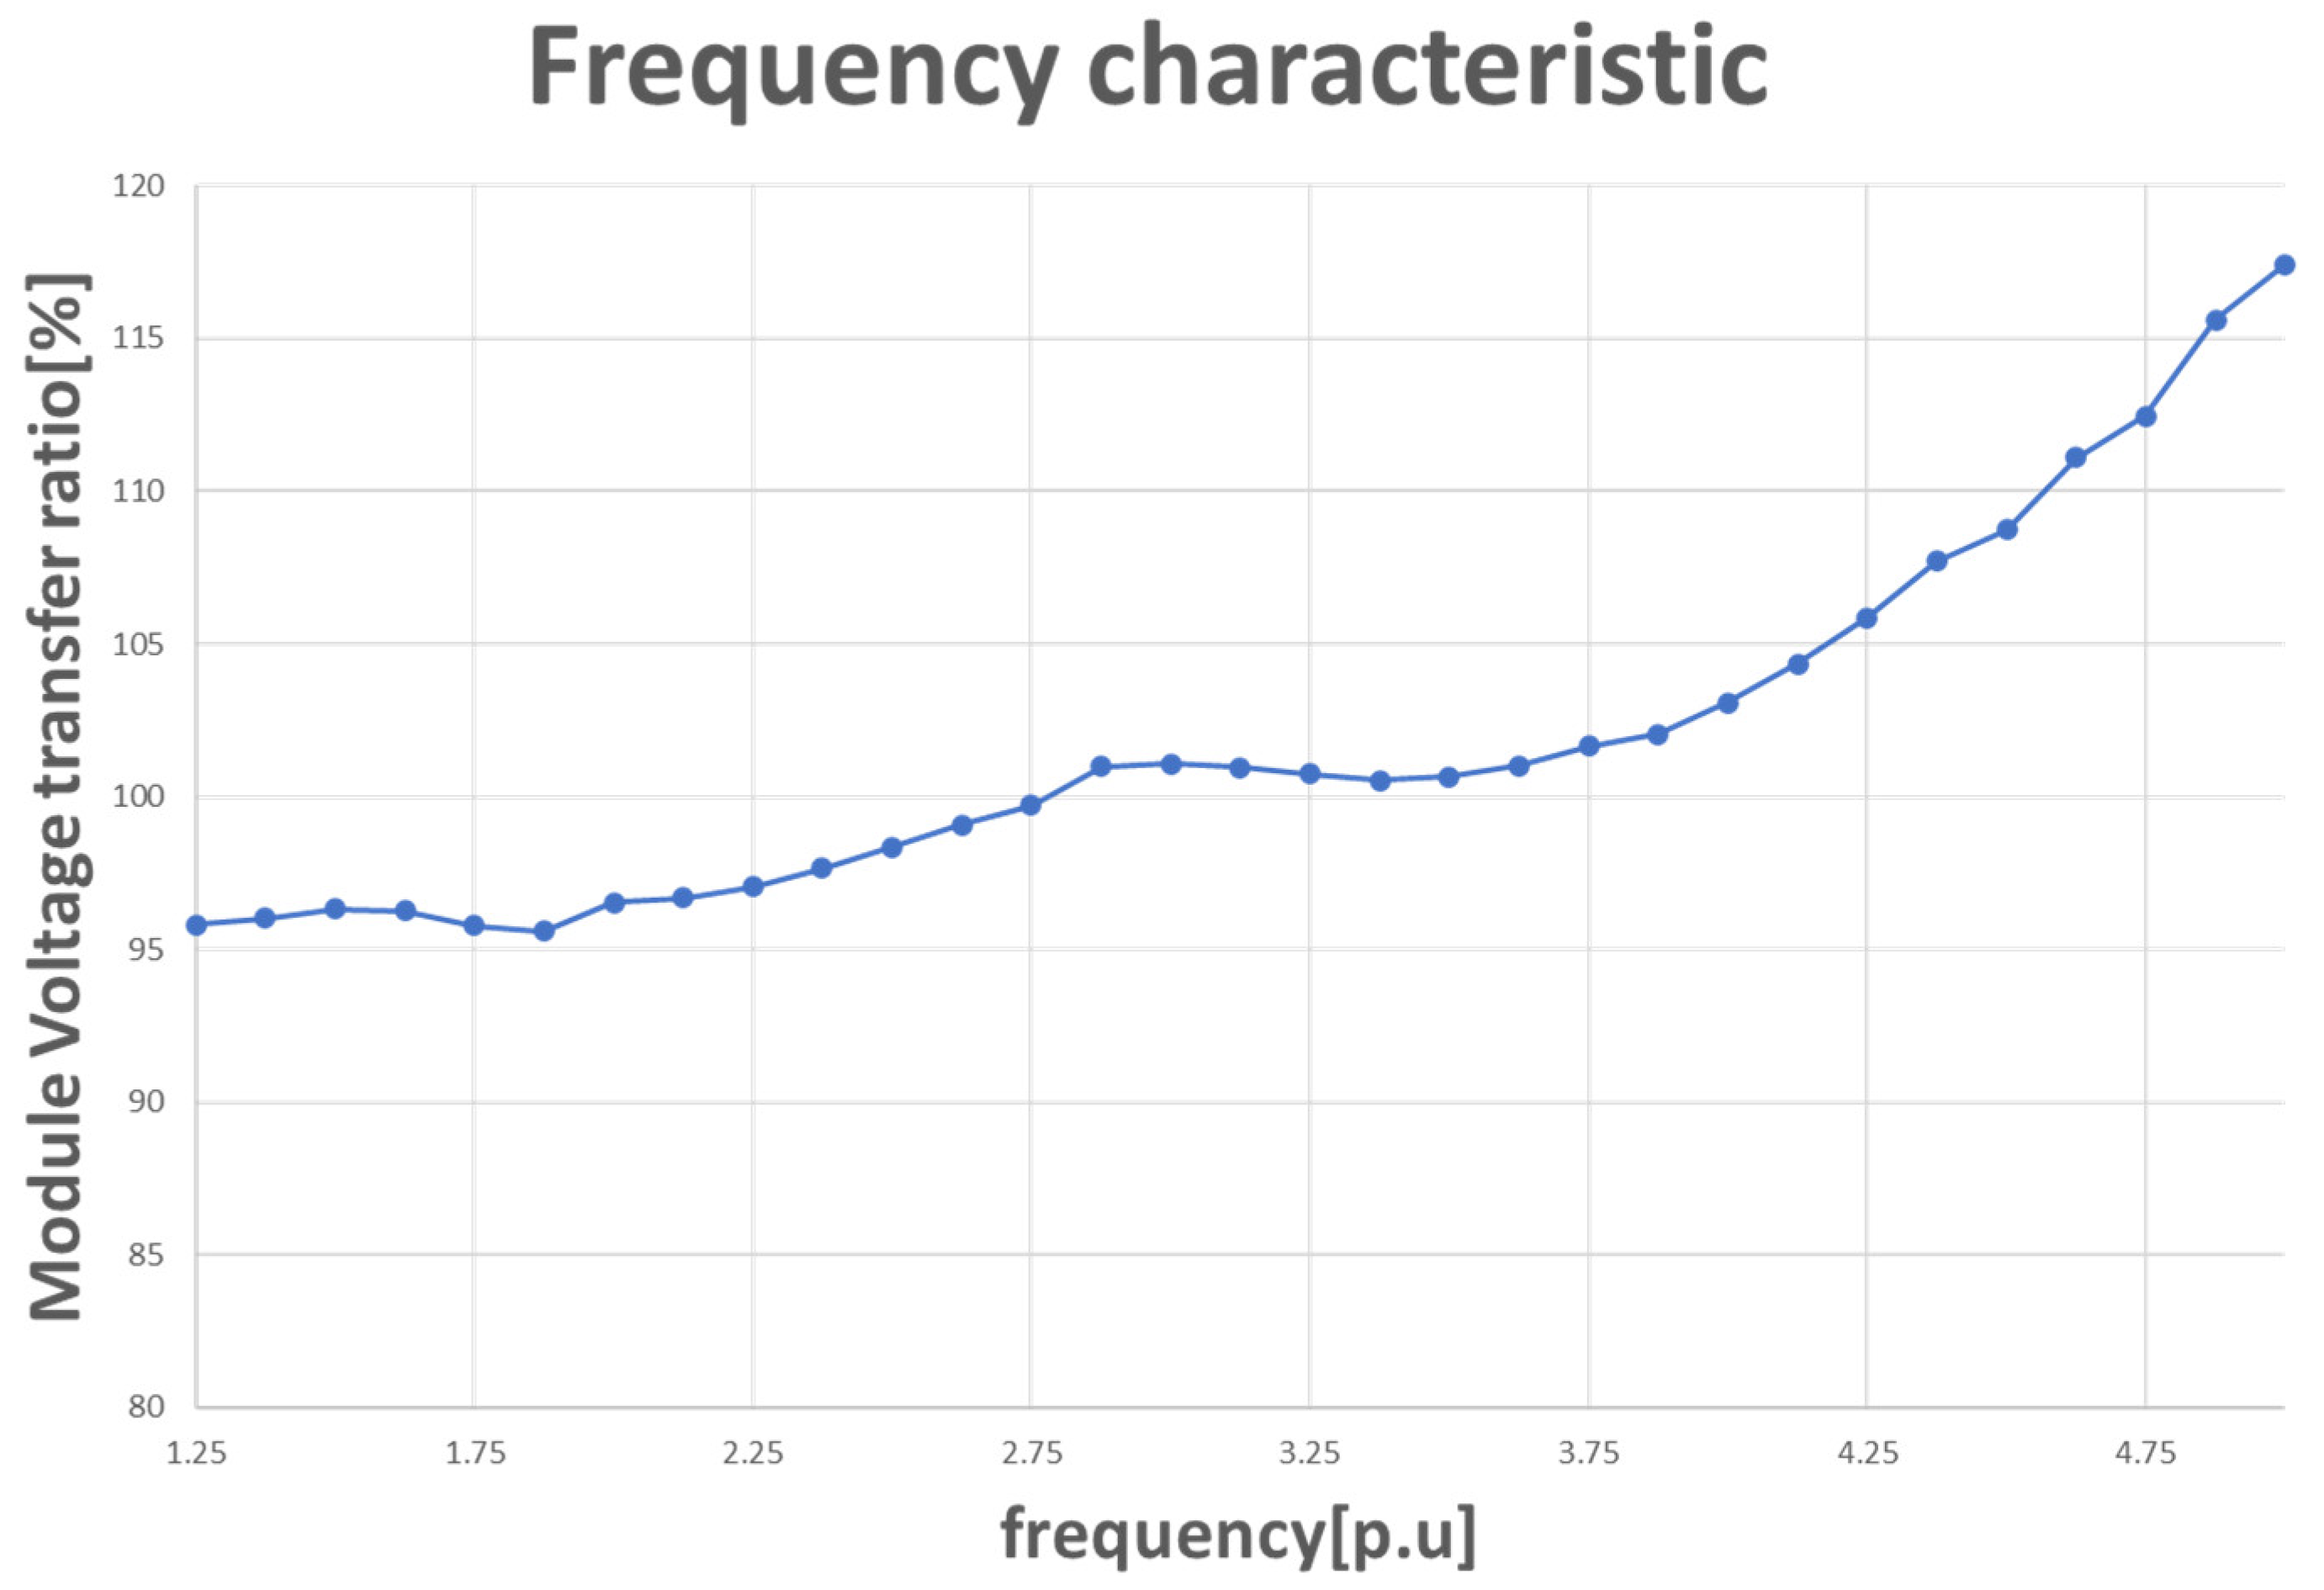
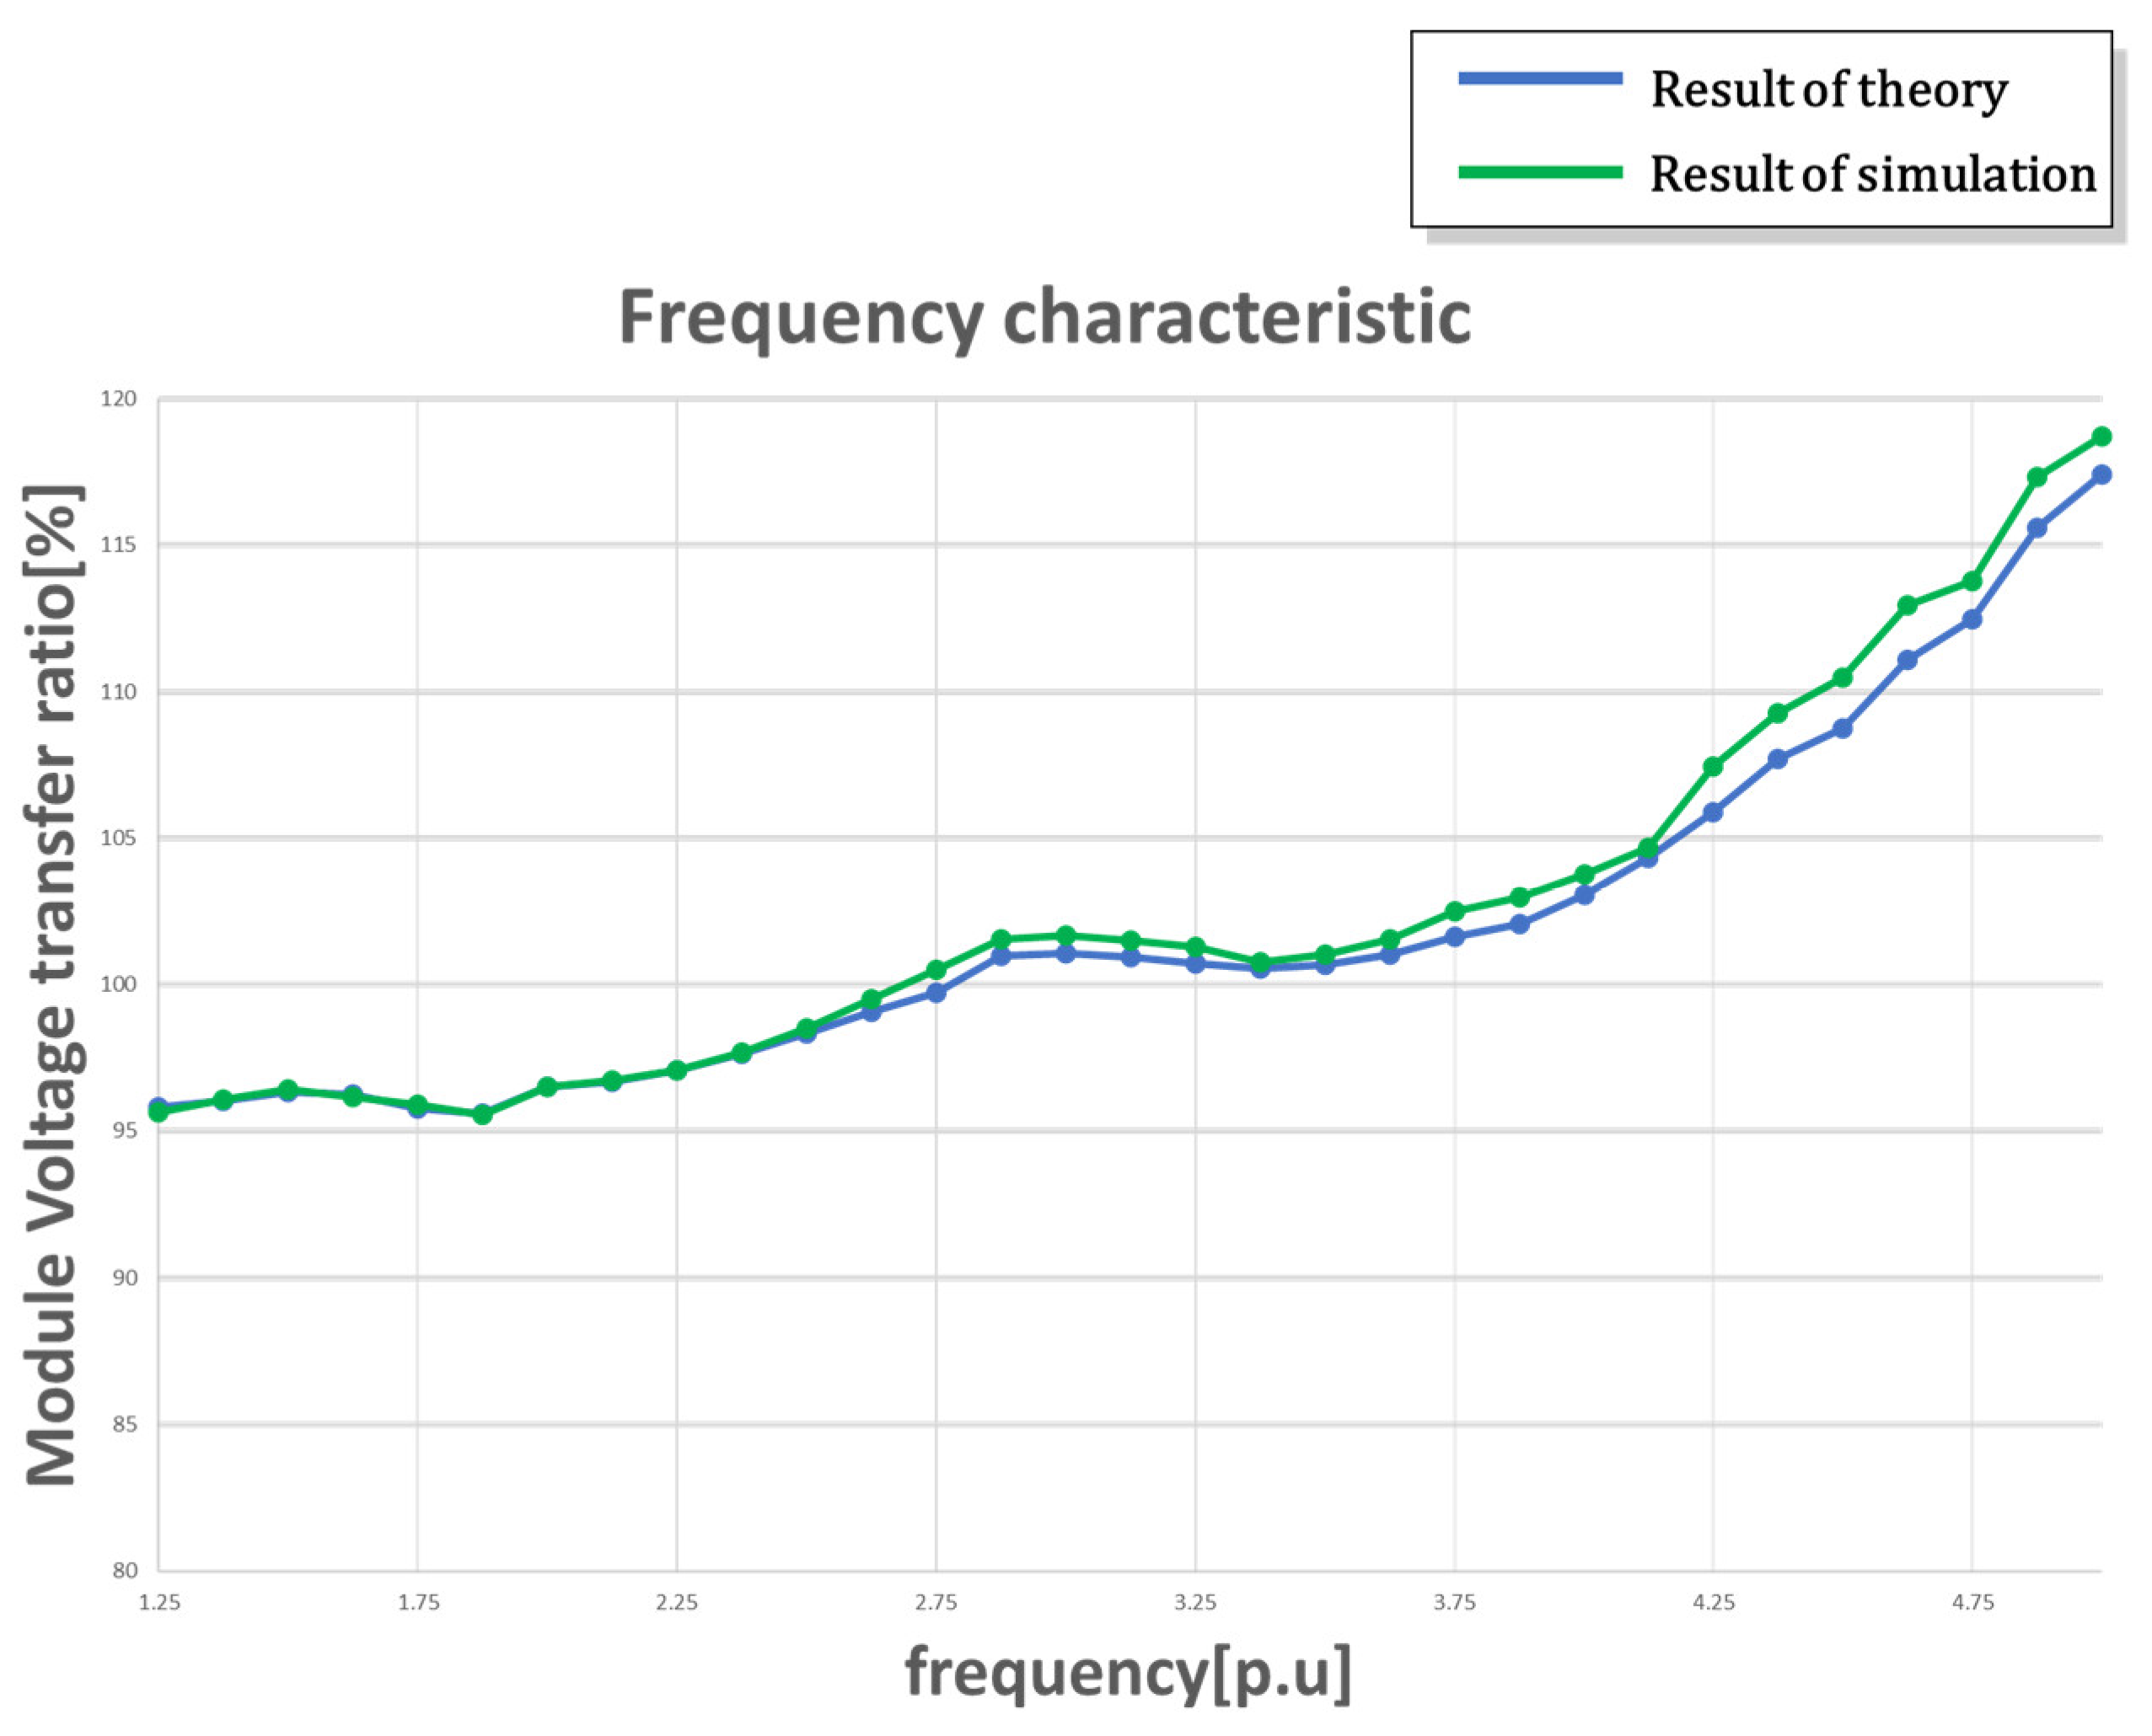
- Minimal changes in the voltage delivery characteristics of the amplifier output within the operating frequency range of the SONAR sensor.
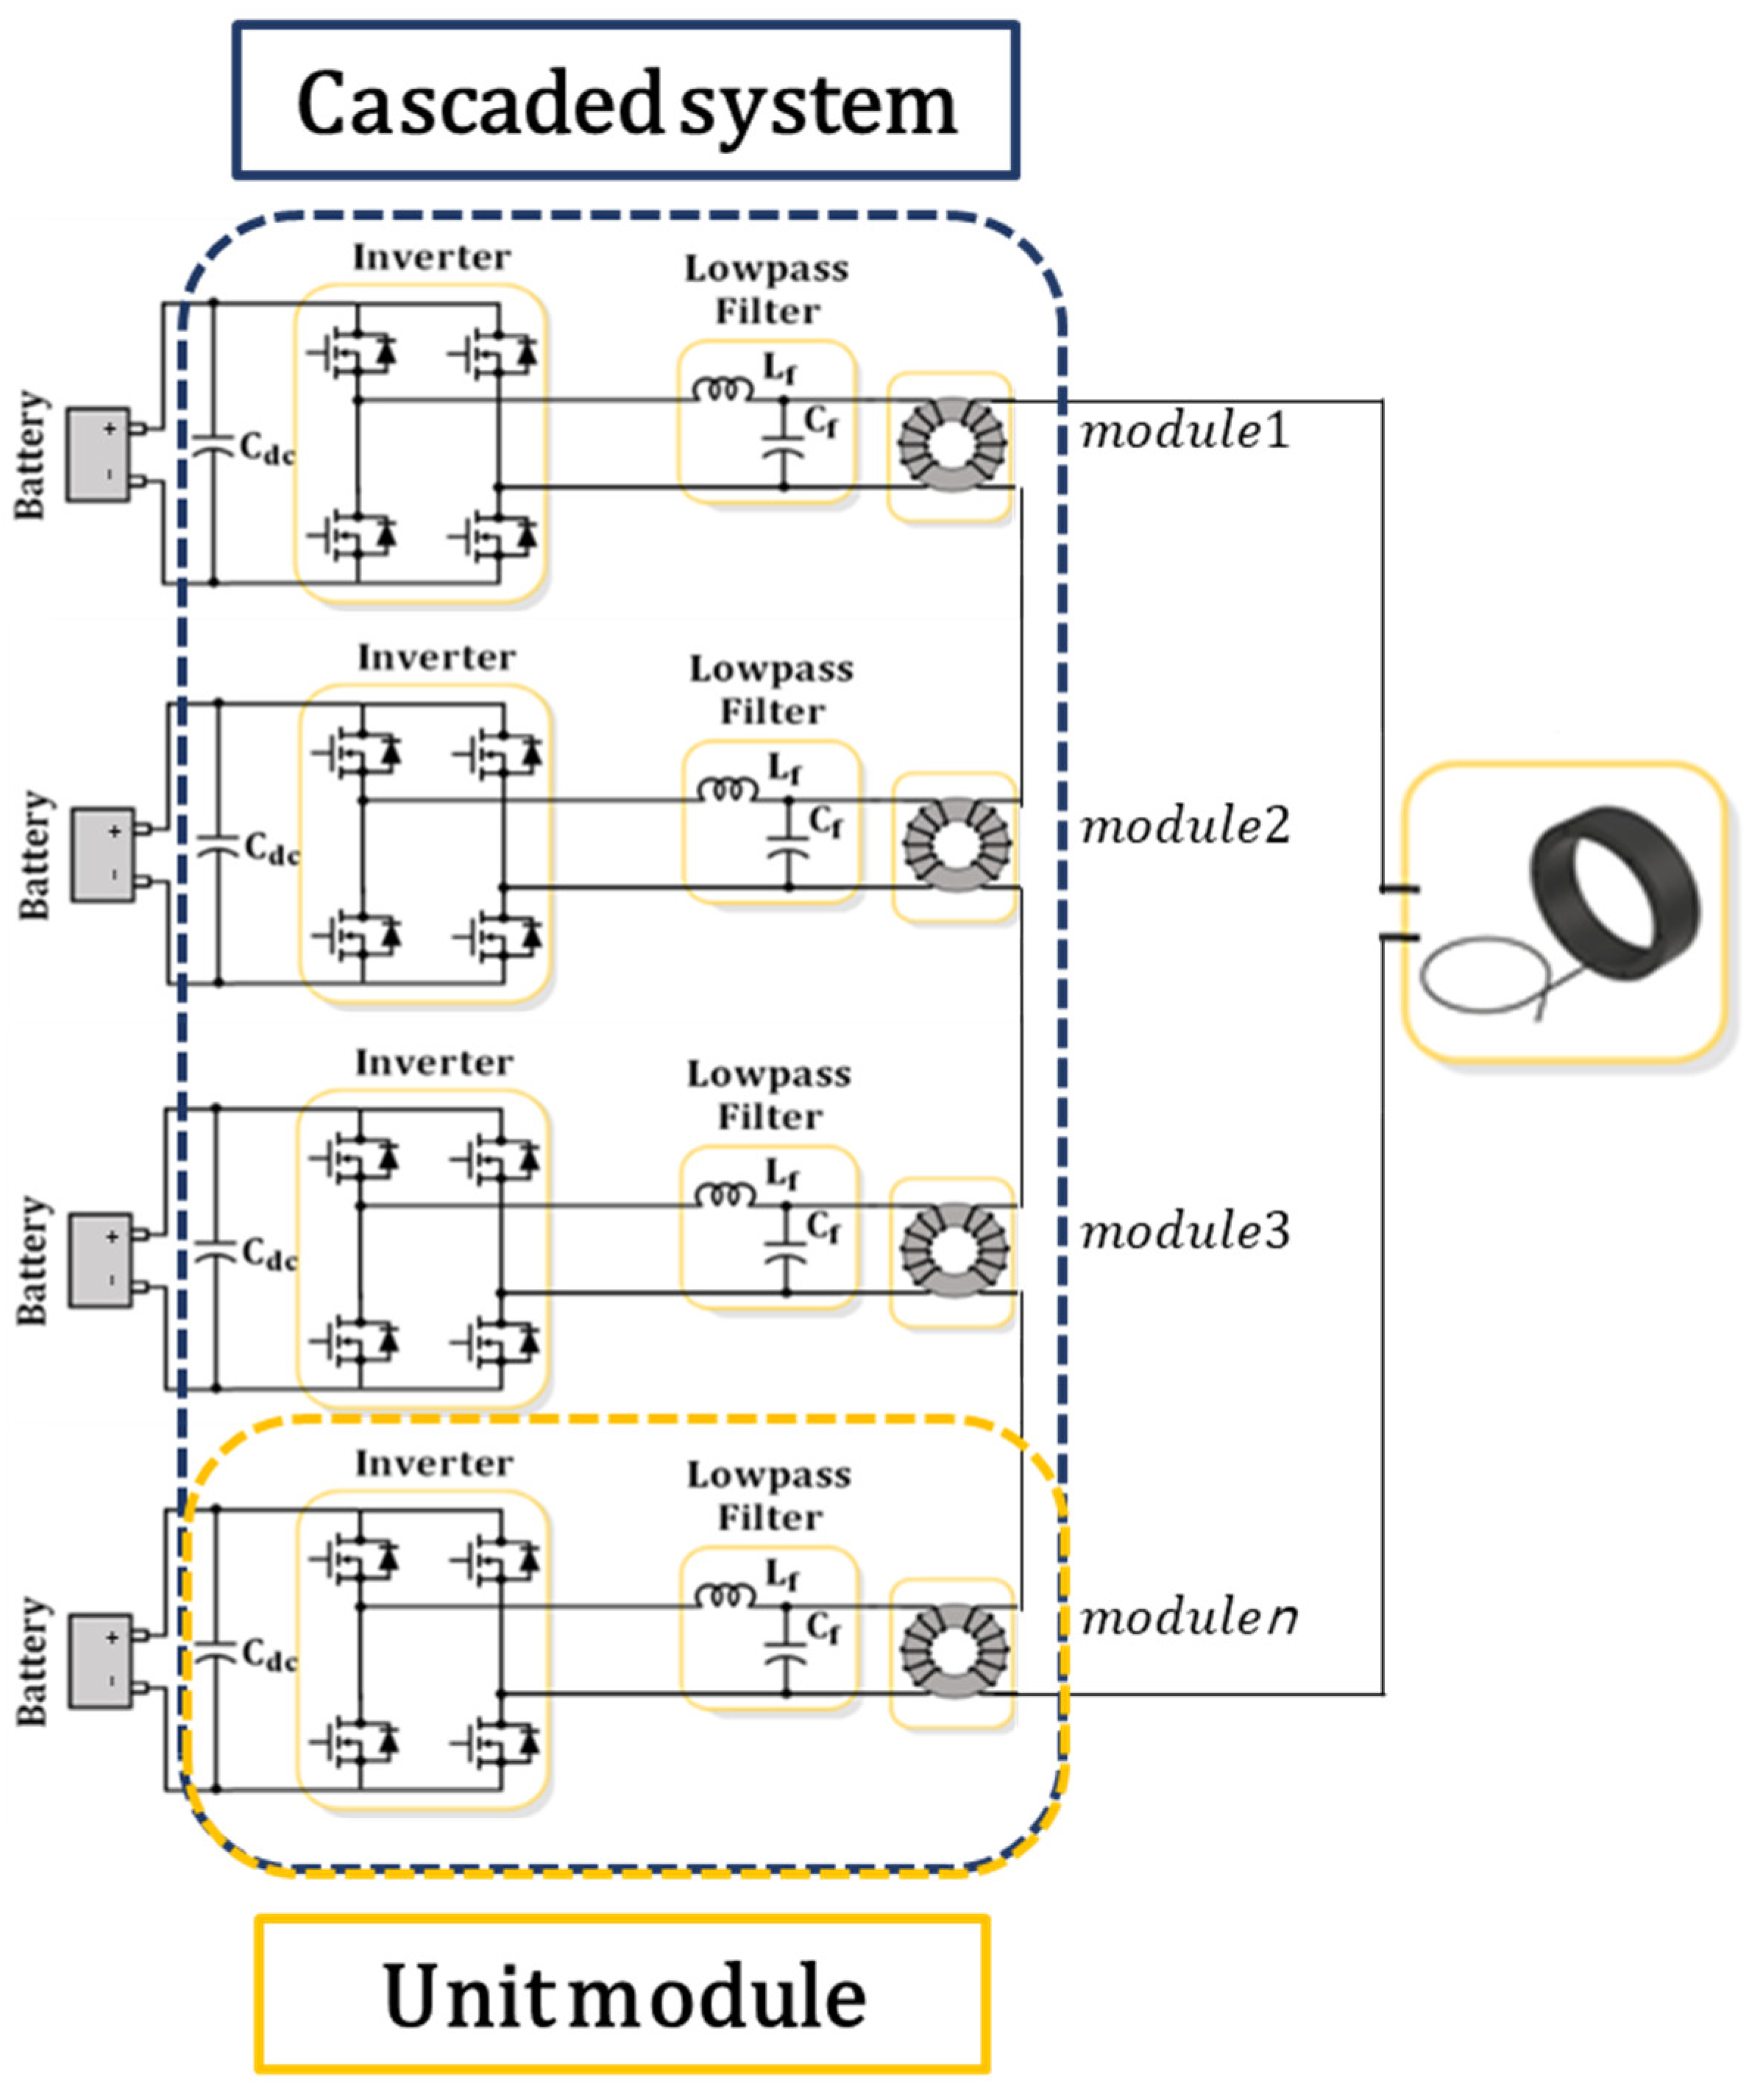
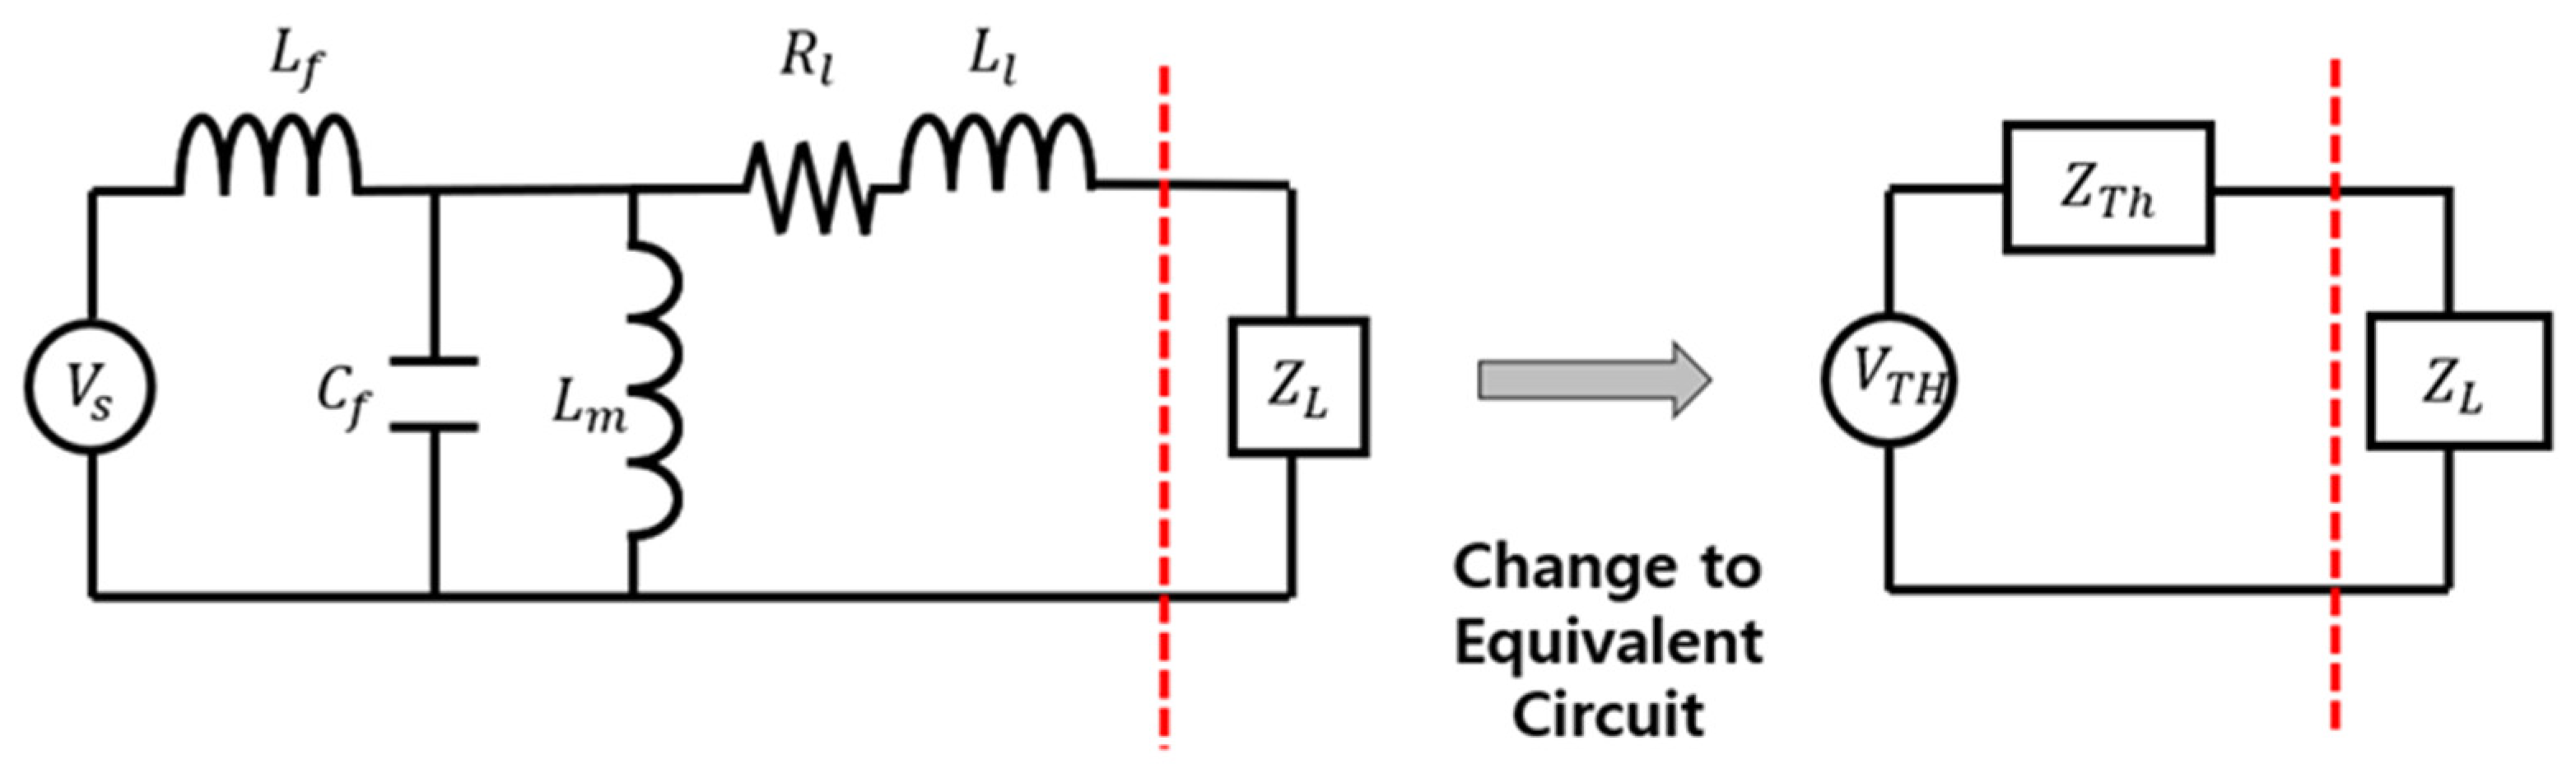
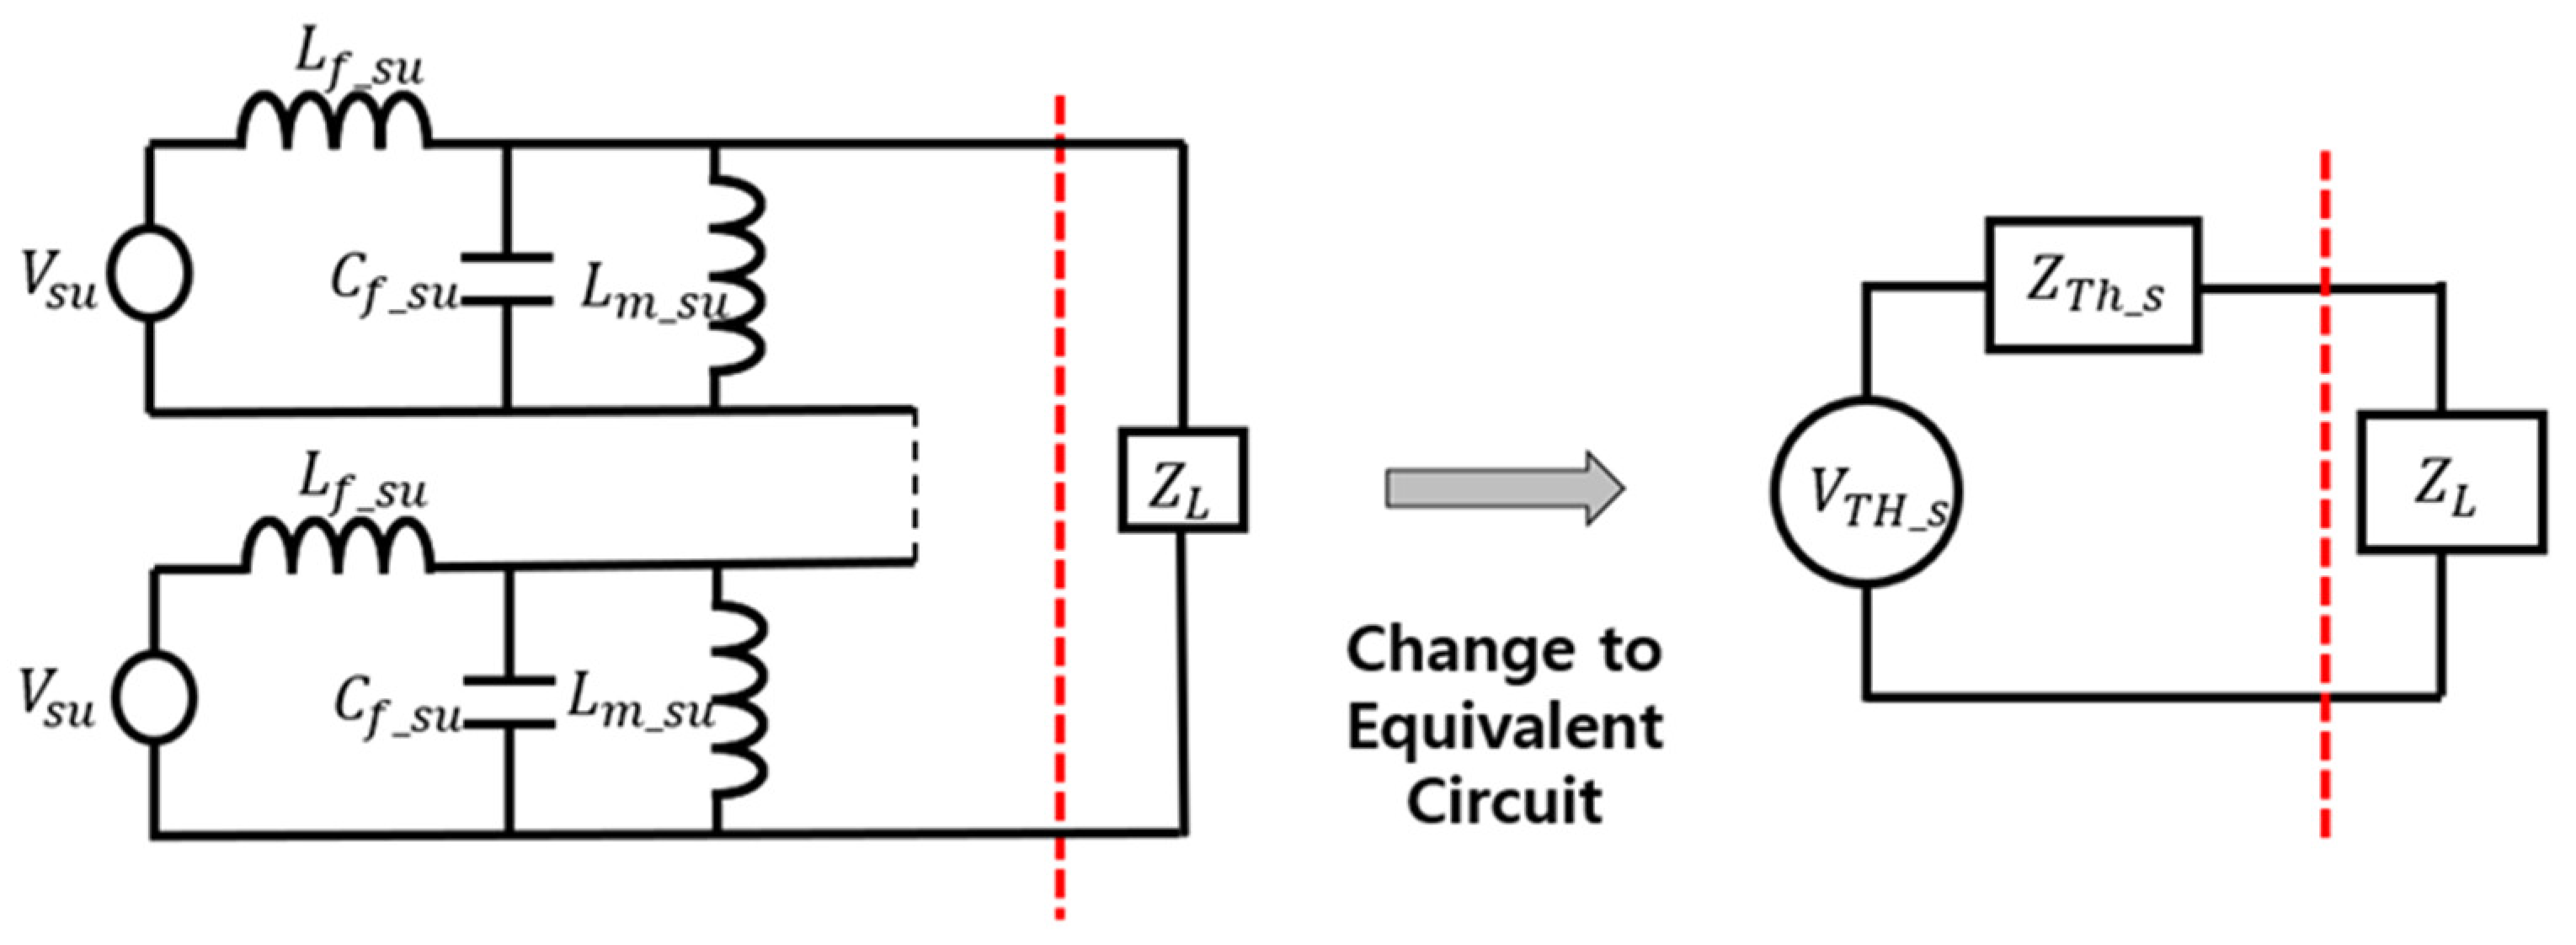
2.3. Relationship between Unified Amplifier System and Cascaded Amplifier System for Sonar Applications
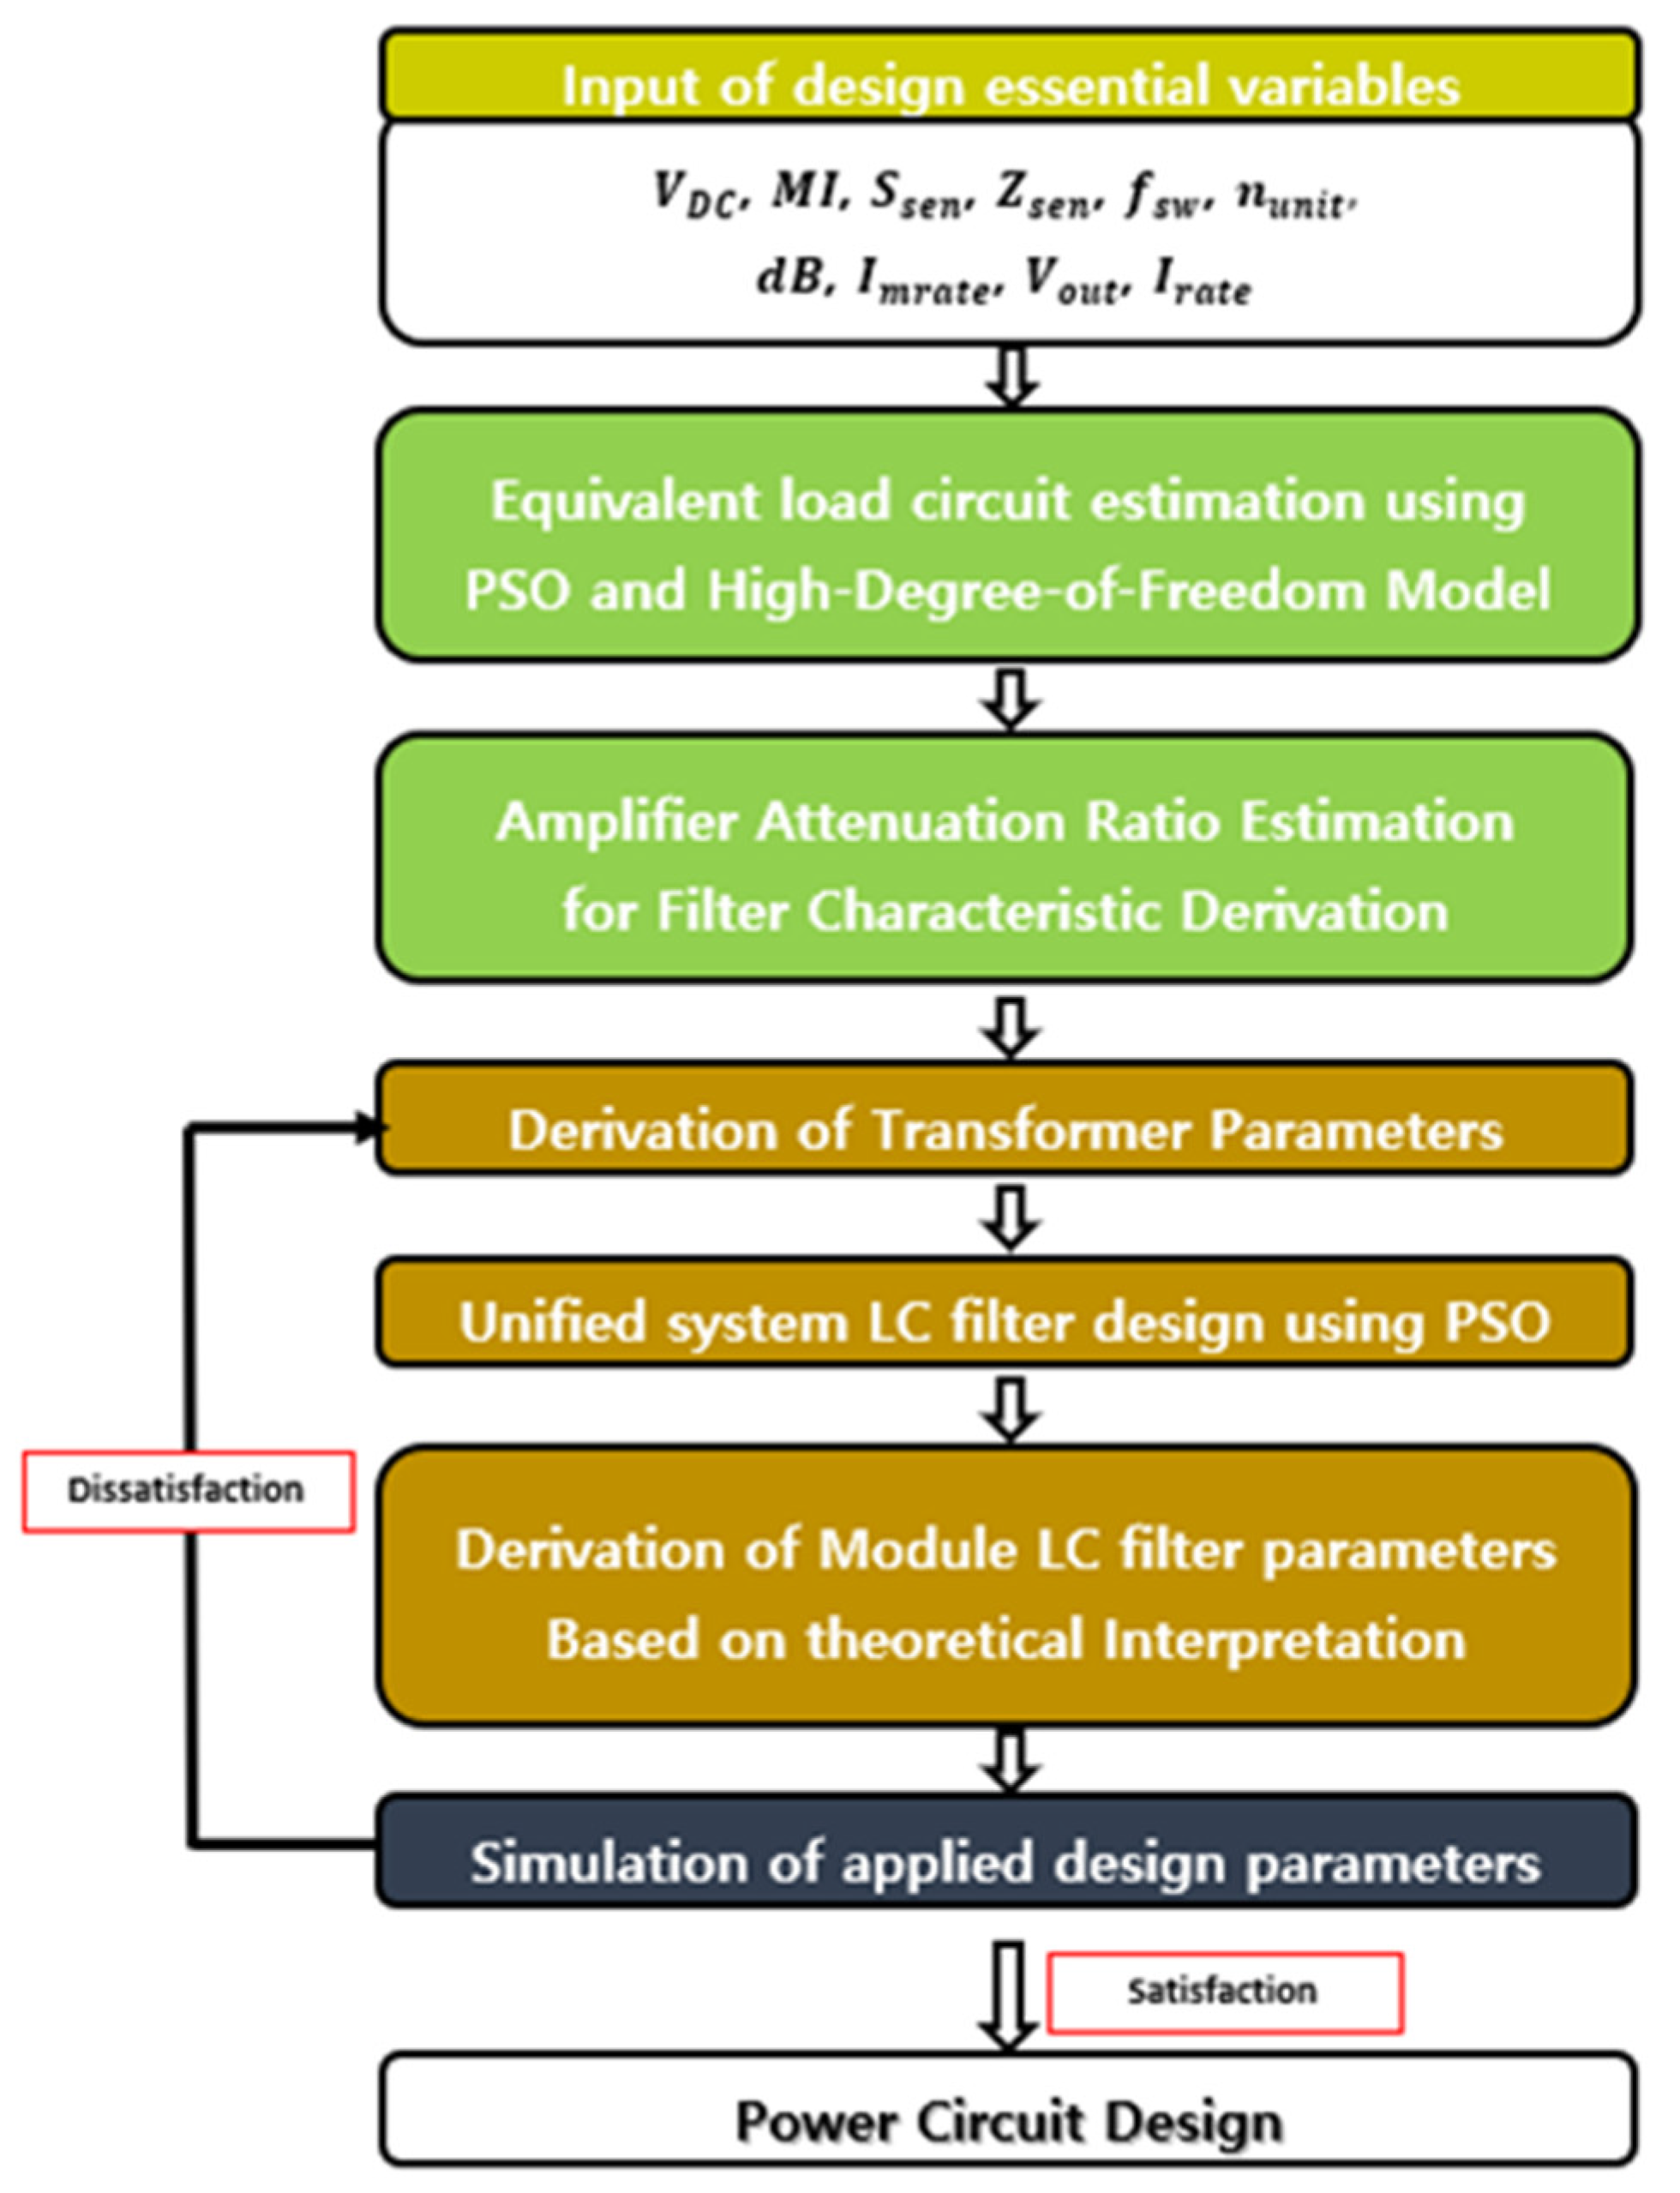
2.4. Extracting Design Parameters for High-Power Amplifiers
2.5. Derivation of LC Filter Parameters
2.6. Derivation of Reduced-Capacity Amplifier Design Parameters
- (1)
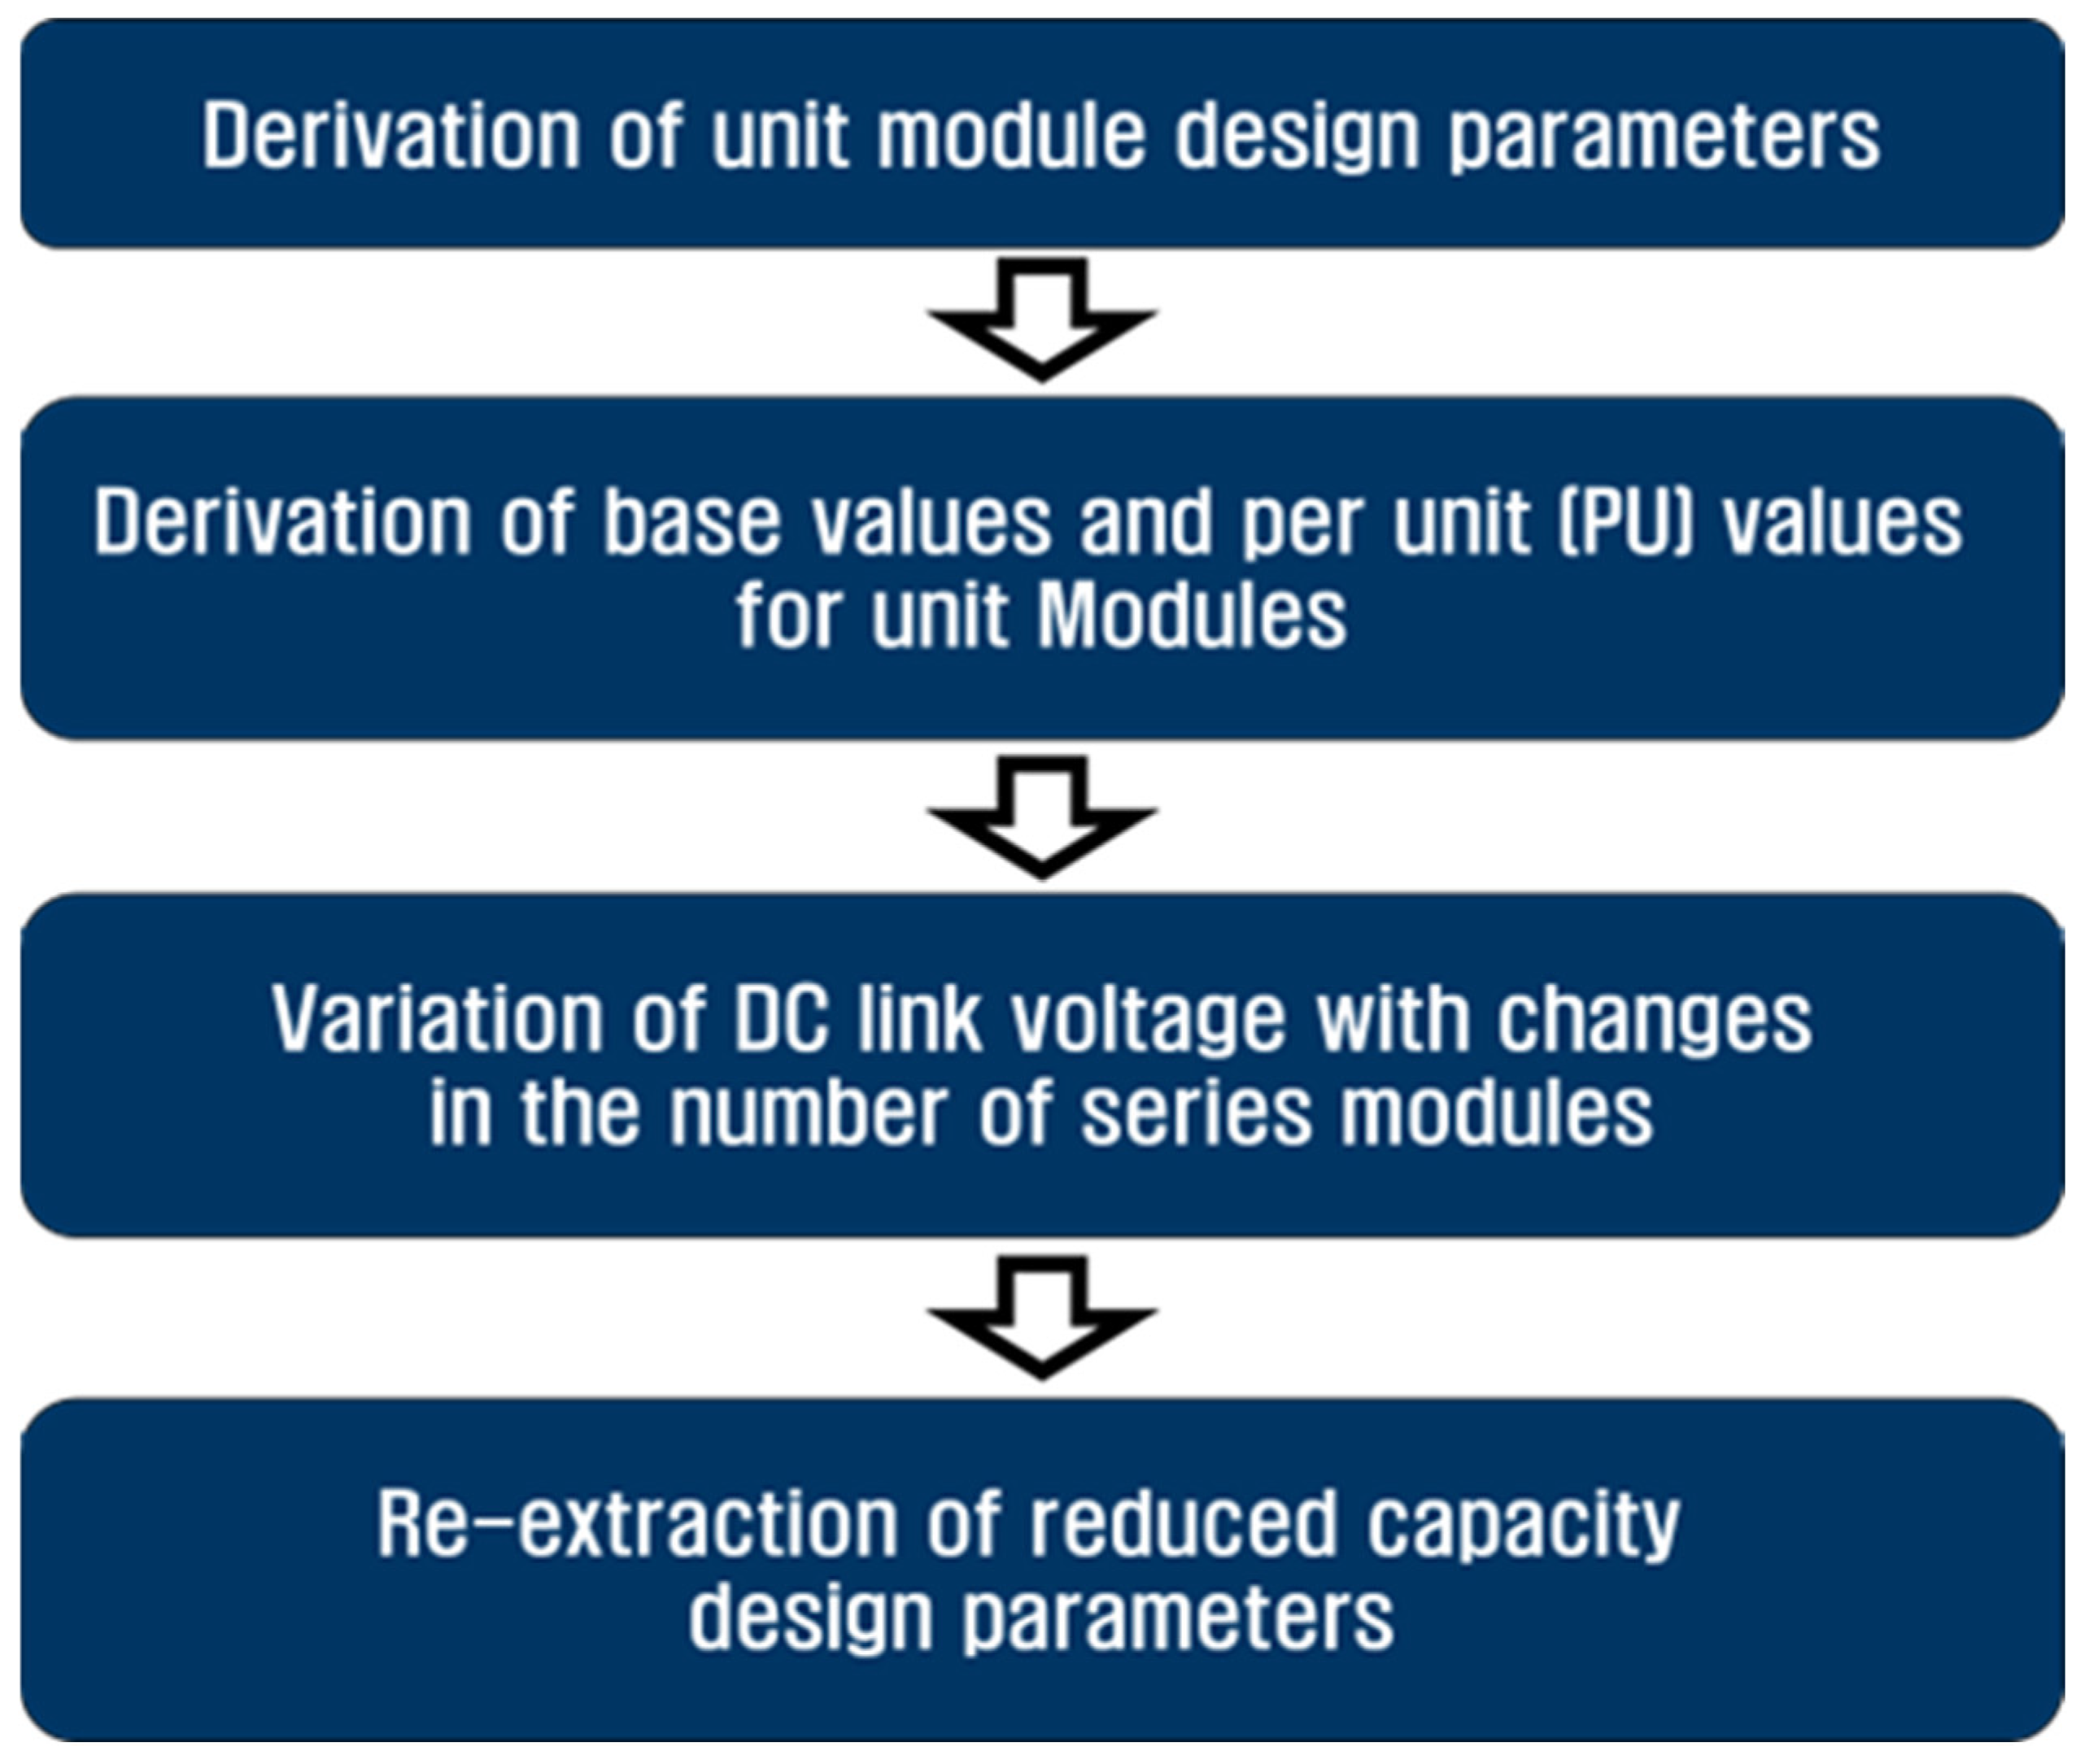
- The design parameters of the unit module were derived using the proposed procedure.
- (2)
- Based on the aforementioned parameters, a fundamental value and p.u. value were set for electrical characteristics, such as the voltage, current, and impedance of the amplifier at one frequency within the SONAR operating frequency range.
- (3)
- To minimize changes in the amplifier characteristics with frequency variations, the turn ratio of the transformer was fixed, and the change in voltage gain with respect to the number of modules was adjusted through DC link voltage control using the results of Equation (6).
- (4)
- Finally, the basic values suitable for the reduced capacity were selected, and the reduced-capacity parameters were rederived.
3. Simulation
4. Experimental Setup and Verification
5. Conclusions
Author Contributions
Funding
Data Availability Statement
Conflicts of Interest
References
- Suresh, Y.; Venkataramanaiah, J.; Panda, A.K.; Dhanamjayulu, C.; Venugopal, P. Investigation on cascade multilevel inverter with symmetric, asymmetric, hybrid and multi-cell configurations. Ain Shams Eng. J. 2017, 8, 263–276. [Google Scholar] [CrossRef]
- Kumar, P.A.; Ramesh, P. Comparison of Different Multilevel Converter Strategy for Induction Motor Drive Application. Int. J. Recent. Innov. Trends Comput. Commun. 2014, 2, 1887–1893. [Google Scholar]
- Choudhury, S.; Bajaj, M.; Dash, T.; Kamel, S.; Jurado, F. Multilevel Inverter: A Survey on Classical and Advanced Topologies, Control Schemes, Applications to Power System and Future Prospects. Energies 2021, 14, 5773. [Google Scholar] [CrossRef]
- Babaei, E.; Alilu, S.; Laali, S. A new general topology for cascaded multilevel inverters with reduced number of components based on developed H-bridge. IEEE Trans. Ind. Electron. 2014, 61, 3932–3939. [Google Scholar] [CrossRef]
- Mariusz, M.; Gopakumar, K.; Jose, R.; Marcelo, P.A. A survey on cascaded multilevel inverters. IEEE Trans. Ind. Electron. 2010, 57, 2197–2206. [Google Scholar]
- Wu, J.-C.; Wu, K.-D.; Jou, H.-L.; Xiao, S.-T. Diode-clamped multi-level power converter with a zero-sequence current loop for three-phase three-wire hybrid power filter. Electr. Power Syst. Res. 2011, 81, 263–270. [Google Scholar] [CrossRef]
- Choi, J.-H.; Mok, H.-S. Simultaneous Design of Low-Pass Filter with Impedance Matching Transformer for SONAR Transducer Using Particle Swarm Optimization. Energies 2019, 12, 4646. [Google Scholar] [CrossRef]
- Song, S.M.; Kim, I.D.; Lee, B.H.; Lee, J.M. Design of Matching Circuit Transformer for High-Power Transmitter of Active Sonar. J. Electr. Eng. Technol. 2020, 15, 2145–2155. [Google Scholar] [CrossRef]
- Choi, J.; Lee, D.H.; Mok, H. Discontinuous PWM Techniques of Three-Leg Two-Phase Voltage Source Inverter for Sonar System. IEEE Access 2020, 8, 199864–199881. [Google Scholar] [CrossRef]
- Jang, J.J.; Choi, J.H.; Lee, D.H.; Mok, H.S. Estimation Method of an Electrical Equivalent Circuit for Sonar Transducer Impedance Characteristic of Multiple Resonance. Sensors 2023, 23, 6636. [Google Scholar] [CrossRef] [PubMed]
- Oh, Y.S. Development of High Resolution Side Scan Sonar System Using Multi Beam Array Porcessing. Ph.D. Thesis, Department of Ocean Engineering Graduate School of Korea Maritime University, Busan, Republic of Korea, 2012. [Google Scholar]
- Kim, H.E. Torpedo Defense System Research Using HMS (Hull Mount Sonar) of PCC (Patrol Combat Corvette). Master’s Thesis, Department of Electronic Graduate School of Ajou University, Suwon, Republic of Korea, 2012. [Google Scholar]
- Haneum, O. Development of Acoustic Transmission Model of SONAR with FFR Transducers and Its Application. Ph.D. Thesis, School of Mechanical Engineering, The Graduate School Pusan National University, Busan, Republic of Korea, 2020. [Google Scholar]
- Im, J.B.; Yoon, H.W.; Kwon, B.J.; Kim, H.S.; Lee, J.M. Analysis and verification of the characteristic of a compact free-flooded ring transducer made of single crystals. J. Acoust. Soc. Korea 2022, 41, 278–286. [Google Scholar]
- Song, S.M.; Kim, I.D.; Lee, B.H.; Lee, J.M. Design of transformer with impedance matching circuit for high power transmitter of active sonar. In Proceedings of the 2019 10th International Conference on Power Electronics and ECCE Asia (ICPE 2019-ECCE Asia), Busan, Republic of Korea, 27–30 May 2019; pp. 2126–2131. [Google Scholar]
- Park, S.U. Passive Element Optimal Design Method for Wideband Sonar Sensor Driving Circuit. Ph.D. Thesis, School of Electrical Engineering The Graduate School Konkuk University, Seoul, Republic of Korea, 2022. [Google Scholar]
- Sreekumar, A.; Panchalai, V.N.; Chacko, B.P.; Thekkath, P. Multilevel converter for excitation of underwater transducers. In Proceedings of the 2015 International Conference on Advances in Computing, Communications and Informatics (ICACCI), Kochi, India, 10–13 August 2015; pp. 651–655. [Google Scholar] [CrossRef]
- Chacko, B.P.; Panchalai, V.N.; Sivakumar, N. Multilevel digital sonar power amplifier with modified unipolar SPWM. In Proceedings of the 2015 International Conference on Advances in Computing, Communications and Informatics (ICACCI), Kochi, India, 10–13 August 2015; pp. 121–125. [Google Scholar] [CrossRef]
- Rajesh, C.R.; Meenalochini, P.; Kannaiah, S.K.; Bindu, A. A hybrid control topology for cascaded H-bridge multilevel inverter to improve the power quality of smart grid connected system: NBO-RERNN approach. Expert Syst. Appl. 2024, 238, 122054. [Google Scholar] [CrossRef]
- Bin, C. Design optimisation of an inductor-integrated MF transformer for a high-power isolated dual-active-bridge DC–DC converter. IET Power Electron. 2019, 12, 2912–2922. [Google Scholar] [CrossRef]
- Payne, A. Skin Effect, Proximity Effect and the Resistance of Circular and Rectangular Conductors. 2016. Available online: https://coil32.net/files/Alan_Payne/Skin-Effect-Proximity-Loss-and-the-Resistance-of-Circular-and-Rectangular-ConductorsIssue-4.pdf (accessed on 10 December 2022).
- Fouineau, A.; Raulet, M.-A.; Lefebvre, B.; Burais, N.; Sixdenier, F. Semi-Analytical Methods for Calculation of Leakage Inductance and Frequency-Dependent Resistance of Windings in Transformers. IEEE Trans. Magn. 2018, 54, 1–10. [Google Scholar] [CrossRef]


| Sensor Type | Power | Operating Range | Simplicity of Structure | Hydraulic Pressure | Efficiency |
|---|---|---|---|---|---|
| Tonpilz | Middle | Low | Middle | Middle | High |
| Flextensionnal | Middle | Middle | High | Middle | High |
| FFR | High | Middle | Middle | Middle | High |
| Symbol | Definition |
|---|---|
| Supply voltage | |
| LC filter parameters (LC filter inductance, LC filter capacitance) | |
| Matching transformer parameters (Magnetizing inductance, leakage resistance, leakage inductance) | |
| Electrical impedance of SONAR | |
| Voltage source of Thevenin equivalent circuit | |
| Impedance of Thevenin equivalent circuit |
| Symbol | Definition |
|---|---|
| Supply voltage | |
| LC filter parameters (LC filter inductance, LC filter capacitance) | |
| Matching transformer parameters (Magnetizing inductance, leakage resistance, leakage inductance) | |
| Electrical impedance of SONAR | |
| Voltage source of Thevenin equivalent circuit | |
| Impedance of Thevenin equivalent circuit | |
| Number of unit modules |
| Symbol | Definition |
|---|---|
| DC link voltage | |
| Inverter modulation index | |
| Inverter switching frequency | |
| SONAR sensor operating frequency range | |
| Apparent power of high-power amplifier | |
| Power amplifier output voltage | |
| , | First-side voltage of transformer of unified system, First-side voltage of transformer of cascaded system |
| Converter-rated current at unit module | |
| Magnetization current at unit module transformer | |
| Number of turns of 1st winding | |
| Number of turns of 2nd winding | |
| Number of unit modules | |
| Transformer turn ratio of cascaded system ( | |
| Magnetization current percent ratio with rated current | |
| Leakage inductance percent ratio with magnetizing inductance | |
| SONAR impedance parameter at frequency | |
| Equivalent impedance of SONAR sensor from primary side of transformer | |
| SONAR impedance real/imaginary parameters |
| Variables | Value | Variables | Value |
|---|---|---|---|
| 350 V | 1.25–3.75 p.u. | ||
| 0.7 | 50 kVA | ||
| 100 kHz | 1500 |
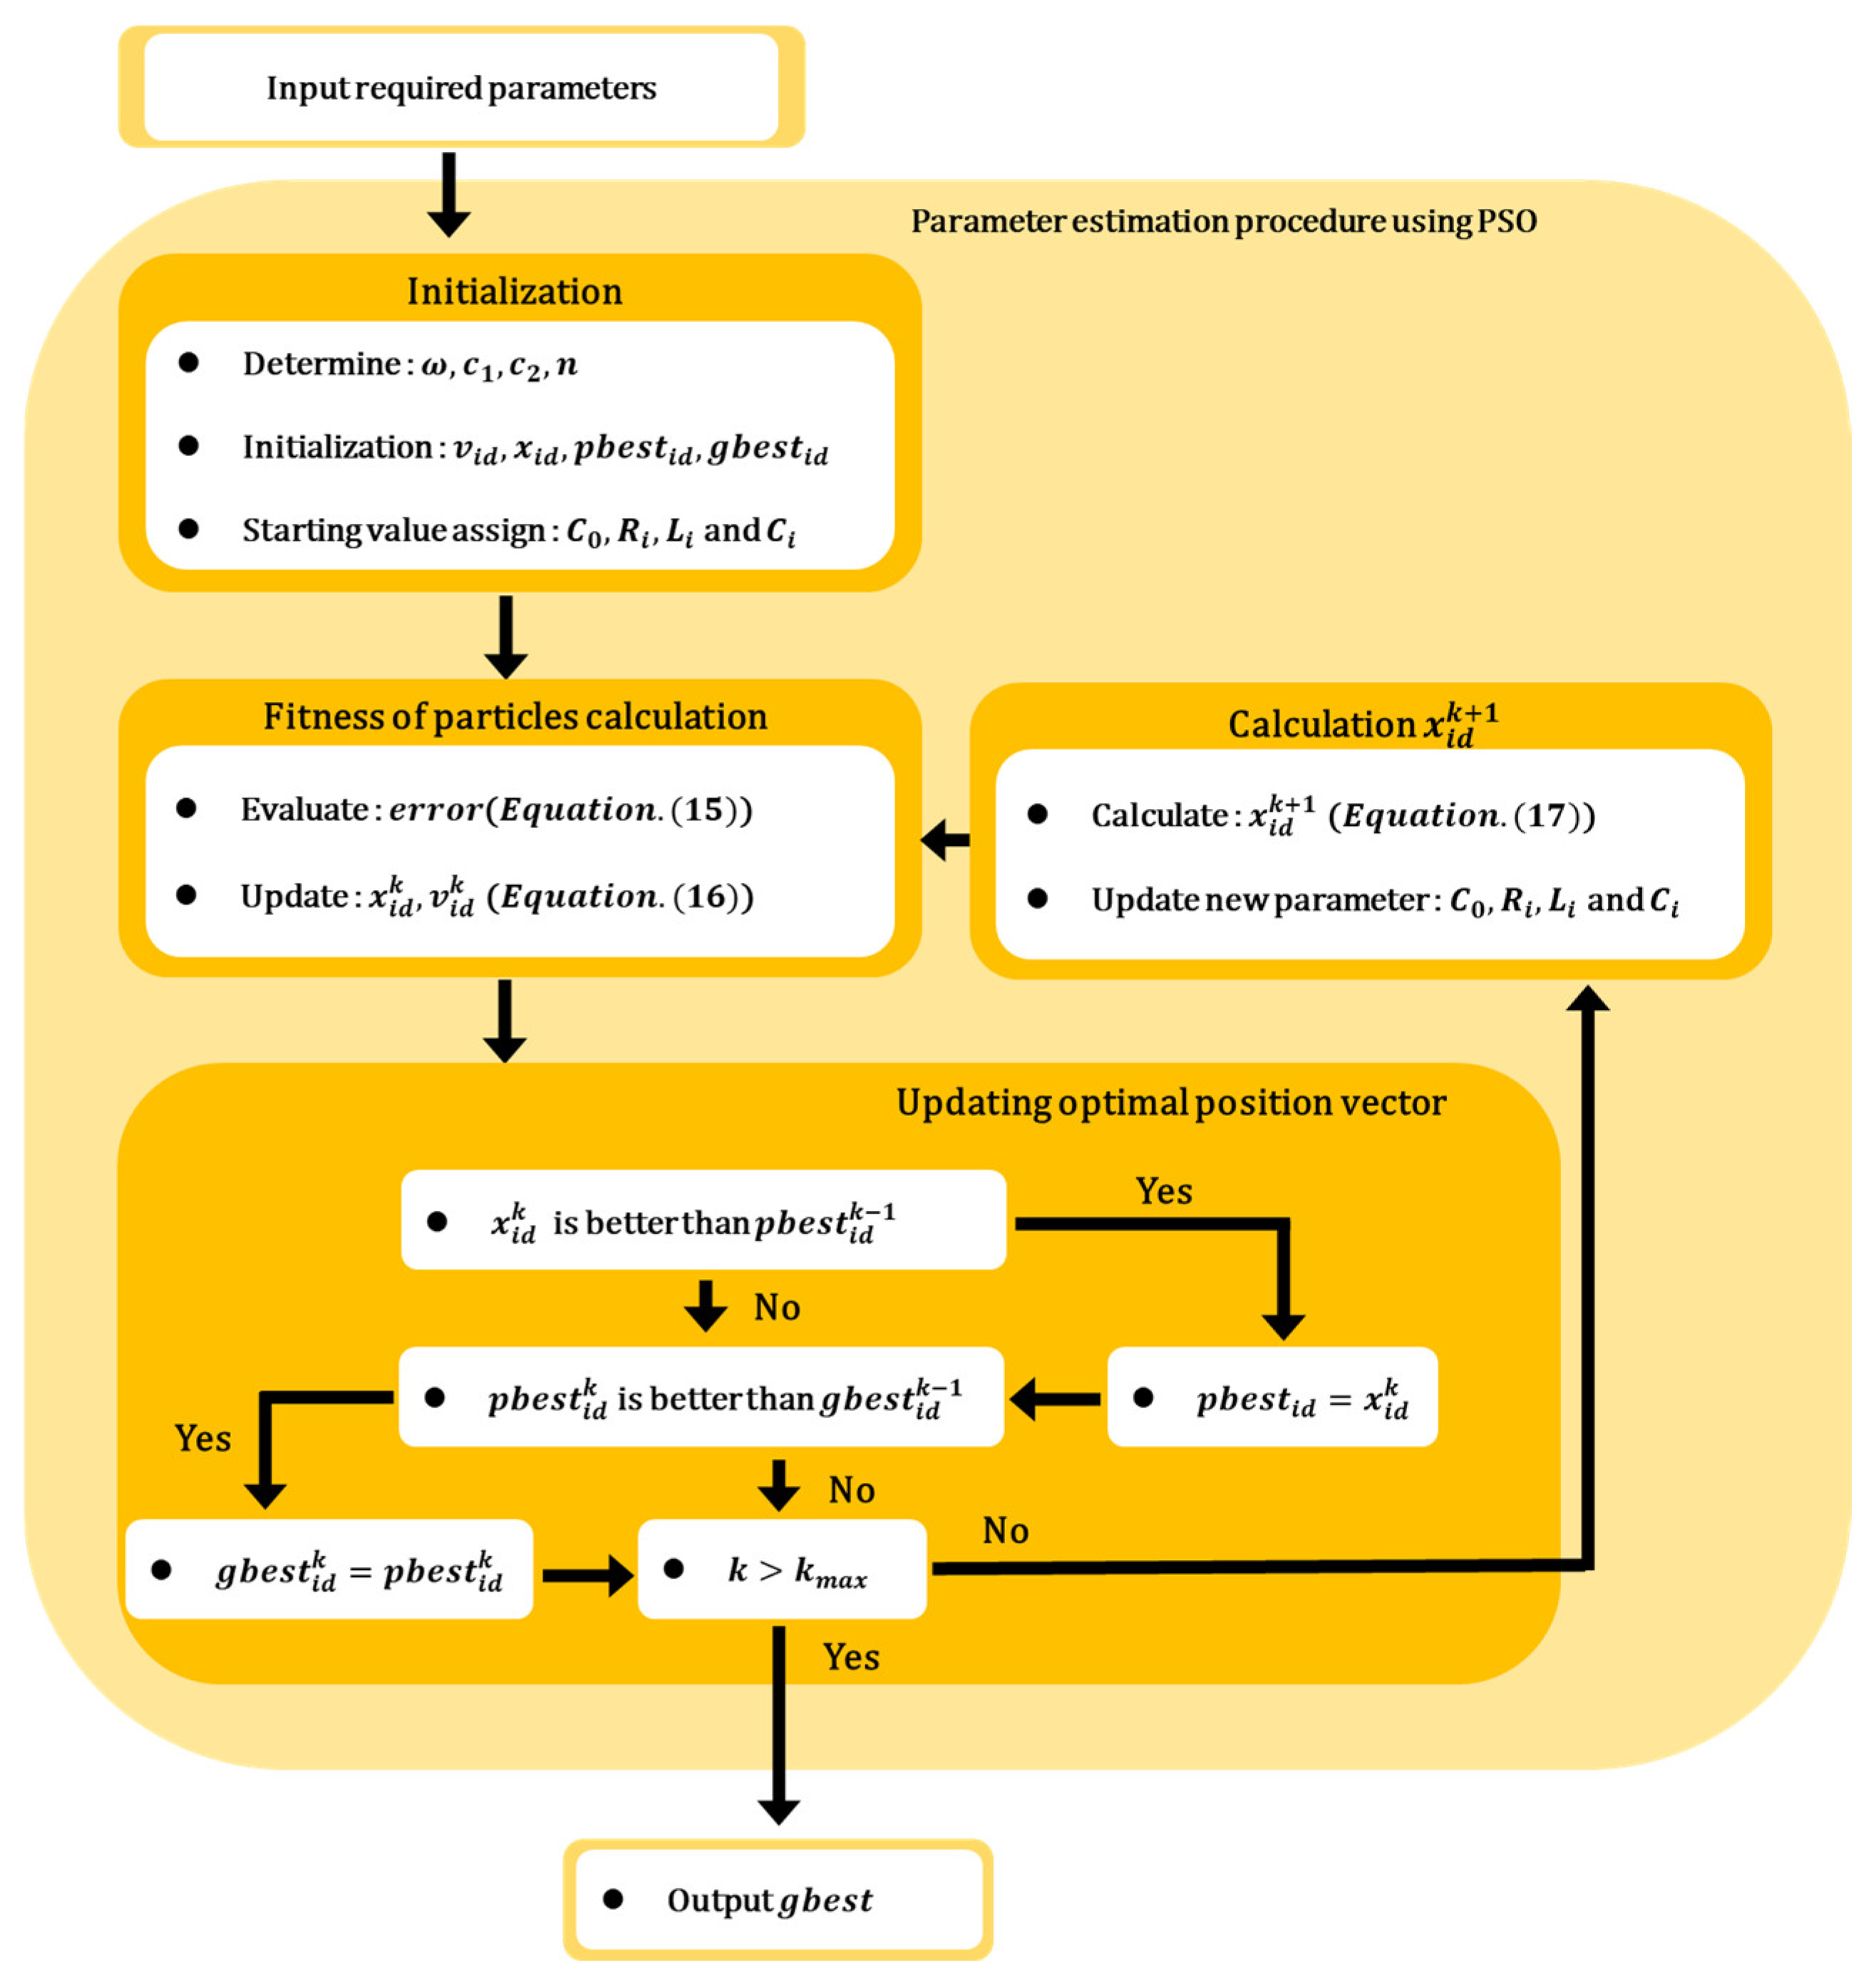
| Symbol | Definition |
|---|---|
| Acceleration constants | |
| Number of swarms | |
| Total number of parameters to derive PSO results | |
| Uniformly distributed random numbers | |
| Inertia weight factor | |
| Number of particles | |
| Total number of particles in swarm | |
| Present velocity vector of swarm | |
| Next velocity vector of particle | |
| Present position vector of swarm | |
| Next position vector of particle | |
| Optimal position vector of swarm | |
| Optimal position vector of particle |
| Parameter | Value | Parameter | Value |
|---|---|---|---|
| 44.26 µH | 339 nF | ||
| 19.50 mH | 1.083 |
| Parameter | Value | Parameter | Value |
|---|---|---|---|
| 50 kVA | 44.26 µH | ||
| 1500 V | 339 nF | ||
| 1.25 p.u. | 19.50 mH | ||
| 1.083:1 | 10 EA |
| Parameter | Value | Base Value | Re-Extracted Parameter |
|---|---|---|---|
| 50 kVA | 5 kVA | 2 kVA | |
| 1500 V | 1500 V | 320 V | |
| 350 V | 1500 V | 175 V | |
| 44.26 µH | 6 | 44.26 µH | |
| 339 nF | 6 [Ω] | 339 nF | |
| 19.50 mH | 6 | 19.50 mH | |
| 10 EA | 10 EA | 4 EA | |
| 1.083:1 | 1.083:1 | 1.083:1 |
| Parameter | Value | Parameter | Value |
|---|---|---|---|
| 175 V | 339 nF | ||
| 100 kHz | 19.50 mH | ||
| 100 ns | 4 EA | ||
| 44.26 µH | 1.083:1 |
| Parameter | Value | Parameter | Value |
|---|---|---|---|
| 175 V | 339 nF | ||
| 100 kHz | 19.50 mH | ||
| 100 ns | 4 EA | ||
| 44.26 µH | 1.083:1 |
| Category | LC Filter Inductance | LC Filter Capacitance | Transformer Magnetizing Inductance | |||
|---|---|---|---|---|---|---|
| Value | Error [%] | Value | Error [%] | Value | Error [%] | |
| Design value | 44.26 µH | - | 339 nF | - | 19.50 mH | - |
| Module 1 | 43.67 µH | 1.34 | 341 nF | –0.58 | 19.51 mH | –0.06 |
| Module 2 | 43.79 µH | 1.06 | 340 nF | –0.29 | 19.40 mH | 0.5 |
| Module 3 | 43.70 µH | 1.26 | 341 nF | –0.58 | 19.69 mH | –1 |
| Module 4 | 43.73 µH | 1.19 | 340 nF | –0.29 | 19.37 mH | 0.63 |
| Parameter | Value | Parameter | Value |
|---|---|---|---|
| 3.79% | 6.15% |
| Conventional Method | Proposed Method | ||
|---|---|---|---|
| Error Rate | Value | Parameter | Value |
| 3.9% | 3.79% | ||
Disclaimer/Publisher’s Note: The statements, opinions and data contained in all publications are solely those of the individual author(s) and contributor(s) and not of MDPI and/or the editor(s). MDPI and/or the editor(s) disclaim responsibility for any injury to people or property resulting from any ideas, methods, instructions or products referred to in the content. |
© 2024 by the authors. Licensee MDPI, Basel, Switzerland. This article is an open access article distributed under the terms and conditions of the Creative Commons Attribution (CC BY) license (https://creativecommons.org/licenses/by/4.0/).
Share and Cite
Jang, J.; Choi, J.; Lee, D.; Mok, H. Design Procedure of Cascaded Multilevel Inverter for High-Power Amplifier in SONAR System. Energies 2024, 17, 1581. https://doi.org/10.3390/en17071581
Jang J, Choi J, Lee D, Mok H. Design Procedure of Cascaded Multilevel Inverter for High-Power Amplifier in SONAR System. Energies. 2024; 17(7):1581. https://doi.org/10.3390/en17071581
Chicago/Turabian StyleJang, Jejin, Jaehyuk Choi, Donghun Lee, and Hyungsoo Mok. 2024. "Design Procedure of Cascaded Multilevel Inverter for High-Power Amplifier in SONAR System" Energies 17, no. 7: 1581. https://doi.org/10.3390/en17071581
APA StyleJang, J., Choi, J., Lee, D., & Mok, H. (2024). Design Procedure of Cascaded Multilevel Inverter for High-Power Amplifier in SONAR System. Energies, 17(7), 1581. https://doi.org/10.3390/en17071581