Article

Combustion Behaviors, Kinetics, and Thermodynamics of Naturally Decomposed and Torrefied Northern Red Oak (Quercus rubra) Forest Logging Residue

1
Department of Forest Biomaterials, North Carolina State University, Raleigh, NC 27695, USA
2
Center for Sustainable Biomaterials & Bioenergy, West Virginia University, Morgantown, WV 26506, USA
3
Division of Forestry and Natural Resources, West Virginia University, Morgantown, WV 26506, USA
4
Department of Chemical and Biomedical Engineering, West Virginia University, Morgantown, WV 26506, USA
5
School of Agricultural Sciences and Forestry, Louisiana Tech University, Ruston, LA 71272, USA
6
Department of Mechanical and Aerospace Engineering, West Virginia University, Morgantown, WV 26506, USA
*
Author to whom correspondence should be addressed.
Energies 2024, 17(7), 1607; https://doi.org/10.3390/en17071607
Submission received: 31 January 2024 / Revised: 11 March 2024 / Accepted: 23 March 2024 / Published: 28 March 2024
(This article belongs to the Section A: Sustainable Energy)

Abstract

:
Torrefaction and combustion have been applied to naturally decomposed red oak logging residues. The results indicated that four-year natural decomposition would lower the energy density of red oak from 20.14 to 18.85 MJ/kg. Torrefaction reduced the O/C and H/C ratios but improved the energy yield values. Two combustion stages were observed for all samples, and no hemicellulose derivative thermogravimetric peak appeared for torrefied samples. The differential scanning calorimetry exothermic heat flow increased after torrefaction. In addition, the Kissinger–Akahira–Sunose average activation energy of untorrefied samples decreased in the first stage (from 157.77 to 149.52 KJ/mol), while it increased in the second stage (from 131.32 to 181.83 KJ/mol). The ∆H, ∆G, and ∆S values of all samples decreased in the first stage, while they increased when the conversion rate was greater than 0.5 for torrefied samples. These findings can aid in a better understanding of the fuel performance of torrefied and untorrefied naturally decomposed red oak logging residues.

1. Introduction

Bioenergy is one of the most promising renewable energy resources due to its renewability and sustainability while it will directly alleviate greenhouse gas (GHG) emissions and global warming [1,2]. Forest logging residue, the most common and abundant woody biomass in the eastern United States [3,4], remains largely underutilized, often left on-site rather than being effectively harnessed for its potential value [5]. Although logging residues left on-site could provide important environmental functions and services, a large quantity can be removed (~70%) as a low-cost and readily available bioenergy feedstock [3]. Furthermore, long-term decomposition in the field may have a negative impact on the quality of logging residues and could cause potential environmental and climatic impacts. For example, the decomposition of deadwood from insects or microorganisms might contribute 29% of carbon flux in the world [6]. In addition, the removal of logging residue from forests and repurposing of its utilization will also reduce wildfire hazards [4].
Northern red oak (Quercus rubra L.) is a common tree species in the U.S., which is largely utilized for solid furniture, lumber, railway ties, and other purposes. As a result, there is a large number amount of northern red oak logging residue on-site waiting to be utilized effectively. Combustion is the most traditional, direct, and effective way to consume biomass to produce heat and power [7,8]. Earlier studies certified that CO2, CH4, NOX, and SOX could be reduced by 15%, 95%, 18%, and 27%, respectively, if 20% of coal combustion was replaced by biomass [9]. Research has also concluded that 1.87–2.62 Mt/year of dry wood residues can generate 2.12–2.99 GWh of electricity on an equivalent energy basis while reducing GHG emissions by 1.91–2.69 Mt annually [10]. However, the feedstock characteristics of low calorific value, low energy density, and high moisture content are major impediments to the combustion process [11]. Thus, pretreatment is needed before its utilization. Torrefaction is an effective pretreatment method for upgrading the fuel properties of biomass, which can increase the biomass higher heating value (HHV) from 15–20 MJ/kg to 16–29 MJ/kg based on the different species (coal: 25–35 MJ/kg) [12,13]. Torrefaction can also enhance the grindability and storability of biomass and reduce its biodegradation of hydrophobicity [13].
Currently, three torrefaction pathways (dry, wet, and steam) have been studied based on the parameter and atmosphere variation [13]. The dry torrefaction of biomass, under non-oxidizing conditions and within a temperature range of 200–300 °C [14], has a higher potential for commercial applications compared to wet and steam processes, of which the difference is due to the factors of cost and implementation [15,16]. In addition, the feedstock species also influences the chemical components of biomass [17], such as hardwoods versus softwoods [18,19], and other lignocellulosic biomass (e.g., crop straw [20,21] and bamboo [16]. However, torrefaction studies related to forest logging residues are still insufficient, especially for characterizing the effects of natural decomposition on energy characteristics. On the other hand, understanding the combustion characteristics and kinetics parameters of torrefied and untorrefied materials is essential for their commercial utilization. From the perspective of the first law of thermodynamics, torrefaction enhances the energy balance by reducing moisture content and increasing the calorific value of biomass. Torrefied biomass retains more energy per unit mass, resulting in the release of more energy when burned compared to untreated wood. In terms of the second law of thermodynamics, which deals with energy quality and entropy, torrefied biomass can be viewed as a more organized form of energy compared to raw biomass. The torrefaction process removes volatile compounds, producing a carbon-rich product with higher energy conversion efficiency when burned or gasified. This aligns with the second law as it reduces energy dispersion and increases the proportion of energy that can be effectively utilized. The thermogravimetric analysis (TGA) technique has been widely applied to reveal the combustion process of biomass, which can bridge the conversion properties of materials with controlled temperature and heating rates [22]. Despite numerous studies having examined various types of biomasses for thermal characteristics using TGA, such as industrial and forest wastes [23], crop straw [24], rice husk [25], and bamboo [26], there is limited information on the combustion properties of naturally decomposed logging residue and its torrefied materials.
In this study, naturally decomposed northern red oak logging residue was treated at a temperature of 300 °C in a nitrogen atmosphere. Proximate, ultimate, and calorific value analyses, Fourier-transform infrared spectroscopy (FTIR), and TGA-DSC were conducted to investigate the fundamental and combustion properties of the torrefied and untorrefied samples. Two model-free kinetic methods, Kissinger–Akahira–Sunose (KAS) and Flynn–Wall–Ozawa (FWO), were used to analyze the combustion kinetics parameters. In addition, master plots were used to determine the reaction model and a thermodynamic analysis was also conducted. Consequently, this research will aid in better understanding the combustion behaviors of torrefied and untorrefied naturally decomposed logging residues and pave the way for their commercial energy utilization.

2. Materials and Methods

In this study, northern red oak (Quercus rubra L.) logging residue samples that were fresh (RO0) and 2- (RO2) and 4-year naturally decomposed (RO4) were collected from sites (according to the forest harvesting inventory) in Upshur County, West Virginia, U.S. Specifically, branches with a diameter of around 10 cm and a length of 30 cm were collected, with three samples from each age group. The bark on the four-year-old logging residue samples was separated from the stem/branch wood; therefore, all samples were debarked to ensure comparisons of comparable biomass samples were possible. All samples were milled to pass through a 1 mm screen and oven-dried under 103 ± 2 °C for 24 h until mass-stabilized. Torrefaction was conducted in a nitrogen atmosphere with temperatures that ranged from room temperature to 300 °C with a 5 °C/min heating rate and 30 min holding time. The torrefied samples were labeled TRO0, TRO2, and TRO4 based on their precursors (Figure 1a).

2.1. Proximate and Ultimate Analyses

Proximate and ultimate analyses were conducted using a Leco TGA 801 (following the ASTM D7582 [34]) and CE Instruments Flash 1112 Series, Thermo Fisher Scientific, Waltham, MA, USA (following ASTM D3176-15 [35]), respectively, for torrefied and non-torrefied samples. The higher heating value (HHV) was tested by a Parr 6200 Calorimeter (following ASTM E711-87 [36]). The oxygen (O), fixed carbon (FC) contents, H/C, O/C, and yield were calculated following Equations (1)–(5), respectively [33]:
O (wt%) = 100 (wt%) − C (wt%) − H (wt%) − N (wt%) − S (wt%)
We ignored the ash and moisture content since wood samples had low ash content and had been thoroughly dried.
FC (wt%) = 100 (wt%) − A (wt%) − VOL (wt%) − MC (wt%)
H/C = (H%/HMW)/(C%/CMW)
O/C = (O%/OMW)/(C%/CMW)
Yield = m 1 m 0 m 1 100
where H, O, N, C, S, A, VOL, and MC represent the molecular weight of hydrogen, oxygen, nitrogen, carbon, sulfur, ash, volatile matters, and moisture content (dry basis), respectively.

2.2. FTIR and Energy Properties

The Fourier Transform Infra-Red spectrometer (FITR) spectra were obtained from an FTS 7000/UMA 600. The absorbance range was set from 400 to 4000 cm−1. The ground dry basis samples were tested directly and the data were collected automatically.
A series of energy indicators including the carbon densification factor (CDF), energy enrichment factor (EEF), energy yield (EY) values, calorific value improvement (CVI), and fuel ratio (FR) were calculated using Equations (6) to (10) [33].
CDF = CT/CUT
EEF = HHVT/HHVU
EY = Yield × EEF
CVI = (EEF − 1) × 100
FR = FC/VOL
where CT is the carbon content of the torrefied sample; CUT is the carbon content of the untorrefied sample; HHVT and HHVUT are the higher heating values of torrefied and untorrefied samples, respectively; yield is generated from Equation (5); and FC and VOL are the fixed carbon and volatile matter of samples. All values are calculated on a dry basis.

2.3. Combustion Characteristics

The SDT 650 thermogravimetric analyzer (TA Instrument, New Castle, DE, USA) was used to explore the combustion characteristics of treated and untreated samples. In this process, samples with an initial weight of approximately 5–9 mg were evenly and loosely distributed in the pan, and the temperature variation was controlled from 50 ± 5 °C with heating rates of 10 °C/min, 20 °C/min, 30 °C/min, and 40 °C/min to 700 °C under air conditioning. The TGA and DSC data were collected in this process.

2.4. Kinetic Parameters

The combustion kinetics analysis is critical in determining the reaction process of biomass. As recommended by the Kinetics Committee of the International Confederation for Thermal Analysis and Calorimetry, the model-free method (Flynn–Wall–Ozawa and Kissinger–Akahire–Sunnose) was used to calculate the kinetic parameters [23]. The master-plot method was used to determine the reaction model [15,37,38].
Basically, the Arrhenius equations and general conversion–time relationship have been illustrated massively in previous studies [23]. The relationship between the conversion rate α, pre-exponential factor (A: min−1), activation energy (Ea: kJ mol−1), gas constant (R = 8.314 J mol−1 K−1), and absolute temperature (T: K) can be built as in Equation (11) at a constant heating rate (β = dT/dt).
d α d T = A β e E a / R T f α

2.4.1. Model-Free Method

The Kissinger–Akahira–Sunose (KAS) method is valid for 20 ≤ Ea/RT ≤ 50, which means Ea/RTeEa/RT/(Ea/RT)2, and Equation (11) can be written as Equation (12) [39]:
l n β T 2 = l n A R E g α E a R T
where g(α) is the conversion rate for the integral reaction-order model. Typically, g(α) = n−1 · (−1 + (1 − α)−n), and n = 1 is typically used for solid biomass combustion [22].
The Flynn–Wall–Ozawa (FWO) method is based on Doyle’s approximation [40,41]. Ea and A can be obtained using the slope and intercept, respectively, derived from linear fitting by the logarithm of heating rates (ln(β)) against 1/T, g(α) = α/(1 − α). The equation can be described as Equation (13):
l n β = l n A E a R g α 5.331 1.052 E a R T

2.4.2. Determination of Reaction Model

The master-plot methods were used to define the suitable combustion mechanism model of the samples. In this way, Equation (11) can be rewritten as Equation (14) [38].
G α = A E β R P u
where u = E/RT, and the temperature integral, denoted as P(u), lacks an analytical solution. Therefore, it can be estimated using empirical equations.
Referring to previous research methods [37,38], P(u) can be written as Equation (15). For single-step degradation with a constant G(α), the appropriate kinetic model was confirmed using master plots where Ea and A values were estimated using α = 0.5 as the baseline point. Thus, Equation (15) can be expressed as Equation (16). When combined, Equations (14), (16), and (17) can be built [37].
P u = exp u u × 1.00198882 u + 1.87391198  
G α G 0.5 = A E β R P u 0.5
where u0.5 = E/RT0.5. G(0.5) is the integral reaction model at α = 0.5. T0.5 is the temperature at α = 0.5.
G α G 0.5 = P u P u 0.5
This differential kinetic equation is among the most common applications of the Moment Propagation method. The 15 most popular dynamic models, as well as their reaction mechanisms for a solid-state thermal degradation process, are listed in Table S1. The theoretical G(α)/G(0.5) and experimental P(u)/P(0.5) values versus x were plotted, respectively [37].

2.5. Thermodynamic Analysis

Thermodynamic analysis is a crucial aspect of physical chemistry and engineering and helps in understanding the energy changes associated with chemical reactions and phase transitions. The data for the pyrolysis and combustion heating rate at 10 °C/min are utilized to calculate the enthalpy (∆H), entropy (∆S), and Gibbs free energy (∆G) [41,42] following Equations (18)–(20). The activation energy (Ea) and pre-exponential factor (A) were based on the predetermined value from the KAS method.
H = E a R T m
G = E a + R T m ln K b T m h 1 A 1
S = H G / T m
where Tm is the peak decomposition temperature, h is Planck’s constant (6.626 × 10⁻³⁴ m2 kg s−1), Kb represents the Boltzmann constant (1.38 × 10⁻²³ m2 kg s−2 K−1), and R is the universal gas constant (8.3145 J mol−1 k−1).

3. Results and Discussion

3.1. Fundamental Characteristics

Table 1 presents the fundamental characteristics of torrefied and untorrefied samples. The results indicated that the decomposition year of logging residue has an impact on the basic properties of untorrefied samples. The nitrogen (N), carbon (C), hydrogen (H), and volatile contents decreased in the second-year decomposition and slightly increased in the fourth-year decomposition. In contrast, the oxygen (O), ash, and fixed carbon (FC) contents increased first and then decreased among samples of three decomposition levels. These changes are likely caused by the decomposition of logging residue in the field environment after harvesting has occurred, which is a complex biochemical transformation process. According to previous research, hardwoods are usually infected by white rot, which is often associated with cellulolytic and lignin degradation [43]. Cellulose (partially) can be degraded through enzymatic processes, and lignin (mainly) can be degraded through ligninolytic reactions, such as peroxidase, manganese, and laccase, all resulting in element content changes in logging residues [43]. On the other hand, the dry torrefaction treatment increased the contents of C, ash, and FC of samples and decreased the contents of N, H, O, and volatiles. However, the C, H, O, FC, and volatile changes in TRO2 and TRO4 are more significant than those of TRO0, showing that torrefaction has a greater influence on degraded biomass. This is likely caused by the partial decomposition in the field. Moreover, the ash content increased for all samples by torrefaction from 0.16–0.31% to 0.22–0.56%, with the lowest value of 0.16% for sample RO4. High-ash pellets can clinker and slag up the pellet furnace/boiler and require more cleaning work. According to the standard of ISO 17225-2:2021 [44] certification, wood pellets can be classified into three classes according to their ash content: A1 (ash ≤ 0.7%), A2 (ash ≤ 1.2%), and B (ash ≤ 1.5%) for premium [45]. Therefore, the increased ash contents of all torrefied samples still fit the range of premium wood pellets [45].
Additionally, the HHV decreased from 20.14 MJ/kg to 18.85 MJ/kg from fresh to 4 year-decomposed, which could be because the white-rot fungi mainly decomposed the lignin, which contributes more energy in biomass than cellulose and hemicellulose [46]. Interestingly, there are no significant HHV differences (22.93, 22.80, and 22.99 MJ/kg for TRO0, TRO2, and TRO4, respectively) among the torrefied samples, which means torrefaction stabilized logging residues’ fuel performance. This result means the 300 °C-treated logging residues have similar chemical components, which could be attributed to the hemicellulose (220–315 °C) and partial lignin decomposition (150–900 °C) in the torrefaction process [47]. Since lignin in 2- and 4-year-decomposed red oak has been partially decomposed in the field, the thermal process could have decomposed an approximate amount of lignin.

3.2. Atomic H/C and O/C Ratio, FTIR, and Energy Properties

A Van Krevelen diagram is used to clearly express the atomic hydrogen-to-carbon (H/C) and oxygen-to-carbon (O/C) processes [48]. Figure 1b compares the H/C and O/C ratios of torrefied and untorrefied samples with several other popular biomass species and peat and lignite (from previous studies) in the van Krevelen diagram. The red ellipse circles the data points of torrefied and untorrefied samples. Theoretically, the lower the O/C and H/C, the higher the energy density for fuel because the removal of oxygen will increase the heating value of chemicals. This trend also was found in previous studies [13]. Thus, the energy density for torrefied samples was higher than for untorrefied samples. Moreover, the differences in O/C and H/C among various-year-decomposed residues further prove the gradual degradation of logging residues in the field throughout the years. The torrefied samples have a higher energy density than pine chips, bamboo, and other biomasses listed in the diagram. The untorrefied samples have higher values than rice straw and rice husk [27,28]. The results indicate that torrefaction reduced O and H levels significantly, implying the dissociation of the hydrogen and oxygen functional groups, boosting energy density close to the peat.
FTIR can provide the basic chemical functional group information of biomass. Figure 1c presents a detailed comparison of torrefied and untorrefied samples. The strong absorbance band around 3000 to 3600 cm−1 can be attributed to the O-H stretching vibration. However, with the increasing degree of partial decomposition that occurred in the field over time (from RO0 to RO4), the absorbance intensity changed slightly. However, the significant changes that occurred resulted from the serious decomposition caused by torrefaction. This is primarily due to the depolymerization of hemicellulose and cellulose during the torrefaction. A temperature of 300 °C fits their degradation ranges and both contain significant O-H groups. For the same reason, the C=O (1742 cm−1) and C-O-C (1244 and 815 cm−1) absorbance bands also decreased significantly. A similar decline was found in previous studies [49]. Furthermore, the wave numbers at 1520 and 1442 cm−1 are assigned to the C=C bond in aromatic skeletal bands, which are changed slightly since the aromatic bands are mainly prevalent in lignin. Lignin and lignin-depolymerized fragments are more difficult to degrade at temperatures of 300 °C and below because of the thermal protective feature and complex three-dimensional structure of lignin.
Energy indicators, such as the energy yield and carbon densification factor, can reflect the energy properties of solid bioproducts. The yield of torrefied samples decreased from 71.42% to 69.28% as the age of the sample increased. The EEF of torrefied samples increased from 1.14 to 1.22 and the energy yield increased from 81.31% to 84.50% (Figure 1d). Based on the previous literature, this could be because white rot usually occurs in the hardwood in the field, decomposing the lignin and partial cellulose in the wood. The thermal decomposition stability of hemicellulose and cellulose is lower than lignin, resulting in a decrease in the yield, and the energy yield increased. In addition, the carbon densification factor was 0.88–0.90, which is lower than that of solid char (1.0 to 1.8) [50,51]. The decomposition occurring in the field allows generated fragments to be further decomposed into smaller molecules via torrefaction. Therefore, torrefaction can condense the energy of the biomass, and the longer that logging residue ages in the field, the greater the energy enrichment effect of the torrefaction. The calorific value improvement (CVI) and fuel ratio (FR) ranged from 14 to 22 and 0.43 to 0.47, respectively. Typically, the FR reflects the volatile pollutants (i.e., NOX) emitted upon combustion. A low fuel ratio typically leads to more flaming combustions and faster burnout. The FR of untorrefied logging residues ranged between 0.25 and 0.26, indicating that torrefied samples surpass untorrefied samples in terms of combustion emission performance.

3.3. Combustion Characteristics

Figure 2 provides the combustion TG and DTG curves of torrefied and untorrefied samples. In theory, there are two stages involved in the biomass combustion process: the volatile combustion stage and the char combustion stage. Specifically, the first stage is responsible for drying, devolatilization, and gasification/flaming (pyrolysis and the gases emitted mix with atmospheric air and burn at a high temperature), and the second stage occurs as the remainder of biomass (mostly char generated from the first stage) burns [22].
The results generate a two-stage reaction kinetic scheme for both torrefied and untorrefied samples. For the untorrefied samples, there is a clear DTG peak shoulder at 300 °C, while this did not occur in torrefied samples. A previous study has shown that the thermal decomposition ranges of hemicellulose, cellulose, and lignin are 220–315 °C, 260–400 °C, and 160–900 °C, respectively [13]. Thus, the DTG peak shoulder of untorrefied samples was primarily caused by the combustion of hemicellulose. In addition, as the combustion heating rate increased, the TG and DTG curves shifted to the high-temperature range. This is mainly because the higher heating rate triggers thermal hysteresis, which was also found in previous studies [33,52]. Moreover, the higher combustion heating rate decreases the reaction intensity because the DTG curves’ peak was lower for torrefied and untorrefied samples in both the first and second combustion stages.
Furthermore, the second stage of torrefied samples was more affected than the untorrefied samples, as shown in Figure 2, which indicates a broader combustion zone and a higher burnout temperature. The specific combustion characteristics are listed in Table 2. The first-stage temperature range was between 176.4 °C and 427.7 °C, and the second stage was 391.2 °C to 639.4 °C. Typically, the first stage is responsible for the main weight loss stage, in which the weight loss of the untorrefied samples was between 67.0% and 70.7%, whereas that of the torrefied samples was between 49.3% and 57.0%. In contrast, in the second stage, the weight loss of untorrefied samples was between 23.4% and 26.4%, while that of the torrefied samples was between 41.6% and 47.8%. The weight loss differences in torrefied and untorrefied samples in these two stages are most likely caused by the following reasons: (1) to some degree, torrefaction reduced the major free water and hemicellulose, partial cellulose, and a small amount of lignin, which results in the lower weight loss of torrefied samples in the first stage; and (2) torrefaction increased the char content of samples, which results in the higher weight loss of torrefied samples in the second stage.
Figure 3 expresses the DSC curves (heat flows) of samples with different combustion heating rates. Basically, both combustion stage 1 and stage 2 are exothermic reactions, in which more heat was released in stage 2. As the natural decomposition duration increased, the heat flow decreased at all heating rates. For example, at a heating rate of 40 °C/min, the heat flow peak of RO0 was 25.35 W/g, which was higher than those of RO2 (20.49 W/g) and RO4 (17.42 W/g). This finding indicated that, after natural decomposition, the decomposed lignin contributes to a lower heat release. In addition, the heat flow also increased for all samples after torrefaction, which increased from 16.80 to 29.52 W/g for RO0, from 18.40 to 27.71 W/g for RO2, and from 15.77 to 21.66 W/g for RO4 at a heating rate of 40 °C/min. This result is mainly because the torrefaction increased the energy density of samples and released more heat during combustion. Furthermore, the higher heating rate also improved the heat release flow of torrefied and untorrefied samples (Figure 3).

3.4. Kinetics Analysis

Biomass combustion kinetics is crucial for energy utilization at a commercial scale [22] because it directly influences the efficiency, design, and control of the energy production process. Efficient combustion maximizes energy yield and minimizes waste, while precise knowledge of reaction rates informs the design of reactors to handle the specific demands of biomass fuels. Moreover, it aids in optimizing process conditions to reduce emissions and comply with environmental standards. This knowledge is also crucial for adapting to different biomass types, ensuring economic viability and operational flexibility in the competitive energy market. In this study, four heating rates of 10, 20, 30, and 40 °C/min were employed for both torrefied and untorrefied samples. The reaction order was assumed as the first reaction order (n = 1). According to Equations (12) and (13), the kinetics with the conversion of 0.2 to 0.8 were calculated for each sample and stage, plotting the ln[β/T2] against 1/T (the KAS method) and ln[β] against 1/T (the FWO method) for each sample (Figures S1 and S2). All correlations are statistically sufficient with R2 from 0.9161 to 0.9996 (Tables S2 and S3). The activation energy (Ea) and pre-exponential factor (A) were determined, and the results are shown in Table 3 and Table 4. For the KAS method, the first stage’s average Ea of untorrefied samples slightly decreased with an increase in the natural decomposition duration, from 157.77 KJ/mol to 149.52 KJ/mol, indicating that natural decomposition will lower the combustion difficulty for red oak logging residues. Similar results were shown for the FWO method. However, the second stage presents opposite results for both KAS and FWO methods, which increased from 131.32 to 181.83 KJ/mol and 136.39 to 184.42 KJ/mol, respectively. Unlike the untorrefied samples, the first stage’s average Ea of torrefied samples increased first and then decreased (consistent with previous results [5]) and is higher than that of the second stage, which means the most combustion difficulty for TRO2 occurred in the first stage while lower combustion difficulty occurred for TRO4 in the first phase. The Ea of TRO0 in the second stage is the lowest at 92.63 KJ/mol for the KAS method and 99.88 KJ/mol for the FWO method. Table 4 also lists the pre-exponential factor (A) of torrefied and untorrefied samples with the KAS and FWO methods for two sub-stages. Generally, the first-stage reaction rate is higher than that in the second stage, while the FWO results are higher than the KAS results.
To clarify the reaction model using master plots, the relationships between the conversion rate (α) and P(u)/P(u0.5) and G(α)/G(0.5) (See Equations (15)–(17)) are shown in Figure 4 and Figure 5 at different heating rate and stages. The Ea predetermined by the KAS method was used. Typically, the first-stage reaction model of torrefied and untorrefied samples is different due primarily to the changed chemical component ratio (hemicellulose degraded). In addition, the second-stage reaction model for torrefied and untorrefied samples was similar but the difference became more and more obvious when the heating rate increased (Figure 4). Figure 5 compares the theoretical master plots with experimental values at 10 °C/min for two stages. Both the first stage and the second stage were close to the P3 model (Mampel power law (n = 3)). However, this does not mean the reaction mechanism is the same as the P3 model expressed due to obvious differences (Figure 4).

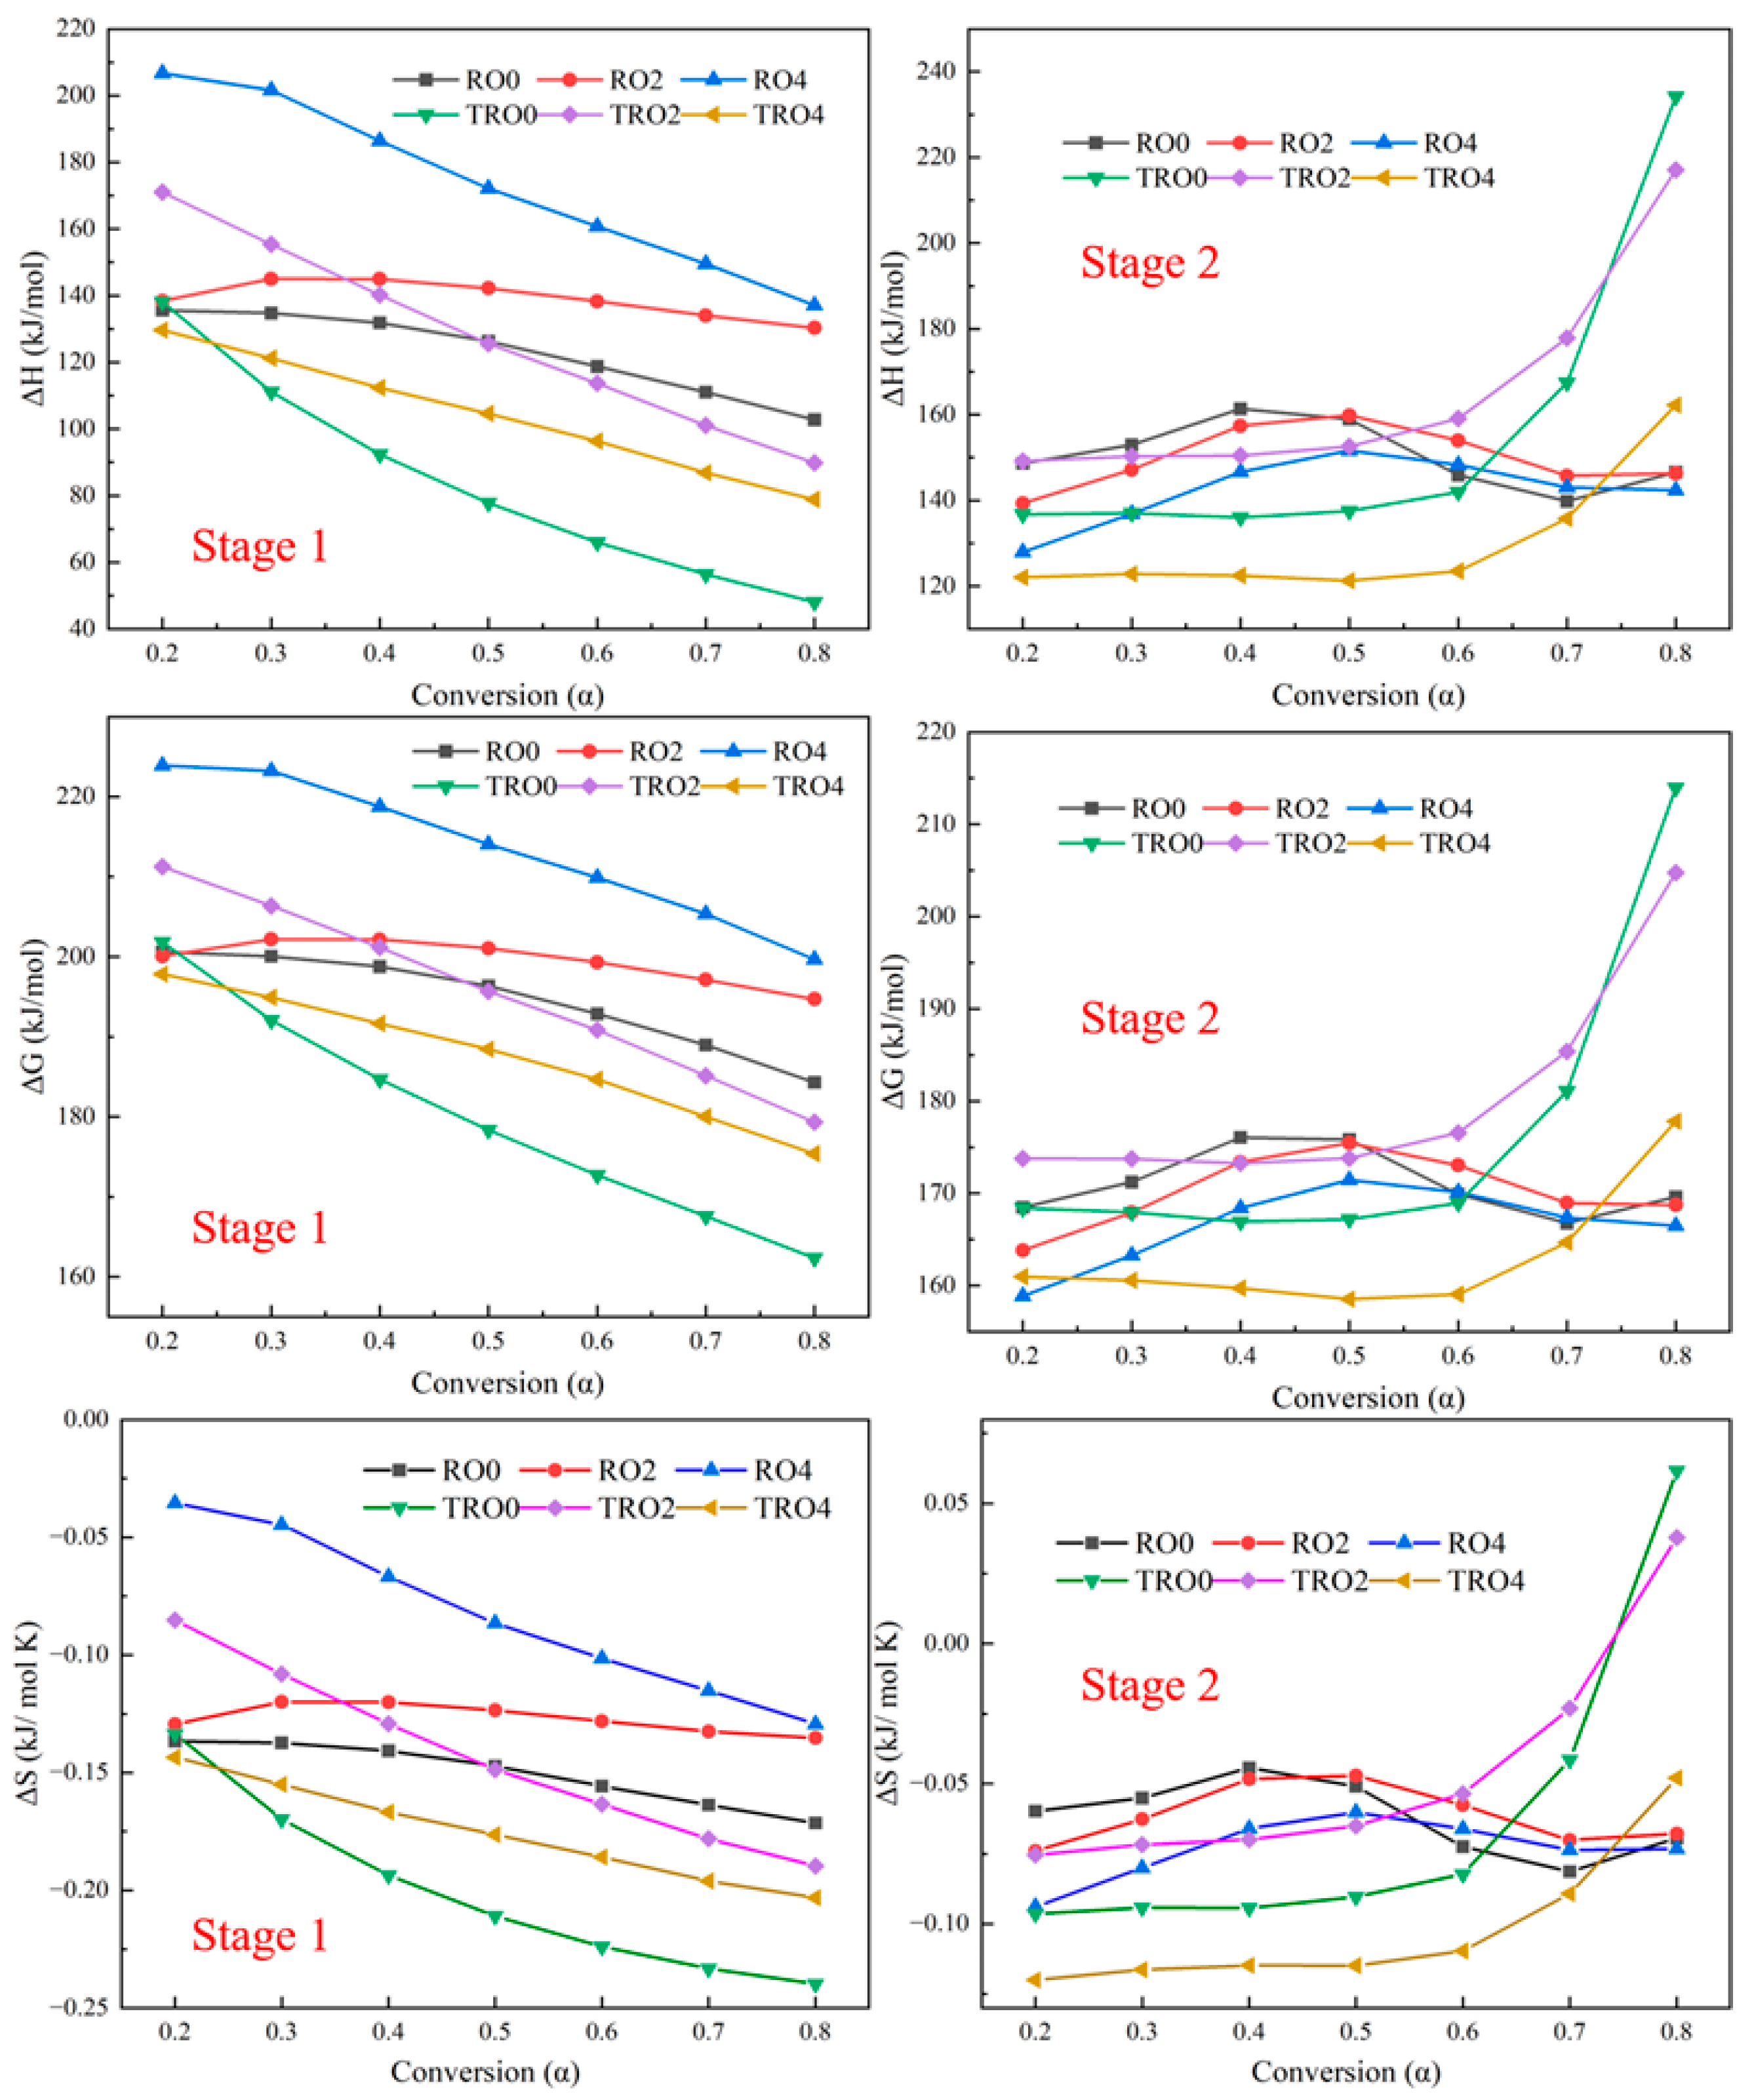
3.5. Thermodynamic Analysis

The enthalpy (∆H) expresses heat release when one mole of a substance burns completely in oxygen, entropy (∆S) is a measure of the degree of disorder in a system where a positive ΔS suggests an increase in disorder while a negative ΔS suggests a decrease, and Gibbs free energy (∆G) is also known as free enthalpy [41]. ΔG combines enthalpy and entropy to determine the spontaneity of a reaction at constant temperature and pressure. The change in ΔG tells us if a process can occur spontaneously. A negative ΔG indicates a spontaneous process, while a positive ΔG means that the process is non-spontaneous and requires energy input to proceed. Figure 6 depicts the ∆H, ∆G, and ∆S based on the KAS method with a heating rate of 10 °C/min. ∆H, ∆G, and ∆S all decreased in the first stage as the conversion rate increased and presented similar trends to each other, which means the heat release and disorder levels decreased. RO4 has the highest ∆H, ∆G, and ∆S values at all conversion rates, while TRO0 yields the lowest ∆H, ∆G, and ∆S values.
In addition, the second stage has a completely different trend of torrefied samples in the first stage. For naturally decomposed samples, the ∆H, ∆G, and ∆S values increased first and then decreased, and these values differed slightly when the conversion rate was 0.8, which means the thermodynamic properties for untorrefied samples were similar at the end of the conversion. However, for torrefied samples, the ∆H, ∆G, and ∆S values did not differ significantly before conversion (α = 0.5), and they then increased significantly after torrefaction. The increase rate for TRO0 was faster than that for TRO2 and TRO4. RO4 is the most reactive and exothermic in the first stage and TRO0 presents the opposite trend to RO4. The thermodynamic properties of torrefied samples increased more sharply than untorrefied samples in a high conversion rate range (0.6–0.8).

4. Conclusions

Natural decomposition decreased the energy density (RO0 > RO2 > RO4), which differed slightly among torrefied samples. The HHV increased by 13.85–21.96%, fixed carbon content increased by 46.41–50.12%, and oxygen content decreased by 11.13–13.11% after torrefaction. The energy yield of logging residue increased after torrefaction. In addition, torrefaction decomposition primarily occurred with hemicellulose and cellulose rather than lignin because a significant reduction in O-H, C=O, and C-O-C groups occurred. All torrefied and untorrefied samples were subjected to two combustion stages, and a higher heating rate would shift the combustion process into the high-temperature zone. Untorrefied samples reacted more easily in the first stage than in the second stage, while the opposite trend is true for torrefied samples. RO4 has the highest ∆H, ∆G, and ∆S values at all conversion rates, while TRO0 yields the lowest ∆H, ∆G, and ∆S values. For the KAS method, the first stage’s average Ea of untorrefied samples decreased slightly as the natural decomposition duration increased, from 157.77 KJ/mol to 149.52 KJ/mol. Similar results were shown for the FWO method. However, the second stage presents opposite results for KAS and FWO methods. The findings of this study will contribute to the effective utilization of naturally decomposed forest logging residues.

Supplementary Materials

The following supporting information can be downloaded at: https://www.mdpi.com/article/10.3390/en17071607/s1, Figure S1: Kinetic plots of two sub-stages according to FWO based on conversion rate from 0.2 to 0.8; Figure S2: Kinetic plots of two sub-stages according to KAS based on conversion rate from 0.2 to 0.8. Table S1: The 15 most popular dynamic models, as well as their reaction mechanisms for a solid-state thermal degradation process [38,43,53]; Table S2 First combustion stage intercept, slope, and R2 of torrefied and untorrefied samples with different conversion rate (SE: Standard error). Table S3 Second combustion stage intercept slope, and R2 of torrefied and untorrefied samples with different conversion rate (SE: Standard error).

Author Contributions

W.H.: methodology, sampling, data curation, experimental, original draft; J.W.: supervision, project administration, funding acquisition, review and editing; J.H.: equipment and experimental; J.S.: sampling, review and editing; S.G.: review and editing; C.J.: experimental; W.S.: sampling; N.N.: review and editing; E.M.S.: review and editing. All authors have read and agreed to the published version of the manuscript.

Funding

This research work was supported by the United States Department of Agriculture National Institute of Food and Agriculture Competitive Grants: 2019-67020-29287 and 2020-68012-31881.

Data Availability Statement

Data is contained within the article and Supplementary Materials.

Acknowledgments

NRCCE of WVU for related data testing.

Conflicts of Interest

The authors declare no conflicts of interest.

References

  1. Ellabban, O.; Abu-Rub, H.; Blaabjerg, F. Renewable energy resources: Current status, future prospects and their enabling technology. Renew. Sustain. Energy Rev. 2014, 39, 748–764. [Google Scholar] [CrossRef]
  2. IEA. Net Zero by 2050; IEA: Paris, France, 2021; Available online: https://www.iea.org/reports/net-zero-by-2050 (accessed on 23 March 2023).
  3. Langholtz, M.H.; Stokes, B.J.; Eaton, L.M. 2016 Billion-Ton Report: Advancing Domestic Resources for a Thriving Bioeconomy, Volume 1: Economic Availability of Feedstock; Managed by UT-Battelle, LLC for the US Department of Energy; Oak Ridge National Laboratory: Oak Ridge, TN, USA, 2016; pp. 1–411.
  4. Jin, E.; Sutherland, J.W. An integrated sustainability model for a bioenergy system: Forest residues for electricity generation. Biomass Bioenergy 2018, 119, 10–21. [Google Scholar] [CrossRef]
  5. Hu, W.; Wang, J.; Hu, J.; Schuler, J.; Grushecky, S.; Nan, N.; Smith, W.; Jiang, C. Thermodegradation of naturally decomposed forest logging residues: Characteristics, kinetics, and thermodynamics. Bioresour. Technol. 2023, 376, 128821. [Google Scholar] [CrossRef]
  6. Seibold, S.; Rammer, W.; Hothorn, T.; Seidl, R.; Ulyshen, M.D.; Lorz, J.; Cadotte, M.W.; Lindenmayer, D.B.; Adhikari, Y.P.; Aragón, R.; et al. The contribution of insects to global forest deadwood decomposition. Nature 2021, 597, 77–81. [Google Scholar] [CrossRef] [PubMed]
  7. Xiao, H.M.; Ma, X.Q.; Lai, Z.Y. Isoconversional kinetic analysis of co-combustion of sewage sludge with straw and coal. Appl. Energy 2009, 86, 1741–1745. [Google Scholar] [CrossRef]
  8. Koppejan, J.; Van Loo, S. (Eds.) The Handbook of Biomass Combustion and Co-Firing; Earth Scan; Routledge: London, UK, 2008. [Google Scholar]
  9. Loeffler, D.; Anderson, N. Emissions tradeoffs associated with cofiring forest biomass with coal: A case study in Colorado, USA. Appl. Energy 2014, 113, 67–77. [Google Scholar] [CrossRef]
  10. Kukrety, S.; Wilson, D.C.; D’Amato, A.W.; Becker, D.R. Assessing sustainable forest biomass potential and bioenergy implications for the northern Lake States region, USA. Biomass Bioenergy 2015, 81, 167–176. [Google Scholar] [CrossRef]
  11. Tumuluru, J.S.; Hess, J.R.; Boardman, R.D.; Wright, C.T.; Westover, T.L. Formulation, pretreatment, and densification options to improve biomass specifications for co-firing high percentages with coal. Ind. Biotechnol. 2012, 8, 113–132. [Google Scholar] [CrossRef]
  12. Cahyanti, M.N.; Doddapaneni, T.R.K.C.; Kikas, T. Biomass torrefaction: An overview on process parameters, economic and environmental aspects and recent advancements. Bioresour. Technol. 2020, 301, 122737. [Google Scholar] [CrossRef]
  13. Chen, W.H.; Lin, B.J.; Lin, Y.Y.; Chu, Y.S.; Ubando, A.T.; Show, P.L.; Ong, H.C.; Chang, J.S.; Ho, S.H.; Culaba, A.B.; et al. Progress in biomass torrefaction: Principles, applications and challenges. Prog. Energy Combust. Sci. 2021, 82, 100887. [Google Scholar] [CrossRef]
  14. Almeida, G.; Brito, J.O.; Perré, P. Alterations in energy properties of eucalyptus wood and bark subjected to torrefaction: The potential of mass loss as a synthetic indicator. Bioresour. Technol. 2010, 101, 9778–9784. [Google Scholar] [CrossRef]
  15. Chen, W.H.; Liu, S.H.; Juang, T.T.; Tsai, C.M.; Zhuang, Y.Q. Characterization of solid and liquid products from bamboo torrefaction. Appl. Energy 2015, 160, 829–835. [Google Scholar] [CrossRef]
  16. Mi, B.; Liu, Z.; Hu, W.; Wei, P.; Jiang, Z.; Fei, B. Investigating pyrolysis and combustion characteristics of torrefied bamboo, torrefied wood and their blends. Bioresour. Technol. 2016, 209, 50–55. [Google Scholar] [CrossRef]
  17. Chen, D.; Gao, A.; Cen, K.; Zhang, J.; Cao, X.; Ma, Z. Investigation of biomass torrefaction based on three major components: Hemicellulose, cellulose, and lignin. Energy Convers. Manag. 2018, 169, 228–237. [Google Scholar] [CrossRef]
  18. Doddapaneni, T.R.K.C.; Praveenkumar, R.; Tolvanen, H.; Palmroth, M.R.; Konttinen, J.; Rintala, J. Anaerobic batch conversion of pine wood torrefaction condensate. Bioresour. Technol. 2017, 225, 299–307. [Google Scholar] [CrossRef] [PubMed]
  19. Chai, M.; Xie, L.; Yu, X.; Zhang, X.; Yang, Y.; Rahman, M.M.; Blanco, P.H.; Liu, R.; Bridgwater, A.V.; Cai, J. Poplar wood torrefaction: Kinetics, thermochemistry and implications. Renew. Sustain. Energy Rev. 2021, 143, 110962. [Google Scholar] [CrossRef]
  20. Cheng, X.; Huang, Z.; Wang, Z.; Ma, C.; Chen, S. A novel on-site wheat straw pretreatment method: Enclosed torrefaction. Bioresour. Technol. 2019, 281, 48–55. [Google Scholar] [CrossRef] [PubMed]
  21. Kai, X.; Meng, Y.; Yang, T.; Li, B.; Xing, W. Effect of torrefaction on rice straw physicochemical characteristics and particulate matter emission behavior during combustion. Bioresour. Technol. 2019, 278, 1–8. [Google Scholar] [CrossRef]
  22. Gil, M.V.; Casal, D.; Pevida, C.; Pis, J.J.; Rubiera, F. Thermal behaviour and kinetics of coal/biomass blends during co-combustion. Bioresour. Technol. 2010, 101, 5601–5608. [Google Scholar] [CrossRef]
  23. Álvarez, A.; Pizarro, C.; García, R.; Bueno, J.L.; Lavín, A.G. Determination of kinetic parameters for biomass combustion. Bioresour. Technol. 2016, 216, 36–43. [Google Scholar] [CrossRef]
  24. Ma, Q.; Han, L.; Huang, G. Evaluation of different water-washing treatments effects on wheat straw combustion properties. Bioresour. Technol. 2017, 245, 1075–1083. [Google Scholar] [CrossRef] [PubMed]
  25. Wang, T.; Fu, T.; Chen, K.; Cheng, R.; Chen, S.; Liu, J.; Mei, M.; Li, J.; Xue, Y. Co-combustion behavior of dyeing sludge and rice husk by using TG-MS: Thermal conversion, gas evolution, and kinetic analyses. Bioresour. Technol. 2020, 311, 123527. [Google Scholar] [CrossRef] [PubMed]
  26. Liang, F.; Wang, R.; Jiang, C.; Yang, X.; Zhang, T.; Hu, W.; Mi, B.; Liu, Z. Investigating co-combustion characteristics of bamboo and wood. Bioresour. Technol. 2017, 243, 556–565. [Google Scholar] [CrossRef] [PubMed]
  27. Channiwala, S.A.; Parikh, P.P. A unified correlation for estimating HHV of solid, liquid and gaseous fuels. Fuel 2002, 81, 1051–1063. [Google Scholar] [CrossRef]
  28. Jenkins, B.; Baxter, L.L.; Miles, T.R., Jr.; Miles, T.R. Combustion properties of biomass. Fuel Process. Technol. 1998, 54, 17–46. [Google Scholar] [CrossRef]
  29. Cordero, T.; Marquez, F.; Rodriguez-Mirasol, J.; Rodriguez, J.J. Predicting heating values of lignocellulosics and carbonaceous materials from proximate analysis. Fuel 2001, 80, 1567–1571. [Google Scholar] [CrossRef]
  30. Munir, S.; Daood, S.S.; Nimmo, W.; Cunliffe, A.M.; Gibbs, B.M. Thermal analysis and devolatilization kinetics of cotton stalk, sugar cane bagasse and shea meal under nitrogen and air atmospheres. Bioresour. Technol. 2009, 100, 1413–1418. [Google Scholar] [CrossRef] [PubMed]
  31. Bonelli, P.R. Slow pyrolysis of nutshells: Characterization of derived chars and of process kinetics. Energy Sources 2003, 25, 767–778. [Google Scholar] [CrossRef]
  32. Masiá, A.T.; Buhre, B.J.P.; Gupta, R.P.; Wall, T.F. Characterising ash of biomass and waste. Fuel Process. Technol. 2007, 88, 1071–1081. [Google Scholar] [CrossRef]
  33. Hu, W.; Feng, Z.; Yang, J.; Gao, Q.; Ni, L.; Hou, Y.; He, Y.; Liu, Z. Combustion behaviors of molded bamboo charcoal: Influence of pyrolysis temperatures. Energy 2021, 226, 120253. [Google Scholar] [CrossRef]
  34. ASTM D7582-15; Standard Test Methods for Proximate Analysis of Coal and Coke by Macro Thermogravimetric Analysis. ASTM International: West Conshohocken, PA, USA, 2015.
  35. ASTM D3176-15; Standard Practice for Ultimate Analysis of Coal and Coke. ASTM International: West Conshohocken, PA, USA, 2015.
  36. ASTM E711-87; Standard Test Method for Gross Calorific Value of Refuse-Derived Fuel by the Bomb Calorimeter. ASTM International: West Conshohocken, PA, USA, 2004; pp. 1–8.
  37. Cai, H.; Liu, J.; Xie, W.; Kuo, J.; Buyukada, M.; Evrendilek, F. Pyrolytic kinetics, reaction mechanisms and products of waste tea via TG-FTIR and Py-GC/MS. Energy Convers. Manag. 2019, 184, 436–447. [Google Scholar] [CrossRef]
  38. Zou, H.; Li, W.; Liu, J.; Buyukada, M.; Evrendilek, F. Catalytic combustion performances, kinetics, reaction mechanisms and gas emissions of Lentinus edodes. Bioresour. Technol. 2020, 300, 1226. [Google Scholar] [CrossRef] [PubMed]
  39. Kissinger, H.E. Reaction kinetics in differential thermal analysis. Anal. Chem. 1957, 29, 1702–1706. [Google Scholar] [CrossRef]
  40. Doyle, C.D. Estimating isothermal life from thermogravimetric data. J. Appl. Polym. Sci. 1962, 6, 639–642. [Google Scholar] [CrossRef]
  41. Dhyani, V.; Kumar, J.; Bhaskar, T. Thermal decomposition kinetics of sorghum straw via thermogravimetric analysis. Bioresour. Technol. 2017, 245, 1122–1129. [Google Scholar] [CrossRef] [PubMed]
  42. Singh, R.K.; Pandey, D.; Patil, T.; Sawarkar, A.N. Pyrolysis of banana leaves biomass: Physico-chemical characterization, thermal decomposition behavior, kinetic and thermodynamic analyses. Bioresour. Technol. 2020, 310, 123464. [Google Scholar] [CrossRef] [PubMed]
  43. Goodell, B.; Qian, Y.; Jellison, J. Fungal Decay of Wood: Soft Rot-Brown Rot-White Rot. In Development of Commercial Wood Preservatives; ACS Symposium Series; American Chemical Society: Washington, DC, USA, 2008; Chapter 2; pp. 9–31. [Google Scholar] [CrossRef]
  44. ISO 17225-2: 2021; Solid Biofuels—Fuel Specifications and Classes—Part 2: Graded Wood Pellets. International Organization for Standardization: Geneva, Switzerland, 2021.
  45. ISO 17225-2; Solid Biofuels—Fuel Specifications and Classes—Part 2: Graded Wood Pellets. The British Standards Institution: London, UK, 2021. Available online: https://www.iso.org/standard/76088.html (accessed on 23 May 2022).
  46. Demirbaş, A. Relationships between lignin contents and heating values of biomass. Energy Convers. Manag. 2001, 42, 183–188. [Google Scholar] [CrossRef]
  47. Yang, H.; Yan, R.; Chen, H.; Lee, D.H.; Zheng, C. Characteristics of hemicellulose, cellulose and lignin pyrolysis. Fuel 2007, 86, 1781–1788. [Google Scholar] [CrossRef]
  48. Kim, S.; Kramer, R.W.; Hatcher, P.G. Graphical method for analysis of ultrahigh-resolution broadband mass spectra of natural organic matter, the van Krevelen diagram. Anal. Chem. 2003, 75, 5336–5344. [Google Scholar] [CrossRef]
  49. El-Hendawy, A.N.A. Variation in the FTIR spectra of a biomass under impregnation, carbonization and oxidation conditions. J. Anal. Appl. Pyrolysis 2006, 75, 159–166. [Google Scholar] [CrossRef]
  50. Lu, X.; Pellechia, P.J.; Flora, J.R.; Berge, N.D. Influence of reaction time and temperature on product formation and characteristics associated with the hydrothermal carbonization of cellulose. Bioresour. Technol. 2013, 138, 180–190. [Google Scholar] [CrossRef] [PubMed]
  51. Ge, S.; Foong, S.Y.; Ma, N.L.; Liew, R.K.; Mahari, W.A.W.; Xia, C.; Yek, P.N.Y.; Peng, W.; Nam, W.L.; Lim, X.Y.; et al. Vacuum pyrolysis incorporating microwave heating and base mixture modification: An integrated approach to transform biowaste into eco-friendly bioenergy products. Renew. Sustain. Energy Rev. 2020, 127, 109871. [Google Scholar] [CrossRef]
  52. Liang, F.; Wang, R.; Xiang, H.; Yang, X.; Zhang, T.; Hu, W.; Mi, B.; Liu, Z. Investigating pyrolysis characteristics of moso bamboo through TG-FTIR and Py-GC/MS. Bioresour. Technol. 2018, 256, 53–60. [Google Scholar] [CrossRef] [PubMed]
  53. Aslan, D.I.; Parthasarathy, P.; Goldfarb, J.L.; Ceylan, S. Pyrolysis reaction models of waste tires: Application of Master-Plots method for energy conversion via devolatilization. Waste Manag. 2017, 68, 405–411. [Google Scholar] [CrossRef] [PubMed]
Figure 1. (a) Torrefaction process and parameters; (b) van Krevelen diagram of atomic ratios for torrefied and untorrefied logging residues and other biomasses; (c) FTIR spectra of untorrefied and torrefied red oak logging residues. Sources: Rice husk [27], Rice straw [28], Olive stones [29], Cotton stalk [30], Peanut shell [31], Pine chips [32], and Bamboo [33]; (d) the yield and energy properties of torrefied samples.
Energies 17 01607 g001
Figure 2. Combustion TG and DTG curves of naturally decomposed and torrefied forest logging residues with different heating rates.
Energies 17 01607 g002
Figure 3. Differential scanning calorimetry curves of naturally decomposed and torrefied forest logging residues with different heating rates.
Energies 17 01607 g003
Figure 4. P(u)/P(u0.5) values versus conversion rate of samples with different stages and heating rates.
Energies 17 01607 g004
Figure 5. P(u)/P(u0.5) comparison with master plots (G(α)/G(0.5)) versus conversion rate of samples with different stages and heating rates.
Energies 17 01607 g005
Figure 6. ∆H, ∆G, and ∆S variation with conversion rate at 10 °C/min and different sub-stages.
Energies 17 01607 g006
Table 1. Proximate, ultimate analyses, and HHV of samples.
SamplesNCHSO *VolatileAshFC *HHV (MJ/kg)
(wt.%, Dry Basis)
RO00.8448.546.34-44.2978.900.2919.9320.14
RO20.7248.396.33-44.5678.200.3120.5919.74
RO40.7748.976.36-43.9178.400.1620.4818.85
TRO00.4653.805.76-39.9768.100.5129.1822.93
TRO20.6855.145.46-38.7266.100.5630.9122.80
TRO40.4355.635.42-38.5366.300.2230.5022.99
* Calculated by difference.
Table 2. Combustion characteristics of torrefied and untorrefied logging residues with different heating rates.
SamplesHeating Rate (°C/min)Stage 1Stage 2
Temp. Range (°C)Peak Temp. (°C)Weight Loss (wt.%)Temp. Range (°C)Peak Temp. (°C)Weight Loss (wt.%)
RO010176.4–396.4331.867.0396.4–513.8475.825.4
20184.6–414.2347.569.8414.2–545.9496.124.8
30197.7–425.4356.970.5425.4–570.8510.824.1
40202.0–427.7363.068.8427.7–577.7514.725.7
RO210182.8–391.7331.467.1391.7–515.4478.526.4
20190.6–401.4345.570.2401.4–530.9489.123.9
30192.7–418.4351.969.7418.4–566.9507.024.5
40202.6–423.4358.670.7423.4–582.0496.823.4
RO410181.7–393.8330.067.3393.8–542.6491.726.1
20184.7–405.4344.368.2405.4–555.5494.523.9
30194.6–414.8351.369.6414.8–571.5497.824.4
40204.0–414.5358.069.1414.5–588.4516.824.9
TRO010229.5–402.6328.357.0402.6–512.7477.339.7
20245.2–407.8342.655.5407.8–548.1490.841.6
30252.3–417.3351.154.4417.3–583.4526.142.7
40254.7–418.6360.253.1418.6–639.4533.943.9
TRO210230.9–391.2326.652.9391.2–523.3478.743.8
20240.8–401.7340.650.7401.7–554.4504.346.4
30246.1–404.2347.649.3404.2–580.1516.847.8
40252.3–413.9354.452.1413.9–609.7525.744.8
TRO410226.4–387.8324.552.6387.8–526.7475.744.2
20251.7–409.1340.054.8409.1–568.9501.844.3
30253.9–410.3347.252.6410.3–597.4516.944.2
40255.7–418.7356.453.3418.7–603.4535.843.6
Table 3. Average combustion activation energy for torrefied and untorrefied samples with KAS and FWO methods and two sub-stages (SE: Standard error).
SampleStage 1Stage 2
KASFWOKASFWO
Ea (KJ/mol)SEEa (KJ/mol)SEEa (KJ/mol)SEEa (KJ/mol)SE
RO0157.7710.71159.3010.21131.327.38136.397.06
RO2157.127.88158.637.45147.3129.80151.5028.30
RO4149.523.03151.392.89181.8321.08184.4220.00
TRO0163.1810.66164.7110.1392.6318.2999.8817.28
TRO2172.527.95173.547.54136.4715.00141.3714.18
TRO4137.308.87140.058.42112.638.37118.737.90
Table 4. Average combustion pre-exponential factor for torrefied and untorrefied samples with KAS and FWO methods and two sub-stages (SE: Standard error).
SampleStage 1Stage 2
KASFWOKASFWO
A (min−1)SEA (min−1)SEA (min−1)SEA (min−1)SE
RO01.25 × 10111512.773.27 × 1017107.812.45 × 1006808.089.38 × 101253.37
RO21.14 × 10111392.553.03 × 101768.572.30 × 10078843.928.95 × 10131747.48
RO42.43 × 10101206.816.49 × 101641.852.06 × 10112907.767.76 × 1017588.13
TRO02.56 × 10162355.997.85 × 1022676.881.18 × 10062017.244.43 × 1012429.93
TRO21.45 × 10151515.204.37 × 1021257.174.17 × 10081527.581.54 × 1015171.97
TRO44.81 × 10103890.801.42 × 10172263.284.72 × 1005827.181.74 × 1012119.442
Disclaimer/Publisher’s Note: The statements, opinions and data contained in all publications are solely those of the individual author(s) and contributor(s) and not of MDPI and/or the editor(s). MDPI and/or the editor(s) disclaim responsibility for any injury to people or property resulting from any ideas, methods, instructions or products referred to in the content.

