Article

One-Pot Hydrothermal Synthesis and Electrochemical Performance of Subspheroidal Core–Shell Structure MoS2/C Composite as Anode Material for Lithium-Ion Batteries

1
School of Materials Science and Engineering, Henan University of Science and Technology, Luoyang 471023, China
2
Collaborative Innovation Center for New Materials and Advanced Processing Technologies of Nonferrous Metals, Luoyang 471023, China
3
National Joint Engineering Research Center for Abrasion Control and Molding of Metal Materials, Luoyang 471003, China
*
Author to whom correspondence should be addressed.
Energies 2024, 17(7), 1678; https://doi.org/10.3390/en17071678
Submission received: 25 February 2024 / Revised: 20 March 2024 / Accepted: 26 March 2024 / Published: 1 April 2024
(This article belongs to the Section D2: Electrochem: Batteries, Fuel Cells, Capacitors)

Abstract

:
Molybdenum disulfide (MoS2) is a promising anode material for lithium-ion batteries (LIBs) due to its distinctive graphene-like structure and high specific capacity. However, its commercial application is hindered by the severe volume expansion during lithiation/delithiation and poor conductivity. In this paper, we report a facile one-pot enhanced hydrothermal synthesis strategy to prepare high-performance MoS2/C composite materials. The results indicate that the as-prepared MoS2/C composite is a subspheroidal core–shell structure material, with uniform coating, good particle dispersion, and an average grain size of approximately 80 nm. The morphology of the composite remained unchanged even after annealing at 500 °C for 2 h. The addition of glucose can accelerate the nucleation and growth of MoS2, and higher hydrothermal temperatures can improve the product yield. The addition of PVP has little effect on the yield, but significantly reduces the particle size. The XPS analysis reveals that the MoO3 may be generated as an intermediate product during the hydrothermal process. The electrochemical test results show that the unannealed MoS2/C samples exhibit discharge-specific capacities of 705.2 mAh·g−1 and 625.7 mAh·g−1 after the first cycle and the 100th cycle, respectively, at a current density of 500 mA·g−1, with a capacity retention rate of 88.7%. In contrast, the specific capacity of the MoS2/C specimens after annealing at 500 °C for 2 h shows a tendency to decrease and then slowly increase during the cycles, and the discharge specific capacity is 582.3 mAh·g−1 after the 100th cycle, which is lower than that of the unheated sample. The impedance analysis reveals that the lithium-ion diffusion coefficient of the MoS2/C material without calcination is 2.11 × 10⁻¹⁸ cm·s−2, which is superior to that of the annealed MoS2/C and pristine MoS2 samples. This characteristic is favorable for lithiation/delithiation during the charge/discharge process.

1. Introduction

In recent years, lithium-ion batteries (LIBs) have been significantly widely used in electric vehicles, portable communication devices, and wearable electronics due to their remarkable properties, e.g., relatively high energy density, rapid charge/discharge capacity, lack of memory effect, and long cycle life, etc. [1,2,3,4,5]. With the increased global focus on the transmission of fossil fuels to cleaner energy and reduction of carbon emissions [6,7,8,9], coupled with the explosive growth of the new energy vehicle market [10], the manufacturing technology and comprehensive performance of LIBs have been further improved. Consequently, they have been gradually applied in the fields of power batteries such as power tools and electric vehicles, as well as stationary energy storage batteries used for solar or wind power storage. As the most commonly used battery technology today, LIBs are a vital unit of the modern energy system.
The anode material is an essential component of LIBs, as it determines the capacity and cycle life of the battery. Currently, graphite is the most extensively used commercial anode material due to its excellent conductivity, smooth discharge, and cost-effectiveness [11]. However, the coulombic efficiency and rate performance of the graphite anode are low, with a theoretical capacity of only 372 mAh·g−1 [12]. In addition, the graphite material is incompatible with the electrolyte, resulting in solvent molecules embedded with lithium in the graphite interlayers during the charging and discharging process. This incompatibility directly reduces both the cycling performance and the specific capacity. Therefore, the graphite anode is insufficient to meet the future demands for LIBs of high capacity and high power.
Molybdenum disulfide (MoS2) is a potential candidate as an anode material for LIBs due to its unique graphene-like layered structure and high specific capacity (with a theoretical capacity of up to 670 mAh·g−1) [13,14,15]. MoS2 has a sandwich structure consisting of covalently bonded Mo-Mo spacing of 0.315 nm within the layers. Furthermore, the layers are connected by weak van der Waals forces, which facilitate the removal and insertion of lithium ions. However, MoS2 has some drawbacks as an anode material for LIBs [16]. For instance, as a semiconductor material, MoS2 has low ion mobility, resulting in high internal resistance and sluggish ion transport. Additionally, the charging and discharging process causes a significant volume change in the MoS2 material. Consequently, the commercial application of MoS2 as an efficient LIBs anode material is further limited by these obstacles.
Recent research has shown that nanocrystallization and hybridization of MoS2 are effective approaches for resolving the above limitations of MoS2 anode materials. Nanocrystalline MoS2 increases the number of reactive sites that significantly enhance ion transport efficiency. Various representative morphologies of nanocrystalline MoS2 have been studied in the literature, including one-dimensional (1D) nanowires [17] and nanotubes [18], two-dimensional (2D) nanosheets [19,20], three-dimensional (3D) nanoflowers [21,22], and nanospheres [23]. However, nanocrystallization exhibits superior specific capacity compared to the improvement in cycle stability. Furthermore, hybridization is another commonly used technique to enhance the comprehensive performance of MoS2 materials in addition to the effective morphology modulation. Incorporating MoS2 with other elementary substances or compounds can inhibit nanosheet stacking and aggregation, enhance the electrical conductivity of the structure and buffer volume expansion during cycling, and improve the cycling stability of the pristine MoS2 anode material. Numerous studies have been conducted to enhance the performance of the MoS2-based anode materials. Liu et al. [24] reported a simple hydrothermal synthesis process to prepare 3D nanoflower-like MoS2 grown on wheat straw cellulose carbon (MoS2@WSCC-F) materials. The carbon enhanced the electrical conductivity of the composite and maintained structural integrity by accommodating the volume changes during cycling. The obtained MoS2@WSCC-F has a stable charge–discharge capacity of 1056.3 mAh·g−1 after 300 cycles at a 1 C rate, a first-cycle Coulombic efficiency of 77%, and a capacity retention rate of 80.4%. Liu et al. [25] prepared the flower-like MoS2 nanosheets encapsulated by nitrogen-doped graphene (FL-MoS2/N-G) by a feasible polyacrylamide (PAM)-assisted hydrothermal approach. The growth of FL-MoS2 is restricted to the interlayers of the graphene. This encapsulation structure has a high loading of active molybdenum disulfide and stabilized structural integrity, which facilitates in the embedding and transportation of lithium ions. The as-obtained FL-MoS2/N-G composite exhibits a high reversible capacity of about 1202 mAh·g−1 at 0.2 A·g−1 and it can remain 835 mAh·g−1 even at 5 A·g−1. Long et al. [26] synthesized a unique MoS2/graphene composite (MoS2/GrF) via a facile hydrothermal method. Due to the “space-confined” effect, the growth of the (002) plane of MoS2 between the layers of graphene oxide was inhibited. This results in the penetration of molybdenum disulfide microspheres (average diameter of 750 nm) into the graphene layers, thereby increased the interlayer spacing and improved the rate performance of the electrode. The MoS2/GrF electrode exhibited an reversible capacity (1510 mAh·g−1 at 100 mA·g−1 after 200 cycles) and excellent rate performance (~990 mAh·g−1 at 1000 mA·g−1). Yang et al. [27] impregnated ordered mesoporous graphene superaparticles (OMGSs) with (NH4)2MoS4 precursor, followed by calcination to produce MoS2@OMGSs composite powders. The encapsulation of 3D-graphene and the highly curved internal network structure of MoS2 make it well suited for lithium-ion storage. MoS2@OMGSs demonstrates excellent cycling stability and rate performance, with a specific capacity of up to 1350 mAh·g−1 and 400 mAh·g−1 at current densities of 0.1 A·g−1 and 10 A·g−1, respectively.
However, the current research on MoS2 modification still faces some challenges. Firstly, the composite category mainly focuses on graphene, carbon nanotubes, and other carbon composites [24,25], which have a complex composition, cumbersome synthesis procedures, and high costs. Secondly, although the prepared MoS2 anode materials have complex and elaborate morphology that enhance electrochemical performance, pursuing a few-layered structure and nanocrystallization exclusively may have a negative impact on both the charge/discharge stability and the specific capacity of the anode material. Nanocrystalline powder materials with complex morphology often have a negative correlation between their complexity and stability, i.e., excessively sophisticated morphology can lead to poor stability [27,28] and low packing density, which compounds with the intrinsic property of nanomaterials. The low density of electrode materials also results in reduced loading of anode materials and, consequently, decreased volumetric energy density. This impedes the commercial application of nano-sized anode material. Therefore, excessive pursuit of delicate morphology is not appropriate. Furthermore, most hydrothermal or solvothermal processes employ the ordinary stationary hydrothermal method with a Teflon-lined stainless autoclave, which is time-consuming, typically exceeding 12 h [29,30,31,32]. The improved hydrothermal method utilized in this experiment includes stirring throughout the reaction process, resulting in increased product yield, a more uniform particle size distribution, smaller product size, decreased product adherence to the reaction line, more uniform distribution of concentration and temperature during reaction, and a shortened reaction time [33,34,35].
This study utilized a microreactor with adjustable temperature, pressure, and stirring speed to prepare nanopowder materials through a one-step, high-intensity hydrothermal process. In this experiment, the inexpensive glucose was utilized as a carbon source material to prepare MoS2/C through a hydrothermal reaction, which improved the conductivity of the material and reduced the internal resistance of the battery. Additionally, carbon provided buffer space for the volume effect of MoS2 in the charge and discharge process, which improved the cycle stability of the battery. The as-prepared subspheroidal MoS2/C composite powder has a uniform grain size distribution and was successfully prepared through hydrothermal reaction in a shorter period (e.g., 7 h), and at a lower temperature (≤200 °C). The effects of hydrothermal temperature and PVP addition on the powder morphology, particle size, and product yield were studied in detail. The crystal structure, morphology, elemental composition, and surface elemental valence states of the MoS2/C material were characterized by X-ray diffraction (XRD), field emission scanning electron microscopy (FESEM), high-resolution transmission electron microscopy (HRTEM), and X-ray photoelectron spectroscopy (XPS), respectively.
The enhanced hydrothermal method for producing nanoparticles offers several benefits, including high synthesis efficiency, efficient use of raw materials, facile preparation procedure, high safety, and minimal equipment requirements. In comparison to alternative techniques, the enhanced hydrothermal method is less expensive and more widely applicable. The reactions proceed in a sealed container, and its impact on both the environment and human health is minimal, in line with the principles of sustainable and eco-friendly development. This system has the potential to serve as a model for synthesizing anode materials in high-capacity lithium batteries.

2. Experimental

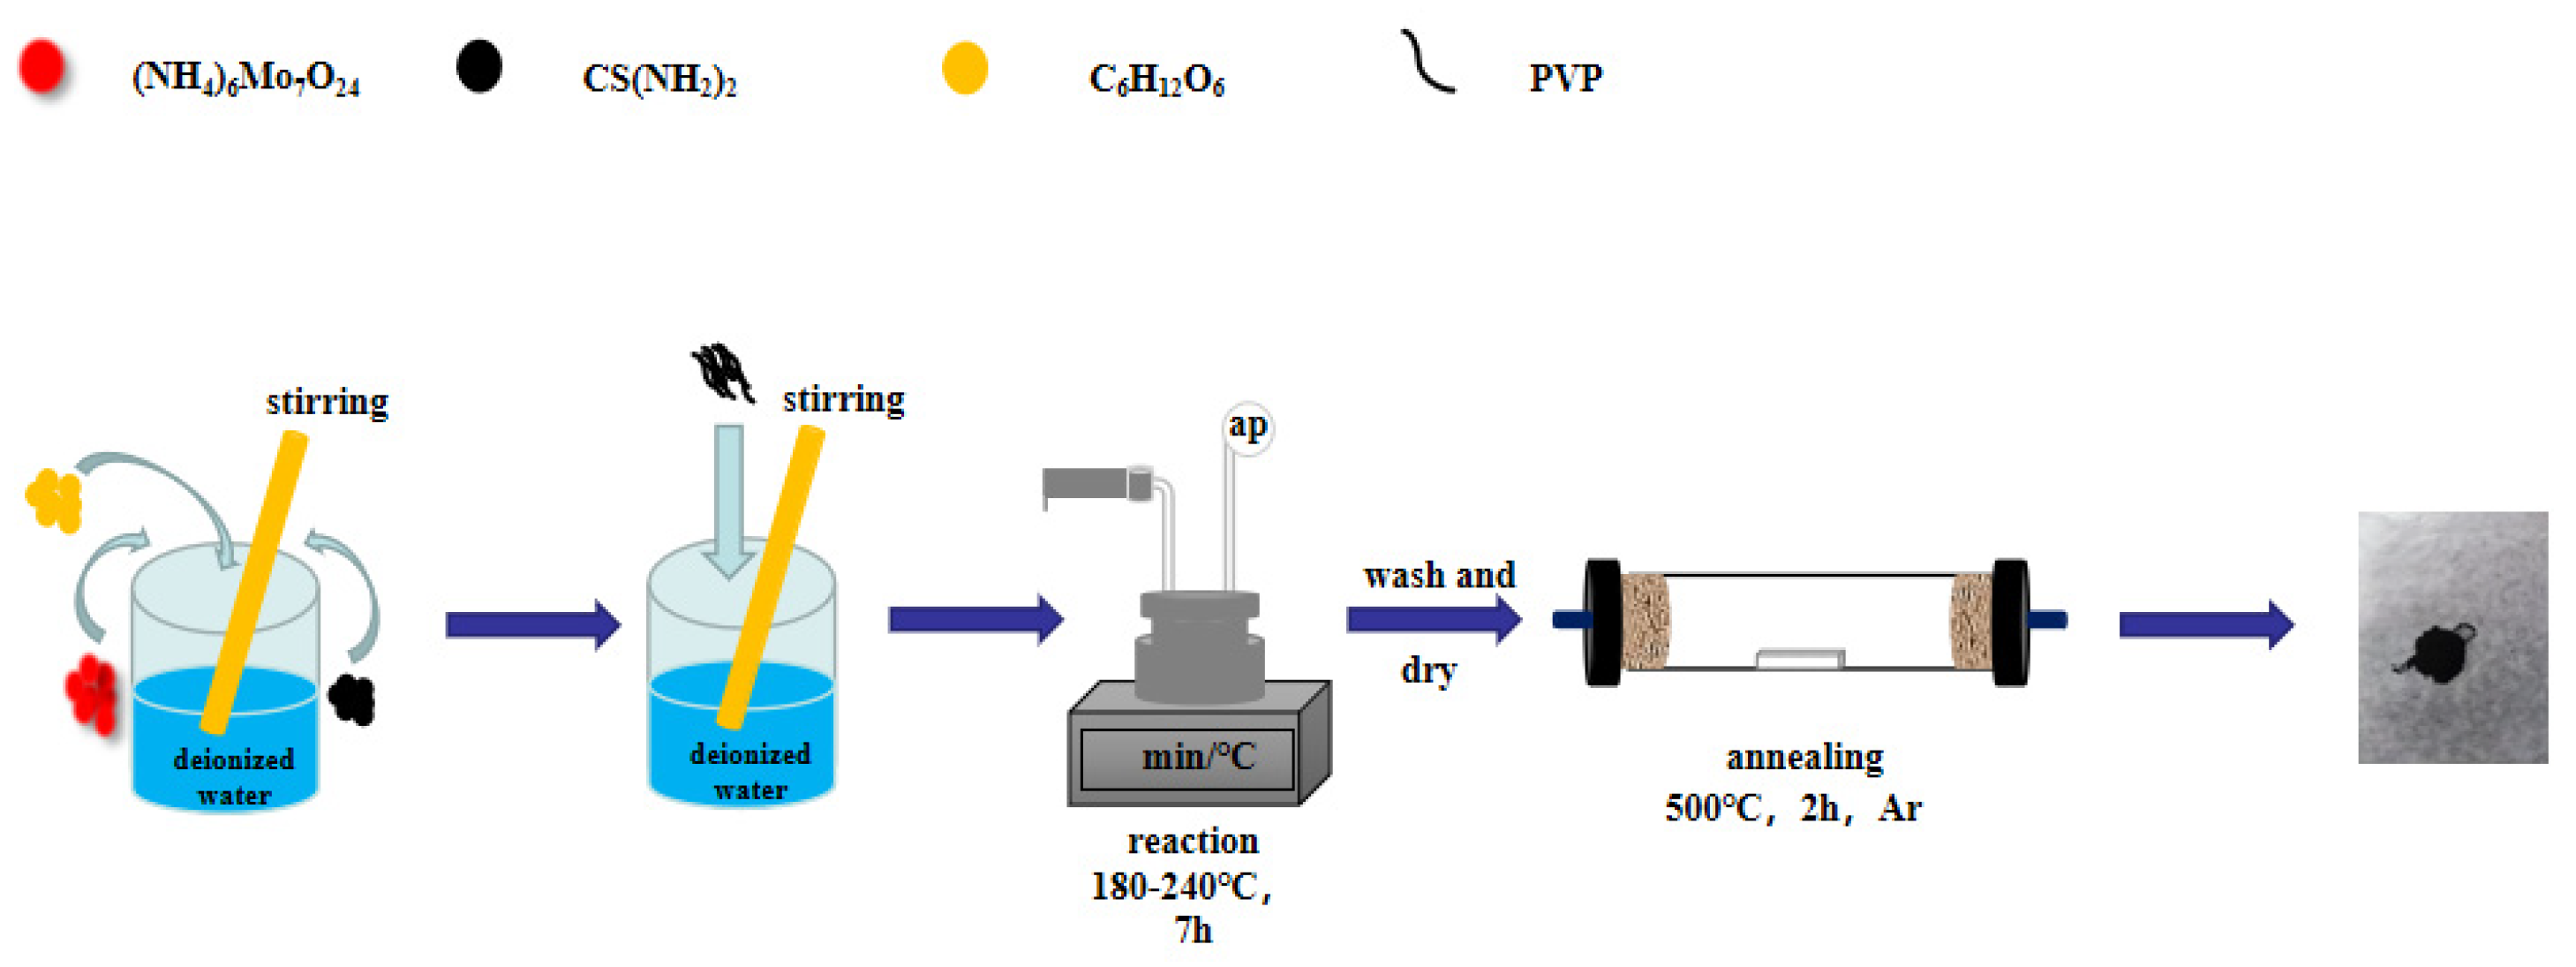
2.1. Synthesis of the MoS2/C Composite

The experimental procedure is illustrated in Figure 1, in which all reagents were of analytical grade without further purification.
In a typical synthesis process, 0.53 mmol of ammonium molybdate ((NH4)6Mo7O24·4H2O, Tianjin Chemical Reagent Co., Tianjin, China), 18.68 mmol of thiourea (CS(NH2)2, Tianjin Tianxiang Chemical Reagent Co., Tianjin, China), and 30.30 mmol of glucose (C6H12O6-H2O, Tianjin Fenghua Chemical Reagent Co., Tianjin, China) were dissolved in sequence in 80 mL of deionized water. After complete dissolution, a specific amount of polyvinyl pyrrolidone ((C6H9NO)n, PVP, Rhawn reagent Co., Ltd., Shanghai, China) was added to the solution and stirred until fully dissolved. The solution was then transferred to a 180 mL stainless steel autoclave lined with modified polyvinyl tetrafluoroethylene) (PTFE) and reacted at a set temperature (180–240 °C) for 7 h. After cooling down to room temperature, the residue was centrifuged washed with ethanol and deionized water alternately six times, and then dried at 70 °C for 12 h in a vacuum dryer oven. Subsequently, the obtained MoS2/C composite powder was annealed in a tubular furnace with argon (purity > 99.999%) protection at 500 °C for 2 h at a heating rate of 5 °C/min and a flow rate of 250 mL/min. For comparison, pristine MoS2 was synthesized under identical experimental conditions without glucose. The product yield was calculated according to the following formula:
r = m m 1 × 280 309 + m 2 × 4 11 × 100 %
where r is the recovery rate, %; m is the mass of the production, g; m1 is the amount of ammonium molybdate, mol; m2 is the amount of glucose, mol.

2.2. Characterization of the MoS2/C Composite

The crystal structure of the samples was determined using X-ray diffraction (XRD, D8-Advanced, Bruker, Karlsruhe, Germany, Cu target radiation (λ = 1.5406 Å)) with a scanning interval of 0.02° from 10° to 80°, while the morphology and microstructure were characterized by scanning electron microscope (SEM, VEGA-SBH, TESCAN, Brno, Czech Republic, with a magnification of 1–10 k and an accelerating voltage of 10–20 kV), field emission scanning electron microscope (FESEM, JSM-IT800, Nippon Electronics, Tokyo, Japan, with a magnification of 1–400 k and a working distance of 10 mm), and high-resolution transmission electron microscope (HRTEM, JEM-2100, Nippon Electronics, Japan, with a magnification of 50–1000 k and an accelerating voltage of 200 kV). The composition and content of the specimens were determined using an energy dispersive spectrometer (EDS, Falcon, EDAX, Pleasanton, CA, USA). Additionally, an X-ray photoelectron spectrometer (XPS, ESCALAB 250Xi K-Alpha+, Thermo Fischer Scientific, Waltham, MA, USA, with a working voltage of 12.5 kV and a filament current of 16 mA) with Al Kα X-ray source (hv = 1486.6 eV) was used to analyze both the elemental composition and valence states of the specimens. A laser particle size analyzer (LPSA, LA-960, HORIBA, Kyoto, Japan) was used to detect the particle size of the material with a light transmittivity of 85% and ultrasonic dispersion of 1 h.

2.3. Electrochemical Performance Test

The samples were mixed and ground with acetylene black and polyvinylidene fluoride in advance. An amount of 20 drops of N-Methylpyrrolidone was then added to form a moderately viscous slurry, which was then evenly coated onto the unpolished surface of clean Cu foils as the anode material. CR2032 buckle cells were assembled in an argon-filled glove box (MIKROUNA-SUPER, Mikrouna (Shanghai, China) Ind. Int. Tech. Co., Ltd., Shanghai, China), with a lithium sheet used as the counter electrode. The charge/discharge cycle performance and rate performance of button batteries were tested on the CT2001A (Wuhan Land Electronics Co., Ltd., Wuhan, China) button battery test system. The cyclic voltammetry (CV) and electrochemical impedance spectroscopy (EIS) tests were carried out at the CHI660E electrochemical workstation (CH Instruments, Austin, TX, USA).

3. Results and Discussion

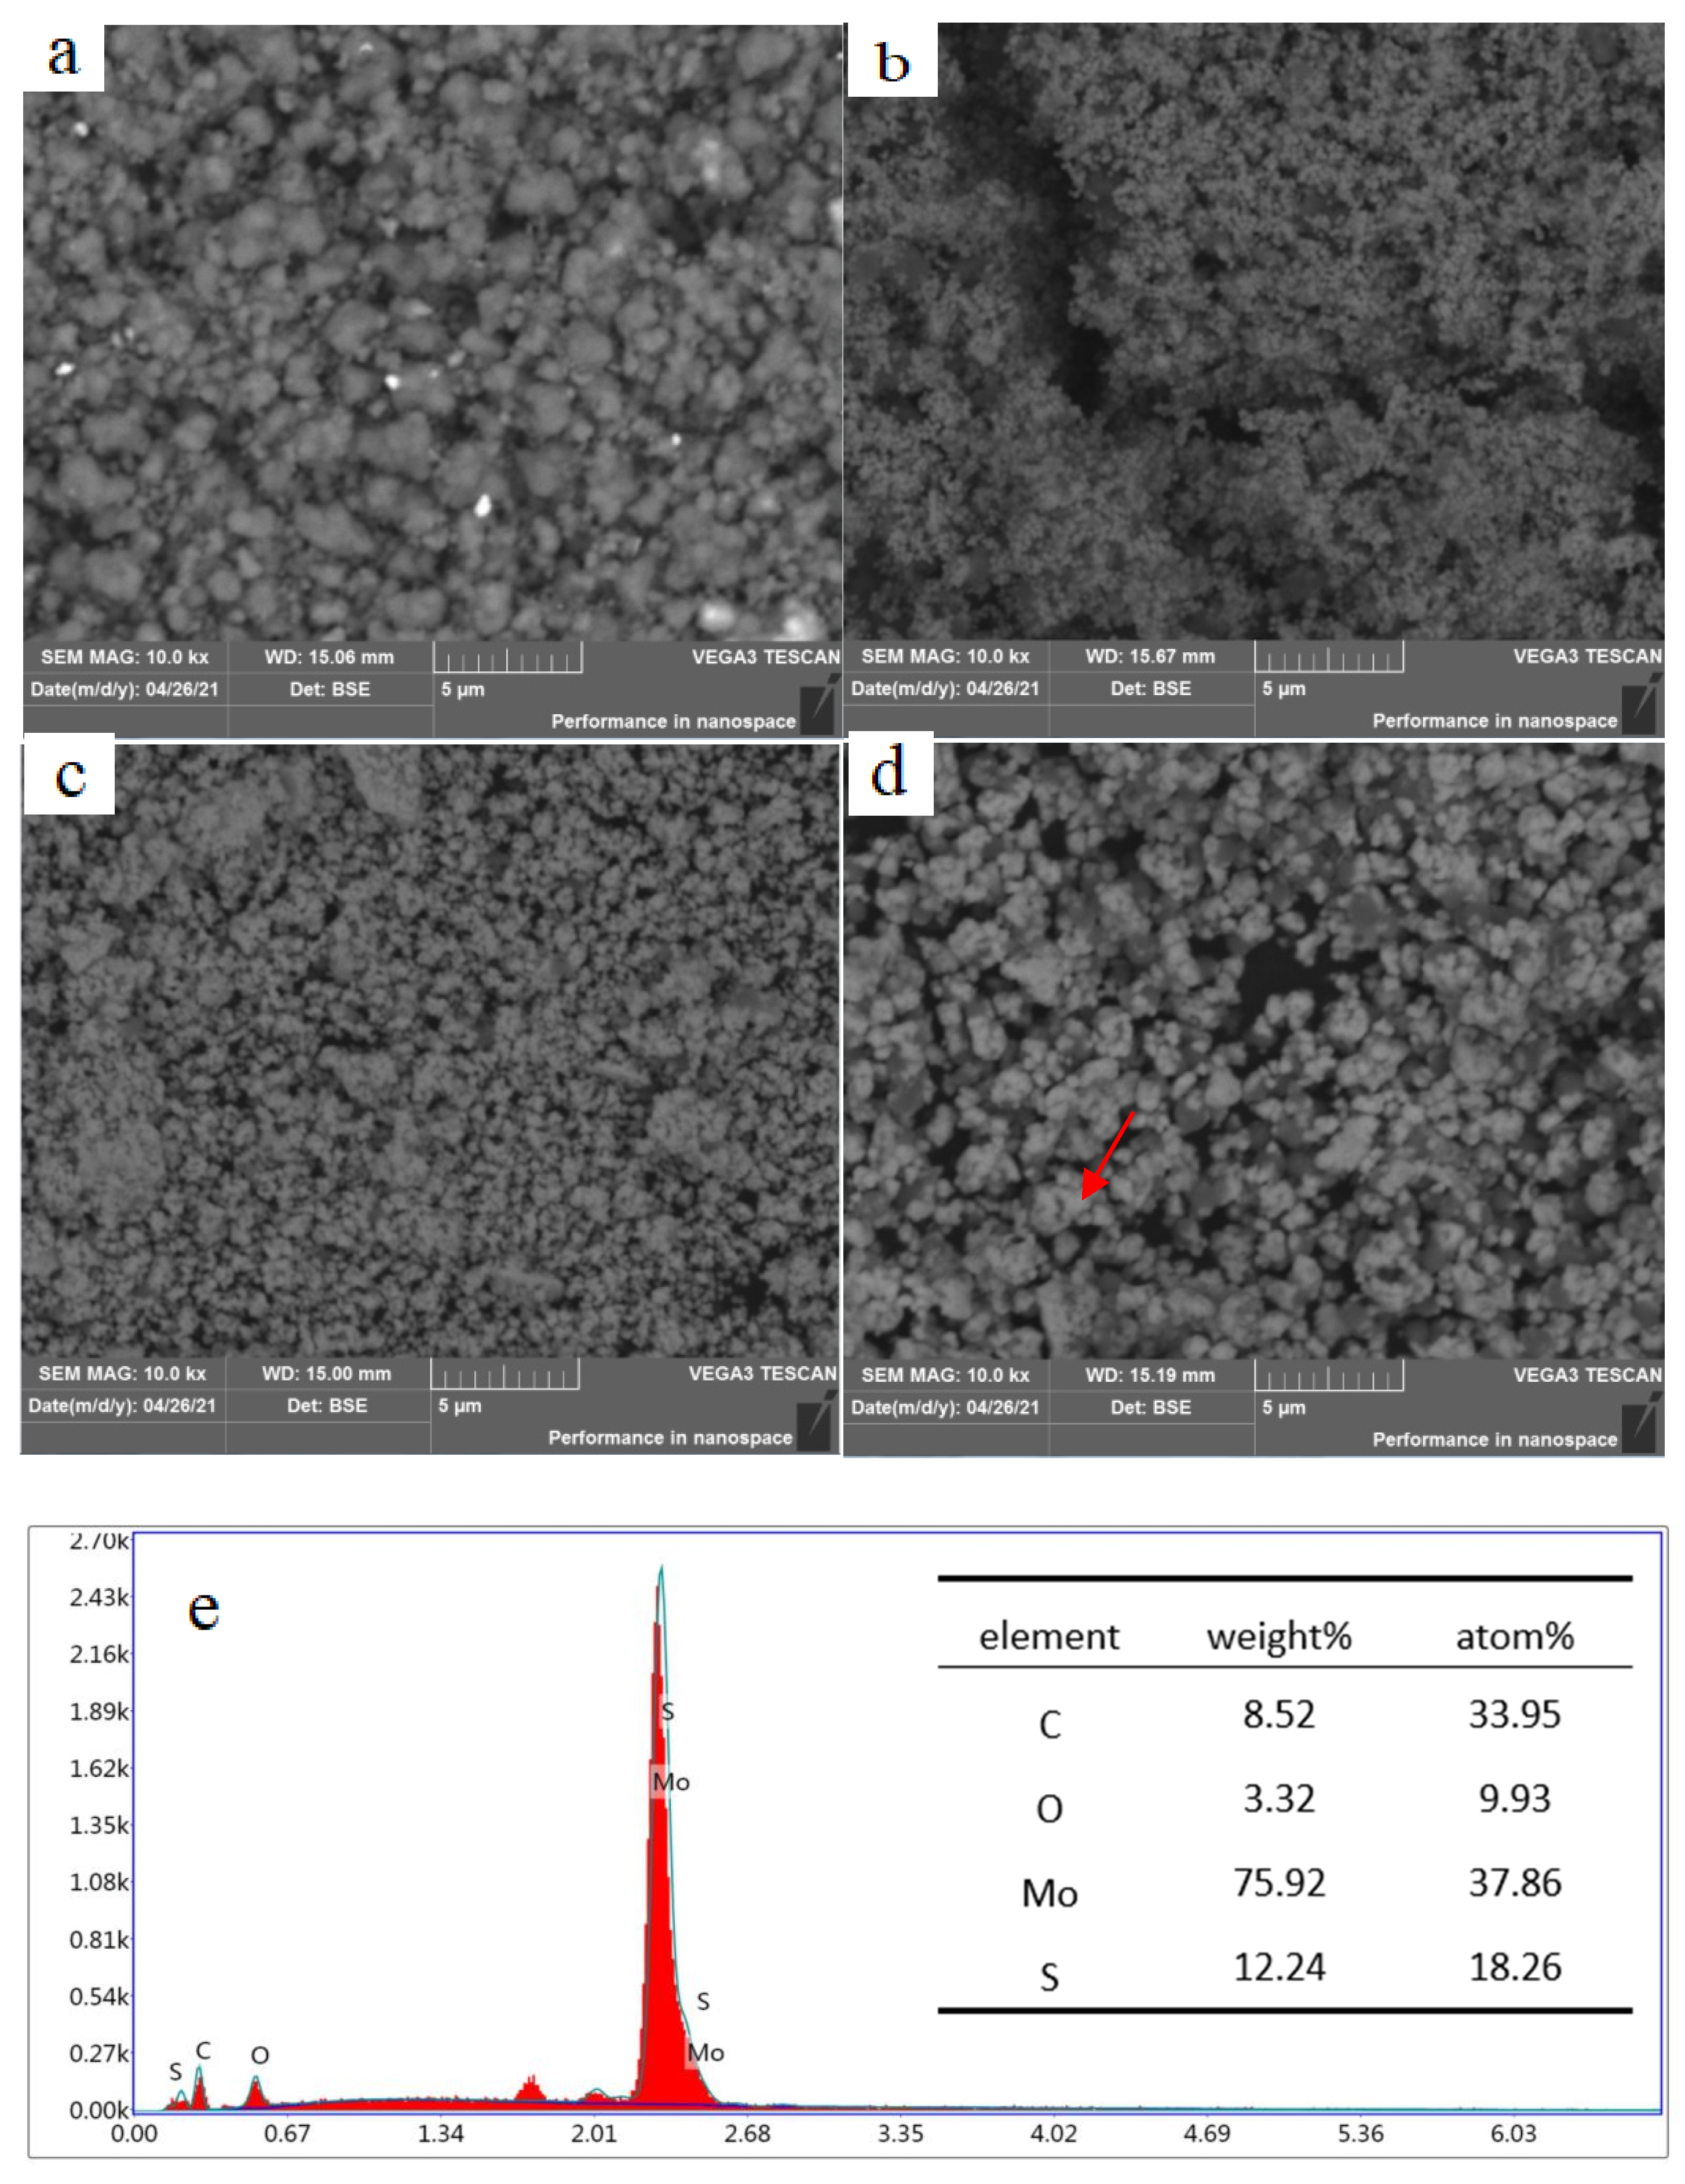
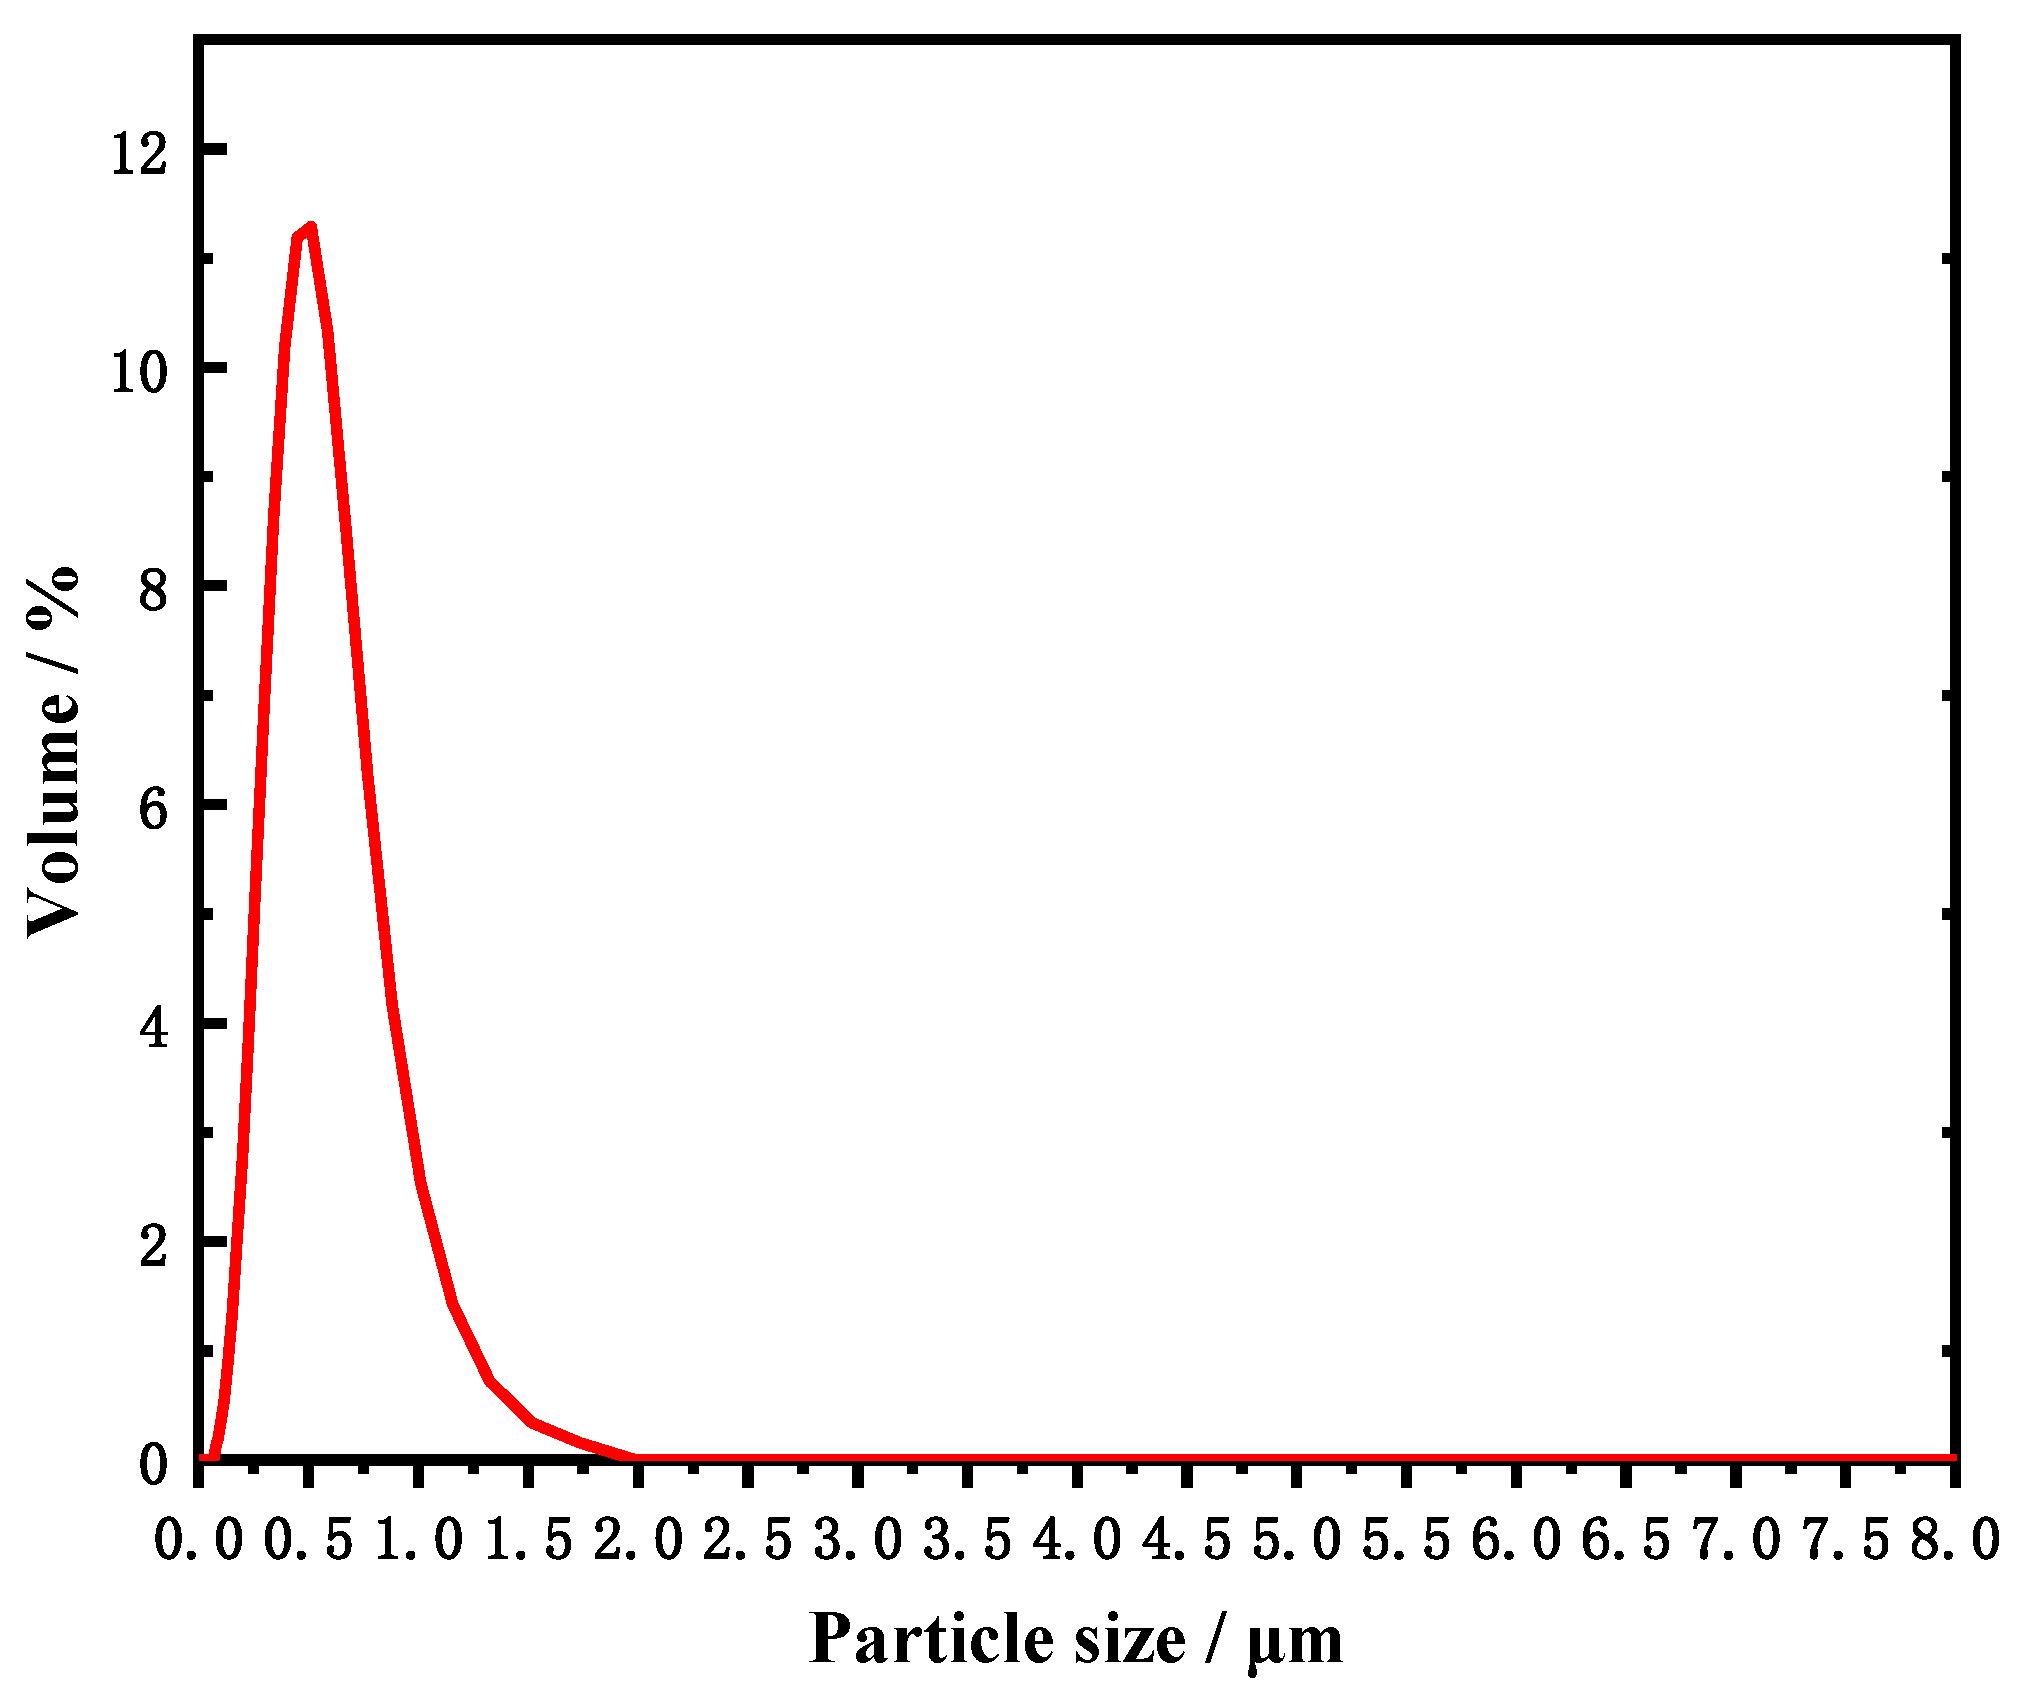
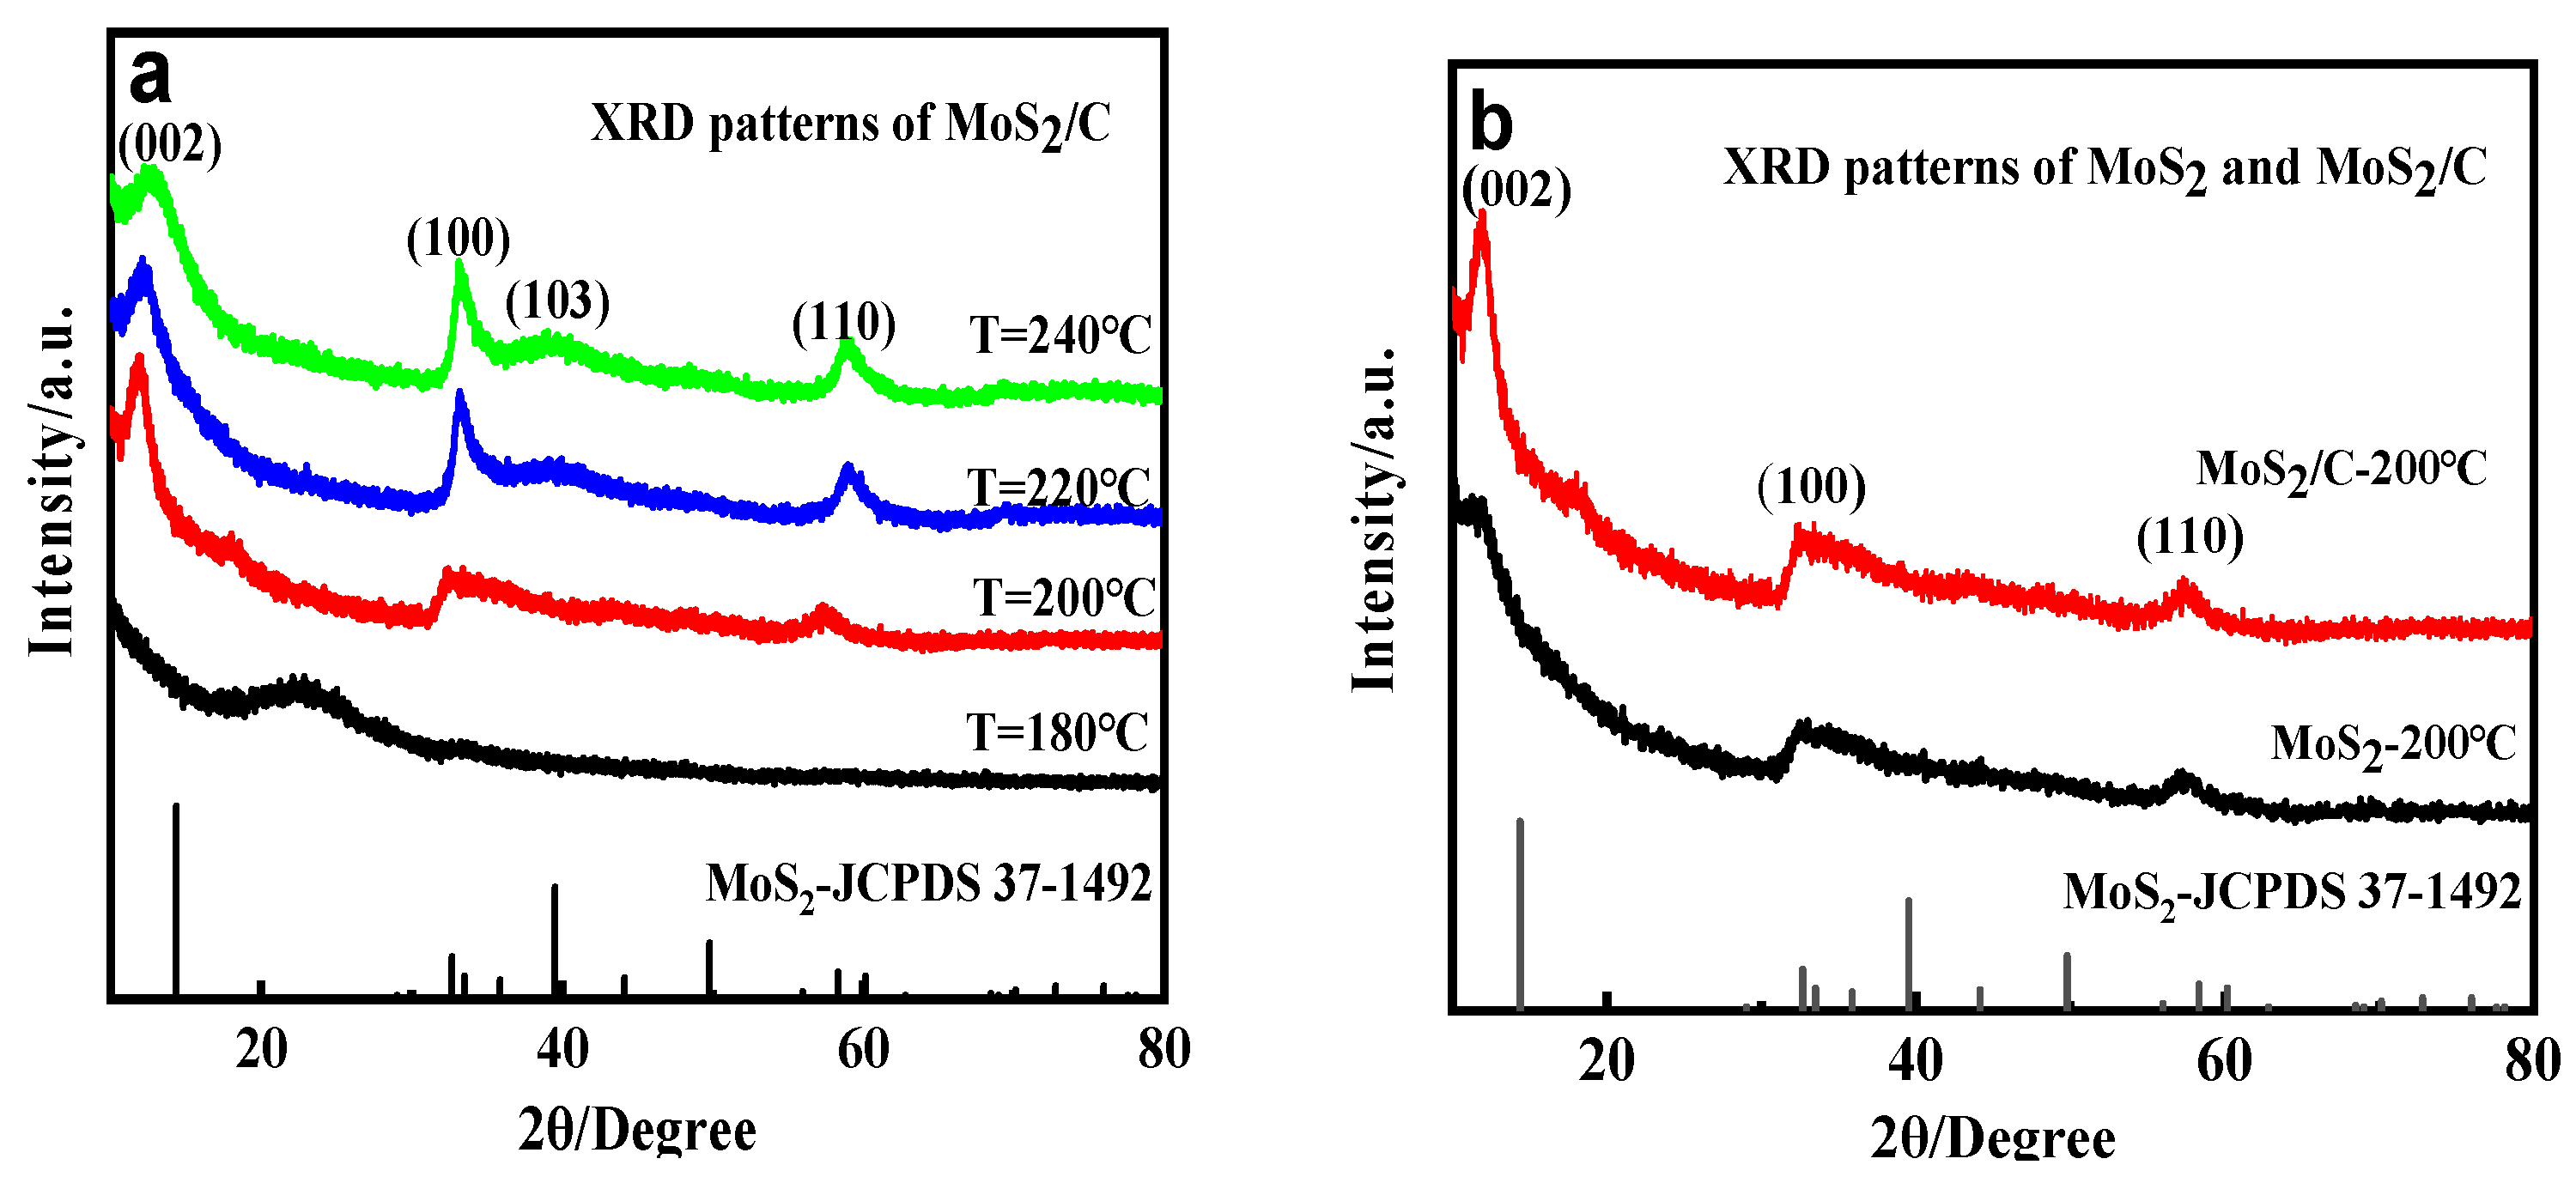
3.1. Effect of Temperature on the Crystal Structure and Morphology

Figure 2 shows the SEM images of the MoS2/C composite synthesized with 10 mmol PVP at 180 °C, 200 °C, 220 °C, and 240 °C for 7 h, respectively. It is noteworthy that no precipitate was produced during the hydrothermal process at 180 °C without the addition of glucose. In contrast, a gray flocculent sediment of 0.06 g was produced when glucose was added under identical experimental conditions (shown in Figure 2a). EDS analysis reveals that the residue mainly consists of C and O, indicating that the hydrothermal temperature increases from room temperature to 180 °C results in glucose carbonization without MoS2 production. At a higher reaction temperature of 200 °C, the product exhibits uniform particle size distribution, as depicted in Figure 2b. The particles have an average size of approximately 200 nm and are evenly dispersed. The as-prepared MoS2/C product is a black powder with a recovery rate of 56.52%, which is 26.52% higher than that of the pristine MoS2. Increasing the reaction temperature to 220 °C (as shown in Figure 2c) results in an average particle size of 350 nm and a yield of 89.01%, which is 66.02% greater than that of the pristine MoS2 prepared at this temperature. At a higher temperature of 240 °C (as shown in Figure 2d), the particles aggregate into larger particles with a grain size range of 0.5 to 1.0 μm. The yield reaches 0.66 g, which is a higher value than the theoretical recovery of 0.62 g. In contrast, the yield of the pristine MoS2 under identical conditions is 95.14%. Additionally, it was discovered that the dried black powder in Figure 2d had a slight white coating, suggesting that higher temperatures may result in some side reactions during the hydrothermal process. The particle size distribution of the specimen synthesized at 200 °C was tested by a laser particle size analyzer. The result is shown in Figure 3. However, the results indicate that the average particle size (D50) was found to be 424.61 nm, which is relatively larger than that observed in electron microscope images. This is due to the fine nanoparticles and their large specific surface area, which makes them prone to agglomeration. Conventional ultrasonic dispersion is not effective in separating them. Additionally, it is worth noting that the instrument setup parameters and shading rate of the sample can also affect the results of laser particle size analysis. For example, during the test of a composite of MoS2 and C in this study, it is important to avoid using refractive index data as a single substance. Instead, precise particle size should be studied more systematically based on specific composite. As a result, the particle size distribution analysis only provides a general reference.
The EDS analysis in Figure 2e (shown in red arrow) reveals that the product is primarily composed of Mo, S, C, and O, with no other impurities present. The atomic ratio of S to Mo is approximately 2:1, indicating that the main phase of the as-prepared samples is MoS2. It is suggested that when ammonium molybdate is used as the source of molybdenum and thiourea serves as the source of sulfur, an intermediate product of molybdenum trioxide is generated through the hydrolysis of the ammonium molybdate during the hydrothermal process. The hydrolysis reaction is accelerated at high temperatures, which may cause incomplete reduction and sulfurization of excess molybdenum oxide by thiourea, resulting in the precipitation of residual molybdenum oxide. Based on the above discussion, the hydrothermal production efficiency can be enhanced by increasing the temperature, as demonstrated by the yield data. However, it is recommended to maintain the temperature range between 200 and 220 °C for the synthesis procedure, as some molybdenum oxide may be introduced at higher temperatures.
Figure 4a displays the XRD patterns of the MoS2/C material prepared at different temperatures. At 180 °C, the specimen does not exhibit any diffraction peak, indicating an amorphous structure of the sample, which is consistent with the SEM analysis in Figure 2a. When the reaction temperature rises to 200 °C, three diffraction peaks located at 12.9°, 32.7°, and 57.3° can be indexed to the (002), (100), and (110) crystal planes of MoS2, respectively (JCPDF 37-1492) [36]. Compared to the pristine MoS2 in Figure 4b, the intensity of the diffraction peak of the MoS2/C samples increased at 200 °C, indicating that the carbonization process of glucose can accelerate the nucleation and crystallization process of MoS2. At 240 °C, the diffraction peaks at the (100), (103), and (110) crystal planes intensify even further. As the temperature increased from 200 °C to 240 °C, the diffraction peaks at the (100), (103), and (110) crystal planes increased, indicating higher crystallinity. However, the intensity of the diffraction peaks on the (002) crystal plane gradually decreased, while the peak width increased at elevated temperatures. This suggests that the growth along the (002) crystal plane was gradually inhibited [37]. Additionally, a new diffraction peak at 39.5° corresponding to the (103) crystal plane of 2H-MoS2 was revealed, suggesting selective orientation in the growth of MoS2. The anisotropy of the growth led to the increased disorder, which disrupted the globular structure and uniform particle size distribution. These findings are consistent with the SEM observations depicted in Figure 2. Therefore, based on the particle size and crystal structure of the product, the optimal temperature for producing nano-MoS2/C materials is 200 °C.

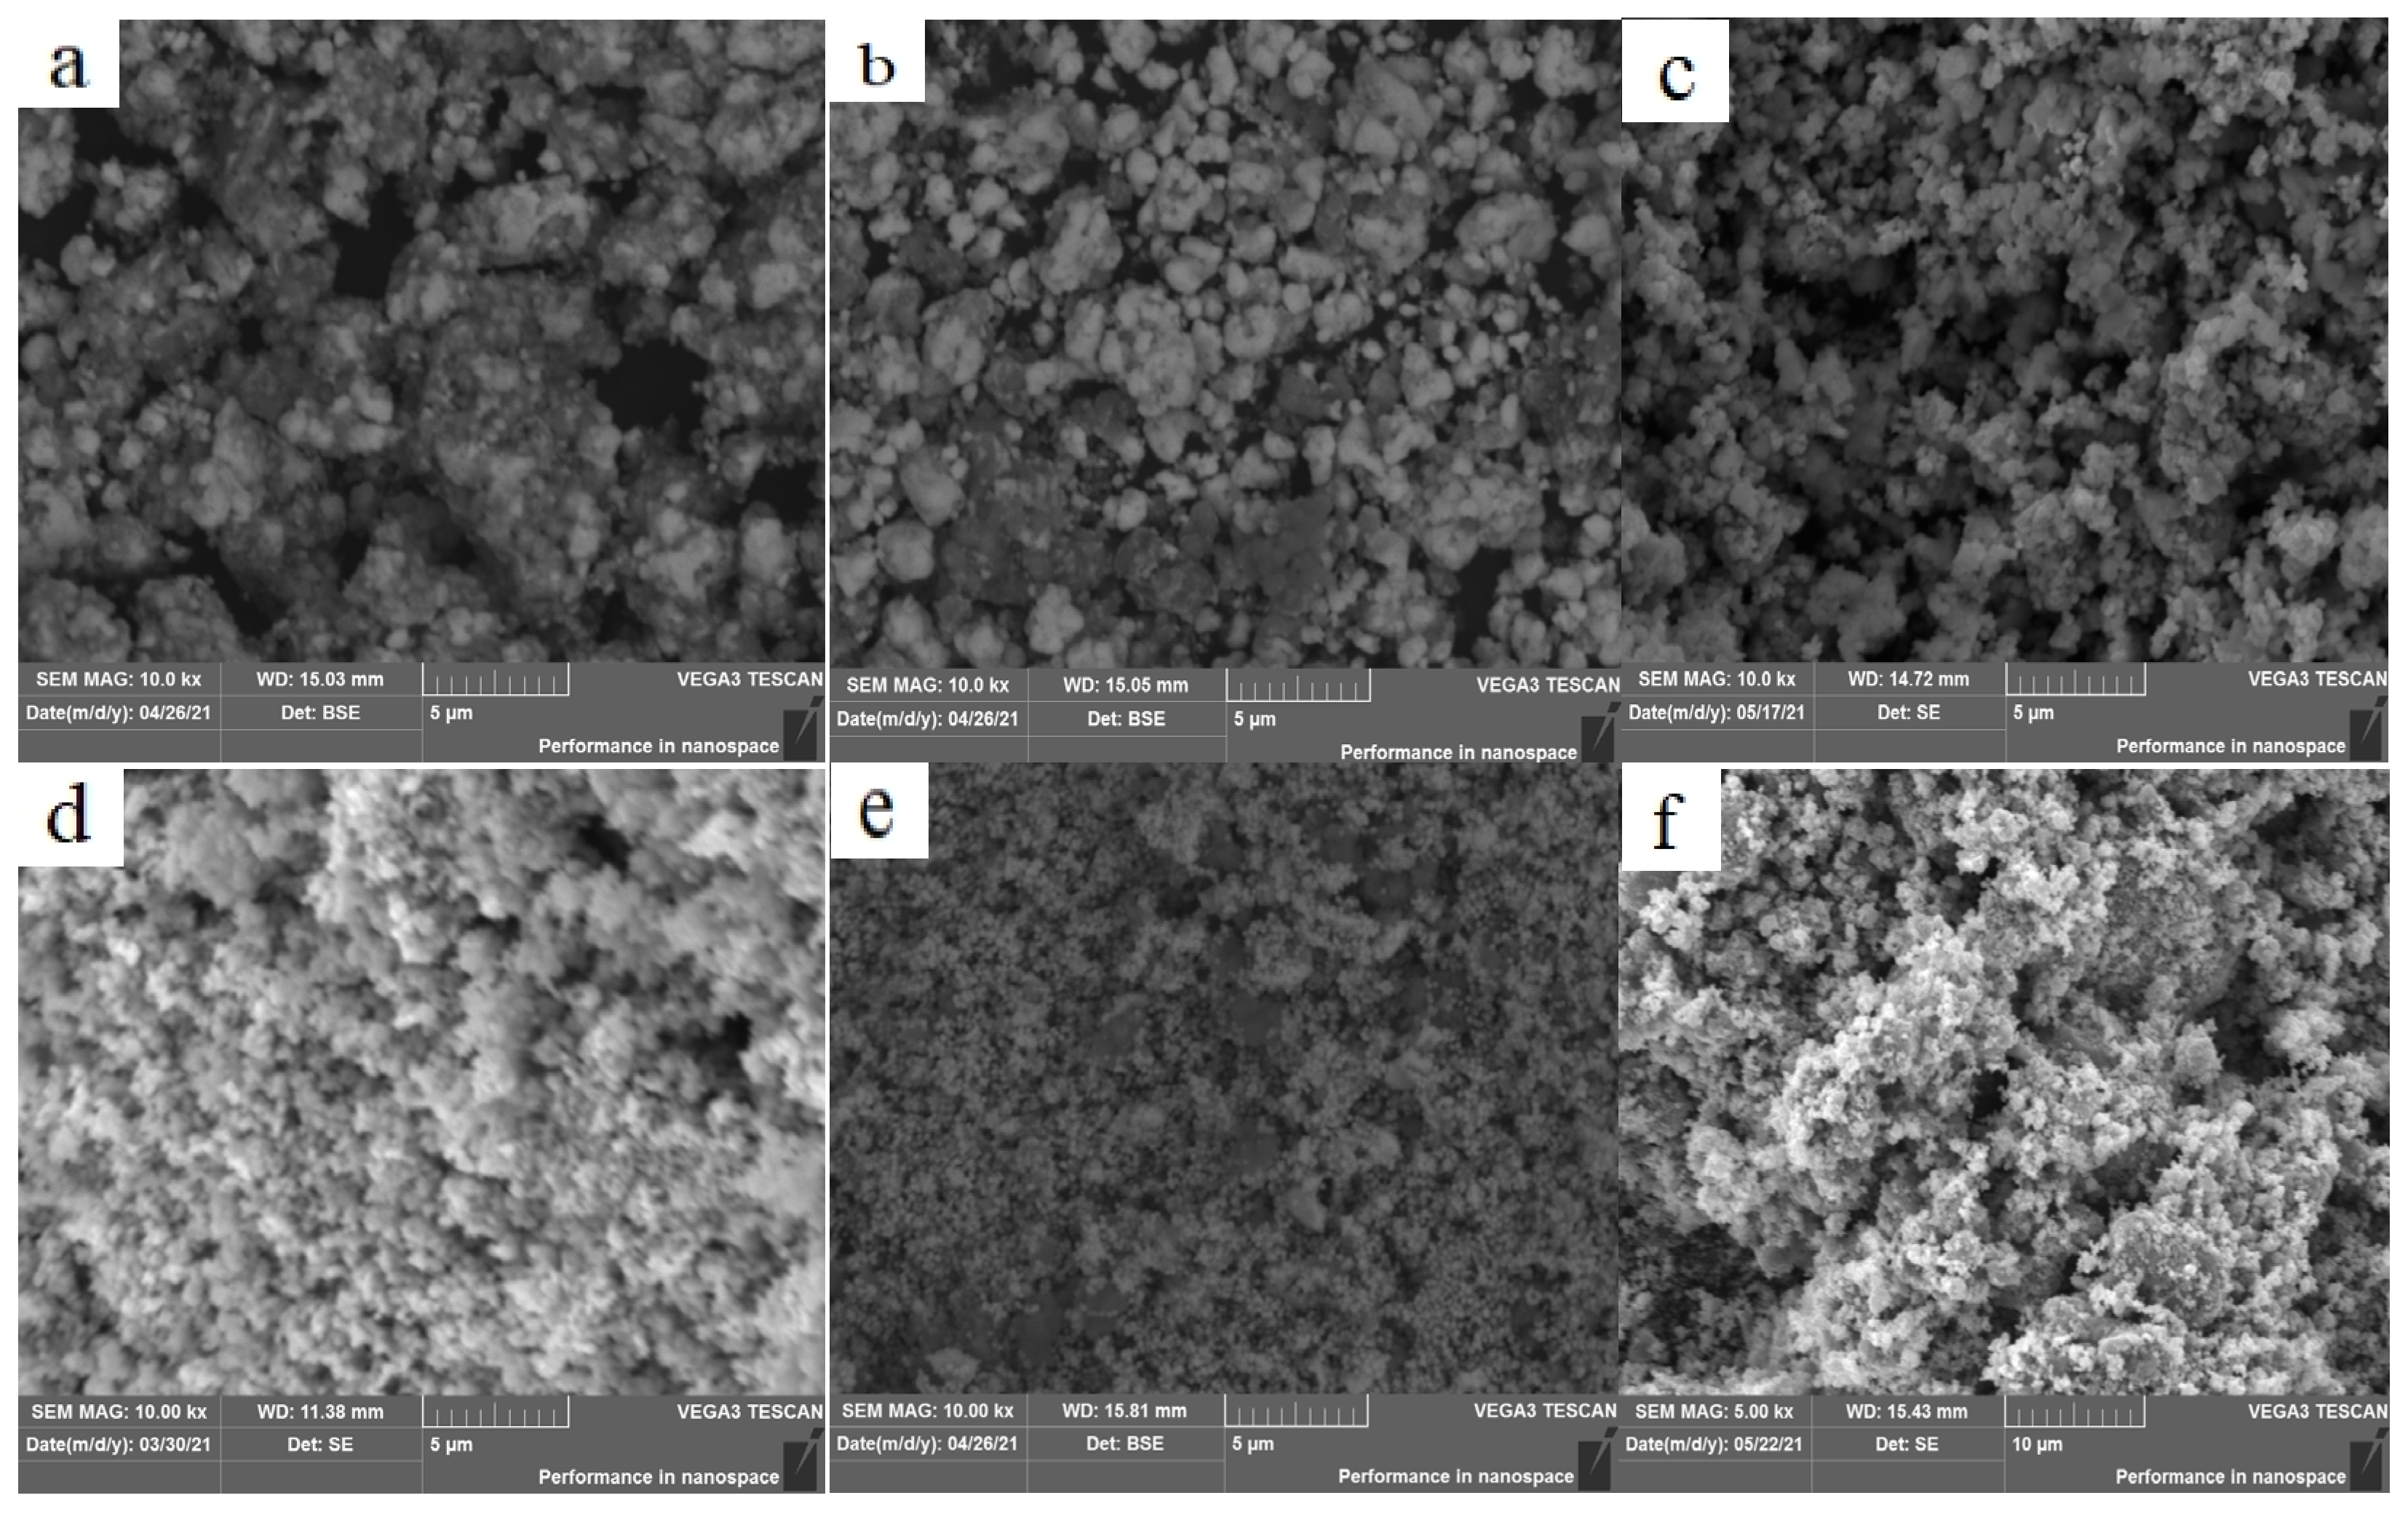
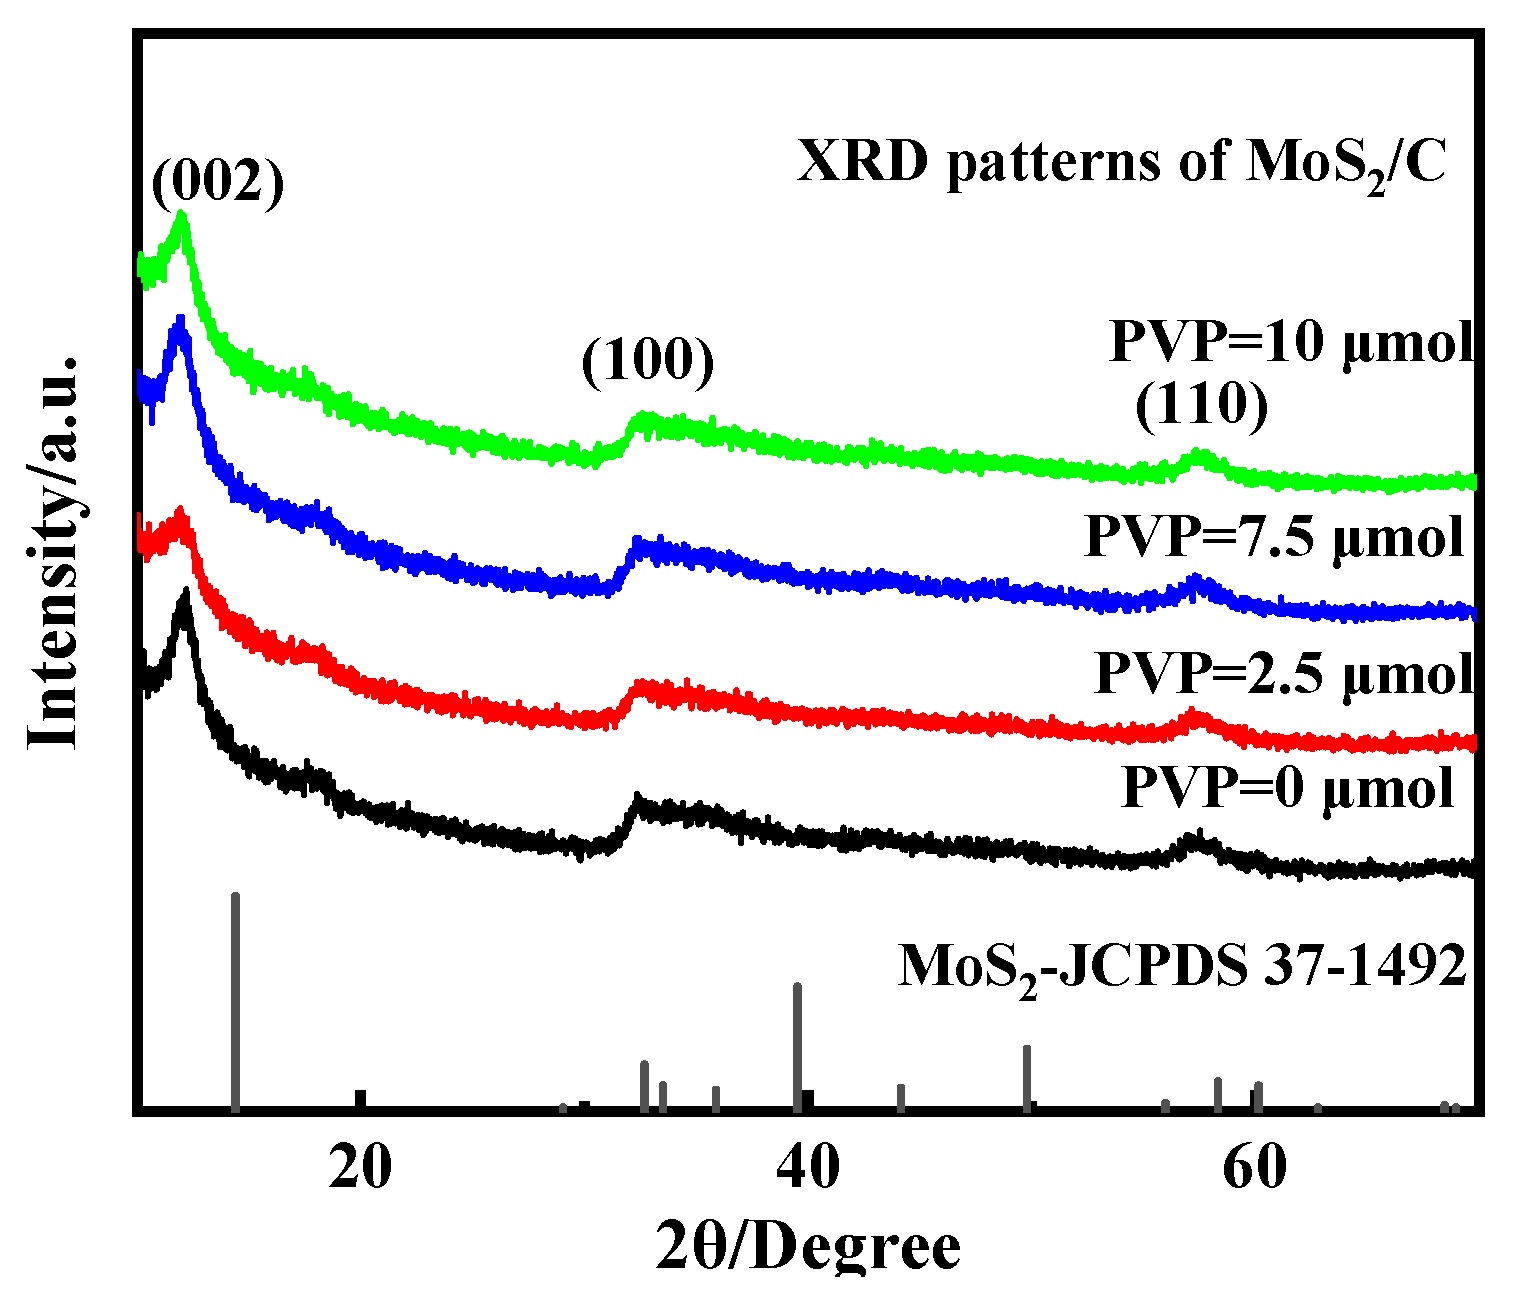
3.2. Effect of PVP on the Crystal Structure and Morphology

To analyze the impact of PVP additions on the morphology, particle size, and production yields of the MoS2/C samples, the specimens were synthesized at 200 °C for 7 h with the PVP additions ranging from 0 to 15 μmol, respectively. As discussed in Section 3.1, the incorporation of carbon resulted in much higher yields compared to the pristine MoS2, while the effect of PVP additions on production yields was found to be insignificant. The yield without PVP supplementation was 58.13%, which is much higher compared to the pristine MoS2 without glucose. The latter cannot precipitate without the addition of PVP. Glucose plays a critical role in inducing carbonization at lower temperatures, creating heterogeneous nucleation sites for MoS2, and accelerating the reaction. As a result, the black MoS2 powder can be produced without the addition of PVP. Increasing the PVP to 2.5 μmol resulted in a 15.36% increase in yield, compared to the pristine MoS2 without glucose addition. Further increasing the PVP amount to 5 μmol resulted in a yield of 56.51%. Figure 5 shows the morphologies of the samples prepared with varying PVP addition. The particle size of the samples decreased significantly with increasing PVP addition, as shown in Figure 5a–c. The addition of PVP at 7.5 μmol and 10 μmol led to a further reduction in particle size, as depicted in Figure 5d,e. At an additional amount of 10 μmol, the particle size was reduced to about 200 nm. The yields were 53.24% and 56.53%, respectively, which are 26.57% and 26.49% higher than the yields obtained from the pristine MoS2 under identical conditions. As shown in Figure 5f, the particle size increased to 500 nm and the yield reached 46.84% when the amount of PVP was increased to 15 μmol. Therefore, the ideal addition amount of PVP for preparing MoS2/C in this experiment is 10 μmol. PVP acts as a soft template in the hydrothermal process, and nano-micelles are formed in the hydrothermal system as the “micro-reactor”, where MoS2 nucleates and grows. In addition, as a non-ionic surfactant, PVP has hydrophilic groups and hydrophobic groups, which can effectively inhibit the stacking aggregation phenomenon of MoS2 during the growth process, so the prepared product has uniform morphology and small particle size.
Figure 6 shows the XRD patterns of MoS2/C prepared with different amounts of PVP. The addition of PVP has an apparent influence on the (002) crystal plane, while there is no significant difference in the crystallization of the (100) and (110) crystal planes. The diffraction peak intensity of the (002) crystal plane in the sample initially decreases, but then increases with an increase in PVP addition. The addition of 2.5 μmol of PVP resulted in weaker crystal growth along the (002) crystal plane and improved agglomeration phenomenon compared to the sample without PVP. The XRD patterns did not reveal any diffraction peaks of molybdenum oxide due to the low amount of the intermediate phase. However, when 7.5 μmol and 10 μmol of PVP were added, there were no significant differences in the positions and intensities of the diffraction peaks compared to those without PVP. The degree of the MoS2 (002) characteristic peak is shifted to lower angles, evidencing that the stacking nature of layered MoS2 was alleviated [38,39].
The MoS2 and MoS2/C materials prepared under the optimal reaction conditions of synthesis at 200 °C for 7 h were analyzed via high-resolution transmission electron microscopy, as depicted in Figure 7. Figure 7a,b display the layered structure of spherical MoS2 in certain internal regions. However, the particles do not exhibit an apparent periodic crystal structure inside the particles, indicating that the samples are nearly amorphous. Figure 7c,d confirm the formation of MoS2/C composites with a core–shell structure, where MoS2 serves as the core and amorphous carbon as the shell in an encapsulated structure. This phenomenon is similar to the other literature [40,41,42] with respect to a core–shell structural composite. Figure 7d with a magnification of 800,000 times reveals striped areas (as shown in the red box area) in the outer shell and core region, which are presumed to be few-layered MoS2, like the stripes in Figure 7b, since graphitic C cannot be produced at the hydrothermal temperature (about 200 °C) used in this study. The introduction of amorphous carbon reduced the average particle size of MoS2 from approximately 200 nm to 50 nm and achieved a uniform coating with a thickness of around 20–30 nm. The specific capacity of pristine molybdenum disulfide anode materials decreases sharply during the charging/discharging process due to volume expansion, which causes the collapse and rearrangement of the MoS2 lamellar structure. This, in turn, reduces the active sites for lithium insertion. The core–shell structure in this study involves a deep integration of carbon and MoS2. In the outer structure, few-layered MoS2 are dispersed within the carbon layer, while in the inner layer, carbon is distributed in MoS2. This dispersed distribution weakens the possibility of stacking. The carbon layer provides a buffer space to alleviate the volume expansion of MoS2, playing a role in structural support, and is conducive to maintaining the structural integrity of MoS2. Similarly, the structure of the core region also enhances cyclic stability.

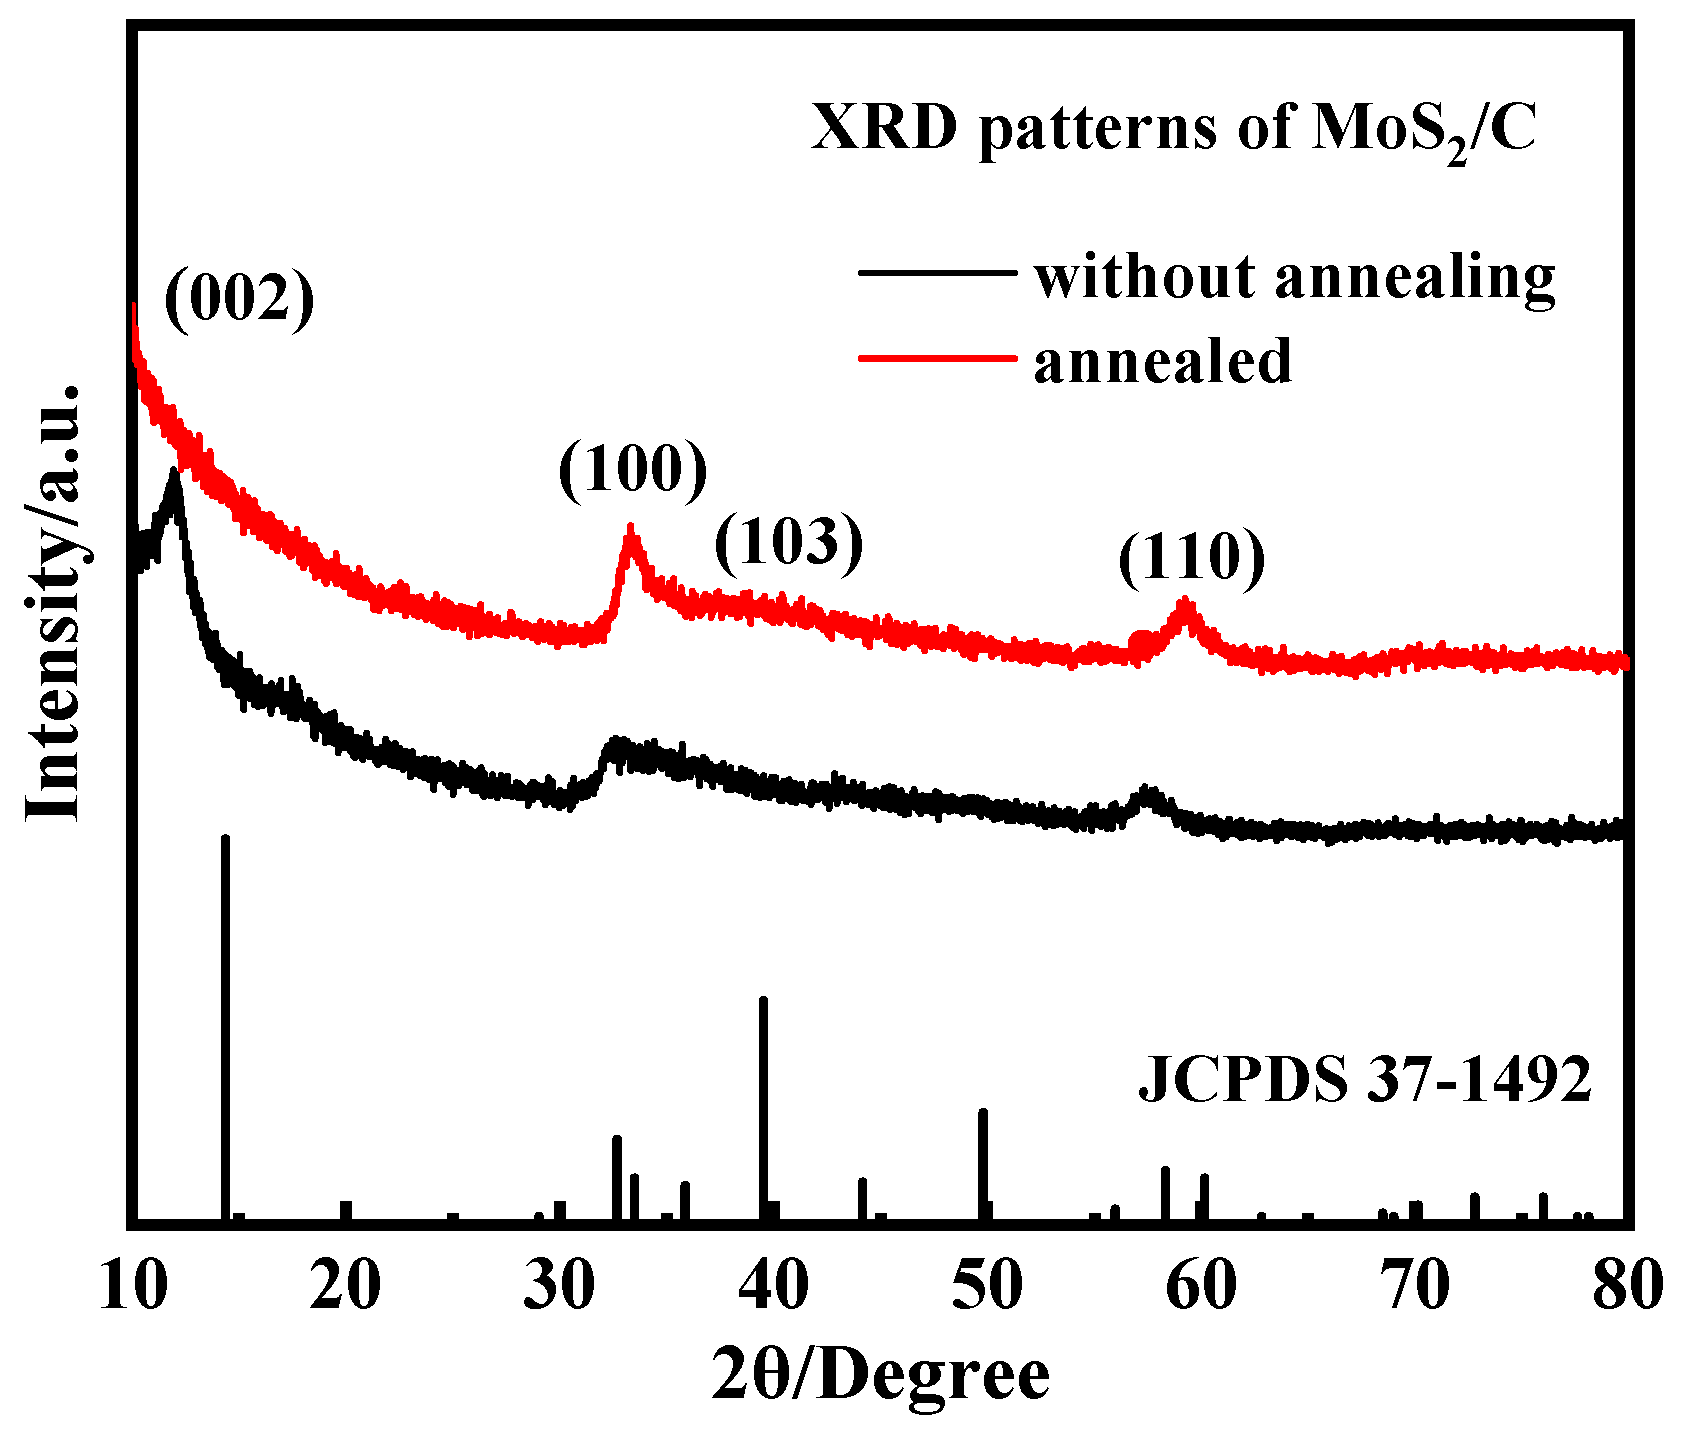
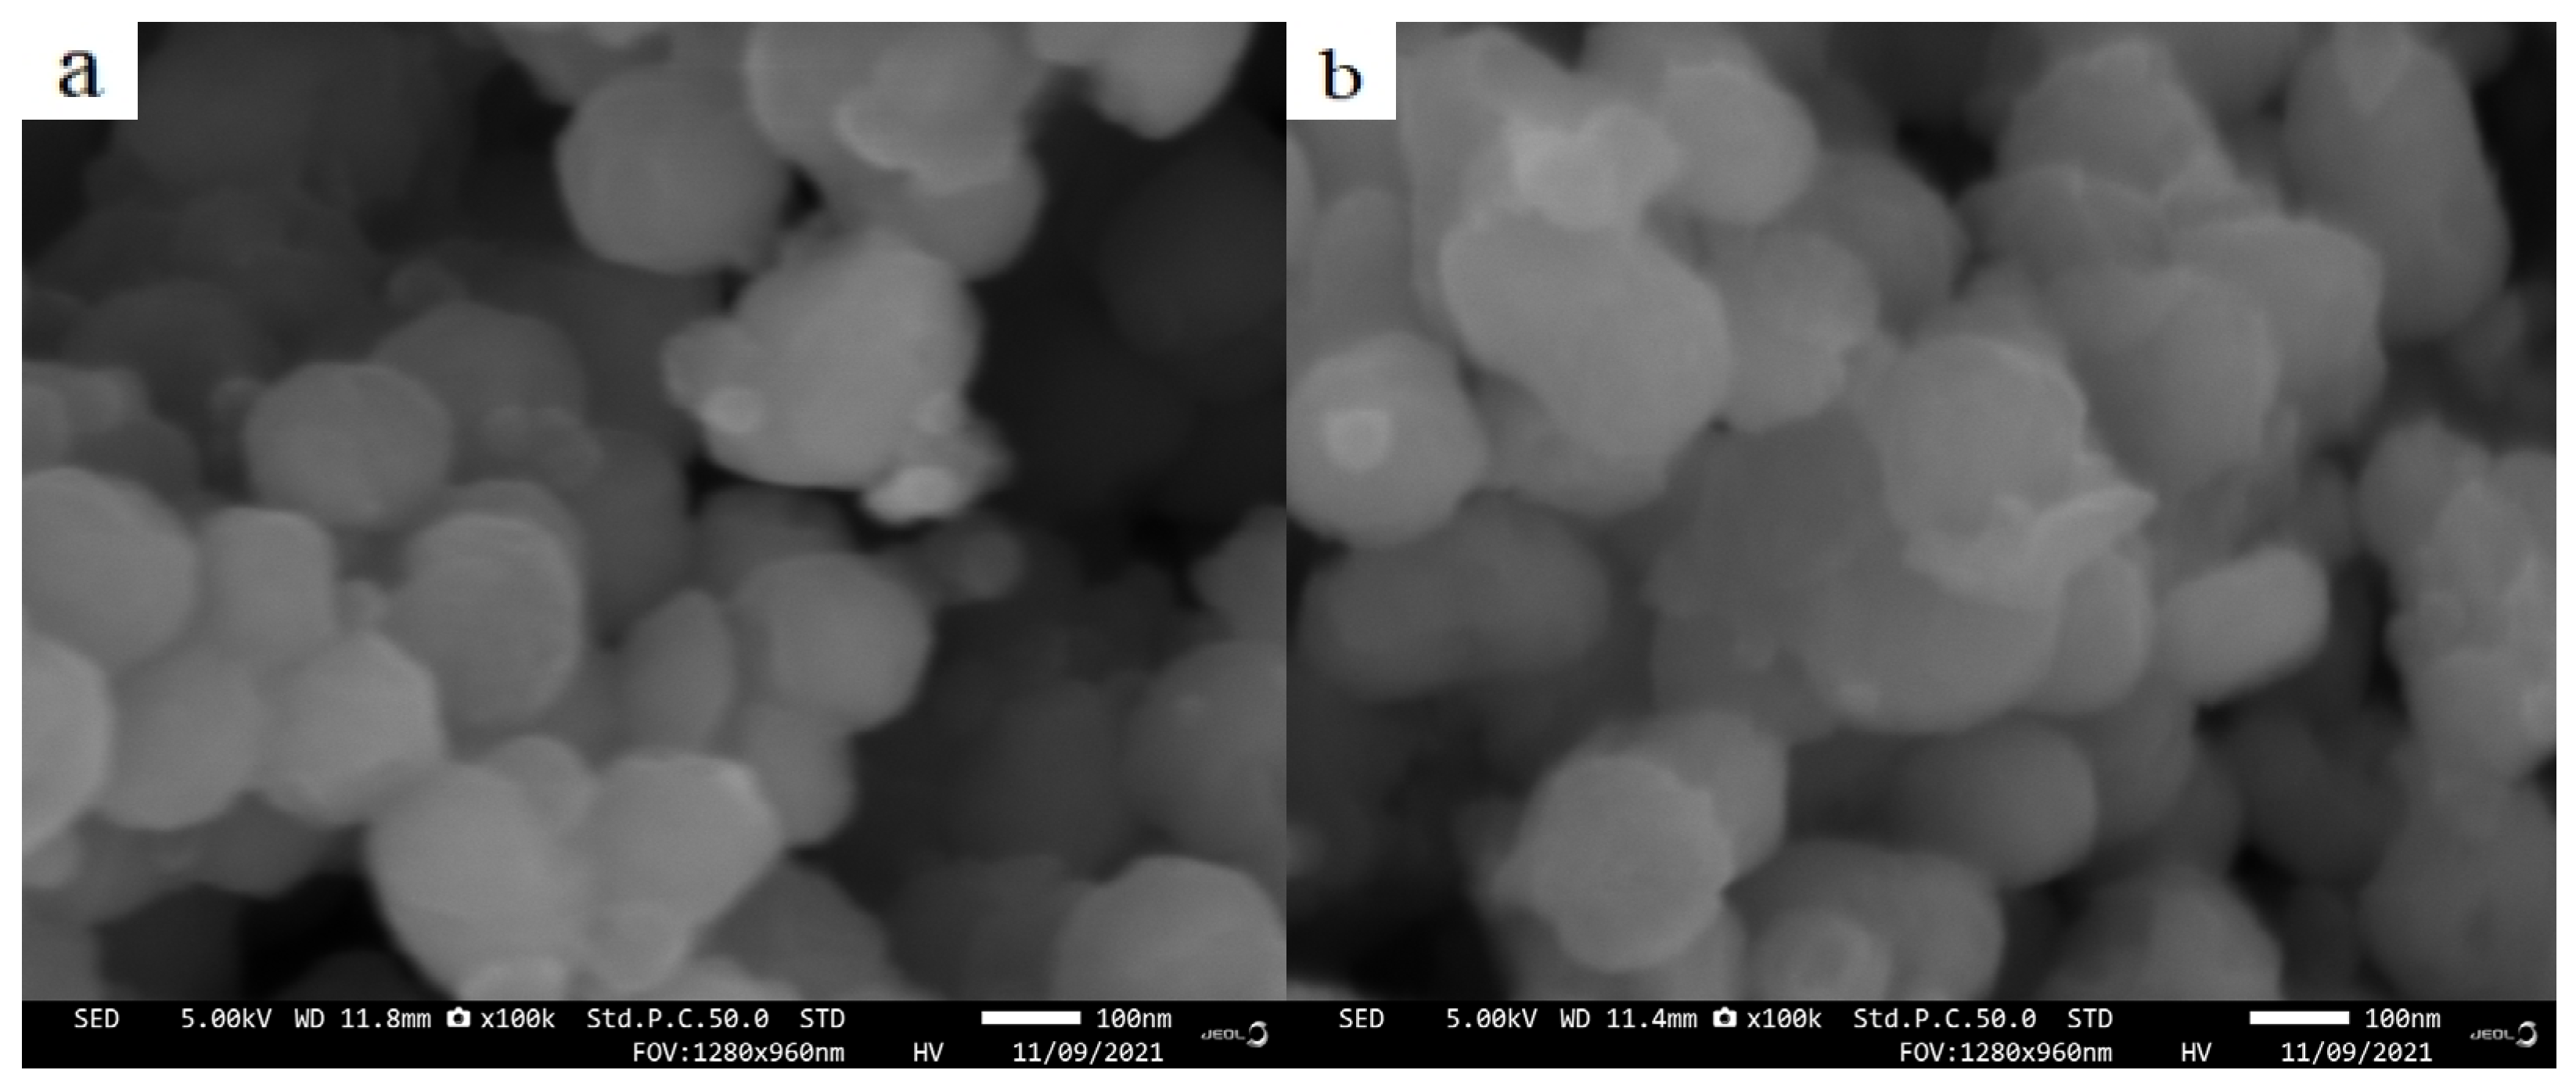
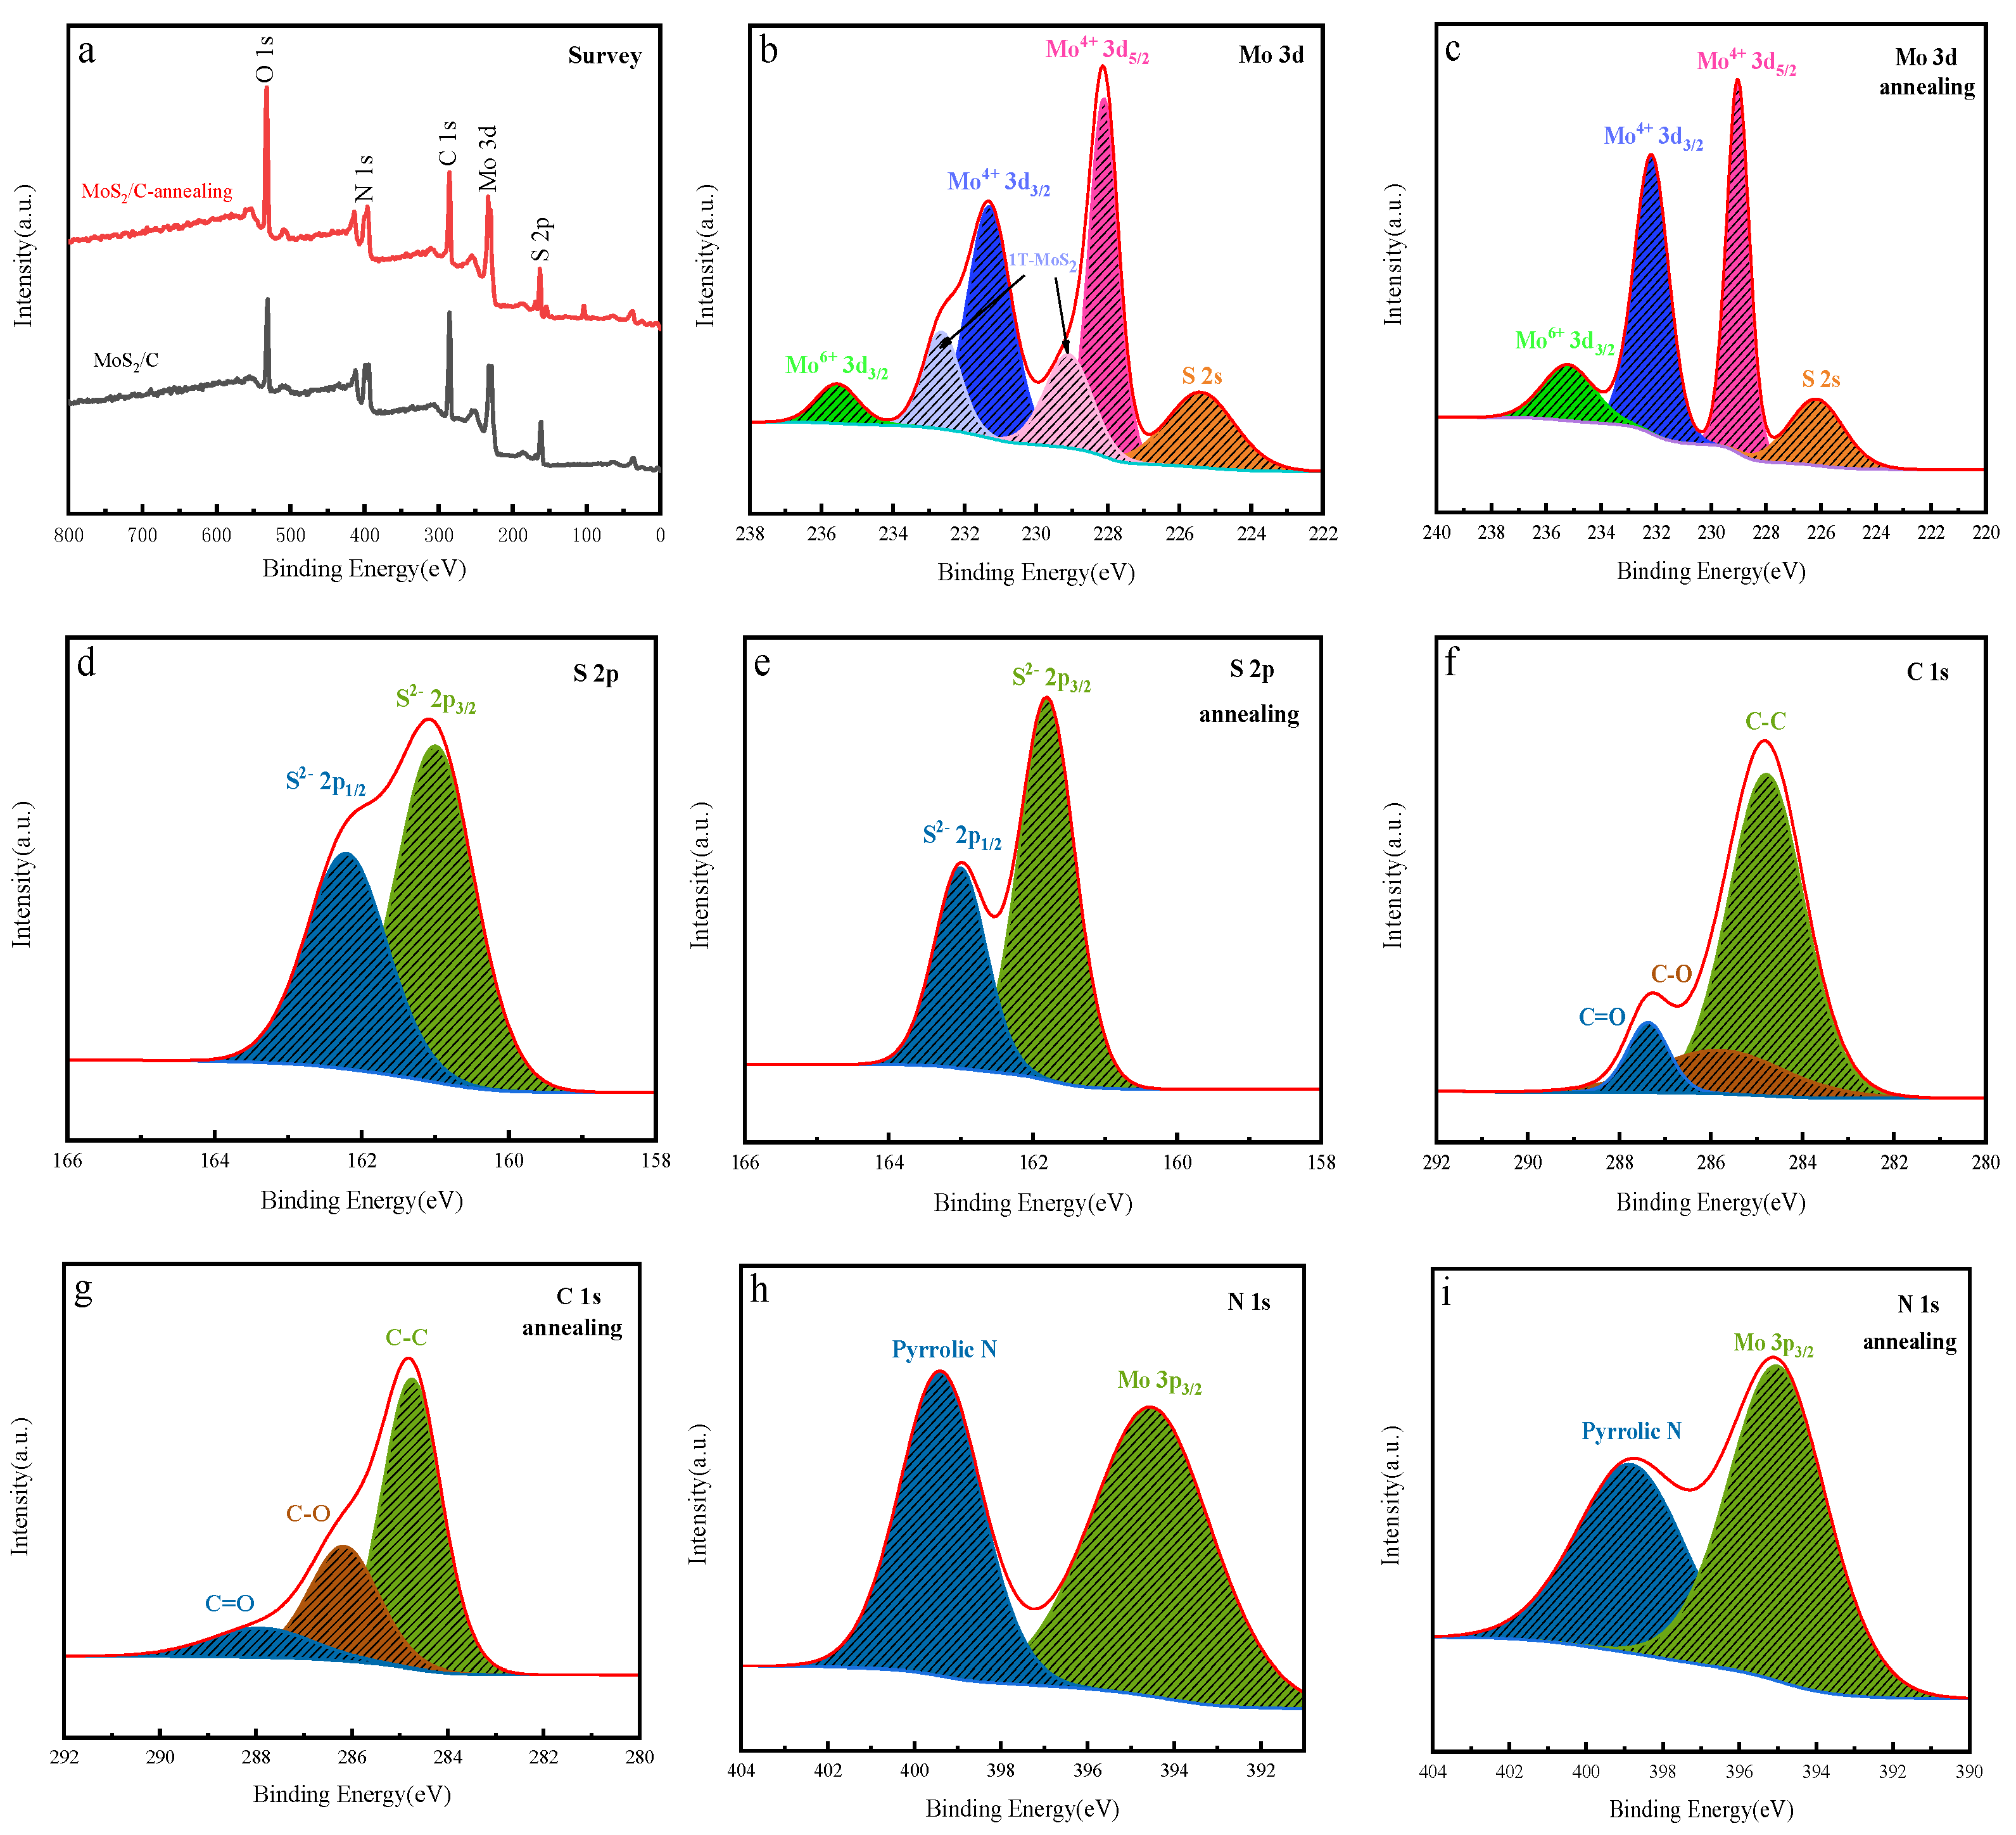
3.3. Effect of Annealing on the Crystal Structure and Morphology

Figure 8 displays the X-ray diffraction patterns of MoS2/C composites prepared under optimal conditions before and after calcination at 500 °C. Prior to annealing, three distinct diffraction peaks located at 12.9°, 32.7°, and 57.3° represent the (002), (100), and (110) crystal planes of MoS2, respectively (JCPDF 37-1492). Compared to the XRD patterns after annealing, the diffraction peaks of MoS2 before annealing displayed significant broadening, indicating a smaller grain size and lower degree of crystallization. The diffraction peak position shifted to a lower angle compared to the standard JCPDF data due to an increase in crystal plane spacing. The decrease in intensity of the (002) diffraction peak of MoS2 suggests an inhibition in crystal growth along the (002) plane [37]. During this synthesis procedure, colloidal carbon is first formed, and then MoS2 crystallizes and grows, while C is also precipitated simultaneously to form a composite structure. Due to the presence of PVP, the particle size is small, and C at this time has an inhibitory effect on the growth of the (002) crystal surface, so the intensity of the (002) diffraction peak is very low. Furthermore, the absence of new diffraction peaks in the composite material indicates that glucose carbonization does not alter the crystal structure of MoS2. The carbonization process provides more sites of heterogeneous nucleation and accelerates the growth rate of MoS2, which increases the intensity of the diffraction peaks on the (002) crystal plane of the MoS2/C material before annealing. The intensities of the (100) and (110) peaks of the sample increased after calcination, and a new diffraction peak at approximately 40° was observed, corresponding to the (103) diffraction peak of 2H-MoS2. This suggests that calcination enhanced the crystallinity of MoS2. Interestingly, the diffraction peak (002) disappeared at elevated temperatures, suggesting inhibited layered stacking of molybdenum disulfide. The reduced layered structure indicates that the colloidal carbon transforms into amorphous carbon during the annealing process, resulting in partial decomposition of the layered structure. As a result, the multi-layered structure is transformed into a single or few-layered structure, causing the disappearance of the (002) diffraction peak. In addition, it can also be attributed to the superabundant defects in the structure caused by the high-temperature treatment [43].
The lattice spacing of nanocrystalline materials can be calculated by Bragg’s equation [44]:
2d(hkl)sinθ = λ
where d represents the lattice spacing in nm, θ is the diffraction degree, and λ is the diffraction wavelength in nm. According to the formula, the lattice spacing for the (002) crystal plane of MoS2/C before annealing is 0.74 nm. In contrast, the theoretical lattice spacing of MoS2 is just 0.62 nm. Hence, the incorporation of carbon colloids within MoS2/C complexes enlarges the lattice spacing of the MoS2 (002) crystal plane. This expansion provides a larger buffer space for lithium-ion insertion and de-embedding during the charge/discharge processes [26], which further enhances the cycling stability of MoS2 anode materials.
The average grain size of the as-prepared MoS2/C can be estimated using Scherrer’s Equation (3).
D ( hkl ) = k λ β cos θ
where D(hkl) represents the average grain size perpendicular to the crystal plane (hkl), measured in Ångstroms. Scherrer’s constant (k) is typically 0.89, and the X-ray diffraction wavelength (λ) is 1.54 Ångstroms for the Cu Kα. The full width at half maximum (FWHM) of the diffraction peaks (β) is measured in radians, and the Bragg diffraction angle (θ) is measured in degrees. For instance, when analyzing the annealed (100) crystal plane, the average grain size can be calculated by substituting 2θ = 33.4° and β = 0.87° (approximately 0.015 radians) into Equation (3). The average grain size of the sample before and after annealing is 11.4 nm and 9.5 nm, respectively. Calcination typically prompts grain growth, and the reduction in grain size observed after annealing may have resulted from the reaction between trace molybdenum trioxide and the surface layer of amorphous carbon with the adsorption of trace oxygen, leading to vaporization.
Figure 9 depicts the FESEM images of the MoS2/C samples both before and after annealing. The products maintain a consistent subspheroidal shape morphology and a particle size of approximately 150 nm, with uniform particle distribution and optimal dispersion. However, Figure 9 reveals the agglomeration of the particles. The main reasons for this phenomenon are the increased number of surface atoms at the nanometer level and their high surface energy, which make them prone to combine with other atoms. To avoid agglomeration, it is important to consider the surface area and energy during synthesis. Secondly, the interaction forces between nanoparticles, such as van der Waals forces and electrostatic forces, are important factors that lead to agglomeration. Additionally, the samples for FESEM observation were prepared without ultrasonic dispersion. Instead, the samples were directly dipped in the conductive adhesive and excess powder was blown off. As a result, the observed samples were not well dispersed and agglomeration was present. The morphology of the as-obtained samples in this study differs significantly from the complex fine structures, such as flower-like shapes, reported in the previous literature [21,22,24,31,32,45]. Interestingly, no significant sheet structure was observed, which is in consistent with the XRD analysis results.
Figure 10 displays the X-ray photoelectron spectroscopy (XPS) spectra of MoS2/C composites before and after annealing at 500 °C. The survey spectra reveal that annealing has little effect on the primary elements present in the composite, which are Mo, S, C, O, and N, as shown in Figure 10a.
The Mo 3d spectra before and after annealing are illustrated in Figure 10b,c. The Mo 3d spectra of the sample before high-temperature treatment exhibit five distinct peaks, where the Mo4+ 3d5/2 and Mo4+ 3d3/2 peaks (at 228.1 eV and 231.3 eV, respectively) correspond to the tetravalent molybdenum ion in 2H-MoS2. Additionally, the Mo6+ 3d3/2 peak at 235.6 eV corresponds to the M-O bond of MoO3, which originates from the residue of MoO3 intermediate products. The peak at 225.4 eV corresponds to the S 2s. Interestingly, it is noteworthy that the two small peaks emerged at 232.7 eV and 229.1 eV, which indicates the existence of a small amount of 1T phase molybdenum disulfide [46]. The metallic 1T phase can improve the electrical conductivity, and thereby enhance the electrochemical properties of the powder. After calcination, the Mo6+ 3d3/2 peak persisted, indicating that a small quantity of MoO3 remained, or that the specimen was oxidized by adsorbed oxygen during the heating process. The small peaks at 232.66 eV and 229.1 eV vanished after calcination, suggesting that the unstable 1T-MoS2 transformed into 2H-MoS2 during annealing. Moreover, the peaks of the Mo4+ 3d5/2 and Mo4+ 3d3/2 at 229.0 eV and 232.2 eV exhibit a shift to higher binding energy, further supporting the disappearance of the 1T-MoS2 in the samples, as demonstrated in reference [47].
Figure 10d,e present the S 2p spectra of molybdenum disulfide before and after calcination. Both spectra exhibit two characteristic peaks corresponding to the S2− 2p3/2 and S2− 2p1/2 [48]. Prior to annealing, the peaks are located at 161.01 eV and 162.2 eV (Figure 10d), while they are at 161.8 eV and 163.0 eV after roasting (Figure 10e).
The C 1s spectra of the as-prepared MoS2/C composite before and after calcination are depicted in Figure 10f,g, respectively. The three distinct peaks located at 284.8 eV, 285.9 eV, and 287.4 eV before annealing correspond to the C-C bond, C-O bond, and C=O bond of the material, respectively [25,49]. These bonds are derived from the carbonization residue of the glucose and PVP in the composite. After annealing, the area of the C=O bond decreases while the area of the C-O bond increases due to the decomposition of the C=O bond. This indicates that part of the colloidal carbon was transformed to amorphous carbon and some oxygenated functional groups in the carbon decomposed during calcination. The absence of C-S or C-Mo bonds in the C1s spectrum confirms that neither the colloidal carbon prior to annealing nor the amorphous carbon post-annealing are chemically bonded to Mo atoms [50].
Figure 10h,i display the N1s spectra of the samples before and after annealing. The unroasted sample shows two peaks at 394.6 eV and 399.4 eV, corresponding to Mo 3p3/2 and Pyrrolic N, respectively [51]. Pyrrolic N is derived from the residue PVP. The N 1s spectrum of samples after calcination is displayed in Figure 10i, revealing two peaks at 395.1 eV and 398.9 eV, corresponding to Mo 3p3/2 and Pyrrolic N, respectively. Compared with the spectrum in Figure 10h, there is a significant reduction of pyrrole N in the molybdenum disulfide after annealing, which suggests the decomposition of PVP. From the above discussion, it is confirmed that N was doped into the MoS2/C composite during the hydrothermal process in addition to the morphology modulation. During the carbonization of the carbon chain in PVP, the N element distributes uniformly in MoS2 along with the carbon chain. Compared with S2− ions, N3− ions have a similar ionic radius but more valence states, so N-doped MoS2 introduces more defects and enhances the conductivity.

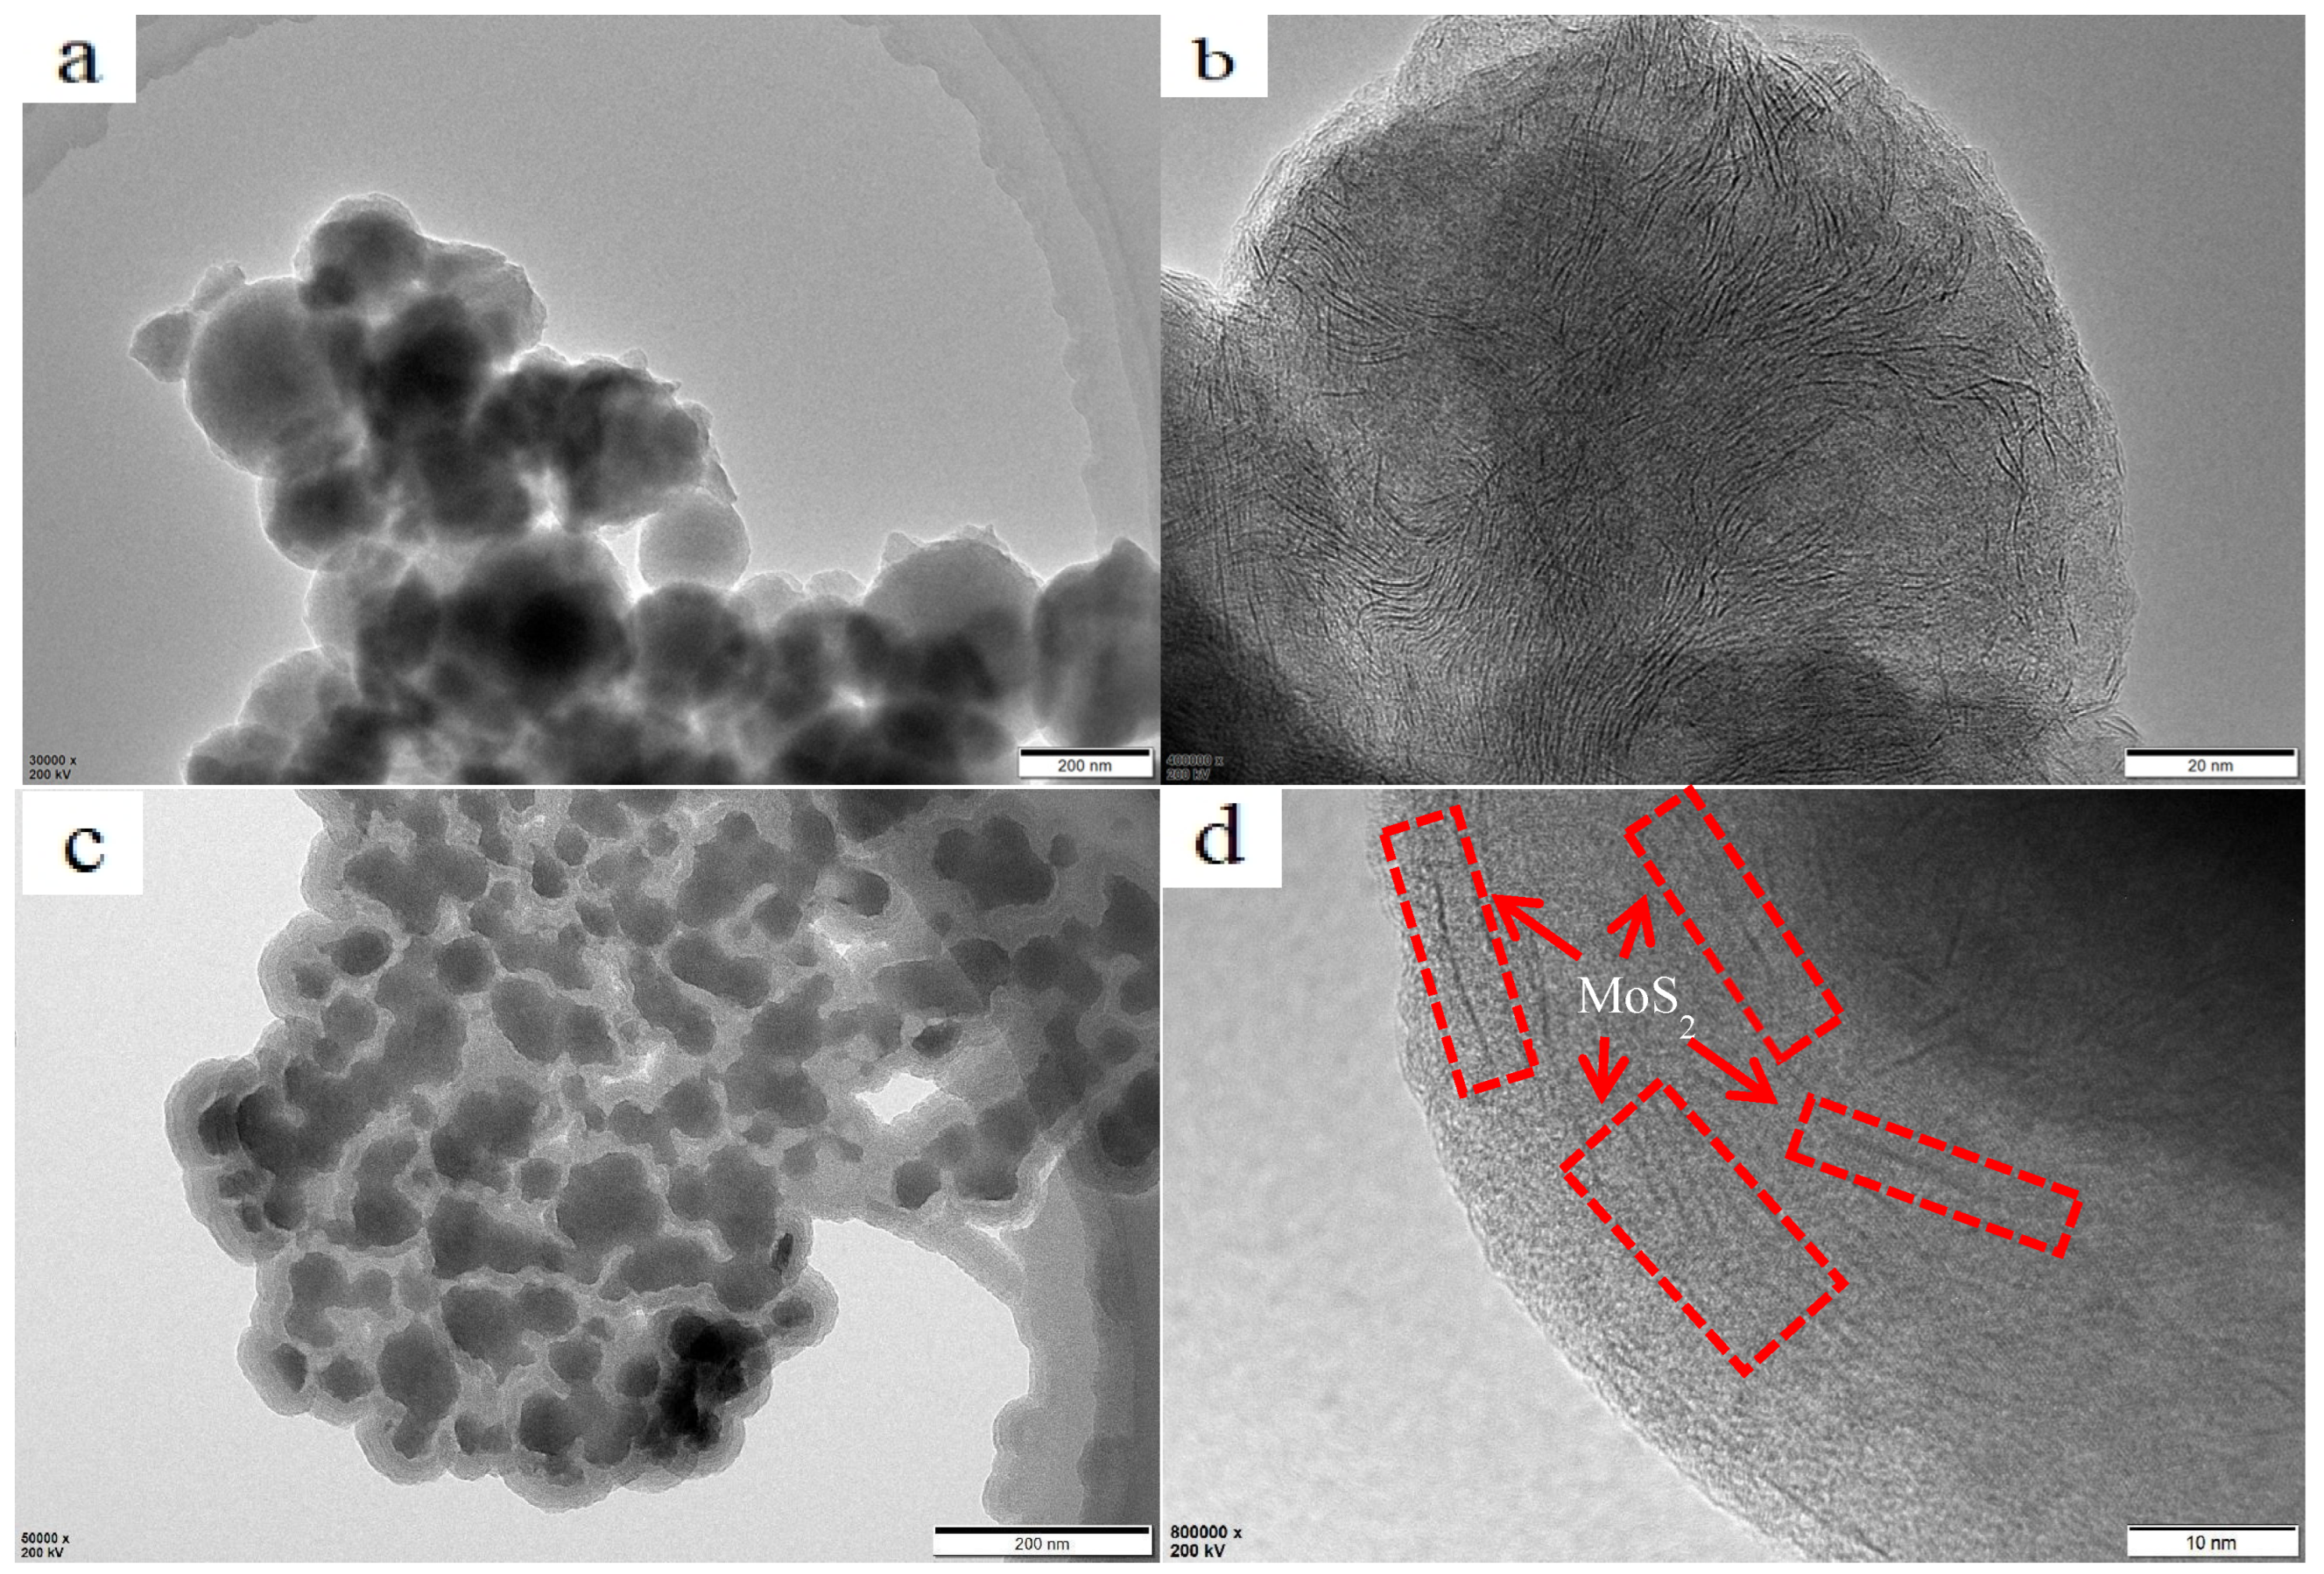
3.4. Synthesis Mechanism

As (NH4)6Mo7O24 is used as the source of molybdenum, NH4+/NH3 is involved in the hydrothermal synthesis process. During the reaction procedure, NH4+/NH3 provides a steady alkaline buffer solution, maintaining the pH at 8–9 regardless of any adjustments made before the reaction. In addition, as discussed in Section 3.1, a white powder layer forms on the surface of the MoS2 synthesized at high temperatures. Based on the EDS results of the white residue, it is deduced that ammonium molybdate led to the formation of a molybdenum oxide intermediate phase initially in the hydrothermal system, as only Mo, S, C, and O were detected. The molybdenum oxide was then transformed into MoS2 in the subsequent sulfurization process. The solid–liquid reaction reduces the nucleation and growth rate of MoS2 compared to the sodium molybdate as the molybdenum source [52,53], leading to a lower degree of crystallization, as evidenced in the XRD patterns.
Based on the material characterization results presented above, a potential hydrothermal synthesis reaction mechanism is hypothesized, as illustrated in Figure 11. The reaction process involves the decomposition of ammonium molybdate (Reaction (1)), followed by the reduction and sulfurization of MoO3 (Reaction (2)). The reactions can be represented as follows:
(NH4)6Mo7O24 + 3H2O → 7MoO3 + 6NH3·H2O
4MoO3 + CS(NH2)2 + 10H2O → 4MoS2 + S + SO2 + 20NH3 + 10CO2
During the hydrothermal procedure, hexaammonium molybdate initially hydrolyzes to generate MoO3. Stirring is applied to evenly disperse the generated MoO3 in an aqueous solution system, which increases its growth rate [33]. Furthermore, employing enhanced hydrothermal equipment with magnetic stirring at 400 r/min, results in the formation of uniformly sized and well-dispersed nano-spherical molybdenum disulfide. The solid spherical structure is formed with the assistance of Polyvinylpyrrolidone (PVP), which envelops the surface of MoO3 with the hydrophilic functional groups to create a nanoscale microreactor. MoS2 grows layer by layer in a “cabbage” structure within the reactor formation. However, the low reaction rate at the heterogeneous interface may prevent the complete execution of the second step, resulting in the presence of residual MoO3 in the sample.
At the initial stage of the hydrothermal process, glucose is first carbonized at a lower temperature of 180 °C, producing gray carbon micelles that serve as heterogeneous nucleation sites for MoS2. Subsequently, the carbon and MoS2 nucleate simultaneously for a uniform composite. As the reaction proceeds, the growth of MoS2 slows down with the decrease in the concentration of the molybdenum source, resulting in the formation of the outer structure with fewer Mo elements and more C elements. This process reduces the specific surface energy of nanocrystalline MoS2 and inhibits the growth of stacked agglomerations of MoS2 along the (002) crystal plane, resulting in the formation of a well-dispersed core–shell structure, where MoS2 as the core with an average size of around 50 nm and a colloidal carbon shell with a thickness of about 30 nm. The composite material exhibits good dispersion, uniform size, and excellent electrical conductivity. After annealing, the colloidal carbon structure is transformed into amorphous carbon. This transformation results in a diffuse distribution of MoS2 throughout the amorphous carbon, which entirely impedes the optimal orientation of the (002) crystal plane, leading to an increased disordered structure. However, the core–shell encapsulation structure improves the structural stability of the samples, resulting in stable cycling performance and excellent capacity retention in the electrochemical test.

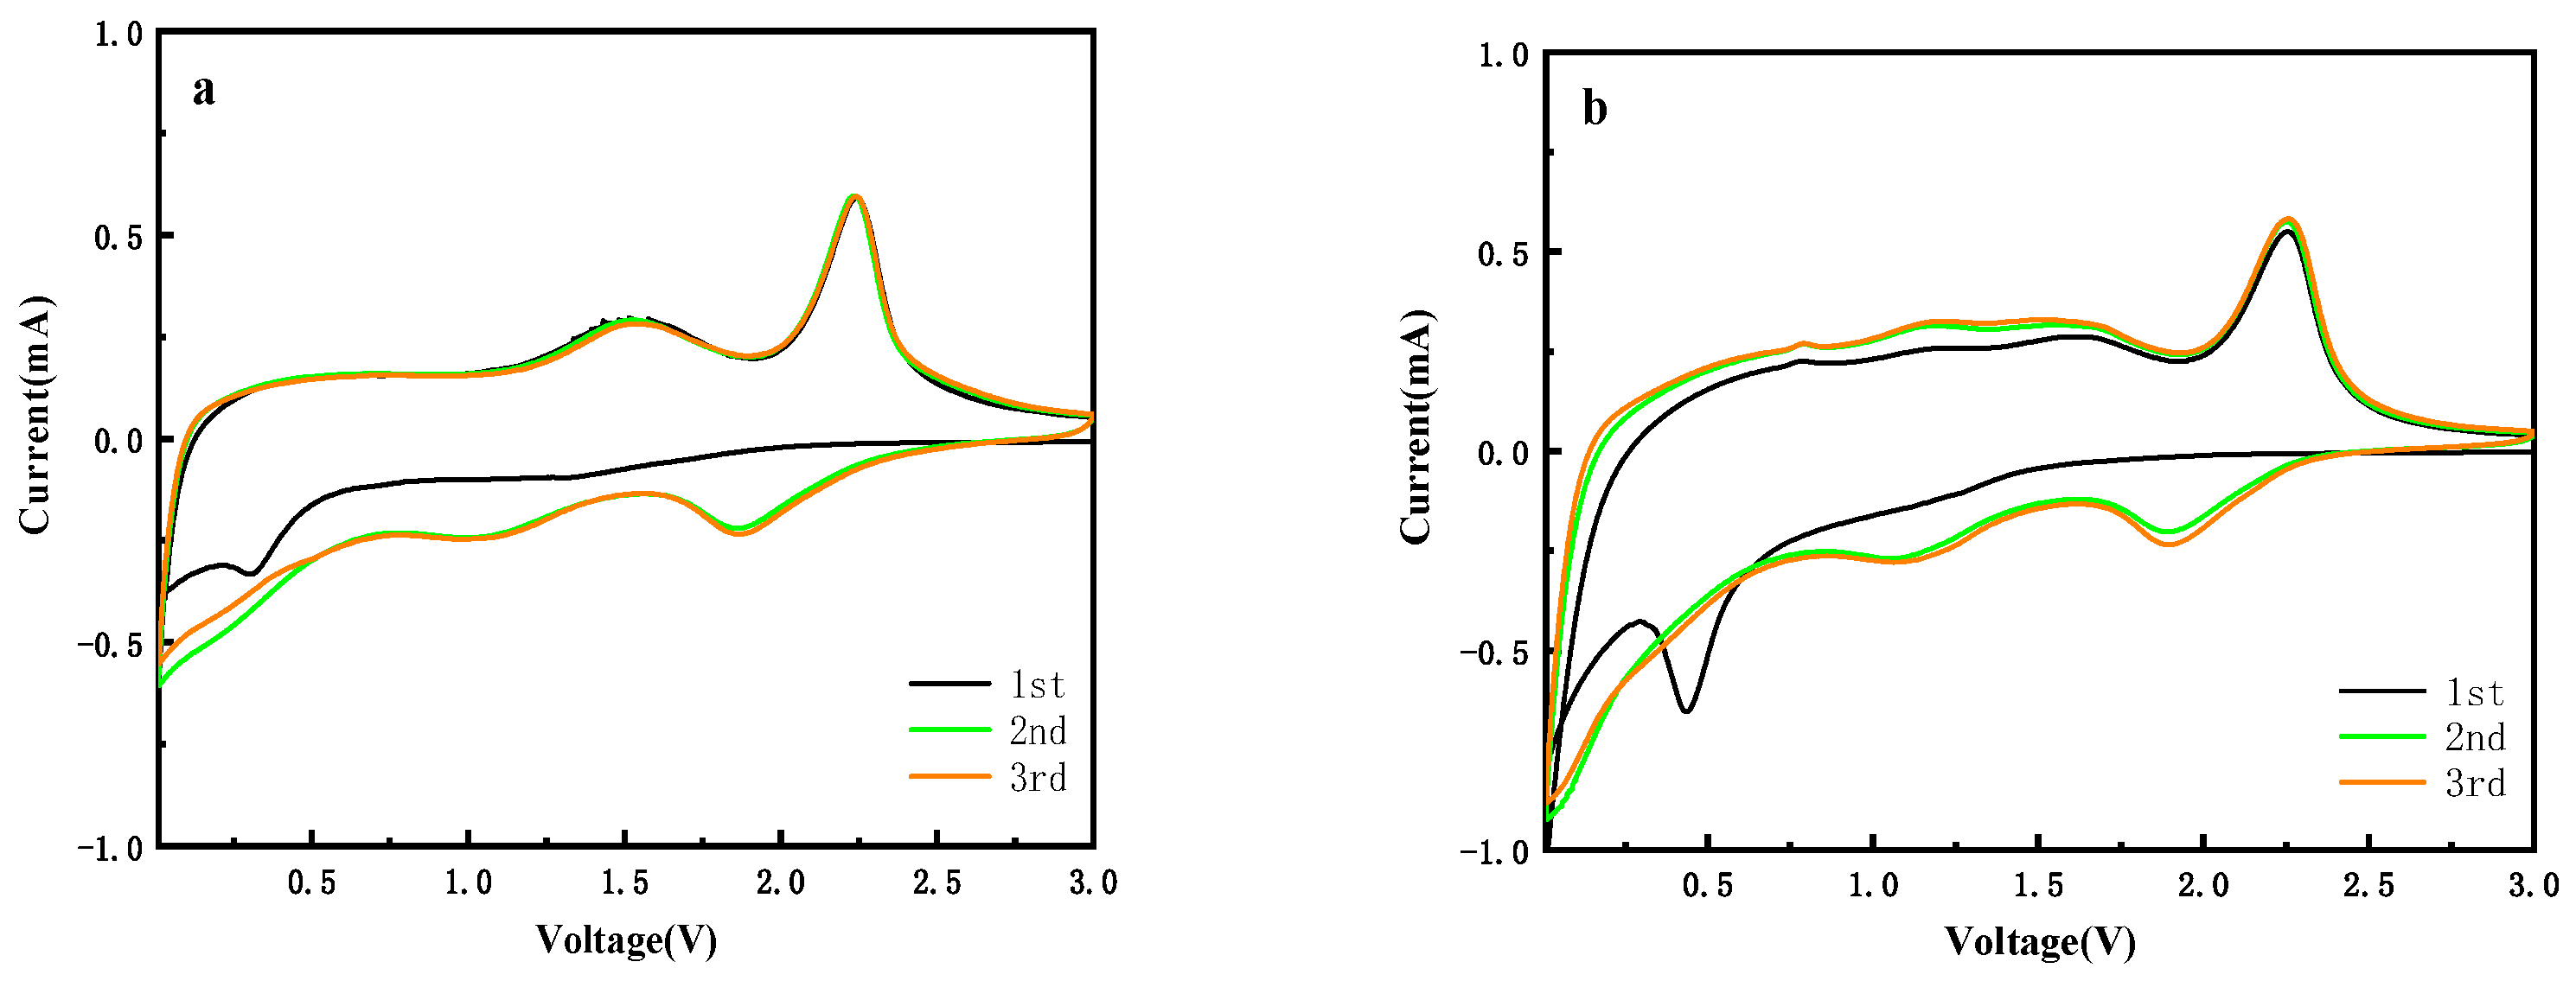
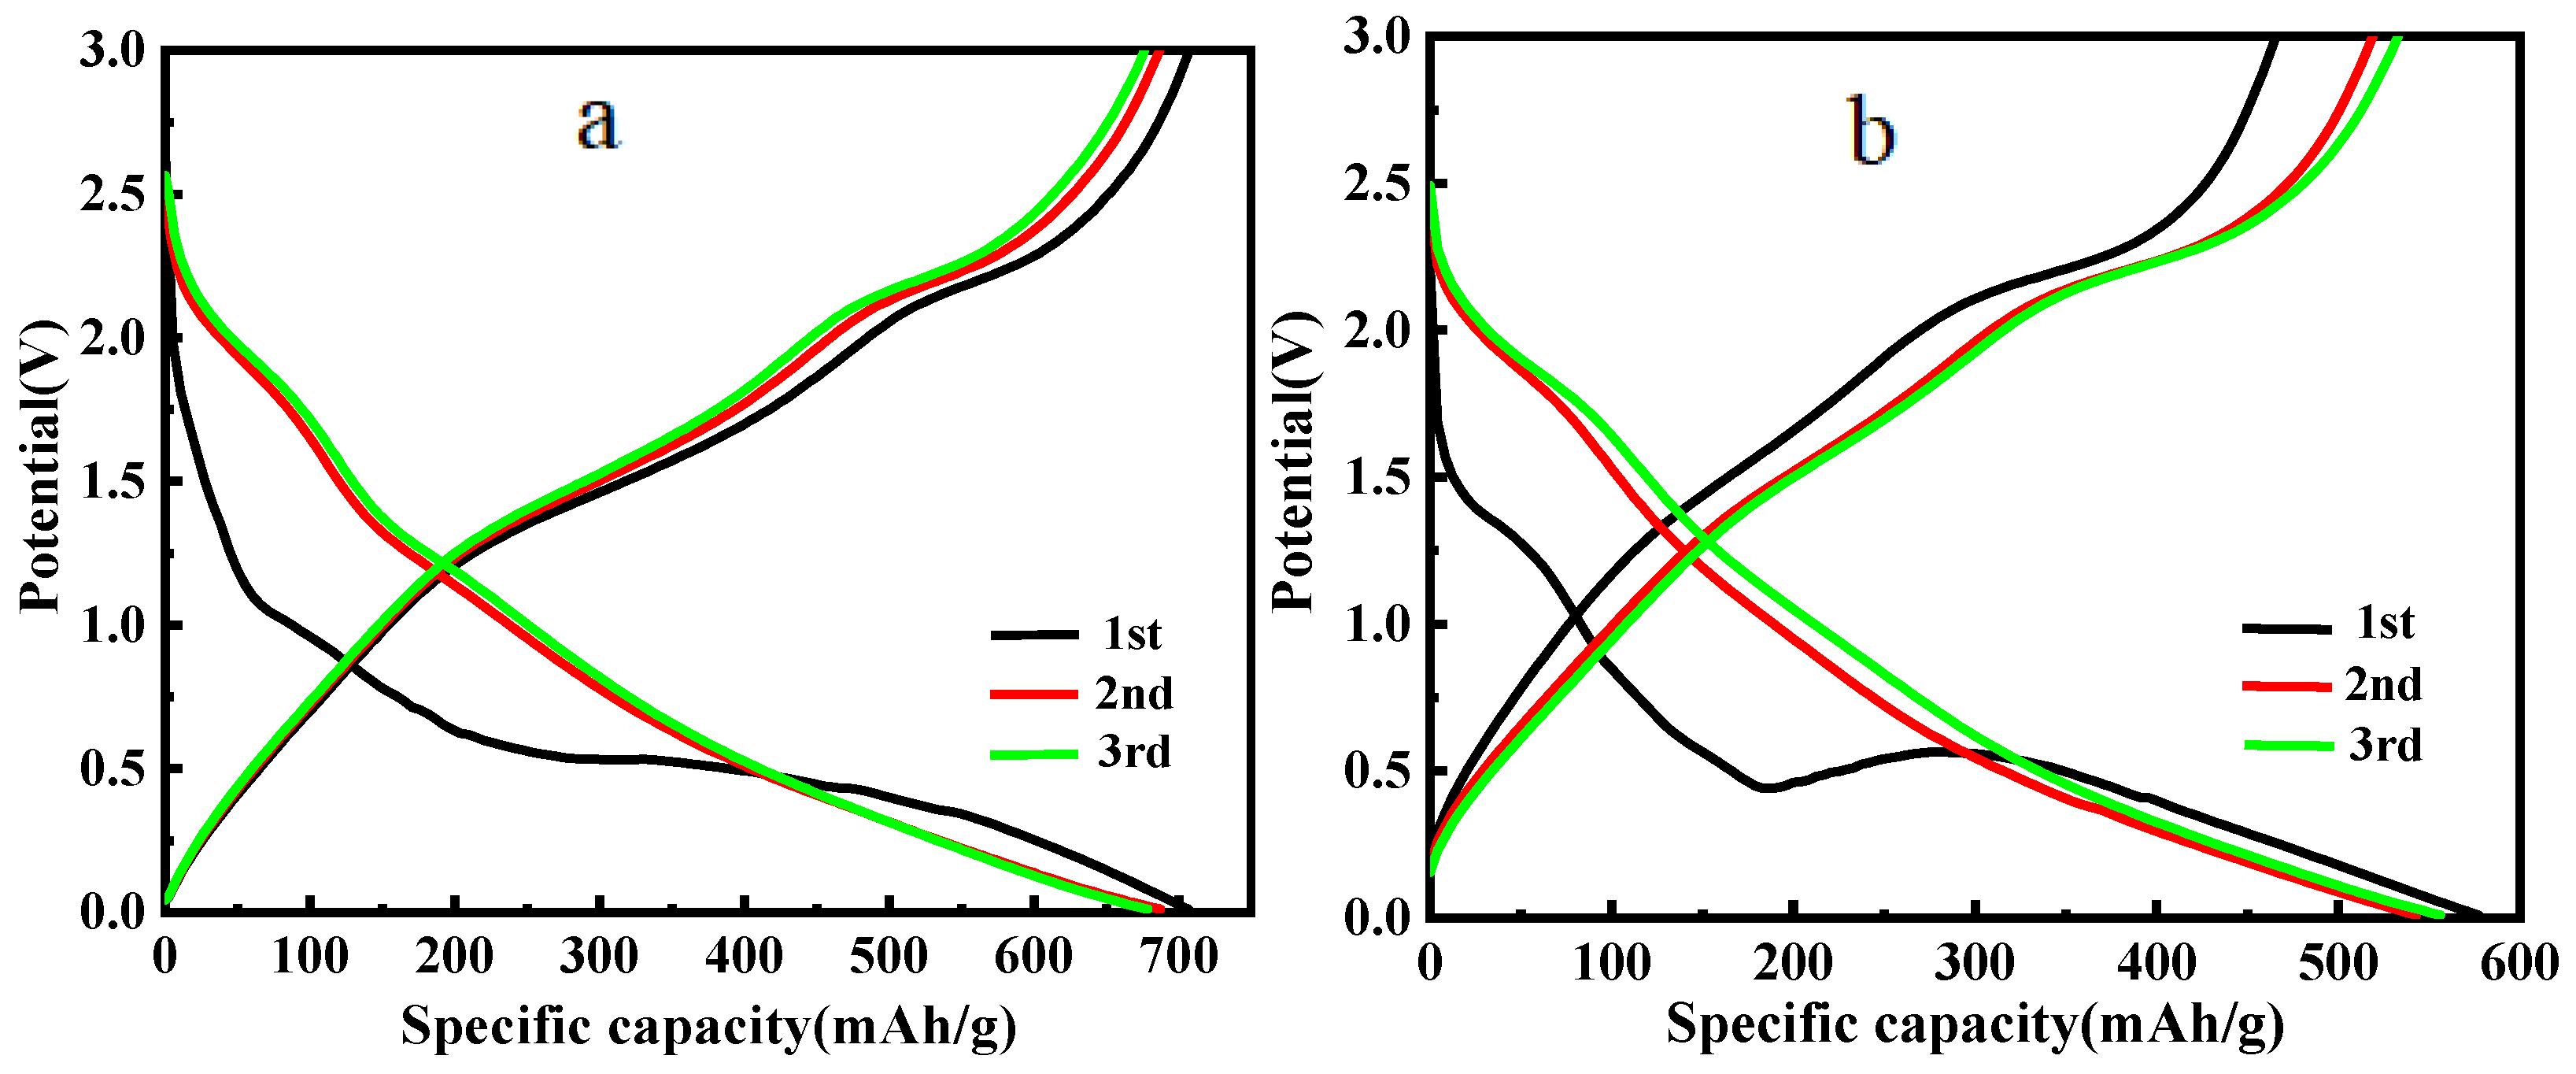
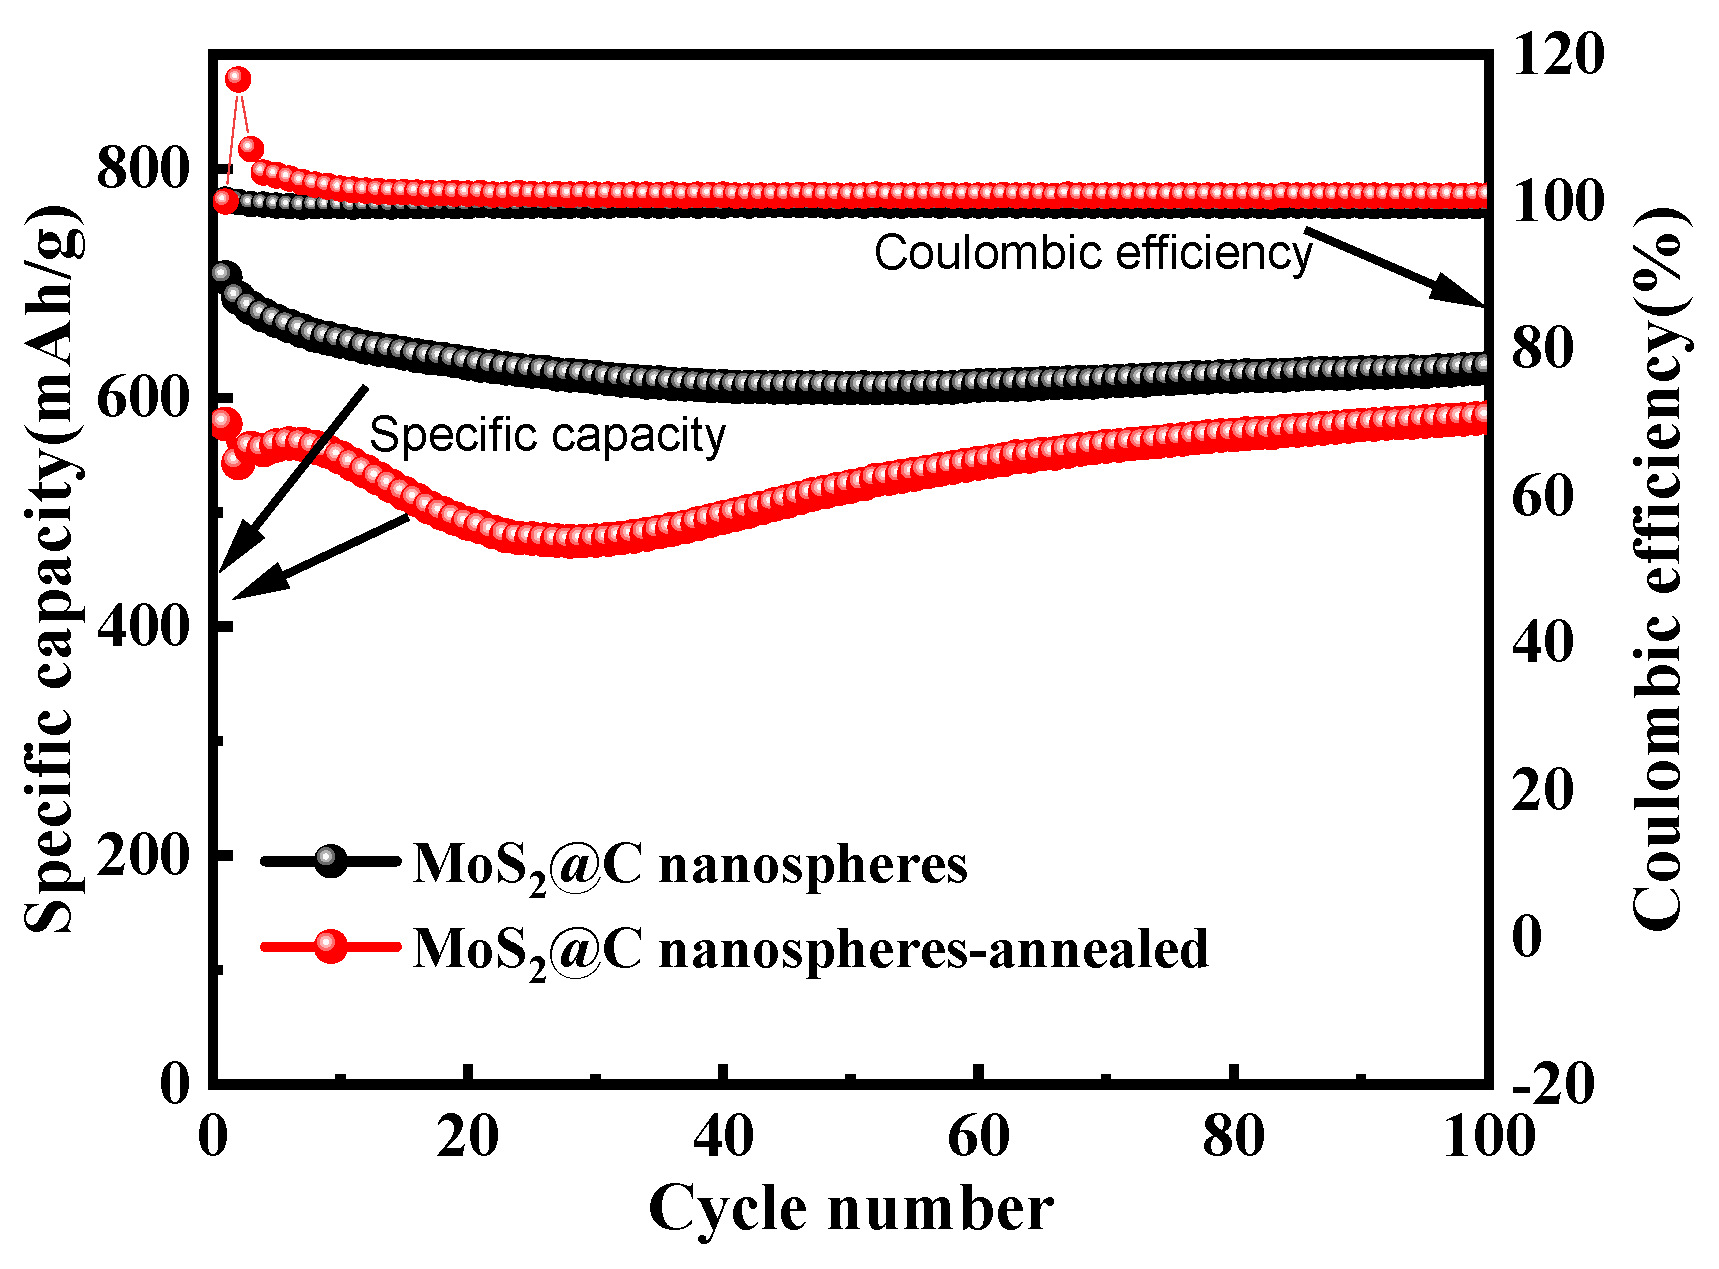
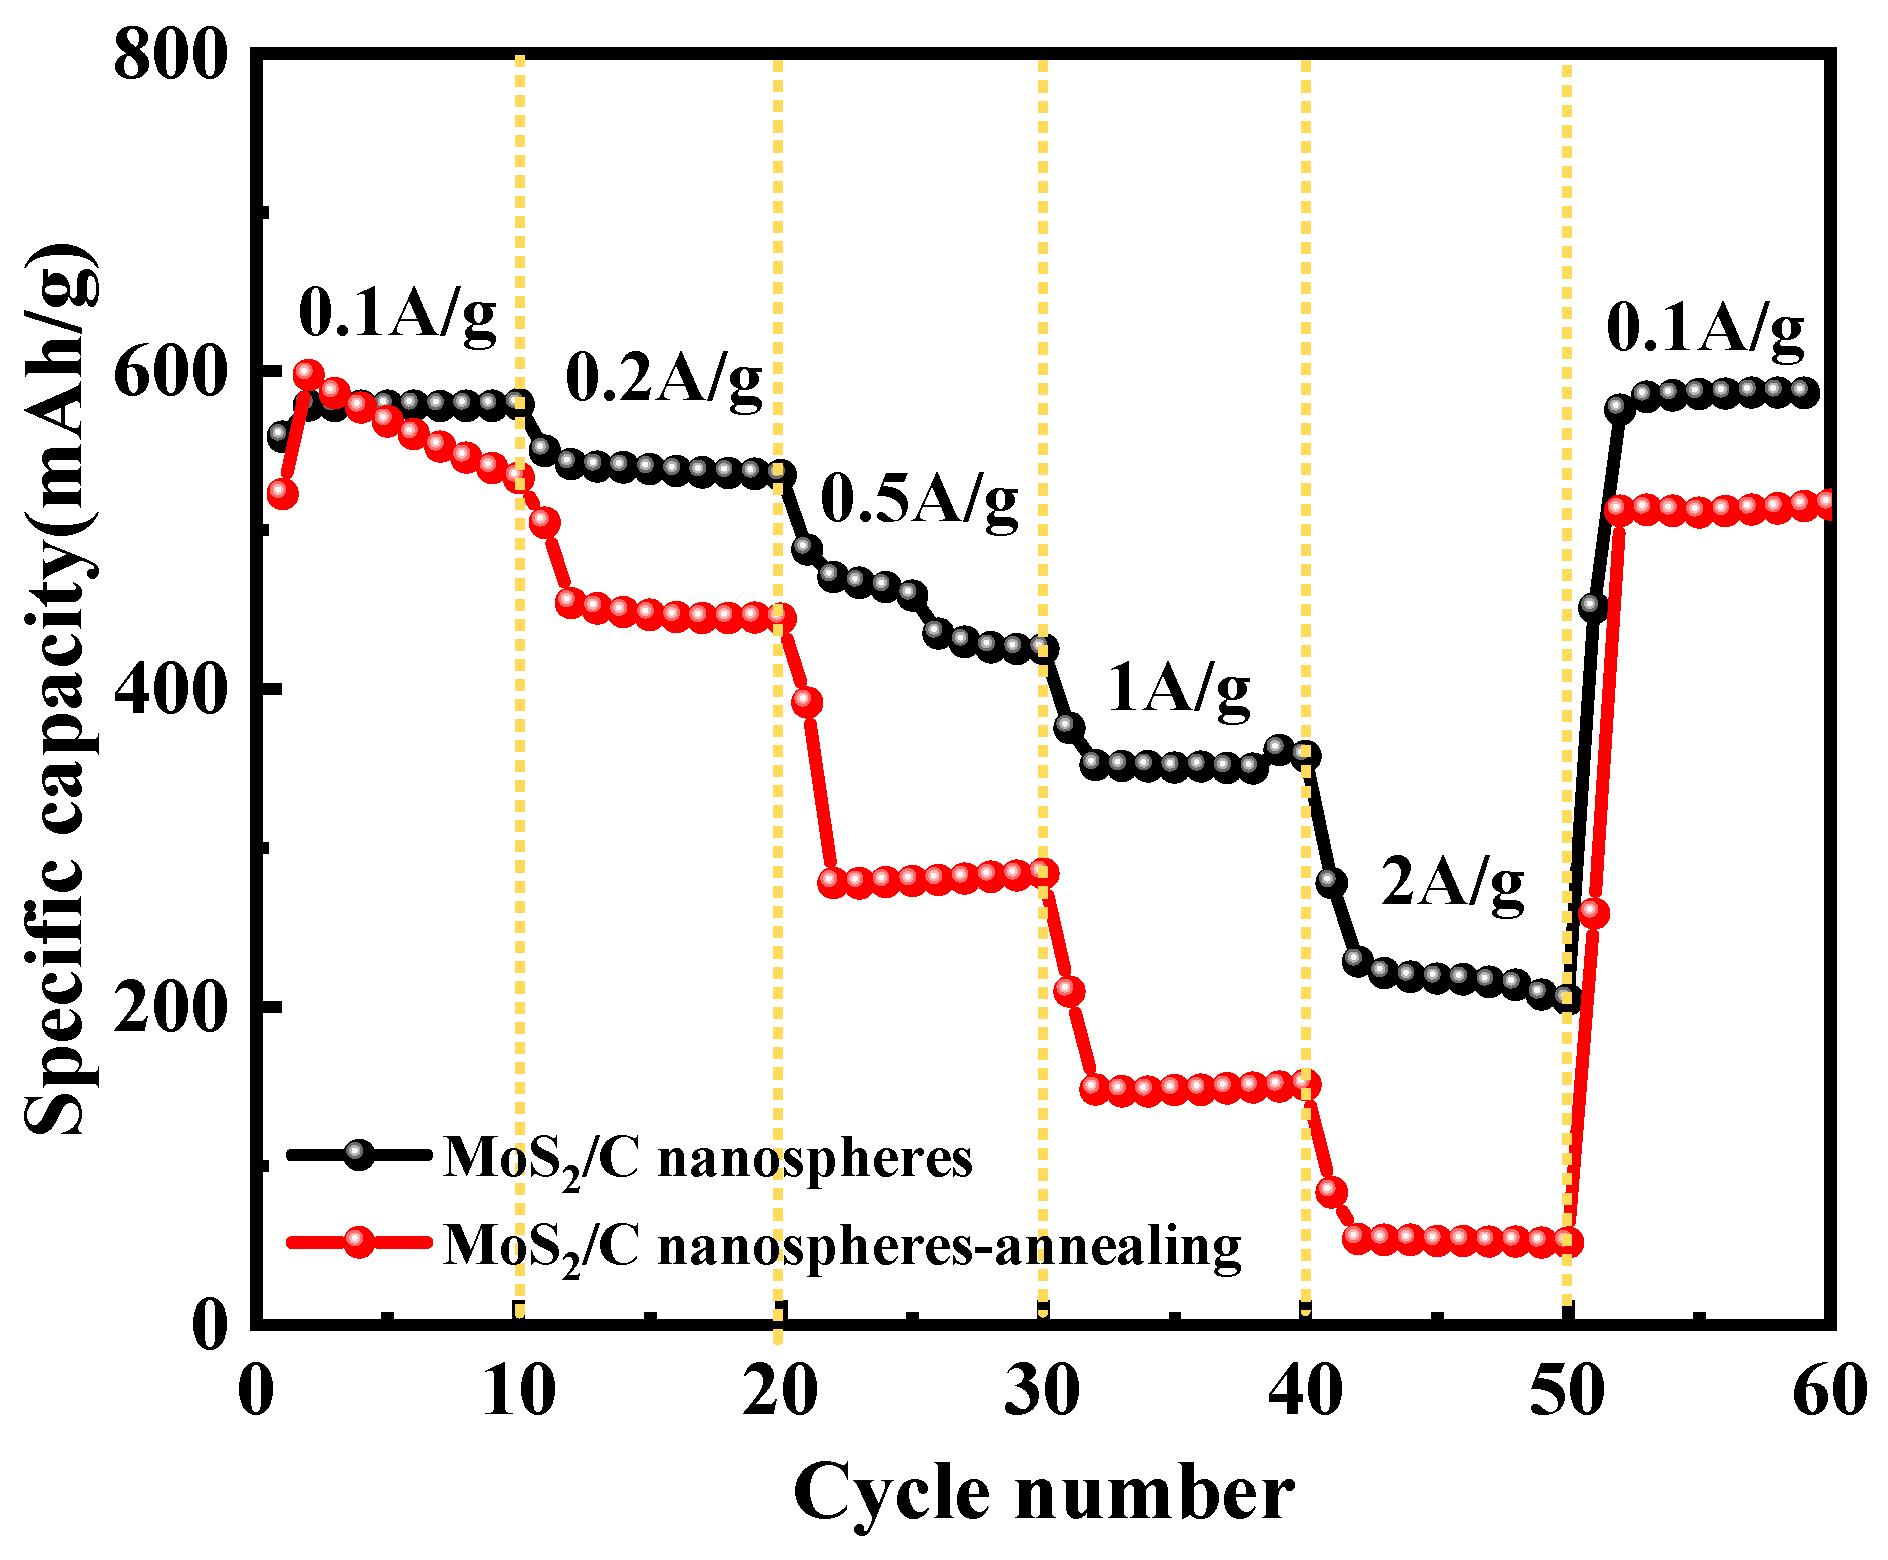
3.5. Electrochemical Performance of MoS2/C

When the scanning interval is 0.01–3 V and the scanning speed is not 0.3 mV/s, the cyclic voltammetry test of the first three cycles of the MoS2/C electrode before and after annealing is shown in Figure 12. Found in the first circle of the cathode scanning process, the first and weak peaks of MoS2/C before and after annealing were exhibited at approximately 1.3 V and 1.4 V, respectively, which corresponds to the amorphous LixMoS2 formed by lithium-ion embedding in molybdenum disulfide lattice, as indicated by the Reaction (3):
MoS2 + xLi+ + xe→LixMoS2 (0 < x ≤ 1, 3~1.1 V vs. Li/Li+)
Then, a second significant reduction peak appears at approximately 0.3 V and 0.5 V, respectively, corresponding to the conversion of LixMoS2 to Li2S, as represented in the Reaction (4):
LixMoS2 + (4 − x)Li++(4 − x)e→Mo+2Li2S (0 < x ≤ 1, 1.1~0 V vs. Li/Li+)
When the anode scanning voltage is about 1.6 V and 2.2 V, respectively, the MoS2/C before and after annealing shows two oxidation peaks, corresponding to the conversion of Li2S to S and the partial vulcanization of Mo to form MoS2, in accordance with the Reactions (5) and (6) [54]:
Li2S→S + 2Li++2e (0~3 V vs. Li/Li+)
2Li2S + Mo→MoS2 + 4Li+ + 4e (0~3 V vs. Li/Li+)
After the first circle scanning, the reduction curves of the materials were shifted and the reduction peaks changed, indicating the occurrence of an irreversible reaction and the formation of solid electrolyte film (SEI). In the following scanning process, the coincidence degree of the CV curve of MoS2/C before annealing is better than that after annealing, indicating that MoS2/C has better cyclic stability before annealing, which is consistent with the cyclic performance test results.
Figure 13 displays the charge–discharge profiles of the MoS2/C material during the first three cycles within a voltage range of 0.01–3 V at a current density of 500 mA·g−1. The specific discharge capacities of the MoS2/C material during the first cycle are 705.2 mAh·g−1 and 577.2 mAh·g−1, before and after annealing, respectively. The discharge curves of the specimen before annealing exhibit two discharge potential plateaus at approximately 1.1 V and 0.5 V, while the discharge curves of MoS2/C after annealing show two discharge potential plateaus at around 1.2 V and 0.6 V, respectively. The plateau at around 1.1 V corresponds to the generation of LixMoS2 [43,55], as indicated by the Reaction (3).
At the plateau of about 0.5 V, LixMoS2 is converted to Mo and Li2S, as represented in the Reaction (4).
The MoS2/C materials exhibit a disparate discharge potential plateau during the second and third cycles compared to the first cycle, indicating an irreversible reaction that led to the formation of LixMoS2 and changes in the structure and composition of the electrode materials after the initial discharge. During the charging process, both pre-annealed and post-annealed MoS2/C exhibit a potential plateau of approximately 2.2 V, in accordance with the Reaction (5).
The carbon shell structure of MoS2/C can effectively improve the conductivity of the electrode, accelerate the ion transfer rates, and improve the discharge performance of the battery. In addition, the carbon shell can also provide buffer space for the volume effect of the electrode material, thereby extending the battery life. The electrochemical behavior of carbon shells in LIBs is shown in Reaction (7), which runs through the entire charge–discharge process.
6C + xLi+ + xe ↔ LixC6 (0~3 V vs. Li/Li+)
The irreversible capacity loss is due to the formation of the solid electrolyte interface film (SEI film) during the first lithiation process of molybdenum disulfide. On the other hand, the almost superimposed curves in the second and third cycles indicate the good reversibility and cycle stability of the subspheroidal samples as the anode material.
Figure 14 shows the cyclic performance of the MoS2/C composites before and after annealing at 500 °C for 2 h. Both samples exhibit a coulomb efficiency of almost 100%. The initial discharge-specific capacity of the MoS2/C material before roasting is slightly higher than that after annealing. The specific capacities of the unannealed MoS2/C material after the first and 100th cycles are 705.2 mAh·g−1 and 625.7 mAh·g−1, respectively, with a capacity retention rate of 88.7%. In contrast, the annealed MoS2/C material shows a faster capacity degradation with a capacity loss of 17.7% after just 30 cycles. However, the specific capacity of the annealed MoS2/C material gradually increases during the subsequent cycles and eventually reaches 582.3 mAh·g−1 after the 100th cycle, which exceeds the initial specific capacity. It can be concluded that the specimen without calcination has a lower capacity retention rate but a higher specific capacity compared with the samples after annealing. This higher specific capacity is maintained even after the 100th cycle. According to the previous XPS analysis results in Section 3.3, a part of the 1T phase MoS2 exists in the sample before annealing. This metallic phase exhibits better electrical conductivity than the 2H phase MoS2, resulting in a higher specific capacity compared to the sample after roasting. Therefore, in practical applications, MoS2/C powder materials for LIBs anode can be prepared by the one-pot hydrothermal process without further annealing treatment.
Moreover, the cycle stability of MoS2/C electrode materials is significantly improved compared to the spherical pristine MoS2 material without annealing [35], indicating that amorphous carbon plays a critical role in reinforcing the MoS2 due to the following reasons. First, the carbonization of glucose refines the MoS2 grains and increases the specific surface area of the active material in contact with the electrolyte. Second, the core–shell structure suppresses the clustering of MoS2 microspheres and improves structural stability. Third, amorphous carbon links the core–shell structure and acts as a bridge between the composite nanospheres, which facilitates ion transport. Fourth, the electrical conductivity of the system is enhanced, accelerating the electron transport rate.
Figure 14 shows that the specific capacity of the sample after annealing fluctuates during the cyclic charge/discharge process. The capacity initially decreases and then slowly recovers with the number of cycles. This trend can be attributed to the annealing procedure, which causes volatilization of the residual molybdenum oxide and creates voids in the material. As a result, the contact area between the active material and the electrolyte increases. With the gradual activation of the anode material, the specific capacity also gradually increases. Based on the testing data in this study, anode materials with high specific capacity and good cycling stability could be synthesized by the one-step enhanced hydrothermal process without subsequent roasting.
Table 1 list electrochemical performance of some MoS2-based anode material synthesized by different process. The cyclic performance in this study is comparable to that of the literature but the synthesis time is shorter. The specific capacity obtained in this study is indeed not very high compared to the other literature. However, the purpose of this study is not to pursue extremely high specific capacity, but to use a relatively simple process to synthesize an anode material with stable charging and discharging performance in a relatively short reaction time. When used as anode material for LIBs, the synthesized MoS2/C exhibited an initial specific discharge capacity of 705.2 mAh·g−1 at a current density of 500 mA·g−1. After the 100th cycle, the specific discharge capacity was 625.7 mAh·g−1, and the capacity retention rate was as high as 88.7%. This is significantly higher than the commercial graphite anode, which has a capacity of only 372 mAh·g−1. The specific capacity of the material in this study can have sufficient capacity space for the cathode material of LIBs, indicating significant research potential.
The rate performance of MoS2/C materials before and after annealing is shown in Figure 15. The specimen exhibits reversible capacities of 579, 534, 425, 358, and 205 mAh·g−1 at current densities of 0.1, 0.2, 0.5, 1.0, and 2.0 A·g−1, respectively. When the current density returns to 0.1 A·g−1, the reversible specific capacity recovers to 586 mAh·g−1, indicating excellent rate performance.
The electrochemical impedance spectroscopy (EIS) test was performed on the button cell after charge/discharge for 100 cycles at a current density of 500 mA·g−1. The equivalent circuit and the Nyquist diagram were fitted using Zview software (version 3.0.0.22), as shown in Figure 16a,b, respectively. In Figure 16a, Re represents the internal resistance of the half cell, which is determined by the physical and contact resistance inside the cell. Rct is the charge transfer resistance at the electrode–electrolyte interface, which is related to the electrochemical properties of the active material. Rs represents the impedance of the SEI film. Zw is the diffusion resistance of Li+ in the electrolyte. CPE is the corresponding constant phase element [61,62,63]. Figure 16b displays the Nyquist diagram of the electrode materials before and after calcination. The semicircle width in the high-frequency region denotes Rct, while the tilt line in the low-frequency region corresponds to Zw, and the intercept of the EIS line in the Z’ axis corresponds to the Re. The Re, Rs, and Rct values of the MoS2/C before calcination are 6.49 Ω, 30.96 Ω, and 11.94 Ω, according to the fitting results. In contrast, the Re and Rct values for the samples after annealing are 3.14 Ω and 147 Ω, respectively. Therefore, the charge transfer resistivity Rct of the annealed subspheroidal MoS2/C is higher than that of the unannealed MoS2/C, indicating that the MoS2/C nanocomposites without annealing have faster charge transfer capability and excellent lithium-ion diffusion capability. A small charge transfer impedance results in faster charge transfer and improved lithium-ion diffusion. This means that when Rct is low, electrons and ions can move more freely through the material, leading to accelerated charge transfer within the material and between interfaces. As a result, the overall cell reaction rate increases. In this study, the 1T-MoS2 in MoS2/C is converted to 2H-MoS2 during the annealing process. Compared to 2H-MoS2, 1T-MoS2 exhibits a metallic phase with lower ion diffusion barriers [64]. This property is favorable for charge transfer at the interface between the active material and the electrolyte. Therefore, the MoS2/C before annealing has a smaller Rct. The electrical conductivity and ion transfer efficiency of molybdenum disulfide matrix materials are improved by the colloidal carbon substance formed during the hydrothermal carbonization of glucose. This enhancement results in fast charging and discharging ability.
The internal resistance of the MoS2/C composite after annealing at 500 °C increases instead of decreasing compared with that before annealing. This suggests that the colloidal carbon substance may have caused morphological or structural changes during the roasting process, resulting in decreased electrical conductivity. Since the EIS plots (shown in Figure 16b) exhibit two semicircular regions with different radii before annealing, with the Rct at this point composed of the charge transfer impedance at the electrode–electrolyte interface and the charge transfer impedance formed by the pseudocapacitance between the electrodes, while MoS2/C only displays a single semicircle after annealing, because no pseudocapacitance is formed between the electrodes after annealing, and the Rct at this point only has charge transfer impedance at the electrode–electrolyte interface. This is consistent with Figure 16a, and the Rct before annealing is smaller than that after annealing, which further indicates that, in this experiment, the one-step strengthening hydrothermal method can synthesize anode electrode materials with good electrochemical properties without subsequent annealing. It has also been suggested in the literature that two semicircles correspond to two reactive interfaces [65]. XPS analysis in this study found the presence of 1T- MoS2 in the samples before annealing, which is attributed to its smaller impedance.
In addition, the diffusion coefficient of lithium ions represents the diffusion rate of lithium ions inside the LIBs, which determines the migration ability of lithium ions in the electrolyte and electrode materials. It is a key indicator to evaluate the performance and safety of the battery. If the diffusion coefficient of lithium ions is too low, lithium ions are difficult to diffuse in the electrode material, thus reducing the discharge performance of the battery. Additionally, a low diffusion coefficient may also cause the internal temperature of the battery to rise quickly, shortening its lifespan. The larger diffusion coefficient of lithium ions suggests faster diffusion kinetics before annealing, which is consistent with the results of charge and discharge above. The cycling stability of MoS2/C material is enhanced when charged and discharged at higher rates due to its larger diffusion coefficient of lithium ions, resulting in better rate performance.
The diffusion coefficient of lithium ions can be calculated by the following Equation (4) [66,67]:
D = R 2 T 2 2 A 2 n 4 F 4 C 2 σ 2
where D is the diffusion coefficient of Li+ (cm·s−2); R is the gas constant (8.314 J·K−1·mol−1); T is the testing temperature (298 K); A is the area of the electrode material (cm2); n is the number of electrons transferred per mole of the active material participating in the electrode reaction; F is Faraday constant (96,500 C·mol−1); and C is the concentration of the lithium ion (mol·L−1); σ is the slope of the Z’-ω−1/2 plot, and the fitted linear relationship graph is shown in Figure 17. The value of ω was calculated from the formula ω = 2πf. According to Equation (4), the lithium-ion diffusion coefficient of the subspheroidal MoS2/C material before and after annealing is 2.11 × 10⁻¹⁸ cm·s−2 and 1.28 × 10⁻²⁰ cm·s−2, respectively, indicating that the MoS2/C material before roasting has a larger lithium-ion diffusion coefficient, which is beneficial for lithium-ion inserting and de-embedding during the charging and discharging process. The diffusion coefficient of lithium ions determines the migration ability of lithium ions in the electrolyte and electrode materials, representing their diffusion rate inside the lithium battery. A larger diffusion coefficient results in a faster diffusion rate and kinetics, facilitating the insertion and de-embedding of lithium ions. The diffusion coefficient is related to the concentration of lithium ions, electronic conductivity, temperature, etc. The diffusion of lithium ions is limited by electronic conductivity [40,68]. During the process of de-embedding lithium, there is a synergistic diffusion phenomenon of lithium ions and electrons. The diffusion of ions is limited by electronic conduction. Furthermore, the carbon coating of the active material improved the comprehensive conductive properties of the composite electrode, resulting in an enhancement of the lithium-ion diffusion ability.

4. Conclusions

(1) The MoS2/C composite powder was prepared in a one-pot enhanced hydrothermal method in a shorter period, with ammonium molybdate, thiourea, and glucose as molybdenum, sulfur, and carbon sources, respectively, under the assistance of polyvinylpyrrolidone (PVP) as a soft template. The as-prepared samples exhibit a subspheroidal core–shell encapsulation structure. The average particle size of MoS2 is approximately 50 nm, and the thickness of the amorphous carbon coating is around 20–30 nm. The particles are uniformly dispersed, and the microscopic morphology remains unchanged after annealing at 500 °C for 2 h. The addition of glucose can accelerate the nucleation and growth of molybdenum disulfide. XPS analysis suggests that the intermediate product MoO3 may exist during the hydrothermal process.
(2) The subspheroidal MoS2/C material exhibits excellent electrochemical properties. At a current density of 500 mA·g−1, the discharge-specific capacities of the unannealed MoS2/C material are 705.2 mAh·g−1 and 625.7 mAh·g−1 after the 1st cycle and 100th cycle, respectively. The carbon in the composite improves the structural stability of MoS2 and enhances the electrical conductivity compared to that of pristine MoS2, resulting in significantly enhanced cyclic stability. The capacity retention rate is 88.7% after charge/discharge for 100 cycles. In contrast, the initial specific capacity of the MoS2/C material after annealing at 500 °C for 2 h is 577.2 mAh·g−1, which tends to decrease and then slowly increase during the testing process. The discharge-specific capacity after 100 cycles is 582.3 mAh·g−1, which is lower than that of the unannealed sample. Impedance analysis indicates that the lithium-ion diffusion coefficient of the unannealed MoS2/C material is 2.11 × 10⁻¹⁸ cm·s−2, which is superior to that of the roasted MoS2/C sample. This characteristic facilitates the insertion and removal of lithium ions during the charging and discharging process.

Author Contributions

Conceptualization, W.L. and D.F.; methodology, W.W. and Y.W.; validation, S.Y., L.F. and J.Z.; formal analysis, S.Y. and Y.L.; investigation, D.F., W.W. and S.Y.; data curation, L.F. and J.Z.; writing—original draft preparation, W.L. and D.F.; writing—review and editing, all authors; visualization, D.F.; supervision, W.L.; project administration, W.L.; funding acquisition, W.L. All authors have read and agreed to the published version of the manuscript.

Funding

This research was funded by (1) the National Natural Science Foundation of China (No. U1404511); (2) the Henan Province Science and Technology R&D Program Joint Fund Project (No.222103810038); (3) Henan Province Higher Education Schools Youth Backbone Teacher Training Program (No. 2019GGJS073); and (4) Henan Provincial University Key Research Project (No.24B430007).

Data Availability Statement

Data is contained within the article.

Acknowledgments

All authors gratefully acknowledge the support from the “Collaborative Innovation Center for New Materials and Advanced Processing Technologies of Nonferrous Metals” and the “Advanced Wear Resistant Material of Changjiang Scholars and Innovative Research Team in University of Ministry of Education of China”.

Conflicts of Interest

The authors declare no conflicts of interest.

References

  1. Zhang, Q.; Yao, T.; He, Q.; Wang, H.; Liu, Z.; Wang, D.; Wang, H.; Meng, L. Enhancing lithium-ion storage performance of hollow CoS2/MoS2 nanospheres via N-doped carbon-coating. J. Energy Storage 2023, 72, 108639. [Google Scholar] [CrossRef]
  2. Wu, L.; Zheng, J.; Wang, L.; Xiong, X.; Shao, Y.; Wang, G.; Wang, J.H.; Zhong, S.; Wu, M. PPy-encapsulated SnS2 nanosheets stabilized by defects on a TiO2 support as a durable anode material for lithium-ion batteries. Angew. Chem. 2019, 131, 821–825. [Google Scholar] [CrossRef]
  3. Wang, Z.; Feng, G.; Zhen, D.; Gu, F.; Ball, A. A review on online state of charge and state of health estimation for lithium-ion batteries in electric vehicles. Energy Rep. 2021, 7, 5141–5161. [Google Scholar] [CrossRef]
  4. Yao, T.; Wang, H.; Wang, J.; Liu, T.; Li, C.; Han, X.; Cheng, Y. Metal-organic framework derived Ge/TiO2@ C nanotablets as high-performance anode for lithium-ion batteries. ChemistrySelect 2019, 4, 10576–10580. [Google Scholar] [CrossRef]
  5. Huang, L.; Li, T.; Liu, Q.; Gu, J. Fluorine-free Ti3C2Tx as anode materials for Li-ion batteries. Electrochem. Commun. 2019, 104, 106472. [Google Scholar] [CrossRef]
  6. IPCC Climate Change. Mitigation of climate change. In Contribution of Working Group III to the Fifth Assessment Report of the Intergovernmental Panel on Climate Change; United Nations. Economic Commission for Africa: Addis Ababa, Ethiopia, 2014; Volume 1454, p. 147. [Google Scholar]
  7. Xu, H.; Li, H.; Wang, X. The Anode Materials for Lithium-Ion and Sodium-Ion Batteries Based on Conversion Reactions: A Review. ChemElectroChem 2023, 10, e202201151. [Google Scholar] [CrossRef]
  8. Kumar, R.; Sahoo, S.; Joanni, E.; Singh, R.K.; Tan, W.K.; Kar, K.K.; Matsuda, A. Recent progress in the synthesis of graphene and derived materials for next generation electrodes of high performance lithium ion batteries. Prog. Energy Combust. Sci. 2019, 75, 100786. [Google Scholar] [CrossRef]
  9. Arshad, F.; Lin, J.; Manurkar, N.; Fan, E.; Ahmad, A.; Wu, F.; Chen, R.; Li, L. Life cycle assessment of lithium-ion batteries: A critical review. Resour. Conserv. Recycl. 2022, 180, 106164. [Google Scholar] [CrossRef]
  10. Zahoor, A.; Yu, Y.; Zhang, H.; Nihed, B.; Afrane, S.; Peng, S.; Sápi, A.; Lin, C.J.; Mao, G. Can the new energy vehicles (NEVs) and power battery industry help China to meet the carbon neutrality goal before 2060? J. Environ. Manag. 2023, 336, 117663. [Google Scholar] [CrossRef]
  11. Nitta, N.; Wu, F.; Lee, J.T.; Yushin, G. Li-ion battery materials: Present and future. Mater. Today 2015, 18, 252–264. [Google Scholar] [CrossRef]
  12. Cao, B.; Liu, Z.; Xu, C.; Huang, J.; Fang, H.; Chen, Y. High-rate-induced capacity evolution of mesoporous C@ SnO2@ C hollow nanospheres for ultra-long cycle lithium-ion batteries. J. Power Sources 2019, 414, 233–241. [Google Scholar] [CrossRef]
  13. Cheng, H.; Shapter, J.G.; Li, Y.; Gao, G. Recent progress of advanced anode materials of lithium-ion batteries. J. Energy Chem. 2021, 57, 451–468. [Google Scholar] [CrossRef]
  14. Wang, W.; Zeng, X.; Warner, J.H.; Guo, Z.; Hu, Y.; Zeng, Y.; Lu, J.; Jin, W.; Wang, S.; Lu, J. Photoresponse-bias modulation of a high-performance MoS2 photodetector with a unique vertically stacked 2H-MoS2/1T@ 2H-MoS2 structure. ACS Appl. Mater. Interfaces 2020, 12, 33325–33335. [Google Scholar] [CrossRef] [PubMed]
  15. Lei, Z.; Zhan, J.; Tang, L.; Zhang, Y.; Wang, Y. Recent development of metallic (1T) phase of molybdenum disulfide for energy conversion and storage. Adv. Energy Mater. 2018, 8, 1703482. [Google Scholar] [CrossRef]
  16. Zhang, R.; Qin, Y.; Liu, P.; Jia, C.; Tang, Y.; Wang, H. How does molybdenum disulfide store charge: A minireview. ChemSusChem 2020, 13, 1354–1365. [Google Scholar] [CrossRef] [PubMed]
  17. Navas, J.; Martínez-Merino, P.; Sánchez-Coronilla, A.; Gallardo, J.J.; Alcántara, R.; Martín, E.I.; Piñero, J.C.; León, J.R.; Aguilar, T.; Toledo, J.H. MoS2 nanosheets vs. nanowires: Preparation and a theoretical study of highly stable and efficient nanofluids for concentrating solar power. J. Mater. Chem. A 2018, 6, 14919–14929. [Google Scholar] [CrossRef]
  18. Radhakrishnan, S.; KA, S.R.; Kumar, S.R.; Johari, P.; Rout, C.S. Energy storage performance of 2D MoS2 and carbon nanotube heterojunctions in symmetric and asymmetric configuration. Nanotechnology 2021, 32, 155403. [Google Scholar] [CrossRef]
  19. Li, Y.; Jiang, S.; Qian, Y.; Yan, X.; Zhou, J.; Yi, Z.; Lin, N.; Qian, Y. 2D interspace confined growth of ultrathin MoS2-intercalated graphite hetero-layers for high-rate Li/K storage. Nano Res. 2021, 14, 1061–1068. [Google Scholar] [CrossRef]
  20. Chen, R.; Lin, C.; Yu, H.; Tang, Y.; Song, C.; Yuwen, L.; Li, H.; Xie, X.; Wang, L.; Huang, W. Templating C60 on MoS2 Nanosheets for 2D Hybrid van der Waals p–n Nanoheterojunctions. Chem. Mater. 2016, 28, 4300–4306. [Google Scholar] [CrossRef]
  21. Zhao, Y.; Zhang, Z.; Zhang, H.; Zhou, Y.; Weng, Y.; Xiong, S. Three-Dimensional PrGO-Based Sandwich Composites With MoS2 Flowers as Stuffings for Superior Lithium Storage. Front. Chem. 2020, 8, 94. [Google Scholar] [CrossRef]
  22. Lou, X.; Liu, Z.; Hou, J.; Zhou, Y.; Chen, W.; Xing, X.; Li, Y.; Liao, Q.; Zhu, X. Modification of the anodes using MoS2 nanoflowers for improving microbial fuel cells performance. Catal. Today 2021, 364, 111–117. [Google Scholar] [CrossRef]
  23. Liu, Y.; Hu, K.; Hu, E.; Guo, J.; Han, C.; Hu, X. Double hollow MoS2 nano-spheres: Synthesis, tribological properties, and functional conversion from lubrication to photocatalysis. Appl. Surf. Sci. 2017, 392, 1144–1152. [Google Scholar] [CrossRef]
  24. Liu, M.; Li, N.; Wang, S.; Li, Y.; Liang, C.; Yu, K. 3D nanoflower-like MoS2 grown on wheat straw cellulose carbon for lithium-ion battery anode material. J. Alloys Compd. 2023, 933, 167689. [Google Scholar] [CrossRef]
  25. Liu, H.; Lin, Y.; Zhang, L. Hierarchical porous MoS2/C nanospheres self-assembled by nanosheets with high electrochemical energy storage performance. Nanoscale Res. Lett. 2020, 15, 199. [Google Scholar] [CrossRef] [PubMed]
  26. Long, F.; Chen, Y.; Wu, C.; Wang, J.; Mo, S.; Zou, Z.; Zheng, G. Unique three-dimensional hierarchical heterogeneous MoS2/graphene structures as a high-performance anode material for lithium-ion batteries. Ionics 2021, 27, 1977–1986. [Google Scholar] [CrossRef]
  27. Ye, R.; Bao, Y.; Huang, J.; Zhao, Y.; Fan, Z.; Chen, H.; Hu, X.; Zhuang, N. Enhanced Hydrogen Evolution Activity and Lithium-Ion Storage of Three-Dimensional Porous MoS2 Hybridized with Graphene Aerogel. Catal. Lett. 2020, 150, 3402–3408. [Google Scholar] [CrossRef]
  28. Zhang, J.; Li, Y.; Gao, T.; Sun, X.; Cao, P.; Zhou, G. Flower-shaped TiO2/C microspheres embedded with fish-scale-like MoS2 as anodes for lithium-ion batteries. Ceram. Int. 2018, 44, 8550–8555. [Google Scholar] [CrossRef]
  29. Jiao, J.; Du, K.; Wang, Y.; Sun, P.; Zhao, H.; Tang, P.; Fan, Q.; Tian, H.; Li, Q.; Xu, Q. N plasma treatment on graphene oxide-MoS2 composites for improved performance in lithium ion batteries. Mater. Chem. Phys. 2020, 240, 122169. [Google Scholar] [CrossRef]
  30. Liu, H.; Lei, Y.; Lin, Y.; Zhang, L.; Lu, Y. One-pot Hydrothermal Synthesis of MoS2 Porous Nanospheres and Their Electrochemical Properties. Int. J. Electrochem. Sci. 2020, 15, 1942–1948. [Google Scholar] [CrossRef]
  31. Liu, Y.; Tang, D.; Zhong, H.; Zhang, Q.; Yang, J.; Zhang, L. A novel MoS2/C nanocomposite as an anode material for lithium-ion batteries. J. Alloys Compd. 2017, 729, 583–589. [Google Scholar] [CrossRef]
  32. Liu, B.; Li, F.; Li, H.; Zhang, S.; Liu, J.; He, X.; Sun, Z.; Yu, Z.; Zhang, Y.; Huang, X. Monodisperse MoS2/graphite composite anode materials for advanced lithium ion batteries. Molecules 2023, 28, 2775. [Google Scholar] [CrossRef] [PubMed]
  33. Suchanek, W.L.; Riman, R.E. Hydrothermal synthesis of advanced ceramic powders. Adv. Sci. Technol. 2006, 45, 184–193. [Google Scholar]
  34. Shi, E.W.; Chen, Z.Z.; Yuan, R.L.; Zheng, Y.Q. Hydrothemal Crystallgraphy, 1st ed.; Science Press: Beijing, China, 2004; pp. 218–219. [Google Scholar]
  35. Wu, Y.; Zhang, L.L.; Wang, W.; Fan, D.S.; Yang, S.S.; Bai, Y.H.; Li, J.W.; Liu, W. Enhanced hydrothermal synthesis and electrochemi-cal performance of subsphaeroidal MoS2 used as anode material for lithium-ion batterie. Rare Met. Mater. Eng. 2023, 52, 2893–2900. [Google Scholar]
  36. Ma, B.-B.; Chen, S.-J.; Huang, Y.-W.; Nie, Z.-Z.; Qiu, X.-B.; Xie, X.-Q.; Wu, Z.-J. Electrochemical lithium storage performance of three-dimensional foam-like biocarbon/MoS2 composites. Trans. Nonferrous Met. Soc. China 2021, 31, 255–264. [Google Scholar] [CrossRef]
  37. Chang, K.; Chen, W.; Ma, L.; Li, H.; Li, H.; Huang, F.; Xu, Z.; Zhang, Q.; Lee, J.-Y. Graphene-like MoS2/amorphous carbon composites with high capacity and excellent stability as anode materials for lithium ion batteries. J. Mater. Chem. 2011, 21, 6251–6257. [Google Scholar] [CrossRef]
  38. Luo, F.; Feng, X.; Zeng, L.; Lin, L.; Li, X.; Kang, B.; Xiao, L.; Chen, Q.; Wei, M.; Qian, Q. In situ simultaneous encapsulation of defective MoS2 nanolayers and sulfur nanodots into SPAN fibers for high rate sodium-ion batteries. Chem. Eng. J. 2021, 404, 126430. [Google Scholar] [CrossRef]
  39. Jia, P.; Liang, J.; Yue, L.; Liu, M.; Wang, X.; Liang, C.; Yu, K. Effect of MoS2 decoration on energy storage of wheat straw-derived porous carbon for lithium-ion batteries. Ionics 2023, 29, 5085–5097. [Google Scholar] [CrossRef]
  40. Teng, Y.; Liu, H.; Liu, D.; He, H.; Chen, Y. Pitaya-like carbon-coated ZnS/carbon nanospheres with inner three-dimensional nanostructure as high-performance anode for lithium-ion battery. J. Colloid Interface Sci. 2019, 554, 220–228. [Google Scholar] [CrossRef] [PubMed]
  41. Hui, K.; Fu, J.; Liu, J.; Chen, Y.; Gao, X.; Gao, T.; Wei, Q.; Li, C.; Zhang, H.; Tang, M. Yolk–shell nanoarchitecture for stabilizing a Ce2S3 anode. Carbon Energy 2021, 3, 709–720. [Google Scholar] [CrossRef]
  42. Bai, J.; Zhao, B.; Wang, X.; Ma, H.; Li, K.; Fang, Z.; Li, H.; Dai, J.; Zhu, X.; Sun, Y. Yarn ball-like MoS2 nanospheres coated by nitrogen-doped carbon for enhanced lithium and sodium storage performance. J. Power Sources 2020, 465, 228282. [Google Scholar] [CrossRef]
  43. Zhu, W.; Shi, C.; Zhao, J.; Wang, Y.; Hu, Y. Structure and electrochemical performance of MoS2 based on different molybdenum-sulfur mole ratios. J. Phys. Chem. Solids 2022, 167, 110749. [Google Scholar] [CrossRef]
  44. Ramohlola, K.E.; Iwuoha, E.I.; Hato, M.J.; Modibane, K.D. Instrumental techniques for characterization of molybdenum disulphide nanostructures. J. Anal. Methods Chem. 2020, 2020, 8896698. [Google Scholar] [CrossRef]
  45. Yin, M.; Song, H.; Tang, A.; Xu, G.; Liu, L.; Pan, Y. Effect of carbon sources on morphologies and electrochemical properties of MoS 2/carbon composites. Ionics 2019, 25, 2087–2092. [Google Scholar] [CrossRef]
  46. Wang, J.; Fang, W.; Hu, Y.; Zhang, Y.; Dang, J.; Wu, Y.; Zhao, H.; Li, Z. Different phases of few-layer MoS2 and their silver/gold nanocomposites for efficient hydrogen evolution reaction. Catal. Sci. Technol. 2020, 10, 154–163. [Google Scholar] [CrossRef]
  47. Eda, G.; Yamaguchi, H.; Voiry, D.; Fujita, T.; Chen, M.; Chhowalla, M. Photoluminescence from chemically exfoliated MoS2. Nano Lett. 2011, 11, 5111–5116. [Google Scholar] [CrossRef]
  48. Liu, M.-C.; Xu, Y.; Hu, Y.-X.; Yang, Q.-Q.; Kong, L.-B.; Liu, W.-W.; Niu, W.-J.; Chueh, Y.-L. Electrostatically charged MoS2/graphene oxide hybrid composites for excellent electrochemical energy storage devices. ACS Appl. Mater. Interfaces 2018, 10, 35571–35579. [Google Scholar] [CrossRef]
  49. Zhang, X.; Huang, L.; Zeng, P.; Wu, L.; Shen, Q.; Gao, Z.; Chen, Y. Hierarchical MoS2 anchored on core-shell Si@C with increased active-sites and charge transfer for superior cycling and rate capability in lithium-ion batteries. Chem. Eng. J. 2019, 357, 625–632. [Google Scholar] [CrossRef]
  50. Xiao, Z.; Sheng, L.; Jiang, L.; Zhao, Y.; Jiang, M.; Zhang, X.; Zhang, M.; Shi, J.; Lin, Y.; Fan, Z. Nitrogen-doped graphene ribbons/MoS2 with ultrafast electron and ion transport for high-rate Li-ion batteries. Chem. Eng. J. 2021, 408, 127269. [Google Scholar] [CrossRef]
  51. Gong, C.; Long, M.; Xiao, J.; Li, J.; Chen, J.; Xiao, Y.; Zhang, G.; Gao, H.; Liu, H. One-step hydrothermal reaction induced nitrogen-doped MoS2/MXene composites with superior lithium-ion storage. Batteries 2022, 8, 156. [Google Scholar] [CrossRef]
  52. Cui, Y.; He, J.; Yuan, F.; Xue, J.; Li, X.; Wang, J. Preparation of MoS2 microspheres through surfactants-assisted hydrothermal synthesis using thioacetamide as reducing agent. Hydrometallurgy 2016, 164, 184–188. [Google Scholar] [CrossRef]
  53. Zeng, X.; Qin, W. Synthesis of MoS2 nanoparticles using MoO3 nanobelts as precursor via a PVP-assisted hydrothermal method. Mater. Lett. 2016, 182, 347–350. [Google Scholar] [CrossRef]
  54. Xue, H.; Yue, S.; Wang, J.; Zhao, Y.; Li, Q.; Yin, M.; Wang, S.; Feng, C.; Wu, Q.; Li, H. MoS2 microsphere@ N-doped carbon composites as high performance anode materials for lithium-ion batteries. J. Electroanal. Chem. 2019, 840, 230–236. [Google Scholar] [CrossRef]
  55. Xu, W.; Wang, T.; Wu, S.; Wang, S. N-doped carbon-coated MoS2 nanosheets on hollow carbon microspheres for high-performance lithium-ion batteries. J. Alloys Compd. 2017, 698, 68–76. [Google Scholar] [CrossRef]
  56. Choi, J.-H.; Kim, M.-C.; Moon, S.-H.; Kim, H.; Kim, Y.-S.; Park, K.-W. Enhanced electrochemical performance of MoS2/graphene nanosheet nanocomposites. RSC Adv. 2020, 10, 19077–19082. [Google Scholar] [CrossRef] [PubMed]
  57. Xue, H.; Jiao, Q.; Du, J.; Wang, S.; Feng, C.; Wu, Q.; Li, H.; Lu, Q.; Shi, D.; Zhao, Y. Hollow MoS2/rGO composites as high-performance anode materials for lithium-ion batteries. Ionics 2019, 25, 4659–4666. [Google Scholar] [CrossRef]
  58. Chen, C.; Xie, X.; Anasori, B.; Sarycheva, A.; Makaryan, T.; Zhao, M.; Urbankowski, P.; Miao, L.; Jiang, J.; Gogotsi, Y. MoS2-on-MXene heterostructures as highly reversible anode materials for lithium-ion batteries. Angew. Chem. Int. Ed. 2018, 57, 1846–1850. [Google Scholar] [CrossRef] [PubMed]
  59. Li, J.; Han, L.; Zhang, X.; Sun, H.; Liu, X.; Lu, T.; Yao, Y.; Pan, L. Multi-role TiO2 layer coated carbon@ few-layered MoS2 nanotubes for durable lithium storage. Chem. Eng. J. 2021, 406, 126873. [Google Scholar] [CrossRef]
  60. Zhang, Y.; Zhao, S.; Zeng, X.; Xiao, J.; Dong, P.; Zhao, J.; Sun, S.; Huang, L.; Li, X. TiO2–MoS2 hybrid nano composites with 3D network architecture as binder-free flexible electrodes for lithium ion batteries. J. Mater. Sci. Mater. Electron. 2017, 28, 9519–9527. [Google Scholar] [CrossRef]
  61. Zhao, J.; Ren, H.; Gu, C.; Guan, W.; Song, X.; Huang, J. Synthesis of hierarchical molybdenum disulfide microplates consisting of numerous crosslinked nanosheets for lithium-ion batteries. J. Alloys Compd. 2019, 781, 174–185. [Google Scholar] [CrossRef]
  62. Li, H.; Su, Q.; Kang, J.; Feng, H.; Huang, P.; Huang, M.; Feng, M.; Tu, G.; Du, G. MoS2 nanosheets attached on carbon microspheres used as anodes for lithium ion batteries. Ceram. Int. 2018, 44, 5311–5318. [Google Scholar] [CrossRef]
  63. Chao, Y. Molybdenum Disulfide/Carbon Composites for Lithium Ion Batteries. Ph.D. Thesis, University of Wollongong, Wollongong, Australia, 2020. [Google Scholar]
  64. Sun, D.; Huang, D.; Wang, H.; Xu, G.-L.; Zhang, X.; Zhang, R.; Tang, Y.; Abd EI-Hady, D.; Alshitari, W.; AL-Bogami, A.S. 1T MoS2 nanosheets with extraordinary sodium storage properties via thermal-driven ion intercalation assisted exfoliation of bulky MoS2. Nano Energy 2019, 61, 361–369. [Google Scholar] [CrossRef]
  65. Zhu, S.; Dai, Y.; Li, J.; Ye, C.; Zhou, W.; Yu, R.; Liao, X.; Li, J.; Zhang, W.; Zong, W. Cathodic Zn underpotential deposition: An evitable degradation mechanism in aqueous zinc-ion batteries. Sci. Bull. 2022, 67, 1882–1889. [Google Scholar] [CrossRef] [PubMed]
  66. Wang, X.; Hao, H.; Liu, J.; Huang, T.; Yu, A. A novel method for preparation of macroposous lithium nickel manganese oxygen as cathode material for lithium ion batteries. Electrochim. Acta 2011, 56, 4065–4069. [Google Scholar] [CrossRef]
  67. Liu, X.; Ma, X.; Liu, G.; Zhang, X.; Tang, X.; Li, C.; Zang, X.; Cao, N.; Shao, Q. Polyaniline spaced MoS2 nanosheets with increased interlayer distances for constructing high-rate dual-ion batteries. J. Mater. Sci. Technol. 2024, 182, 220–230. [Google Scholar] [CrossRef]
  68. Mao, Z.-Y.; Sun, Y.-P.; Scott, K. Evaluation of apparent lithium-ion diffusion coefficients in FePO4/LiFePO4 cathode material particles from linear non-equilibrium thermodynamics and principle of electroneutrality. J. Electroanal. Chem. 2016, 766, 107–119. [Google Scholar] [CrossRef]
Figure 1. Schematic illustration of the synthesis process.
Energies 17 01678 g001
Figure 2. SEM images of MoS2/C samples prepared at (a) 180 °C, (b) 200 °C, (c) 220 °C, (d) 240 °C, and (e) EDS data of the sample in Figure 2d.
Energies 17 01678 g002
Figure 3. Particle size distribution of MoS2/C sample.
Energies 17 01678 g003
Figure 4. XRD patterns of (a) MoS2/C prepared at different temperatures and (b) MoS2 materials prepared at 200 °C.
Energies 17 01678 g004
Figure 5. SEM images of MoS2/C materials prepared with different PVP addition in μmol ((a)—0; (b)—2.5; (c)—5; (d)—7.5; (e)—10; (f)—15)).
Energies 17 01678 g005
Figure 6. XRD patterns of MoS2/C materials prepared with different PVP additions.
Energies 17 01678 g006
Figure 7. HRTEM images of as-prepared MoS2 and MoS2/C specimens. ((a)—MoS2, 30,000×; (b)—MoS2, 400,000×; (c)—MoS2/C, 50,000×; (d)—MoS2/C, 800,000×).
Energies 17 01678 g007
Figure 8. XRD patterns of MoS2/C before and after annealing.
Energies 17 01678 g008
Figure 9. FESEM images of MoS2/C ((a)—before annealing; (b)—after annealing).
Energies 17 01678 g009
Figure 10. XPS spectra of MoS2/C materials before and after annealing. ((a)—survey spectra; (b)—Mo3d before annealing; (c)—Mo3d after annealing; (d)—S2p before annealing; (e)—S2p after annealing; (f)—C1s before annealing; (g)—C1s after annealing; (h)—N1s before annealing; (i)—N1s after annealing).
Energies 17 01678 g010
Figure 11. Illustration of synthesis mechanism for subspheroidal MoS2/C composite.
Energies 17 01678 g011
Figure 12. Cyclic voltammetry (CV) of the MoS2/C electrode during the first three cycles, at the scanning rate of 0.3 mV/S, the voltage range is from 0.01 to 3 V ((a)—before annealing; (b)—after annealing).
Energies 17 01678 g012
Figure 13. Charge and discharge curves of the MoS2/C electrode during the first three cycles, at the current density of 500 mA·g−1 and the voltage range of 0.01 to 3 V ((a)—before annealing; (b)—after annealing).
Energies 17 01678 g013
Figure 14. Cyclic stability of MoS2/C as anode, test at the current density of 500 mA·g−1.
Energies 17 01678 g014
Figure 15. Rate performance of MoS2/C samples before and after annealing, at the current density of 500 mA·g−1.
Energies 17 01678 g015
Figure 16. (a) Equivalent circuit diagram and (b) Nyquist diagram of MoS2/C samples before and after annealing.
Energies 17 01678 g016
Figure 17. Fitted linear relation of Z’ and ω−1/2 of MoS2/C materials before and after annealing.
Energies 17 01678 g017
Table 1. Cyclic stability of MoS2-based anode synthesized by different methods.
MaterialMorphologyMethodTimeInitial Discharge Specific CapacityCyclic StabilityRef.
MoS2/CNuclear crust structurehydrothermal7 h705.2 mAh·g−1Specific capacity was 625.7 mAh·g−1 after 100 weeks of cyclingThis work
(0.5 A·g−1)
MoS2/GNSNanohydrothermal12 h732 mAh·g−1Specific capacity less than 100 mAh·g−1 after 100 weeks of cycling[56]
sheet(0.1 A·g−1)
MoS2/rGOHollow microsphereshydrothermal8 h760 mAh·g−1Specific capacity retention was 99.15% after 100 weeks of cycling[57]
(0.5 A·g−1)
MoS2/Mo2TiC2TxSheetliquid phase mixing72 h646 mAh·g−1Specific capacity retention was 86% after 500 weeks of cycling[58]
(0.1 A·g−1)
C@MoS2@Nanotubetemplate method-agent heat method/455.2 mAh·g−1Specific capacity was 455.2 mAh·g−1 after 1000 cycles[59]
TiO2(2 A·g−1)
MoS2/TiO2Micrometer floridhydrothermal16 h410.8 mAh·g−1Specific capacity retention was 88% after 300 weeks of cycling[60]
(0.8 A·g−1)
MoS2-TiNStriatedmagnetron sputtering/700 mAh·g−1Specific capacity retention was 89% after 300 weeks of cycling[31]
(0.1 A·g−1)
MoS2Ultra-thermal drive stripping method12 h450 mAh·g−1 (0.5 A·g−1)Specific capacity retention was 94% after 200 weeks of cycling[2]
thin nanosheets
MoS2-PVP@NCBall of woolhydrothermal29 h607.1 mAh· g−1Specific capacity was 356 mAh·g−1 after 300 weeks of cycling[4]
(1 A·g−1)
Disclaimer/Publisher’s Note: The statements, opinions and data contained in all publications are solely those of the individual author(s) and contributor(s) and not of MDPI and/or the editor(s). MDPI and/or the editor(s) disclaim responsibility for any injury to people or property resulting from any ideas, methods, instructions or products referred to in the content.

