Article

Dynamic Modeling and Simulation of a Facade-Integrated Adsorption System for Solar Cooling of Lightweight Buildings

Institute of Building Energetics, Thermotechnology and Energy Storage, University of Stuttgart, 70569 Stuttgart, Germany
*
Author to whom correspondence should be addressed.
Energies 2024, 17(7), 1706; https://doi.org/10.3390/en17071706
Submission received: 27 February 2024 / Revised: 22 March 2024 / Accepted: 29 March 2024 / Published: 2 April 2024

Abstract

:
Reductions of carbon dioxide emissions from the building sector are mandatory for climate protection. This calls for both a reduction of the construction material and energy as well as a reduction of the operational energy. Against this background, a novel facade-integrated adsorption system for solar cooling of lightweight buildings is proposed and theoretically investigated in this work. For this purpose, a detailed simulation model is developed to analyze both the processes in the single components as well as the overall system behavior. The proposed system consists of the three components adsorber, condenser and evaporator, which are connected vacuum-tight and are coupled by vapor transfer. The simulation results of a defined reference case yield cooling rates of 54   W per installed square meter of adsorber facade. The cooling power can be maintained for 12 h, confirming the applicability of the proposed system. Furthermore, a comprehensive parametric study is carried out in order to identify an optimum set of parameter values for maximum cooling rate under the assumed conditions. The results reveal that controlled constant cooling rates of 105   W per square meter of adsorber facade can be reached and a maximum peak power of 145   W per square meter of adsorber facade is possible.

1. Introduction

1.1. Motivation

The building sector accounts for approximately 40% of the global carbon dioxide emissions due to its huge demand of resources and operational energy [1]. Therefore, significant reduction of construction material for new buildings is mandatory for climate protection. This can be achieved through lightweight buildings. However, unlike conventional massive buildings with a larger share of concrete, lightweight buildings have low inherent thermal capacity, and thus, are prone to thermal oscillations. This effect is further intensified by global warming and leads to an increasing demand for building air cooling [2,3]. Obviously, the required cold production should be realized without further carbon dioxide emissions. Against this background, the Collaborative Research Centre 1244 at the University of Stuttgart interdisciplinarily investigates adaptive building skins and structures to reduce resource consumption in building construction as well as energy consumption in building operation [4]. In this framework, a novel facade-integrated adsorption system for solar cooling of lightweight buildings is proposed and developed. The system combines the functionality of energy storage and cold production, with minimum occupation of inner building space and utilization of the facade areas rather than the often occupied roof top areas. All of this topics are identified as uptrend themes in the field of knowledge [5]. Furthermore, materials are chosen according to recyclability and ecological friendliness. In this work, the focus is on the theoretical investigation of the novel cooling system by means of modeling and numerical simulations.

1.2. Literature Review

Sustainable cooling technologies for buildings can be divided into passive and active cooling systems. An overview of passive cooling systems is given in [6]. The installation of phase change material into the facades as well as into the roofs can significantly lower the annual energy demand [7]. However, these applications cannot be controlled with the same flexiblity in terms of switching times and temperature levels. Thus, they cannot adapt to different user preferences and cooling scenarios.
Active solar cooling technologies are a promising solution to economically provide cooling power with zero or very low CO2 emissions [8]. The multiple different solar cooling technologies can be distinguished into two major groups [9]: on the one hand, photovoltaic modules can electrically drive compression chillers [10], and on the other hand, solar thermal collectors can thermally drive sorption chillers or desiccant cooling systems. The latter group of thermally driven technologies is studied widely and many applications are in operation [11,12,13,14]. The proposed system investigated in this work belongs to the group of thermally driven sorption chillers. Compared to the electrically driven technologies, it has two main advantages. The efficiency of the solar thermal collector is two to three times higher than the efficiency of currently available photovoltaic modules. Secondly, the proposed adsorption cooling system introduces thermal capacity to the lightweight building through its ad-/desorption potential, and thus, can limit the temperature fluctuations already without active cooling.
In the group of solar thermal cooling systems, most installations are either absorption or adsorption systems [13]. A broad overview of solar sorption cooling systems is given in [15]. In [16], the focus is on adsorption refrigeration technology. The systems presented in these technology overviews have separated solar thermal collectors and ab-/adsorption units. The solar thermal collectors are usually installed on the buildings roof, while the chiller units are integrated into the basement. In order to provide continuous cooling power, the systems consist of two ab-/adsorber reactors, where the desorption and ab-/adsorption processes take place alternately. The two ab-/adsorbers can be coupled thermally to increase the efficiency through internal heat recovery [17,18]. Another approach to achieve continuous cooling power is presented in [19], combining a solar absorption chiller unit with radiative cooling. During the day, a solar thermal collectors drives the absorption chiller, and during the night, cold is produced by flipping the collector so that the bottom layer with a selective radiative cooling adsorption layer faces the sky. In contrast to the sorption cooling systems presented in the literature, the proposed adsorption system in this work combines the adsorber and solar thermal collector into one component, which allows to also integrate the adsorber into the facade. The integration of solar thermal energy systems into the facade is favorable due to the high potential of solar energy harvesting in this area. An overview of current research in this field is presented in [20,21]. The only work known to the authors in which the solar thermal collector and the adsorber are integrated into one single component is [22]. However, this system provides cooling energy only during the night, and thus, requires an additional insulated water tank for cold storage to provide cooling power during the day, whereas the propsed system in this work incorporates the energy storage in the element itself. Furthermore, the combination of condenser and evaporator into one element reduces the flexibility.
A wide range of adsorbent materials is investigated with respect to their potential for solar sorption cooling application [23,24,25]. Commonly used adsorption pairs for solar cooling are activated carbon in combination with ammonia or methanol as well as silica gel or zeolite with water as adsorptive. For the proposed system in this work, zeolite 13X and water is chosen as adsorption pair, as its adsorption characteristics are well documented and its cycle stability is proven [26,27].
Finally, the modeling of adsorption systems is studied in the literature. An overview for different applications is given in [28]. In [29], a numerical one-dimensional lumped-parameter model is given and validated against experimental data. However, the model has to be calibrated by experiments, and thus, it is limited. Modeling and simulation studies of sorption chillers for solar cooling often do not account for heat and mass transfer limitations inside the sorption unit [30,31]. In contrast a detailed model of closed low-pressure adsorbers is applied in this work. Co-author Schaefer developed this adsorber model for the fundamental investigation of heat and mass transfer in closed low-pressure adsorbers for the thermal energy storage [32,33].

1.3. Subject Matter

The scheme and operating principle of the system is shown in Figure 1. The system consists of three main components: an adsorber (A) containing granular zeolite 13X and water as adsorption pair, a condenser (C) and an evaporator (E). All components are connected vacuum-tight via pipes and are initially evacuated. While the adsorber and the condenser are integrated into the building envelope and exchange heat with the environment, the evaporator is installed as a cooling ceiling inside the building.
The system runs through two main phases during each day: the regeneration phase and the cooling phase. During the regeneration phase, the adsorber is heated up by solar irradiation, initiating the desorption of the adsorbed water. The released vapor flows to the condenser, where it condenses, emitting the heat of condensation to the ambient. As soon as the adsorber is no longer heated up by solar irradiation, due to the course of the sun, the subsequent cooling phase starts. The adsorber is connected to the evaporator in this phase and continuously re-adsorbs vapor. The vapor transfer from the evaporator to the adsorber induces evaporation in the evaporator, resulting in a temperature decrease of the remaining water. Since the pressure in the evaporator equals the saturation pressure of the respective water temperature, the vapor pressure is lowered accordingly. Finally, the water cycle is completed in the early morning hours by pumping water from the condenser into the evaporator until the initial water level in the evaporator is reached again. Since the cycle is defined by the course of the sun, the cycle duration is one day. Generally, continuous cooling could be achieved by adding additional adsorber and condenser elements on the opposite facades of the building. However, this shall not be considered in this first theoretical investigation.

1.4. Objectives of Study

The main objective of this work is to gain a better understanding of both the component system behavior as well as to theoretically prove the functionality of the proposed system. For this purpose, a model of the novel facade-integrated adsorption system is developed. The model of the adsorber is based on previous works of the co-author Schaefer [32,33,34] and is adjusted for the application as facade-integrated element. Furthermore, models of the evaporator and the condenser are developed. A comparison of the model aspects of the previous works and this work is given in Table 1. The system model is numerically implemented and broad simulation studies are carried out.
The discussion of the simulation results focuses on the following questions:
  • What is the achievable cooling power and cooling energy capacity?
  • What is a suitable size ratio of the components?
  • How can the system performance be optimized?
The paper is organized as follows: in Section 2, the model is described separately for the three main components, i.e., adsorber, condenser and evaporator. Following, the numerically implementation is briefly addressed in Section 3, before the simulation results are presented and discussed in detail in Section 4. Finally, the study is concluded in Section 5.

2. Model Description

The three components, i.e., adsorber, condenser and evaporator, are not thermally connected, but are only coupled by the vapor mass low m ˙ v between the components, which is determined by the adsorption/desorption rate inside the adsorber. The adsorption/desorption rate in turn depends on the vapor pressure conditions in the condenser and evaporator, respectively, which again are affected by the vapor mass flow. Hence, the coupling is bidirectional. During the regeneration phase, the pressure at the outlet of the adsorber is set by the condenser pressure, as vapor flows from the adsorber into the condenser. During the cooling phase, the adsorber inlet pressure is defined by the evaporator pressure. Since the components are only coupled through their boundary conditions, the components can be modeled separately. All three components are panel-shaped and sufficient mechanical stiffness is achieved through internal structures, such as fins or pins known from evacuated flat plate solar thermal collectors [35].

2.1. Adsorber

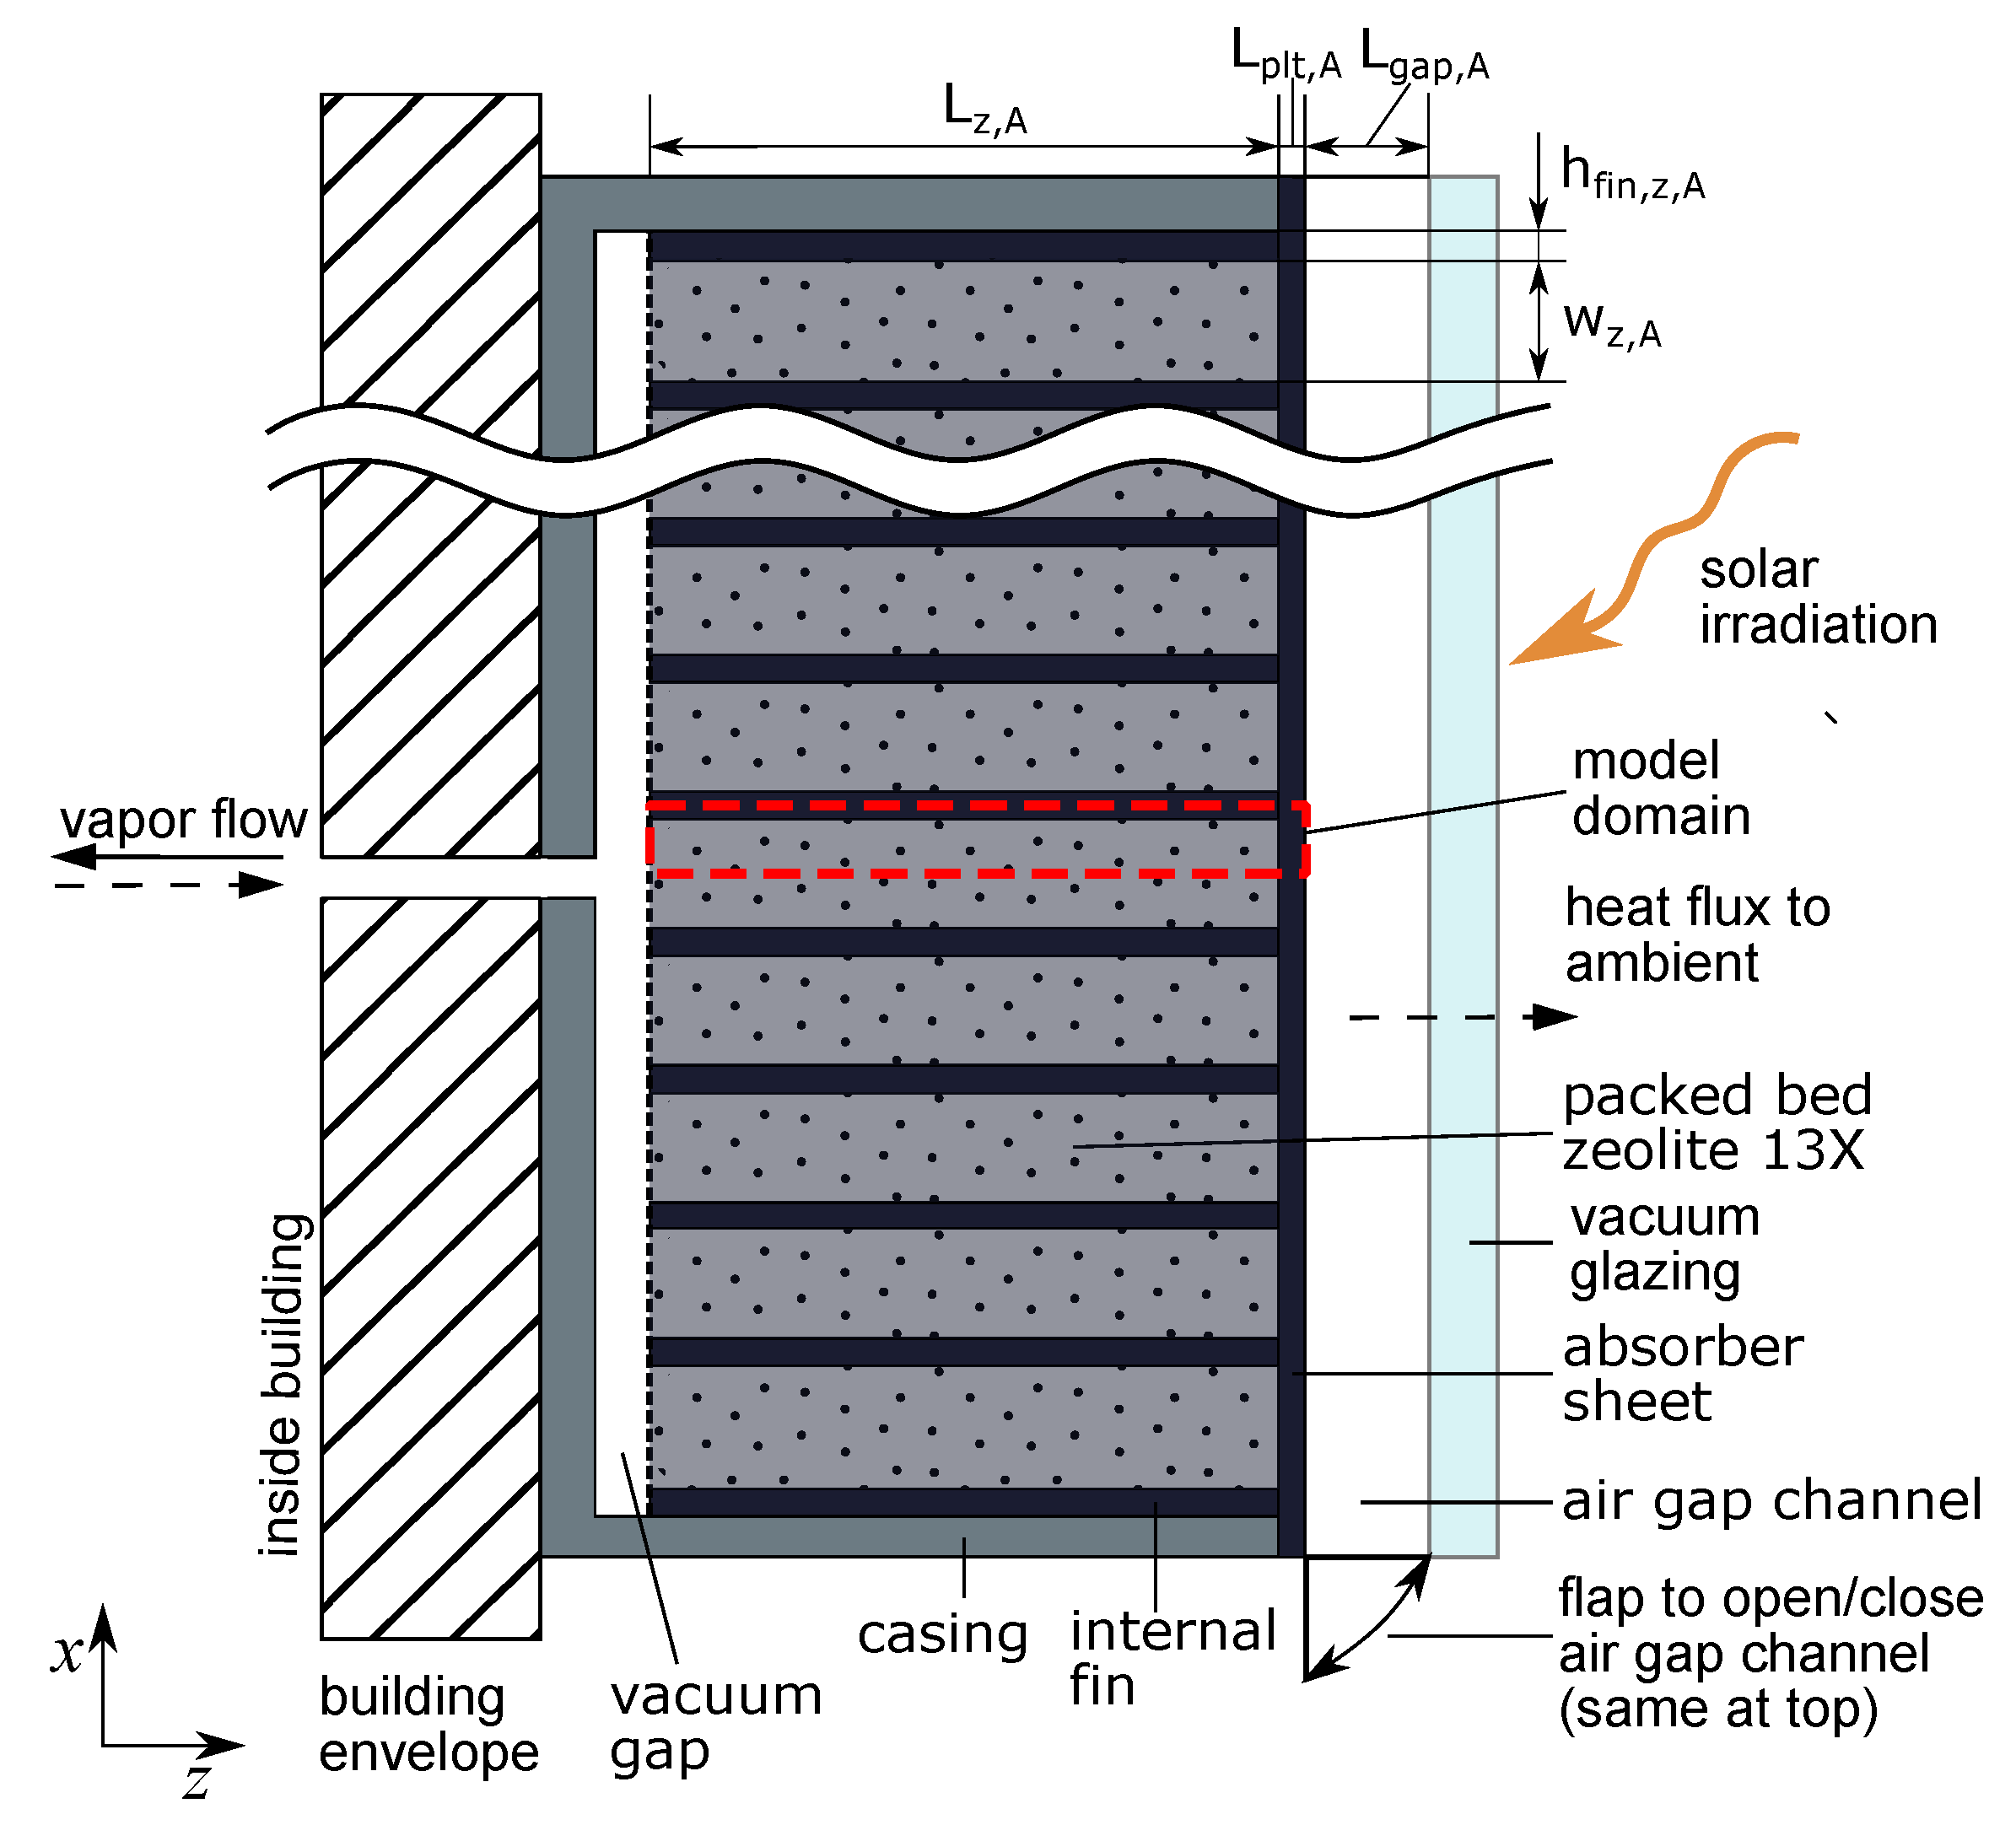
The design scheme and model domain of the adsorber is depicted in the cross-section side view in Figure 2. The panel-shaped adsorber is enclosed by a metal casing at the back and sides as well as by a metal absorber sheet at the outer face. The adsorber is attached vertically to a southeast facade of the building. The adsorber is filled with a granular adsorbent, while a wire mesh separates the adsorbent from the vacuum gap. Due to this gap, the backside of the adsorber is thermally well insulated towards the building’s envelope. This insulation is further secured by additional vacuum insulation panels on the back of the casing. The applied adsorption pair is granular zeolite 13X and water. Water vapor can flow in and out of the adsorber through a central in-/outlet at the back of the adsorber, assuming an instant and homogenous distribution of the vapor inside the vacuum gap. To overcome the heat transport limitations of the zeolite packed bed, metal fins are integrated. In order to efficiently absorb the solar irradiation during the regeneration phase, the outer adsorber face is covered by a metal absorber sheet as well as a vacuum glazing. Between the absorber sheet and the vacuum glazing, there is an air channel, which is closed by a flap during the regeneration phase, while it is open during the cooling phase to efficiently transfer the released heat of adsorption to the ambient by free air convection through the air gap channel. To enhance the heat release in the cooling phase, the absorber sheet is equipped with vertical metal fins in the air gap to increase the heat transfer surface (not depicted in Figure 2). Since geometry as well as boundary conditions are symmetrical and under the assumption that temperature variations over the absorber sheet are negligibly small, the examination can be reduced to the marked model domain. The geometry parameters of the reduced problem are noted in Figure 2.
The adsorber model is based on a model for the adsorbent bulk, previously developed and published by co-author Schaefer [32,33]. Here, the existing model is extended by the internal metal fins in the adsorbent bulk and the absorber sheet, including the absorber fins. The assumptions of the underlying model are discussed in detail in the aforementioned publication, and thus, they are only mentioned in brief here. The main assumptions, referring to the processes in the adsorbent bulk, are as follows:
  • The vapor is an ideal gas and viscous Newton-fluid;
  • Local thermal equilibrium is assumed;
  • Due to the low pressure, rarefaction effects in the mass and heat transport in the adsorbent bulk are considered;
  • The adsorption kinetics can be described by the linear-driving-force approximation;
  • The heat of adsorption depends on the water uptake;
  • The temperature dependencies of the material parameters (viscosity, heat capacity, density, etc.) are accounted for.
Following these assumptions, the balance equations for vapor mass and adsorbent energy as well as the mass balance for the adsorbed water are derived, yielding:
ε R s 1 T A ε R s p A T A 2 ρ b ε ρ b c z + X A c A ρ b Δ h A 0 0 1 · p A t T A t X A t = · m ˙ v , A · q ˙ A c p , v m ˙ v , A · T A k A X eq X A ,
where p A , T A and X A describe the local pressure, temperature and water uptake in the zeolite adsorbent bulk, the fluxes m ˙ v , A and q ˙ A denote the local vapor mass und heat flux, respectively, ε refers to the porosity of the adsorbent bulk, R s refers to the specific gas constant of the vapor, ρ b refers to the bulk density, c z , c a and c p , v refer to the specific heat capacities of the dry zeolite adsorbent, the adsorbate and the vapor, respectively, Δ h A refers to the heat of adsorption, k A refers to the adsorption kinetics parameter and X eq refers to the water uptake at equilibrium. Using the density of the dry zeolite adsorbent ρ z , the bulk density is calculated with ρ b = ( 1 ε ) ρ z . In [33], the values and equations of the parameters and material functions are given in detail.
The vapor mass flux m ˙ v , A and the heat flux q ˙ a must be specified to close the system of balance equations. Darcy’s law is locally applied for the vapor mass flux, which reads as follows:
m ˙ v , A = κ · ρ v μ v p A ,
where κ denotes the permeability tensor, ρ v denotes the density and μ v denotes the dynamic viscosity of the vapor.
To calculate the heat flux in the adsorbent bulk, Fourier’s law is applied:
q ˙ A = λ eff , A T A ,
where λ eff , A is the effective heat conductivity of the adsorbent bulk. For both the permeability and heat conductivity, so-called Knudsen correction factors are applied. These factors account for the rarefaction effects due to the low vapor pressure and are described by Schaefer in [32,33].
The model presented so far solely describes the processes in the adsorbent bulk. Therefore, the model has to be extended to include the heat transport in the metal fins and absorber sheet. As the applied extension is already presented by Schaefer et al. for another application in [34], only a short summary is given here. For the metal fins integrated into the adsorbent bulk, the one-dimensional transient heat equation [36] is applied, which reads as follows:
ρ fin , A c fin , A T fin , A t = λ fin , A 2 T fin , A z 2 + 2 h fin , z , A q ˙ fin , z , A ,
where T fin , A refers to the local fin temperature, averaged over the fin cross-section and ρ fin , A , c fin , A , λ fin , A and h fin , z , A denote the density, specific heat capacity, heat conductivity and the thickness of the metal fin, respectively. The heat exchange between metal fin and adsorbent bulk is given by the term q ˙ fin , z , A . Approximating the local temperature distribution over the cross-section of the fin by a parabolic function, this term yields:
q ˙ fin , z , A = 6 h fin , z , A λ fin , A T fin , z , A T fin , A ,
where T fin , z , A is the contact temperature between fin and zeolite.
Similar to the metal fins, the metallic absorber sheet is modeled by the two-dimensional transient heat equation [36]:
ρ sht , A c sht , A T sht , A t = λ sht , A 2 T sht , A z 2 + λ sht , A 2 T sht , A x 2 ,
where T sht , A is the local temperature in the adsorber sheet and ρ sht , A , c sht , A and λ sht , A denote the density, specific heat capacity and heat conductivity of the adsorber sheet, respectively. The thermal coupling of the sheet and the zeolite as well as of the internal metal fins and the zeolite is achieved by equating the heat fluxes at the surface, where the heat flux in the zeolite at the contact surfaces is calculated according to Fourier’s law from the local temperature gradient in the zeolite at the contact boundary.
Finally, the adsorber model has to be extended in order to incorporate the air gap channel, which can be opened or closed, as well as the vacuum glazing. This is achieved by applying the heat flux q ˙ sht , A , which depends on the operational phases, to the outer face of the absorber sheet. During the regeneration phase, the vacuum glazing and closed air gap channel act as a solar thermal collector. The efficiency η sol of such a collector is calculated by:
η sol = η 0 c 1 T sht , surf T amb + c 2 T sht , surf T amb 2 q ˙ sol ,
where η 0 refers to the optical efficiency, which is the maximum efficiency of the solar collector, c 1 to the linear loss factor, c 2 to the quadratic loss factor and q ˙ sol to the solar irradiation ([37], p. 356). The temperatures T sht , surf , A and T amb denote the temperature at the surface of the absorber sheet and the ambient temperature, respectively. Thus, the heat flux q ˙ sht , reg , A to the outer face of the absorber sheet during the regeneration phase reads as follows:
q ˙ sht , reg , A = q ˙ sol η sol .
During the cooling phase, the air gap channel is opened by the flaps to cool the absorber sheet by free convection. The optional external fins on the absorber sheet are not spatially resolved, but are considered applying the geometry factor Γ fin , A for the increased surface of the absorber sheet and η fin , A for the fin efficiency, which takes into account the non-uniform temperature distribution along the fin. Furthermore, the additional heat capacity added by the mass of the external fins is incorporated by increasing the effective heat capacity of the metal in the adsorber.
The heat flux q ˙ sht , cool , A , applied to the outer face of the absorber sheet during the cooling phase, is the heat flux released to the ambient by free convection and radiative emission reduced by the received solar irradiation. This yields:
q ˙ sht , cool , A = ϵ A σ SB ζ rad + α gap , A η fin , A Γ fin , A T amb T sht , surf , A + η 0 q ˙ sol ,
where ϵ A refers to the emissivity factor of the adsorber sheet, σ SB refers to the Stefan–Boltzmann constant and α gap , A refers to the convective heat transfer coefficient. The coefficient ζ rad is defined as:
ζ rad = T sht , surf , A 4 T amb 4 / T sht , surf , A T amb
and is introduced to pseudo-linearize the heat flux Equation (9).
The air gap channel is divided into several small channels formed by the absorber sheet, the external fins and the vacuum glazing. It is assumed that the convective heat transfer coefficient α gap , A between the metallic structures and the air flow inside the channels can be determined from correlations for free convection in a vertical heated tube from ([38], p. 703), applying the hydraulic diameter D H of the rectangular channel between the fins. It is distinguished between laminar and turbulent boundary layers depending on the Grashof number Gr S . For laminar boundary layers ( Gr S   <   1 ), the heat transfer coefficient is as follows:
α gap , A = Gr S Pr λ air 16 D H ,
where λ air denotes the heat conductivity of the air inside the channels. For turbulent boundary layers ( Gr S   >   1 ), the heat transfer coefficient is as follows:
α gap , A = 0.52 Gr S Pr 0.25 λ air D H .

2.2. Condenser

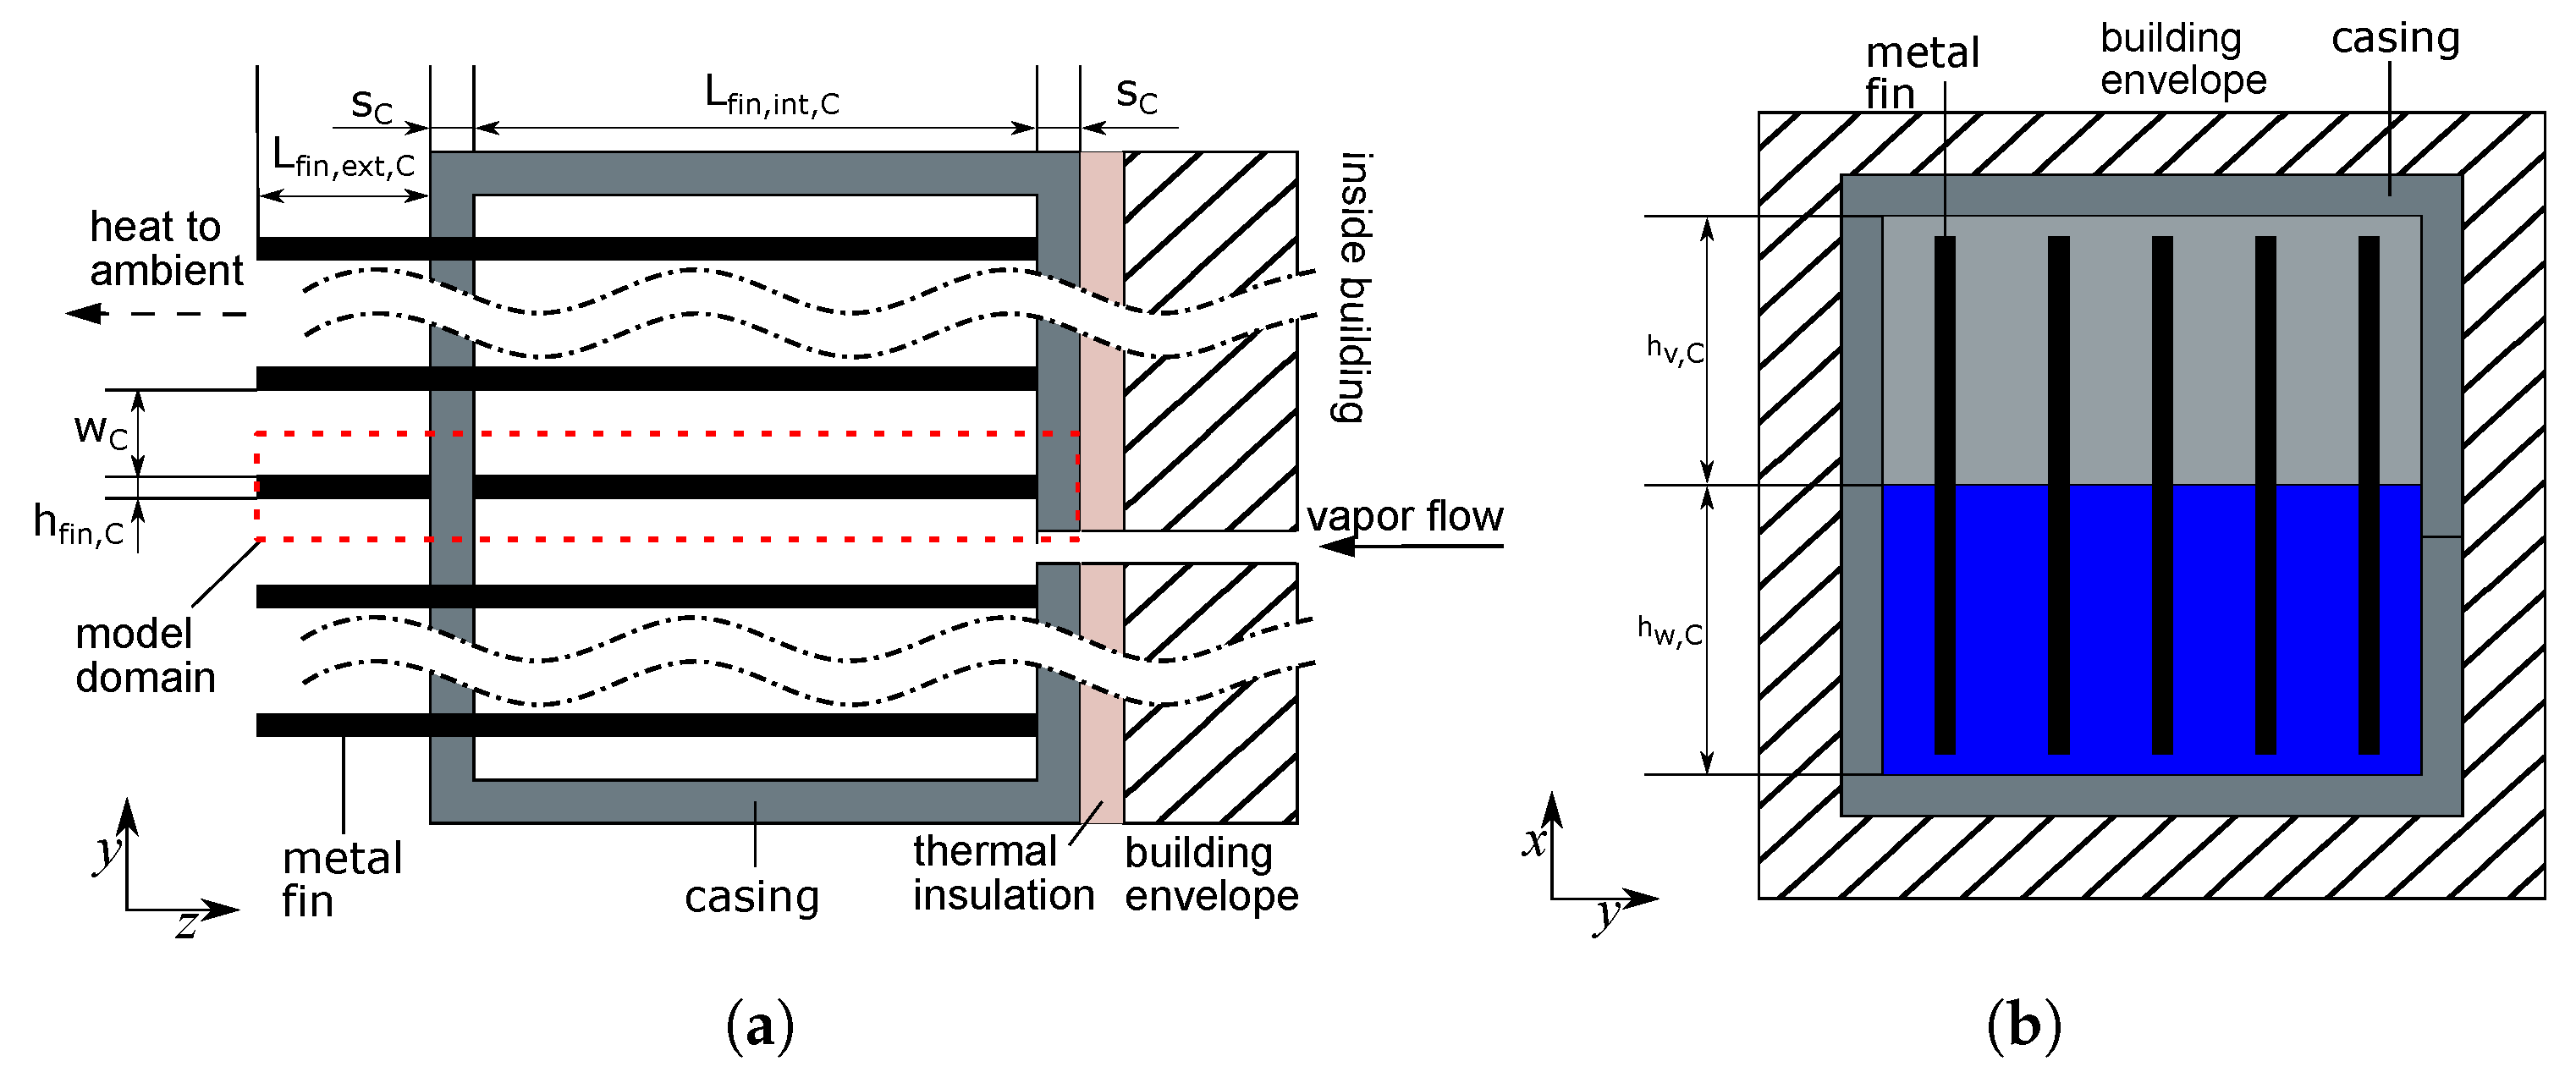
The design scheme and model domain of the condenser is depicted in Figure 3. Similar to the adsorber, the condenser is enclosed by a metal casing and is attached vertically to the northwest facade of the building. Internal metal fins are included to enhance heat transport to the ambient, and thus, improve the condensation rate. The backside of the condenser is thermally insulated, whereby the insulation is assumed ideal. In the regeneration phase, vapor flows from the adsorber into the condenser and condenses on the metal fins or the water surface, releasing the heat of condensation to the fins or the water, respectively. The heat is then conducted through the internal fins to the external fins, where it is emitted to the ambient air. Furthermore, the water phase is in direct contact to the outer wall and heat is being transferred to the ambient through the outer wall. Due to symmetry of geometry and boundary conditions, the model domain can be reduced to the marked area (red dashed box).
The developed model of the condenser describes the condensation and the heat transport processes in the metal structures under the following physical assumptions:
  • The energy and mass of the vapor are neglectable;
  • The vapor is an ideal gas;
  • The vapor is always saturated;
  • Incoming vapor fully condenses;
  • The water is incompressible;
  • Temperature variations in the condensed water are negligibly small, but natural convection is indirectly captured through correlations for the heat transfer;
  • Temperature variations in height direction of the walls are negligibly small;
  • Boundary effects of the top and bottom of the casing are neglected;
  • The temperature dependencies of the water (density, heat capacity, enthalpy of evaporation, etc.) are accounted for.
As it is assumed that incoming vapor fully condenses, the mass change of the condensed water m w , C is equal to modulus of the incoming vapor mass flow m ˙ v . The mass change is the sum of condensation on the metallic structures, where it is assumed that solely laminar film condensation m ˙ lfc takes place, and the condensation at the free water surface m ˙ s . Thus, the mass balance reads as follows:
d m w , C d t = m ˙ lfc + m ˙ s = m ˙ v .
Note that m ˙ v is negative during desorption according to Equation (26). The mass flow m ˙ lfc is calculated from the Nußelt theory of laminar film condensation [36,39] with the following physical assumptions:
  • The condensate film flow is always laminar and steady;
  • The surface temperatures of fins and walls are isotherm;
  • The vapor bulk is stagnant.
In case the mass flow m ˙ lfc exceeds the incoming vapor flow m ˙ v , the condensation at the water surface m ˙ s becomes negative, which means that evaporation takes place to maintain the state of saturation in the vapor phase. It is assumed that a water circulation inside the condenser occurs in this case, with water evaporating at the water surface and condensing again on the metallic fins and casing.
Due to the assumption of a homogenous water temperature, no spatial discretization of the water is required. Thus, the energy balance of the water yields:
m w , C c w d T w , C d t = i Q ˙ i + m ˙ v Δ h e + c p , v T v , A T w , C ,
where i Q ˙ i denotes the heat fluxes to the internal fins and casing and Δ h e the enthalpy of evaporation. The term c p , v T v , A T w , C accounts for the sensible heat of the vapor, which is coming in from the adsorber and is generally cooled to the temperature of the condenser. It is assumed that this sensible heat of the inflowing vapor is first transferred to the water phase before the vapor condenses.
Furthermore, the heat transport in the metallic fins and walls has to be modeled. This is achieved in a similar way as for the internal fins of the adsorber, applying the one-dimensional transient heat equation. For the fins, this is as follows:
ρ fin , C c fin , C T fin , C t = λ fin , C 2 T fin , C z 2 + 2 h fin , C q ˙ w / v / amb , fin , C ,
where T fin , C is the the local temperature, averaged over the fin cross-section, and ρ fin , C , c fin , C , λ fin , C and h fin , C are the density, specific heat capacity, heat conductivity and the thickness of the metal fin, respectively. The heat transfer from the water or vapor to the internal fins as well as from the external fins to the ambient air is q ˙ w / v / amb , fin , C . This coupling term is derived by approximating the local temperature distribution over the cross-section of the fin, applying a parabolic function. Determining the temperature gradient from the parabolic temperature profile at the fin surface and evaluating Fourier’s law, the coupling heat flux term reads as follows:
q ˙ w / v / amb , fin , C = 6 h fin , C λ fin , C T w / v / amb , fin , C T fin , C ,
where T w / v / amb , fin , C denotes the contact temperature between the fin and the water, vapor or ambient air. The contact temperatures are determined by equating the heat fluxes at the internal boundaries.
The heat transport inside the casing is modeled with the same approach, but the local temperature distribution over the cross-section of the casing is approximated by a piecewise linear function instead of a parabolic function. Moreover, the fins and the casing are thermally coupled by equating the heat fluxes at the contact surface. For better readability, the heat transfer equations are only given for the fins in the following. Yet, the given equations are also valid for the casing.
The heat transfer between the metallic structures and the water or vapor phase, respectively, is modeled with:
q ˙ w / v , fin , C = α ¯ lfc / w , mtl T w / v , C T w / v , fin , C ,
where α ¯ lfc / w , mtl is the heat transfer coefficient and T w / v , fin , C is the contact temperature for the respective contact surface. In the case of contact with the vapor phase, the Nußelt theory of laminar film condensation [39] is applied to model the heat transfer and the heat transfer coefficient α ¯ lfc , mtl , averaged over the whole fin area, is calculated from:
α ¯ lfc , mtl = 0.943 Δ h e λ w 3 g ρ w ρ v T w , C T v , fin , C ν w h v , C ,
where λ w refers to the heat conductivity of liquid water, g refers to the gravitational acceleration, ρ w refers to the density of liquid water, ρ v refers to the density of vapor, T w , C refers to the temperature of the water in the condenser, which equals the saturation temperature, and T v , fin , C refers to the contact temperature of vapor and fin. The variable ν w is the kinematic viscosity of the water and h v , C is the height of the vapor phase.
In the case of contact with the water phase, the heat transfer is modeled, assuming free convection inside the water phase and the heat transfer coefficient is estimated with an empirical equation given in the VDI Heat Atlas ([38], p. 675):
α ¯ w , mtl = 0.42 Pr 0.012 Ra 0.25 h w , C l 0.25 λ w 0.5 w C ,
where Pr denotes the Prandtl number, Ra denotes the Rayleigh number, h w , C denotes the height of the water phase inside the condenser and w C denotes the distance between the fins.
Finally, the heat transfer from the external fins and casing to the ambient air has to be modeled. Here, both convective heat transfer and thermal radiation are considered:
q ˙ amb , fin , C = α amb , C T amb , fin , C T amb + σ SB ε C T amb , fin , C 4 T amb 4 .
The convective heat transfer coefficient α amb , C is approximated conservatively by a constant value of 4 W / ( m 2 K ) , which is an averaged value for the expected temperature ranges and geometry parameters applying the procedure for free convection of external flows at vertical surfaces described in the VDI Heat Atlas ([38], p. 667). As the external heat transfer is very sensitive to the fluctuating wind conditions, it is not necessary to apply a precise correlation function, which is only valid for steady conditions. Moreover, this might give a wrong impression on the model accuracy of the aspect. The radiative emissivity ε C is set to 0.8 . Note that the second term in Equation (20), which accounts for thermal radiation, is not applied to the external fin areas, which are opposite of each other, assuming that they mainly radiate on each other rather than into the ambient. Only the radiation from the base surface of the condenser is taken into the account.

2.3. Evaporator

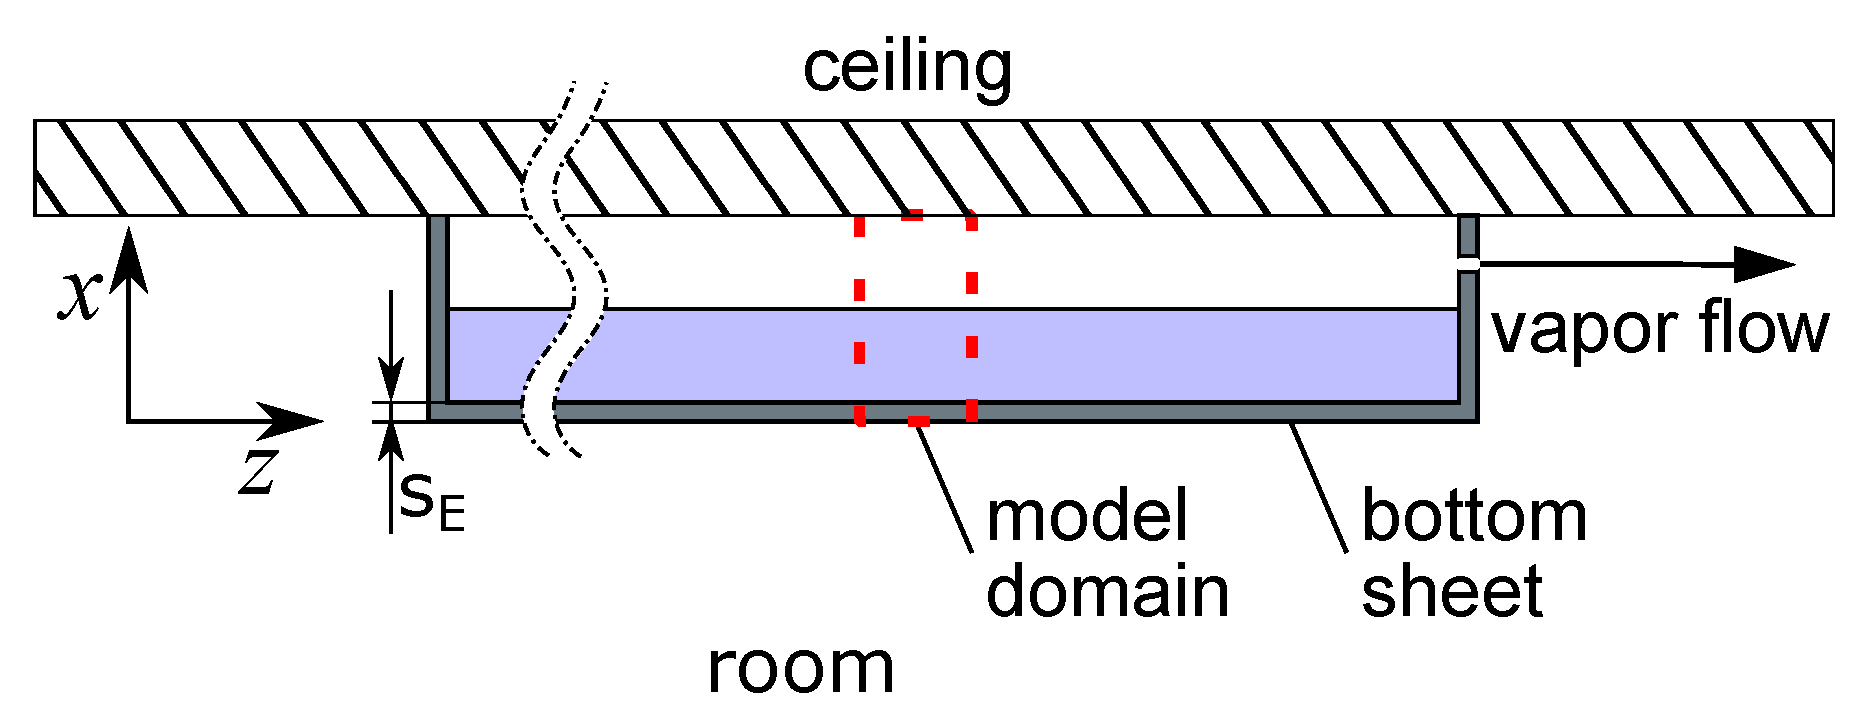
The design scheme and model domain of the evaporator is shown in Figure 4. The evaporator is also enclosed by a metal casing and is installed inside the building as a cooling ceiling. The applied box-shaped configuration is a very simple configuration, chosen in this work to determine the potential of the system with respect to the cooling rate. Nevertheless, more complex solutions such as pipe coils or active ventilation are possible and could be investigated with slight modifications to the evaporator model presented in the following. Vapor is extracted from the evaporator by the adsorption in the adsorber during the cooling phase, which reduces the pressure in the evaporator. Thus, evaporation is induced and the remaining water is cooled due to extracted heat of evaporation. The water then cools the metallic bottom sheet of the evaporator, which is in direct contact with the air inside the room. The model domain can be limited to the depicted section (red dashed box) as the horizontal dependency of the surface temperature of the bottom metal casing can be neglected.
For the water, the mass and energy balance equations are evaluated, applying the following assumptions:
  • Energy and mass of the vapor phase are neglectable;
  • The vapor is an ideal gas;
  • The water is incompressible;
  • Vapor pressure in the evaporator is assumed to be equal to saturation pressure;
  • Outflowing vapor instantly evaporates;
  • The temperature dependencies of the water (density, heat capacity, enthalpy of evaporation, etc.) are accounted for.
As the mass of the vapor phase is neglected, the change of water mass inside the evaporator m w , E is determined by the vapor mass flux to the adsorber:
d m w , E d t = m ˙ v .
It is assumed that the natural convection in the water phase can be approximated by Rayleigh–Benard convection. The energy balance for the water phase in the evaporator yields:
m w , E c w d T w , E d t = A E α ¯ w , E T w , mtl , E T w , E m ˙ v Δ h e ,
where A E refers to the contact area between water phase and bottom sheet. The contact temperature T w , mtl , E is calculated by evaluating the heat fluxes at the surface between water and the metal bottom sheet. The heat transfer coefficient α ¯ w , E between the bottom sheet and the water phase is determined by applying empirical correlations given in the VDI Heat Atlas ([38], p. 674), where it is distinguished between laminar and turbulent boundary layers depending on the Rayleigh number Ra . For laminar boundary layers ( Ra < 2.2 × 10 4 ), the heat transfer coefficient is as follows:
α ¯ w , E = λ w 0.208 Ra 0.25 h w , E ,
where h w , E denotes the height of the water phase. For turbulent boundary layers ( Ra > 2.2 × 10 4 ), the heat transfer coefficient is as follows:
α ¯ w , E = λ w 0.092 Ra 0.33 h w , E .
In order to calculate the temperature change inside the metallic bottom of the evaporator, the one-dimensional heat conduction in x-direction is modeled. This yields:
m mtl , E c mtl , E d T mtl , E d t = A E α r , E T r T r , mtl , E α w , E T w , mtl , E T w , E ,
where ρ mtl , E , c mtl , E and s mtl , E are the density, specific heat capacity and thickness of the metallic bottom sheet, respectively. Again, the contact temperature T r , mtl , E is determined by equating the heat fluxes at the surface between the bottom sheet and the air inside the room. The temperature of the room T r is set to a constant value of 23   ° C . The heat transfer coefficient α r , E between the bottom sheet and the air is assumed to a constant value of 7   W / ( m 2 K ) , which is a conservative estimation and accounts for both convective heat exchange and radiation. No correlation is applied as α r , E depends on many parameters, such as ventilation of the room. Here, in contrast to the adsorber and condenser model, heat radiation is not directly modeled, since the surface temperatures inside the room are unknown, but is included indirectly in the heat transfer coefficient.

2.4. Coupling and Boundary Conditions

The three components are connected by pipes and the distinct component models are coupled through the mass flows of vapor or water. The vapor flow m ˙ v between adsorber and condenser or evaporator, respectively, is determined by the ad-/desorption rate inside the adsorber:
m ˙ v = m z d X A ¯ d t ,
where m z denotes the mass of the dry zeolite in the adsorber and X A ¯ denotes the spatially averaged water uptake of the adsorber. During desorption, the water uptake decreases and m ˙ v becomes negative. The vapor flows out of the adsorber and into the condenser. During adsorption, the water uptake increases and m ˙ v becomes positive, accordingly. The vapor flows out of the evaporator and into the adsorber. Furthermore, the adsorber model is coupled to the other component models through the pressure. The outlet pressure at the adsorber is set to the pressure of the condenser in the regeneration phase and the inlet pressure of the adsorber is set to the pressure of the evaporator in the cooling phase.
As the cooling demand increases with ambient temperatures and solar irradiation, a representative day in summer for a site in Stuttgart, Germany, where the proposed adsorption system will be realized within the CRC 1244 [4], is chosen. The 26th of August in 2016 is identified as such a day and is defined as the reference day for the simulation study. The respective hourly values for ambient temperature and solar radiation are taken from the database PVGIS-SARAH of the Photovoltaic Geographical Information System [40,41]. The azimuth angle of the vertical adsorber facade is 45 ° (south-east). In Figure 5, the time curves of the applied ambient conditions are given. For the solar collector efficiency η sol , an evacuated flat plate collector [42] and a flat plate collector [43] are chosen. In addition, the average between the two is calculated and used as third case. The coefficients for efficiency Equation (7) are given in Table 2. Furthermore, the temperature T r of the room to be cooled is assumed to a constant value of 23   ° C . This allows for a more general examination of the proposed adsorption cooling system, independent of specific room and building conditions.

2.5. Operating Phases and Switching Criteria

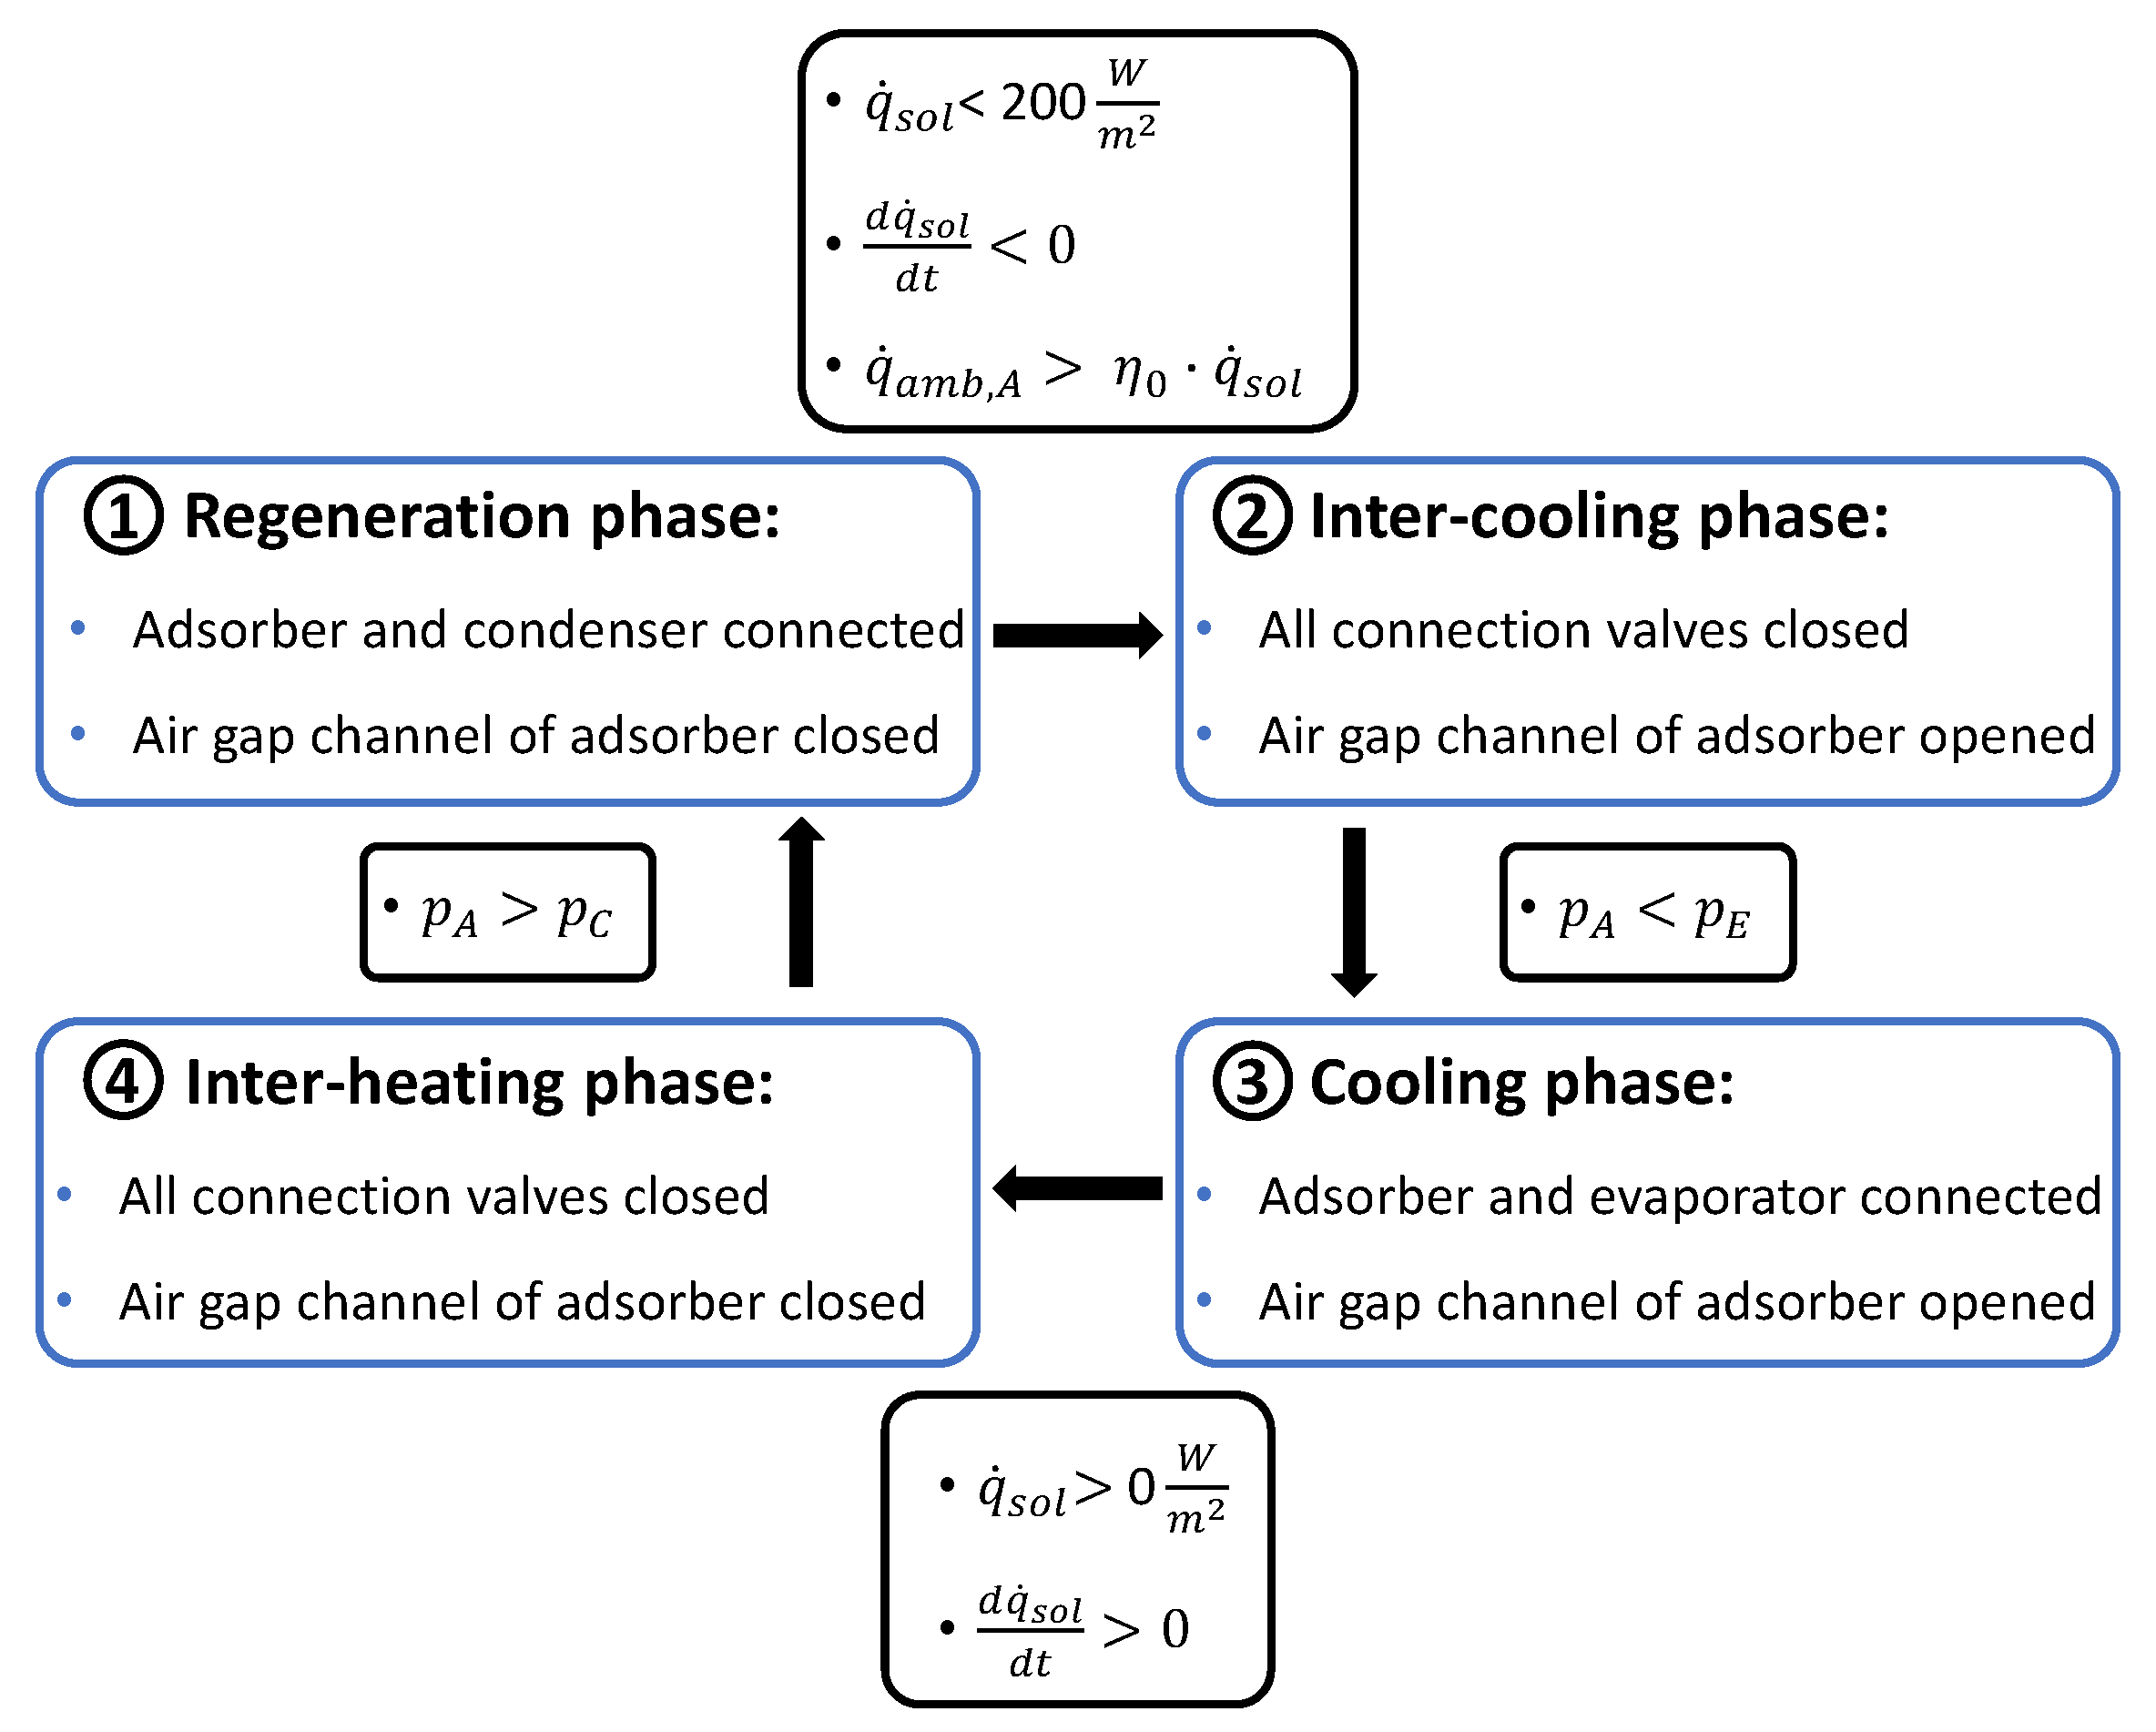
The adsorption cooling system runs through four operational phase, which differ regarding the opening or closing of the connecting pipes and the air gap channel of the adsorber, see Figure 2. The operational phases and the corresponding switching criteria are depicted in Figure 6. The switching criteria depend on the solar irradiation and the pressures in the three components.
1. Regeneration phase: In this phase, the water uptake of the adsorber is reduced. This is realized by heating up the adsorber with solar irradiation and opening the connection between adsorber and condenser, so that the released vapor can flow to the condenser and condense. The air channel is closed in this case to facilitate the heat-up of the adsorber. The outlet pressure of the adsorber corresponds to the saturation pressure in the condenser, which strongly effects the desorption rate. Low pressures are beneficial as the water uptake at equilibrium decreases with decreasing pressure. Therefore, an efficient cooling of the condenser is required.
The regeneration phase takes place while the solar radiation q ˙ sol shines on the adsorber and lasts until q ˙ sol decreases below 200   W / m 2 due to the course of the sun. For lower values of q ˙ sol , the rate of desorption becomes small as the adsorber is almost not heated up further. Furthermore, the longer the regeneration phase continues, the later the cooling phase starts. Thus, the end of the regeneration phase strongly depends on the compass orientation of the facade. Alternatively, the facade can be shaded actively. The second switching criteria regarding the negative slope of the solar irradiation is necessary to avoid switching to the cooling phase in the early morning hours when q ˙ sol is still below 200   W / m 2 . Furthermore, switching should only take place if the adsorber can be effectively cooled by opening the air channel. This is ensured by applying the third switching criteria, which evaluates if the emitted heat flux with an opened air channel exceeds the incoming solar irradiation, reduced by the optical losses of the solar collector.
2. Inter-cooling phase: At the end of the regeneration phase the pressure inside the adsorber, which is almost equal to that of the condenser, is above the pressure inside the evaporator due to a higher temperature of the condenser. Thus, immediately connecting the adsorber with the evaporator would lead to a vapor flow from the adsorber into the evaporator and heat up the evaporator, which is contrary to the intention during the cooling phase. Therefore, it is necessary to reduce the pressure inside the adsorber first by closing all connecting pipes and opening the air channel. Then, the adsorber cools down and the remaining vapor inside the adsorber is re-adsorbed, which reduces the pressure. Once the pressure is equal to or lower than the pressure of the evaporator, the system can switch to the cooling phase.
3. Cooling phase: In this phase, the room is cooled by evaporating water in the evaporator. Therefore, the connection between evaporator and adsorber is opened, so that the vapor can be adsorbed, which leads to continous evaporation. This also means that the inlet pressure at the adsorber is determined by the pressure inside the evaporator. However, a control valve, which allows for the reduction of the adsorber inlet pressure, is considered to control the temperature, and thus, the cooling power of the evaporator. The details of the control are explained in the next Section 2.6. Again, the vapor flow is determined from the adsorption rate in the adsorber, refer to Equation (26). This rate can be increased by improving the cooling of the adsorber, as the water uptake at equilibrium increases with decreasing temperatures. Thus, the air channel is opened. The cooling phase is active until the solar radiation increases again in the early morning hours. The second switching criteria regarding the positive slope of the solar irradiation is necessary to avoid switching to the regeneration phase in the afternoon hours when q ˙ sol is below 200   W / m 2 , but still exceeds 0   W / m 2 .
4. Inter-heating phase: At the end of the cooling phase, the pressure inside the adsorber is below that of the condenser, which would lead to vapor flowing from the condenser to the adsorber if the regeneration phase would start immediately after the cooling phase. Therefore, the pressure inside the adsorber must first increase, which is achieved by closing all valves in the connecting pipes and also the air channel. Through the solar irradiation the adsorber is heated up and a relatively small amount of water is desorbed, which increases the pressure. Once the pressure is equal to or higher than the pressure of the condenser, the system can switch to the regeneration phase.
Note that the adsorber can only be connected to either the condenser or the evaporator at the same time, as adsorption and desorption cannot take place at the same time. To close the internal water cycle, liquid water is pumped from the condenser into the evaporator in the early morning hours to compensate for the water, which has been transferred from the evaporator to the condenser via the adsorber. This pumping procedure is considered to require only a short time compared to the described phases and is conducted at the end of the inter-heating phase.

2.6. Cooling Power Control

The evaporation rate, and consequently, the cooling power of the evaporator, can be controlled by a control valve, which reduces the inlet pressure of the adsorber. If no control is applied, the inlet pressure is equal to the saturation pressure of the evaporator. The reduced inlet pressure leads to a lower water uptake at equilibrium, consequently limiting the adsorption rate, and thus, the vapor mass flow from the evaporator to the adsorber, which is equal to the evaporation rate in the evaporator. The prime objective of this control is to avoid temperatures in the evaporator below 15   ° C to prevent condensation of the air moisture at the cooling ceiling inside the room. The implemented control algorithm is a modification of the control developed in [32]. The controller equation reads as follows:
p in , A t = min p E t ; K 1 , 2 T E t T set , E .
The first argument of the minimum function describes the pressure change of the evaporator and the second argument defines a temperature proportional control. If the temperature of the evaporator is higher than the set point temperature T set , E , the first term of the equation ensures that the inlet pressure of the adsorber equals the pressure of the evaporator to achieve maximum adsorption rates. As soon as the temperature drops below the set point, the temperature regulated controller applies and limits the inlet pressure of the adsorber. A value of K 1 , 2 = 10   Pa / ( s K ) is identified as a suitable parameter value.

3. Numerical Implementation

The model of the adsorption cooling system, consisting of the presented models of the three components adsorber, condenser and evaporator, is implemented in MATLAB R2020a to conduct numerical simulations and solved in a similar manner as described in the previous study of co-author Schaefer [32], applying the finite-difference method. In general, the spatial derivatives are approximated by the central difference approximation. Only at the boundaries, e.g., the contact surface of zeolite and internal fins in the adsorber, the temperature derivatives normal to the boundary are approximated by one-sided finite-difference approximations. The Matlab solver ode15s is applied for the time integration of the spatially discretized differential equation system. As the three components are only coupled by the vapor mass flow m ˙ v , the system of equations for each component can be solved separately per time step. Finally, more details on the numerical implementation as well as the model validation can be found in [32].

4. Results and Discussion

4.1. Simulation Case Set-Up and Procedure

To gain a better understanding of the system behavior and to identify the optimization potential, multiple cases are simulated. At first, a defined reference case is thoroughly studied. The surface area of the three components adsorber, condenser and evaporator is assumed quadratic and is set to 1 m 2 . All applied geometry parameters are summarized in Table 3. Subsequently, a broad parametric study is conducted, varying only one parameter at a time while all other parameters are set to the reference case values. Finally, two cases with high cooling potential are identified from the results of the parametric study and are investigated in detail.
For the initial conditions, which are summarized in Table 4, it is assumed that the initial water uptake of the adsorber is at its maximum. The initial temperatures are defined as they would appear after a downtime of the system. For the evaporator and the condenser, the pressure equals the respective saturation pressure. For the adsorber, the pressure of the condenser is applied initially as the operation starts with connected adsorber and condenser. These initial conditions are applied to all simulated cases.
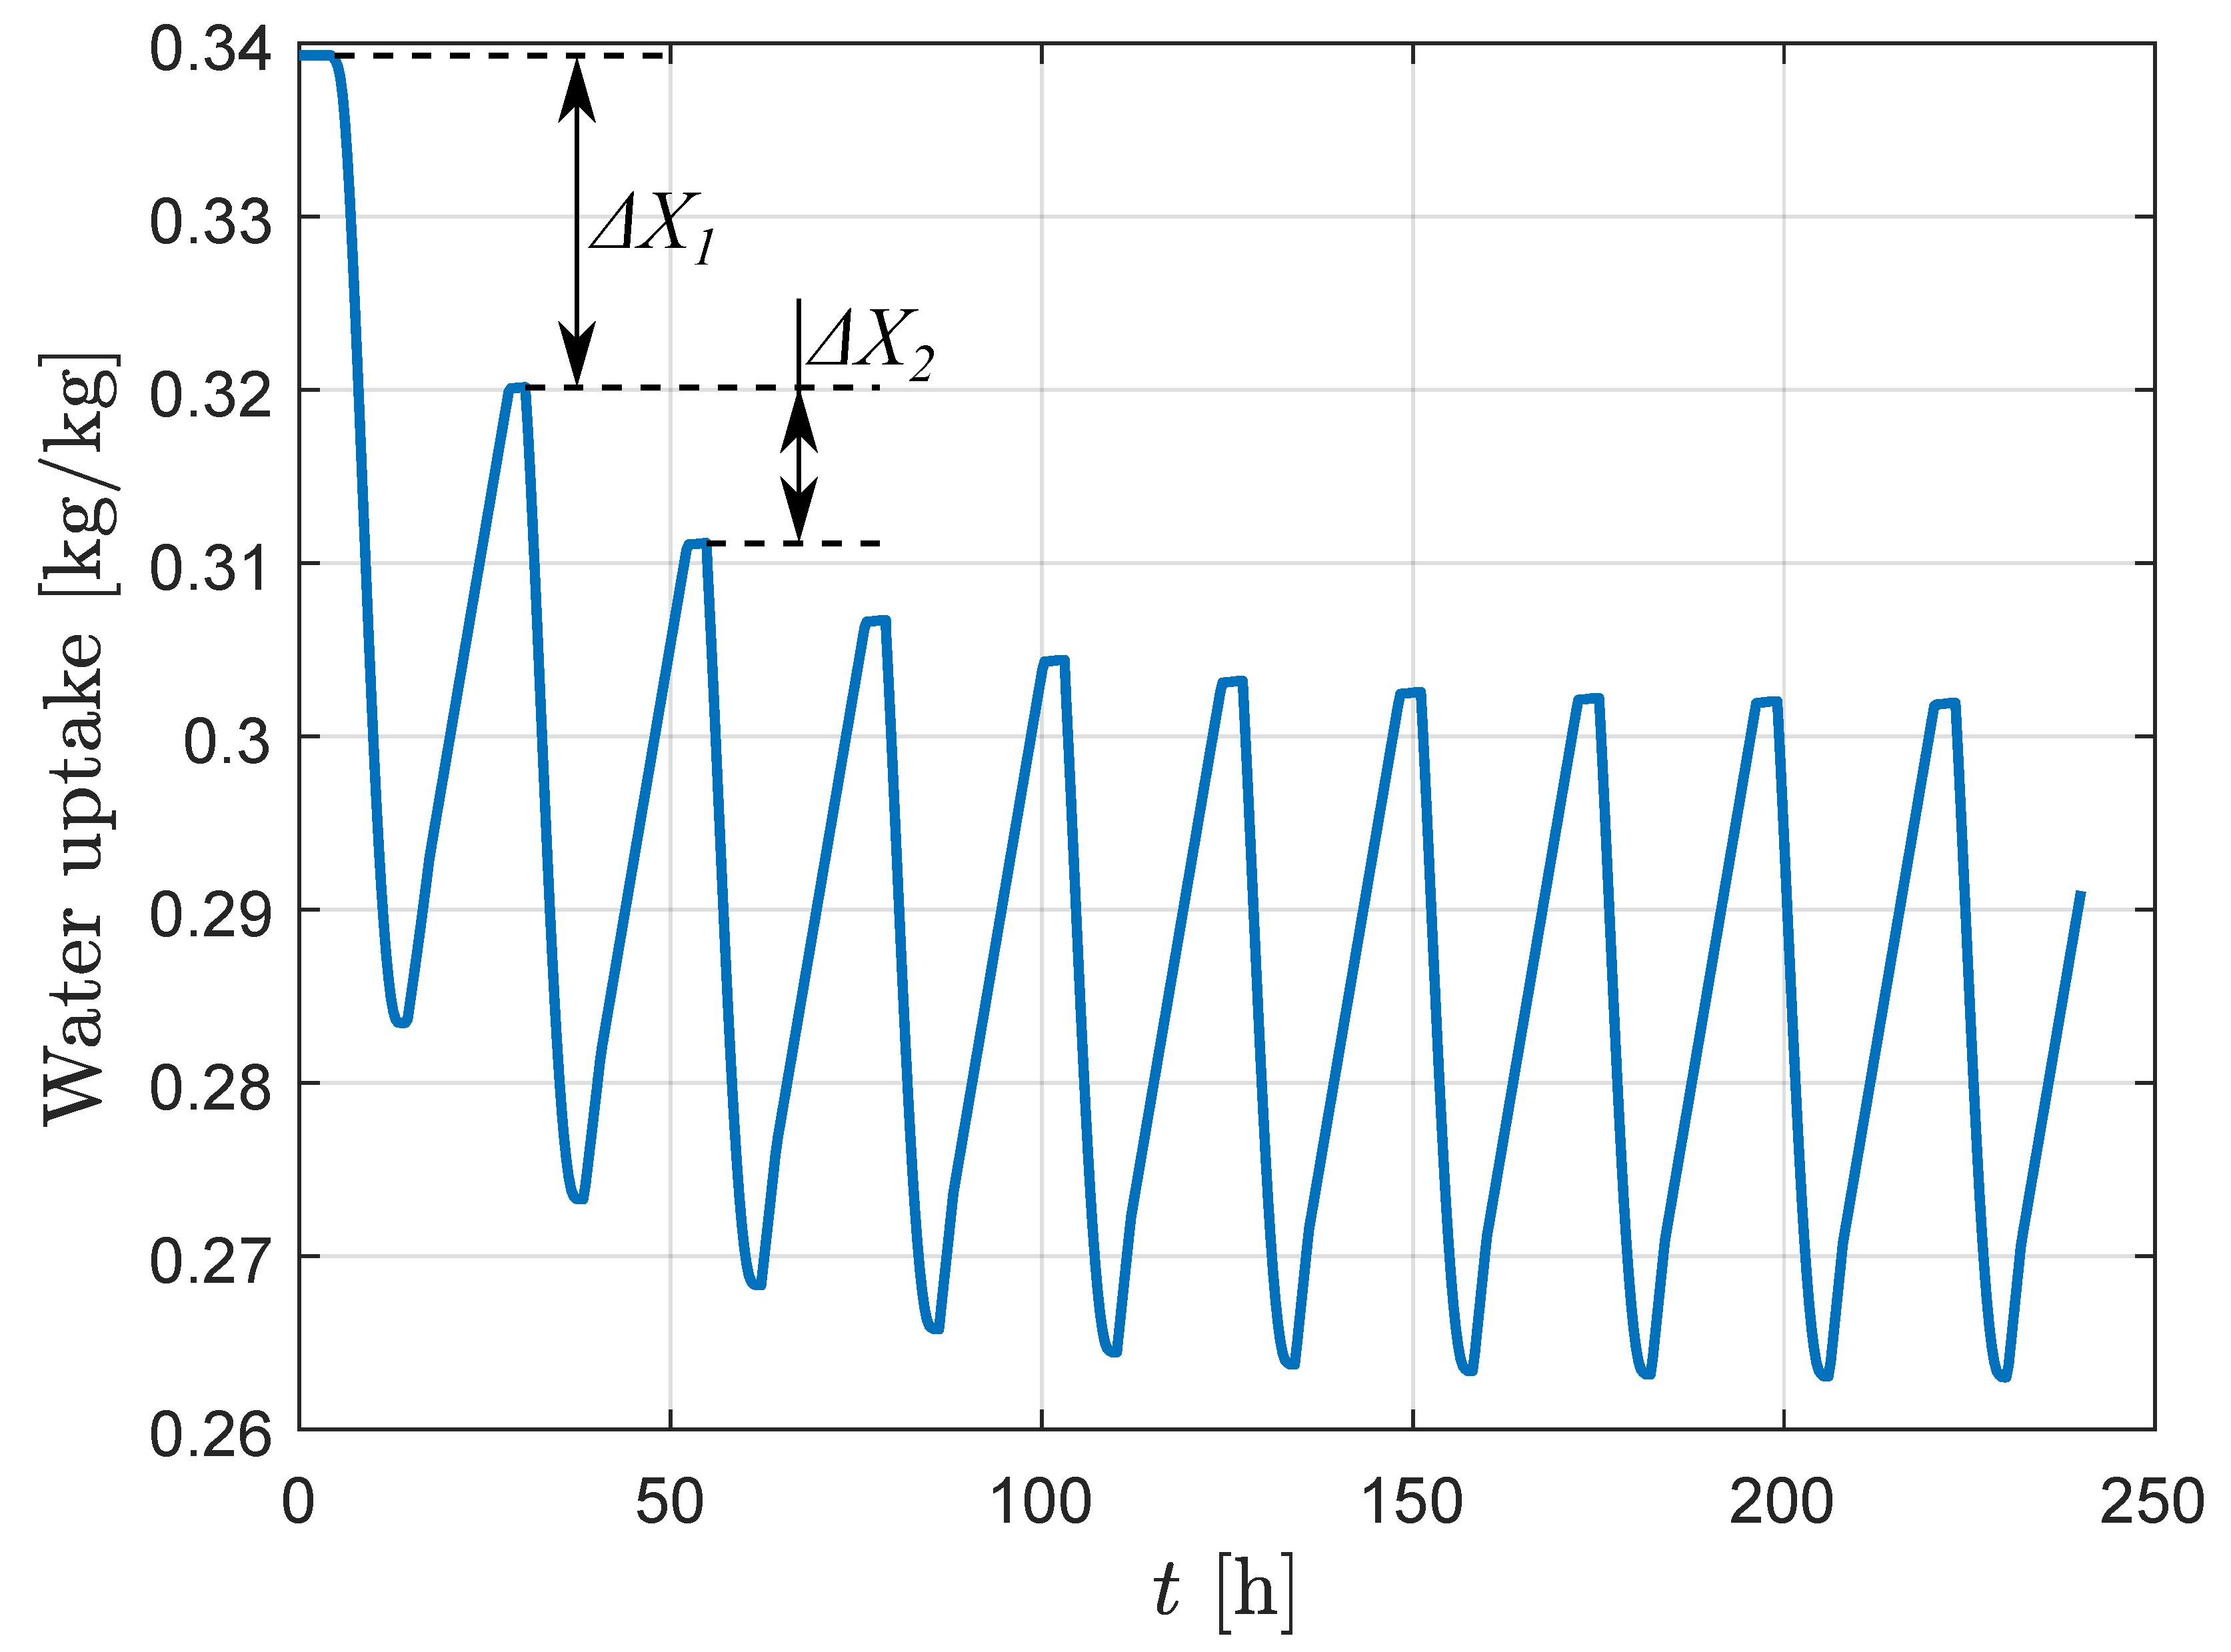
As the system generally does not reach dynamic equilibrium after 24 h with the chosen boundary and initial conditions, up to 10 consecutive days with identical boundary conditions regarding ambient temperature and solar radiation are simulated to ensure that the dynamic equilibrium for the analyzed day is reached. Through this procedure, the system’s characteristic cooling performance for a specific day can be achieved, independent of the stochastic daily fluctiations of the weather and solar irradiation around the examined day. To evaluate whether the dynamic equilibrium has been reached, the change of the maximum value of the water uptake between consecutive days is analyzed as shown in Figure 7. If the difference Δ X i between two consecutive days is below 1% of the initial water uptake, it is justified to assume that the dynamic equilibrium has been reached. For the reference case, the dynamic equilibrium is already reached after five days. In the following sections, the simulation results achieved for the 9th and 10th consecutive simulation day are shown, and thus, the dynamic equilibrium is reached in all presented cases.

4.2. Reference Case

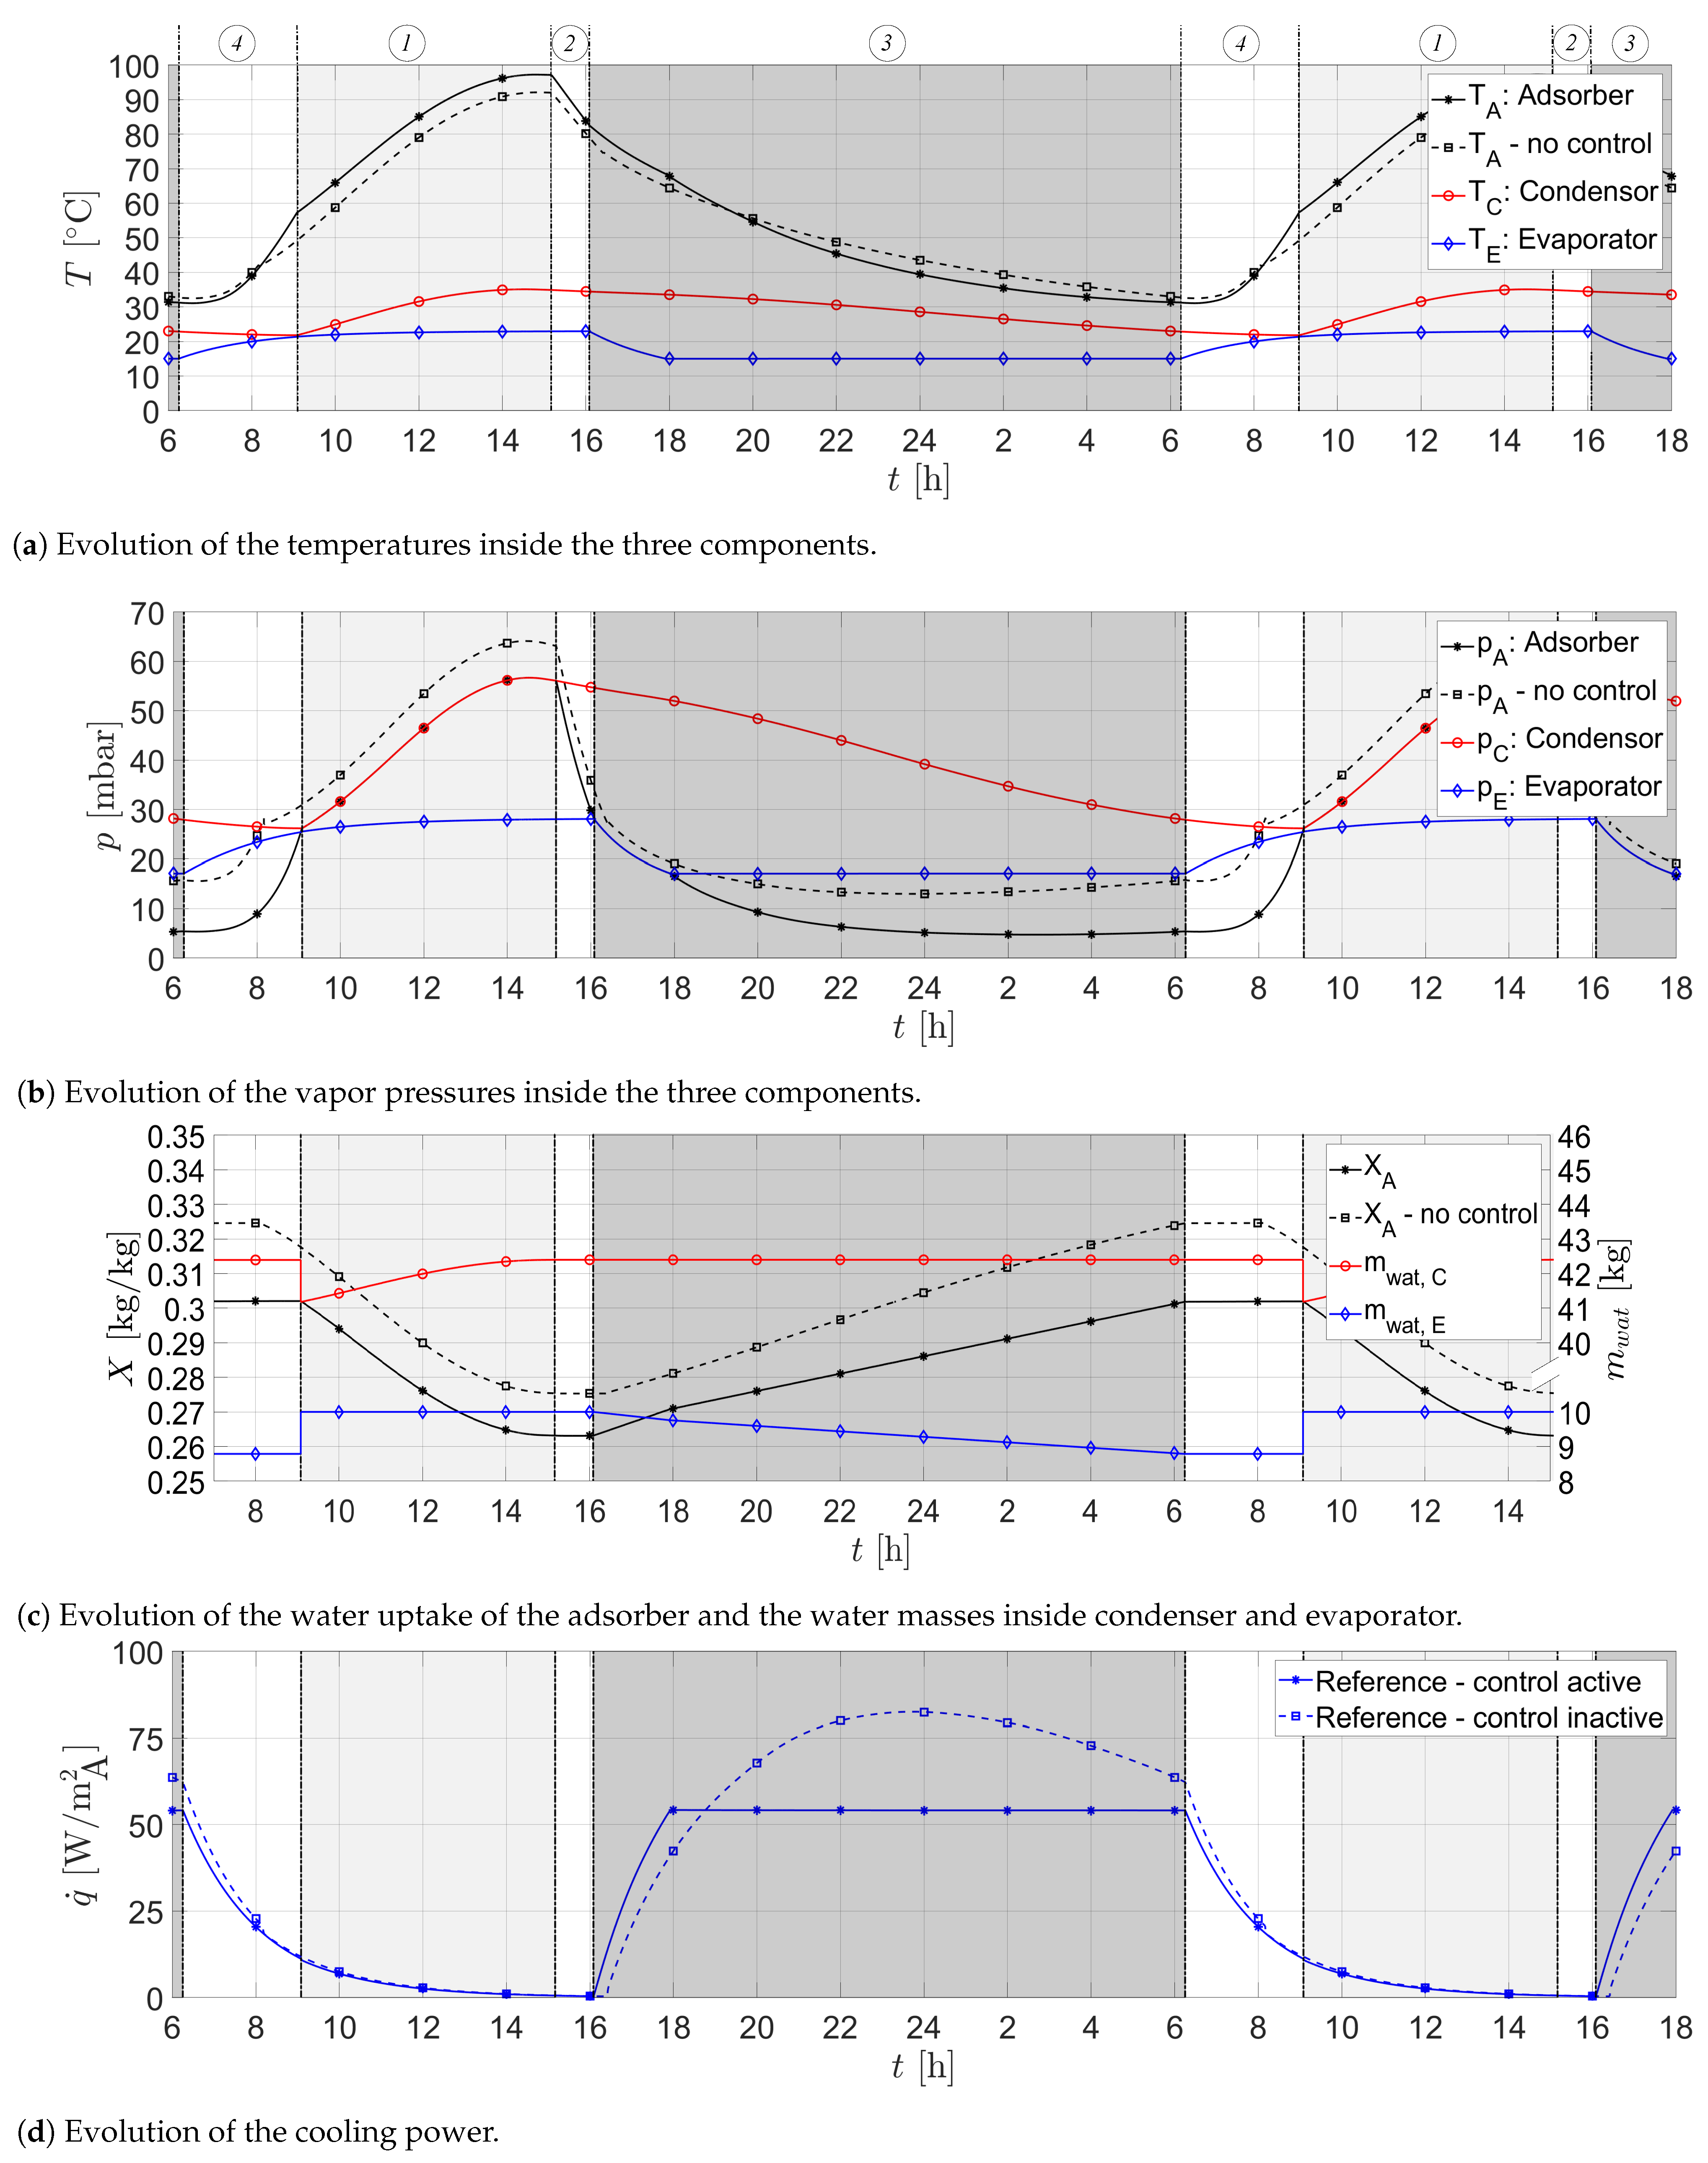
At first, the simulation of the reference case is carried out to gain a deeper understanding of the system behavior. The evolution curves of temperatures, vapor pressures, water uptake and water masses of the three components adsorber, condenser and evaporator as well as the achieved cooling power over time for the reference case are shown in Figure 8. For the adsorber, the presented values correspond to the mean values of the zeolite temperature and the vapor pressure in the adsorbent bulk. Additionally, a simulation with the same parameters as for the reference, but without the temperature control of the evaporator presented in Section 2.6, is conducted and the results for the adsorber in this case are depicted with dashed lines. The results of the uncontrolled case are discussed at the end of this section.
The regeneration phase ➀ is shaded light gray and the cooling phase ➂ is shaded dark gray in Figure 8. For the reference case, it is found that the regeneration phase lasts from 9:05 a.m. until 3:10 p.m. (t = 15.17 h) and the cooling phase from 4:05 p.m. (t = 16.08 h) until 6:20 a.m. the next morning, with an inter-cooling phase ➁ of 45 min and an inter-heating phase ➃ of almost 3 h in between.
During the inter-heating phase, the temperature T A inside the adsorber increases from its minimum of 31   ° C to 57   ° C due to solar irradiation and further increases to its maximum of 97   ° C at the end of the regeneration phase. The fastest changes for the temperature inside the adsorber occur during the intermediate phases with closed adsorber valves, as there is almost no change in water uptake, and thus, neither the heating up is slowed down by desorption nor cooling down by adsorption. Hence, at the switching from intermediate phase to regeneration phase or cooling phase, respectively, the slope of the temperature evolution changes as desorption and adsorption process are initiated. The temperature T C of the water inside the condenser increases from its minimum of 22   ° C to its maximum of 35   ° C during the regeneration phase due to the release of condensation enthalpy. During the other three operational phases, the condenser is continously cooled down by heat exchange with the environment. For the temperature T E of the water inside the evaporator, the simulation yields that the temperature decreases at the beginning of the cooling phase for almost 2 h down to its minimum of 15 ° C , which equals the set point temperature of the applied controller. This temperature can be maintained until the end of the cooling phase. Since the adsorption rate is actively limited after 6p.m. (t = 18 h) by the controller, the temperature T A declines faster. After the cooling phase, the evaporator is slowly being heated up by the continued heat flux from the room to the evaporator until the room temperature of 23   ° C is reached again.
The vapor pressures inside the condenser T C and inside the evaporator T E follow the course of the corresponding component temperature as the pressures always equal the saturation pressure, see Figure 8b. The necessity for the inter-heating phase with closed adsorber becomes clear from this figure. At the beginning of the inter-heating phase, the adsorber pressure is significantly lower than the condenser pressure and the vapor would flow from the condenser to the adsorber if the connection would be opened immerdiately. Therefore, the adsorber pressure is elevated fast in this phase by desorption of a small amount of water vapor, while keeping the adsorber valves closed. During the regeneration phase, the vapor pressure at the adsorber outlet is defined by the condenser pressure p C . As the mean adsorber pressure is almost identical with the condenser pressure, the vapor mass transport limitations in the adsorber are negligible. This is expected due to the short length L z , A of the zeolite bed. At the end of the regeneration phase, the adsorber pressure is substantially higher than the evaporator pressure. Therefore, the inter-cooling phase is required, in which the adsorber pressure is reduced by re-adsorption of the remaining vapor in the closed adsorber. At the beginning of the cooling phase (t = 16.08 h), the adsorber pressure follows the evaporator pressure, since the adsorber inlet pressure is set to the evaporator pressure. At 6p.m. (t = 18 h), the set point temperature of the controller is reached and the inlet pressure of the adsorber is reduced by the controller according to Equation (27). In practice, this could be realized through a throttle valve. This limits the adsorption rate, and hence, also the rate of evoporation, which determines the evaporator temperature and further to cooling power, as discussed below.
The water uptake varies by around 0.04   kg / kg , with a minimum of 0.263   kg / kg and a maximum of 0.302   kg / kg , see Figure 8c. This is a rather small variation of water uptake compared with other applications [44], but results from the examined zeolite 13X, which requires high desorption temperatures and shows a relatively high adsorption enthalpy. Hence, this indicates that other adsorbents, such as silica gel [45], might be more suitable for this application and should be investigated in further studies. A higher variation of water uptake would increase the amount of vapor that could be adsorbed during the cooling phase, and hence, would increase the obtainable cooling energy. During the inter-heating phases, the water uptake does not change, as the adsorber is closed and the re-adsorption of remaining vapor in the adsorber does not change the water uptake noticeably. During the regeneration phase, the condenser water mass m w , C increases, and during the cooling phase, the evaporator water mass m w , E decreases. Furthermore, the pumping process, which is carried out at the end of the inter-heating phase, can be seen.
Since the heat transfer coefficient between the evaporator bottom sheet and the room is assumed to be a constant with 7   W / ( m 2 K ) and the temperature of the room is assumed constant at 23   ° C , the cooling power proportionally follows the temperature of the evaporator. Thus, their courses also in principle identical, but mirrored, compare Figure 8a,d. Additionally, it is found that the cooling power reaches its maximum at 6p.m. (t = 18 h) and is constant until the end of the cooling phase. In case the control strategy with a set point temperature of 15   ° C for the water inside evaporator is applied, the maximum generated cooling power is 54.1   W / m A 2 . This power value is slightly smaller than the ideal value of 56   W / m A 2 , which would be achieved if the thermal resistance of the metallic bottom sheet would be ignored.
Additionally, the reference case was also simulated without applying the temperature controller and the results are depicted with dashed lines in Figure 8. Without the controller, the rate of evaporation, and hence, the cooling power, is solely determined by the rate of adsorption. Thus, the adsorber limits it to a maximum of 82.5   W / ( m A 2 ) . This indicates that a larger evaporator could be coupled with the adsorber. Furthermore, the cooling energy generated for the non-controlled system is approximately 27% higher compared to the controlled system, which results in a slighly higher change in water uptake of 0.05   kg / kg . This shifts the course of the water uptake above the one with active controller and has two effects. On the one hand, the temperature of the zeolite only reaches 92.1   ° C as desorption at a higher level of water uptake can take place at a lower temperature. On the other hand, this leads to a slower dynamic at the beginning of the cooling phase as the cooling of the adsorber is hampered, and thus, the adsorption rate is also reduced.

4.3. Parametric Studies

To analyze the influence of the geometry parameter values as well other component parameters of the three components on the system behavior and achievable cooling rates, a broad parametric study is conducted. Three characteristic results are chosen for convenient comparison of the multiple results. The first characteristic result is the cooling energy generated over one day, which is evaluated for both the case with temperature control and without. The second characteristic result is the maximum cooling power, which is achieved during the cooling phase. As this value is actively limited by the controller, it is only used to compare the results without active controller. The third characteristic result is the dynamic at the beginning of the cooling phase, defined as the time until the maximum cooling power ( 54.1   W / m A 2 ) found in the controlled reference case is reached. This result is used for the comparison of the controlled cases instead of the maximum cooling power. In the following sections, the varied parameters as well as the corresponding results are assigned to the different components or the building and are discussed separately. Furthermore, the evolution of the cooling power over time is shown for the variation of four particularly relevant parameters in Figure 9. For compactness, the further variations are only discussed with respect to the characteristic results and are summarized in Table 5.

4.3.1. Adsorber

At first, the solar collector efficiency η sol is increased to the one of a evacuated flat plate collector and decreased to the one of a flat plate collector. In the controlled case, the variations have a minor effect on the generated cooling energy, see Table 5. The cooling dynamic is improved by the evacuated flat plate collector due to a higher temperature of the adsorber at the end of the regeneration phase. However, without the controller, the variations have a significant impact. With the more efficient evacuated flat plate collector, the variation in water uptake during the regeneration phase is increased. Thus, more water can evaporate during the cooling phase, and hence, a higher cooling power is reached and more cooling energy is generated. For the variation to the flat plate collector, the same explanations are valid, but vice versa.
Secondly, the external fins of the adsorber, which are attached to the absorber sheet to increase the heat transfer in the air gap channel during the cooling phase, are varied with respect to both the distance w fin , abs , A between the fins and the length L fin , abs , A of the fins. For the three variants with distance and length having the same value, almost no differences are found in the results, see Figure 9a. This is because the heat exchange surface is almost identical. However, compared to the reference case, the behavior of the system is improved as the cooling of the adsorber is accelerated, which leads to a shorter inter-cooling phase, and thus, an earlier start of the cooling phase, a slightly better dynamic at the beginning of the cooling phase and a higher adsorption rate, resulting in an increased maximum cooling power. Accordingly, the variant with the smallest distance and the longest fins examined here is found to be the best of the examined cases and the variant without any fins to be the worst case. Note that a smaller distance between the fins might limit the free convection and this the heat transfer due to increased effect of fluid friction.
Finally, the material of the metal used in the adsorber is changed to copper and stainless steel. For both variants, lower values of cooling energy, slower dynamics and decreased maximum cooling powers for the case without control are found. The volumetric heat capacity of both materials is higher than that of aluminum. Thus, the adsorber reaches lower temperatures during the regeneration phase, leading to a reduced cooling down in the following phases. In addition, the change in water uptake is reduced compared to the reference case, which decreases the achievable cooling energy. In the case of copper, the higher heat conductivity cannot compensate for the higher volumetric heat capacity.

4.3.2. Condenser

For the parameter variations studied for the condenser, only small effects on the cooling phase are found, see Table 5. It is beneficial if the temperature during the regeneration phase is kept as low as possible, as this leads to a low vapor pressure value at the outlet of the adsorber, which improves the desorption, and consequently, the system behavior. This can be achieved by increasing either the outer length of the fins L fin , o , C or the facade area of the condenser, decreasing the distance w fin , C between the fins or by improving the heat transfer coefficient to the ambient. All options except for the last one extend the heat transfer surface to the ambient and also increase the metal mass of the condenser, which lowers the temperature increase of the water. In the case of the increased condenser size, the water mass itself is additionally enlarged. The same explanations, but vice versa, are valid for the respective opposite variations.
Table 5. Summarized results of the parametric study.
Control ActiveControl Inactive
VariationCooling EnergyDynamicMax. CoolingCooling Energy
[Wh][min]Power [W][Wh]
Reference/823112 82.5 1043
Adsorber
Collector efficiency η sol High + 3.4 % + 44.6 % + 20.2 % + 21.3 %
Collector efficiency η sol Low 3.9 % 58.9 % 13.5 % 14.4 %
External adsorber fins
( w fin , sht , A × L gap , A ) 15   mm  ×  15   mm + 2.6 % + 28.6 % + 3.6 % + 3.5 %
External adsorber fins
( w fin , sht , A × L gap , A ) 20   mm  ×  20   mm + 2.7 % + 30.4 % + 3.8 % + 3.6 %
External adsorber fins
( w fin , sht , A × L gap , A ) 30   mm  ×  30   mm + 2.8 % + 31.3 % + 4.0 % + 3.7 %
External adsorber fins
( w fin , sht , A × L gap , A ) 10   mm  ×  20   mm + 4.9 % + 51.8 % + 8.5 % + 5.1 %
External adsorber fins
( w fin , sht , A × L gap , A ) no fins 4.5 % 50.0 % 5.8 % 7.3 %
Material of metal structuresCopper 1.7 % 16.1 % 3.5 % 4.4 %
Material of metal structuresSteel 2.6 % 24.1 % 5.5 % 6.5 %
Condenser
Length of outer fins L fin , o , C 11   mm 1.0 % 4.5 % 1.7 % 2.8 %
Length of outer fins L fin , o , C 45   mm + 1.0 % + 2.7 % + 1.9 % + 3.0 %
Width between fins w fin , C 25   mm + 1.0 % + 4.5 % + 2.1 % + 3.2 %
Width between fins w fin , C 25   mm 1.0 % 4.5 % 1.7 % 2.7 %
Heat transfer coefficient α amb , C 8   W / m 2 K + 1.5 % + 5.4 % + 2.9 % + 4.7 %
Heat transfer coefficient α amb , C 16   W / m 2 K + 1.9 % + 8.0 % + 4.5 % + 7.4 %
Facade area 0.5   m 2 5.6 % 26.8 % 9.7 % 13.8 %
Facade area 2   m 2 + 2.2 % + 17.0 % + 7.0 % + 9.1 %
Evaporator
Surface area 1.25   m 2 + 20.5 % 0.9 % //
Surface area 1.5   m 2 + 31.5 % 5.4 % //
Surface area 1.75   m 2 + 33.9 % + 1.8 % //
Surface area 2   m 2 + 35.0 % + 6.3 % //
Surface area 3   m 2 + 37.4 % + 15.2 % //
Surface area 4   m 2 + 38.5 % + 19.6 % //
Surface area 5   m 2 + 39.2 % + 22.3 % //
Set point temperature T set , E 12.5   ° C + 23.2 % 22.3 % //
Set point temperature T set , E 10   ° C + 26.7 % 25.9 % //
Heat transfer coefficient α r , E 14   W / m 2 K + 34.9 % + 38.4 % + 17.7 % + 6.4 %
Building
Compass orientation
of adsorber facade 90 ° + 1.9 % 214.3 % 27.0 % 18.8 %
Compass orientation
of adsorber facade 67.5 ° + 7.5 % 45.5 % 17.9 % 17.3 %
Compass orientation
of adsorber facade 22.5 ° 0.7 % + 12.5 % + 7.8 % 0.1 %
Compass orientation
of adsorber facade 0 ° 3.8 % + 33.0 % + 15.3 % 2.0 %

4.3.3. Evaporator

There are three parameters analyzed for the evaporator. At first, the surface area of the evaporator is enlarged while the facade areas of adsorber and condenser are kept constant. As expected, this increases the maximum cooling power and the obtainable cooling energy per facade area of adsorber, see Figure 9b. Furthermore, it is found that the cooling power can be controlled for an evaporator surface area of up to 1.5 m 2 , as higher areas influence the achievable power and energy values only little. However, larger evaporators require more casing material as well as water mass, which raises both the price and the weight of the system. This limitation is caused by the limited rate of adsorption inside the adsorber, which determines the rate of evaporation. In addition, the set point temperature of the controller is not reached for the variants with areas above 1.5 m 2 . However, the cooling power cannot be maintained until the end of the cooling phase already for this area of 1.5   m 2 . No significant dependency of the dynamics at the beginning of the cooling phase is found. Finally, the duration of the inter-cooling phase increases with the surface area of the evaporator. This is due to the higher amount of adsorbed water, which leads to a higher final value of the water uptake. Again, this results in a lower temperature of the adsorber at the end of the regeneration phase.
Secondly, the set point temperature of the evaporator is reduced from 15   ° C to 12.5   ° C and 10   ° C , which increases the temperature difference between evaporator and room, and thus, amplifies the maximum cooling power and the generated cooling energy, see Figure 9c. The dynamic on the other hand is slightly decelerated as the temperatures of the adsorber at the end of the regeneration phase are slightly lower compared to the reference case due to a higher final value of the water uptake. It is found that a set point temperature of 10   ° C cannot be reached, and therefore, the results of this case are equal to the ones of the reference case without controller.
Thirdly, the heat transfer coefficient between the evaporator and the room is doubled to 14   W / ( m 2 K ) . This leads to a similar increase of the generated cooling energy as an increased evaporator size of 2   m 2 , but also improves the dynamic, as only the reference amount of water has to be cooled down by evaporation.

4.3.4. Building

Finally, the orientation of the facade, which the adsorber is placed on, is varied from east to south, where it is south-east in the reference case. As expected, it is found that this has a huge impact on the system behavior. The further east the adsorber faces, the earlier the regeneration phase starts and the earlier the solar irradiation falls below the value of 200   W / m 2 , which determines the switching from regeneration to cooling phase. On the other hand, the highest cooling power is found for an orientation to south, as the adsorber reaches the highest temperatures and the lowest values of water uptake due to the increased solar irradiation. Again, this also improves the dynamic at the beginning of the cooling phase. Nevertheless, in case of south orientation of the adsorber, the cooling phase starts in the evening at 7 p.m. (t = 19 h). Thus, it is not practical for most applications, because the cooling demand is generally high during the day and not during the night. Looking at the cooling energies, the orientation south-east of the reference case yields the best result. Orientations further to the east lead to lower cooling powers and orientations further to the south cannot compensate for the late start of the cooling phase by the increased cooling power.

4.4. Optimum Cases

As the parameter studies presented in Section 4.3 only analyze the effects of the variation of a single parameter, but do not account for the simultaneous variation of multiple parameters, two optimum cases are identified from the results of the parametric study.
The first one is the practical optimum case, where the parameters are chosen in a way that is assumed to be technically possible, whereas the parameters of the ideal optimum case are most likely hard to achieve in practice. Nevertheless, it is useful to analyze the ideal optimum case in order to estimate the theoretical potential of the proposed system. The applied parameters of both cases are shown in Table 6. For clarity, the parameters of the reference case are denoted as well.
The evolution of the cooling power over time for the two cases is shown in Figure 10 and is discussed in detail in the following.

4.4.1. Practical Optimum Case

The practical optimum case with an evaporator size of 1   m 2 shows an increased maximum cooling power compared to the reference case, which is due to the lower set point temperature of the controller in the controlled case. Without controller, the difference is caused by the improvement of the adsorber design with respect to the absorber fins, resulting in a enhanced cooling down during the cooling phase and of the condenser design, leading to a lower vapor pressure inside the adsorber during the regeneration phase. Both mentioned effects also shorten the required inter-cooling phase by 20 min and improve the dynamic at the beginning of the cooling phase. Thus, the cooling power level of 54.1   W / ( m A 2 ) is reached at least 1 h faster. Again, the results for the increase of the evaporator size up to 2   m 2 indicate that there is an upper limit for the size, determined by the rate of adsorption in the adsorber, which is between 1   m 2 and 1.5   m 2 for the practical optimum case. Nevertheless, already with a size of 1.5   m 2 , the cooling power cannot be kept constant until the end of the cooling phase, as the adsorber is not able to provide the required rate of adsorption.

4.4.2. Ideal Optimum Case

The ideal optimum case reveals cooling power levels up to 145   W / m A 2 , which is significantly higher compared to the reference case and the practical optimum cases due to the increased heat transfer coefficient between the evaporator and the room. The improved solar collector efficiency as well as the increased heat release to the environment of the condenser lead to enhanced desorption resulting in a lower water uptake, and consequently, to a significant higher total cooling energy. Moreover, both mentioned effects also further shorten the required inter-cooling phase and increase the dynamic at the beginning of the cooling phase. For the case controlled to 15   ° C , it is found that the cooling power can be kept constant for more than 10 h, while for the case controlled to 10   ° C , the set-point temperature is never reached, as the adsorber is not able to provide the required rate of adsorption.

5. Conclusions and Outlook

A novel facade-integrated adsorption system for solar cooling of lightweight buildings was presented and theoretically investigated. For this purpose, a detailed numerical model of the three main components adsorber, condenser and evaporator was developed and implemented into Matlab. Internal heat and mass transfer as well as adsorption and condensation/evaporation processes are thoroughly incorporated into the model for all three components.
The simulation of a reference case confirmed that the proposed solar cooling system is suitable for building applications. The cooling rate achieved for the reference case was determined to 54   W / m 2 . Furthermore, it was shown that the applied control strategy allows for constant cooling rates during the whole cooling phase.
With respect to the specific questions formulated in Section 1.4, further results of the comprehensive simulation study can be summarized:
  • It was found that cooling power levels of up to 100   W / m 2 can be reached with a practical best-case configuration. This compares well to the values of state-of-the-art cooling ceilings. The current system is able to provide constant cooling powers of around 75   W / m 2 for more than 13 hours. Nevertheless, the system is not able to provide constant power levels higher than around 75 W / m 2 due to the finite adsorption rate of the adsorber.
  • The optimal surface ratio of the component adsorber and evaporator strongly depends on the heat transfer that can be realized between room and the evaporator, which depends on the heat transfer coefficient and the set-point temperature of the evaporator. With the configuration of the reference case with a determined cooling rate of 54   W / m 2 , the 1   m 2 adsorber can be connected to up to 1.5   m 2 of evaporator area. For higher cooling rates, the ratio should be 1:1, as the adsorption rate of the adsorber is limited. The surface area of the condenser has only minor influence on the cooling performance.
  • The parameters with the highest impact on the cooling power and cooling energy, respectively, are the solar collector efficiency of the adsorber, the surface ratios, the orientation of the facade carrying the adsorber, the configuration of the external fins on the absorber sheet and the maximum heat flux between evaporator and adjacent room determined by the heat transfer coefficient and the temperature difference.
To conclude, the numerical simulations demonstrated the theoretical proof of concept of the proposed facade-integrated adsorption system for solar cooling and the developed models allow for further studies focussing on the identified limitations of the system. The low amplitude of the water uptake variation will be adressed in future works by material optimization. Moreover, the future works include the model extension to study the alternating operation with two adsorber facades as well as active shading of the adsorbers for more flexible and demand responsive cooling. For further optimization of the adsorber, the implementation in a three-dimensional solver, e.g., COMSOL Multiphysics 5.6, is underway. Finally, we set up a lab-scale experiment of the proposed system to validate the derived model and will implement it into the demonstrator high-rise building of the Collaborative Research Center 1244 in the coming years.

Author Contributions

Conceptualization, M.S. and O.B.; methodology, M.S. and O.B.; software, O.B. and D.M.; validation, O.B. and M.S.; data curation, O.B.; writing—original draft preparation, O.B.; writing—review and editing, M.S., O.B. and D.M.; visualization, O.B.; supervision, M.S.; project administration, M.S.; funding acquisition, M.S. All authors have read and agreed to the published version of the manuscript.

Funding

This research was funded by the Deutsche Forschungsgemeinschaft (DFG, German Research Foundation) under SFB1244-279064222.

Data Availability Statement

The data presented in this study are available on request from the corresponding author.

Acknowledgments

The authors thank the Deutsche Forschungsgemeinschaft for funding.

Conflicts of Interest

The authors declare no conflicts of interest.

References

  1. United Nations Environment Programme. 2020 Global Status Report for Buildings and Construction; United Nations Environment Programme: Nairobi, Kenya, 2020. [Google Scholar]
  2. Mutschler, R.; Rüdisüli, M.; Heer, P.; Eggimann, S. Benchmarking cooling and heating energy demands considering climate change, population growth and cooling device uptake. Appl. Energy 2021, 288, 116636. [Google Scholar] [CrossRef]
  3. Larsen, M.; Petrović, S.; Radoszynski, A.M.; McKenna, R.; Balyk, O. Climate change impacts on trends and extremes in future heating and cooling demands over Europe. Energy Build. 2020, 226, 110397. [Google Scholar] [CrossRef]
  4. Blandini, L.; Haase, W.; Weidner, S.; Böhm, M.; Burghardt, T.; Roth, D.; Sawodny, O.; Sobek, W. D1244: Design and Construction of the First Adaptive High-Rise Experimental Building. Front. Built Environ. 2022, 8, 814911. [Google Scholar] [CrossRef]
  5. Cristino, T.M.; Neto, A.F.; Wurtz, F.; Delinchant, B. The Evolution of Knowledge and Trends within the Building Energy Efficiency Field of Knowledge. Energies 2022, 15, 691. [Google Scholar] [CrossRef]
  6. Gupta, N.; Tiwari, G.N. Review of passive heating/cooling systems of buildings. Energy Sci. Eng. 2016, 4, 305–333. [Google Scholar] [CrossRef]
  7. Akeiber, H.; Nejat, P.; Majid, M.Z.A.; Wahid, M.A.; Jomehzadeh, F.; Zeynali Famileh, I.; Calautit, J.K.; Hughes, B.R.; Zaki, S.A. A review on phase change material (PCM) for sustainable passive cooling in building envelopes. Renew. Sustain. Energy Rev. 2016, 60, 1470–1497. [Google Scholar] [CrossRef]
  8. Internation Energy Agency. The Future of Cooling; IEA Publications: Paris, France, 2018. [Google Scholar]
  9. Sarbu, I.; Sebarchievici, C. Review of solar refrigeration and cooling systems. Energy Build. 2013, 67, 286–297. [Google Scholar] [CrossRef]
  10. Huang, B.J.; Hou, T.F.; Hsu, P.C.; Lin, T.H.; Chen, Y.T.; Chen, C.W.; Li, K.; Lee, K.Y. Design of direct solar PV driven air conditioner. Renew. Energy 2016, 88, 95–101. [Google Scholar] [CrossRef]
  11. Henning, H.M. Solar assisted air conditioning of buildings—An overview. Appl. Therm. Eng. 2007, 27, 1734–1749. [Google Scholar] [CrossRef]
  12. Ullah, K.R.; Saidur, R.; Ping, H.W.; Akikur, R.K.; Shuvo, N.H. A review of solar thermal refrigeration and cooling methods. Renew. Sustain. Energy Rev. 2013, 24, 499–513. [Google Scholar] [CrossRef]
  13. Settino, J.; Sant, T.; Micallef, C.; Farrugia, M.; Spiteri Staines, C.; Licari, J.; Micallef, A. Overview of solar technologies for electricity, heating and cooling production. Renew. Sustain. Energy Rev. 2018, 90, 892–909. [Google Scholar] [CrossRef]
  14. Ghafoor, A.; Munir, A. Worldwide overview of solar thermal cooling technologies. Renew. Sustain. Energy Rev. 2015, 43, 763–774. [Google Scholar] [CrossRef]
  15. Almasri, R.A.; Abu-Hamdeh, N.H.; Esmaeil, K.K.; Suyambazhahan, S. Thermal solar sorption cooling systems - A review of principle, technology, and applications. Alex. Eng. J. 2022, 61, 367–402. [Google Scholar] [CrossRef]
  16. Goyal, P.; Baredar, P.; Mittal, A.; Siddiqui, A.R. Adsorption refrigeration technology—An overview of theory and its solar energy applications. Renew. Sustain. Energy Rev. 2016, 53, 1389–1410. [Google Scholar] [CrossRef]
  17. Wang, R. Performance improvement of adsorption cooling by heat and mass recovery operation. Int. J. Refrig. 2001, 24, 602–611. [Google Scholar] [CrossRef]
  18. Chan, K.C.; Tso, C.Y.; Chao, C.Y.H.; Wu, C.L. Experiment verified simulation study of the operating sequences on the performance of adsorption cooling system. Build. Simul. 2015, 8, 255–269. [Google Scholar] [CrossRef]
  19. Hu, T.; Kwan, T.H.; Pei, G. An all-day cooling system that combines solar absorption chiller and radiative cooling. Renew. Energy 2022, 186, 831–844. [Google Scholar] [CrossRef]
  20. Prieto, A.; Knaack, U.; Auer, T.; Klein, T. Solar coolfacades: Framework for the integration of solar cooling technologies in the building envelope. Energy 2017, 137, 353–368. [Google Scholar] [CrossRef]
  21. Noaman, D.S.; Moneer, S.A.; Megahed, N.A.; El-Ghafour, S.A. Integration of active solar cooling technology into passively designed facade in hot climates. J. Build. Eng. 2022, 56, 104658. [Google Scholar] [CrossRef]
  22. Blackman, C.; Hallström, O.; Bales, C. Demonstration of Solar Heating and Cooling System Using Sorption Integrated Solar Thermal Collectors. In Proceedings of the EuroSun 2014 Conference, Aix-les-Bains, France, 16–19 September 2014; Frank, E., Papillon, P., Eds.; ISES: Freiburg, Germany, 2015; pp. 1–10. [Google Scholar] [CrossRef]
  23. Allouhi, A.; Kousksou, T.; Jamil, A.; El Rhafiki, T.; Mourad, Y.; Zeraouli, Y. Optimal working pairs for solar adsorption cooling applications. Energy 2015, 79, 235–247. [Google Scholar] [CrossRef]
  24. Cabeza, L.F.; Solé, A.; Barreneche, C. Review on sorption materials and technologies for heat pumps and thermal energy storage. Renew. Energy 2017, 110, 3–39. [Google Scholar] [CrossRef]
  25. Rezk, A.; Gediz Ilis, G.; Demir, H. Experimental study on silica gel/ethanol adsorption characteristics for low-grade thermal driven adsorption refrigeration systems. Therm. Sci. Eng. Prog. 2022, 34, 101429. [Google Scholar] [CrossRef]
  26. Mette, B.; Kerskes, H.; Drück, H.; Müller-Steinhagen, H. Experimental and numerical investigations on the water vapor adsorption isotherms and kinetics of binderless zeolite 13X. Int. J. Heat Mass Transf. 2014, 71, 555–561. [Google Scholar] [CrossRef]
  27. Semprini, S.; Asenbeck, S.; Kerskes, H.; Drück, H. Experimental and numerical investigations of an adsorption water-zeolite heat storage for refrigeration applications. Energy Procedia 2017, 135, 513–521. [Google Scholar] [CrossRef]
  28. Pesaran, A.; Lee, H.; Hwang, Y.; Radermacher, R.; Chun, H.H. Review article: Numerical simulation of adsorption heat pumps. Energy 2016, 100, 310–320. [Google Scholar] [CrossRef]
  29. Schreiber, H.; Lanzerath, F.; Bardow, A. Predicting performance of adsorption thermal energy storage: From experiments to validated dynamic models. Appl. Therm. Eng. 2018, 141, 548–557. [Google Scholar] [CrossRef]
  30. Thomas, S.; André, P. Numerical simulation and performance assessment of an absorption solar air-conditioning system coupled with an office building. Build. Simul. 2012, 5, 243–255. [Google Scholar] [CrossRef]
  31. Tso, C.Y.; Fu, S.C.; Chao, C.Y.H. Modeling a solar-powered double bed novel composite adsorbent (silica activated carbon/CaCl2)-water adsorption chiller. Build. Simul. 2014, 7, 185–196. [Google Scholar] [CrossRef]
  32. Schaefer, M.; Thess, A. Modeling and simulation of closed low-pressure zeolite adsorbers for thermal energy storage. Int. J. Heat Mass Transf. 2019, 139, 685–699. [Google Scholar] [CrossRef]
  33. Schaefer, M. Modeling and Simulation of Closed Low-Pressure Adsorbers for Thermal Energy Storage. Ph.D. Thesis, University of Stuttgart, Stuttgart, Germany, 2019. [Google Scholar] [CrossRef]
  34. Schaefer, M.; Raab, A.; Gerle, M.; Pfeiler, D.; Vogel, J.; Thess, A. Development of a zero-energy-sauna: Simulation study of thermal energy storage. Energy Build. 2022, 256, 111659. [Google Scholar] [CrossRef]
  35. Gao, D.; Gao, G.; Cao, J.; Zhong, S.; Ren, X.; Dabwan, Y.N.; Hu, M.; Jiao, D.; Kwan, T.H.; Pei, G. Experimental and numerical analysis of an efficiently optimized evacuated flat plate solar collector under medium temperature. Appl. Energy 2020, 269, 115129. [Google Scholar] [CrossRef]
  36. Baehr, H.D.; Stephan, K. Heat and Mass Transfer, 3rd ed.; Springer: Berlin, Germany, 2011. [Google Scholar]
  37. Alexopoulos, S.; Kalogirou, S.A. Solar Thermal Energy; Springer: New York, NY, USA, 2022. [Google Scholar] [CrossRef]
  38. VDI. Heat Atlas; Springer: Berlin/Heidelberg, Germany, 2010. [Google Scholar] [CrossRef]
  39. Nusselt, W. Die Oberflaechenkondensation des Wasserdampfes; VDI-Z: Düsseldorf, Germany, 1916; Volume 60, pp. 541–546+569–575. [Google Scholar]
  40. European Commission. Photovoltaic Geographical Information System. Available online: https://joint-research-centre.ec.europa.eu/pvgis-photovoltaic-geographical-information-system_en (accessed on 1 June 2022).
  41. Huld, T.; Müller, R.; Gambardella, A. A new solar radiation database for estimating PV performance in Europe and Africa. Sol. Energy 2012, 86, 1803–1815. [Google Scholar] [CrossRef]
  42. SPF Institute for Solar Technology. Solar Collector Factsheet Tancredi TAN 2504. 2016. Available online: https://serv.spf.ch/spftesting/collectors/pdfs/scf1858en.pdf (accessed on 1 June 2022).
  43. SWT Technologie. Test Report Thermal Performance of a Solar Collector. 2017. Available online: https://www.tvpsolar.com/attach/20170614_%20TVP_MT_Power_v4_Solar_Keymark_Test_Report.pdf (accessed on 1 June 2022).
  44. Liu, Y.; Leong, K.C. Numerical modeling of a zeolite/water adsorption cooling system with non-constant condensing pressure. Int. Commun. Heat Mass Transf. 2008, 35, 618–622. [Google Scholar] [CrossRef]
  45. Sapienza, A.; Velte, A.; Girnik, I.; Frazzica, A.; Füldner, G.; Schnabel, L.; Aristov, Y. “Water - Silica Siogel” working pair for adsorption chillers: Adsorption equilibrium and dynamics. Renew. Energy 2017, 110, 40–46. [Google Scholar] [CrossRef]
Figure 1. Cross-section view and operating principle of a high-rise building equipped in floor n (exemplarily) with the facade-integrated adsorption system for solar cooling. The main components are: A—adsorber, C—condenser, E—evaporator. The regeneration phase, in which the adsorber is heated up by solar irradiation, is shown on the left hand side and the cooling phase on the right hand side. The colored arrows indicate the main heat fluxes during the two phases.
Energies 17 01706 g001
Figure 2. Design scheme and model domain (dashed red box) of the adsorber (cross-section side view). The scheme is not to scale, as the height is approximately 1 m, while the width in z-direction is only approximately 10 cm. The absorber sheet is equipped with metal fins inside the air gap channel.
Energies 17 01706 g002
Figure 3. Design schemes and model domain (dashed red box) of the condenser (cross-section top and front view). The schemes are not to scale as the height and length are approximately 1 m, while the width in z-direction is approximately 8 cm. (a) Cross-section top view of the condenser, (b) cross-section front view of the condenser.
Energies 17 01706 g003
Figure 4. Design scheme and model domain (dashed red box) of the evaporator (cross-section side view).
Energies 17 01706 g004
Figure 5. Ambient temperature and solar radiation on 26 August 2016 for a site in Stuttgart, Germany. The solar radiation is determined for a vertical facade with compass orientation south-east.
Energies 17 01706 g005
Figure 6. Operational phases (blue boxes) and switching strategy of the adsorption system. The corresponding switching criteria are given in the black boxes.
Energies 17 01706 g006
Figure 7. Evolution of the water uptake inside the adsorber over 10 consecutive days with identical ambient conditions for the reference case.
Energies 17 01706 g007
Figure 8. Evolution of temperatures, pressures, water uptake, water masses and cooling power of the three components adsorber, condenser and evaporator over the time t for the reference case. The four operational phases are numbered, where ➀ refers to the regeneration phase, ➁ refers to the inter-cooling phase, ➂ refers to the cooling phase and ➃ refers to the inter-heating phase. The parts of the figure covered by the legend can be seen from the first half of the figures. The cooling power q ˙ is given per installed square meter of adsorber facade.
Energies 17 01706 g008
Figure 9. Evolution of cooling powers over the time t for different configurations analyzed in the parametric study. The parts of the figure covered by the legend can be seen from the first half of the figures. The cooling power q ˙ is given per installed square meter of adsorber facade.
Energies 17 01706 g009
Figure 10. Evolution of cooling powers over the time t for the practical and the ideal optimum case, see Table 6. The parts of the figure covered by the legend can be seen from the first half of the figures. The cooling power q ˙ is given per installed square meter of adsorber facade.
Energies 17 01706 g010
Table 1. Comparison of the model aspects considered in the previous works and this work.
Previous Works by co-Author Schaefer
Model AspectFundamental Adsorber Model [32,33]Sauna Oven Application [34]This Work
Mass transfer inside the adsorber
Heat transfer inside the adsorber
Heat transfer fluid inside the adsorber--
Metal plate to absorb heat-
Metal fins inside the adsorber-
Solar collector--
Evaporator--
Condenser--
Operation strategy for building application--
Table 2. Coefficients of the solar collector efficiency, see Equation (7).
ParameterEvacuated FlatFlat Plate CollectorAverage
Plate Collector
η 0 ( ) 0.737 0.7910.764
c 1 ( W / ( m 2 K ) ) 0.504 4.47 2.487
c 2 ( W / ( m 2 K 2 ) ) 0.006 0.007 0.0065
Table 3. Geometry parameters of the studied reference case.
ParameterValue
Geometry—Adsorber, see Figure 2
width between internal fins w z , A = 30 mm
length of internal fins L z , A = 50 mm
thickness of internal fins h fin , z , A = 3 mm
thickness of absorber sheet L sht , A = 2 mm
width of air gap channel L gap , A = 10 mm
width between external fins w fin , sht , A = 20 mm
Geometry—Condenser, see Figure 3
width between fins w fin , C = 50 mm
length of inner fins L fin , i , C = 81 mm
length of outer fins L fin , o , C = 22.5 mm
thickness of fins h fin , C = 3 mm
thickness of casing s C = 3 mm
Geometry—Evaporator, see Figure 4
thickness of bottom sheet s E = 3 mm
Table 4. Boundary and initial conditions of the reference case.
ParameterValueUnit
Boundary conditions
T r 23 °C
T set , E 15 °C
T amb time-dependent, see Figure 5 °C
q ˙ sol time-dependent, see Figure 5 W / m 2
η sol average, see Table 2-
Initial conditions
T A , 0 23 °C
T C , 0 21 °C
T E , 0 23 °C
p A , 0 24.93 mbar
p C , 0 24.93 mbar
p E , 0 28.17 mbar
X A , 0 0.3393 ( 33.93 % ) kg / kg
m w , C , 0 40 kg
m w , E , 0 10 kg
Table 6. Geometry and process parameters of the studied practical and ideal optimum case.
ParameterRef. CasePract. OptimumIdeal OptimumUnit
Adsorber
η sol AverageAverageHigh%
L fin , abs , A 102020 mm
w fin , abs , A 201010 mm
Condenser
w C 505025 mm
L fin , o , C 22.5 4545 mm
α amb , C 4816 W / ( m 2 K )
Evaporator
T set , E 15 12.5 10 ; 12.5 ; 15 °C
α air , E 7714 W / ( m 2 K )
A E 1 1 ; 1.5 ; 2 1 m 2
Disclaimer/Publisher’s Note: The statements, opinions and data contained in all publications are solely those of the individual author(s) and contributor(s) and not of MDPI and/or the editor(s). MDPI and/or the editor(s) disclaim responsibility for any injury to people or property resulting from any ideas, methods, instructions or products referred to in the content.