Article

Pressure Transient Test Analysis for Deep Fractured Gas Reservoirs in Tarim Basin

1
PetroChina Tarim Oilfield Company, Korla 841000, China
2
Research Institute of Petroleum Exploration and Development, PetroChina, Beijing 100083, China
3
National Elite Institute of Engineering, CNPC, Beijing 100096, China
4
School of Energy Resources, China University of Geosciences, Beijing 100083, China
*
Author to whom correspondence should be addressed.
Energies 2024, 17(7), 1717; https://doi.org/10.3390/en17071717
Submission received: 8 January 2024 / Revised: 24 February 2024 / Accepted: 9 March 2024 / Published: 3 April 2024
(This article belongs to the Section H1: Petroleum Engineering)

Abstract

:
Fractures are common features in deep gas reservoirs with strong heterogeneity, which are generally evaluated by well-testing analysis. Based on the characteristics of a variety of spatial scales from microscopic fractures to macroscopic faults in the Kuche area, this paper investigated the pressure behavior of naturally fractured gas reservoirs by using four typical patterns, including the Warren–Root model, radial composite model, dual-flow-state model, and local heterogeneity model. As a result, typical well-testing curves and parameter sensitivity analysis were demonstrated in detail. Furthermore, the pressure transient behavior of multi-scaled fractured reservoirs was identified by use of a state-of-the-art workflow. The analysis shows that the four patterns and their identification processes were feasible for the inversion of reservoir parameters in fractured gas reservoirs. Combined with dynamic data, the proposed method could further guide the optimization of development schemes and is of great significance for the development of fractured gas reservoirs.

1. Introduction

In recent years, deep and ultra-deep gas reservoirs have become an important area for the expansion of natural gas storage and production in China [1]. There exist numerous hydrocarbon reserves in the Kuche area, Tarim Basin, especially in the front overthrust belt of the Kuche Mountains. With the continuous deepening of exploration and development, breakthroughs have been made from the deep reservoirs in Kela2 [2,3,4] to the ultra-deep reservoirs in the Bozi and Dabei areas [5,6,7]. Natural gas production has skyrocketed and has become the most important area for the development of natural gas production capacity in the Tarim Basin. The geological conditions of the deep and ultra-deep gas reservoirs are very complex [8], which are characterized by a great burial depth, high temperatures, extremely high pressure, dense matrix, and developed faults and fractures. The complex structural movement makes significant differences to the generations of naturally fractured reservoirs, resulting in different production dynamics and development strategies [9]. The identification of different models to fit the fracture-matrix pattern is of great importance for the development of such gas reservoirs. Well-testing analysis is based on seepage theory, and various models are established to fit production performance data and invert and evaluate geological parameters, which provide a basis for development scheme formulation and optimization of fractured gas reservoirs [10].
Deep gas reservoirs in the Tarim Basin are characterized by developed fractures and strong heterogeneity. It is important for reservoir engineers to select well-testing models to appropriately describe the fractures. The dual-porosity model is widely used for fractured gas reservoirs. Barenblatt et al. [11] first proposed the concept of dual media, treating natural fractured reservoirs as matrix systems and fracture systems, both considered as continuous media. However, there are differences in the storage and permeability capabilities between the two media. Warren et al. [12] proposed the classic Warren–Root model based on the concept of dual media, assuming that the matrix of dual-porosity media experiences pseudo-steady-state flow towards fractures. Kazemi [13] and De Swaan O [14] proposed a dual-porosity model with plate matrix and sphere matrix, respectively, based on the Warren–Root model of block matrix and stable channeling, which considers the unstable cross-flow from the matrix system towards the fracture system. Subsequently, numerous researchers developed and improved the dual-porosity model [15,16,17,18,19,20,21,22,23,24] to characterize fractures and flowing behaviors of fractured reservoirs. Because of simplification, the dual-continuum model cannot grasp the transient behaviors in reservoirs with large isolated fractures and can lead to large errors. To more precisely describe fractures and multi-scale characteristics of fractured reservoirs, a number of numerical models with discrete fracture networks (DFNs) were developed. Sun et al. [25] established a numerical well test model based on multi-scale media by combining the random generation of natural fracture networks with the unstructured grid method and solved it by using the finite element method with mixed elements. Chen et al. [10] proposed a numerical well-testing model considering discrete fractures and permeability heterogeneity for radially complex fractured gas reservoirs and the PEBI method was used for local grid refinement by MRST.
However, each method has disadvantages. It is difficult to accurately describe the characteristics of reservoir fractures in the Kuche area by use of one single continuum model due to the great heterogeneity. Even when using a numerical model which can more precisely characterize the natural fractures, a large number of fractures can lead to difficulties in description and a significant increase in computational time costs, resulting in biased interpretation of the results. To address the shortcomings of the single continuum method and according to the fact that actual well-testing curves in the Kuche area always include concavity and lines with slopes from 0.5 to 1 [1], a set of identification procedures of fault–pore–fracture multi-scale media well-testing models is established in this article including the Warren–Root model, radial composite model, dual-flow-state model, and local heterogeneity model. Parameter sensitivity analysis of the four models and application to a field case study in the Kuche area were conducted, which showed the influence factors for the curve shapes of different patterns and the utility of the identification procedure.
The well-testing model identification procedure proposed in this paper can be feasibly used for the selection of different models and inversion of formation parameters in fractured reservoirs in the Kuche area. Combined with dynamic data of wells, the results can help guide the optimization of development schemes due to water invasion or other adjustments of the reservoir, which can help enhance the recovery.

2. Development of Well-Testing Models

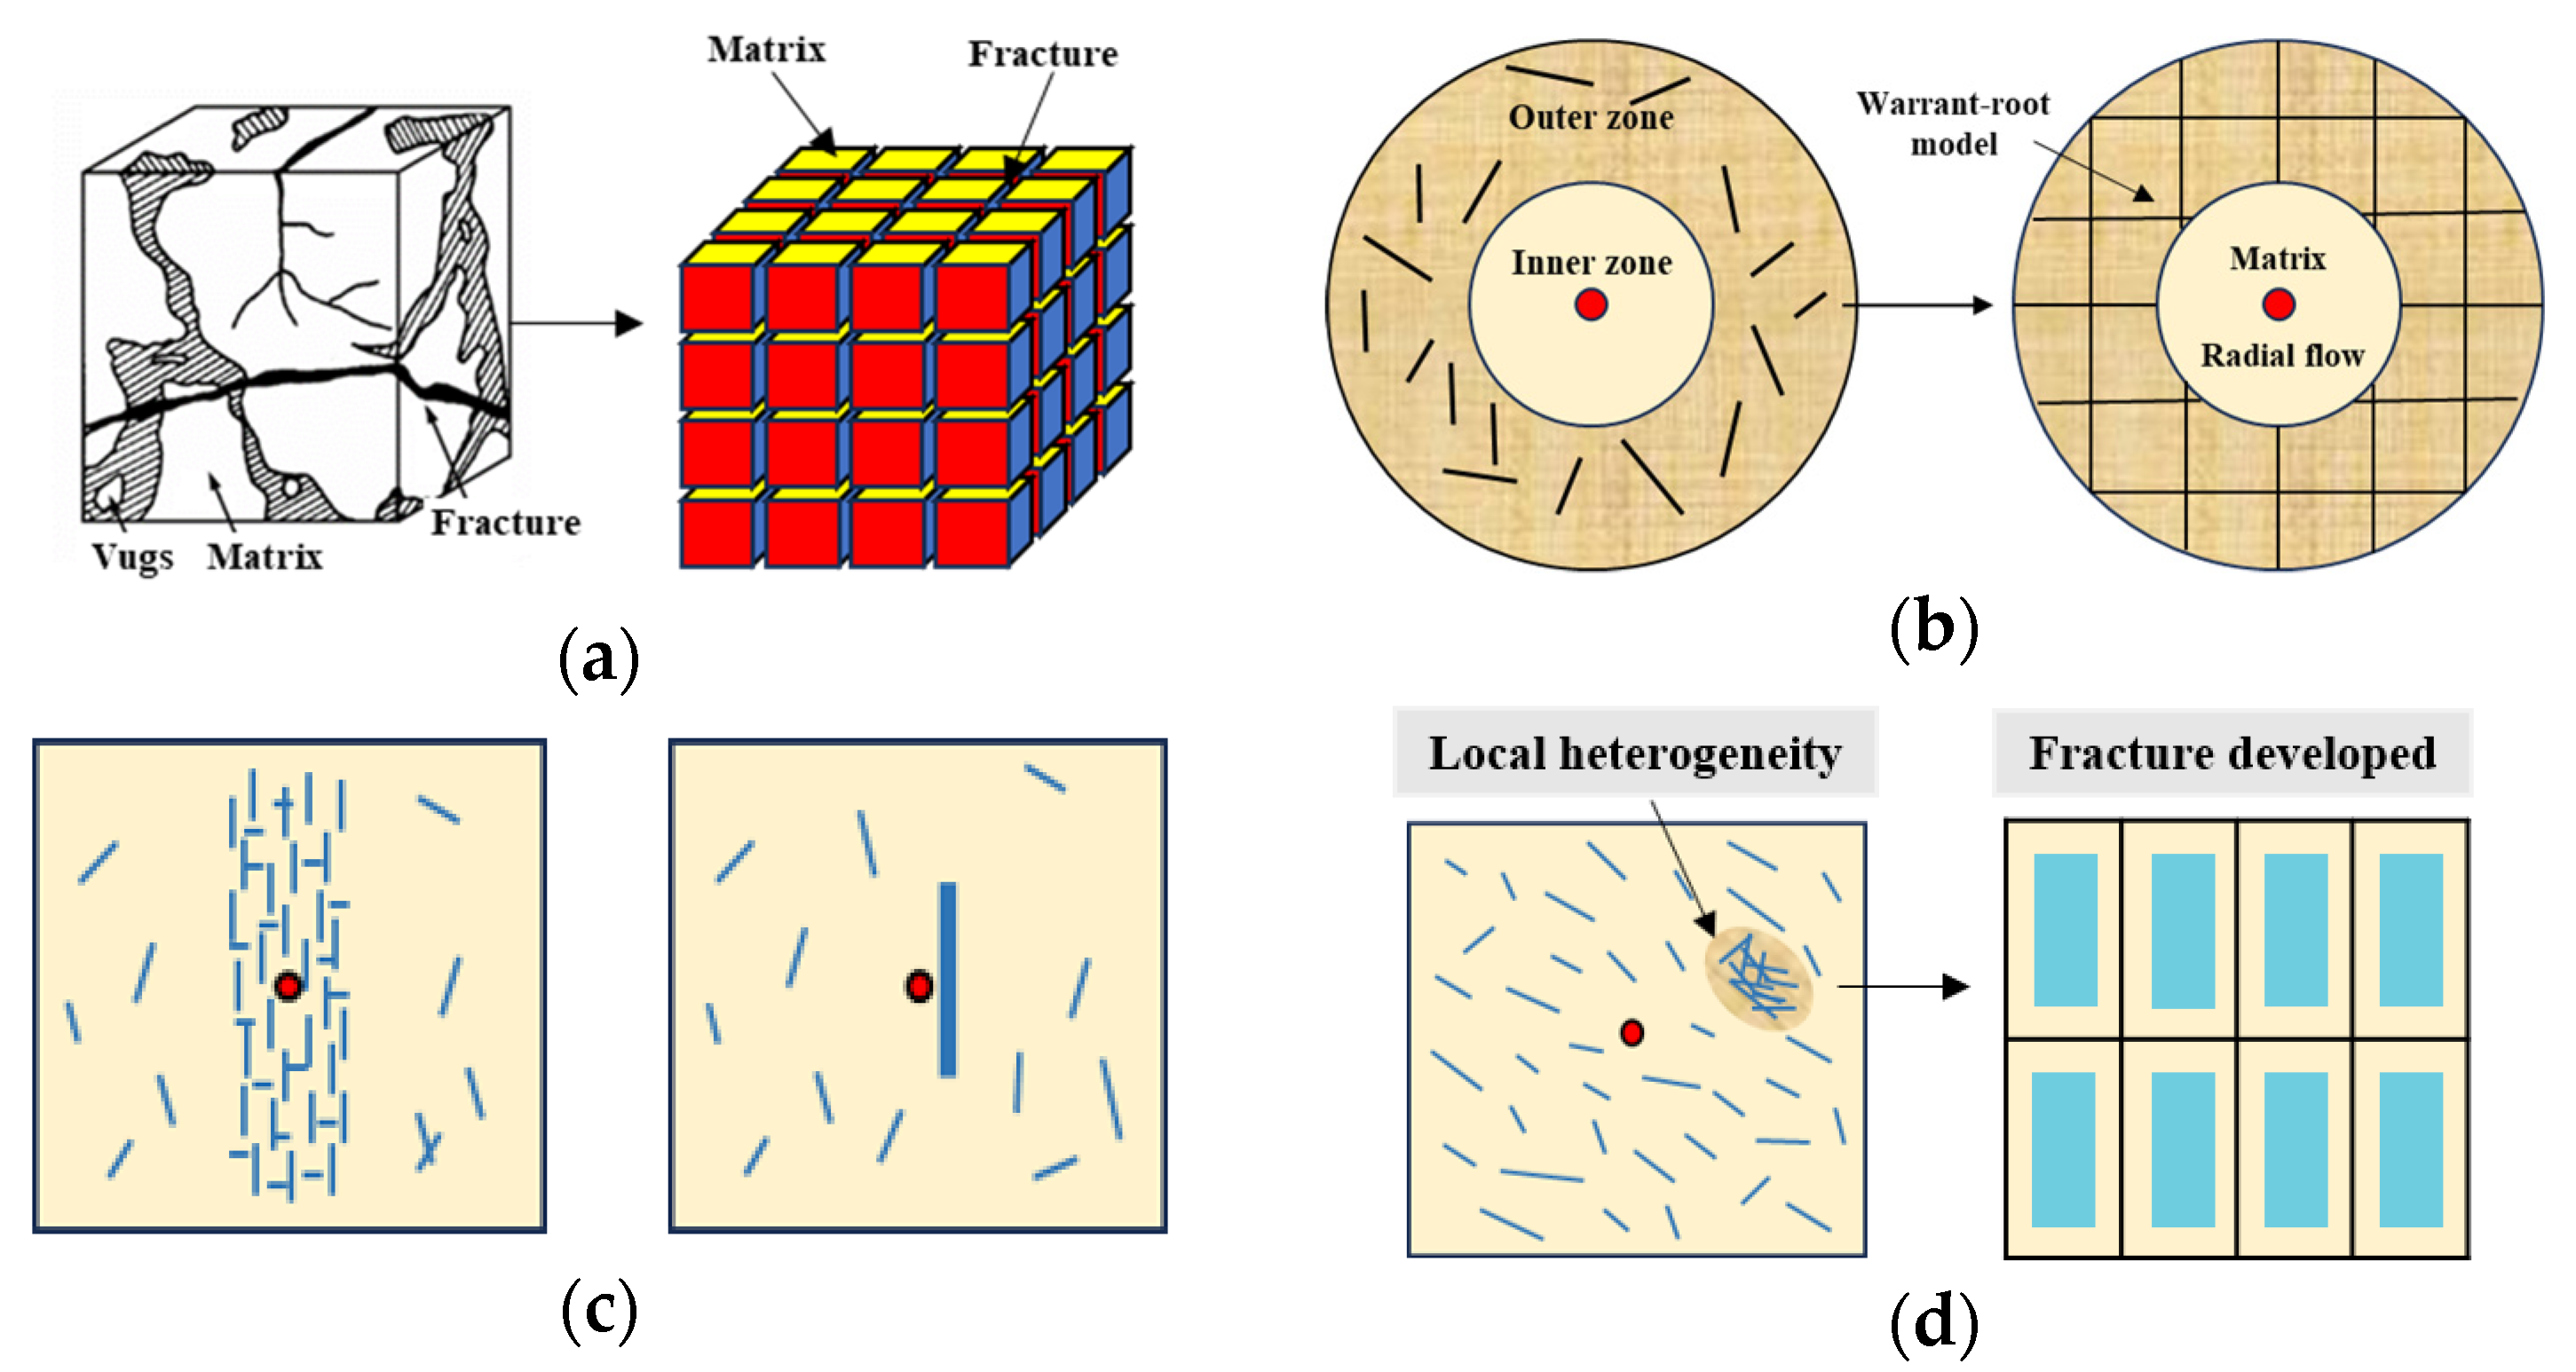
2.1. Development of Models

The Warren–Root model is the most typical and widely used dual-porosity model, suitable for reservoirs with network-type and interconnected fractures, through elastic storage capacity ratio ω and cross-flow coefficient λ to describe the relationship between fractures and matrix and, based on the assumption that seepage in the matrix rock block is at the pseudo-steady-state stage (i.e., the pressure drop rate at each point in the matrix rock block is the same), the flow function between the matrix block and surrounding fractures is given (i.e., the pseudo-steady-state flow function).
To compensate for the shortcomings of the Warren–Root model in describing the multi-scale fracture matrix and reservoir heterogeneity, three well-testing models based on the Warren–Root model are proposed in this paper, which are consistent with the characteristics of fracture development in the Kuche area (Figure 1).

2.2. Model Assumptions and Mathematical Models

To establish the mathematical model, four fluid flow diagrams for different models are drawn to describe the fluid flowing from the reservoir to the wellbore, as shown in Figure 2. The Warren–Root model describes the flow process from the matrix to fractures and then to the wellbore under the assumption that fluid cannot flow from the matrix to the well directly. The radial composite model divides the seepage area radially into two regions: the inner tight matrix region and the outer dual-porosity region. Different from the radial composite model, the dual-flow-state model consists of an inner dual-porosity region and outer matrix region, with the well located in the matrix block. This model describes the flow process from the matrix to the dual-porosity region and then to the matrix where the well is located and eventually to the wellbore. The local heterogeneity model considers the influence of locally disconnected fractures and connected fracture networks and the flow process can be divided into two parts: 1. fluid flow from disconnected fractures to corresponding matrix then to connected fractures; 2. fluid flow to the matrix where the well is located and eventually to the wellbore.
Basic assumptions of the four well-testing models are as follows:
  • The matrix is cut into equal-sized hexahedra in the fracture development zone, which conforms to the Warren–Root model;
  • The reservoir is sealed up and down with equal thickness;
  • The fluid is single-phase compressible and pseudo-pressure is applied to linearize the flowing equation;
  • The influences of capillary force and gravity are ignored, and the temperature during the seepage process remains constant;
  • The reservoir fluid follows the Darcy flow law.

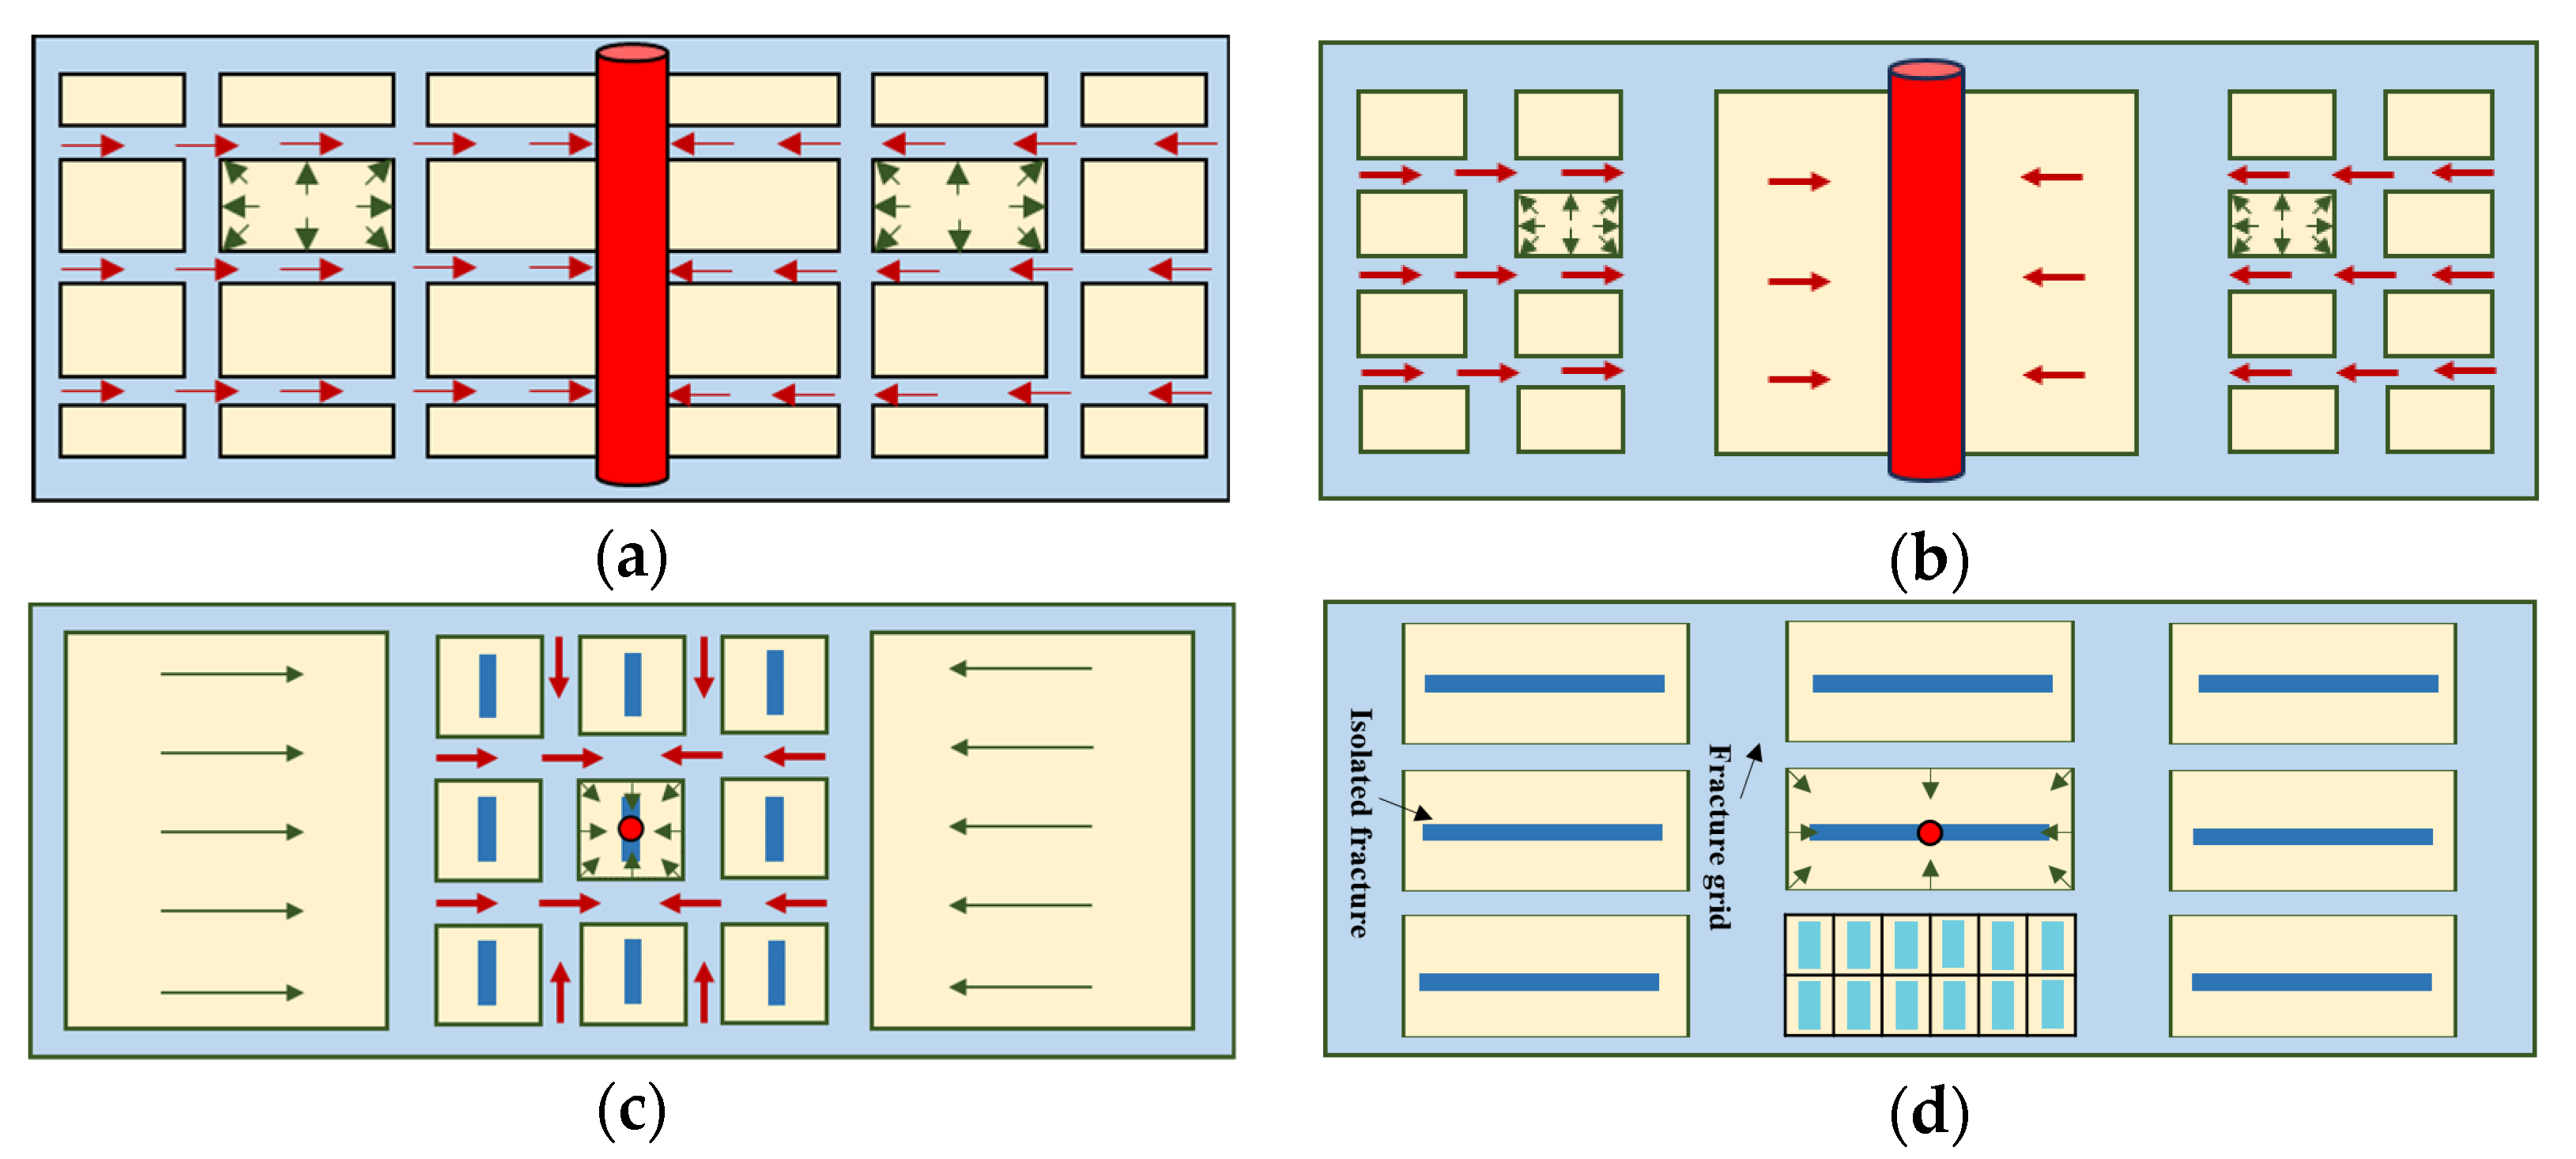
2.2.1. Warren–Root Model

In order to accurately describe the gas property and solve the flowing equation, pseudo-pressure [26] and dimensionless form are introduced. The multi-composite model proposed by Huang et al. [27] can be simplified to the Warren–Root model when assuming one region exists in the model. For more details as to the process of solving flow equations, please see [27].
The dimensionless equation governing fluid flow can be obtained as follows [27]:
1 r D r D r D ψ f D r D = ω ψ f D t D + 1 ω ψ m D t D
where ψfD and ψmD denote the dimensionless pseudo-pressures of the fracture and matrix system; rD denotes the dimensionless radial distance; tD denotes dimensionless time.
The second term on the right side of the equation can be written as [27]:
1 ω ψ m D t D = λ ψ f D ψ m D
where ω is elastic storage ratio, dim; λ is cross-flow coefficient.
The expressions of ω and λ are as follows [27]:
ω = ϕ c f ϕ c f + ϕ c m , λ = α k m k f r w 2

2.2.2. Radial Composite Model

By simplifying the multi-composite model [27] into a dual-composite model with the inner region of tight matrix, we can obtain the radial composite model proposed in this article.
The dimensionless governing equation for the inner zone is as follows [28]:
1 r 1 D r 1 D r 1 D ψ 1 m D r 1 D = ψ 1 m D t D
where ψ1m is the dimensionless pseudo-pressure of the matrix system in the inner zone; r1D is the dimensionless radial distance in the inner zone.
The outer zone is a dual-porosity media (Warren–Root model), and the control equation is as follows [27]:
1 r 2 D r 2 D r 2 D ψ 2 f D r 2 D = η 1 η 2 ω ψ 2 f D t D + 1 ω ψ 2 m D t D
where ψ2f and ψ2m denote the dimensionless pseudo-pressures of the fracture and matrix system in the outer zone; r2D denotes the dimensionless radial distance in the outer zone.
The expression for diffusivity η is as follows [27]:
η = k ϕ μ g C t
where k is permeability, D; μg is gas viscosity, mPa·s; Ct is total compressibility, MPa−1.
The dimensionless junction interface condition is as follows [27]:
ψ 1 D r * , t D = ψ 2 D r * , t D , ψ 1 D r 1 D = k 2 μ 1 k 1 μ 2 ψ 2 D r 2 D
where ψ1D and ψ2D represent the dimensionless pseudo-pressures; r* represents the junction interface of the inner and outer zones.

2.2.3. Dual-Flow-State Model

Based on the fact that a line with slope of 0.5 often appears on the well-testing curve in the Tarim Basin, which shows a characteristic linear flow at the late stage, we establish a model including an inner dual-porosity region and outer linear flow region. The inner zone is the same as in the radial composite model, and the control equations will not be elaborated here. The governing equation describing the linear flow in the outer zone is as follows [29]:
2 ψ 2 m D 2 x 2 m D = η 1 η 2 ψ 2 m D t D
where ψ1m represents the dimensionless pseudo-pressure of the outer matrix; x2m denotes the dimensionless distance in the x direction.
The condition at the junction interface is as follows [29]:
ψ 1 D = ψ 2 D , ψ 1 D r 1 D = k 2 μ 1 k 1 μ 2 ψ 2 D x 2 D

2.2.4. Local Heterogeneity Model

The local heterogeneity mathematical model can be divided into two parts, describing, respectively, the inner flow process of the matrix and the flow process from the matrix to fractures and then to the matrix and finally to the wellbore.
  • Inner flow process of matrix
For all matrix blocks except for the matrix where the well is located, the investigation radius is used to simulate the equal pressure line of the matrix blocks [30], as shown in Figure 3. The edge pressure of the matrix is the lowest, and the inner pressure of the matrix is the highest. From the inner to the outer seepage, each matrix edge can be considered as a well, and the matrix blocks can have any shape with a larger set area.
The governing equation in radial coordinates can be expressed as [30]:
2 ψ 2 r 2 2 + ω ( r ) ψ 2 r 2 = 1 3.6 η 2 ψ 2 t
where ψ2 denotes the pseudo-pressures in the matrix, MPa2/(mPa·s); η2 denotes the diffusion coefficient of matrix, m2/h; r2 denotes the radial distance in the matrix, m.
ω(r) is defined as follows and is equal to 0, 1/r, and 2/r for linear flow, radial flow, and spherical flow, respectively [30]:
ω ( r ) = 1 C ( r ) d C ( r ) d r
C(r) is the diffusion area of the matrix fluid and is expressed as follows [30]:
C ( r ) = R in   r R in   C 0 = 1 r R in   C 0 ,   0 r R in  
2.
Flow process from matrix to fracture and then to matrix and finally to the wellbore
After the fluid flows from the matrix to the fracture, the pressure difference in the fracture can be ignored under the assumption that fractures are of infinite conductivity. Under this assumption, fluid in each matrix flows directly to the matrix block containing the wellbore and then it flows radially to the wellbore.
The material balance equation for the fracture system can be expressed as [30]:
i = 1 i = n 0 t q i d t + 0 t q s c B d t = c t f V f ϕ f p i p f
where n represents the number of matrixes, dim; qi represents the flux from each matrix to fracture; m3/d.
The radial flow equation of the matrix block where the wellbore is located is as follows:
1 r 1 r 1 r 1 ψ 1 r 1 = 1 3.6 η 1 ψ 1 t
where ψ1 denotes the pseudo-pressures in the matrix, MPa2/(mPa·s); η1 denotes the diffusion coefficient of the matrix, m2/h; r1 denotes the radial distance in the matrix, m.

3. Results of Models

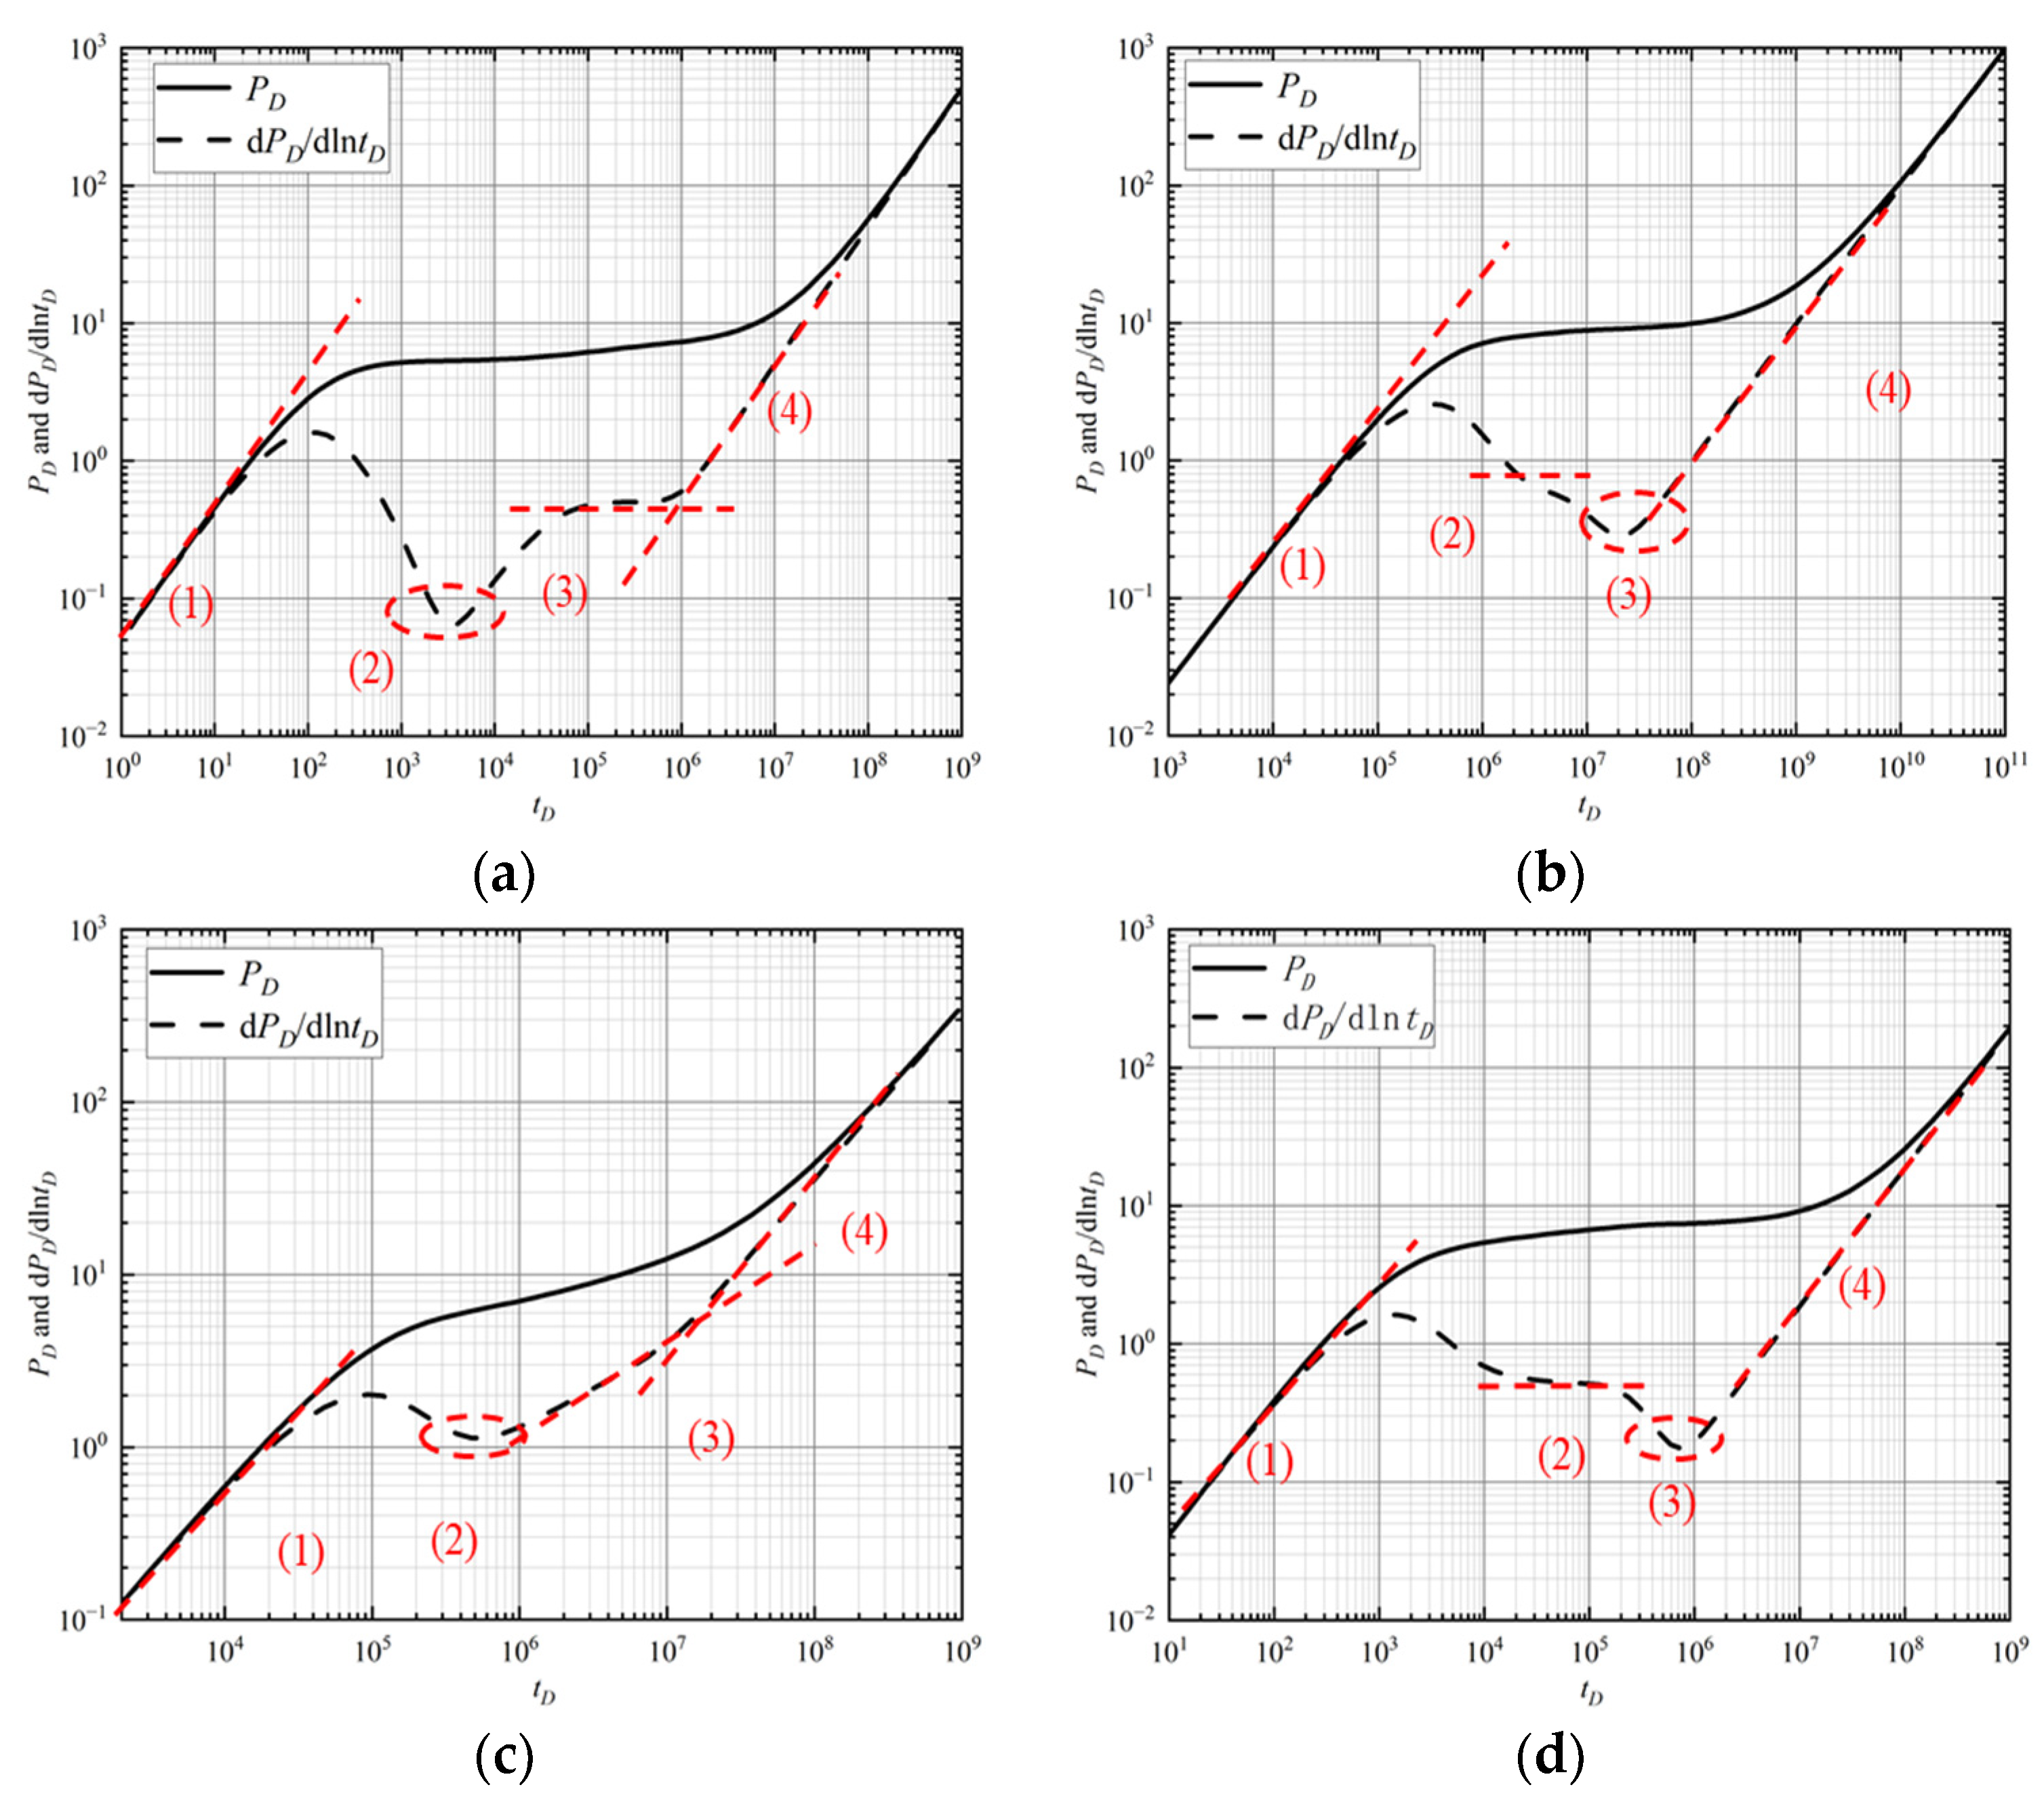
3.1. Typical Well-Testing Curve Chart and Flow Stage Division

By combining the seepage control equation and continuity equation, a MATLAB program is used to solve the equations. With time as the x-axis and dimensionless pressure and pressure derivative as the y-axis, typical well-testing curve diagrams for different well-testing models are drawn (Figure 4), and the curves are divided into four stages using well-testing analysis methods.
According to the typical well-testing curves, the gas seepage process can be divided into four stages: (1) and (4) are common stages of the four models, and stage (1) shows a pressure derivative slope of 1 and “hump” characteristics, namely wellbore storage and skin effect stage; stage (4) exhibits a characteristic of a later pressure derivative slope of 1, which is the boundary control flow stage. The differences between the four models are mainly reflected in stages (2) and (3), where the Warren–Root model stages (2) and (3) show a concave and horizontal line, respectively, that implicates the dual-porosity stage and radial flow stage, while the dual-flow-state model shows a concave line in stage (2) but shows a slope of 0.5 in stage (3), that is, the fluid inside the outer matrix flows linearly into the fractures. Stages (2) and (3) of the radial composite model and local heterogeneity model are radial flow and dual-porosity stages, respectively. The differences between the radial composite model and local heterogeneity model are that the duration of the wellbore storage stage in the radial composite model is longer and the dual-porosity characteristic is more obvious in the local heterogeneity model which is slightly influenced by the elastic storage ratio.

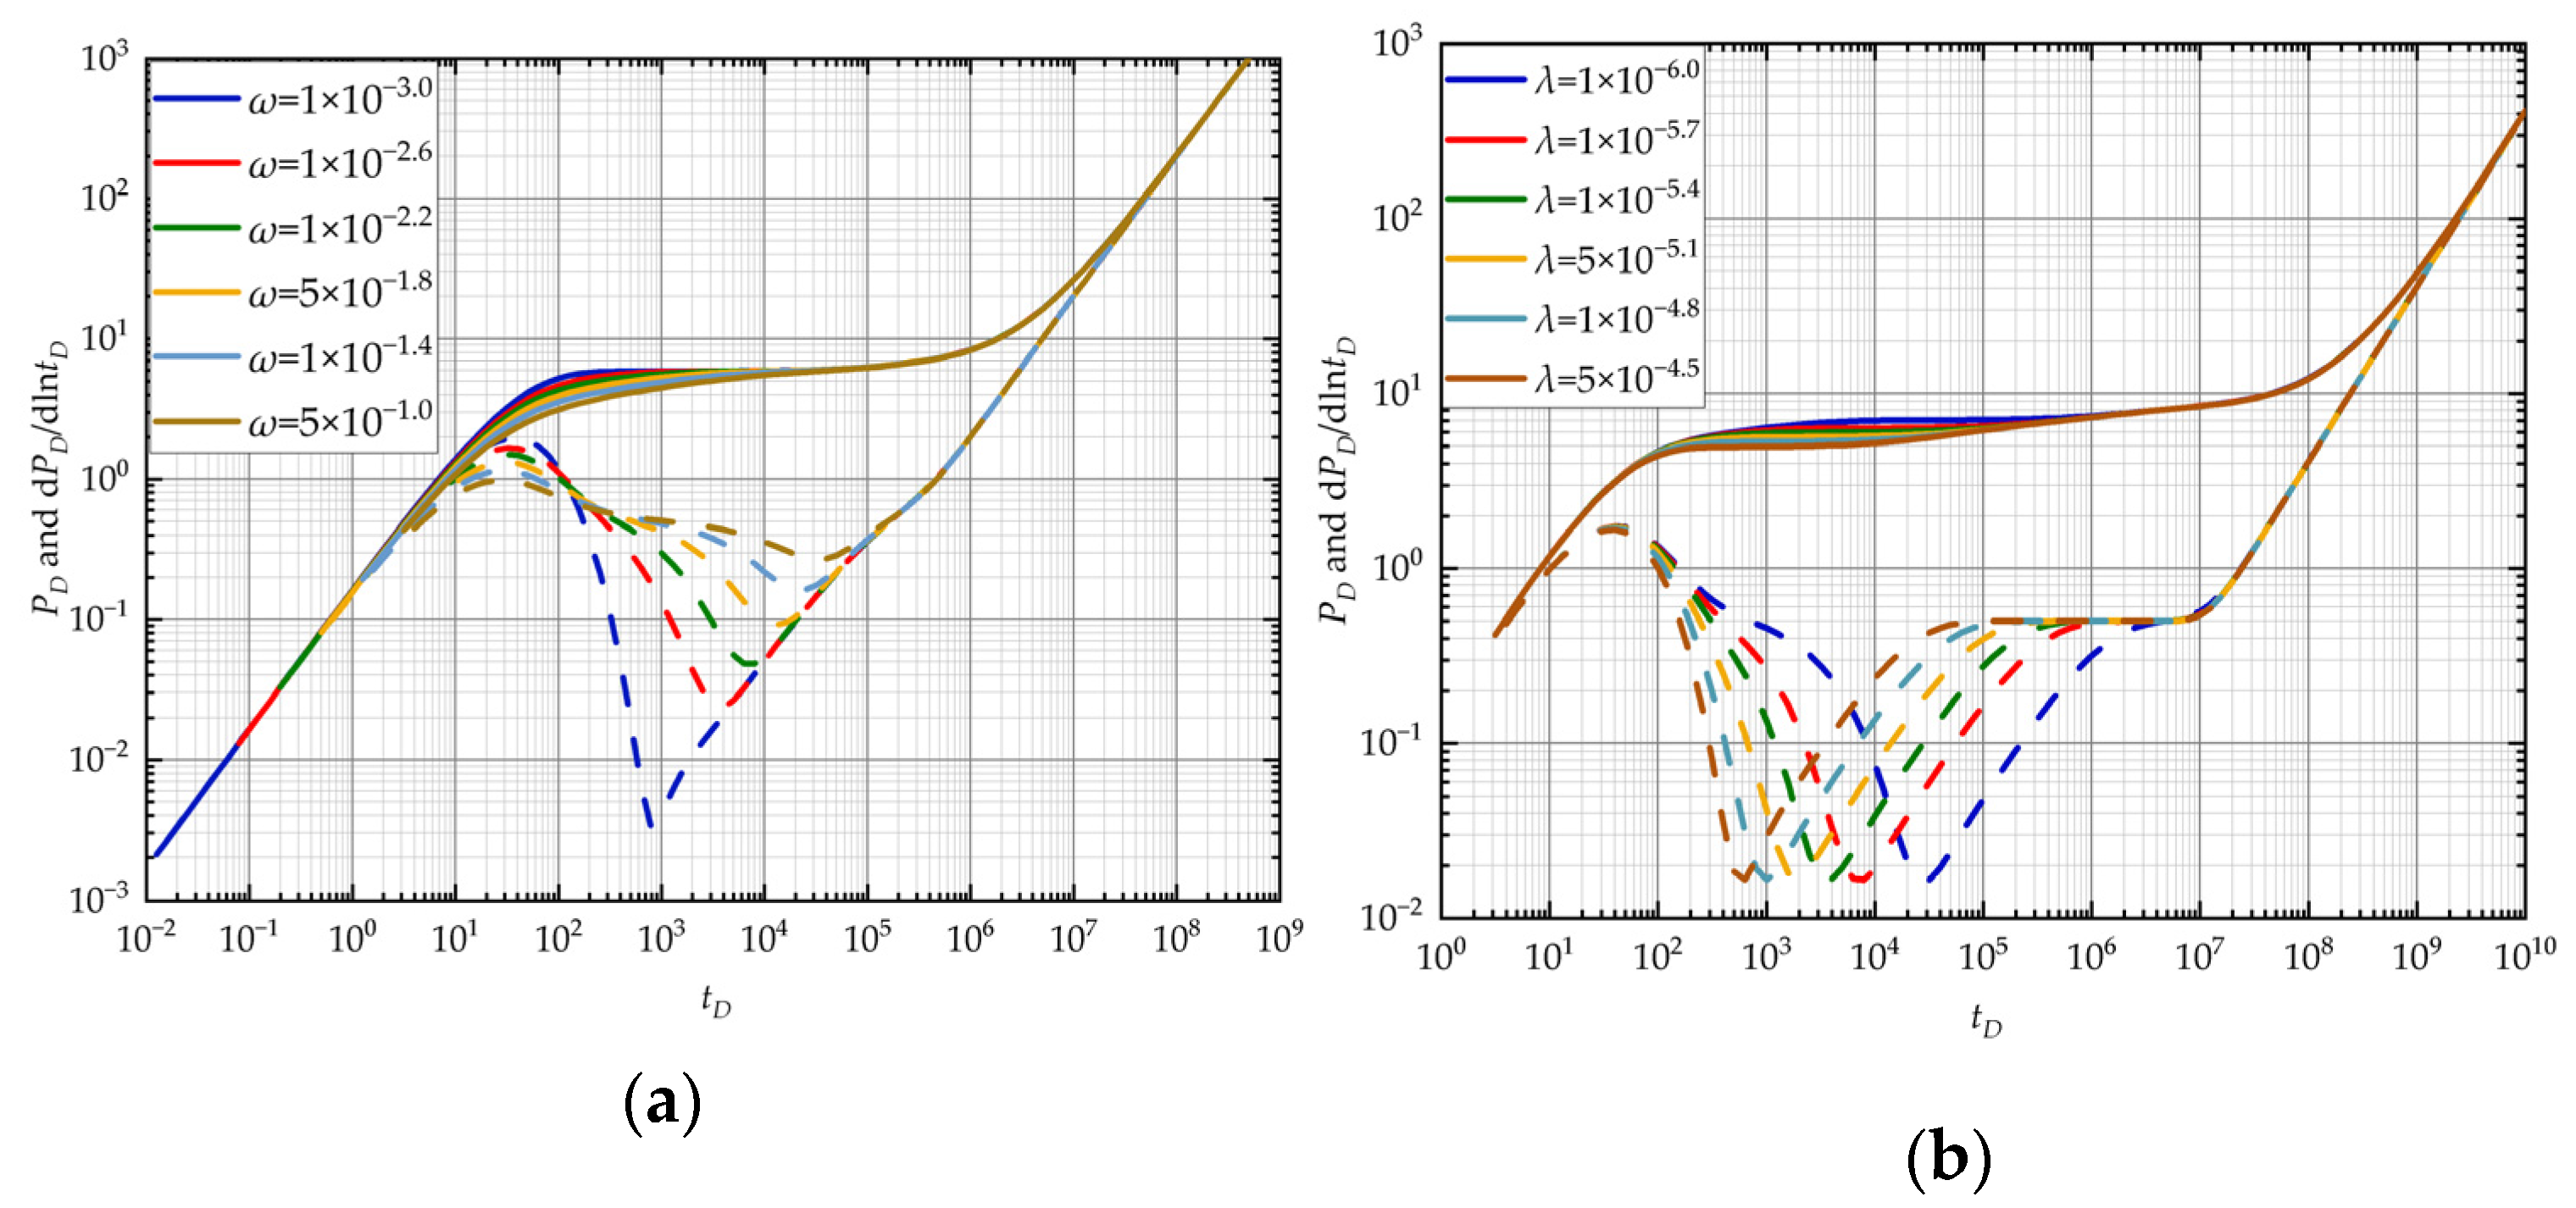
3.2. Sensitivity Analysis of Well-Testing Curves

In this section, we conduct a sensitivity analysis on the four well-testing models under different conditions to investigate pressure transient behaviors such as elastic energy storage ratio, cross-flow coefficient, and matrix block area and their impact on typical well-testing curves is summarized. Studying different sensitivity parameters is of great significance in understanding the range of influence of each parameter on the well-testing curve and also helps to interpret well-testing data in the next step and understand pressure data measured on-site.

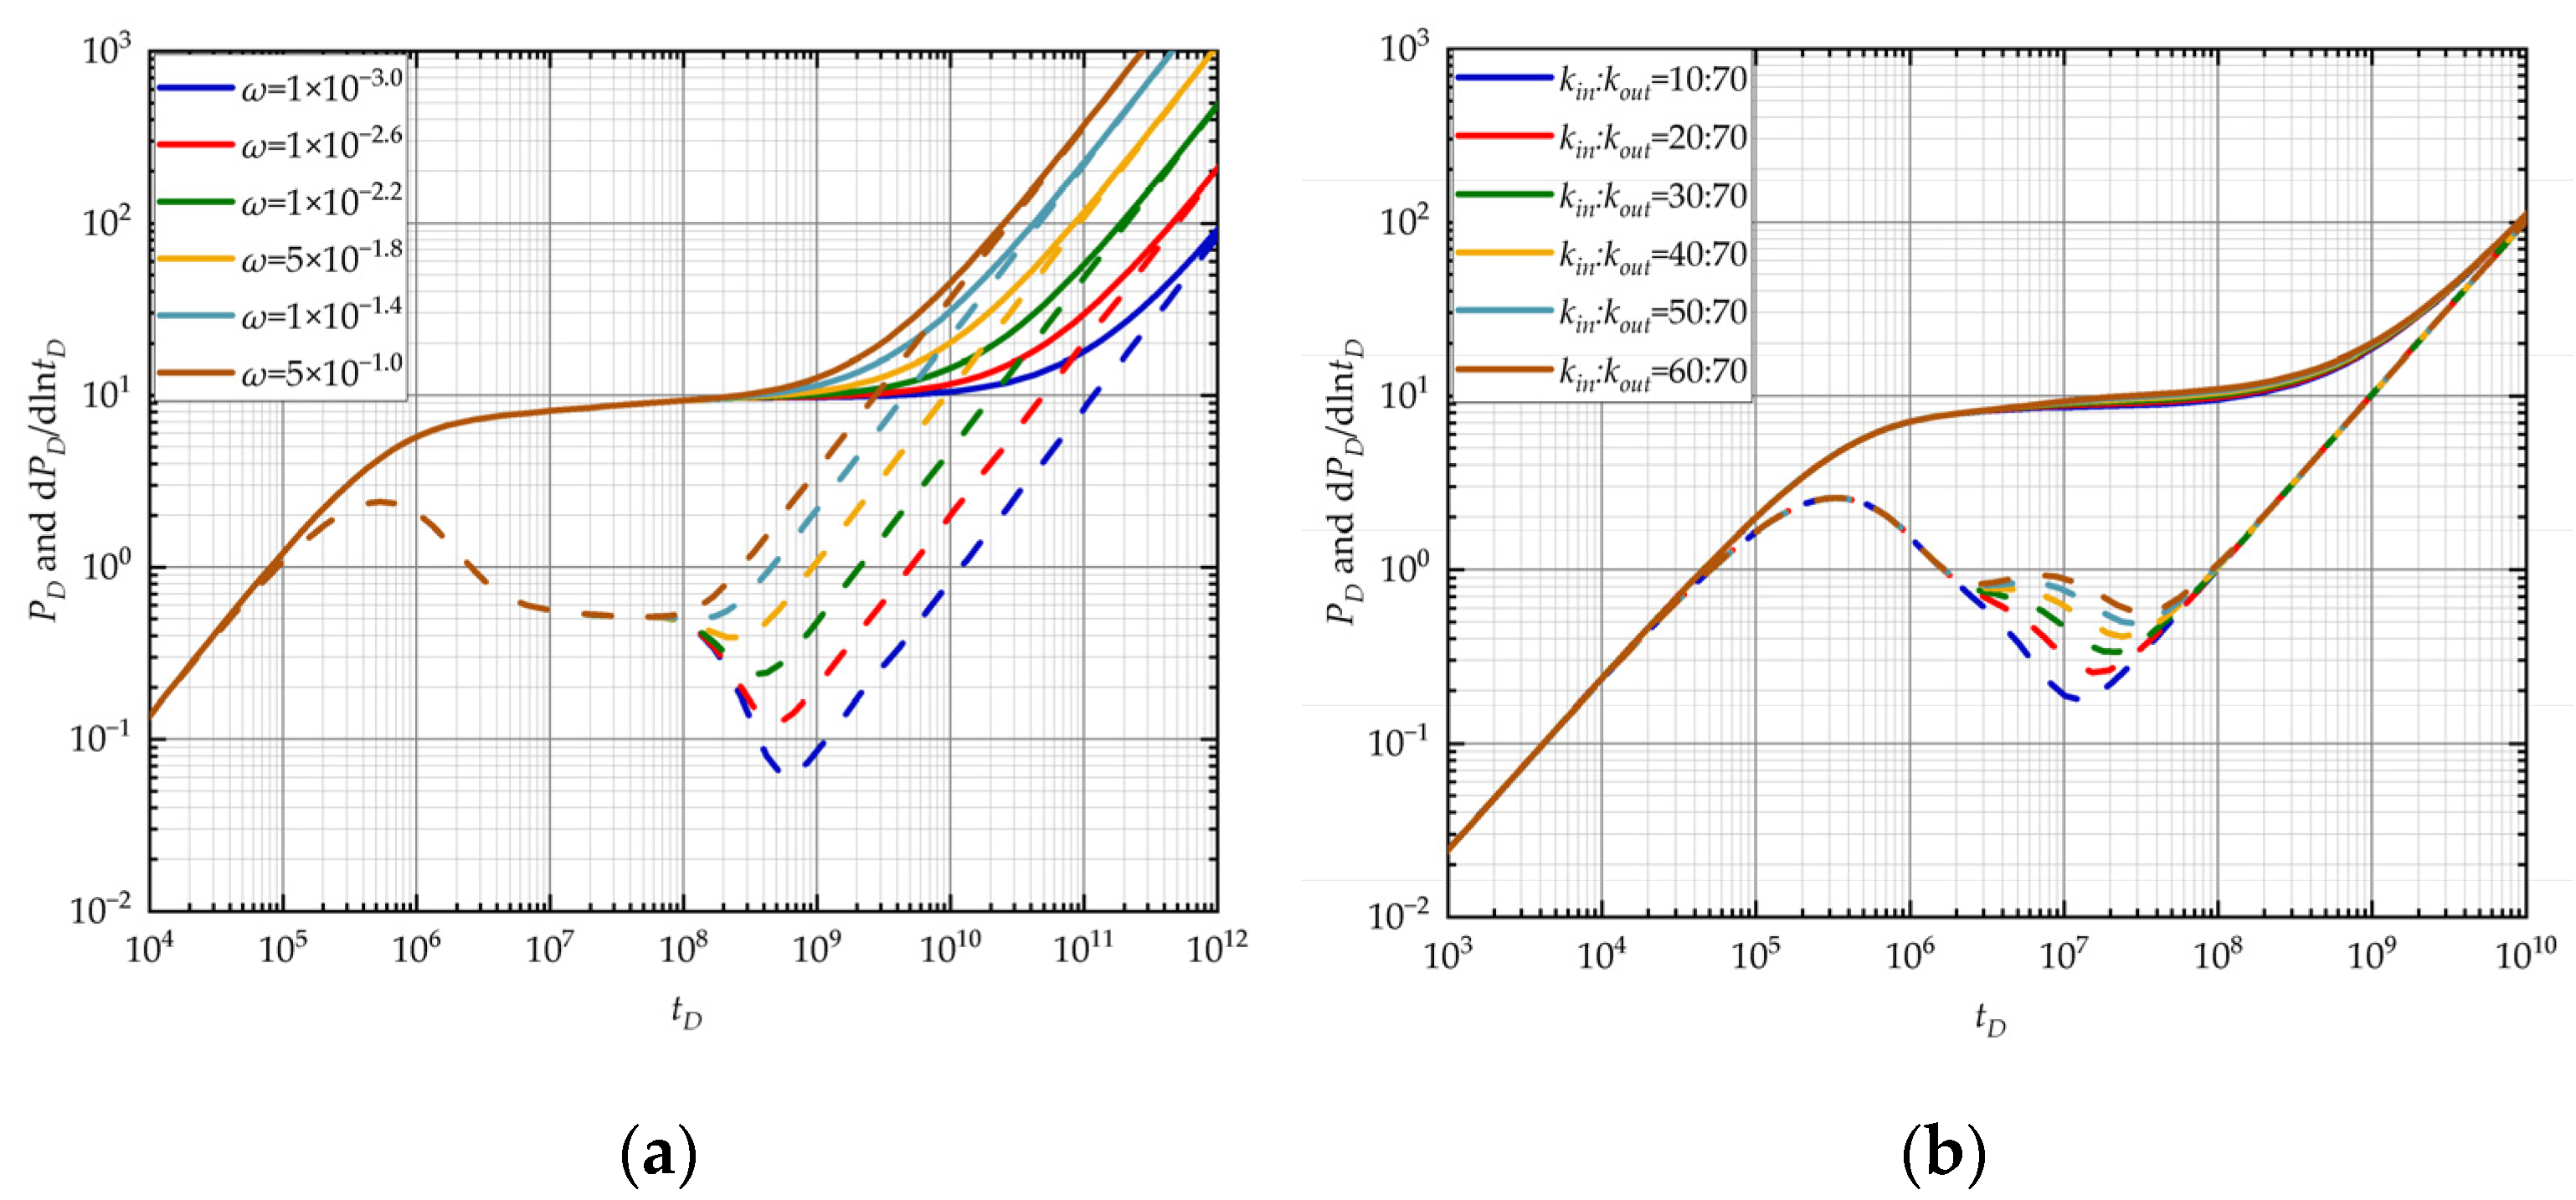
3.2.1. Warren–Root Model

As shown in Figure 5, the elastic storage capacity mainly influences the degree of hump and “depression”; as the elastic storage capacity ratio increases, the fracture storage and gas supply capacity are enhanced, so the “hump” gradually decreases which reflects milder pressure buildup, and the curve shows a decrease in the degree of “depression”, indicating a weakening of the matrix’s ability to supply to fractures. When the elastic energy storage ratio equals 1, the “depression” will not be observed but directly appear as a planar radial flow in the well-testing curve. The cross-flow coefficient only influences the occurrence of concavity but not the degree. The greater the cross-flow coefficient, the earlier the occurrence of concavity, reflecting the earlier the supply of the matrix to the fracture begins.

3.2.2. Radial Composite Model

As shown in Figure 6a, in the dual-porosity stage, the degree of concavity of the derivative curve gradually decreases with the increase in the elastic energy storage ratio, until it completely disappears. In the later stage of boundary flow, pressure waves reach the reservoir boundary and fluid flow enters a pseudo-steady state. In general, a horizontal line can be seen after the dual-porosity stage, indicating the planar radial flow. However, due to the small radius parameter setting, the horizontal line cannot be seen and results in different time to reach the reservoir boundary that is displayed as multiple parallel straight lines with a slope of 1. The larger the elastic energy storage ratio, the earlier it reaches the boundary and the larger the value of the pressure derivative. As shown in Figure 6b, at the radial flow stage, as the permeability ratio of the inner and outer zones increases, the radial flow time also increases continuously, and its derivative curve shows a horizontal straight line with a value of 0.5. During the cross-flow stage, the degree of curve concavity decreases with the increase in the permeability ratio. Different from the curve shapes under different elastic storage ratios, the graph shows multiple overlapping straight lines with a slope of 1 in the boundary flow stage because of the same elastic storage ratios.

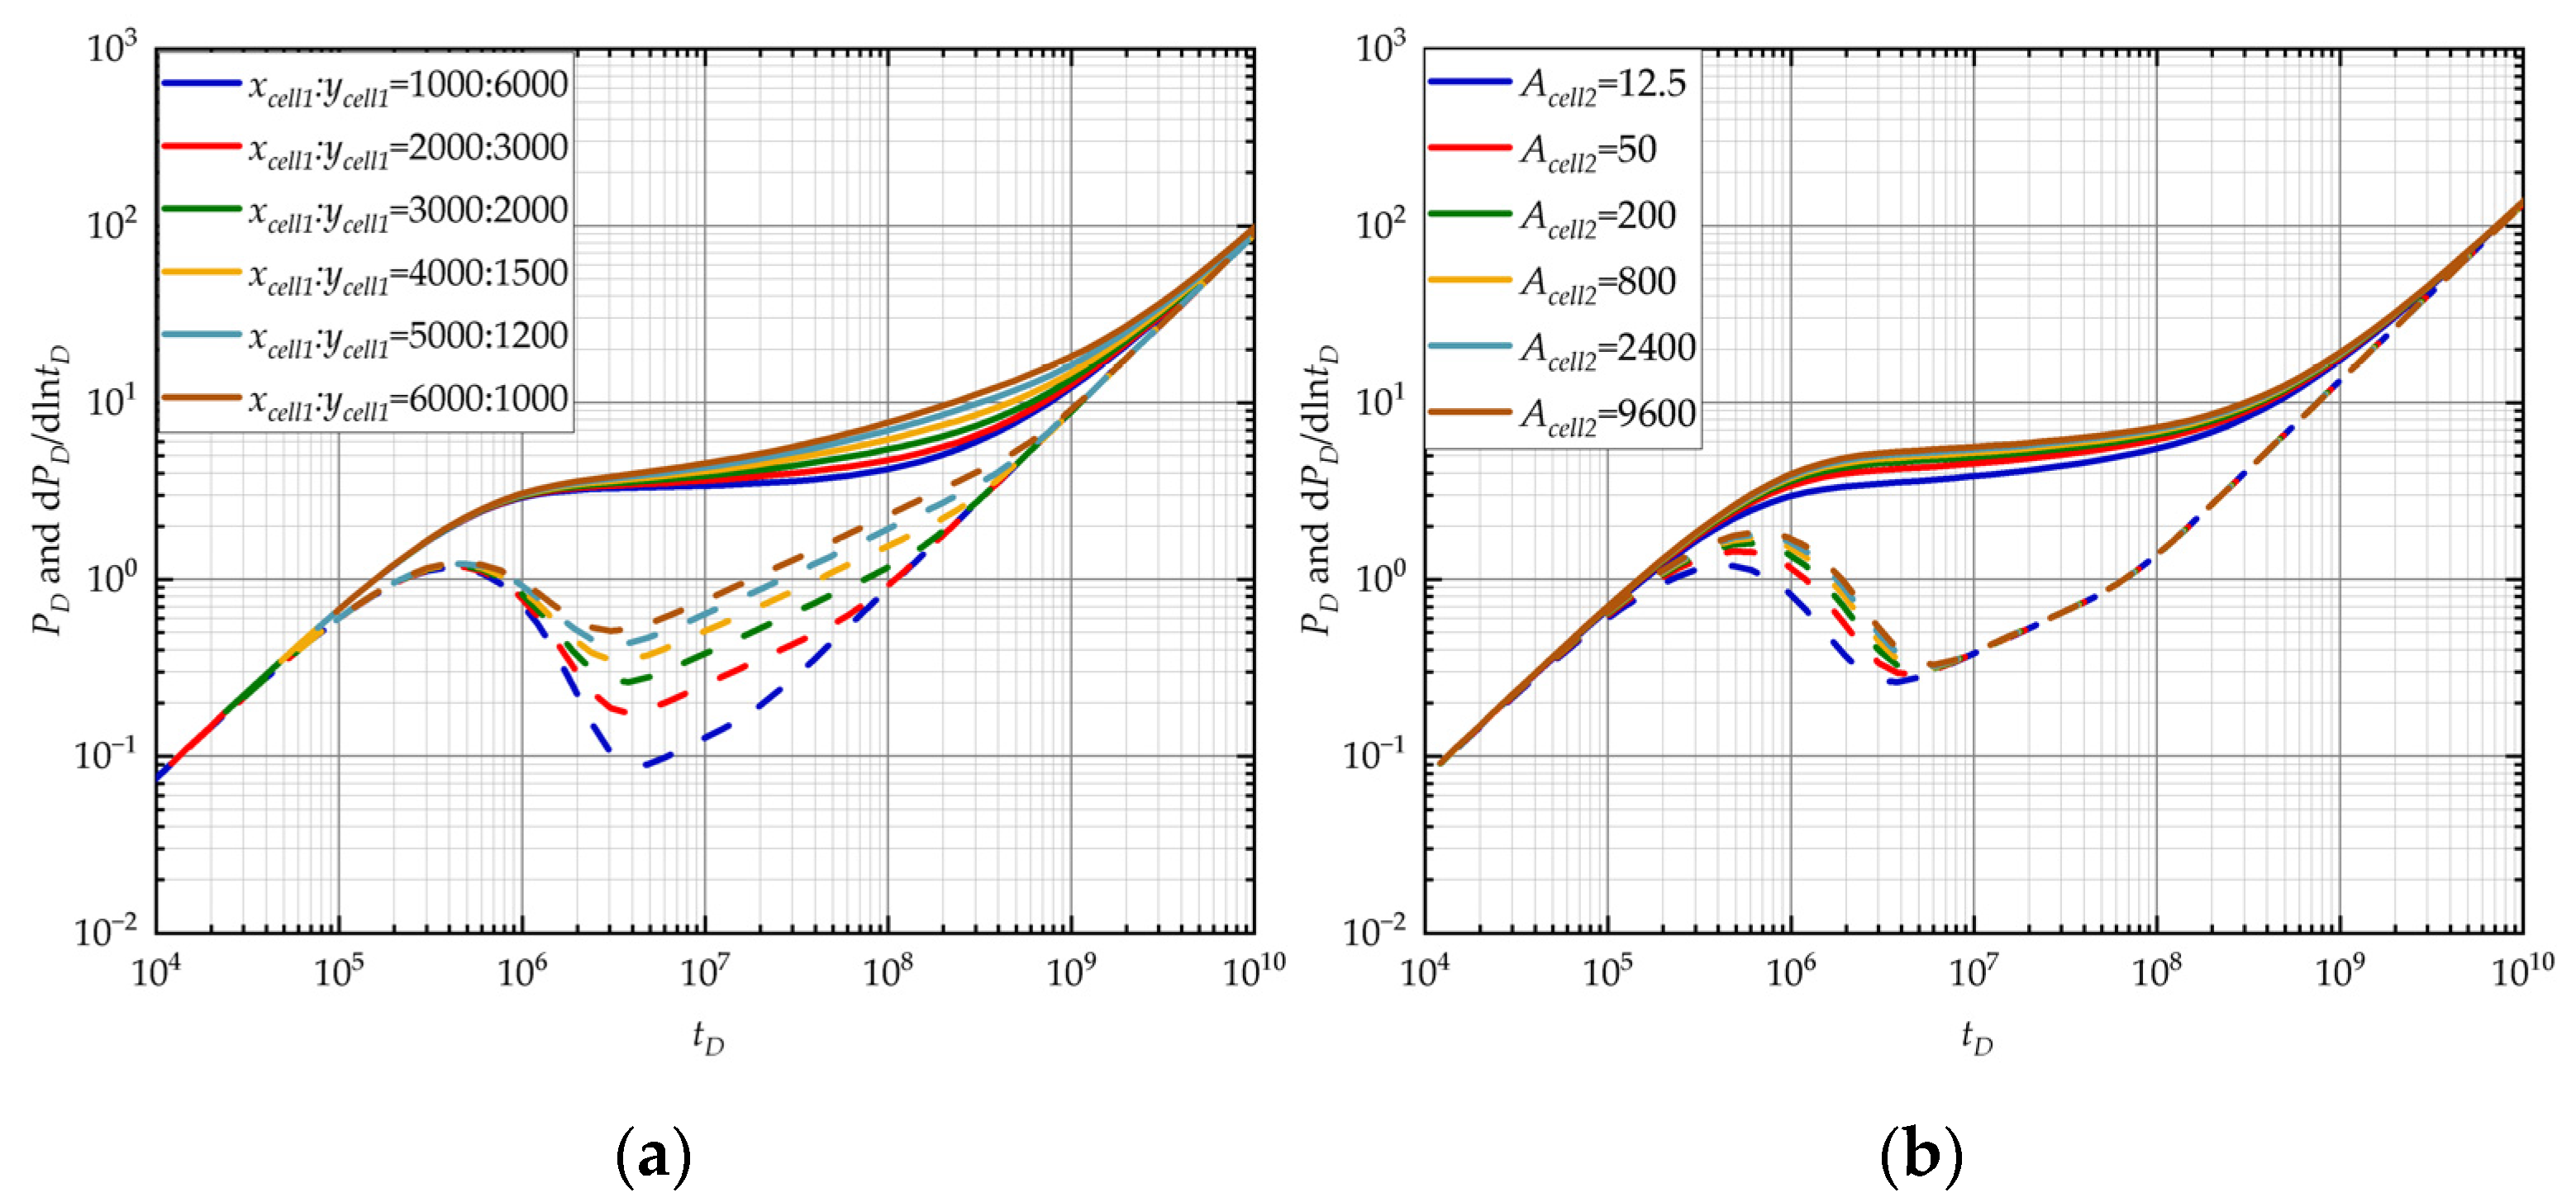
3.2.3. Dual-Flow-State Model

As shown in Figure 7, when the area of the linear flow substrate remains constant, the aspect ratio (i.e., the ratio of the length in the x direction to length in the y direction of the matrix block, which in fact reflects the shape of the reservoir) will affect the degree of concavity of the pressure derivative curve and the time to reach the boundary flow. As the aspect ratio increases, the reservoir length in the x direction will be larger, the degree of concavity in the curve decreases, and both the pressure drop and pressure derivative increase, with a longer linear flow time and later arrival time at the boundary flow stage. When the area of the matrix block decreases, the hump and pressure decrease. The area of the matrix block does not affect the linear flow and boundary flow stages and presents two straight lines with slopes of 0.5 and 1 on the well-testing curve.

3.2.4. Local Heterogeneity Model

As shown in Figure 8a, as the elastic storage capacity ratio increases, the pressure drop and pressure derivative of the reservoir gradually increase, and the increase in the amount decreases, with the curve showing a decrease in the degree of depression. In the later stage of boundary flow, pressure waves reach the reservoir boundary and the graph shows multiple parallel straight lines with a slope of 1. As shown in Figure 8b, as the area of the matrix block increases, the radial flow time increases because the pressure response requires more time to propagate to the boundary of the matrix block where the well is located, which leads to a more pronounced radial flow stage. The pressure derivative curve gradually shifts upwards, showing a decrease in the degree of concavity, which is because when the matrix block area increases, the number of matrixes will decrease and the dual-porosity characteristic will tend to disappear on the well-testing curve. The area of the matrix block plays an insignificant role in the occurrence of the boundary flow stage and presents basically overlapping lines with a slope of 1 on the well-testing curve.

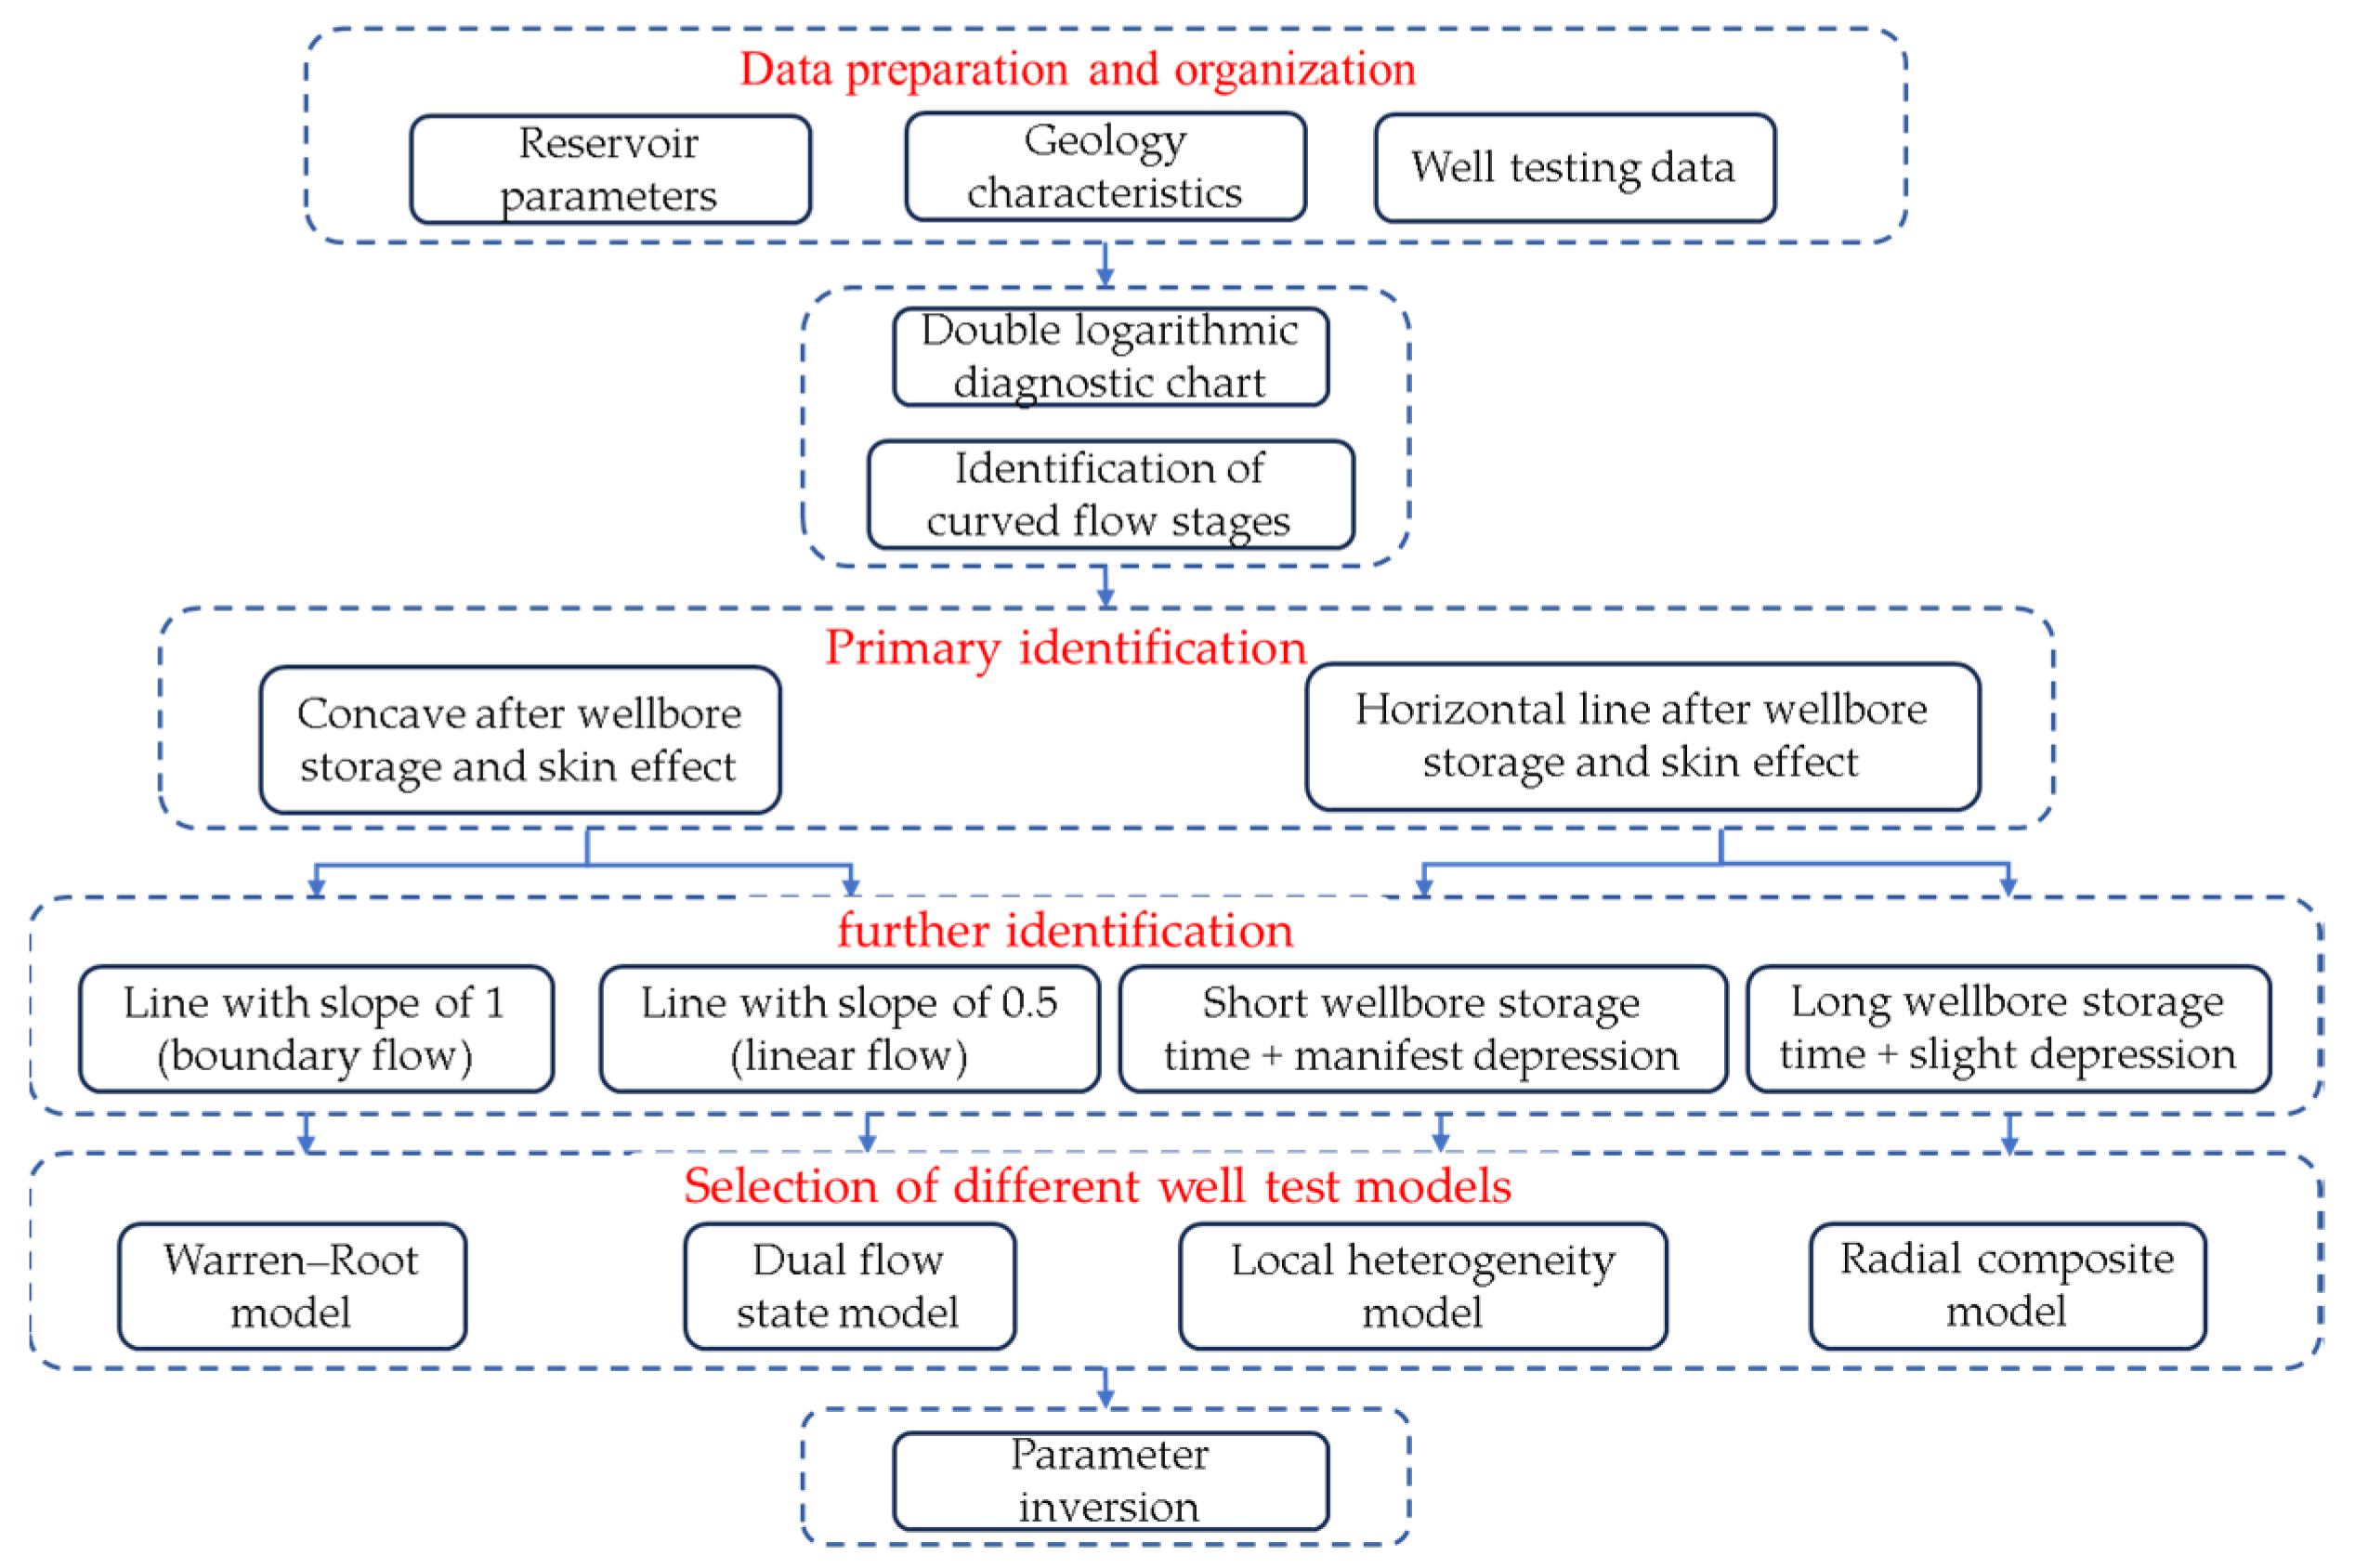
4. Identification Procedure of Well-Testing Model

Based on the four proposed well-testing models, a multi-scale media well-testing model identification procedure for faults, pores, and fractures is established, as shown in Figure 9.
The basic identification process includes the following:
  • Based on the basic parameters of the reservoir, geology characteristics, and well-testing data, we first plot the pressure and its derivatives in a log–log coordinate, namely pressure transient analysis (PTA) curves;
  • According to the analysis of the characteristics of the flow stages in the well-testing curve, when a concave curve appears after the wellbore storage and skin effect stage, followed by a horizontal line and boundary flow which manifests as a line with a slope of 1 on the derivative curve, the Warren–Root model should be used for well-testing analysis. However, due to the fracture development heterogeneity, the area of the “Warren–Root system” is small and the horizonal line is always covered by a boundary line which leads to the “disappearance” of the radial flow stage;
  • When linear flow characteristics with a slope of 0.5 and a boundary flow stage with a slope of 1 appear after concavity on the well-testing curve, the dual-flow-state model should be used for well-testing analysis. For most cases, there is only the line with a slope of 0.5 and the line with a slope of 1 does not coexist with it. So, the line with a slope of 0.5 can serve as a sign for choosing the dual-flow-state model for parameter inversion.
  • If the time of the wellbore storage effect stage is short and radial flow characteristics appear on the curve after it and subsequently a concave line appears, the local heterogeneity model should be used for well-testing analysis;
  • However, the time of wellbore storage effect stage may be difficult to identify which can lead to misjudgment of the well-testing model. So, the geology characteristics and curve analysis are needed to help choose the appropriate model. If the reservoir geology characteristics near the well show local heterogeneity with high fracture development, the local heterogeneity should be considered first. Furthermore, from parameter sensitivity analysis, we can obtain that the elastic storage ratio can influence the degree of depression for the radial composite model while it has a slight influence on the local heterogeneity model due to its local fracture development. So, if the degree of concavity on the curve is not significant, the radial composite model is more appropriate for parameter inversion.
Two important pieces of information can be obtained through this identification procedure. Firstly, it reveals the reservoir pattern around the well, including the multi-scale media characteristics of faults, pores, and fractures. This information, when combined with the dynamic characteristics of gas well production, allows for the implementation of corresponding measures to address issues such as water invasion. The second piece of information involves the inversion of reservoir parameters, which holds significant importance for productivity calculation, gas well classification, and evaluation of development effects.

5. Model Application

5.1. Field Case

The target block is located in the Kuche area of the Tarim Basin. The reservoir is deeply buried, with high formation pressure, poor matrix properties, and widespread development of fractures. The density of fractures is high, the filling is small, and the opening is good. The matrix–fracture pattern is complex, making it a typical deep high-pressure fractured sandstone gas reservoir.
  • Data collection and organization. Collect and organize input parameters for well-testing models, including reservoir properties, natural gas properties, and wellbore and pressure-testing data, as shown in Table 1 and Table 2.
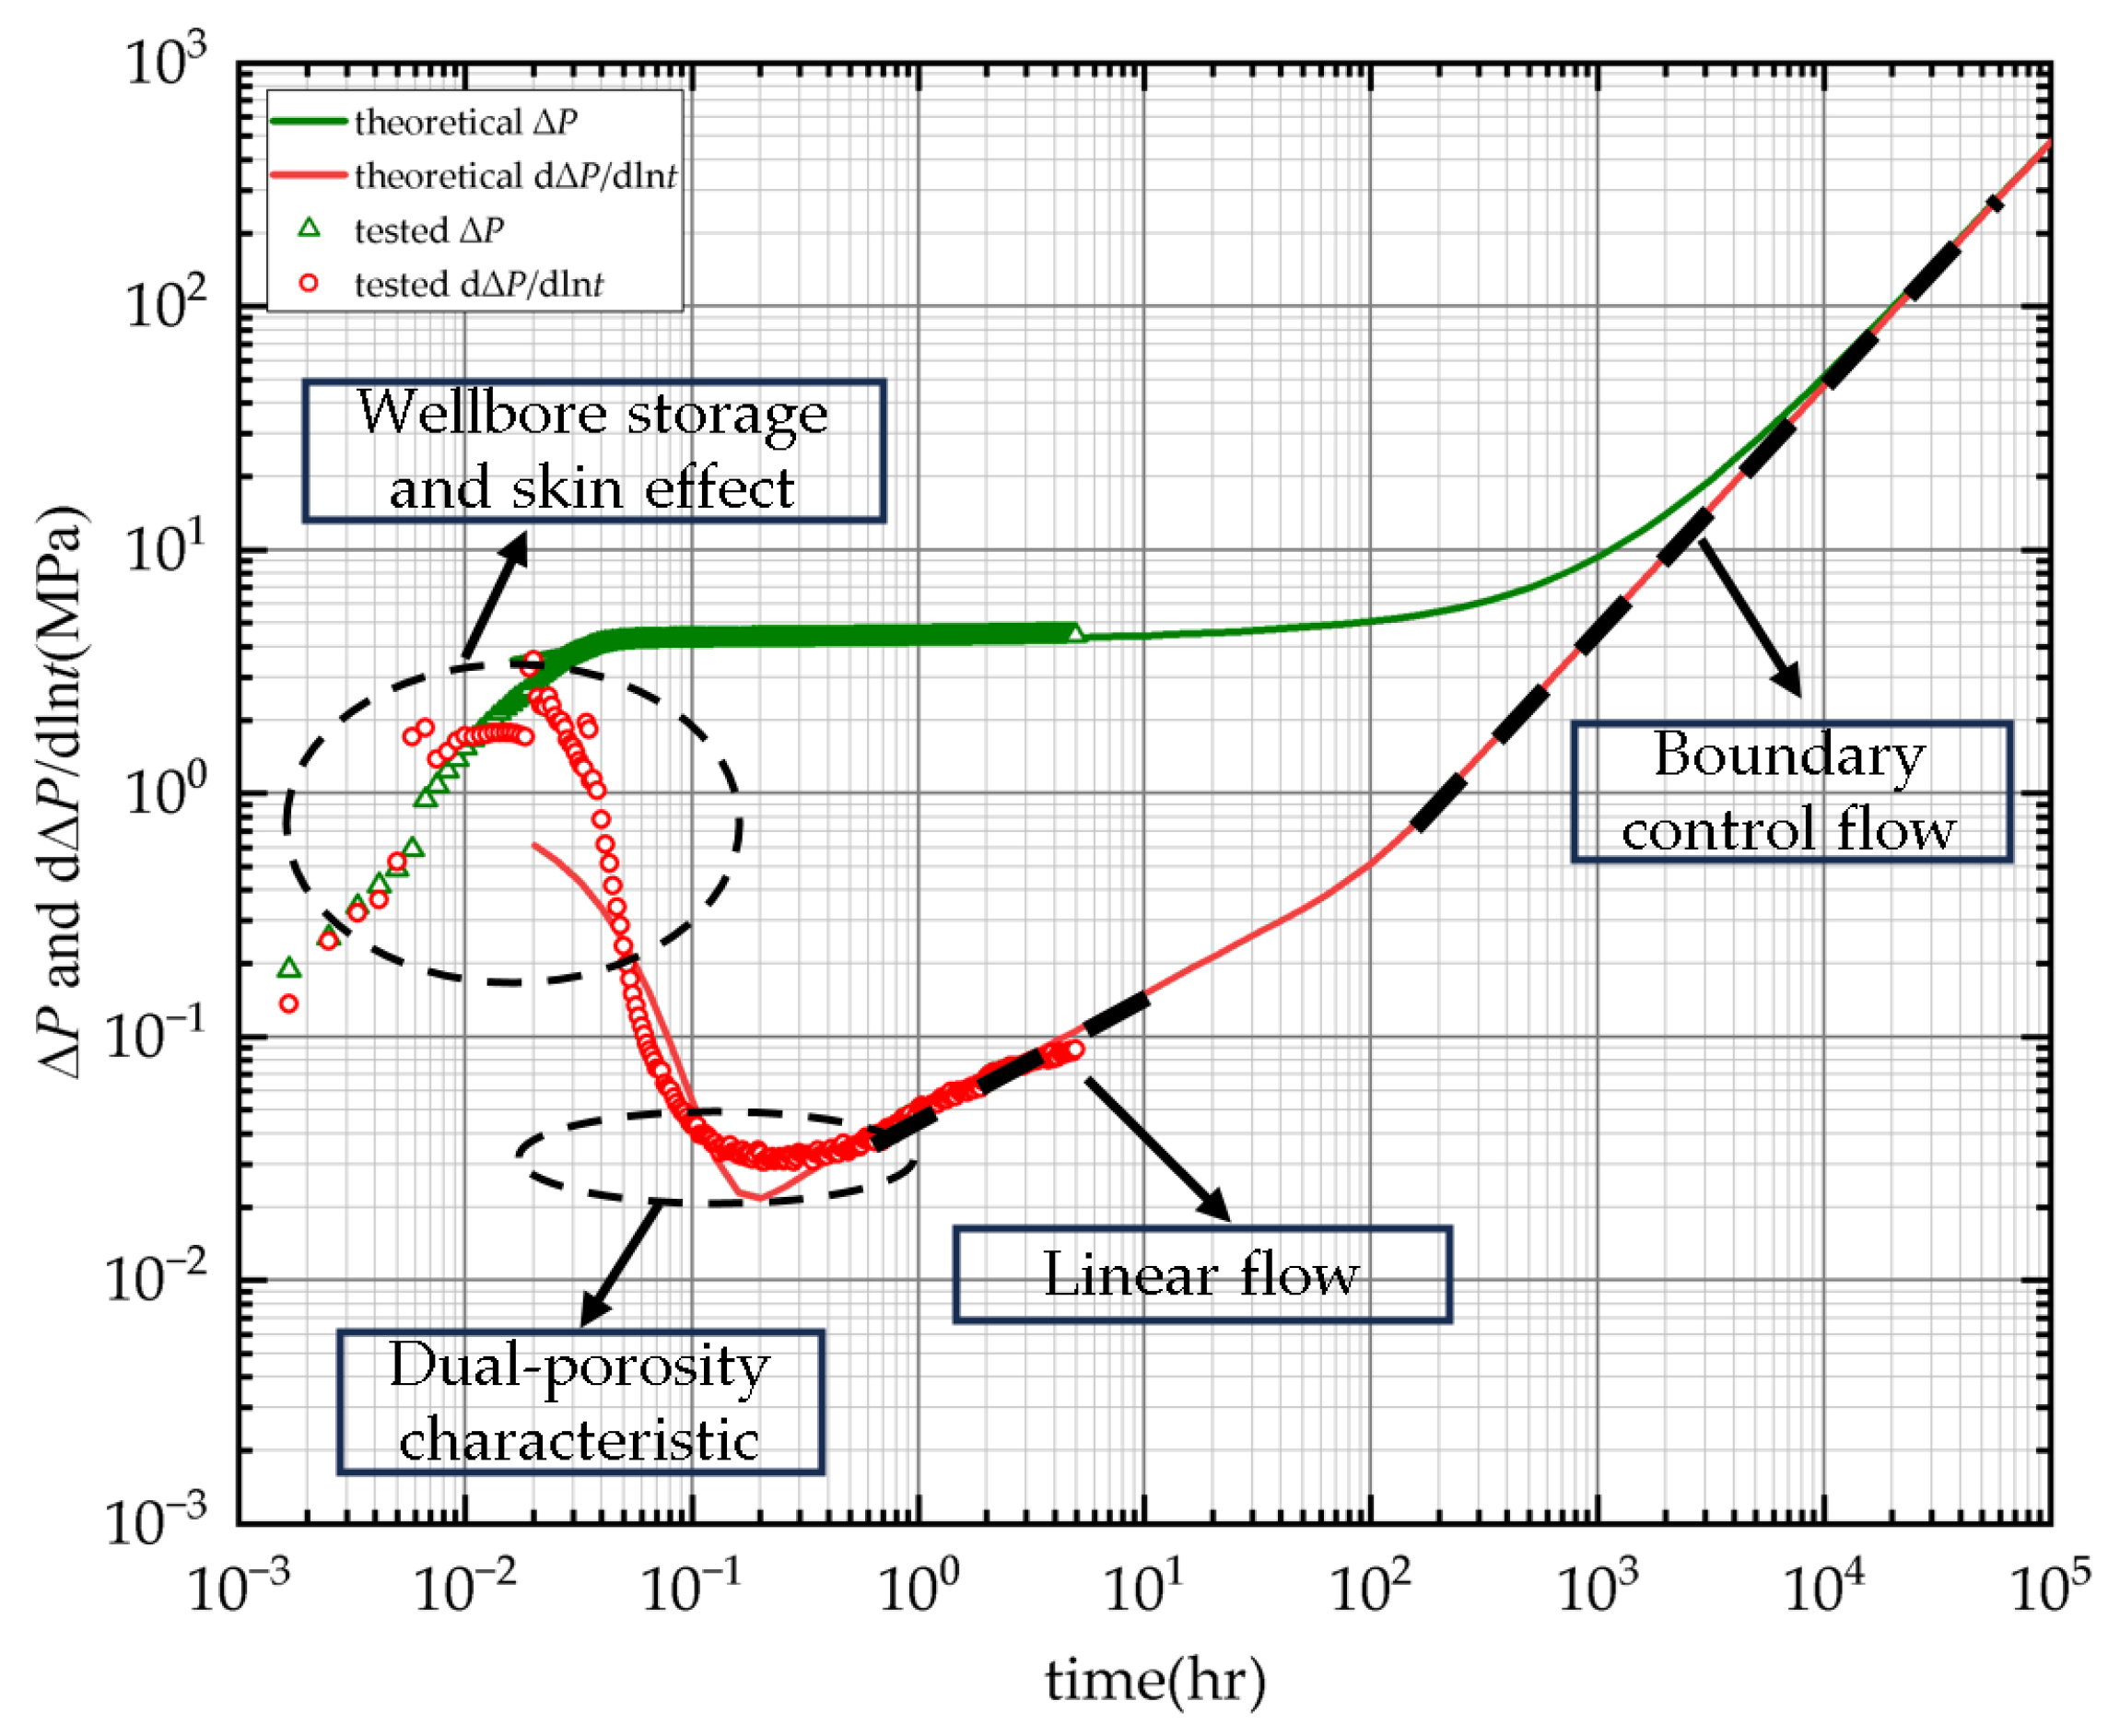
  • Parameter import and curve plot in log–log coordinate. Input the sorted gas reservoir and gas parameters and import the data from the shut-in wellbore pressure recovery test. Plot the pressure and its derivatives in a log–log coordinate (Figure 10);
  • Determine the analyzing model based on the curve shape. According to the identification procedure of different well-testing models and combined with the analysis of the well’s surrounding formation, the derivative curve exhibits characteristics of concavity and a slope of 0.5. Thus, the seepage characteristics conform to the dual-flow-state model. This model is used for this pressure recovery analysis, and the fitting results are shown in Figure 11;
  • Division of flow stages and inversion results. The well-testing curve can be categorized into four stages: ① well storage and continuation flow stage: including wellbore storage and skin effect; ② dual-porosity characteristics. The curve exhibits a “concave” characteristic, representing dual-porosity features; ③ linear flow stage: the derivative curve shows a linear upward trend with a slope of 0.5; ④ boundary flow stage: it shows an upward trend due to obstructed flow, indicating a boundary flow with a slope of 1 (as the testing time was short, the results did not fully manifest the boundary flow characteristics). The curve-fitting rate is 85% calculated by the following method and inversion parameter results derived from the model are presented in Table 3.
R = 1 1 n v m o d e l v a c t u a l v a c t u a l
where n is total number of well-testing points; vmodel is the value calculated by our model; vactual is the value from well test data.

5.2. Discussion

The well-testing curve indicates that the reservoir around the well conforms to the dual-flow-state model and the fitting rate exceeds 85% which shows the accuracy of the dual-flow-state model. Specifically, the well is located within a relatively dense matrix, with directional development of fracture zones around the well. There are also matrixes where linear flow appears at the edge of the reservoir. Existing research indicates that a well, located 3 km east of the current well, has been drilled into the water layer. Therefore, for the well we have studied, it belongs to the edge water gas reservoir. According to our well-testing model and corresponding results, linear seepage from the distant matrix towards the fracture zone exists within the range of well control, which may result in rapid water invasion into the fracture zone. Many studies and field development have shown that water invasion is the most important factor leading to low recovery of the reservoir. When water reaches the well, it will be too late to adopt measures to restrict it because large fractures always developed in the ultra-deep reservoir and water can invade the reservoir along the fractures rapidly. Therefore, it is necessary to give early warning of water invasion which can be determined by monitoring chloride ions and other means. It is important to reduce the production rate of the well or take strong drainage measures to slow down the linear flow of water from the matrix to the fracture system and rapid flow along the fractures to increase the water-free gas production period of the gas well and ultimately improve the recovery rate.

6. Conclusions

  • Based on the characteristics of fracture development in the Tarim Basin and Warren–Root model, we established a set of identification methods of multi-scale media well-testing models suitable for different matrix–fracture patterns and conducted parameter sensitivity analysis for each of the four models, which can be used for the selection of well-testing models and inversion of formation parameters. Different from numerical well-testing methods, this is less time consuming and fewer parameters are needed.
  • The application to the well in the Tarim Basin demonstrated that the theoretical curve in the log–log coordinate was consistent with the actual curve, with a curve-fitting rate exceeding 85%, which showed the accuracy of the identification procedure.
  • Pseudo-pressure was used for the solution in this article that conforms to the properties of gas and formation heterogeneity considered in the local heterogeneity model by using a depth of investigation (DOI) method.
  • A field case study shows it can be feasibly used for parameter inversion in the Tarim Basin. Combined with dynamic data, strategies for water prevention and control which are of great significance to production can be proposed. So, the procedure established in this paper can be widely used in the Tarim Basin to help guide gas development.
However, there are still problems remaining. For example, there is always water invasion into reservoirs in the Tarim Basin, but this was not considered in the article. As for reservoirs in the Tarim Basin, water is an important factor that should be considered and high pressure may influence the gas flow behavior. So, a two-phase flow model is needed in the future and the process of solving the mathematical model may be simplified according to some phenomena such as gas behaving as a microcompressible fluid such as oil or water.

Author Contributions

Conceptualization, X.W.; methodology, X.W. and B.C.; software, W.Z.; validation, X.W. and B.C.; formal analysis, F.Y.; investigation, X.W.; resources, L.L.; data curation, L.L.; writing—original draft preparation, D.C.; writing—review and editing, X.W.; visualization, W.Z.; supervision, J.W.; project administration, F.Y.; funding acquisition, D.C. All authors have read and agreed to the published version of the manuscript.

Funding

This research received no external funding.

Data Availability Statement

Due to the confidentiality of the company, the data that support the findings of this research are unavailable. Data may be available from the corresponding author upon reasonable request.

Conflicts of Interest

Authors Dong Chen, Fenglai Yang and Lei Liu were employed by the PetroChina Tarim Oilfield Company, Xin Wang and Junlei Wang were employed by the PetroChina, Baohua Chang were employed by the CNPC. The remaining authors declare that the research was conducted in the absence of any commercial or financial relationships that could be construed as a potential conflict of interest.

References

  1. Chang, B.; Tang, Y.; Zhu, S.; Li, S.; Cao, W. Well test characteristics and understandings of the ultra-deep fractured tight sandstone gas reservoirs: A case study on Keshen Gas Field in Tarim Basin. Petrol. Geol. Oilfield Dev. Daqing. 2021, 40, 167–174. [Google Scholar]
  2. Jia, C.; Li, Q. Petroleum geology of Kela-2, the most productive gas field in China. Mar. Pet. Geol. 2008, 25, 335–343. [Google Scholar]
  3. Li, B.; Zhu, Z.; Xia, J.; Ma, C. Development patterns and key techniques of coal-formed Kela 2 gas field. Pet. Explor. Dev. 2009, 36, 392–397. [Google Scholar]
  4. Han, D.; Xiong, W.; Jiang, T.; Gao, S.; Liu, H.; Ye, L.; Zhu, W.; An, W. Investigation of the Water-Invasion Gas Efficiency in the Kela-2 Gas Field Using Multiple Experiments. Energies 2023, 16, 7216. [Google Scholar] [CrossRef]
  5. Zhu, G.; Cui, L.; Zhang, Z.; Li, T.; Yang, H.; Chen, W.; Zhao, K.; Yan, H. Composition and origin of molecular compounds in the condensate oils of the Dabei gas field, Tarim Basin, NW China. Pet. Explor. Dev. 2019, 46, 504–517. [Google Scholar] [CrossRef]
  6. Yang, X.; Wang, Q.; Li, Y.; Lü, X.; Xie, H.; Wu, C.; Wang, C.; Wang, X.; Mo, T.; Wang, R. Formation mechanism of the Bozi-Dabei trillion cubic natural gas field, Kuqa foreland thrust belt. Earth Sci. Front. 2022, 29, 175–187. [Google Scholar]
  7. Zhu, W.; Mo, T.; Chen, C.; Hu, C.; Wang, C.; Shi, C.; Shi, L.; Li, P. Characteristics and Effects of Laminae on a Cretaceous Reservoir in the Bozi–Dabei Area of the Tarim Basin, China. Processes 2023, 11, 2472. [Google Scholar] [CrossRef]
  8. Jia, C. Key scientific and technological problems of petroleum exploration and development in deep and ultra-deep formation. J. China Univ. Pet. Ed. Nat. Sci. 2023, 47, 1–12. [Google Scholar]
  9. Jiang, T.; Teng, X.; Yang, X. Integrated techniques for rapid and highly-efficient development and production of ultra-deep tight sand gas reservoirs of Keshen 8 Block in the Tarim Basin. Nat. Gas. Ind. B 2016, 36, 30–38. [Google Scholar] [CrossRef]
  10. Chen, Z.; Zhang, S.; Zhou, B.; Liao, X.; Yu, W. A new numerical well testing model considering discrete fractures for heterogeneous fractured gas reservoirs. Nat. Gas. Ind. 2023, 43, 77–86. [Google Scholar]
  11. Barenblatt, G.; Zheltov, I.; Kochina, I. Basic concepts in the theory of seepage of homogeneous liquids in fissured rocks[strata]. Appl. Math. Mech. 1960, 24, 1286–1303. [Google Scholar] [CrossRef]
  12. Warren, J.; Root, P. The behavior of naturally fractured reservoirs. SPE J. 1963, 3, 245–255. [Google Scholar] [CrossRef]
  13. Kazemi, H. Pressure transient analysis of naturally fractured reservoirs with uniform fracture distribution. SPE J. 1969, 9, 451–462. [Google Scholar] [CrossRef]
  14. De Swaan, O.A. Analytic solutions for determining naturally fractured reservoir properties by well testing. SPE J. 1976, 16, 117–122. [Google Scholar] [CrossRef]
  15. Raghavan, R.; Ohaeri, C. Unsteady flow to a well produced at constant pressure in a fractured reservoir. In Proceedings of the SPE California Regional Meeting, Bakersfield, CA, USA, 25–26 March 1981. [Google Scholar]
  16. Luan, Z. Analytical solution for transient flow of non-newtonian fluids in naturally fractured reservoirs. Acta Pet. Sin. 1981, 2, 75–79. [Google Scholar]
  17. Jia, Y. Considering skin factor, dual medium of wellbore storage effect, effective hole diameter model of confined strata and typical curve. Nat. Gas. Ind. 1994, 5, 48–51. [Google Scholar]
  18. Yao, J.; Dai, W.; Wang, Z. Well test interpretation method for triple medium reservoir with variable wellbore storage. J. China Univ. Pet. Ed. Nat. Sci. 2004, 28, 46–51. [Google Scholar]
  19. Jiang, R.; Gao, Y.; Sun, Z.; Gao, Y.; He, S. Bottom pressure characteristics for eccentric fracture vertical well in dual-medium low-permeability reservoir. Fault-Block Oil Gas Field 2020, 27, 778–783. [Google Scholar]
  20. Martyushev, D.; Yurikov, A. Evaluation of opening of fractures in the Logovskoye carbonate reservoir, Perm Krai, Russia. Pet. Res. 2021, 6, 137–143. [Google Scholar] [CrossRef]
  21. Gao, Y.; Rahman, M.; Lu, J. Novel mathematical model for transient pressure analysis of multi-fractured horizontal wells in naturally fractured oil reservoirs. ACS Omega 2021, 6, 15205–15221. [Google Scholar] [CrossRef] [PubMed]
  22. Wu, M.; Li, T.; Zhao, G.; Zhao, J.; Cai, J. Well test model for horizontal well in dual-porosity three-zone composite reservoir. Well Test. 2022, 31, 6–12. [Google Scholar]
  23. Martyushev, D.; Yang, Y.; Kazemzadeh, Y.; Wang, D.; Li, Y. Understanding the mechanism of hydraulic fracturing in naturally fractured carbonate reservoirs: Microseismic monitoring and well testing. Arabian J. Sci. Eng. 2023, 1–14. [Google Scholar] [CrossRef]
  24. Martyushev, D.; Ponomareva, I.; Chukhlov, A.; Davoodi, S.; Osovetsky, B.; Kazymov, K.; Yang, Y. Study of void space structure and its influence on carbonate reservoir properties: X-ray microtomography, electron microscopy, and well testing. Mar. Pet. Geol. 2023, 151, 106192. [Google Scholar] [CrossRef]
  25. Sun, H.; Ouyang, W.; Zhu, S.; Wan, Y.; Tang, Y.; Cao, W. A new numerical well test method of multi-scale discrete fractured tight sandstone gas reservoirs and its application in the Kelasu Gas Field of the Tarim Basin. Nat. Gas. Ind. 2022, 42, 55–64. [Google Scholar] [CrossRef]
  26. Huang, L.; Liu, Q. Percolation mathematic model in compound gas reservoir with dual medium of excessive sections. Well Test. 2006, 15, 11–14. [Google Scholar]
  27. Al-Hussainy, R.; Ramey, H., Jr.; Crawford, P. The Flow of Real Gases through Porous Media. J. Pet. Technol. 1966, 18, 624–636. [Google Scholar] [CrossRef]
  28. Chen, Z.; Li, D.; Zhang, S.; Liao, X.; Zhou, B.; Chen, D. A well-test model for gas hydrate dissociation considering a dynamic interface. Fuel 2022, 314, 123053. [Google Scholar] [CrossRef]
  29. Cai, M.; Wu, Y.; Wu, Y.; Tan, J.; Fang, J. Analysis on pressure behavior of trilinear flow model of vertical fracture wells in triple porosity reservoir. Fault-Block Oil Gas Field 2008, 01, 58–60. [Google Scholar]
  30. Liu, J.; Liu, X.; Zhu, H.; Ma, X.; Zhang, Y.; Zeng, J.; Luo, W.; Teng, B.; Li, Y.; Wan, N. A decomposed fracture network model for characterizing well performance of fracture networks on the basis of an approximated flow equation. Lithosphere 2021, 2021, 5558746. [Google Scholar] [CrossRef]
Figure 1. Schematic diagram of four well-testing models in the Kuche area: (a) Warren–Root model, modified from [12]; (b) Radial composite model; (c) Dual-flow-state model; (d) Local heterogeneity model.
Energies 17 01717 g001
Figure 2. Schematic diagram of fluid flow in four models: (a) Warren–Root model; (b) Radial composite model; (c) Dual-flow-state model; (d) Local heterogeneity model.
Energies 17 01717 g002
Figure 3. Schematic diagram of flow in heterogeneity model, modified from [30]: (a) Relationship between fractures and matrix; (b) Matrix under initial condition; (c) Investigation and contours of pressure; (d) Fluid flow from matrix to wellbore.
Energies 17 01717 g003
Figure 4. Typical gas-well-testing curves of four models: (a) Warren–Root model; (b) Radial composite model; (c) Dual-flow-state model; (d) Local heterogeneity model.
Energies 17 01717 g004
Figure 5. Sensitivity analysis of Warren–Root model parameters. The solid lines represent dimensionless BHP, the dashed lines represent derivative of dimensionless BHP: (a) Pressure transient behavior under different elastic energy storage ratios; (b) Pressure transient behavior under different cross-flow coefficients.
Energies 17 01717 g005
Figure 6. Sensitivity analysis of radial composite model parameters. The solid lines represent dimensionless BHP, the dashed lines represent derivative of dimensionless BHP: (a) Pressure transient behavior under different elastic energy storage ratios; (b) Pressure transient behavior under different inner and outer permeability ratios.
Energies 17 01717 g006
Figure 7. Sensitivity analysis of dual flow state model parameters. The solid lines represent dimensionless BHP, the dashed lines represent derivative of dimensionless BHP: (a) Pressure transient behavior under different aspect ratios of linear flow matrix blocks; (b) Pressure transient behavior under different matrix block areas.
Energies 17 01717 g007
Figure 8. Sensitivity analysis of local heterogeneity model parameters. The solid lines represent dimensionless BHP, the dashed lines represent derivative of dimensionless BHP: (a) Pressure transient behavior under different elastic energy storage ratios; (b) Pressure transient behavior under different matrix block areas.
Energies 17 01717 g008
Figure 9. Identification procedure of multi-scale media well-testing models for fractured gas reservoirs.
Energies 17 01717 g009
Figure 10. The well-testing data plotted in log–log coordinate.
Energies 17 01717 g010
Figure 11. Matching of dimensionless tested data and proposed model in this paper.
Energies 17 01717 g011
Table 1. Basic parameters of a well in Tarim Basin.
ParametersValues
Wellbore radius/m0.08414
Reservoir top depth/m6185
Reservoir effective thickness/m12
Porosity/%7.15
Reservoir pressure/MPa92.81
Rock compressibility/MPa−18.1675 × 10−5
Reservoir temperature/°C117.56
Gas relative density/dim0.6377
Gas deviation factor/dim1.652
Gas viscosity/(mPa·s)0.0401
Gas volume coefficient/dim0.00244
Gas compressibility/MPa−10.00397
Table 2. Test pressure data table (data after dilution).
ParametersMeasuring Time/hPressure/MPa
Data 10.00000000088.211504
Data 20.00416666788.580317
Data 30.00833333389.305794
Data 40.01250000089.900153
Data 50.01666666790.350214
Data 60.02083333390.825350
Data 70.02500000091.203580
Data 80.02916666791.458737
Data 90.03333333391.625746
Data 100.03750000091.779463
Data 110.04166666791.858774
Data 120.04583333391.900357
Data 130.05000000091.923355
Table 3. Dynamic inversion parameter results of well testing.
ParametersValues
Elastic energy storage ratio/dim0.0927
Wellbore storage coefficient/(m3/MPa)0.23
Skin factor/dim3
Effective permeability of outer matrix/mD62
Effective permeability of the surrounding finely cut matrix/mD33
Effective permeability of the matrix where the well is located/mD30
Disclaimer/Publisher’s Note: The statements, opinions and data contained in all publications are solely those of the individual author(s) and contributor(s) and not of MDPI and/or the editor(s). MDPI and/or the editor(s) disclaim responsibility for any injury to people or property resulting from any ideas, methods, instructions or products referred to in the content.

