Article

Is Greece Ready for a Hydrogen Energy Transition?—Quantifying Relative Costs in Hard to Abate Industries

1
Department of New Technologies & Alternative Energy Sources, HelleniQ Energy, 8A Chimarras Street, 15125 Maroussi, Greece
2
Department of Business Development and Technology, Aarhus University, Birk Centerpark 15, Innovatorium, 7400 Herning, Denmark
3
Fluid Mechanics and Turbomachinery Laboratory, Department of Mechanical Engineering, University of the Peloponnese, 1 Megalou Alexandrou Str., Koukouli, 26334 Patras, Greece
*
Author to whom correspondence should be addressed.
Energies 2024, 17(7), 1722; https://doi.org/10.3390/en17071722
Submission received: 28 February 2024 / Revised: 25 March 2024 / Accepted: 2 April 2024 / Published: 3 April 2024
(This article belongs to the Section A: Sustainable Energy)

Abstract

:
During the past few years, hydrogen use has come to be considered as an alternative energy carrier in a future decarbonized world. Many developed nations are undergoing a shift towards low-carbon energy sources, driven by the excessive reliance on fossil fuels and the detrimental effects of climate change. This study aims to investigate the potential for hydrogen deployment in the Greek energy market during the next few decades. In this context, green hydrogen’s potential application in the Greek market is being assessed, employing an integrated techno-economic model grounded in worldwide trends and localized expenses. The forthcoming years will see an analysis of both the challenges and opportunities surrounding the integration and implementation of hydrogen in new and existing processes within Greece. Many alternative ways to produce hydrogen in Greece are investigated, contemplating different production paths. We evaluate how fluctuations in hydrogen, oil, and carbon prices affect the economics of green hydrogen adoption in oil refining, as is detailed in the draft of the European Union delegated act published in May 2022. The Levelized Cost of Hydrogen (LCOH) for different scenarios is calculated for the time frame up until 2050. A sensitivity analysis reveals that investment costs, electricity prices, electrolyzer efficiency, and carbon taxes significantly influence the LCOH, ultimately impacting the economic competitiveness of hydrogen production. These findings underscore the importance of aligning public–private partnership agendas in hydrogen production to create optimal conditions for investment attraction and development.

1. Introduction

The adverse effects of climate change, mainly caused by large-scale fossil fuel utilization and consumption [1,2,3], have forced investigations into clean energy solutions aiming at a sustainable energy transition. Since the Paris Agreement in 2015 [4], many governments have focused their efforts on offsetting greenhouse gas emissions and achieving their decarbonization targets. In this context, the role of renewable fuels in a decarbonized world is of great significance.
Clean stock-based energy carriers such as hydrogen offer a synergistic solution that works with a wide range of applications while lowering costs and emissions throughout the system [5]. The predominant method for producing hydrogen involves steam methane reforming in natural gas (referred to as “grey hydrogen”)—representing 80% of hydrogen produced (almost 90 Mt/a)—with significant emissions of carbon dioxide. Reducing these emissions via Carbon Capture Utilization and Storage (CCUS) (so-called “blue hydrogen”) is considered as a viable solution [6]. In this direction, the International Energy Agency (IEA) estimates that by 2030, the global hydrogen production is projected to reach 200 million tons per annum (Mt/a), with approximately 70% of it expected to originate from low-carbon sources [7]. The Hydrogen Strategy Communication places a high priority on advancing renewable hydrogen and establishes incremental targets for capacity installation from 2020 to 2050: at least 6 gigawatts (GW) installed and 1 million tons of production by 2024, 40 GW and 10 million tons of production by 2030, and full commercial scale expected by 2050 [8].
Renewable hydrogen originates from sustainable sources (excluding biomass fuels), and can reduce greenhouse gas (GHG) emissions by 70% in relation to conventional fuels [9]. The Renewable Energy Directive (RED II) provides the same definition of renewable hydrogen; however, RED II projects that by 2030, renewable hydrogen is expected to account for 50% of total hydrogen consumption across both the energy sector and industries utilizing hydrogen as feedstock. In this context, the EU’s public consultation on the Delegated Act outlined criteria for defining renewable electricity and established reporting requirements to prevent the utilization of previously subsidized renewable electricity [10,11,12,13]. Similarly, on other continents, the trends are the same [14,15,16,17,18,19].
Greece—following the EU’s climate goals—aims to achieve carbon neutrality by 2050 by adopting ambitious climate and energy goals. According to the Greek National Energy and Climate Plan [20], the Renewable Energy Sources (RES) share for 2030 should reach at least 35% of the final gross energy demand; 60% of the final gross electricity demand; 40% of the heating and cooling sector; and 14% of the transport sector. In this context, new applications and technologies for the generation of power from RES, such as the production of hydrogen, will likely be assessed through pilot projects. The NECP considers hydrogen a future solution, although it is currently at a nascent development stage. To be more specific, it is estimated that by 2030, the domestic production of hydrogen from electrolysis will reach 3500 GWh, with a capacity of 750 MW [21]. This will be fueled by RES Renewable Energy projects, generating 3 GW (80% photovoltaic and 20% wind power). It is assumed that the produced green hydrogen will primarily substitute natural gas and partially petroleum in refineries, industry, and transportation sectors.
The oil refinery industry is among the industries that consumes hydrogen as a feedstock. Oil refineries use hydrogen to eliminate impurities, particularly sulfur, and to enhance heavy oil fractions into lighter products. Hydrogen consumption in the oil refining industry is of crucial importance, with almost 40 million tons (Mt) of hydrogen out of the global demand of 90 Mt in 2020 [9]. Almost all hydrogen used in refineries is produced from unabated fossil fuels, resulting in more than 200 Mt CO2 emitted in 2021. The oil refining industry in Greece is aiming at a holistic transformation, and is fully aligned with the targets set by the European Union regarding the new and cleaner energy forms and the reduction in greenhouse gas emissions.
However, before now, very few studies have addressed hydrogen production in Greece; the present study aims to cover the limited research work in the literature. The majority of studies do not focus on Greece and do not take into consideration specific cost for Greece. In this context, this paper seeks to address this gap by estimating the cost of producing green hydrogen in the oil refinery sector, and to investigate the role of green hydrogen based on Greece’s current policy framework. Thus, this paper provides a techno-economic assessment of green hydrogen generation in the oil refinery sector of Greece, under different technology trajectories. The price of green hydrogen produced using different types of electrolyzers and employing different electricity production pathways is estimated for the current year (indicated as 2020), 2030 and 2050. The paper includes five sections. After the Introduction (Section 1), the overview of green hydrogen (Section 2) provides a range of pertinent studies examining green hydrogen production from various perspectives, as well as relative costs and current implementations in the oil refinery industry. The scenario design, the system description, the analysis and the methodologies are outlined in Section 3 and Section 4, while the findings are presented and discussed in Section 5.

2. Green Hydrogen Production: Current Trends and Costs

Green hydrogen is regarded as a carbon-neutral solution as it can be produced using sustainable resources such as renewable energy or biogas. When it is generated from renewable electricity (solar, wind, etc.), in cases when the power production exceeds the demand, it can be employed to enhance grid flexibility and stability. Additionally, it can offer seasonal energy storage capabilities. To be more specific, the Power-to-Gas (PtG) arrangement uses the renewable-based surplus in order to produce hydrogen via water electrolysis. Electricity is utilized to separate water into hydrogen and oxygen; meanwhile, hydrogen can be stored and converted back into electricity or utilized for various energy applications. In this way, renewable hydrogen production or so-called green hydrogen increases grid stability and flexibility [22].
Currently, as per the European Hydrogen Observatory’s estimations, hydrogen production costs in Europe for 2022, utilizing grid electricity, averaged 9.85 EUR/kg H2, whereas hydrogen production costs through electrolysis with a direct connection to a renewable energy source had an average estimated cost of 6.86 EUR/kg [23]. However, the cost of hydrogen production technologies, within the next decade, is estimated to decrease by 50%. To be more specific, by 2030, the costs of renewable hydrogen production could decrease to a range of USD 1.4/kg to 2.3/kg, accelerating in this way green hydrogen investments in certain regions by 2028–2034 [24]. Based on the abovementioned, and given that numerous countries worldwide have formulated national strategies to expedite the development of the green hydrogen value chain, various studies have been carried out, aiming to point out its importance and assess relative production costs. These include the studies of Chu et al. [25], who suggested a plan outlining feasible measures to ensure a strategic supply of hydrogen to the Korean economy; Liu et al. [15], who investigated key factors for hydrogen systems from the Chinese perspective for “green hydrogen standard” initiatives; and AbouSeada and Hatem [16], who threw light on the prospects of green hydrogen production in Africa. Park et al. also studied the Korean green hydrogen sector in depth [26]. Benalcazar and Komorowska [12] examined the possibility of generating green hydrogen across diverse regions in Poland. Zhou et al. [17] indicated that green hydrogen is of fundamental importance for the development of a carbon-free society in China. Aziz et al. [27] explored the prospects and the current state of green hydrogen production in Saudi Arabia. Karavel et al. [28] assessed the potential of green hydrogen production in Turkey using solar energy, and evaluated multiple technologies to demonstrate that investments in hydrogen generation assets should guide future investments in this economic sector. Søgaard-Deakin and Xydis [29] focused on lessons learnt from the Danish production of green hydrogen from clean drinking water via proton membrane electrolysis, while Sorrenti et al. [30] studied the viability of green hydrogen generation and energy islands.
A detailed analysis regarding the recent and future costs of clean hydrogen production is discussed by El-Emam and Ozcan [31]. Janssen et al. [32] summarized the European conditions for hydrogen economy development, providing detailed country-specific cost projections for renewable hydrogen generation with perspectives extending up to 2050 (claiming that relative costs can be below 2 EUR/kg in 2050). Touili et al. [19] suggested that the solar hydrogen potential and the corresponding production costs within the Moroccan territory vary between 6.489 and 8.308 ton/km2, with costs between 5.79 and 4.64 USD/kg, respectively. The costs of green hydrogen are affected also by the electricity price and the type of power source that supplies the electrolyzers. In 2020, the Levelized Cost of Hydrogen (LCOH) provided by solar photovoltaics (PV) in Europe stood at approximately 7.5 USD/kg H2. Meanwhile, the LCOH for offshore wind and onshore wind was notably lower, at 4.4 USD/kg H2 and 4.2 USD/kg H2, respectively [7]. The evaluation of electrolytic hydrogen production and utilization in Ecuador suggests that hydrogen can be produced at a low cost of USD 3 per kilogram of hydrogen (kgH2), provided that electrolysis plants operate continuously and utilize low-cost electricity [33]. Apart from the electricity price cost barrier, it has been suggested that CAPEX is of paramount importance to investigate in the production of green hydrogen [34]. The mention of the electricity price cost barrier highlights the potential economic hurdles associated with high electricity prices, which are a vital component in green hydrogen production through methods like electrolysis [35]. On the other hand, the assertion that CAPEX is of paramount importance underscores the crucial role that upfront capital expenditures play in establishing or upgrading the necessary infrastructure for green hydrogen production. Successfully navigating and managing both the electricity cost barrier and CAPEX are pivotal for making green hydrogen economically viable and attractive to potential investors, ensuring its competitiveness in the evolving energy landscape [36].
Another factor influencing the cost of green hydrogen generation is the electrolyzer technology. Electrolyzers represent an electrochemical apparatus employed to split water molecules into hydrogen and oxygen through electrical means. Within an electrolyzer, the conversion of electrical energy into chemical energy occurs, resulting in the production of hydrogen. Comprising two electrodes and an electrolyte, an electrolyzer cell forms the fundamental unit. Multiple cells can be interconnected in series to create a stack, thereby facilitating hydrogen generation. Ancillary components of the electrolyzer encompass the cooling apparatus, systems for hydrogen purification, rectifiers, and provisions for demineralized water supply, among others. The available technologies include Alkaline Electrolyzers (AEs), Proton Exchange Membrane Electrolyzers (PEMEs), and Solid Oxyde Electrolyzers (SOEs). AEs, compared to the other two types of electrolyzers, are advantageous due to market availability, non-reliance on noble metals as constituent materials, extended lifespan, and reduced investment costs [37]. However, they face certain technical constraints, including low operating pressure thresholds and restricted operational current densities (below 400 mA/cm2), which are linked to the formation of potentially combustible hydrogen and oxygen mixtures diffusing through membranes [38]. SOE is still in the development phase, whereas AE and PEME are considered more matured technologies. It has been estimated that reductions of 33%, 34% and 50% in hydrogen price in Denmark can be achieved by the large-scale utilization of AEs, PEMEs and SOEs, respectively [39]. Despite the fact that the AE is a mature technology, it has the potential to achieve a CAPEX reduction of 27% by 2030 [40]. It needs to be pointed out that there are also membraneless electrolyzers that can be used for low-cost hydrogen production, which the industry has started to embrace and incorporate [41].

2.1. Hydrogen Energy Transition within the Greek Energy Sector

Greece has set an ambitious goal for 2030 and beyond as part of its new National Energy and Climate Plan [20], which targets the installation of 1.7 GW of electrolyzers by 2030 (135,000 tons of green hydrogen production) and 30.6 GW of electrolyzers by 2050, producing 2.3 million tons of green hydrogen. The total consumption of green hydrogen in Greece is expected to reach 63.6 TWh a year by 2050, with 70% of the fuel used in transportation. Natural gas in the Greek system will be mixed with green hydrogen to 5.6% by 2030 and to 15.4% by 2050. Biomethane is also expected to contribute 15.4% and 20.4%, respectively, in order to make gas consumption cleaner. In order to do this, the authorities are planning to enforce a mandatory annual minimum for gas suppliers that will gradually increase. This strategy aims to encourage gas suppliers to adopt cleaner practices and technologies in their operations, thereby reducing the overall environmental impact of gas consumption. By implementing a mandatory minimum standard, authorities not only set clear expectations for suppliers, but also pave the way for a progressive shift towards cleaner energy solutions, contributing to a more sustainable and eco-friendly gas industry [42].
Greece’s approach to the development of hydrogen energy comprises: hydrogen production from renewable electricity; hydrogen use for the decarbonization of the transport sector (mainly shipping); long-term hydrogen storage for power generation; the use of existing gas infrastructure for hydrogen transport, and the stimulation of hydrogen-related R&D. The Greek industry sector has a significant potential for hydrogen use in industry, given that the ammonia industry and refineries both use fossil-derived hydrogen [43].
To be more specific, oil refineries undertake numerous industrial processes to convert crude oils into various products. Among these, hydro-processing covers a range of catalytic processes, including hydrotreating and hydrocracking for the removal of sulfur (hydro-desulfurisation (HDS)), oxygen, nitrogen and metals. During the hydrocracking process, heavy gas oils undergo simultaneous cracking and hydrogenation, resulting in the production of refined fuels with reduced molecular sizes and higher hydrogen-to-carbon ratios. This process yields significant quantities of diesel and kerosene. In hydro-treating, hydrogen is employed to hydrogenate sulfur and nitrogen compounds, ultimately removing them as hydrogen sulfide (H2S) and ammonia (NH3). Taking into consideration the fact that refinery product specifications have become stricter in order to meet environmental requirements, the demand for hydrogen to supply hydroprocessing units continuously increases [44]. Regarding hydrogen supply within the refinery, it is facilitated through the hydrogen generation unit (HGU), where hydrogen is generated through the steam reforming of natural gas (NG), naphtha, liquefied petroleum gas (LPG), or through the partial oxidation (POx) process. Alternatively, hydrogen can be sourced from merchant gas producers and transported to the refinery via pipelines. The quantity required for the aforementioned processes in refineries typically varies based on the crude oil quality and the extent of impurities that need to be eliminated.

2.2. Green Hydrogen and Applications in Refineries

Recently, there has been a surge of interest in the planning and implementation of electrolytic hydrogen and carbon capture projects in refineries across Europe. For instance, in Germany, BP [45] plans to supply 20% of the Lingen refinery’s hydrogen demand with electrolytic hydrogen. The renewable electricity required for electrolysis will be generated by an offshore wind farm in the North Sea, with operations scheduled to commence by 2024. In Germany, the REFHYNE project involves a partnership between Shell and four other companies. Together, they are constructing a 10 MW Polymer Electrolyte Membrane (PEM) electrolyzer to produce hydrogen for a refinery and offer ancillary services to the German Transmission System Operators. The project will also monitor the conditions under which the electrolyzer business models become viable, in order to establish a base for the justification of changes in existing policies [46]. Shell also established, in 2020, the NortH2 project (located in the north side of the Netherlands), aimed at constructing large-scale wind farms in the North Sea (aiming to reach 10 GW by 2040). The initial turbines are expected to be operational by 2027 and will be dedicated to producing renewable hydrogen primarily aimed at meeting the demands of the industrial sector [47]. HySynergy is another interesting project, where Everfuel and Shell established a partnership in Frederica, Denmark, in order to build a GW-rated P2X plant with a 10-metric-tonhydrogen storage facility [48]. Another showcase is the MultiPLHY project, set at Neste’s renewable products refinery in Rotterdam, which also relies on SOEC technology [49]. The objective of this project was to install, integrate, and operate a high-temperature electrolyzer (HTE) system on a multi-megawatt scale (approximately 2.4 MW) at a biofuels refinery in Rotterdam, Netherlands. The purpose was to produce hydrogen (≥60 kg/h) for the refinery’s processes.
Despite the great interest in green hydrogen applications in refineries, few studies have previously assessed their use in oil refineries. More specifically, there is no previous study, to our knowledge, that assesses green hydrogen production in the Greek oil market. This study developed feasible hydrogen scenarios for the Greek oil industry to address this research gap. The current study takes into consideration the energy needs of Greece and the European Green Deal, and tries to shed light on the following question: “Can Greece meet the 2030–2050 European green deal targets?”. In this direction, different hydrogen production scenarios in an energy-intensive industry sector in Greece (oil refinery) are being evaluated, in order to select the best technology that will accelerate the energy transition while safeguarding the economic and technical sustainability of relative investments.

3. Scenario Design and Methodology

As regards scenario designs, these were developed taking into consideration various techno-economic parameters such as CAPEX, OPEX, costs of PPA contracts, H2 production, commodities prices, types of electrolyzer etc. Scenario design is focused on the comparison of the integration of different systems in terms of efficiencies and investment costs, the use of PV energy surplus, as well as CO2 emissions and CO2 emissions avoided. Figure 1 illustrates the configuration of the system under study.
  • Grey—Business as Usual Scenario (BAU)
This scenario is built on the conventional hydrogen production system (representing the current situation), using a steam methane reformer (SMR) with Pressure Swing Adsorption (PSA) purification to obtain 2000 Nm3/day of 99.9% pure hydrogen in an oil refinery. The annual hydrogen production is 100,000 tn/year. This scenario is used as the base to compare to other scenarios.
  • Blue—Carbon Capture Storage (CCS) Scenario for Existing Steam Methane Reformer
In this scenario, the hydrogen generation unit operates with low CO2 emissions. It is based on the Business-As-Usual (BAU) scenario; however, in this case, a carbon capture facility is integrated into the Steam Methane Reforming (SMR) unit. A CO2 capture facility is installed at the exit of the reformer, capturing approximately 50% of the CO2 produced during SMR. The primary CO2 capture method employed for steam reforming is captured post-combustion through chemical absorption using an amine-based solvent [50]. The SMR unit runs on natural gas, and the share of captured CO2 reaches 60%.
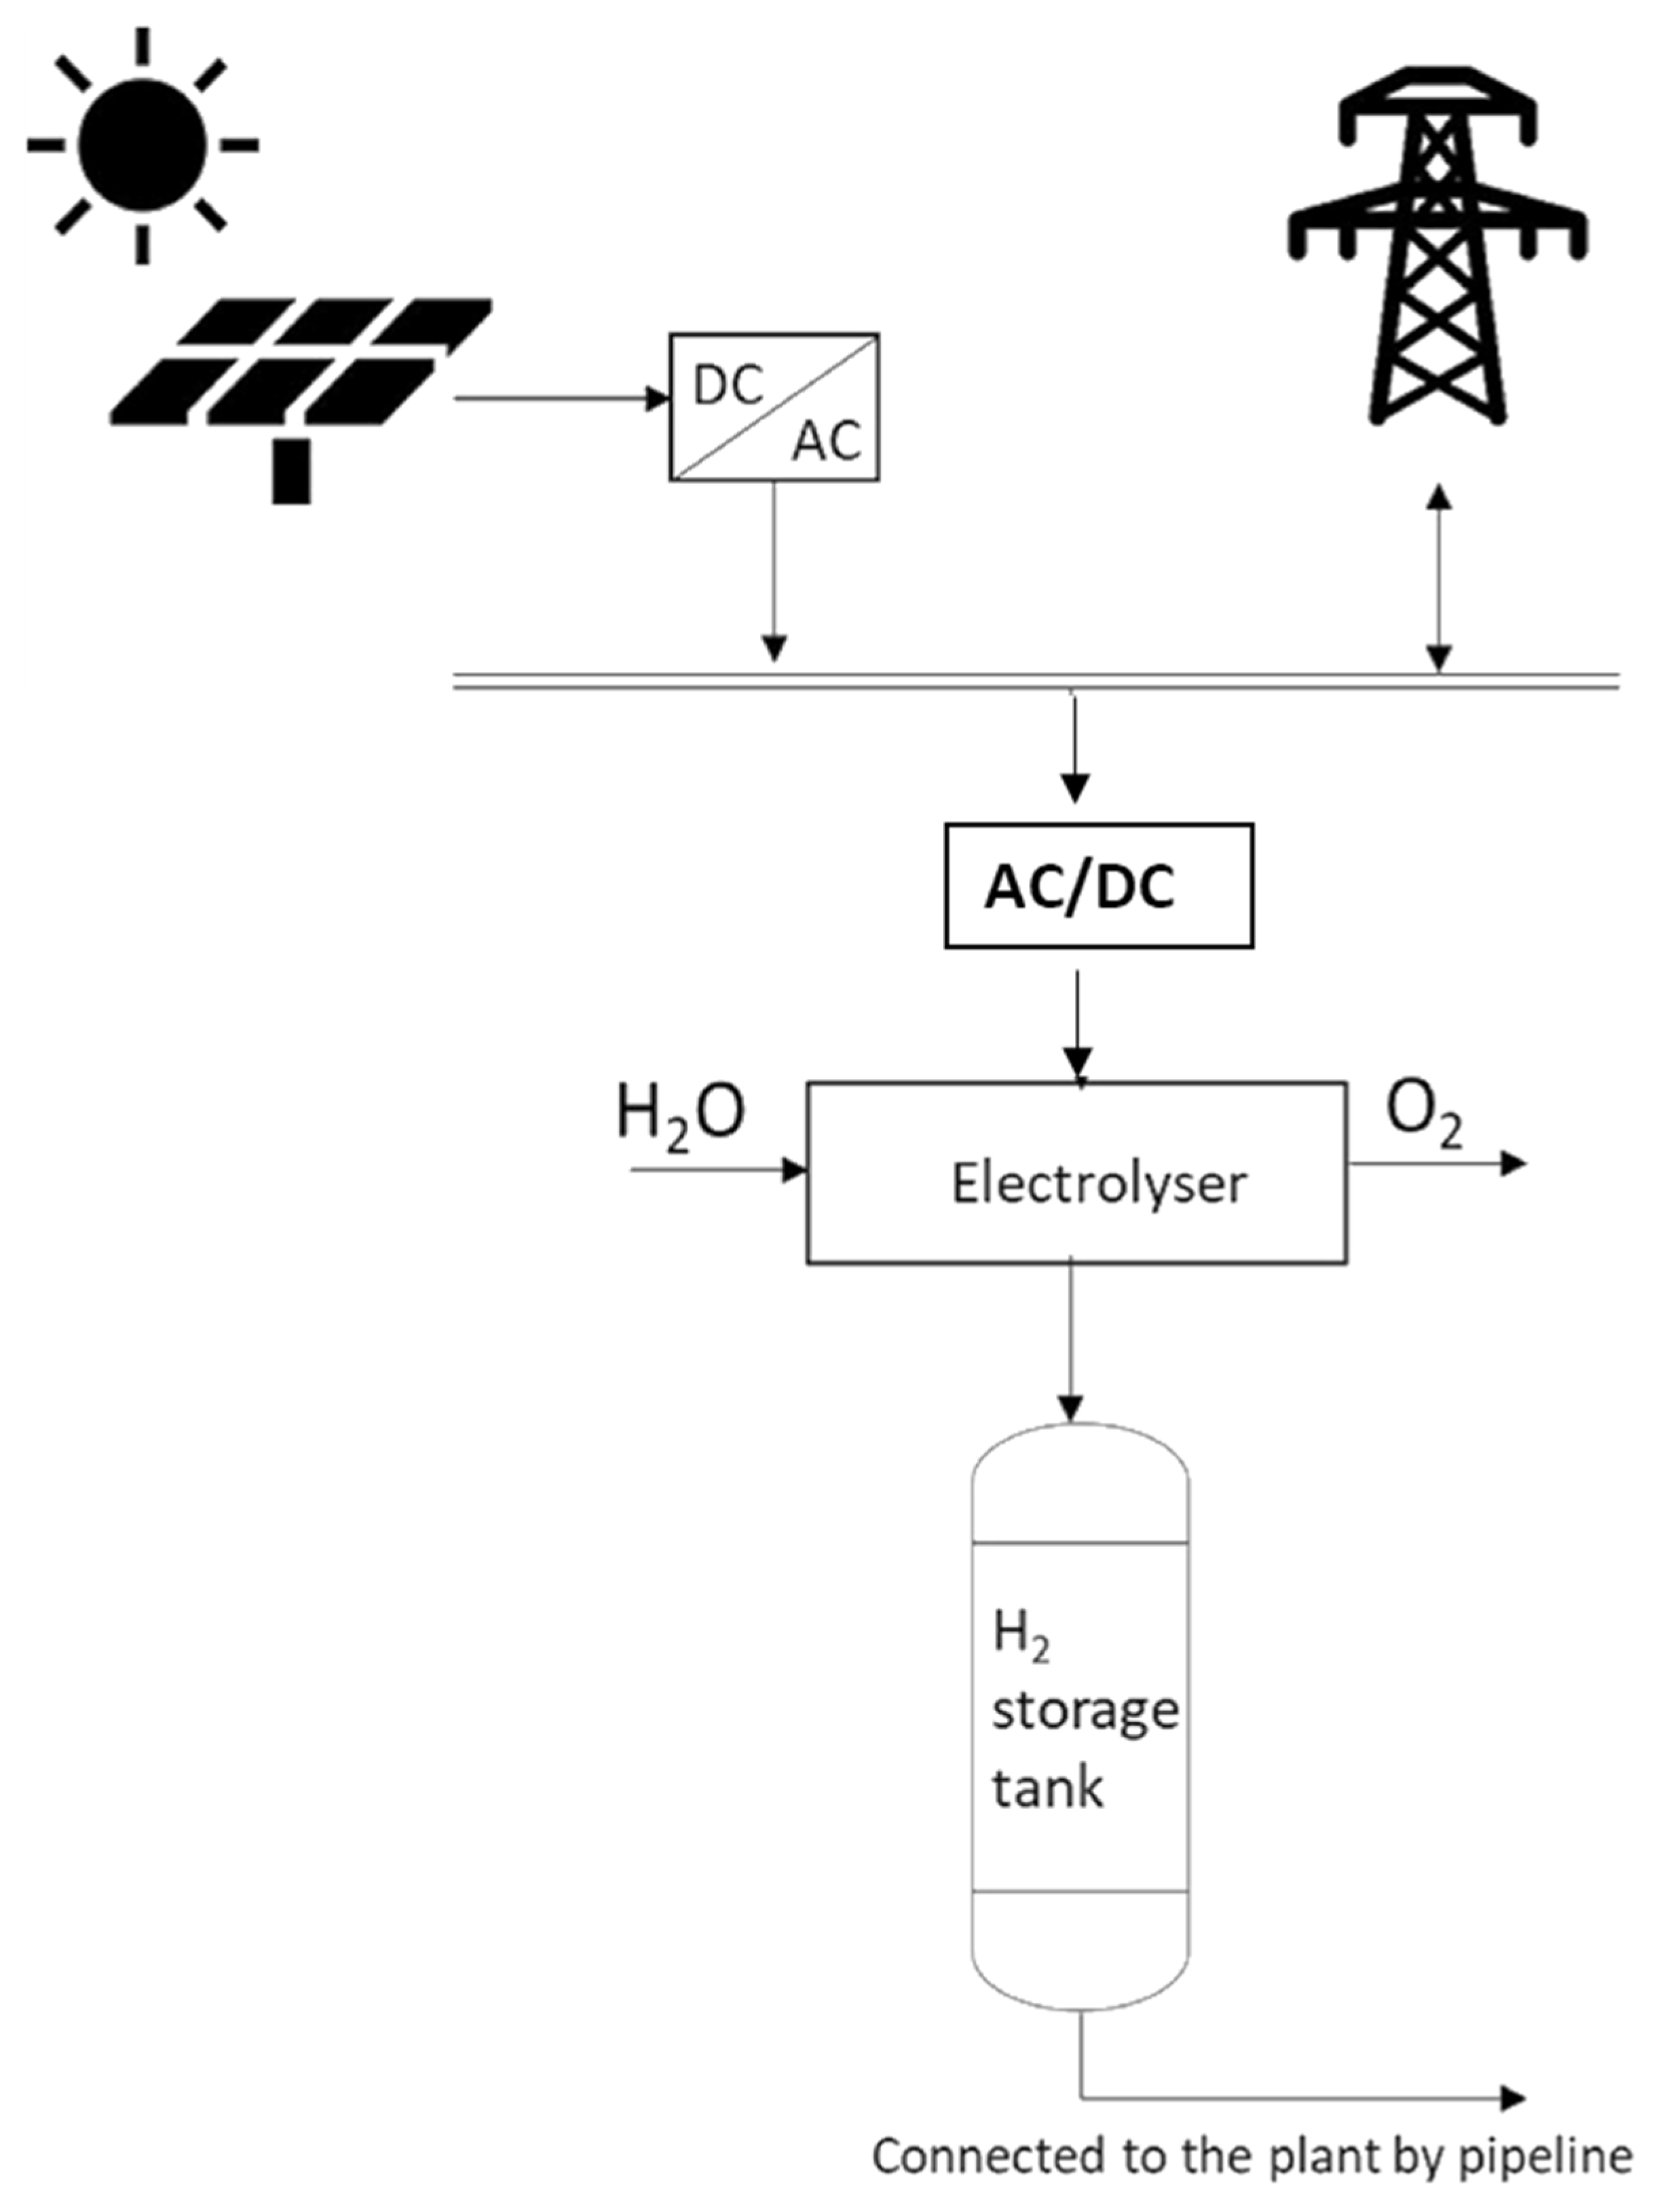
  • Green—PV Power Purchase Agreement (PPA) Scenario
In this scenario the refinery invests in a solar power plant in an area near the refinery’s premises. The power requirements for the operation of the electrolyzer system are covered by a dedicated-grid connected solar PV plant. The individual module for the PV plant has a peak power of 50 W, utilizing a mono-crystalline unit (Model 1Soltech 1STH-240-WH, Anodized Aluminum Alloy, 1Soltech, Farmers Branch, TX, USA) with both azimuthal and tilt angles fixed at 158°.
During the daytime, the PV plant supplies a portion of the electricity generated by it to power the operation of the electrolyzer unit, while the excess electricity is fed back into the grid. During nighttime hours, when electricity is needed for the electrolyzer system, stored green electricity is drawn from the grid. The hydrogen produced is stored in a hydrogen storage tank connected to the refinery via a pipeline (Figure 1).
Power Purchase Agreements are long-term contracts between producers (or developers of electricity production projects) and buyers of energy (typically called off-takers). During the agreement period, the producer is liable for all costs that revolve around energy generation, and the buyers procure energy at a specified rate (fixed or indexed). PPA terms usually range between 5 and 20 years. Green PPAs are agreements where the energy is produced by an RES asset (dispatchable or not). The off-taker disengages almost completely from fluctuating prices for energy, which depend heavily on prices of CO2 emission allowances and Natural Gas prices (the standard fuel for electricity generation in the post-lignite era) [51]. In this scenario, in order to power the electrolyzer system, PPAs on utility-scale PV are secured. The generated energy is transmitted through the electricity grid. Surplus electricity can be sold on the spot market (day-ahead auction). Since the hydrogen is going to decarbonize the refinery process, only green hydrogen (according to RED 2) will be produced. This can be secured through PPAs that fulfill the additionality, simultaneity and locality criteria, or through an electricity network with more than 90% renewable energies. The total solar radiation on the tilted PV surface is estimated as 1600 h, representing the system’s electricity production over a year. The PPA cost based on the abovementioned and Greece’s regulatory framework is considered as 200 EUR/MWh (Day Ahead/PPA).
A techno-economic analysis is performed, aiming to evaluate the Levelized Cost of Hydrogen (LCOH) for the abovementioned scenarios (grey, blue and green hydrogen production). The scenarios evaluated refer to the current decade (2020), the NECP target year (2030), as well as the long-term target year for carbon neutrality (2050).
The production costs include: CAPEX (capital expenditure) and OPEX (operating expenditure). The generation costs are assessed for three electrolyzer technologies: Alkaline Water Electrolysis (ALK), Polymer Electrolyte Membrane (PEM), and Solid Oxide Electrolyzer Cell (SOEC). The scenarios take into consideration: investment costs; efficiency; electricity generated both from the Greek national grid as well as from solar PV for the years 2020, 2030, and 2050. Finally, in order to identify the factors affecting the LCOH production, a sensitivity analysis is performed.

3.1. Levelized Cost of Hydrogen

Levelized Costs serve as indicators to evaluate the economic efficiency and competitiveness of a technology by quantifying its economic feasibility [52]. In this context, the Levelized Cost of Energy (LCOE) is utilized for the assessment and comparison of different energy storage systems. With this method, the cost of electricity generation over the life of the system is determined. The LCOE is determined by dividing the total capital cost of the storage by the expected energy output, while also considering the time-varying value of money [53]. In another approach, LCOE represents the minimum price the generated power should be sold at, in order to break even at the end of the expected lifetime (Equation (1)).
L C O E = n = 1 N   I n + F n + V n × 1 + i n         n = 1   N E n × 1 + i n    
where:
  • In = Cost of investment;
  • Fn = Fixed operational expenditure (F-OPEX);
  • Vn = Variable operational expenditure;
  • En = Energy obtained in year n;
  • N = Plant lifetime;
  • i = Discount rate.
The investment costs are calculated as per Equation (2), where:
  • Cx = CAPEX (costs associated with electrolyzers, dispensers, engineering, procurement, and construction (EPC));
  • X = Quantity of spare parts related to CAPEX;
  • CRF = Capital Recovery Factor (Equation (3)).
I a , n = I n × C R F = x = 1 x ( C x ) × C R F
C R F = i   1 + i n     1 + i n 1    
Fixed operating expenditure (F-OPEX) (Fa,n) is calculated as a percentage of the annualized CAPEX (Table 2), whereas the variable operating expenditure (V-OPEX (Va,n)) is calculated as follows:
V a = C e + C w + C n
Ce, Cw and Cn are the natural gas, water, and electricity costs. Total annual costs are calculated as per Equation (5):
C a   = I a , n   + F a , n + V a , n  
where:
  • Ca = Annualized total costs;
  • Ia,n = Annualized investment;
  • Fa,n = Fixed OPEX (EUR/year);
  • Va,n = Variable OPEX (EUR/year)
The calculation of energy output is calculated on the basis of kWh/year or kg/year. The ratio of total costs to the energy obtained as hydrogen EH2a (kWh/year) yields the LCOH, as indicated in Equation (6) and expressed in kWh/year:
L C O H = C a E H 2 a

3.2. Cost Assessment and Data

Production costs include both CAPEX and OPEX. CAPEX includes production equipment costs, compressors, dispensers, construction, and other EPC expenses. Meanwhile, OPEX encompasses fixed costs associated with operating the hydrogen production setup, as well as replacement and variable costs, such as those related to water, fuel, and feedstock.
Table 1 summarizes the investment cost—expressed in million EUR per MW—of hydrogen generation, the efficiency of conversion, and the lifespan of the technologies and production methods being studied [54].
Table 2 outlines the operational data and parameters (such as production capacity, CAPEX and OPEX, energy and material inputs, operational hours, carbon tax, etc.) used in calculating LCOH across various scenarios. The annual operational costs of hydrogen production through water electrolysis encompass operation and maintenance expenses, raw material costs, etc. OPEX is estimated as 1.5% of the total capital investment. This estimation is aligned with estimations of previous studies regarding the decarbonization of natural gas systems [55]. Production costs mainly consist of several raw material inputs, including efficiency, water consumption, and electrolyte consumption in water electrolysis for hydrogen production. Furthermore, to analyze the variation in hydrogen production costs resulting from different energy generation technologies, the electricity prices of purchased electricity are based on the power generation costs of various energy generation technologies.

4. Results and Discussion

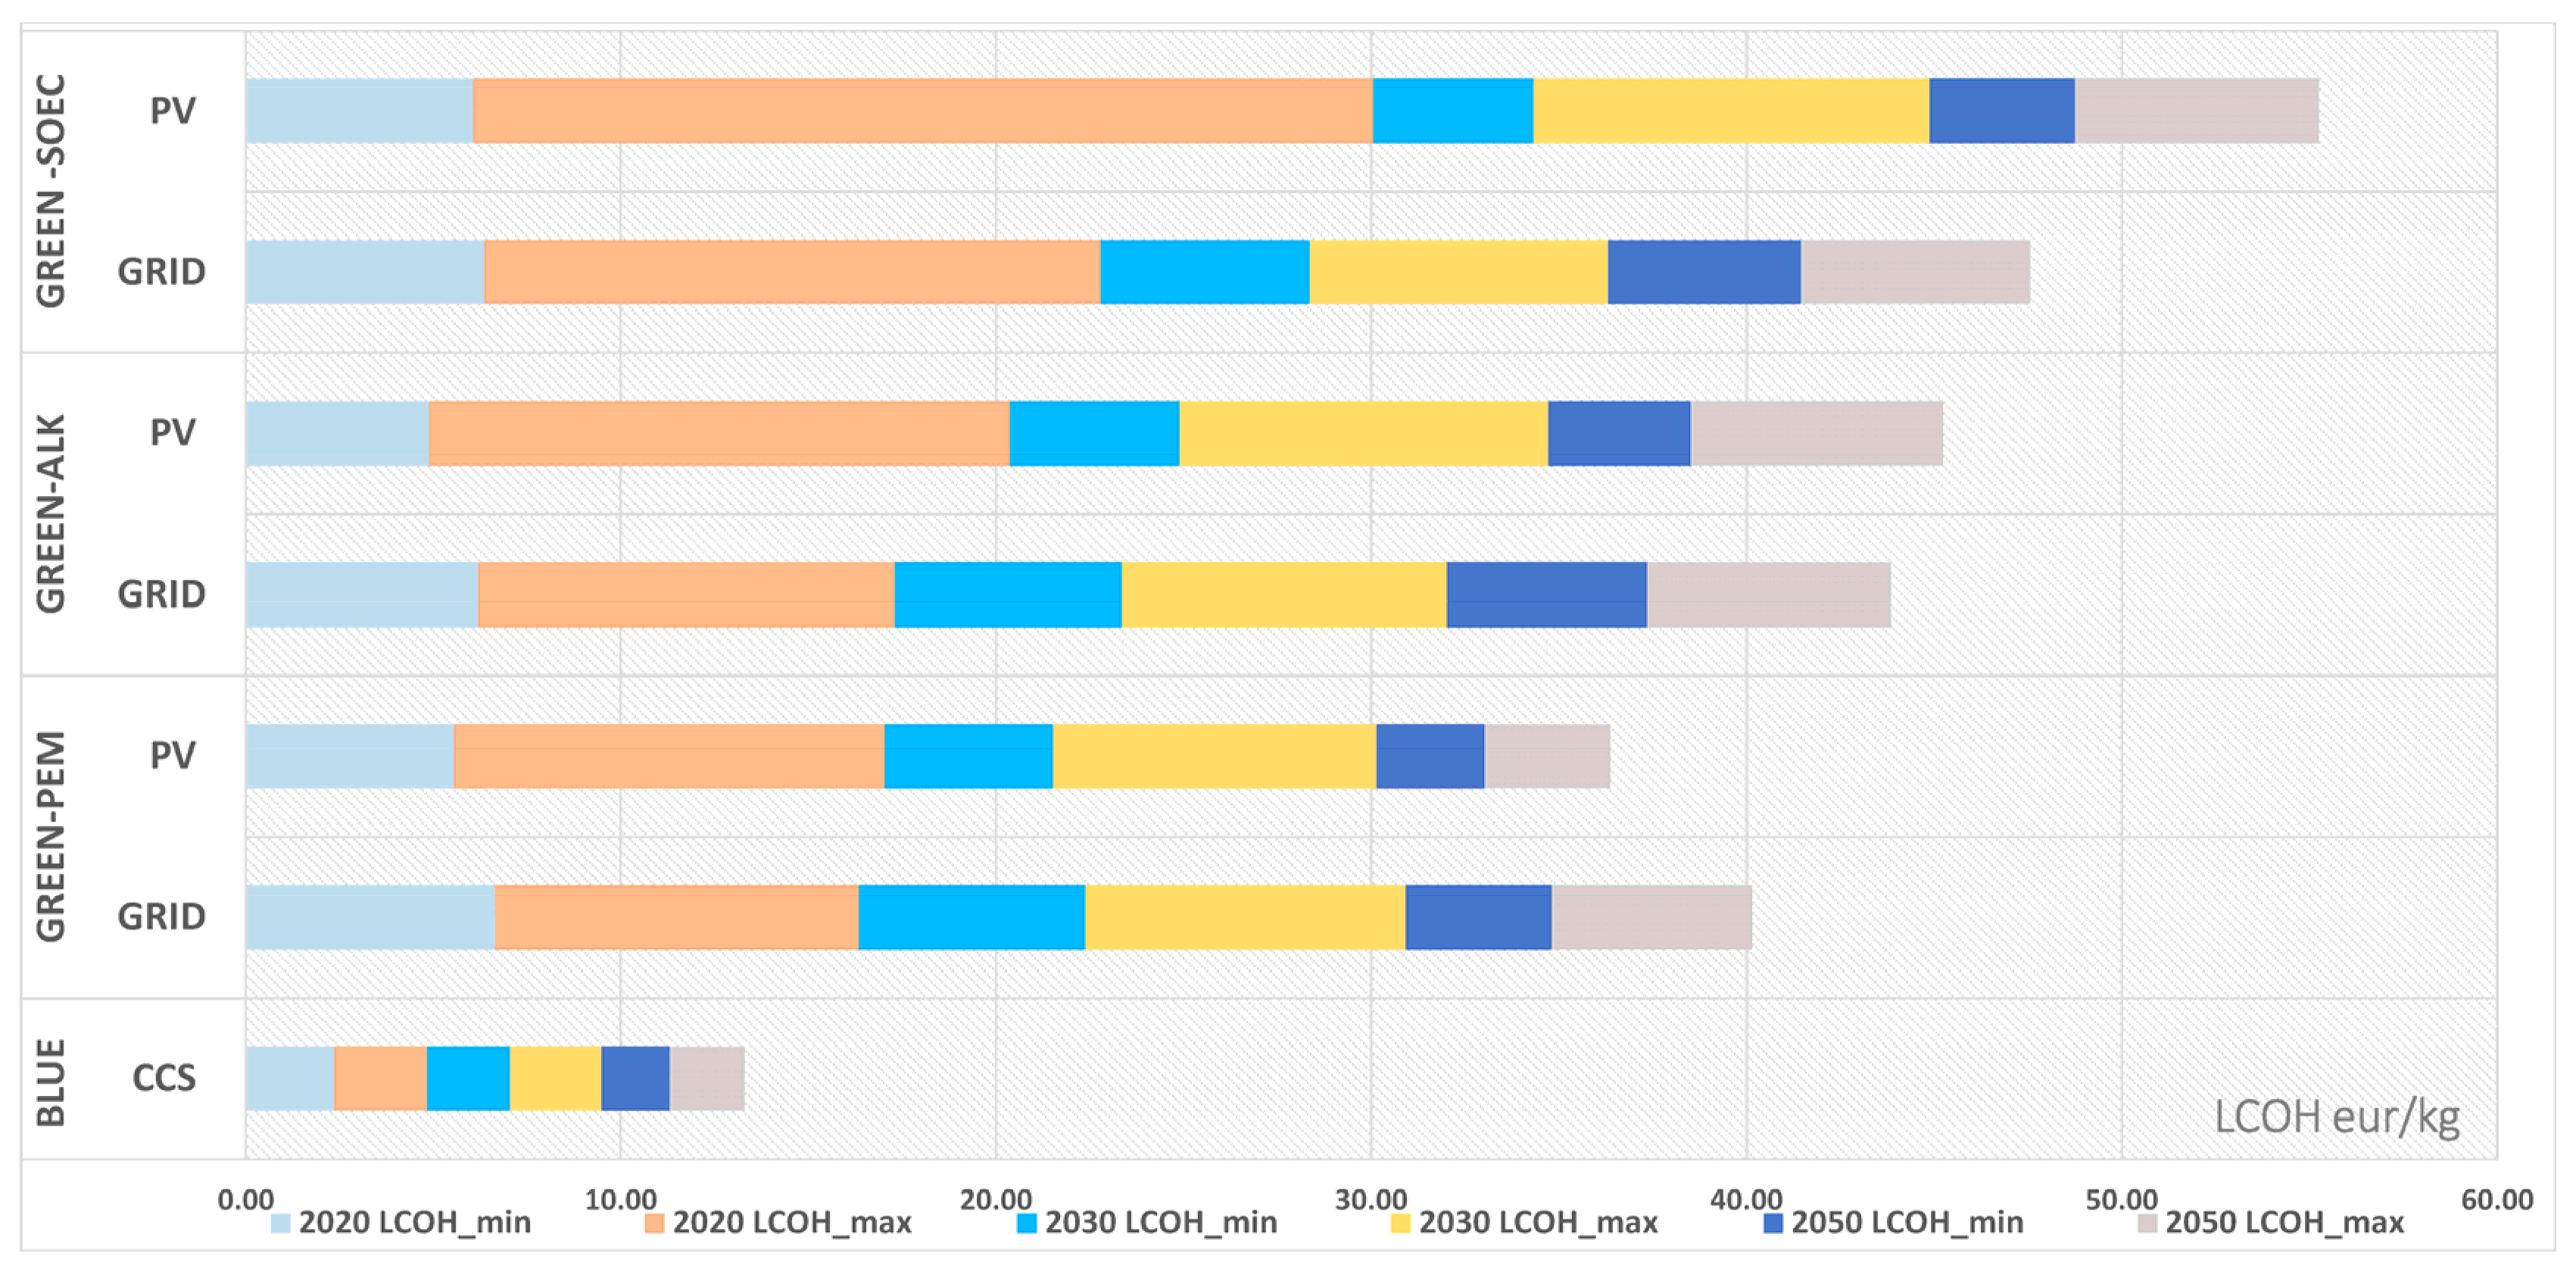
4.1. Hydrogen Production Costs

Table 3 summarizes the calculation of LCOH for the various hydrogen generation technologies (in EUR/kgH2) for the scenarios for 2020, 2030, and 2050, respectively. The results suggest that in 2023, the cost of green hydrogen production is not as competitive as the costs of grey and blue hydrogen. The costs of hydrogen generation via steam methane reforming without carbon capture (grey scenario) span across 1.925–2.078 EUR/kgH2.
It is noted that, even though all LCOHs of methane reforming with carbon capture (blue scenario) are more expensive (compared to the grey scenario a with cost of NG at 0.1171 EUR/kWh), remaining the cheapest LCOH for low-carbon alternatives in hard-to-abate industries, such as refineries (Figure 2).
On the other hand, the production of green hydrogen is affected by the type of electrolyte as well as the type of energy. In the year 2023 (2020 column), the minimum LCOH cost is 5.54 EUR/kgH2 (PEM connected to solar PV), whereas the maximum LCOH is 24.00 EUR/kgH2 (SOEC connected to solar PV). On the other hand, in 2050, SOEC hydrogen production via solar energy may be as competitive as PEM hydrogen production via solar energy, reaching 3.88 EUR/kgH2.
The grey scenario (BAU) is the cheapest, at 1.92 EUR/kgH2. It is noteworthy that the evaluation of relative costs in 2030 and 2050 is essential, particularly when assessing the impacts of the carbon tax on energy coming from conventional pathways. Currently (i.e., calculations for 2020), the most economical pathway for hydrogen production is the one described in the grey scenario, while solar-powered electrolyzers exhibit the lowest levelized cost of hydrogen across various electricity production scenarios. Grey and blue hydrogen prove to be more cost-effective than green hydrogen; the latter can be attributed to factors such as the Technological Level of Readiness (TRL), carbon emissions, as well as fuel prices.

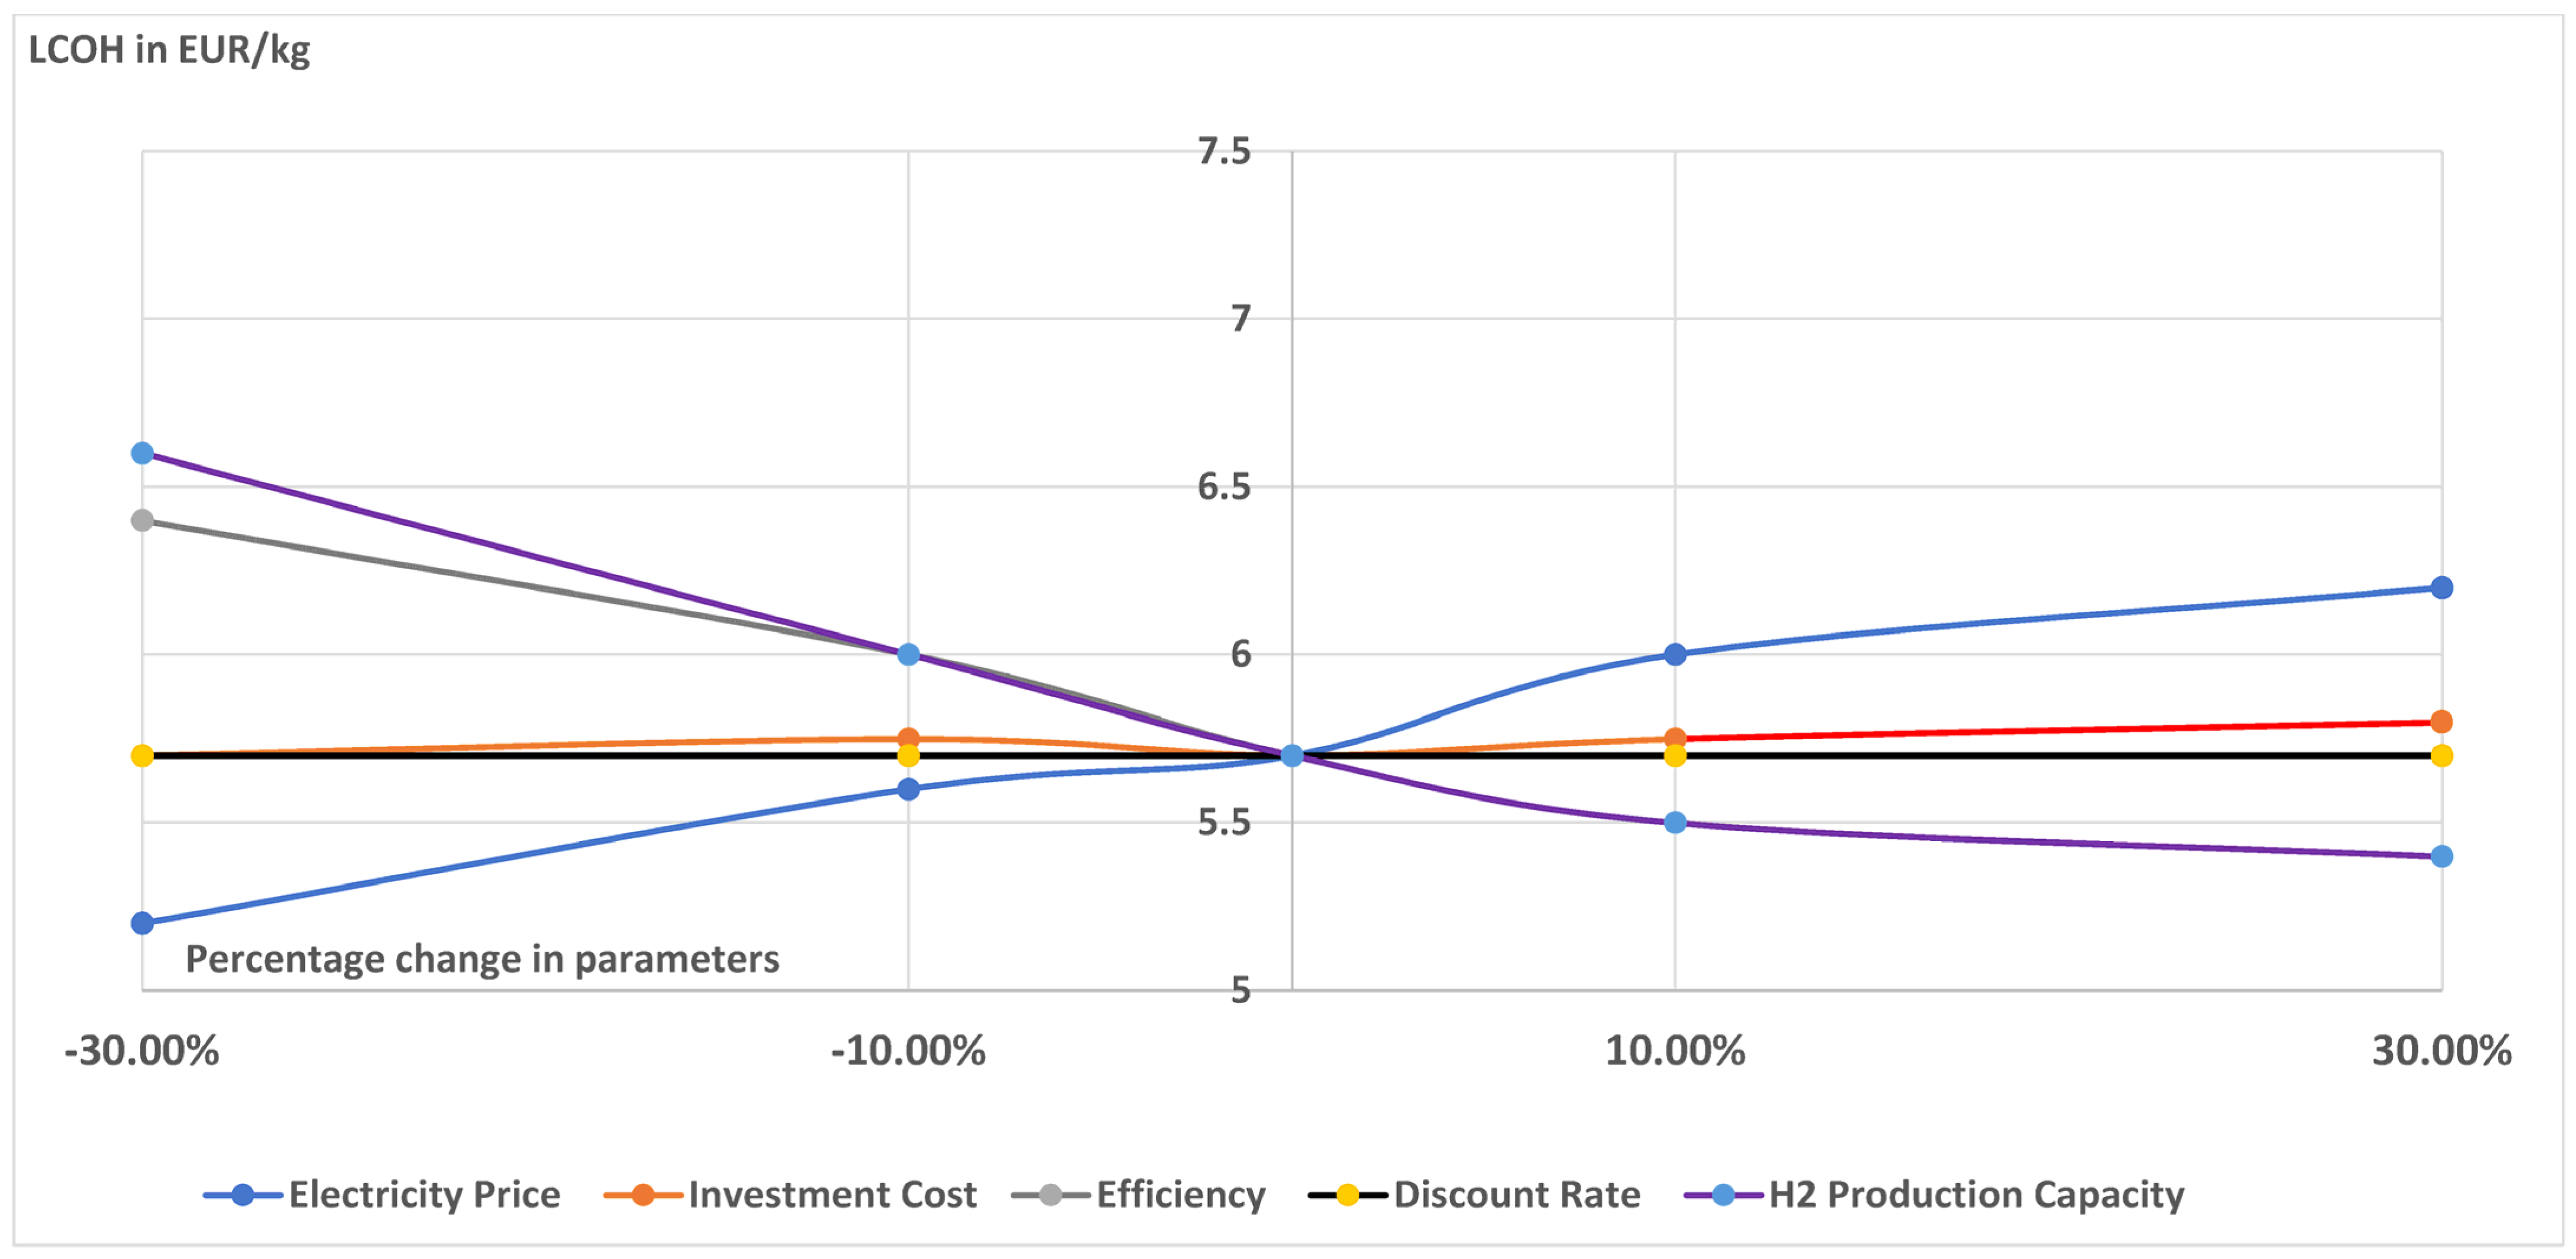
4.2. Sensitivity Analysis on LCOH

A sensitivity analysis has been carried out, aiming to evaluate the impacts of input parameters when calculating the LCOH under different scenarios. The analysis is performed by varying within a range of ±30% (%). The parameters taken into consideration include the investment costs, the discount rate, the capacity factor, the cost of electricity/natural gas, as well as the hydrogen production capacity. The production of hydrogen via the blue—CCS scenario is affected not only by the prices of natural gas, but also by the capacity factor and investment cost (Figure 3). As regards the prices of natural gas, it is noted that the LCOH is reduced to 2.25 EUR/kgH2 at the lower sensitivity bound, and increased to around 5.00 EUR/kgH2 at the upper sensitivity bound. This is attributed mainly to the large volume of natural gas utilized in the SMR-CCS plants, invariably causing large increases in their LCOH. Similarly, the LCOH values, when examining the impacts of the capacity factor, were 3.85 EUR/kgH2 and 3.4 EUR/kgH2 for the lower and upper sensitivity bounds, respectively. Moreover, an upward trend in the LCOH is noticed as the investment cost increases, with 3.9 EUR/kgH2 at the upper sensitivity bound.
Figure 4 and Figure 5 demonstrate that LCOH decreases when the capacity of the electrolyzer increases, both when the PEM is grid-powered and when it is solar-powered. The LCOH for green hydrogen decreases as technology and electrolyzer efficiency improve. In addition, the sensitivity analysis for the production of green hydrogen using the PEM electrolyzer indicates that 80% of the total costs for grid-connected electricity sources are attributed to electricity costs, whereas the solar power hydrogen production pathway is affected by investment costs (constituting more than 60% of the overall expenses). It is highlighted that the energy costs associated with grid and solar electricity are 0.1845 EUR/kWh and 0.02 EUR/kWh, respectively (Table 2).
Another factor of crucial importance is the electricity source used for hydrogen production. Solar power offers a more favorable price for hydrogen production compared to grid-connected electricity. Figure 5 illustrates the impacts of various parameters on the Levelized Cost of Hydrogen (LCOH) using electricity generated from solar power. The hydrogen production cost is predominantly influenced by the electricity cost, with capital costs being the most important factor.
It should be stated that the production of green hydrogen is directly tied to the availability and cost of renewable electricity sources, and so understanding and addressing these cost factors become pivotal. The ongoing efforts to reduce the cost of electricity through advancements in renewable technologies and increased efficiency will play a crucial role in enhancing the economic viability of hydrogen production. Simultaneously, managing and optimizing capital costs in the design and implementation of hydrogen production facilities will be essential for fostering a competitive and sustainable hydrogen market.

5. Conclusions and Future Outlook

This work has investigated the techno-economic performance of Greece’s hydrogen production capacity, calculating relative LCOH in hard-to-abate industries, such as oil refining. It is here shown that Greece is not yet ready to support a total hydrogen energy transition, taking into consideration the important gap in the production cost between green hydrogen and blue/grey hydrogen. As a matter of fact, the current framework does not enable the realization of zero-carbon industries by 2050.
In performing a techno-economic analysis, based on the reliance on natural gas and other gaseous energy carriers such as hydrogen, this study concludes that immediate amendments and changes are necessary to achieve the 2050 carbon-neutral targets. Undoubtedly, the role of hydrogen in the decarbonization of hard-to-abate industries is of crucial importance. This, however, requires the creation of an ecosystem based on integrated planning and an innovative decision support system, which will mitigate the risks, strengthen the competitiveness, and create business opportunities in the whole value chain.
However, the findings of this study highlight the considerable challenge posed by the high cost of green hydrogen production in Greece, necessitating substantial investments in infrastructure, technology, and incentives to stimulate demand in hard-to-abate industries like refining. With ongoing development in the country’s renewable energy sector and efforts to encourage the adoption of green hydrogen, there is potential for a decrease in production costs over time. However, this is not enough, as a framework for the generation and distribution of green hydrogen should be developed, in order to limit uncertainty for investors. Furthermore, the lack of infrastructure in conjunction with the limited domestic market hinders the upscaling of hydrogen production in Greece. Moreover, the global green hydrogen market is still nascent, with limited international demand. This factor could constrain the opportunity for green hydrogen exports from Greece.
The regulatory and political constraints of green hydrogen generation constitute significant challenges that must be addressed for hard-to-abate industries, in order to reach their energy transition targets. Investments in the necessary infrastructure should be made in order to support the industry. Tackling these challenges will necessitate a sustained, long-term commitment to the development of the green hydrogen industry.
It is important to take into account stakeholder motivation, with the main emphasis being on decarbonization rather than favoring a specific approach. Various approaches must be undertaken to diminish reliance on fossil fuels and decrease greenhouse gas (GHG) emissions. The results of this work indicate that the current levelized cost of green hydrogen falls short compared to grey or blue hydrogen. Therefore, it is imperative to foster innovative action aiming to reduce costs, implement increased carbon taxation, encourage and incentivize hydrogen adoption, and secure enhanced funding from the European Union. Subsidies and cost allocation mechanisms are vital for increasing stakeholder participation and mitigating investment risks. To facilitate the transition towards green hydrogen, subsidies and cost allocation mechanisms become vital tools. These financial incentives will serve to increase stakeholder participation and help mitigate the risks associated with investments in cleaner technologies. By fostering a supportive and incentivized environment, policymakers can accelerate the shift towards greener and more sustainable hydrogen production methods, aligning with the broader objective of decarbonization and environmental responsibility.
It is suggested that the incorporation of a carbon tax has the potential to substantially lower the costs associated with hydrogen production from both steam methane reforming (SMR) and electrolyzers [65]. It is worth noting that in addition to a substantial rise in natural gas prices in the market, only a substantial fee per unit weight of CO2 can achieve the desired outcome. Taking into account emissions and costs, the study concludes that methane reforming with carbon capture is a viable option (blue—CCS scenario), and it seems to be a viable solution for the decarbonization of hard-to-abate industries until such time as green hydrogen using RES can be cost-competitive. Furthermore, the employment of CCS is important for reaching the European decarbonization goals (by 2050, at least 10 Gt of CO2) [63]. In addition, the significant uncertainty resulting from disrupted Russian gas supplies and geopolitical instabilities exacerbates energy scarcity in the European energy market, intensifying price pressures and volatility for both fossil and renewable energy sources. As a result, stakeholders in the energy sector must navigate these uncertainties and develop strategies to address the challenges posed by geopolitical factors, ensuring resilience and adaptability in the face of evolving market dynamics. In this context, phasing out Russian pipeline gas could increase the importance of CCS, as the minimum amount of CO2 sequestered by 2050 could reach 15 Gt [66].
Finally, this work can be improved and expanded upon by taking into consideration: (i) other energy-intensive industrial sectors covered by ETS (i.e., steel, cement, ammonia, etc.), so as to provide a more comprehensive depiction of European industry; (ii) long-term uncertainties of the 2050 European energy system (especially in the areas of technology development and policy regulation). These uncertainties are of crucial importance to all stakeholders.

Author Contributions

Conceptualization, E.A.N.; methodology, E.A.N.; validation, G.X. and S.K.; resources, S.K.; data curation, E.A.N.; writing—original draft preparation, E.A.N.; writing—review and editing, S.K. and G.X. All authors have read and agreed to the published version of the manuscript.

Funding

This research received no external funding.

Data Availability Statement

The data presented in this study are available on request from the corresponding author due to privacy.

Conflicts of Interest

E.A.N. and S.K. were employed by HelleniQ Energy. The company was not involved in the study design, collection, analysis, interpretation of data, the writing of this article or the decision to submit it for publication. The remaining authors declare that the research was conducted in the absence of any commercial or financial relationships that could be construed as a potential conflict of interest.

References

  1. Sharma, S.; Agarwal, S.; Jain, A. Significance of hydrogen as economic and environmentally friendly fuel. Energies 2021, 14, 7389. [Google Scholar] [CrossRef]
  2. Cader, J.; Koneczna, R.; Olczak, P. The impact of economic, energy, and environmental factors on the development of the hydrogen economy. Energies 2021, 14, 4811. [Google Scholar] [CrossRef]
  3. Hernandez, P.G.; Berg, T.L.; Xydis, G. Usage of Methanol Fuel Cells to Reduce Power Outages in the Etelä-Savo Region, Finland. Environments 2023, 10, 96. [Google Scholar] [CrossRef]
  4. Maggio, G.; Nicita, A.; Squadrito, G. How the hydrogen production from RES could change energy and fuel markets: A review of recent literature. Int. J. Hydrogen Energy 2019, 44, 11371–11384. [Google Scholar] [CrossRef]
  5. Gandhi, K.; Apostoleris, H.; Sgouridis, S. Catching the hydrogen train: Economics-driven green hydrogen adoption potential in the United Arab Emirates. Int. J. Hydrogen Energy 2022, 47, 22285–22301. [Google Scholar] [CrossRef]
  6. Baker, F. Is the United Kingdom’s hydrogen strategy an effective low carbon strategy? Int. J. Energy Prod. Manag. 2022, 7, 164–175. [Google Scholar] [CrossRef]
  7. International Energy Agency. Global Hydrogen Review. 2021. Available online: https://iea.blob.core.windows.net/assets/5bd46d7b-906a-4429-abda-e9c507a62341/GlobalHydrogenReview2021.pdf (accessed on 17 December 2023).
  8. European Commission. Communication COM/2020/301: A Hydrogen Strategy for a Climate-Neutral Europe|Knowledge for Policy. 2020. Available online: https://knowledge4policy.ec.europa.eu/publication/communication-com2020301-hydrogen-strategy-climate-neutral-europe_en (accessed on 15 December 2023).
  9. New Definitions for Blue and Green Hydrogen: The European Commission’s Package on Hydrogen and Decarbonized Gas Markets. Available online: https://www.insideenergyandenvironment.com/2022/01/new-definitions-for-blue-and-green-hydrogen-the-european-commissions-package-on-hydrogen-and-decarbonized-gas-markets/ (accessed on 10 December 2023).
  10. European Commission Delegated Regulation (European Union of XXX Supplementing Directive (European Union) 2018/2001 of the European Parliament and of the Council by Establishing a Union Methodology Setting out Detailed Rules for the Production of Renewable Liquid and Gaseous Transport Fuels of Non-Biological Origin Ref. Ares (2022) 3836651–20/05/2022. Available online: https://www.euractiv.com/wp-content/uploads/sites/2/2022/05/090166e5ec7b7157.pdf (accessed on 23 November 2023).
  11. da Silva Veras, T.; Mozer, T.S.; da Silva César, A. Hydrogen: Trends, production and characterization of the main process worldwide. Int. J. Hydrogen Energy 2017, 42, 2018–2033. [Google Scholar] [CrossRef]
  12. Benalcazar, P.; Komorowska, A. Prospects of green hydrogen in Poland: A techno-economic analysis using a Monte Carlo approach. Int. J. Hydrogen Energy 2022, 47, 5779–5796. [Google Scholar] [CrossRef]
  13. de Graaf, V. Clean Hydrogen: Building Block of a New Geopolitical Landscape, Spanish Inst Strateg Stud. 2021. Available online: https://lib.ugent.be/catalog/pug01:8713281 (accessed on 15 November 2023).
  14. Chu, K.H.; Lim, J.; Mang, J.S.; Hwang, M.H. Evaluation of strategic directions for supply and demand of green hydrogen in South Korea. Int. J. Hydrogen Energy 2022, 47, 1409–1424. [Google Scholar] [CrossRef]
  15. Liu, W.; Wan, Y.; Xiong, Y.; Gao, P. Green hydrogen standard in China: Standard and evaluation of low-carbon hydrogen, clean hydrogen, and renewable hydrogen. Int. J. Hydrogen Energy 2022, 47, 24584–24591. [Google Scholar] [CrossRef]
  16. AbouSeada, N.; Hatem, T.M. Climate action: Prospects of green hydrogen in Africa. Energy Rep. 2022, 8, 3873–3890. [Google Scholar] [CrossRef]
  17. Zhou, Y.; Li, R.; Lv, Z.; Liu, J.; Zhou, H.; Xu, C. Green hydrogen: A promising way to the carbon-free society. Chin. J. Chem. Eng. 2022, 43, 2–13. [Google Scholar] [CrossRef]
  18. Bujok, P.; Bjørn-Thygesen, F.; Xydis, G. Developing a sustainable energy strategy for Midtjyllands Airport, Denmark. Int. J. Sustain. Transp. 2023, 17, 273–297. [Google Scholar] [CrossRef]
  19. Touili, S.; Merrouni, A.A.; Azouzoute, A.; El Hassouani, Y.; Amrani, A.I. A technical and economical assessment of hydrogen production potential from solar energy in Morocco. Int. J. Hydrogen Energy 2018, 43, 22777–22796. [Google Scholar] [CrossRef]
  20. National Energy and Climate Plan (NECP); Ministry of Environment and Energy: Athens, Greece, 2019.
  21. OT, 2023, Greece Takes a Stance on Hydrogen. Available online: https://www.ot.gr/2022/11/02/english-edition/greece-takes-a-stance-on-hydrogen/ (accessed on 17 December 2023).
  22. Schiebahn, S.; Grube, T.; Robinius, M.; Tietze, V.; Kumar, B.; Stolten, D. Power to gas: Technological overview, systems analysis and economic assessment for a case study in Germany. Int. J. Hydrogen Energy 2015, 40, 4285–4294. [Google Scholar] [CrossRef]
  23. European Hydrogen Observatory. Available online: https://observatory.clean-hydrogen.europa.eu/sites/default/files/2023-11/Report%2001%20-%20November%202023%20-%20The%20European%20hydrogen%20market%20landscape.pdf (accessed on 1 March 2024).
  24. Hydrogen Council in Collaboration with McKinsey & Company. A Perspective on Hydrogen Investment, Market Development and Cost Competitiveness, Hydro Insights; Hydrogen Council in Collaboration with McKinsey & Company: Sydney, Australia, 2021. [Google Scholar]
  25. Chu, H.; Berger, L.; Grenga, T.; Wu, Z.; Pitsch, H. Effects of differential diffusion on hydrogen flame kernel development under engine conditions. Proc. Combust. Inst. 2023, 39, 2129–2138. [Google Scholar] [CrossRef]
  26. Park, J.; Kim, C.H.; Cho, H.S.; Kim, S.K.; Cho, W.C. Techno-economic analysis of green hydrogen production system based on renewable energy sources. Trans. Korean Hydrog. New Energy Soc. 2020, 31, 337–344. [Google Scholar] [CrossRef]
  27. Aziz, G.; Sarwar, S.; Khan, M.S.; Waheed, R. The prospect of green hydrogen in Saudi Arabia: An overview of theoretical and empirical approach. Environ. Sci. Pollut. Res. 2024, 31, 6597–6609. [Google Scholar] [CrossRef]
  28. Karayel, G.K.; Javani, N.; Dincer, I. Green hydrogen production potential for Turkey with solar energy. Int. J. Hydrogen Energy 2022, 47, 19354–19364. [Google Scholar] [CrossRef]
  29. Søgaard-Deakin, J.; Xydis, G. Green hydrogen production using proton membrane electrolysis of clean drinking water. J. Environ. Eng. Sci. 2024, 40, 1–9. [Google Scholar] [CrossRef]
  30. Sorrenti, I.; Rasmussen, T.B.; Xydis, G.; Enevoldsen, P.; You, S. Correlations between component size green hydrogen demand and breakeven price for energy islands. Renew. Sustain. Energy Rev. 2023, 183, 113439. [Google Scholar] [CrossRef]
  31. El-Emam, R.S.; Özcan, H. Comprehensive review on the techno-economics of sustainable large-scale clean hydrogen production. J. Clean. Prod. 2019, 220, 593–609. [Google Scholar] [CrossRef]
  32. Janssen, J.L.; Weeda, M.; Detz, R.J.; van der Zwaan, B. Country-specific cost projections for renewable hydrogen production through off-grid electricity systems. Appl. Energy 2022, 309, 118398. [Google Scholar] [CrossRef]
  33. Pelaez-Samaniego, M.R.; Riveros-Godoy, G.; Torres-Contreras, S.; Garcia-Perez, T.; Albornoz-Vintimilla, E. Production and use of electrolytic hydrogen in Ecuador towards a low carbon economy. Energy 2014, 64, 626–631. [Google Scholar] [CrossRef]
  34. Zhang, Y.; Wang, N.; Tong, X.; Duan, L.; Lin, T.-E.; Maréchal, F.; Van Herle, J.; Wang, L.; Yang, Y. Reversible solid-oxide cell stack based power-to-x-to-power systems: Economic potential evaluated via plant capital-cost target. Appl. Energy 2021, 290, 116700. [Google Scholar] [CrossRef]
  35. Hill, S.J.P.; Bamisile, O.; Hatton, L.; Staffell, I.; Jansen, M. The cost of clean hydrogen from offshore wind and electrolysis. J. Clean. Prod. 2024, 445, 141162. [Google Scholar] [CrossRef]
  36. Biggins, F.; Kataria, M.; Roberts, D.; Brown, S. Green hydrogen investments: Investigating the option to wait. Energy 2022, 241, 122842. [Google Scholar] [CrossRef]
  37. Schmidt, O.; Gambhir, A.; Staffell, I.; Hawkes, A.; Nelson, J.; Few, S. Future cost and performance of water electrolysis: An expert elicitation study. Int. J. Hydrogen Energy 2017, 42, 30470–30492. [Google Scholar] [CrossRef]
  38. Ursúa, A.; Barrios, E.L.; Pascual, J.; San Martín, I.; Sanchis, P. Integration of commercial alkaline water electrolysers with renewable energies: Limitations and improvements. Int. J. Hydrogen Energy 2016, 41, 12852–12861. [Google Scholar] [CrossRef]
  39. Panah, P.G.; Cui, X.; Bornapour, M.; Hooshmand, R.A.; Guerrero, J.M. Marketability analysis of green hydrogen production in Denmark: Scale-up effects on grid-connected electrolysis. Int. J. Hydrogen Energy 2022, 47, 12443–12455. [Google Scholar] [CrossRef]
  40. Krishnan, S.; Fairlie, M.; Andres, P.; de Groot, T.; Kramer, G.J. Power to gas (H2): Alkaline electrolysis. In Technological Learning in the Transition to a Low-Carbon Energy System; Academic Press: New York, NY, USA, 2020; pp. 165–187. [Google Scholar]
  41. Esposito, D.V. Membraneless electrolyzers for low-cost hydrogen production in a renewable energy future. Joule 2017, 1, 651–658. [Google Scholar] [CrossRef]
  42. Tsagkari, M. Energy Governance in Greece. In Handbook of Energy Governance in Europe; Springer International Publishing: Cham, Switzerland, 2022; pp. 709–736. [Google Scholar]
  43. Griffiths, S.; Sovacool, B.K.; Kim, J.; Bazilian, M.; Uratani, J.M. Decarbonizing the oil refining industry: A systematic review of sociotechnical systems, technological innovations, and policy options. Energy Res. Soc. Sci. 2022, 89, 102542. [Google Scholar] [CrossRef]
  44. LaFleur, A. Use and Optimization of Hydrogen at Oil Refineries; University of Houston: Houston, TX, USA, 2017. [Google Scholar]
  45. BP. 2024. Available online: https://www.bp.com/en/global/air-bp/news-and-views/press-releases/bp-refinery-in-lingen-starts-production-of-saf.html (accessed on 10 February 2024).
  46. REFHYNE. 2024. Available online: https://www.clean-hydrogen.europa.eu/projects-repository/refhyne_en (accessed on 10 February 2024).
  47. Shell, 2024, Hydrogen—What Is It? Hydrogen Fuel & Projects. Available online: https://www.shell.com/energy-and-innovation/new-energies/hydrogen.html (accessed on 15 December 2023).
  48. Renewablesnow. 2024. Available online: https://renewablesnow.com/news/everfuel-milks-first-h2-at-20-mw-electrolysis-plant-in-denmark-808548/ (accessed on 3 September 2023).
  49. Multiplhy Project. 2024. Available online: https://multiplhy-project.eu/ (accessed on 17 December 2023).
  50. Soltani, R.; Rosen, M.A.; Dincer, I. Assessment of CO2 capture options from various points in steam methane reforming for hydrogen production. Int. J. Hydrogen Energy 2014, 39, 20266–20275. [Google Scholar] [CrossRef]
  51. Huneke, F.; Göß, S.; Österreicher, J.; Dahroug, O. Power Purchase Agreements: Financial Model for Renewable Energies; Energy Brainpool: Berlin, Germany, 2018. [Google Scholar]
  52. EPA, DOE. Report of the Interagency Task Force on Carbon Capture and Storage; Department of Energy and Environmental Protection Agency: Washington, DC, USA, 2010. [Google Scholar]
  53. Viktorsson, L.; Heinonen, J.T.; Skulason, J.B.; Unnthorsson, R. A step towards the hydrogen economy—A life cycle cost analysis of a hydrogen refueling station. Energies 2017, 10, 763. [Google Scholar] [CrossRef]
  54. EC. ASSET Study on Hydrogen Generation in Europe: Overview of Costs and Key Benefits. 2021. Available online: https://op.europa.eu/en/publication-detail/-/publication/c4000448-b84d-11eb-8aca-01aa75ed71a1 (accessed on 21 November 2023).
  55. Khatiwada, D.; Vasudevan, R.A.; Santos, B.H. Decarbonization of natural gas systems in the EU—Costs, barriers, and constraints of hydrogen production with a case study in Portugal. Renew. Sustain. Energy Rev. 2022, 168, 112775. [Google Scholar] [CrossRef]
  56. Nel. Hydrogen Electrolysers the World’s Most Efficient and Reliable Electrolysers. 2020. Available online: http://www.silpac.com.cn/download/Electrolysers-Brochure-Rev-C.pdf (accessed on 3 September 2023).
  57. Sunfire, Hydrogen the Renewable Feedstock and Energy Carrier. 2022. Available online: https://www.sunfire.de/en/hydrogen (accessed on 21 November 2023).
  58. IEAGHG. IEAGHG Technical Report: Techno-Economic Evaluation of SMR Based Standalone (Merchant) Plant with CCS. 2017. Available online: https://ieaghg.org/exco_docs/2017-02.pdf (accessed on 3 September 2023).
  59. Christensen, A. Assessment of hydrogen production costs from electrolysis: United States and Europe. Int. Counc. Clean Transp. 2020, 1, 1–64. [Google Scholar]
  60. Statista. Available online: https://www.statista.com/statistics/1290229/carbon-intensity-power-sector-greece/ (accessed on 10 January 2024).
  61. Janssen, J. Fact Sheet—Steam Methane Reforming (SMR) for Hydrogen Production with Carbon Capture Using Flue Gas. 2018. Available online: https://energy.nl/wp-content/uploads/steam-methane-reforming-smr-for-hydrogen-production-with-carbon-capture-using-flue-gas-2-7.pdf (accessed on 10 January 2024).
  62. EU Carbon PermitsPrice—Chart—Historical Data—News. Available online: https://tradingeconomics.com/commodity/carbon (accessed on 15 January 2023).
  63. Eurostat. Electricity Price Statistics. 2023. Available online: https://ec.europa.eu/eurostat/statistics-explained/index.php?title=Electricity_price_statistics#Electricity_prices_for_non-household_consumers (accessed on 17 December 2023).
  64. Eurostat, 2024: Natural Gas Price Statistics. 2023. Available online: https://ec.europa.eu/eurostat/statistics-explained/index.php?title=Natural_gas_price_statistics (accessed on 20 January 2024).
  65. Zun, M.T.; McLellan, B.C. Cost Projection of Global Green Hydrogen Production Scenarios. Hydrogen 2023, 4, 932–960. [Google Scholar] [CrossRef]
  66. Durakovic, G.; Zhang, H.; Knudsen, B.R.; Tomasgard, A.; del Granado, P.C. Decarbonizing the European energy system in the absence of Russian gas: Hydrogen uptake and carbon capture developments in the power, heat and industry sectors. J. Clean. Prod. 2024, 435, 140473. [Google Scholar] [CrossRef]
Figure 1. Configuration of the system under study.
Energies 17 01722 g001
Figure 2. Minimum and maximum LCOH (EUR/kg) of the technologies under study.
Energies 17 01722 g002
Figure 3. Sensitivity of LCOH (EUR/kg) at ±30% (%) of parameters for the blue—CCS scenario.
Energies 17 01722 g003
Figure 4. Sensitivity of LCOH (EUR/kg) at ±30% (%) of parameters for the green—PEM, grid electricity scenario.
Energies 17 01722 g004
Figure 5. Sensitivity of LCOH (EUR/kg) at ±30% (%) of parameters for the green—PEM, solar electricity scenario.
Energies 17 01722 g005
Table 1. Investment costs, efficiency, and stack lifetime for electrolyzers and Steam Methane Reformers for the years 2020, 2030, and 2050 [54].
Factor Year PEM ALK SOEC SMR + CCU PV
Investment cost (Mil EUR/MW)20201.26–2.820.44–2.831.07–6.660.79–1.650.43–0.83
20300.84–2.820.36–1.530.58–3.330.91–1.290.27–0.27
20500.77–2.740.22–0.880.39–1.140.86–1.210.16–0.16
Efficiency (LHV %)202056–6363–7074–8169-
203061–6963–7274–8469-
205067–7470–8077–8469-
Lifetime (Hours)202030,000–90,00050,000–90,00010,000–30,000-1343
203060,000–90,00072,500–100,00040,000–60,000-1484
2050100,000–150,000100,000–150,00075,000–100,000-1499
Table 2. Parameters taken into consideration for the calculation of LCOH.
Parameter Technology Value Units Source
Hydrogen productionPEM3MW H2[56]
ALK13MW H2[56]
SOEC2.5MW H2[57]
CCU300MW H2[58]
LifetimeElectrolyzers20Years[54]
CCU25years[58]
PV20years[57]
F-OPEXElectrolyzers1.5% of CAPEXEUR[53]
CCU3% of CAPEXEUR[58]
Replacement and chemical costs: annualized (REPEX)Electrolyzers20% of CAPEX per replacementEUR[59]
CCU3% of CAPEXEUR[58]
Emission factorsGrid electricity344gCO2/kWh e[60]
H2 production (via CCU)890gCO2/Nm3 H2[61]
Electrolyzers’ efficiency (LHV of H2)PEM, ALK, and SOEC61%[57]
Full load hour factor (capacity)Grid electricity80%[53]
Solar electricity20%[58]
Natural gas95%[58]
ETS CO2 emissions: (carbon) tax 82EUR/tCO2[62]
Density0.0889kg/Nm3
Lower heating value33.3333kWh/kg H2
Discount rate6%[53]
Capacity recovery factor (CRF)Electrolyzers0.0872
Grey0.0782
Blue—CCU0.0782
Water consumptionPEM10.12kg/kg H2[54]
ALK10.12kg/kg H2[54]
SOEC13.00kg/kg H2[57]
CCU6.70kg/kg H2[58]
Energy costsGrid electricity (without taxes in Greece)0.1845EUR/kWh[63]
Lowest cost of solar electricity (European average)0.02EUR/kWh[64]
Natural gas0.1171EUR/kWh[64]
Water costsElectrolyzers1.8188EUR/m3[63]
CCU0.2EUR/m3[58]
Table 3. Calculation of LCOH in 2020, 2030, and 2050 (EUR/kWh H2) in Greece.
Technology Year
202020302050
MinMaxMinMaxMinMax
ElectrolyzerPEMGRID6.659.706.038.553.885.34
PV5.5411.494.498.632.883.34
ElectrolyzerALKGRID6.2011.116.048.675.346.48
PV4.8915.484.529.833.796.72
ElectrolyzerSOECGRID6.3616.435.577.965.136.10
PV6.0624.004.2710.543.886.50
SMR GREY—BAU1.922.08----
BLUE—CCS2.362.482.202.451.822.00
Disclaimer/Publisher’s Note: The statements, opinions and data contained in all publications are solely those of the individual author(s) and contributor(s) and not of MDPI and/or the editor(s). MDPI and/or the editor(s) disclaim responsibility for any injury to people or property resulting from any ideas, methods, instructions or products referred to in the content.

