Article

Low-Carbon Optimization of Integrated Energy Systems with Time-of-Use Carbon Metering on the User Side

School of Electrical Engineering, Northeast Electric Power University, Jilin 132000, China
*
Author to whom correspondence should be addressed.
Energies 2024, 17(9), 2071; https://doi.org/10.3390/en17092071
Submission received: 11 March 2024 / Revised: 21 April 2024 / Accepted: 25 April 2024 / Published: 26 April 2024

Abstract

:
In the wake of the dual-carbon objective, the call for low-carbon attributes in integrated energy systems is ascending, with an amplified imperative to integrate wind and solar power efficiently. This study introduces an advanced low-carbon optimization framework for integrated energy systems, incorporating a sophisticated time-differentiated carbon accounting mechanism attentive to consumer emissions. A nuanced carbon accounting model is crafted to assess consumer emissions with greater accuracy. Predicated on these emissions, a refined low-carbon demand response model is articulated, factoring in the influence of carbon emission factors pertinent to electricity and heat procurement on user conduct. This model integrates the consideration of heat reclaimed from methanation processes, which in turn informs the carbon emission factors associated with purchased heat, and evaluates the subsequent optimization impact on the system. The proposed model is designed to curtail the system’s operational expenditures and is operationalized via the CPLEX solver. Through the establishment of various scenarios for evaluative comparison, the model is corroborated to substantially augment the system’s proficiency in assimilating wind and solar energy, markedly curtail carbon emissions, and facilitate a sustainable and cost-efficient operation of the integrated energy system.

1. Introduction

In the vortex of accelerated global economic progression, the ascendant craving for energy across myriad sectors has precipitated the extensive exploitation of fossil fuels, thereby aggravating environmental degradation. The consequential prodigious discharges of carbon dioxide notably contribute to the phenomenon of global warming. To uphold its responsibility towards terrestrial stewardship and humanity’s welfare, China promulgated the “dual carbon” goals at the 75th United Nations General Assembly. This ambitious manifesto envisions capping carbon emissions by the year 2030 and attaining carbon neutrality by 2060. Attaining these targets necessitates an imperative reform in the electric power sector and a pronounced reduction in carbon emissions. The Integrated Energy System (IES) is an energy system that optimizes the coupling and collaboration of multiple types of energy sources, such as electricity, heat, and gas. As a key energy solution, IES, which integrates multiple energy types, has demonstrated its importance in the realization of clean and efficient energy use and has become a key factor in the future development of energy [1]. The exploration of IES’s potential to slash carbon emissions is indispensable for begetting an eco-friendly and sustainable energy epoch.
Discourse on the methodologies of carbon emission accounting and trading within the realms of IES is pivotal to the actualization of its environmental sustainability. Reference [2] examines the impact of greenhouse gas accounting regimes on the demand for grid carbon emission factors. Reference [3] suggests that implementing carbon metering in traditional power systems not only reduces their emissions but also enhances carbon reduction awareness among users. Reference [4] introduces a multi-timescale optimal scheduling method for integrated energy systems, addressing the challenges of accurately estimating carbon trading costs across different timescales under a stepped carbon trading mechanism. Reference [5] explores the uncertainty in indirect carbon emission intensities at grid-connected points of integrated energy systems, proposing a robust optimization method to enhance the system’s resilience against variability in carbon pricing. Reference [6] focuses on quantifying carbon emissions in industrial parks, employing system simulations to identify emission sources and develop optimization strategies for their carbon management systems. Reference [7] develops a comprehensive carbon measurement method that spans the entire chain from source through the network to the load, based on analyzing carbon emission flows within power systems. Reference [8] evaluates different accounting methods and recommends a greenhouse gas emissions strategy tailored to specific park characteristics. Reference [9] discusses the measurement attributes of user carbon emissions and introduces a comprehensive traceability method for the electric carbon measurement network. Reference [10] advocates for an articulation and mutual recognition system among different types of environmental equity products within the electric carbon market, detailing supporting technologies such as traceability, transaction, and deposit processes, collaborative clearing, and comprehensive assessment methods for the synergistic development of markets for electricity, carbon, and green certificates. The above studies suggest that while carbon emission and trading mechanisms are critical for reducing emissions in integrated energy systems, existing studies rely on fixed carbon values, which are inadequate for effective scheduling within these systems. This paper proposes a dynamic, time-measured calculation method for carbon emissions, enabling real-time adjustments and optimization of unit outputs to determine momentary emission factors.
Whilst carbon emissions stem directly from the generative facet, they are inherently instigated by consumer-side energy demands, studies [11,12] argue that involving users in carbon trading mechanisms can enhance clean energy consumption and reduce carbon emissions. Research [13] assesses the direct carbon emission responsibility on the load side from the perspective of electricity consumption, finding that apportionment based on the Shapley value more accurately reflects each load member’s contribution to system carbon emissions. Research [14] examines both supply-side and user-side low-carbon mechanisms, their limitations, and the scheduling benefits of their complementary characteristics, proposing a power system low-carbon realization mechanism with source-load complementarity. Research [15] tracks the power consumption attributes from the load to the power side, categorizing users into high-carbon and low-carbon groups, implementing a carbon tax on high-carbon power to alter consumption habits, facilitate effective demand response, and achieve low-carbon power system planning from the load side. Research [16] introduces the concept of low-carbon demand response (LCDR) in the electricity market, detailing a price-based LCDR mechanism and its model. Research [17] proposes an incentive-based low-carbon demand response model from the user perspective to guide low-carbon scheduling on the supply side. Research [18] develops a dual-principle tiered carbon trading mechanism that includes user participation, leveraging dispatchable low-carbon resources during scheduling to reduce system emissions. Research [19] presents a systematic carbon emission reduction mechanism that encourages power system users to actively participate in reducing emissions, analyzing low-carbon demand response effects from both system and power user perspectives. This paper considers using variable-time carbon emission factors to incentivize users, based on time-differentiated carbon metering, to adjust their energy use behaviors, thereby influencing the economy and low-carbon objectives of the system side. In IES, thermoelectric loads are often co-existing, literature [20] discusses using energy routers to couple electric and thermal loads, with literature [21] elaborating on the principles of energy routers. It is noted that while consumer-side carbon emission responsibilities are frequently considered, the thermal load impact is seldom addressed. In this paper’s model, the thermal load’s influence is acknowledged, employing time-differentiated carbon accounting to secure time-specific carbon factors for consumer heating purchases, thereby engaging in a low-carbon demand response.
P2G equipment facilitates the conversion of electrical energy to natural gas through the electrolysis of water and the methanation reaction, enhancing the integration of energy sources and presenting a novel and effective approach for new energy utilization, thereby garnering scholarly attention [22,23]. Some researchers have demonstrated that the efficiency of energy use can be augmented by recovering waste heat from the methanation reaction during the electricity-to-gas conversion [24,25]. The viability of P2G heat recovery has been confirmed in studies [26,27], which propose using reaction waste heat directly for district heating. Research [28] has successfully optimized heat recovery in the power-to-gas process, achieving high recovery rates and substantial economic benefits from wind power through P2G. Research [29] suggests that the exothermic nature of the electricity-to-gas conversion can be effectively managed in conjunction with heat storage tanks, offering a new method to utilize surplus wind energy. The composition of heat output generally includes gas-fired boilers, cogeneration, etc., whose carbon emission factors are all at a high level and have a low incentive impact on the users. This paper proposes to introduce a heat recovery system for the methanation reaction process of the P2G equipment in the IES, which affects the composition of the heat output and changes the carbon emission factor in some time periods, so that the user’s heat use behavior is based on the new carbon emission factor for demand response.
Building upon the aforementioned discourse, this paper constructs a low-carbon optimization scheduling model for IES, cognizant of time-differentiated carbon accounting on the consumer side. The principal contributions of this paper are enumerated as follows:
(1)
It delineates time-specific carbon factors derived from the output conditions of IES units at various junctures to optimize consumer-side energy consumption behavior and its intrinsic carbon emissions.
(2)
It incorporates low-carbon demand response stratagems for both electrical and thermal loads on the consumer side, thereby amplifying the carbon mitigation capacity of consumers.
(3)
It embraces heat recovery from methanation reactions to transform the heating output landscape, influencing the carbon emission factors of consumer heating purchases and promoting the assimilation of wind and solar energy, as well as carbon reduction in the system.
The subsequent sections of this paper are arranged as follows: Section 2 explicates the specific calculation methodology and procedural framework for time-differentiated carbon accounting; Section 3 formulates a carbon trading model; Section 4 advances a low-carbon demand response mechanism; Section 5 and Section 6 engage in comparative analysis to authenticate the model’s efficacy and practicability through scenario construction; Section 7 encapsulates the study with concluding remarks.

2. Structure of the Integrated Energy System Considering Time-Differentiated Carbon Accounting on the Consumer Side

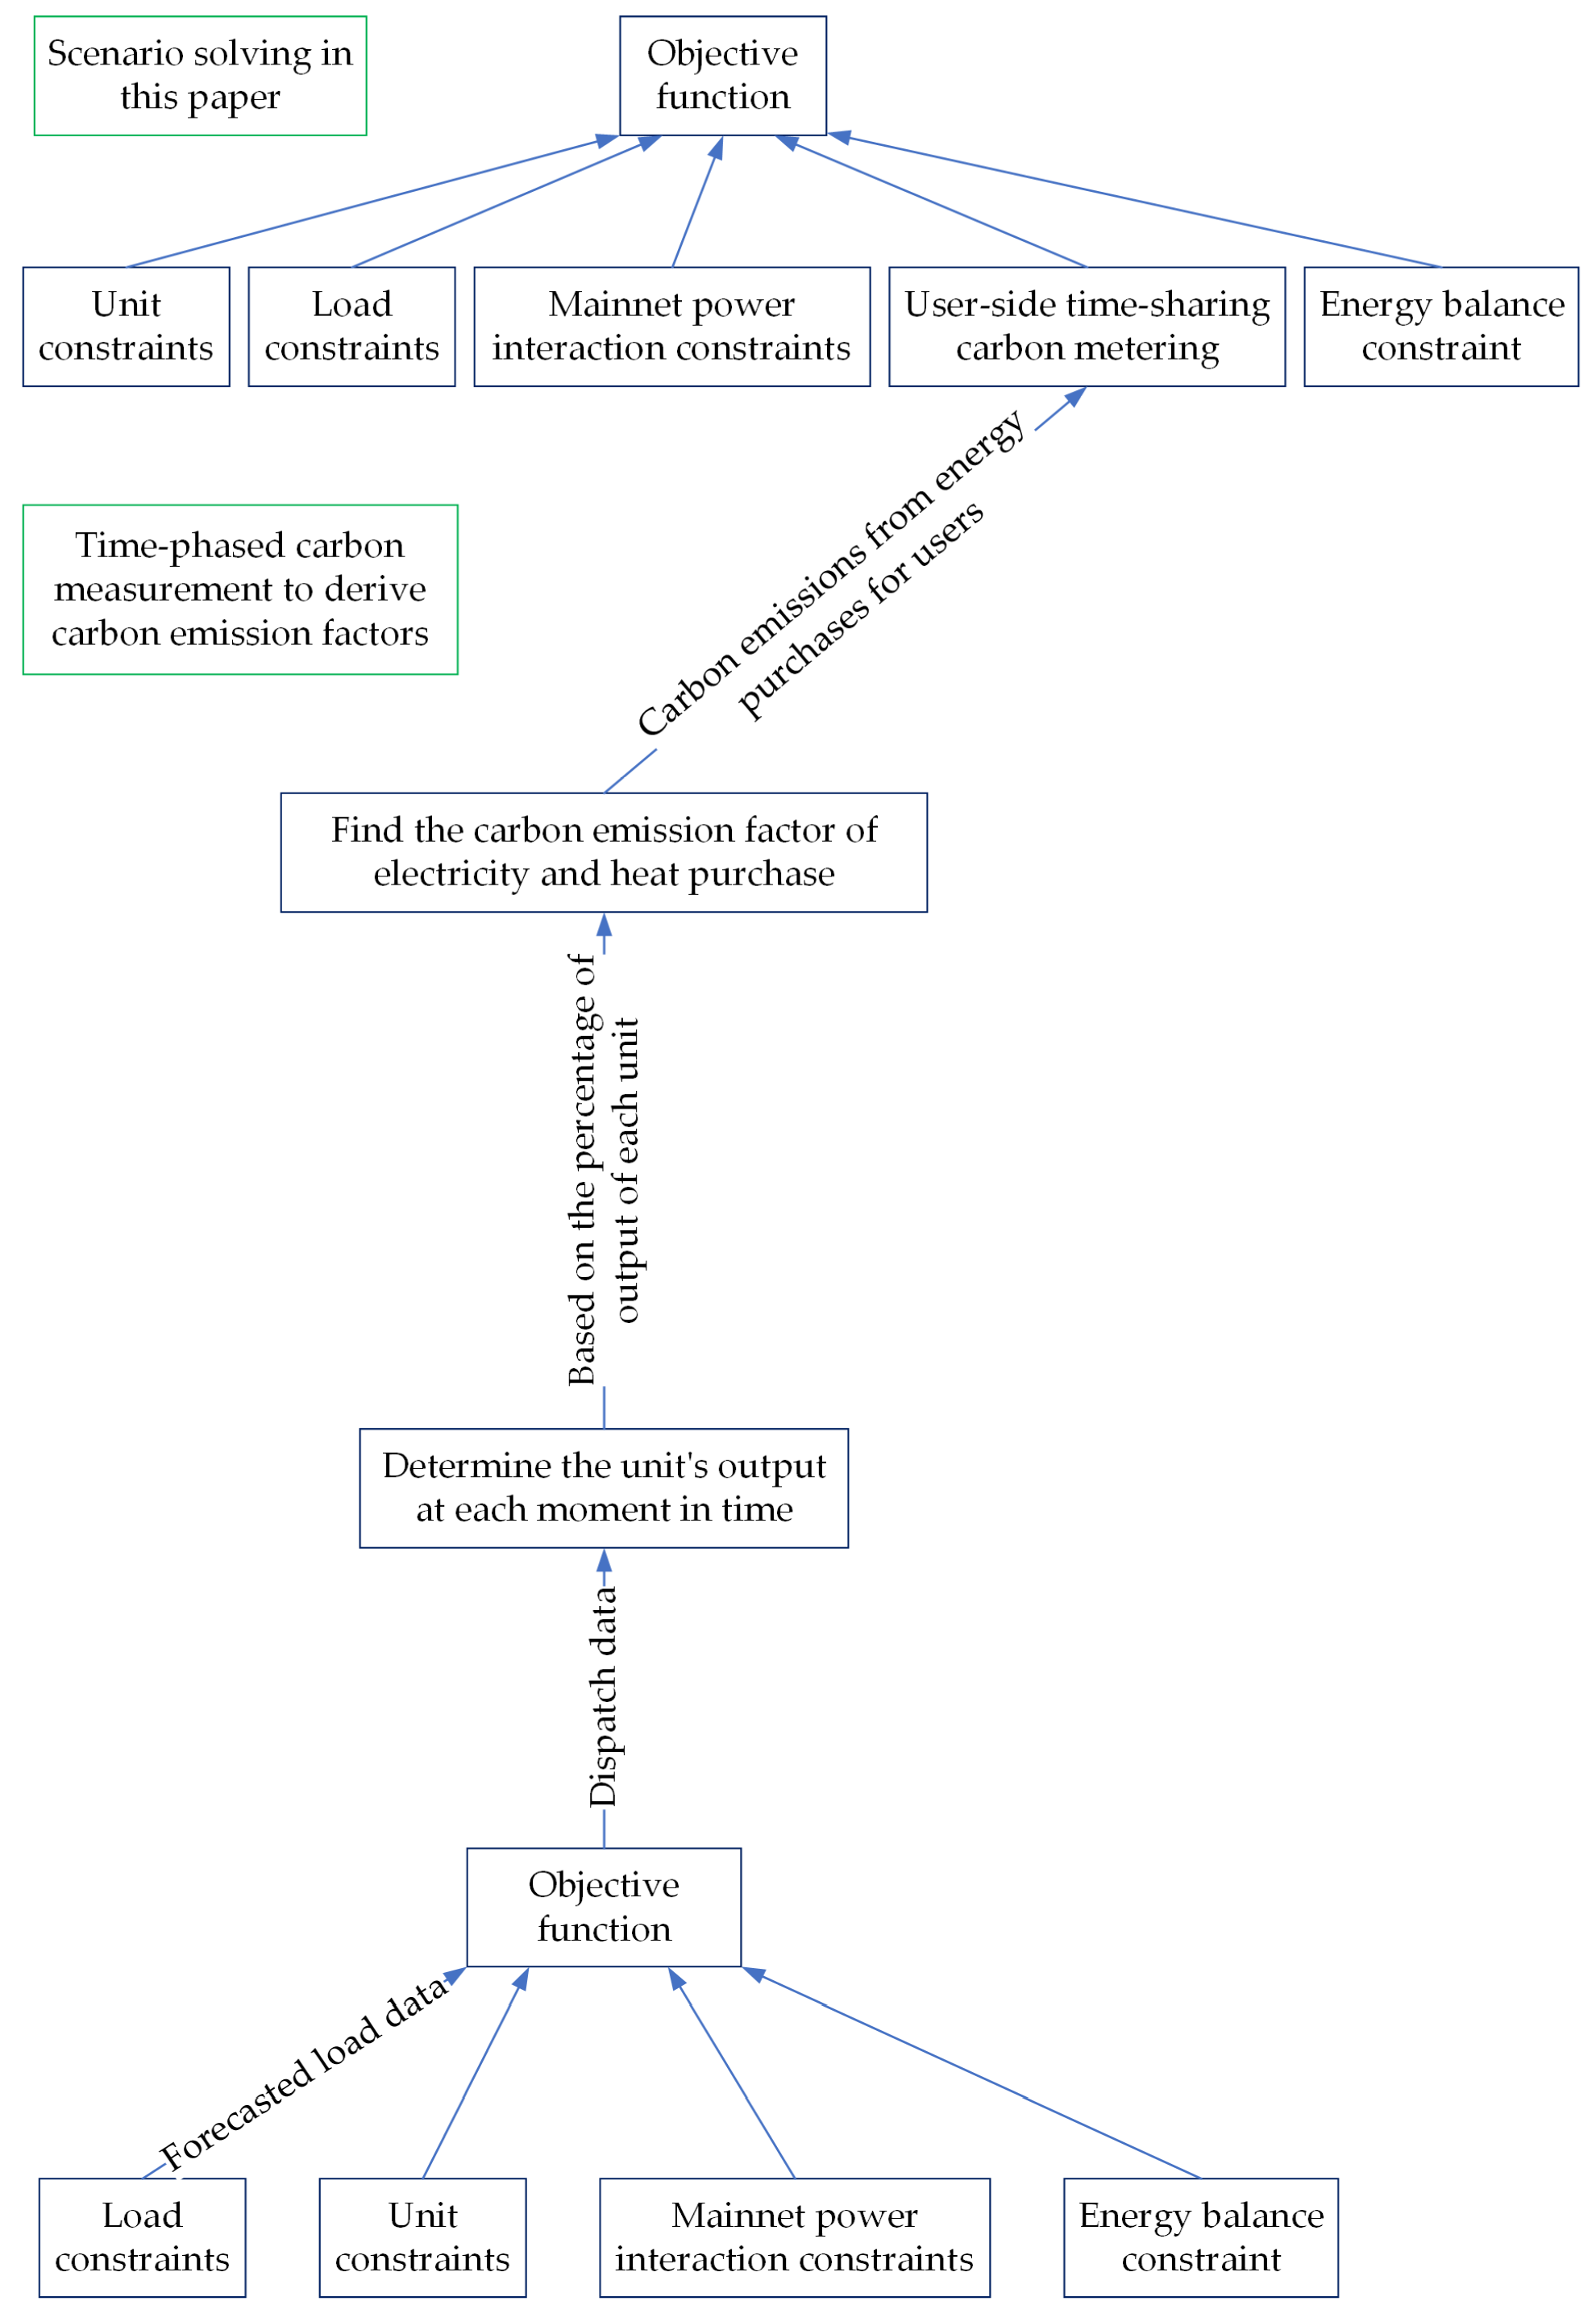
2.1. Time-Differentiated Carbon Accounting

Carbon accounting emerges as a pivotal mechanism to attain the twofold objectives of carbon neutrality. Presently, the prevalent approach involves employing static carbon emission factors as stipulated by the Intergovernmental Panel on Climate Change (IPCC). Nonetheless, the operational conditions of energy generation entities fluctuate over time, engendering divergent carbon dioxide outputs. The conventional methodology, reliant on mean carbon factors, falls short of addressing the imperative need for carbon reduction and fails to incentivize the adoption of renewable energy sources. To enhance calculation precision and foster the consumption of green energy, the adoption of temporally variegated carbon accounting is indispensable. This method ascertains exact carbon factors for distinct temporal segments by scrutinizing the output of various units across different intervals. The formula for calculating carbon emissions at any given moment is as outlined:
C t = γ t P t
γ 1 γ 24 = P a 1 P m 1 P a 24 P m 24 λ a λ m
where C t and γ t signify the carbon emissions and carbon factor values at time t, respectively; P j t denotes the output magnitude of unit j at time t; λ j indicates the carbon emission coefficient of unit j.
In contemporary inquiries into temporally variegated carbon accounting, the specificity of carbon emission factors for each time frame remains imprecise and overlooks the contributions of equipment involved in energy provision [30], thereby inadequately motivating loads. With a focus on the consumer end, it is essential for all apparatuses engaged in power distribution to partake in temporally variegated accounting to refine accuracy. The energy variants incorporated in the integrated energy system model delineated in this manuscript encompass natural gas, wind power, solar energy, and acquired electricity (chiefly derived from thermal power). Presuming the advanced publication of the carbon emission factor prediction curve to consumers, they are prompted to adjust their energy consumption behaviors daily. Upon recognizing the variances in carbon emission factors for future energy procurement, within their adjustment capabilities, consumers react with the aim of optimizing their carbon footprint reduction. To accurately incentivize consumer involvement in eco-friendly dispatching, the methodology depicted in Figure 1 is employed to derive temporally variegated carbon emission factors.
By projecting the system’s wind and solar production along with the park’s electric and thermal demands, day-ahead planning for the Integrated Energy System is executed to capture the output data for each unit at every moment. Temporally variegated carbon accounting results in the determination of carbon emission factors for procuring electricity and heat at each instant on the consumer side. Utilizing the gathered data, planning that takes into account the consumer-side demand for low-carbon response is undertaken, juxtaposing the system’s economic expenditures, carbon outputs, and the integration of wind and solar energy under two planning scenarios. According to scholarly works [31], it is ascertainable whether the aforementioned energy types incur carbon emissions during their production, transit, and usage phases, with their cumulative carbon emissions presented in Table 1.

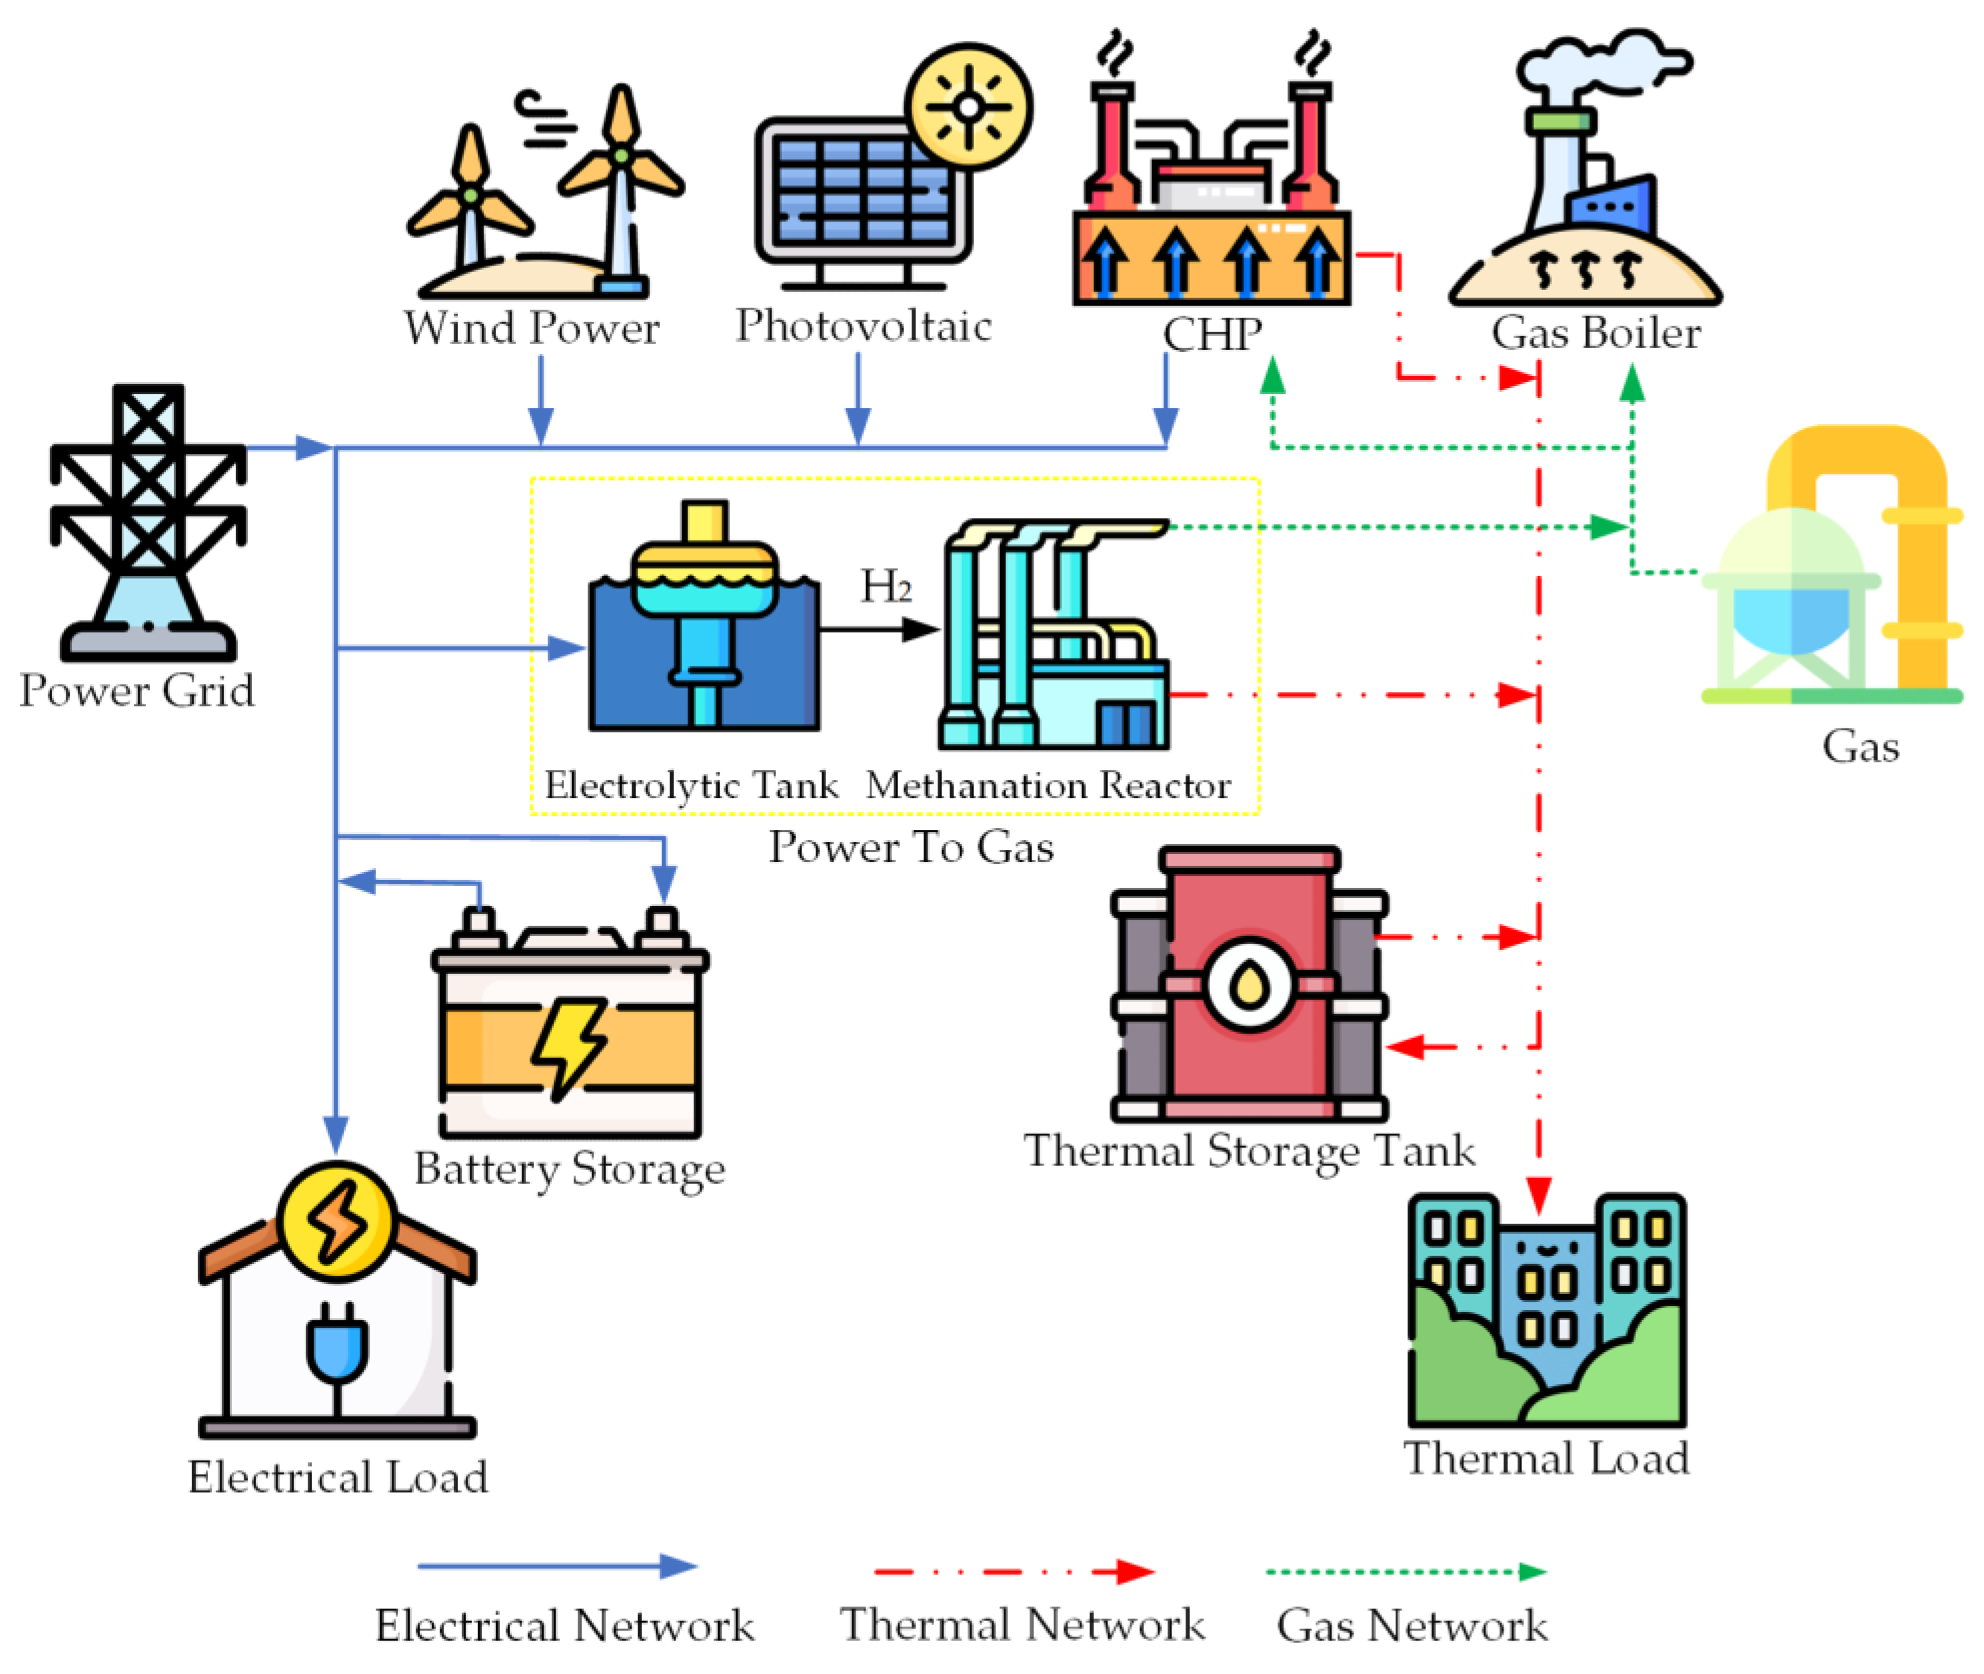
2.2. Structure of the Integrated Energy System

This document explores the architecture of the unified energy framework as illustrated in Figure 2, incorporating the amalgamation of three distinct energy modalities: electrical, gas, and thermal energies. The provision side of this spectrum encompasses external electrical grids, gas infrastructures, photovoltaic entities, and wind energy generators. Mechanisms for inter-conversion among these energy forms include combined heat and power (CHP) systems, power-to-gas (P2G) converters, and gas boilers (GBs). Energy reservation implements consist of battery storage and a thermal reservoir tank.

2.2.1. CHP Systems

CHP Systems produce electricity through the combustion of natural gas, simultaneously harnessing the residual thermal output from the electrification process to satisfy thermal demands. These systems, equipped with variable electric-to-thermal output ratios, are capable of modulating their electric and thermal productions in alignment with real-time demands for electricity and warmth, thereby optimizing operational advantages. Their functional paradigm is encapsulated in the equations below:
P C H P e ( t ) = μ e H L P C H P ( t )
Q C H P h ( t ) = μ h H L P C H P ( t )
P C H P min P C H P ( t ) P C H P max
Δ P C H P min P C H P ( t ) P C H P ( t 1 ) Δ P C H P max
k C H P min Q C H P h ( t ) / P C H P e ( t ) k C H P max
where P C H P e ( t ) and Q C H P h ( t ) denote the electrical and thermal outputs of the CHP system at time t, respectively; μ e and μ h represent the efficiencies of the CHP system in converting gas into electrical and thermal forms, respectively; H L is the calorific potency of natural gas; P C H P ( t ) signifies the natural gas intake of the CHP at time t; P C H P min and P C H P max outline the minimal and maximal constraints on natural gas intake power and delineate the acceleration and deceleration capacities of the CHP; k C H P min and k C H P max define the minimal and maximal ratios of electricity-to-heat conversion for the CHP.

2.2.2. P2G System Model

The P2G mechanism operates through two phases: hydrogen generation and methanation, as shown in Figure 3. Initially, an electrolyzer generates hydrogen by water electrolysis; subsequently, this hydrogen is introduced into a methanation reactor where it combines with CO2 to produce CH4, subsequently distributed to gas turbines and the gas network.
The operational models are delineated as follows:
1.
Electrolyzer (EL)
E H 2 ( t ) = μ E L P P 2 G ( t )
P P 2 G min P P 2 G ( t ) P P 2 G max
Δ P P 2 G min P P 2 G ( t ) P P 2 G ( t 1 ) Δ P P 2 G max
where E H 2 ( t ) and P P 2 G ( t ) signify the hydrogen energy output and electrical energy input of the EL at time t, respectively; μ E L represents the conversion efficiency of the EL from electrical to hydrogen energy; P P 2 G min and P P 2 G max mark the lower and upper limits on electrical input power; Δ P P 2 G max and Δ P P 2 G min are the ramp-up and ramp-down thresholds of the EL.
2.
Methanation Reactor (MR)
P M R ( t ) = μ M R E H 2 M R ( t ) H L
C M R ( t ) = τ P M R ( t )
E H 2 M R ( t ) E H 2 ( t )
Δ E H 2 M R , min E H 2 M R ( t ) E H 2 M R ( t 1 ) Δ E H 2 M R , max
where P M R ( t ) and E H 2 M R ( t ) indicate the gas energy output and hydrogen energy input of the MR at time t, respectively; μ M R is the efficiency of the MR in transforming hydrogen energy into gas energy; C M R ( t ) denotes the requisite CO2 amount at time t by the MR; τ is the CO2 conversion rate; Δ E H 2 M R , max and Δ E H 2 M R , min are the ramp-up and ramp-down capacities of the MR. Equation (13) affirms that all hydrogen utilized by the MR is sourced from the hydrogen generated by the EL.
The methanation reaction in the P2G process is a vigorous exothermic reaction, releasing 165.01 kJ of heat per mole of methane produced [11]. The intense heat generated can reduce reaction efficiency or cause catalyst sintering, making temperature control a critical aspect of the methanation process. Consequently, timely heat transfer is essential to facilitate its use in heating applications within the P2G system.
4 H 2 + C O 2 Δ H C H 4 + H 2 O Δ H = 165.01   kJ / mol
The resultant heat can be recaptured and leveraged, diminishing gas consumption, concurrently abating the system’s carbon footprint, and facilitating the integration of wind and solar energy. The thermal output from the reaction is specified as follows:
Q M R ( t ) = 44.64 P M R ( t ) ρ M R Δ H
where Q M R ( t ) is the thermal yield from the methanation reaction, and ρ M R is the efficiency of heat recuperation.

2.2.3. Gas Boiler (GB)

Primarily, the gas boiler serves to fulfill thermal energy requirements for consumers by igniting natural gas, with its operational paradigm encapsulated in the equation below:
Q G B ( t ) = μ G B H L P G B ( t )
where Q G B ( t ) represents the thermal output provided by the gas boiler at time t, μ G B signifies the efficiency of the gas boiler, and P G B ( t ) denotes the quantity of gas combusted by the boiler at time t.

2.2.4. Energy Storage Devices

(1)
The battery storage model in this paper is as follows:
E S ( t ) = E S ( t 1 ) ( 1 μ E S ) + λ E S , c h a P E S , c h a ( t 1 ) P E S , d i s ( t 1 ) λ E S , d i s
where E S ( t ) corresponds to the stored electrical at time t, respectively; μ E S is the self-discharge rates of the electrical accumulator, respectively; λ E S , c h a and λ E S , d i s represent the charging and discharging efficacies of the battery; P E S , c h a ( t ) and P E S , d i s ( t ) denote the charging and discharging powers of the battery at time t.
(2)
The thermal reservoir tank model in this paper is as follows:
H S ( t ) = H S ( t 1 ) ( 1 μ H S ) + λ H S , c h a Q H S , c h a ( t 1 ) Q H S , d i s ( t 1 ) λ H S , d i s
where H S ( t ) corresponds to the stored electrical and thermal energies at time t, respectively; μ H S represents the self-discharge rates of the electrical accumulator and thermal reservoir, respectively; λ H S , c h a and λ H S , d i s are the storage and release efficiencies of the thermal reservoir; Q H S , c h a ( t ) and Q H S , d i s ( t ) signify the storage and release powers of the thermal tank at time t.

3. Carbon Trading Model

3.1. Provision Side Carbon Emission Schema

For the provision sector’s engagement in carbon commerce, elucidating the schema’s inaugural carbon allowance and the factual carbon discharges is imperative, structured as follows:
1.
Initial Carbon Quota Model
E I E S = α I E S e t = 1 T P b u y ( t ) + α I E S h t = 1 T ( P C H P ( t ) + P G B ( t ) )
where E I E S symbolizes the schema’s initial carbon allowance, α I E S e denotes the carbon allowance coefficient for procured electricity, and α I E S h signifies the carbon allowance per unit of active energy for natural gas.
2.
Factual Carbon Emission Schema
Within the P2G sequence, the methanation stage assimilates a portion of CO2, thereby rendering this segment of carbon emissions effectively negative.
C I E S = β I E S e t = 1 T P b u y ( t ) + β I E S h t = 1 T ( P C H P ( t ) + P G B ( t ) ) t = 1 T C M R ( t )
where C I E S represents the schema’s initial carbon allowance, β I E S e is the carbon emission coefficient for procured electricity, and β I E S h outlines the carbon emission coefficient for natural gas.

3.2. Consumer Side Carbon Emission Framework

While direct carbon emissions emanate from the generation facet, in essence, they are an indirect consequence of the consumer segment’s energy requisition. Appraising the carbon emissions attributable to consumers is instrumental in diminishing the overall carbon discharges of the system and the energy expenditures of the consumers themselves. To compute the consumer-side carbon emissions, defining the consumer’s carbon allowance is essential. In this discourse, the consumer’s carbon allowance primarily derives from the procurement of heat and electricity.
E u = α u e t = 1 T P e ( t ) + α u h t = 1 T Q h ( t )
where E u encapsulates the total carbon allowance on the consumer side; α u e and α u h are the carbon allowance conversion coefficients for procured electricity and heat, correspondingly; and P e ( t ) and Q h ( t ) pertain to the procured electric and thermal energy on the consumer side.
The empirical carbon emission framework on the consumer side is delineated as follows:
C u = β u e t = 1 T P e ( t ) + β u h t = 1 T Q h ( t )
where C u signifies the actual carbon emissions on the consumer side, and β u e and β u h represent the carbon emission coefficients for procured electricity and heat at time t, respectively (ascertained through temporally differentiated carbon accounting).

3.3. Tiered Carbon Trading Model

To catalyze the low-carbon evolution of the energy ecosystem, the current phase of carbon commerce segregates distinct procurement volumes into brackets. For parks distinguished by superior low-carbon standards, wherein the system’s actual carbon discharges fall below the system’s carbon allowance, a specified economic incentive is bestowed. The stratified carbon commerce model premised on this notion is outlined as follows:
F C = θ ( C E ) , C < E ω 1 ( C E ) , E < C < E + d ω 1 d + ω 2 ( C E ) , E + d < C < E + 2 d
where θ denotes the compensation coefficient, C indicates the actual carbon emissions on the consumer side, ω s signifies the carbon pricing for each tier, and d represents the carbon trading interval length.

4. Low-Carbon Demand Response Scheme

Within the electrical system, demand response emerges as a crucial mechanism for resource assimilation and modulation, facilitating the amalgamation of user-side resources, modulating the load profile, and flexibly managing supply-side output. In the realms of users’ production and everyday life, energy consumption behavior is swayed by both fiscal and carbon emission considerations. Employing demand response to curtail energy expenditures and fulfill energy requisites stands as a strategic approach to these ends. This discourse segregates the load into two categories: those responsive to price variations and those driven by incentives under time-differentiated carbon accounting.

4.1. Price-responsive Demand Load

Price-sensitive demand predominantly pertains to household electricity consumption. It propels users to alter their conventional electricity usage patterns for economic benefits through fluctuating electricity rates, establishing a definitive orientation for energy consumption. Typically, the elasticity matrix E is utilized to depict the impact of changes in electricity rates on the load variations.
λ Δ d , 1 λ Δ d , 2 λ Δ d , t = E λ Δ b , 1 λ Δ b , 2 λ Δ b , t
P t = P t + λ Δ d , t P t
where E denotes the elasticity matrix for price-sensitive demand, wherein the principal diagonal houses the self-elasticity coefficient, and the off-diagonal elements contain the cross-elasticity coefficients; λ Δ d , t and λ Δ b , t represent the variation rate of load and electricity price at time t, respectively; P t and P t indicate the load quantities prior to and subsequent to the engagement in price-responsive demand at time t.

4.2. Time-Differentiated Carbon Accounting Incentive-Driven Demand Response Load

This segment of load alteration is chiefly governed by carbon emission coefficients. The aim behind engaging users in a demand response driven by time-differentiated carbon accounting incentives is to diminish the collective carbon emissions of the system. Analyses of time-differentiated carbon accounting reveal that varying compositions of unit output at different intervals result in dissimilar carbon emissions for identical load levels. User participation in demand response alters energy consumption patterns, prompting adjustments in generation units and, consequently, in the system’s carbon emissions. Appropriately steering user-side energy demand reduction or energy substitution during periods of elevated carbon emission coefficients contributes to lowering the total carbon emissions and, hence, reduces the operational costs of the system.
Δ P + ( t ) = ε Φ P ( t )
Δ P ( t ) = ε Φ P ( t )
Φ 1 , 0 , 1
γ t > γ t o p , Φ = 1 γ t < γ l o w , Φ = 1 γ l o w < γ t < γ t o p , Φ = 0
where Δ P + and Δ P denote the augmentation and diminution of load at time t, respectively; ε signifies the coefficient of demand response participation; γ t o p and γ l o w delineate the upper and lower bounds for load involvement in demand response; and P ( t ) represents the cumulative load at time t.

5. Consider a Low-Carbon Dispatch Model for Integrated Energy Systems, Incorporating Time-of-Use Carbon Metering on the User Side

5.1. Objective Function

The principal aim of the IES framework, with a focus on temporally differentiated carbon accounting at the consumer level, is to minimize the aggregate operational expenditure throughout the dispatch interval of the system. The operational expenses for the integrated energy system encompass the initiation and upkeep costs of assorted unit apparatus, expenses incurred from carbon trading, costs for acquiring energy, and the financial implications associated with the curtailment of wind and solar energy production.
min F I E S = F m c + F c + F b + F q
F m c = t = 1 T j = 1 M υ j P j ( t ) F b = t = 1 T ( e t P e b u y ( t ) + g P g b u y ( t ) ) F q = t = 1 T υ p v ( P V ( t ) P V ( t ) ) + t = 1 T υ p w ( P W ( t ) P W ( t ) )

5.2. Constraints

1.
Equilibrium of Energy Supplies
Electric power equilibrium:
P e ( t ) + P P 2 G ( t ) + P E S , c h a ( t ) = P W ( t ) + P V ( t ) + P e b u y ( t ) + P E S , d i s ( t ) + P C H P e ( t )
where P e b u y ( t ) denotes the quantum of electricity procured from the primary grid by the system at time t.
Thermal power equilibrium:
Q h ( t ) + Q H S , c h a ( t ) = Q C H P h ( t ) + Q M R ( t ) + Q G B ( t ) + Q H S , d i s ( t )
Gas power equilibrium:
P g b u y ( t ) + P M R ( t ) = P C H P ( t ) + P G B ( t )
2.
Regulations for Energy Storage
E S min E S ( t ) E S max σ c h a P E S , c h a min P E S , c h a ( t ) σ c h a P E S , c h a max σ d i s P E S , d i s min P E S , d i s ( t ) σ d i s P E S , d i s max σ c h a + σ d i s = 1
H S min H S ( t ) H S max σ c h a Q H S , c h a min Q H S , c h a ( t ) σ c h a Q H S , c h a max σ d i s Q H S , d i s min Q H S , d i s ( t ) σ d i s Q H S , d i s max σ c h a + σ d i s = 1
where Equation (36) represents the battery storage constraints, Equation (37) represents the constraints for the thermal reservoir tank; E S max , E S min and H S max , H S min signify the maximum and minimum capacity thresholds of the energy storage mechanism; σ c h a and σ d i s are binary variables that ensure the energy storage unit does not engage in charging and discharging simultaneously.
3.
Interactive Power Limitation with the Main Network
P e b u y min P e b u y ( t ) P e b u y max P g b u y min P g b u y ( t ) P g b u y max
where P e b u y max , P e b u y min and P g b u y max , P g b u y min indicate the maximum and minimum transaction limits for procuring electricity and natural gas from the primary grid, respectively.
4.
Photovoltaic and Wind Turbine Unit Constraints
P V ( t ) P V ( t ) P W ( t ) P W ( t )
Inclusions of constraints for CHP mechanisms and P2G systems are as delineated in Equations (5)–(7), (9), (10), (13) and (14).

5.3. Model Execution

This paper establishes a mathematical model of the equipment mentioned in the above content by using the predicted values of wind and solar power output and electric and thermal loads of the integrated energy system for calculation, selecting the parameter values suitable for this model, setting the constraints, and establishing the objective function. The framework proposed herein constitutes a linear optimization problem with a singular objective. Leveraging the MATLAB R2018a platform, the optimization dispatch model is constructed using the YALMIP toolbox; subsequently, it is resolved via the CPLEX 12.10 commercial optimization software.

6. Exposition of Case Study Findings

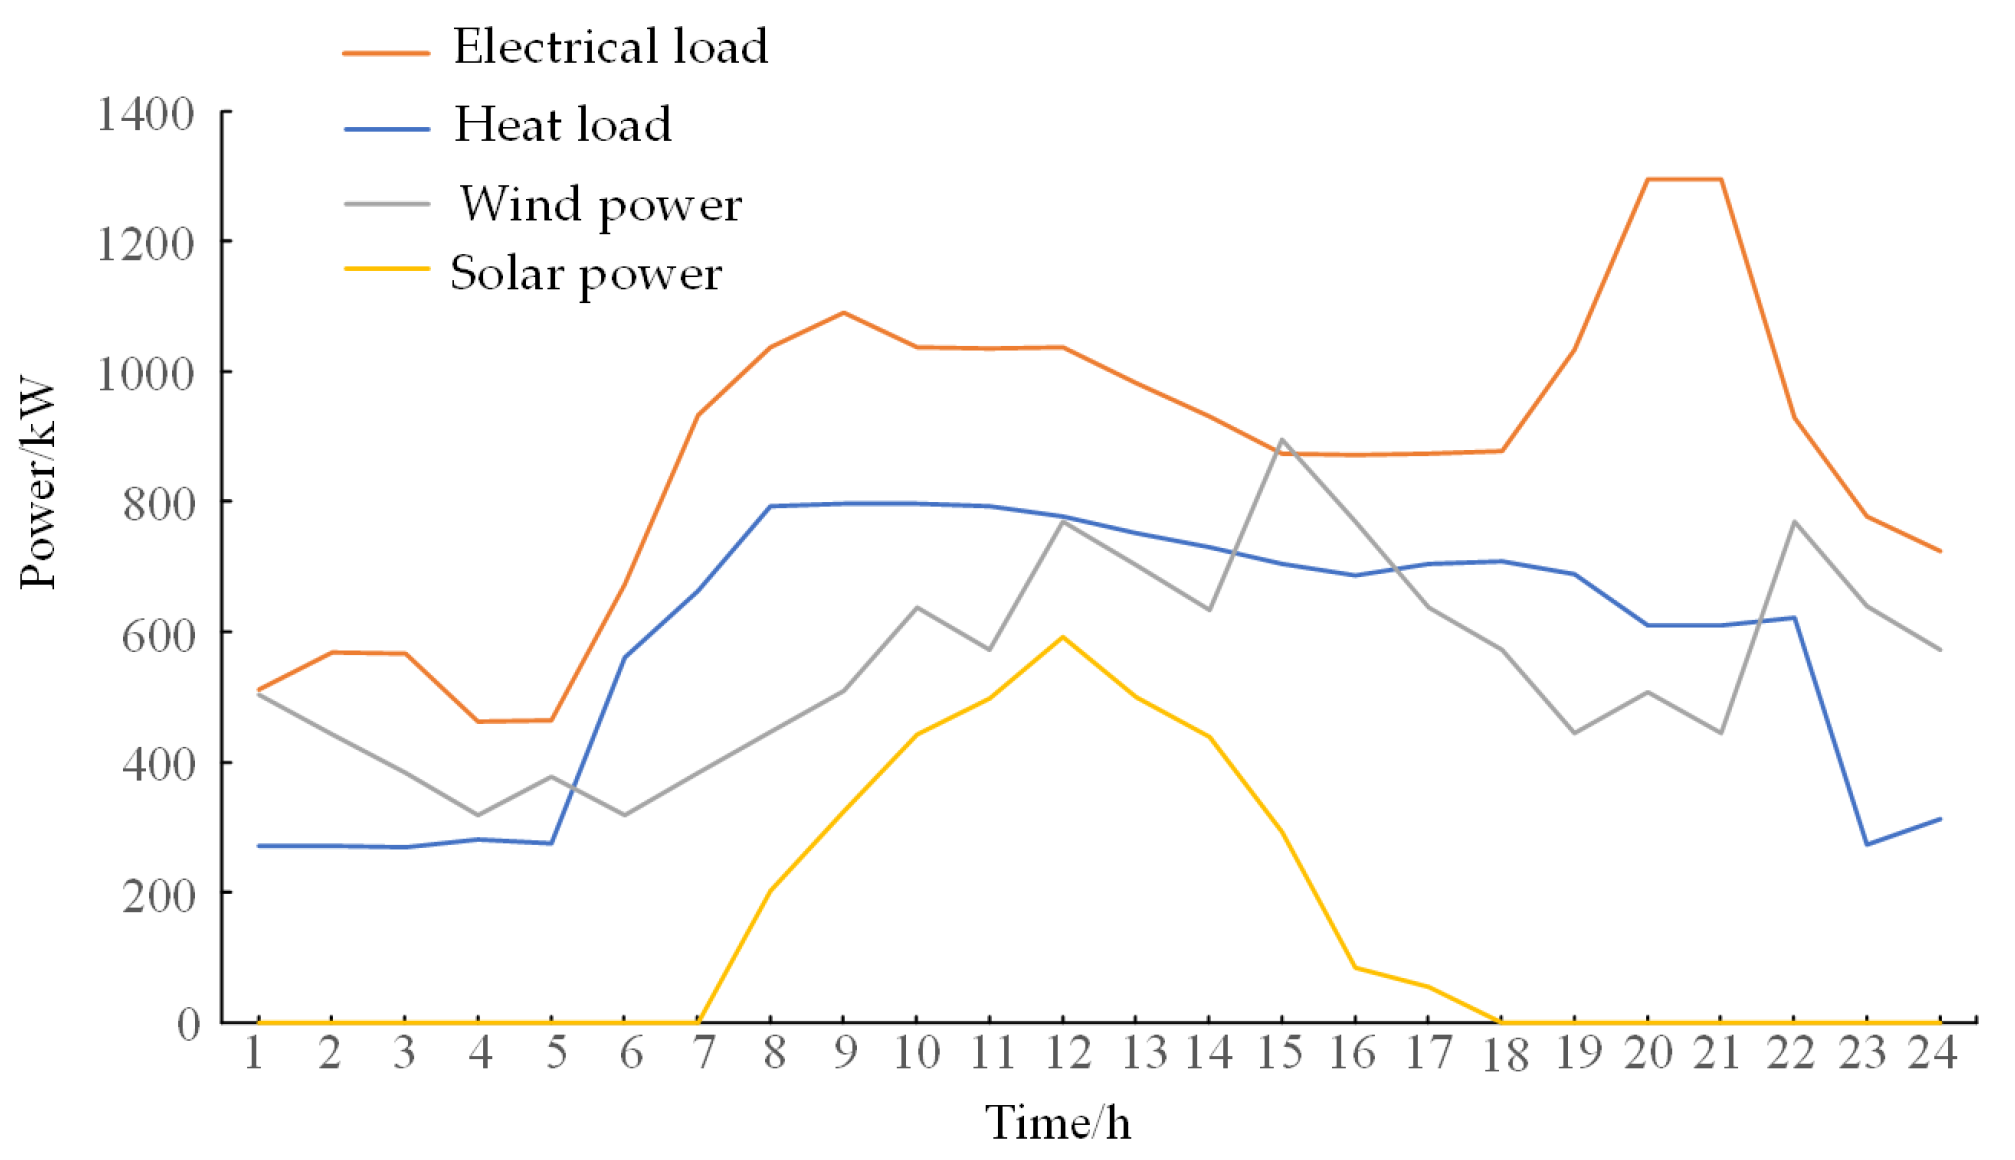
6.1. Elucidation of Study Parameters

The subject of this study is a small-scale integrated energy system park located in Jiangsu, electing a diurnal cycle for directive activities with the increment of a singular hour as the elementary unit of chronological distribution. Anticipated quotidian requisitions for electrical and thermal energies, coupled with foretold generative trajectories for aeolian and solar faculties, are illustrated in Figure 4. The time-of-day tariffs used in the system are shown in Table 2. Concomitant equipment specifications are enumerated in Table 3. In regard to stratified carbon commerce, the foundational cost is set at 0.25 RMB for each kilogram, with a sectional mass of 500 kg and an ascension rate of 0.25, whilst penalties imposed for the underutilization of wind and heliacal outputs stand at 0.3 RMB per kilowatt-hour.
The subsequent narrative stages are contrived to evaluate the effectiveness of the posited optimization schema.
Scenario 1 abstains from considering the thermal dispensation in methanation within the precursory day’s optimization scheduling.
Scenario 2 accommodates the robust thermal emanation during power-to-gas methanation in the identical scheduling framework.
Scenario 3 augments the comprehensive energy system optimization scheduling by factoring in the consumer-side effects of temporally differentiated carbon accounting, taking Scenario 2 as its basis.

6.2. Results Analysis

6.2.1. Comparative Examination of Scenarios

The analytical perusal of Table 4 reveals that in Scenario 2, recuperating the thermal efflux resultant from methanation precipitates a diminution in thermal and consequently electrical outputs from the CHP and GB units. This engenders an expanded window for the absorption of aeolian and heliacal powers, effectuating an 87.7% reduction in the fiscal burden of their underutilization compared to Scenario 1. The amplification of pristine energy generation beneficially influences the reduction of operating expenditures and carbonic expulsions, with the procurement costs of energy diminishing by 3% and carbon emissions by 6.7%.
Scenario 3, informed by temporally differentiated carbon ledgering on the end-user’s side, prompts a behavioral shift in energy consumption. This transition results in a 10.4% decrement in carbon emissions relative to Scenario 2. The tiered carbon market’s remunerative framework bestows certain recompenses during the trade, abating the aggregate operational costs by 6.3%. Under the sway of temporally differentiated carbon accounting, end-users elect to mitigate energy requisitions during periods of high carbon emission factors while capitalizing on periods of heightened clean energy generation to curtail their carbonic footprint. This, in turn, influences the outputs from system-side units and diminishes the system’s overall carbon emissions.
When juxtaposed with Scenario 1, both the energy procurement expenses and carbon emissions in Scenario 3 experienced declines of 9.2% and 16.5%, respectively. The integration of P2G heating has appreciably curtailed the system’s energy acquisition costs; concurrently, the incentivization from end-user temporal carbon accounting fosters the system’s receptivity to aeolian and solar energies, substantially reducing carbon emissions. This is further augmented by the carbon market’s compensatory mechanism, which trims total operational expenditures.
The data and accompanying analysis underscore the impactful contribution of end-user demand response under temporally differentiated carbon accounting and the exploitation of heat recovery in methanation processes within IES, markedly enhancing economic efficiency, low-carbon traits, and the assimilation capacity for wind and solar energy.

6.2.2. Dispatching Outcome Analysis for the Paper’s Scenarios

The Integrated Energy System model formulated herein, incorporating end-user temporal carbon accounting and heat utilization from methanation reactions, has been refined through optimization. The dispatching outcomes are visualized in Figure 5 and Figure 6, and the carbon emission factors for electricity and heat purchases by users at each moment in time are shown in Figure 7.
In Figure 5, the nocturnal span from 00:00 to 07:00 sees the electrical demand met primarily by wind turbines, CHP units, and grid acquisitions, with the system harnessing batteries to store any surplus. The daytime window from 08:00 to 17:00, characterized by bountiful wind and solar endowments, relies mainly on the outputs of wind turbines, photovoltaic units, and CHP units, which satisfy the concurrent thermal needs of consumers. Post fulfillment of electrical requirements, the power-to-gas apparatus initiates operation, and the synthesized methane curbs the system’s energy purchase costs. During evening hours from 18:00 to 21:00, as photovoltaic units lapse in electricity provision, CHP units ramp up their output in tandem with wind turbines and batteries to fulfill user demand. The late hours from 22:00 to 24:00 witnessed an uptick in wind turbine output, with any excess channeled towards power-to-gas operations.
Figure 6 illustrates that from 00:00 to 07:00, the thermal demand of users is predominantly supplied by CHP and GB units. Given that wind energy alone cannot satisfy the electrical demand during these hours, the thermal output of CHP units overshadows that of GB units. The interval from 00:00 to 05:00 observes lower thermal requisitions, allowing for heat storage; conversely, from 08:00 to 17:00, a significant surge in thermal demand on the user side prompts a collaborative response from CHP units, GB, and heat storage to provide heating. With an ample supply of wind and solar power, the CHP’s electrical output wanes, and its thermal output correspondingly subsides. To accommodate the heightened thermal demand, GB unit output surges, complemented by heat from methanation. From 18:00 to 22:00, the absence of photovoltaic contribution necessitates increased CHP output, with GB and heat storage fulfilling the residual heating requirements. Lastly, from 22:00 to 24:00, as the energy demand dwindles, the reduced output of CHP units and the heat from GB, heat storage, and methanation reactions adequately meet the thermal requirements of users.

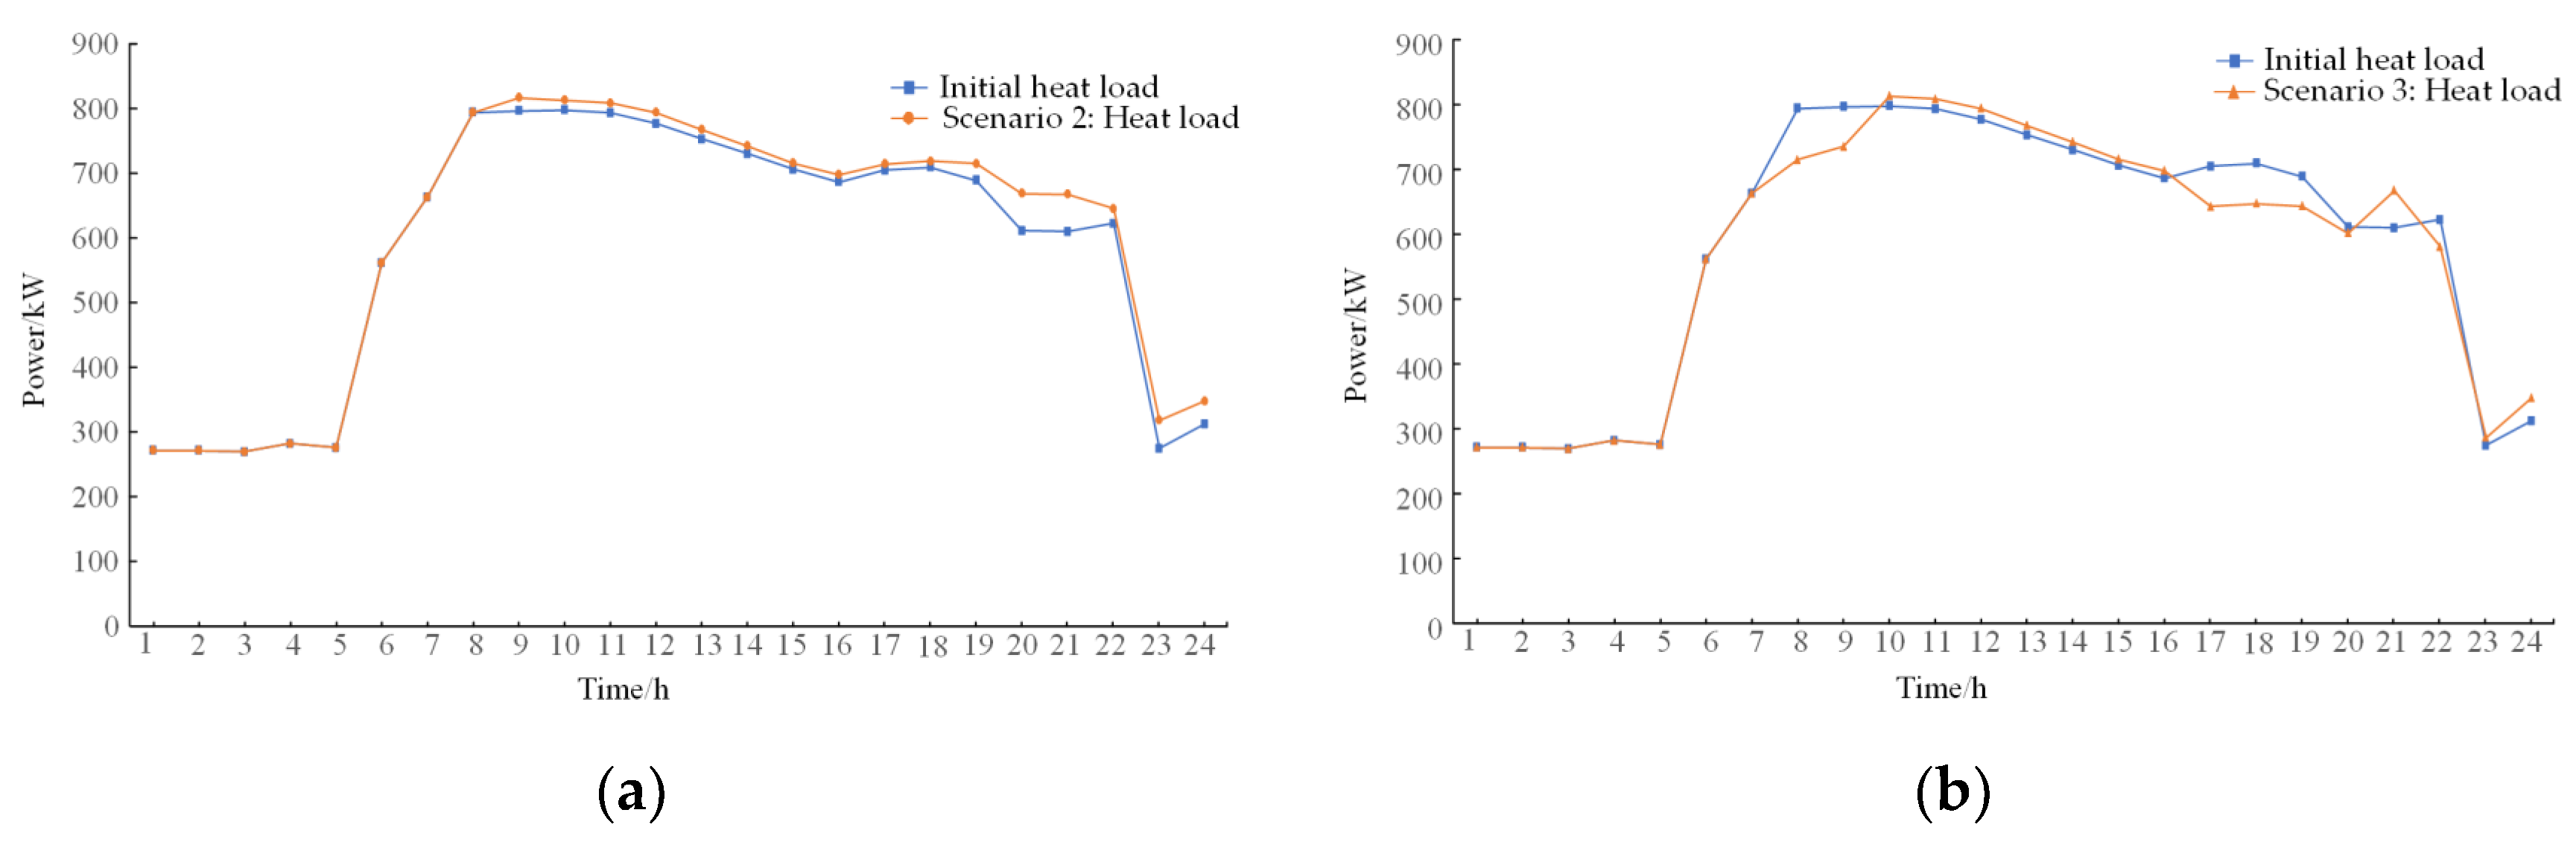
6.2.3. Assessing the Effect of Time-Variant Carbon Accounting on End-Users

The analysis juxtaposes Scenarios 2 and 3 to discern the ramifications of consumer responsiveness to temporal carbon accounting incentives. Electrical consumption for Scenario 2 is depicted in Figure 8a, whereas Scenario 3’s is portrayed in Figure 8b.
In Scenario 2, where demand response is merely price-elastic, we observe an uptick in electric consumption during the nocturnal nadir pricing interval from 00:00 to 08:00. Conversely, during the zenith price spans of 09:00–12:00 and 18:00–21:00, there is a conspicuous contraction of electrical demand, with a propensity to substitute with more economical thermal alternatives where feasible. The intermediate price periods of 13:00 to 17:00 and 22:00 to 24:00 see an unaltered electric consumption pattern.
Scenario 3 not only contemplates price-elastic demand but also the influence of carbon emission-centric user behavior. Delving into the emission factors linked to electric purchases and their corresponding price segments, we identify a pattern: From 00:00 to 05:00, both the cost and emissions are at their ebb, prompting an escalation in user consumption. From 06:00 to 08:00, despite the persisting nadir pricing, an elevation in emission factors leads to a palpable dip in the electric load surge, in stark contrast to Scenario 2. Peak price periods of 19:00 to 21:00, coupled with elevated emission rates, trigger a downturn in energy demand, with some consumption shifting to thermal energy. From 09:00 to 18:00 and 22:00 to 24:00, users’ responses are principally driven by electricity pricing, given the lower emission factors during these intervals.
As for thermal consumption illustrated in Figure 9, Scenario 2 experiences shifts primarily from electrical to thermal energy during peak price times. In Scenario 3, time-specific carbon accounting induces users to scale back thermal consumption during times of high emission factors to eschew excessive emissions, as seen from 07:00 to 09:00 and 17:00 to 20:00. Conversely, during intervals of lower emission factors for purchased heat, thermal demand only compensates for the diminished electrical loads, such as from 10:00 to 16:00, at 21:00, and at 24:00.

6.2.4. The Impact of Utilizing Heat Recovery from Methanation Reactions

As depicted in Figure 10, the discarded power and carbon emissions for the three scenarios presented in this study are shown. The consumption of wind–solar energy largely depends on the customer’s electric load, storage batteries, and the P2G device. Within the P2G device, the electrolyzer operates during periods when wind–solar energy is abundant. In Scenario 2, recycling exothermic heat from the methanation reaction reduces the heat output of the CHP unit, consequently lowering its electric power output and providing additional capacity for wind–solar energy consumption. The discarded power in Scenario 2 decreases by 447.9 kW compared to Scenario 1. Additionally, the methanation reaction enhances the production of natural gas and heat, reduces the purchased energy of the system, and optimizes energy usage, leading to significant reductions in the system’s carbon emissions and operating costs. Thus, utilizing the reaction heat in the methanation process substantially improves the system’s capacity for wind–solar energy consumption and carbon emission reduction. In Scenario 3, the use of methanation recovery heat, combined with user-side carbon metering, further lowers carbon emissions and operational costs.

7. Conclusions

This treatise formulates an integrated energy system’s low-carbon optimization dispatch model, mindful of consumer-side temporal carbon accounting and inclusive of heat emanation from P2G methanation. The comparative scrutiny of three discrete scenarios yields these insights:
(1)
Temporal carbon accounting empowers consumer demand responsiveness based on variant carbon emission factors for electric and thermal purchases, constraining consumption within periods of lesser carbon footprints. This strategy culminates in a 16.5% dip in system carbon emissions and a subsequent 9% cutback in operational costs.
(2)
By introducing carbon emission metrics for consumer heat acquisitions, consumers weigh the carbon output from concurrent electricity and heat purchases, opting for the energy form that minimizes emissions. This interplay between electric and thermal demands further refines consumer energy utilization patterns.
(3)
Harnessing methanation reaction heat lowers CHP thermal outputs, thereby diminishing their electrical production, which, in turn, amplifies the system’s capability to integrate wind and solar energies, precipitating an 87.7% reduction in the cost associated with energy waste.
In conclusion, the paper’s proposed consumer-side carbon accounting-aware low-carbon optimization dispatch significantly enhances the integrated energy system’s carbon efficiency and economic viability.

Author Contributions

Conceptualization, Y.Y. and J.Z.; methodology, J.Z. and T.C.; validation, T.C. and H.Y.; formal analysis, Y.Y. and J.Z.; investigation, H.Y.; resources, T.C. and H.Y.; writing—original draft preparation, J.Z. and T.C.; writing—review and editing, J.Z.; visualization, T.C.; supervision, Y.Y.; project administration, J.Z. All authors have read and agreed to the published version of the manuscript.

Funding

This research was funded by the Science and Technology Planning Project of Xinjiang Uygur Autonomous Region (2022A01007-3).

Data Availability Statement

Data and material can be provided on request.

Conflicts of Interest

The authors declare no conflicts of interest.

References

  1. Dou, X.; Zhao, W.H.; Lang, Y.Z.H.; Li, Y.; Gao, C.V. Overview of Operation Research of Natural Gas–Electricity Coupled Systems Considering Power-to-Gas Technology. Power Syst. Technol. 2019, 43, 165–173. [Google Scholar]
  2. Liu, G.Y.; Wang, J.Y.; Tang, Y.C.; Wang, D. Evolution of Research Directions and Application Needs for Carbon Emission Factors in Power Grids. Power Syst. Technol. 2024, 48, 12–28. [Google Scholar]
  3. Zaman, U.A.; Mahbub, A.O.A. Modeling Electricity Bill with the Reflection of CO2 Emissions and Methods of Implementing AMI for Smart Grid in Bangladesh. Int. J. Intell. Syst. Appl. 2022, 14, 14–21. [Google Scholar]
  4. Zou, Y.H.; Zeng, A.D.; Hao, S.P.; Ning, J.; Ni, L.Y. Multi-time scale optimization dispatch of integrated energy systems under a ladder-type carbon trading mechanism. Power Syst. Technol. 2023, 47, 2185–2198. [Google Scholar]
  5. Zhou, T.; Xue, Y.F.; Ji, J.; Han, Y.; Bao, W.H.; Li, F.Q.; Du, E.S.; Zhang, N. Two-stage robust optimization method for electric-cold-heat integrated energy systems considering the uncertainty of indirect carbon emissions from electricity. Power Syst. Technol. 2024, 48, 50–63. [Google Scholar]
  6. Zhang, J. Research on Simulation and Optimization of Carbon Emission System in Industrial Parks. Ph.D. Thesis, North China Electric Power University, Beijing, China, 2020. [Google Scholar]
  7. Zhang, N.; Li, Y.W.; Huang, J.H.; Li, Y.H.; Du, E.S.; Li, M.X.; Liu, Y.L.; Kang, C.Q. Full-chain carbon metering methods and carbon accounting system in power systems. Autom. Electr. Power Syst. 2023, 47, 2–12. [Google Scholar]
  8. Chen, G.; Shan, Y.; Hu, Y.; Tong, K.; Wiedmann, T.; Ramaswami, A.; Guan, D.; Shi, L.; Wang, Y. Environmental Science & Technology. Environ. Sci. Technol. 2019, 53, 5545–5558. [Google Scholar]
  9. Wang, C.Y.; Lu, D.; Li, H.L.; Chen, H.; Zhao, S. Methods and Analysis of Carbon Metering Network Tracing for Electricity Carbon Emissions. Power Syst. Technol. 2024, 1–10. [Google Scholar] [CrossRef]
  10. Shang, N.; Chen, Z.; Leng, Y. Mechanisms and Key Technologies for Mutual Recognition of Typical Environmental Rights Products under Electric Carbon Market Context. Proc. CSEE 2024, 1–19. [Google Scholar] [CrossRef]
  11. Wang, J.T.; Wang, Y.Y.; Zhou, M.; Wu, Z.Y.; Yu, T.; Si, Z.Y. Indirect Carbon Emission Accounting Methods for Users Considering Green Electricity Trading. Power Syst. Technol. 2024, 48, 29–39. [Google Scholar]
  12. Huang, M.H.; Tang, K.J.; Dong, S.F.; Nan, B.; Song, Y.H. Optimal Power Flow Based on Carbon Flow Theory Considering Carbon Emission Quotas on the Demand Side. Power Syst. Technol. 2023, 47, 2703–2713. [Google Scholar]
  13. Zhou, Q.; Feng, D.H.; Xu, C.B.; Feng, C.; Sun, S.; Ding, T. A Comparative Study on Direct Allocation Methods of Carbon Emission Responsibility on the Demand Side. Autom. Electr. Power Syst. 2015, 39, 153–159. [Google Scholar]
  14. Cui, Y.; Deng, G.B.; Zhao, Y.T.; Zhong, Z.W.; Tang, Y.H.; Liu, X.Y. Economic Dispatch of Wind Power Systems Considering Complementary Low-Carbon Characteristics of Sources and Loads. Proc. CSEE 2021, 41, 4799–4815. [Google Scholar]
  15. Yu, H.; Sun, W.; Zhao, Y.; Ban, M. Carbon Emission Area Division of Power System Considering Carbon. Energy Rep. 2023, 9, 618–627. [Google Scholar] [CrossRef]
  16. Yang, C.; He, B.; Liao, H.; Ruan, J.; Zhao, J. Price-Based Low-Carbon Demand Response Considering the Conduction of Carbon Emission Costs in Smart Grids. Front. Energy Res. 2022, 10, 959786. [Google Scholar] [CrossRef]
  17. Ye, Y.J.; Xing, H.J.; Mi, Y.; Yan, Z.; Dong, J. Low-Carbon Optimal Dispatch of Integrated Energy Systems Considering Low-Carbon Demand Response and Master-Slave Game Theory. Power Syst. Autom. 2024, 1–17. Available online: http://kns.cnki.net/kcms/detail/32.1180.TP.20230824.1932.008.html (accessed on 15 April 2024).
  18. Huang, W.X.; Liu, D.B.; Li, S.C.; Li, W.F.; Bao, Z.Y.; Yang, Y. Bi-level Optimization of an Integrated Energy System with P2G and Demand Response Under Dual Carbon Targets. Electr. Meas. Instrum. 2022, 59, 8–17. [Google Scholar]
  19. Li, Y.W.; Zhang, N.; Du, E.S.; Liu, Y.L.; Cai, X.; He, D.W. Research and Benefit Analysis on Low-Carbon Demand Response Mechanism of Power Systems Based on Carbon Emission Flow. Proc. CSEE 2022, 42, 2830–2842. [Google Scholar]
  20. Zhang, Z.; Wang, C.; Lv, H.; Liu, F.; Sheng, H.; Yang, M. Day-Ahead Optimal Dispatch for Integrated Energy System Considering Power-to-Gas and Dynamic Pipeline Networks. IEEE Trans. Ind. Appl. 2021, 57, 3317–3328. [Google Scholar] [CrossRef]
  21. Duan, J.D.; Yang, Y.; Liu, F. Distributed Optimization of Integrated Electricity-Natural Gas Distribution Networks Considering Wind Power Uncertainties. Int. J. Electr. Power Energy Syst. 2022, 135, 107460. [Google Scholar] [CrossRef]
  22. Du, Y.F. Study on Multi-Energy Complementary and Energy Routing Optimization Strategy for Regional Energy Internet. Ph.D. Thesis, Huazhong University of Science and Technology, Wuhan, China, 2022. [Google Scholar]
  23. Atri, S.; Tyagi, S. Energy Based Route Prioritization for Optimum Multi-path Selection. Int. J. Comput. Netw. Inf. Secur. 2023, 15, 89–102. [Google Scholar] [CrossRef]
  24. Safari, F.; Dincer, I. Assessment and Optimization of an Integrated Wind Power System for Hydrogen and Methane Production. Energy Convers. Manag. 2018, 177, 693–703. [Google Scholar] [CrossRef]
  25. Zhang, Y.L.; Ye, M.; Xiao, R.; Ge, L.C. Integration and Optimization of Synthetic Natural Gas Production Process from Waste Incineration Power Generation Coupled with Power-to-Gas Technology. Chem. Eng. Prog. 2022, 41, 1677–1688. [Google Scholar]
  26. Schaaf, T.; Grünig, J.; Schuster, R.M.; Orth, A. Storage of Electrical Energy in a Gas Distribution System-Methanation of CO2-Containing Gases. Energ, Sustain. Soc. 2014, 4, 476–485. [Google Scholar] [CrossRef]
  27. Zhang, K.; Guo, X.X.; Han, S.; Sun, L.P. Capacity Planning of Power-to-Gas Facilities Based on the Application of Electrolysis Heat and Cooperative Game Theory. Power Syst. Technol. 2021, 45, 2801–2811. [Google Scholar]
  28. Cheng, Y.; Liu, M.; Chen, H.; Yang, Z. Optimization of Multi-Carrier Energy System Based on New Operation Mechanism Modelling of Power-to-Gas Integrated with CO2-Based Electrothermal Energy Storage. Energy 2021, 216, 119269. [Google Scholar] [CrossRef]
  29. Ren, S.N.; Wang, J.; Gong, L.W.; Liu, X.; Liu, T.; Hu, Z.B. Low-Carbon Economic Dispatch of Wind Power Incorporating Power-to-Gas Heat Recovery and Thermal Storage Tanks. Electr. Equip. Energy Effic. Manag. Technol. 2020, 11, 103–110. [Google Scholar] [CrossRef]
  30. Wang, L.L.; Gao, H.J.; Liu, C.; Cai, W.H.; Hu, M.Y.; Liu, J.Y. Electric-Carbon Coupled Interactive Sharing of Intelligent Building Clusters Considering Time-Differentiated Carbon Metering. Power Syst. Technol. 2022, 46, 2054–2064. [Google Scholar]
  31. Wang, Z.Y.; Shi, Y.; Tang, Y.M.; Yan, X.Y.; Cao, J.; Wang, H.F. Low-Carbon Economic Operation and Energy Efficiency Analysis of Integrated Energy Systems Considering LCA Energy Chain and Carbon Trading Mechanism. Proc. CSEE 2019, 39, 1614–1626+1858. [Google Scholar]
Figure 1. The flow of carbon emission factor calculation.
Energies 17 02071 g001
Figure 2. Structure of the integrated energy system.
Energies 17 02071 g002
Figure 3. P2G model diagram.
Energies 17 02071 g003
Figure 4. Wind power and photovoltaic unit output and load forecasting.
Energies 17 02071 g004
Figure 5. Electrical output in Scenario 3.
Energies 17 02071 g005
Figure 6. Thermal output in Scenario 3.
Energies 17 02071 g006
Figure 7. Carbon emission factors for purchased electricity and heat.
Energies 17 02071 g007
Figure 8. (a) Electrical loads in Scenario 2 and (b) electrical loads in Scenario 3.
Energies 17 02071 g008
Figure 9. (a) Heat loads in Scenario 2 and (b) heat loads in Scenario 3.
Energies 17 02071 g009
Figure 10. Energy abandonment in Scenarios 1 and 2.
Energies 17 02071 g010
Table 1. Carbon emission factors by energy type.
Type of EnergyProductiveTransportUseCarbon Emission Factor g/kWh
GAS564.7
Wind power-43
Solar power-154.5
Thermal power1303
Energy storage devices-91.33
The symbol “√” signifies the occurrence of carbon emissions at that stage, and the symbol “-” denotes the absence of carbon emissions in that phase. (Greenhouse gas emissions during the operational phase predominantly stem from the energy consumed in material production and replacement during transportation and the energy used in equipment maintenance).
Table 2. Time-of-day tariffs.
Time00:00–8:0012:00–17:00
21:00–24:00
08:00–12:00
17:00–21:00
Electrovalency/RMB0.280.631.05
Table 3. Equipment parameters.
InstallationsCapacity/kWEfficiencyO&M Costs/(RMB/kWh)
CHP6000.35/0.540.15
GB4000.90.15
EL4000.80.2
MR3000.550.2
BT4500.90.1
HES4500.90.1
Table 4. Comparison of scenario cost data.
Various CostsScenario 1Scenario 2Scenario 3
System costs/RMB13,008.212,628.811,828.5
Cost of energy purchased/RMB6009.75834.85453.3
Equipment operating costs/RMB6551.66775.36531.9
System carbon trading costs/RMB2944.6−156.7
Carbon emissions/kg5791.55398.94834.7
The cost of curtailment of wind and solar/RMB152.918.70
Disclaimer/Publisher’s Note: The statements, opinions and data contained in all publications are solely those of the individual author(s) and contributor(s) and not of MDPI and/or the editor(s). MDPI and/or the editor(s) disclaim responsibility for any injury to people or property resulting from any ideas, methods, instructions or products referred to in the content.

