Article

Experimental Study on the Effect of Mixed Thermodynamic Inhibitors with Different Concentrations on Natural Gas Hydrate Synthesis

1
State Key Laboratory of Production Disaster Prevention and Control Co-Founded by Shandong Province and the Ministry of Science and Technology, Shandong University of Science and Technology, Qingdao 266590, China
2
College of Energy and Mining Engineering, Shandong University of Science and Technology, Qingdao 266590, China
3
Graduate School of Engineering, Nagasaki University, Nagasaki 852-8521, Japan
*
Author to whom correspondence should be addressed.
Energies 2024, 17(9), 2078; https://doi.org/10.3390/en17092078
Submission received: 1 March 2024 / Revised: 13 April 2024 / Accepted: 23 April 2024 / Published: 26 April 2024

Abstract

:
Natural gas hydrate (NGH) is a potential future energy resource. More than 90% of NGH resources exist in the pore medium of seafloor sediments. During the development of deep-sea oil and gas fields, wellbore pipelines are often clogged due to the synthesis of gas hydrates, and the addition of thermodynamic inhibitors is a common solution to prevent hydrate synthesis. In this paper, the effects of two single inhibitors, sodium chloride and ethylene glycol, as well as hybrid inhibitors combining these two inhibitors on the synthesis of methane hydrates were investigated using the self-developed one-dimensional gas hydrate exploitation simulation test apparatus. The effects of single and hybrid inhibitors were investigated in terms of the hydrate synthesis volume and gas–water two-phase conversion rate. The results show that the hybrid inhibitor has a better inhibitory effect on hydrate synthesis with the same initial synthesis driving force. When the concentration of inhibitors is low, salt inhibitors can have a better inhibitory effect than alcohol inhibitors. However, in the mixed inhibitor experiment, increasing the proportion of ethylene glycol in the mixed inhibitor can more effectively inhibit the synthesis of hydrates than increasing the proportion of sodium chloride in the mixed inhibitor.

1. Introduction

Natural gas hydrates are the subject of an emerging research trend for resource development in countries all over the world due to their large resource reserves and clean burning [1,2]. The South China Sea is rich in natural gas hydrate resources and is an important energy replacement area [3,4]. In the process of deepwater oil and gas field development, due to the low-temperature and high-pressure conditions in deepwater environments, which lead to a rapid decrease in fluid temperature in the wellbore, hydrate formation and deposition inevitably occur [5,6,7], resulting in deepwater gas wells being faced with a serious obstacle in the form of hydrate, posing a risk to the flow [8,9]. Hydrate flow obstacles can seriously affect the development of deepwater gas wells, causing huge economic losses, and in serious cases, safety accidents may even occur, which is an important influencing factor restricting the safe and efficient development of deepwater gas fields [10,11,12,13,14].
To address the technical obstacles caused by hydrate generation in the process of deep-sea oil and gas field development, many scholars have conducted extensive research and proposed many effective solutions. According to the synthesis mechanism and conditions of natural gas hydrate, the drying method, the pressure control method, the pipeline heating method, and the injection of chemical inhibitors can be used to inhibit the synthesis of hydrate [10,15,16]. Among them, thermodynamic inhibitors (THIs) are often added to drilling and fracturing fluids as inhibitors for hydrate control due to their low manufacturing cost and easy accessibility, and are therefore widely used in drilling, well completion, and hydrate production [9]. In previous studies, scholars have studied the effect of THI on the synthesis properties of hydrates. Chong et al. [17] carried out an experimental study on the effect of different concentrations (1.5 wt% and 3.0 wt%) of NaCl solutions on the synthesis of natural gas hydrate under the conditions of a sandy porous medium, and the results showed that the presence of NaCl under pure water conditions exerted a significant inhibitory effect on the synthesis of the hydrate compared to that of pure water. Cha et al. [18] carried out an experimental study on the phase equilibrium of hydrates containing hybrid salt solutions of NaCl, KCl, and NH4Cl, and found that NaCl was a more effective hydrate inhibitor based on the same molar amount. Mekala et al. [19] studied the synthesis and dissociation kinetics of natural gas hydrate in Toyoura sand (100–500 μm) using 3.03 wt% saline seawater, and the conversion of water to hydrate was 72% in experiments conducted under pure water conditions, while the conversion rate was only 11.6% in experiments conducted in seawater. Cha et al. [20] studied the synthesis characteristics of hydrate at a concentration of 30.0 wt% of ethylene glycol (EG), and found that the presence of EG leads to a change in the equilibrium conditions and reduces the driving force for hydrate synthesis. They also found that at a concentration of 30 wt% of EG, the onset of hydrate synthesis is delayed and hydrate growth is slower. Hydrate thermodynamic inhibitors inhibit hydrate synthesis by regulating the thermodynamic conditions of hydrates, with better thermodynamic regulation performance and easier control of the inhibition effect. In addition, under certain conditions, THI exhibits higher stability and can continuously inhibit hydrate formation without frequent addition or adjustment, and it can also be applied to hydrate inhibition under different types and conditions without the limitation of specific reaction kinetic conditions [16,21,22]. Therefore, compared with other types of hydrate inhibitors, the stability and versatility of THI in hydrate inhibition have been widely used in deep-sea oil and gas field development and other related fields.
Hybrid inhibitors improve inhibition, adapt to diverse engineering environments, and reduce production costs. Previous studies have shown that combining two or more inhibitors into a hybrid inhibitor can synergistically inhibit hydrate generation [10,23]. Due to the different effects of different inhibitors at different concentrations, a hybrid inhibitor may have a stronger inhibitory effect at the same dosage compared to a single inhibitor. More research has been conducted on hybrid THI inhibitors. Gye-Hoon Kwak et al. [24] carried out experiments on the natural gas hydrate phase equilibrium under mixed solutions consisting of NaCl (10 wt%) and EG (10 wt%, and 30 wt%), and the results of the experiments showed that the mixture of salt and EG resulted in a shift in the hydrate phase equilibrium boundaries toward lower temperatures and higher pressures. Similarly, phase equilibrium experiments of natural gas hydrate in mixed aqueous solutions of EG and NaCl (5.77 EG mass %, 15.36 EG mass %, and 23.88 EG mass % mixed with 3.77 NaCl mass %, respectively; 3.77 EG mass % mixed with 15.67 NaCl mass %) carried out by C. Eichholz et al. [25] led to similar conclusions. Jageret et al. [26] tested the effect of a mixture of MeOH (5.88 mol%, 12.3 mol%, 19.4 mol%, and 27.2 mol% methanol relative to water) and NaCl (2 mol% and 4 mol% NaCl relative to water) on natural gas hydrate, and they concluded that the combined effect of the hybrid inhibitor exceeded the sum of the individual effects, and the inhibition was more pronounced, especially when the inhibitor concentration was higher. Kim et al. [27] experimentally investigated the characteristics of hydrate synthesis in the simultaneous presence of EG (20.0 wt%) and NaCl (3.5 wt%, 7.0 wt%, 10.0 wt%, 20.0 wt%). The presence of NaCl and EG in the aqueous phase appeared to minimize the interactions between hydrate particles by encircling the hydrate particles, a phenomenon that demonstrated that NaCl and EG acted as synergistic inhibitors under insufficiently inhibitory conditions, further limiting the hydrate synthesis. Bai et al. [28] evaluated the kinetic effects of low concentrations of EG (0.1 wt%, 0.5 wt%, 1 wt%, 5 wt%) and NaCl (0.1 wt%, 0.5 wt%, 1 wt%, 5 wt%) on natural gas hydrate synthesis in SDS solutions, and the results showed that both NaCl and EG had kinetic inhibitory effects on hydrate synthesis in SDS solutions, and the inhibitory effect of NaCl was greater than that of EG at the same content. Sui et al. [29] experimentally investigated the synergistic inhibition of natural gas hydrate synthesis by EG and the kinetic inhibitor PEO-co-VCap-1 in the presence of fine sand, and the experimental results showed that the use of PEO-co-VCap-1 in combination with EG not only retarded hydrate nucleation but also effectively reduced the catastrophic growth of hydrates. Cha et al.’s [20] experiments also yielded the same results. Zhao et al. [30] used different concentrations of NaCl (10% and 20%) and EG (20% and 40%) composite combinations to study the inhibitory effect of hybrid thermodynamic inhibitors on hydrate synthesis, and it was found that the composite inhibitors could effectively reduce water activity and thus inhibit hydrate generation. Hydrate equilibrium studies of methane, ethane, and propane synthesis gas mixtures in the simultaneous presence of EG and salt solutions (3.36 mol % EG and 3.56 mol % NaCl; 3.45 mol % EG and 1.92 mol % CaCl2) by Sun et al. [31] showed that the addition of NaCl showed greater thermodynamic inhibition than the addition of EG on the same mass percentage basis. The above studies have made some progress on the effects of mixed inhibitors on hydrate synthesis, but the understanding of the synergistic effect of mixed inhibitors of different compositions in hydrate synthesis is not comprehensive enough, so the present study is devoted to the search for more effective inhibition effects by changing the composition ratio and formulation of mixed inhibitors. By investigating new combinations of mixed inhibitors, it is hoped that a more advantageous inhibition scheme can be found to improve the inhibition effect and stability of hydrates.
Given the above understanding, this paper chose the quartz sand porous medium as the host environment for hydrate synthesis, and under the conditions of constant initial pressure and initial temperature, experimental studies on the effects of different concentrations of single thermodynamic inhibitors (NaCl and EG) and a hybrid inhibitor (NaCl + EG) on natural gas hydrate synthesis were carried out using a self-developed one-dimensional natural gas hydrate exploitation simulation test apparatus. The effects of single and hybrid inhibitors were investigated in terms of the hydrate synthesis volume and gas–water two-phase conversion rate. Useful research results are provided to address the problems caused by natural gas hydrate synthesis in deep-sea oil and gas fields’ development.

2. Experiment

2.1. Experimental Materials and Apparatus

In this experiment, the quartz sand used has a grain size of 15–53 μm. According to the SEM test results of Liu [32], in the sediment of the SH7 reservoir in Shenhu Sea, South China Sea, the silt (4~63 μm) accounted for 23.5% of the total, and the quartz sand used in this study has a grain size similar to that of silt (4~63 μm) and is within the range of the South China Sea marine sediment. Therefore, quartz sand with this particle size was used as the skeleton of the porous medium to carry out hydrate synthesis experiments. To avoid the influence of other ions present in the regular aqueous solution on hydrate synthesis, deionized water was used to provide the necessary water molecules. Table 1 shows the inhibitors and other materials used in the experiment.
The test apparatus utilized was the one-dimensional gas hydrate exploitation simulation test apparatus developed by the Mining Disaster Prevention and Control Laboratory at Shandong University of Science and Technology [33], which mainly consists of five modules: a gas injection system, a one-dimensional model and temperature control system, an export metering system, a back pressure control system, and a data acquisition system, as shown in Figure 1. The core part of the apparatus is a one-dimensional high-pressure reactor, as shown in Figure 2a, with dimensions of Φ 60 × 300 mm, made from 316L stainless steel, and a pressure resistance of 25 MPa. The reactor has a pressure sensor installed at both the inlet and outlet to monitor their respective pressures. The range of the pressure sensor is from 0 to 25 MPa and it has an accuracy of 0.01 MPa. Additionally, there are four temperature sensors evenly distributed along the reactor body. These sensors are located at distances of 5 mm, 75 mm, 145 mm, and 215 mm from the reactor inlet, respectively. Their purpose is to measure the temperature changes inside the reactor. The temperature sensor is a Pt100 platinum resistor with a measurement range of −20 °C to 200 °C. It has a measurement accuracy of 0.1 °C. The temperature during the experiment is controlled by the KDHD-III high- and low-temperature thermostatic chamber, which has a temperature control range of −30 °C to 200 °C, as shown in Figure 2b. The back pressure control system mainly controls the outlet pressure of the reactor, in order to realize the accurate reduction in the gas pressure in the reactor step by step, and the system includes a horizontal manual back pressure pump, an automatic back pressure pump, a back pressure valve (with a pressure control accuracy of 0.05 MPa), and a back pressure vessel (with a pressure resistance value of 40 MPa and a volume of 500 mL). In addition, the outlet metering system is used to measure the amounts of discharged gases, liquids, and solids, which mainly consists of gas–liquid separators, gas–solid–liquid three-phase separators, high-, medium-, and low-range flowmeters (ranges of 30 mL/min, 300 mL/min, and 1000 mL/min, respectively), an electronic balance, and a wet flowmeter (with a range of 0.5 m3/h).

2.2. Experimental Steps

(1)
Preparation of Porous Medium Reservoirs
In this experiment, the sand–water mixing method was used to prepare sand-containing porous medium reservoirs. First, 1500 g of dry quartz sand (15–53 μm) was weighed in a container, and 300 g of deionized water was measured with a beaker for the reserve; then, the mass of NaCl and EG required for each group of experiments was calculated according to the experimental scheme, accurately weighed and added into 300 g of deionized water, and stirred with a glass rod to make the solution fully soluble. Finally, the stirred solution was poured into 1500 g of dry sand and mixed thoroughly so that the sand–water mixture was well blended, and each group of experiments ensured that the total mass of sand and water used was equal, in order to avoid inducing additional experimental variables. The experiments used the layered compaction method to fill the reactor, both weighing the same mass of wet sand each time and using the compaction hammer to compact the same number of times, in order to prepare a more homogeneous porous media reservoir [34]. The apparatus and quartz sand used in the experiment are shown in Figure 3.
(2)
Synthesis of Natural Gas Hydrate
We installed the filled one-dimensional reactor into the high- and low-temperature chambers, and connected the piping, temperature sensors, and pressure sensors. We started the thermostat, setting the temperature to 298.15 K, and waited until the temperature at each measurement point in the reactor was stabilized at 298.15 K for some time; then, we opened the gas cylinder and used the inlet valve to inject methane gas into the reactor. We initially stabilized the reactor pressure at 10 MPa after the closure of the inlet valve; if the kettle pressure remained stable for a long period (1~2 days), then this indicated that the airtightness was good and the next step of the test could be carried out. After completing the leak check for the reactor, the thermostat was set to 277.15 K; the rate of temperature decrease of the thermostat is 0.5 K/min. As the temperature was lowered, hydrates were gradually generated in the reactor in the gas-saturated and supercooled state. After the temperature and pressure in the reactor had reached a steady state, i.e., the temperature and pressure had remained unchanged for a long time, we considered that the natural gas hydrate in the reactor had been completely synthesized at this time, and the macroscopic manifestation was that the size of the hydrate saturation was no longer changing.

2.3. Experimental Programs

In this paper, firstly, experiments on hydrate synthesis under pure water conditions were carried out, and subsequently, studies on the effects of two single inhibitors, NaCl and EG, at different concentrations, on the synthesis of hydrates were carried out. In previous studies, most scholars studied the effect of 1.5 wt% and 3.5 wt% NaCl solutions on the characteristics of hydrate synthesis [17,27,35,36]. According to the relevant literature, the salinity of normal seawater is around 2.65% [37], so the concentration of the NaCl solution was set to 1.5 wt%, 2.65 wt%, and 3.5 wt% in this experiment, and the EG was configured according to the water–alcohol mass ratio of 3:1, 5:1, and 7:1, respectively. Subsequently, the above six single inhibitors with different concentrations were mixed and combined to obtain nine different composite inhibitors. The initial experimental pressure and temperature were always 10 MPa and 298.15 K, respectively. The specific experimental conditions are shown in Table 2.

3. Experimental Results and Discussion

3.1. Calculation Method for Natural Gas Hydrate Synthesis Process

Under the excess gas method, a predetermined amount of methane gas is injected into the reactor to synthesize hydrates. The equation for calculating the initial molar amount n m , 0 of methane gas at the initial moment is as follows:
n m , 0 = P t , 0 V C R z R T t , 0
where P t , 0 is the pressure of the reactor at the initial moment, MPa; V C R is the volume of the reactor, L; R is the ideal gas constant; z is the compression factor estimated by the equation of state proposed by Pitzer [38]; and T t , 0 is the thermodynamic temperature of the reactor at the initial moment, K.
In this study, the molar amount of CH4 consumed for the synthesis of hydrates Δ n H , t is calculated based on the true gas equation of state (2a) [39]. The normalized gas consumption at any given moment t is N G t , calculated based on Equation (2b) [17]:
Δ n H , t = V C R P C R z R T t = 0 V C R P C R z R T t
N G t = Δ n H , t n H 2 O
where Δ n H , t is the methane gas consumption, mol; P C R and T are the pressure and temperature in the reactor at any time t, respectively; and V C R is the one-dimensional reactor volume, L.
The total material quantity of deionized water in the porous medium during the test is calculated as
n w , 0 = m w , 0 M w
where n w , 0 is the total amount of deionized water, mol; m w , 0 is the total mass of deionized water, 300 g; and M w is the molar mass of water molecules, 18.015 g/mol.
The conversion rate of water to hydrate is calculated based on Equation (4):
C W H = ( Δ n H , ) end × N H y d n H 2 O × 100 %
where ( Δ n H , ) end is the amount of methane consumed at the complete end of hydrate synthesis, mol, and N H y d represents the hydration number, i.e., the number of water molecules required to encapsulate a gas molecule in a hydrate molecule. Referring to other studies, 6.1 was chosen as the hydration number in this paper [40,41].
The conversion rate C CH 4 of gas to hydrate at the end of hydrate synthesis is calculated based on Equation (5):
C C H 4 = ( Δ n H , ) end n m , 0 × 100 %
The total volume of synthesized hydrate in porous media is calculated as
V h = ( Δ n H , ) end × M h ρ h
where V h is the total volume of hydrate, cm3; ρ h is the hydrate density, generally taken as 0.94 g/cm3; and M h is the molar mass of the hydrate, generally taken as 119.5 g/mol.
The data calculated for each parameter of the experiment are shown in Table 3.

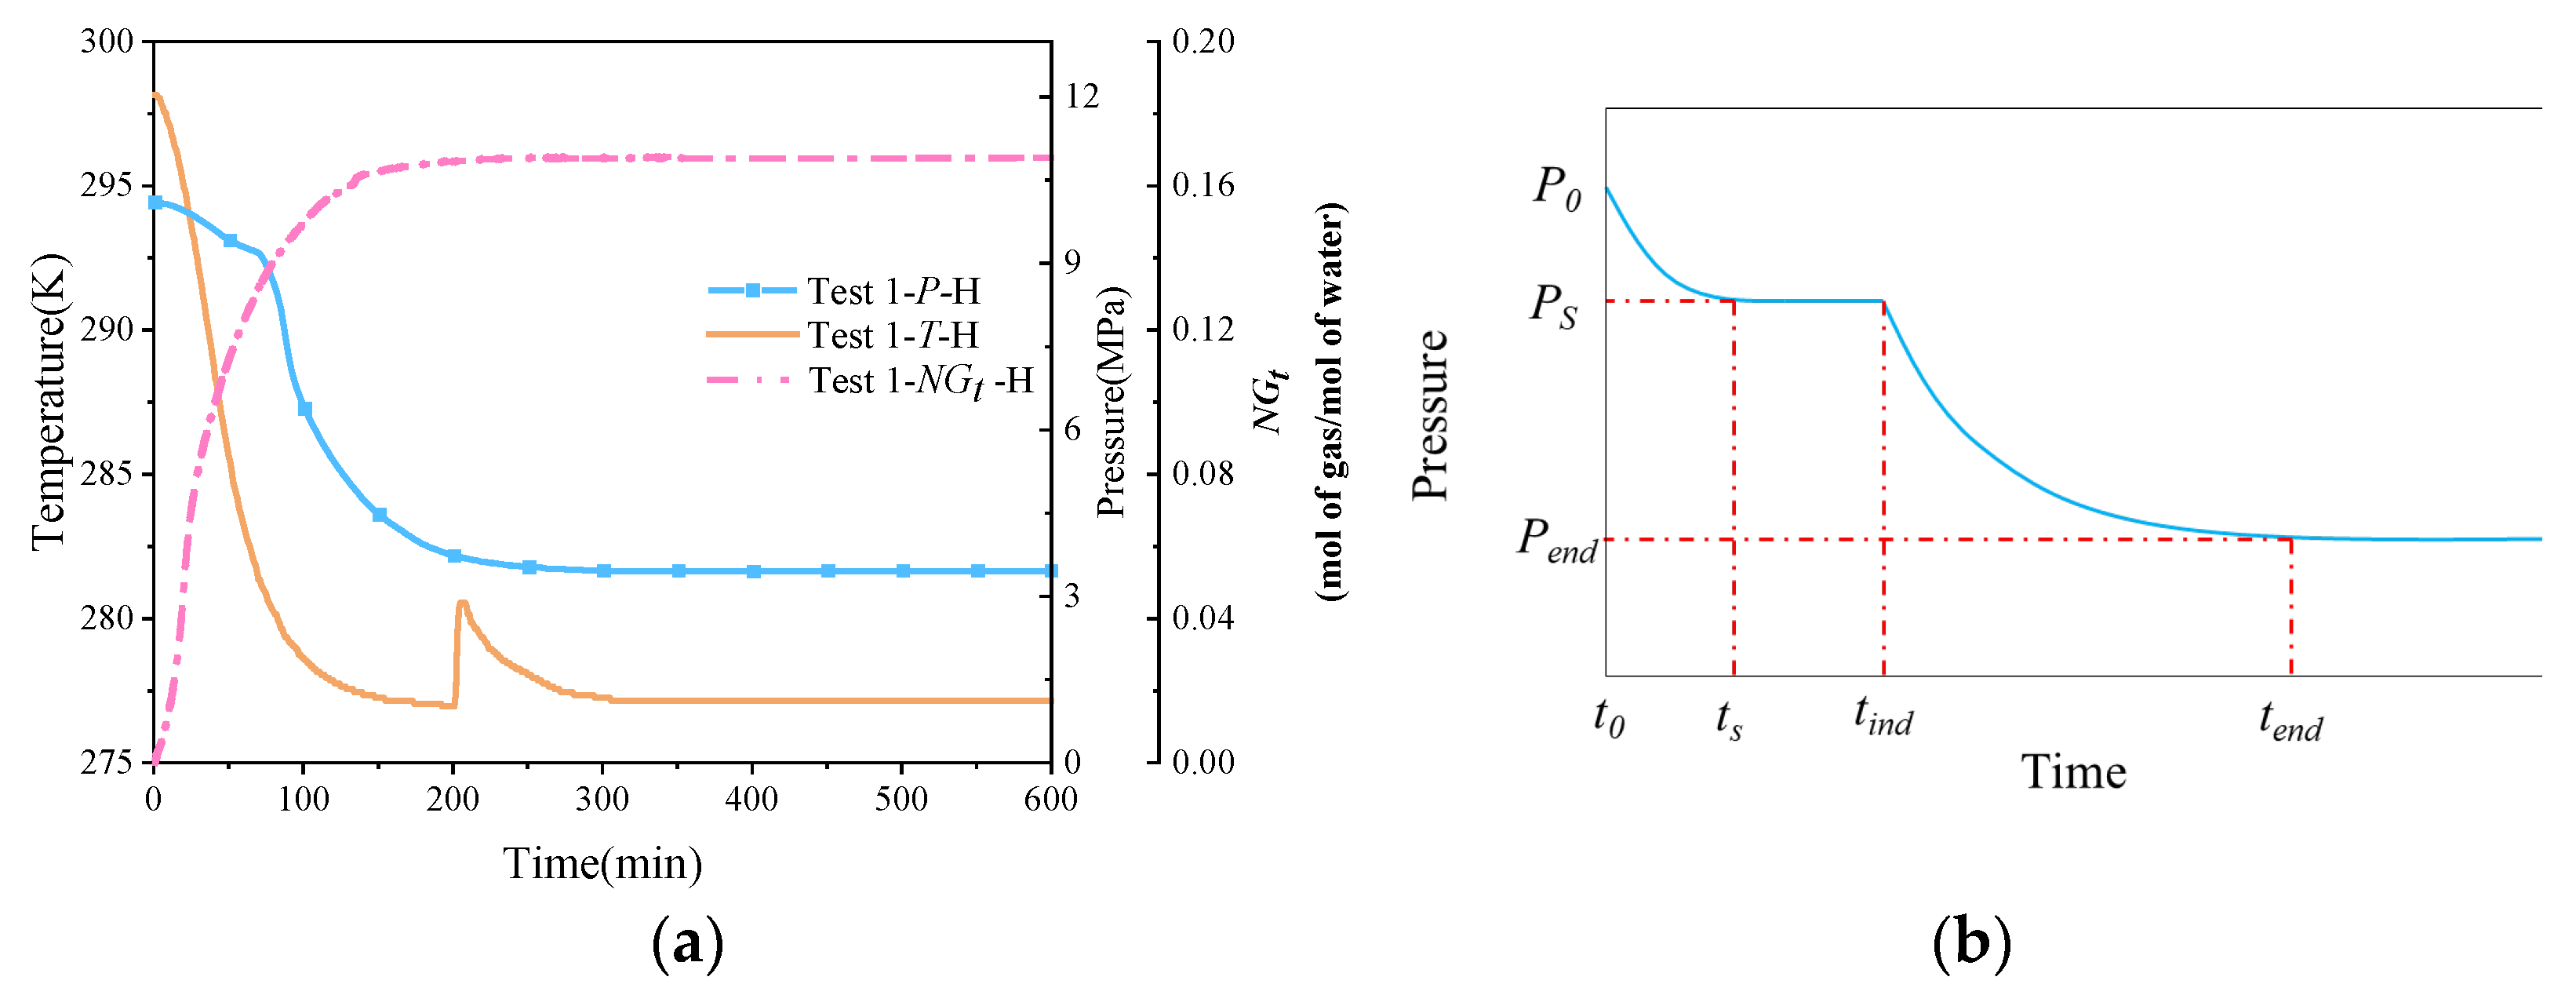
3.2. Synthesis of Natural Gas Hydrate in Pure Water

Figure 4a shows the variation curves of temperature, pressure, and normalized gas consumption during natural gas hydrate synthesis under pure water conditions. It can be seen that as the temperature of the thermostat gradually decreases, the reactor, as well as the sand layer and methane gas inside the reactor, cools down and gradually stabilizes to the set temperature of the thermostat. Due to the exothermic nature of hydrate synthesis, the onset of significant hydrate synthesis is indicated by a large drop in pressure in the reactor and a sharp rise in reservoir temperature. Only one exothermic peak was observed in the P-T curve because of the one-time gas injection method used in this experiment. In Englezos’ nucleation theory [42], the nucleation process of natural gas hydrate is divided into two parts as a whole, i.e., the nucleation part and the growth part, where hydrate nucleation refers to the process of forming a critical-size, stable hydrate nucleus; the formation of the nucleus is more difficult, and generally includes an induction period, which is characterized by a great deal of uncertainty and stochasticity. When the crystal nucleus in the supersaturated solution reaches a certain stabilized critical size, then the system will spontaneously enter the rapid hydrate growth phase. As can be seen from Figure 4b, the nucleation part includes the dissolution stage (t0ts) and the nucleation stage (tstind); the growth part includes the rapid growth stage and the stabilization stage (tindtend).
The pressure curves shown in Figure 4a are consistent with Englezos’ [42] theory of hydrate synthesis. The pressure dropped from 10 MPa to 3.46 MPa when the system reached the stabilization stage under pure water conditions. As shown in Figure 4a, compared with the initial moment, the pressure decreased by 6.54 MPa, and the conversion rate of methane gas was 66.93% after stabilization, while all the water was converted to hydrate, and the experimental calculation results are shown in Table 3. A large amount of exothermic heat is released during the rapid growth phase of the hydrate, where the temperature rises from 276.95 K to 280.45 K, and then gradually returns to the set temperature of the thermostat.

3.3. Synthesis of Natural Gas Hydrate under a Single Inhibitor

Figure 5 shows the synthesis curve of hydrate under different concentrations of NaCl solution. Under the conditions of a constant initial water content, the pressure of the system after reaching the stabilization stage increases gradually as the concentration of NaCl continues to rise. The stabilized pressure was 4.57 MPa for a salinity of 1.5 wt%, while it was 5.15 MPa and 5.24 MPa for a salinity of 2.65 wt% and 3.5 wt%, respectively. Meanwhile, the conversion rate of methane was 55.46%, 48.71%, and 47.72%, and the conversion rate of deionized water was 84.66%, 74.35%, and 72.85%, respectively. Compared with the pure water experiments, in the salt-containing system, the final stabilizing pressures are all higher than in the pure water system, despite being subjected to the same initial synthesis drive, whereas the amount of heat released during the synthesis phase is lower than in the pure water system, i.e., the amount of hydrate synthesized is less than that synthesized under pure water conditions, as shown in Table 3. This demonstrates that the salt thermodynamically inhibits hydrate formation by inhibiting hydrate growth, even when the NaCl content in the system is low (1.5 wt%), which is in agreement with Chong et al. [17] and Yang et al. [43]. Many hypotheses exist to explain the mechanism of inhibition of hydrate synthesis by NaCl, and most scholars generally agree that the presence of salt reduces the activity of the water and disrupts the lattice structure of the gas hydrate, thus increasing the barrier to hydrate nucleation [30]. In terms of the duration of the experiments (i.e., the time for hydrate formation to reach a steady state), the time taken by the hydrate to undergo the nucleation phase was significantly longer in the 3.5 wt% and 2.65 wt% salt solutions compared to the experiments performed in pure water (about 238 min and 194 min for N3.5 and N2.65, respectively). However, regarding the final stabilizing pressure, the difference in stabilizing pressure between the 2.65 wt% salt solution and the 3.5 wt% salt solution was not large, and the temperature increase in the synthesis process of both of these solutions was the same. This may be because the inhibitory effect of NaCl on hydrate synthesis is not consistently enhanced with the increase in mass fraction or because the enhancement of the inhibitory effect is not obvious when the concentration of NaCl is increased by a small amount, which needs to be investigated further experimentally.
Figure 6a shows the temperature–pressure profiles of hydrate synthesis with different proportions of EG solutions. Similar to the NaCl solution, with the same initial synthesis driving force, as the proportion of EG in the solution increases, the stabilizing pressure at which the system eventually stabilizes gradually increases, and the exothermic heat of the synthesis process gradually decreases. This means that less of the methane gas in the system has reacted to synthesize the hydrate, and therefore, the system exhibits a higher stabilizing pressure externally. Comparing the temperature–pressure curves of the three different ratios of EG inhibitors, the best inhibitory effect on hydrate synthesis was achieved when the water–alcohol mass ratio was 3:1, and the final stabilized pressure only decreased by about 4 MPa compared with that of the initial state, with a temperature increase of 2.2 K, which was only about half of that of the pure water condition. This is because as the percentage of alcohols in the system increases, the hydrophilic hydroxyl groups in the alcohol molecules greatly disrupt the structure of the hydrate cages, thus making it more difficult to form hydrate cage structures, while the hydroxyl groups can form hydrogen bonds with localized liquid water molecules, leading to a decrease in the growth rate of the natural gas hydrate. Comparison of the analysis of the time of synthesis of EG-influenced hydrates shows that EH13 undergoes a longer nucleation phase and the system reaches final stabilization after a longer period (around 400 min), whereas the time required to reach final stabilization is around 370 min and 350 min for H5E1 and H7E1, respectively. This also shows that when the EG content in the system is higher, the time required for hydrate nucleation as well as to reach the final steady state is longer and the synthesis of hydrate is more difficult. Figure 6b represents the variation rule of normalized gas consumption (NGt) with time under the condition of a single-alcohol inhibitor, and it can be seen that the NGt when the water–alcohol mass ratio is 3:1 is about half of that when the water–alcohol mass ratio is 7:1, which also indicates that a greater inhibitor content is needed if a good inhibitory effect is to be achieved in practical applications.

3.4. Synthesis of Hydrate in Hybrid Inhibitor Systems

Figure 7 shows the trend of temperature and pressure changes under hybrid inhibitor conditions. Within this figure, Figure 7a–c present the regular effects of quantitative NaCl mixed with different proportions of EG on hydrate synthesis, while Figure 7d–f present the regular effects of quantitative EG mixed with different proportions of NaCl on hydrate synthesis. From the temperature and pressure curves in each figure, it is easy to see that the inhibitory effect of a hybrid inhibitor is better than that of a single inhibitor, which is in line with the general law that the larger the amount of thermodynamic inhibitor is, the more obvious the inhibition of hydrate synthesis is. Comparing the stabilized pressures of different mixing conditions in Figure 7a–f, it can be seen that the final stabilized pressure of the system is increased substantially when the water–alcohol mass ratio reaches 3:1 compared to the water–alcohol mass ratio of 7:1 and 5:1, which is in line with the experimental results of the mono-alcohol inhibitors. This implies that for alcohol inhibitors, a significant inhibitory effect on hydrate formation can only be achieved when the dosage is sufficiently high. In addition, the final stabilizing pressures were less affected by the NaCl mass fraction when the water–alcohol mass ratios were 7:1 and 3:1. However, it is worth noting that for the two sets of experiments, N1.5-H5E1 and N3.5-H3E1, the final steady pressures were almost the same, which seems to be in contradiction with the previous rule that the larger the amount of the inhibitor, the better the inhibitory effect is. This may be due to the difference in the inhibition mechanism between hybrid inhibitors and single inhibitors, and due to the difference in hydrophilicity of the two different chemical reagent molecules under the salt–alcohol mixing conditions, the hydrophilic inhibitor preferentially causes inhibition under the hybrid inhibitor conditions, and the synergistic effect of the disruption of water molecule cages reaches the maximum when 1.5 wt% NaCl is mixed with H5E1. In addition, in another set of experiments, N3.5-H3E1, no hydrate nucleation and growth were observed, and no exothermic phenomena were observed during the experiments, while the temperature of the measuring point followed the temperature of the thermostat all the time. In Kim’s experiment [27], when the concentration of NaCl in the EG solution exceeded 10.0 wt%, no hydrate synthesis was observed for more than 600 min, which may be attributed to the fact that when the inhibitor concentration was high enough, it greatly disrupted the structure of the cavity between the water molecules, resulting in the generation of very little or no hydrate, which also suggests that when the concentration of NaCl in the mixed solution of NaCl and EG exceeds 3 wt%, NaCl becomes a strong inhibitor.

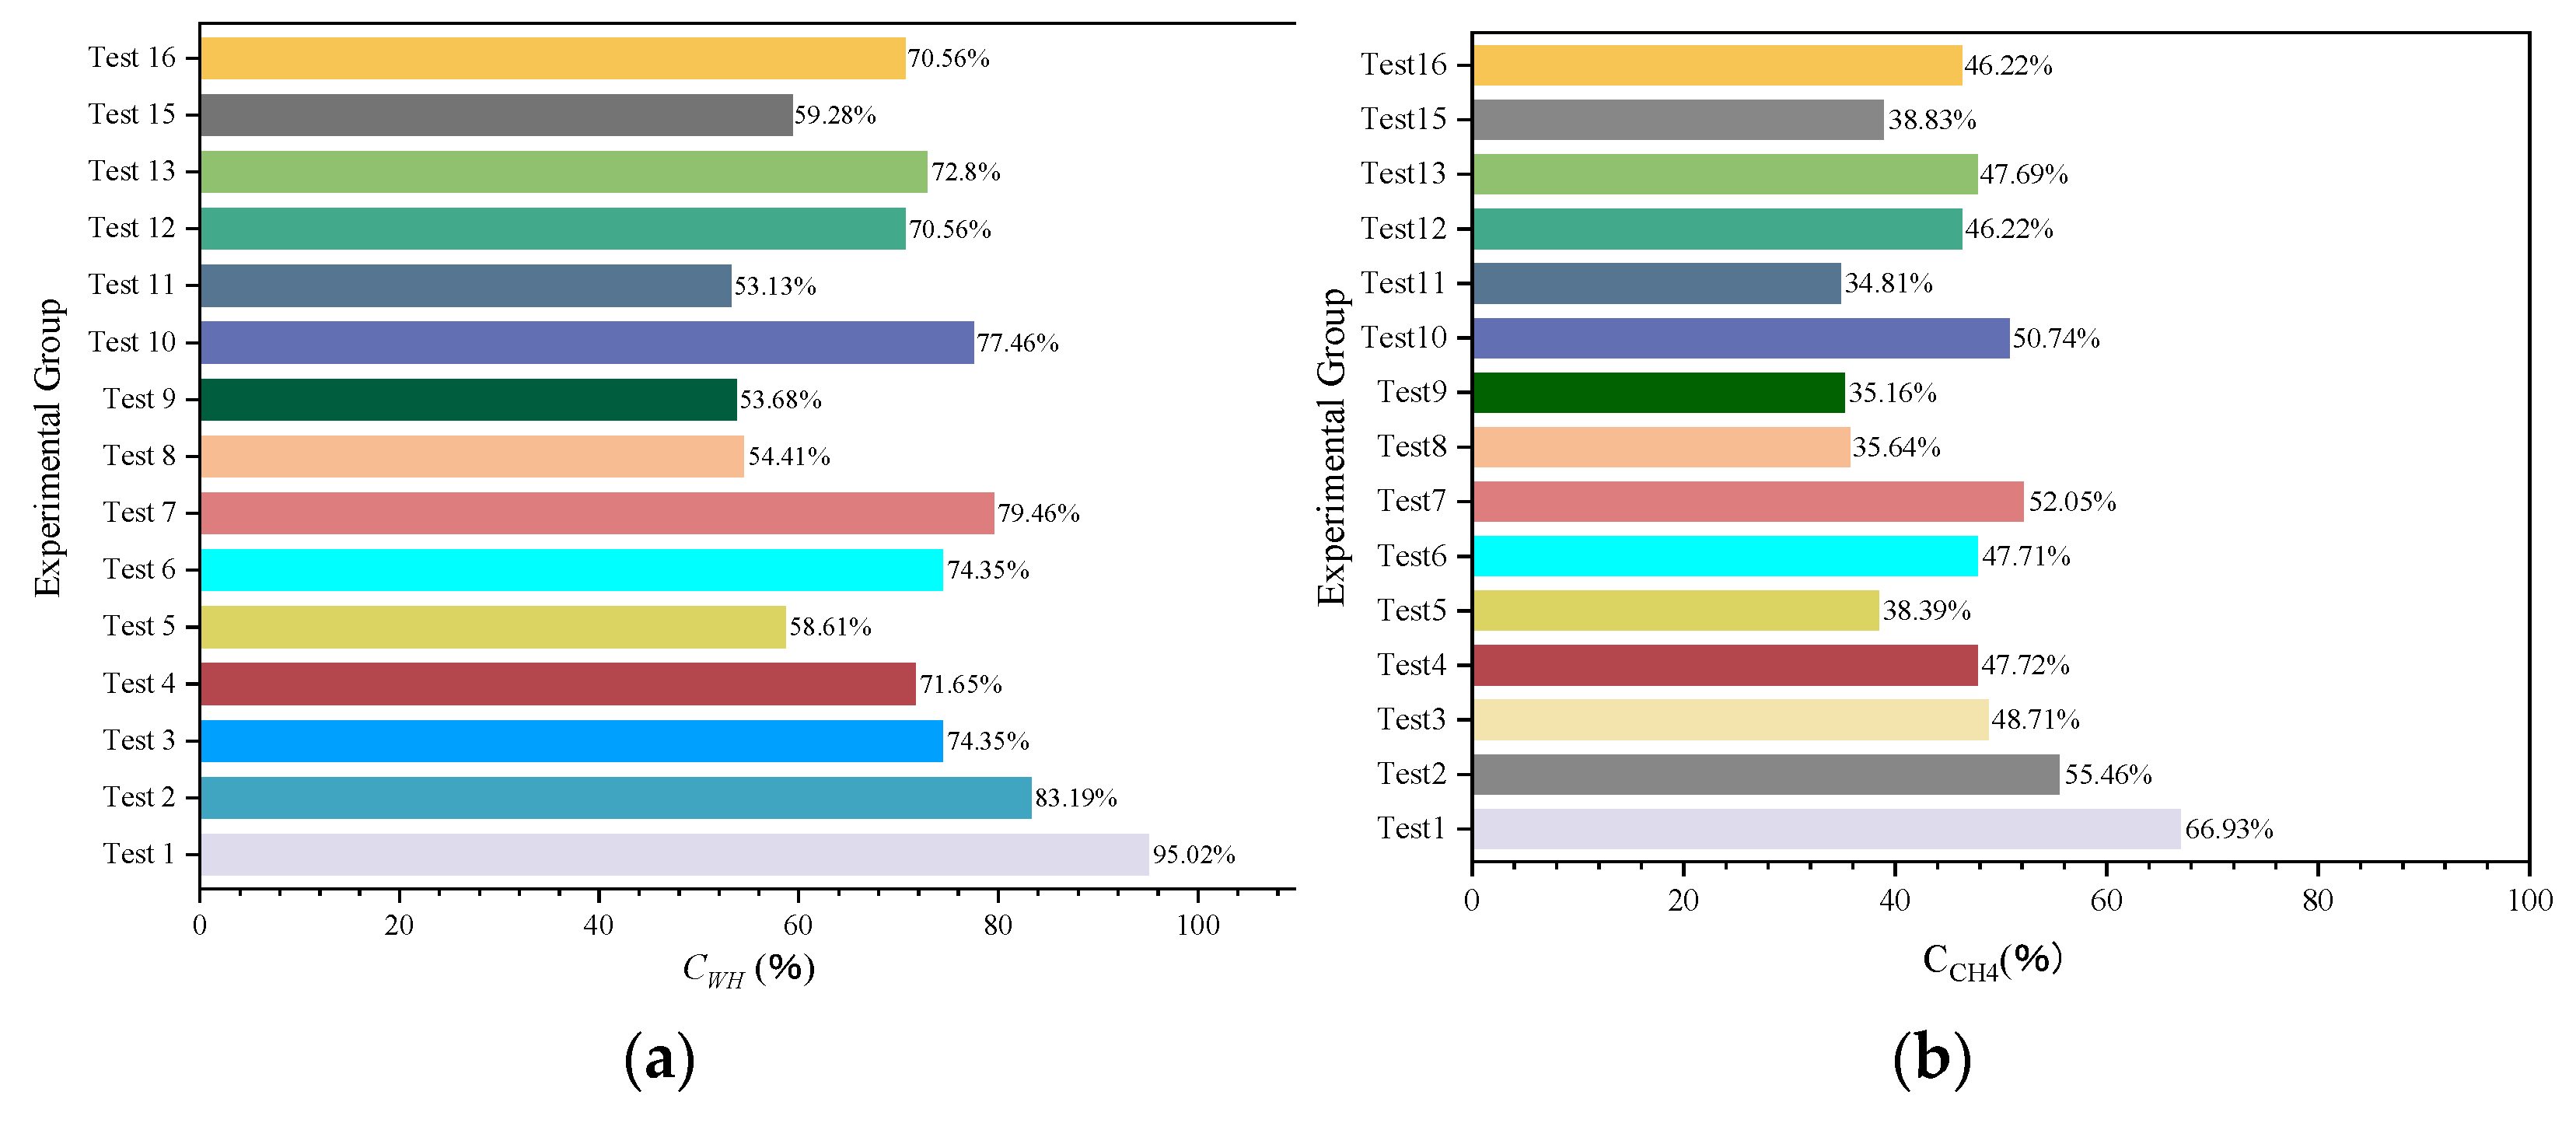
3.5. Comparison of Natural Gas Hydrate Synthesis Results

The range of pressure drop and the magnitude of temperature increase during hydrate synthesis can characterize the inhibitory effect of hydrate generation, i.e., the final stabilizing pressure of the experiment is negatively correlated with the heat released from the synthesis. Therefore, to compare more clearly the effects of different inhibitor systems on the synthesis of hydrates, histograms of the gas–water two-phase conversion rate (Figure 8), the histogram of the amount of methane consumed by the experiment (Figure 9), and the histogram of the volume of synthesized hydrate (Figure 10) were obtained according to the relevant data in Table 3, respectively. It can be seen that for NaCl solutions with mass fractions of 1.5 wt%, 2.65 wt%, and 3.5 wt%, respectively, when the post-synthesis pressures reached a steady state, the water conversion rates were 83.19%, 74.35%, and 71.65%, whereas the methane gas conversion rates were 55.46%, 48.71%, and 47.72%, respectively. Meanwhile, for the three different water–alcohol mass ratios, the water phase conversion rates were 58.61%, 74.35%, and 79.46%, while the gas phase conversion rates were 38.39%, 47.71%, and 52.05%, respectively. The results show that the amount of hydrate synthesized in pure water experiments was consistently higher than that in the presence of inhibitors under the same synthetic driving force, confirming the inhibitory effect of NaCl and EG on hydrate synthesis, while the inhibitory effect of a high concentration of inhibitor on hydrate was better than that of a low concentration of inhibitor, which indicated that the dosage of the thermodynamic inhibitor was an important indicator affecting the degree of inhibition. Under the premise of a single inhibitor, this is consistent with the rule that the higher the dosage, the stronger the inhibition of the hydrate, and other scholars have come to similar conclusions [26,44]. For the hybrid inhibitor, no hydrate generation was observed in the N3.5-H3E1 group of experiments, while N1.5-H5E1 is a group of particular interest, as the inhibition achieved at this ratio is very satisfactory, which suggests that mixing different inhibitors at a certain ratio may provide better inhibition synergy. In addition to this, the rest of the experiments were consistent with better hydrate inhibition as the concentration and ratio of inhibitors increased.
Comprehensively comparing all the experiments in this work, it can be confirmed that the inhibitory effect of the hybrid inhibitor is superior to that of the single inhibitors, which is because the presence of NaCl and EG in the aqueous phase can minimize the interactions between the hydrate particles by encircling them. The ionic strength of the solution can be increased by the addition of NaCl [45], and the presence of Na+ and Cl ions can change the crystal structure and stability of the hydrate, reducing the opportunity for water molecules to participate in the formation of the hydrate [46], and decreasing the ability to form the hydrate. Ethylene glycol reduces the activity of water molecules and increases the intermolecular interaction force, which changes the surface tension of the solution and affects the dispersion and aggregation of hydrate nuclei and thus influences the synthesis of hydrates [47,48]. Therefore, the mixed inhibitor of NaCl and ethylene glycol can simultaneously play a role in regulating the ionic strength, water molecule activity intermolecular forces in solution, and other mechanisms to inhibit the synthesis of hydrate, thus achieving a better inhibition effect. And these results prove that, in insufficiently inhibited conditions, NaCl demonstrates a synergistic effect with the EG, which further limits the hydrate synthesis. At low concentrations of inhibitors, the amount of NaCl used to achieve the same inhibitory effect is significantly lower than that of alcohol. In the experiments of Bai et al. [28], NaCl was inhibited more effectively than EG at low concentrations of inhibitors, so NaCl can be preferred as an inhibitor at low concentrations of inhibitors. However, when the amount of inhibitor is increased, NaCl exerts a less potent inhibitory effect than increasing the alcohol concentration, and when the alcohol inhibitor is increased to a certain level, it can completely inhibit the growth of the hydrate.

4. Conclusions

In this paper, an experimental study on the effect of thermodynamic inhibitors on natural gas hydrate synthesis was carried out using an independently developed one-dimensional natural gas hydrate exploitation simulation test apparatus, revealing the characteristics of the effect of single and composite inhibitors on hydrate synthesis, and the following main conclusions were obtained:
  • When the mixed inhibitor and single inhibitor dosages are equal, the inhibition effect of the mixed inhibitor is significantly better than that of the single inhibitor. The inhibition results obtained in the Test 9 group were very satisfactory, with hydrate synthesis volumes and gas–water phase conversion rates similar to those of the Test 8 group. This indicates that mixing of different inhibitors in a certain ratio provides a better synergy of inhibition. The presence of NaCl can minimize the interactions between hydrate particles by surrounding them, thus acting as a synergistic effect on EG and further limiting hydrate synthesis.
  • In the whole process of hydrate synthesis, the exotherm of hydrate synthesis mainly occurs in the stage of hydrate large-scale growth, and no more obvious exotherm phenomenon is found in the stage of nucleation. In the single inhibitor experimental group, it was found that the induction period of the hydrate synthesis stage increased significantly with increasing inhibitor dosage and the synthesis took longer to reach stability.
  • Under the same initial synthesis driving force, in the single inhibitor experimental group, it can be found that with the increase in the mass fractions of NaCl and EG, the water conversion rate in the two different inhibitors decreased from 83.19% and 79.46% to 71.65% and 68.61%, respectively, and the methane gas conversion rate decreased from 55.46% and 52.05% to 47.72% and 38.39%, respectively. These indicate that the inhibition of hydrate synthesis is enhanced by increasing the inhibitor concentration, and NaCl can exert a stronger inhibition at lower inhibitor concentrations.
  • In the mixed inhibitor experimental group, increasing the percentage of EG in the mixed inhibitor was more effective in inhibiting hydrate synthesis compared to increasing the percentage of NaCl in the mixed inhibitor.

Author Contributions

Funding acquisition, Y.J.; conceptualization, H.L. and Q.S.; methodology, H.L. and M.L.; data curation, M.L. and P.Y.; writing—original draft preparation, H.L. and M.L.; investigation, X.D. and Q.S.; resources, H.L. and Q.S.; writing—review and editing, Y.J. and P.Y.; visualization, X.D. and P.Y. All authors have read and agreed to the published version of the manuscript.

Funding

This research was funded by the Shandong Provincial Natural Science Foundation, China (Grant number ZR2019ZD14 and ZR2021QE154), and the National Natural Science Foundation, China (Grant No. 52204042).

Data Availability Statement

The original contributions presented in the study are included in the article, further inquiries can be directed to the corresponding author.

Conflicts of Interest

The authors declare no conflicts of interest.

References

  1. Li, X.-S.; Xu, C.-G.; Zhang, Y.; Ruan, X.-K.; Li, G.; Wang, Y. Investigation into gas production from natural gas hydrate: A review. Appl. Energy 2016, 172, 286–322. [Google Scholar] [CrossRef]
  2. Sloan, E.D., Jr.; Koh, C.A. Clathrate Hydrates of Natural Gases; CRC Press: Boca Raton, FL, USA, 2007. [Google Scholar]
  3. Li, J.F.; Ye, J.L.; Qin, X.W.; Qiu, H.J.; Wu, N.Y.; Lu, H.L.; Xie, W.W.; Lu, J.A.; Peng, F.; Xu, Z.Q. The first offshore natural gas hydrate production test in South China Sea. China Geol. 2018, 1, 5–16. [Google Scholar] [CrossRef]
  4. Wang, L.; Fu, S.; Liang, J.; Shang, J.; Wang, J. A review on gas hydrate developments propped by worldwide national projects. Geol. China 2017, 44, 439–448. [Google Scholar]
  5. Hou, X.K.; Qi, S.W.; Huang, X.L.; Guo, S.F.; Zou, Y.; Ma, L.N.; Zhang, L.X. Hydrate morphology and mechanical behavior of hydrate-bearing sediments: A critical review. Geomech. Geophys. Geo-Energy Geo-Resour. 2022, 8, 161. [Google Scholar] [CrossRef]
  6. Liu, W.; Wang, S.; Yang, M.; Song, Y.; Wang, S.; Zhao, J. Investigation of the induction time for THF hydrate formation in porous media. J. Nat. Gas Sci. Eng. 2015, 24, 357–364. [Google Scholar] [CrossRef]
  7. Liu, Y.; Chen, B.; Chen, Y.; Zhang, S.; Guo, W.; Cai, Y.; Tan, B.; Wang, W. Methane Storage in a Hydrated Form as Promoted by Leucines for Possible Application to Natural Gas Transportation and Storage. Energy Technol. 2015, 3, 815–819. [Google Scholar] [CrossRef]
  8. Mokhatab, S.; Wilkens, R.J.; Leontaritis, K. A review of strategies for solving gas-hydrate problems in subsea pipelines. Energy Sources Part A 2007, 29, 39–45. [Google Scholar] [CrossRef]
  9. Wang, Y.H.; Fan, S.S.; Lang, X.M. Reviews of gas hydrate inhibitors in gas-dominant pipelines and application of kinetic hydrate inhibitors in China. Chin. J. Chem. Eng. 2019, 27, 2118–2132. [Google Scholar] [CrossRef]
  10. Elhenawy, S.; Khraisheh, M.; Almomani, F.; Al-Ghouti, M.A.; Hassan, M.K.; Al-Muhtaseb, A. Towards Gas Hydrate-Free Pipelines: A Comprehensive Review of Gas Hydrate Inhibition Techniques. Energies 2022, 15, 8551. [Google Scholar] [CrossRef]
  11. Fu, W.Q.; Wang, Z.Y.; Duan, W.G.; Zhang, Z.N.; Zhang, J.B.; Sun, B.J. Characterizing methane hydrate formation in the non-Newtonian fluid flowing system. Fuel 2019, 253, 474–487. [Google Scholar] [CrossRef]
  12. Kelland, M.A.; Iversen, J.E. Kinetic Hydrate Inhibition at Pressures up to 760 Bar in Deep Water Drilling Fluids. Energy Fuels 2010, 24, 3003–3013. [Google Scholar] [CrossRef]
  13. Sohn, Y.H.; Seo, Y. Effect of monoethylene glycol and kinetic hydrate inhibitor on hydrate blockage formation during cold restart operation. Chem. Eng. Sci. 2017, 168, 444–455. [Google Scholar] [CrossRef]
  14. Yan, C.L.; Li, Y.; Cheng, Y.F.; Wang, W.; Song, B.J.; Deng, F.C.; Feng, Y.C. Sand production evaluation during gas production from natural gas hydrates. J. Nat. Gas Sci. Eng. 2018, 57, 77–88. [Google Scholar] [CrossRef]
  15. Makogon, T. Chapter 5—Flow restrictions and blockages in operations. In Handbook of Multiphase Flow Assurance; Makogon, T.Y., Ed.; Gulf Professional Publishing: Oxford, UK, 2019; pp. 95–189. [Google Scholar]
  16. Nasir, Q.; Suleman, H.; Elsheikh, Y.A. A review on the role and impact of various additives as promoters/inhibitors for gas hydrate formation. J. Nat. Gas Sci. Eng. 2020, 76, 24. [Google Scholar] [CrossRef]
  17. Chong, Z.R.; Chan, A.H.M.; Babu, P.; Yang, M.J.; Linga, P. Effect of NaCl on methane hydrate formation and dissociation in porous media. J. Nat. Gas Sci. Eng. 2015, 27, 178–189. [Google Scholar] [CrossRef]
  18. Cha, M.J.; Hu, Y.; Sum, A.K. Methane hydrate phase equilibria for systems containing NaCl, KCl, and NH4Cl. Fluid Phase Equilib 2016, 413, 2–9. [Google Scholar] [CrossRef]
  19. Mekala, P.; Busch, M.; Mech, D.; Patel, R.S.; Sangwai, J.S. Effect of silica sand size on the formation kinetics of CO2 hydrate in porous media in the presence of pure water and seawater relevant for CO2 sequestration. J. Pet. Sci. Eng. 2014, 122, 1–9. [Google Scholar] [CrossRef]
  20. Cha, M.; Shin, K.; Kim, J.; Chang, D.; Seo, Y.; Lee, H.; Kang, S.P. Thermodynamic and kinetic hydrate inhibition performance of aqueous ethylene glycol solutions for natural gas. Chem. Eng. Sci. 2013, 99, 184–190. [Google Scholar] [CrossRef]
  21. Creek, J.L.; Subramanian, S.; Estanga, D.A. New method for managing hydrates in deepwater tiebacks. In Proceedings of the Offshore Technology Conference, Houston, TX, USA, 2–5 May 2011; p. OTC–22017-MS. [Google Scholar]
  22. Ke, W.; Chen, D. A short review on natural gas hydrate, kinetic hydrate inhibitors and inhibitor synergists. Chin. J. Chem. Eng. 2019, 27, 2049–2061. [Google Scholar] [CrossRef]
  23. Yang, C.F.; Ke, W.; Zhao, C.; Chen, D.Y. Experimental Evaluation of Kinetic Hydrate Inhibitors and Mixed Formulations with Monoethylene Glycol for Hydrate Prevention in Pure Water and Brine-Oil Systems. Energy Fuels 2020, 34, 12274–12290. [Google Scholar] [CrossRef]
  24. Kwak, G.H.; Lee, K.H.; Hong, S.Y.; Seo, S.D.; Lee, J.D.; Lee, B.R.; Sum, A.K. Phase Behavior and Raman Spectroscopic Analysis for CH4 and CH4/C3H8 Hydrates Formed from NaCl Brine and Monoethylene Glycol Mixtures. J. Chem. Eng. Data 2018, 63, 2179–2184. [Google Scholar] [CrossRef]
  25. Eichholz, C.; Majumdar, A.; Clarke, M.; Oellrich, L.; Bishnoi, P. Experimental investigation and calculation of methane hydrate formation conditions in the presence of ethylene glycol and sodium chloride. J. Chem. Eng. Data 2004, 49, 847–851. [Google Scholar] [CrossRef]
  26. Jager, M.; Peters, C.; Sloan, E. Experimental determination of methane hydrate stability in methanol and electrolyte solutions. Fluid Phase Equilib. 2002, 193, 17–28. [Google Scholar] [CrossRef]
  27. Kim, H.; Park, J.; Seo, Y.; Ko, M. Hydrate risk management with aqueous ethylene glycol and electrolyte solutions in thermodynamically under-inhibition condition. Chem. Eng. Sci. 2017, 158, 172–180. [Google Scholar] [CrossRef]
  28. Bai, J.; Gu, J.; Wang, D.; Shang, L.; Lv, Z.; Zhai, J. Effects of Low Concentrations of NaCl and EG on Hydrate Formation Kinetics and Morphology in the Presence of SDS. Energy Fuels 2022, 36, 11873–11887. [Google Scholar] [CrossRef]
  29. Jinhao, S.; Zhi, W.; Xuanji, L.; Xuanwei, Z.; Yumo, Z.; Shangfei, S.; Bohui, S.; Jing, G.; Xia, L. Paired KHI-MEG for synergistic inhibition of methane hydrate reformation. Chem. Ind. Eng. Prog. 2022, 41, 5373–5380. [Google Scholar] [CrossRef]
  30. Xin, Z.; Zhengsong, Q.; Weian, H.; Guowei, Z.; Yongjun, Z. Inhibition mechanism and optimized design of thermodynamic gas hydrate inhibitors. Acta Pet. Sin. 2015, 36, 760–766. [Google Scholar] [CrossRef]
  31. Sun, Z.-G.; Fan, S.-S.; Shi, L.; Guo, Y.-K.; Guo, K.-H. Equilibrium conditions hydrate dissociation for a ternary mixture of methane, ethane, and propane in aqueous solutions of ethylene glycol and electrolytes. J. Chem. Eng. Data 2001, 46, 927–929. [Google Scholar] [CrossRef]
  32. Liu, C.; Ye, Y.; Meng, Q.; He, X.; Lu, H.; Zhang, J.; Liu, J.; Yang, S. The Characteristics of Gas Hydrates Recovered from Shenhu Area in the South China Sea. Mar. Geol. 2012, 307–310, 22–27. [Google Scholar] [CrossRef]
  33. Yujing, J.; Peng, Y.; Hengjie, L.; Lianjun, C.; Genrong, D. Development of multi-dimensional production simulation test system for natural gas hydrate and its primary application. Rock Soil Mech. 2022, 43, 286–298. [Google Scholar] [CrossRef]
  34. Yan, P.; Luan, H.; Jiang, Y.; Liang, W.; Liu, M.; Chen, H. Influence of depressurization mode on natural gas hydrate production characteristics: One-dimensional experimental study. Geoenergy Sci. Eng. 2024, 234, 212671. [Google Scholar] [CrossRef]
  35. You, K.H.; Kneafsey, T.J.; Flemings, P.B.; Polito, P.; Bryant, S.L. Salinity-buffered methane hydrate formation and dissociation in gas-rich systems. J. Geophys. Res. Solid Earth 2015, 120, 643–661. [Google Scholar] [CrossRef]
  36. Lee, J.W.; Kang, S.P. Phase Equilibria of Natural Gas Hydrates in the Presence of Methanol, Ethylene Glycol, and NaCl Aqueous Solutions. Ind. Eng. Chem. Res. 2011, 50, 8750–8755. [Google Scholar] [CrossRef]
  37. Jiang, Y.J.; Gong, B.; Wang, G. Introduction of Methane Hydrate Production in Deep Sea; Science Press: Beijing, China, 2017. [Google Scholar]
  38. Smith, J.M. Introduction to chemical engineering thermodynamics. J. Chem. Educ. 1950, 27, 96. [Google Scholar] [CrossRef]
  39. Chong, Z.R.; Koh, J.W.; Linga, P. Effect of KCl and MgCl2 on the kinetics of methane hydrate formation and dissociation in sandy sediments. Energy 2017, 137, 518–529. [Google Scholar] [CrossRef]
  40. Uchida, T.; Hirano, T.; Ebinuma, T.; Narita, H.; Gohara, K.; Mae, S.; Matsumoto, R. Raman spectroscopic determination of hydration number of methane hydrates. AIChE J. 1999, 45, 2641–2645. [Google Scholar] [CrossRef]
  41. Tulk, C.; Ripmeester, J.; Klug, D. The application of Raman spectroscopy to the study of gas hydrates. Ann. N. Y. Acad. Sci. 2000, 912, 859–872. [Google Scholar] [CrossRef]
  42. Englezos, P. Clathrate hydrates. Ind. Eng. Chem. Res. 1993, 32, 1251–1274. [Google Scholar] [CrossRef]
  43. Yang, S.H.B.; Babu, P.; Chua, S.F.S.; Linga, P. Carbon dioxide hydrate kinetics in porous media with and without salts. Appl. Energy 2016, 162, 1131–1140. [Google Scholar] [CrossRef]
  44. Dholabhai, P.D.; Parent, J.S.; Bishnoi, P.R. Equilibrium conditions for hydrate formation from binary mixtures of methane and carbon dioxide in the presence of electrolytes, methanol and ethylene glycol. Fluid Phase Equilib. 1997, 141, 235–246. [Google Scholar] [CrossRef]
  45. Qi, Y.; Wu, W.; Liu, Y.; Xie, Y.; Chen, X. The influence of NaCl ions on hydrate structure and thermodynamic equilibrium conditions of gas hydrates. Fluid Phase Equilib. 2012, 325, 6–10. [Google Scholar] [CrossRef]
  46. Sun, S.-C.; Kong, Y.-Y.; Zhang, Y.; Liu, C.-L. Phase equilibrium of methane hydrate in silica sand containing chloride salt solution. J. Chem. Thermodyn. 2015, 90, 116–121. [Google Scholar] [CrossRef]
  47. Zhao, X.; Qiu, Z.; Zhang, Z.; Zhang, Y. Relationship between the gas hydrate suppression temperature and water activity in the presence of thermodynamic hydrate inhibitor. Fuel 2020, 264, 116776. [Google Scholar] [CrossRef]
  48. Lim, V.W.S.; Metaxas, P.J.; Johns, M.L.; Aman, Z.M.; May, E.F. The impact of mono-ethylene glycol and kinetic inhibitors on methane hydrate formation. Chem. Eng. J. 2022, 427, 131531. [Google Scholar] [CrossRef]
Figure 1. Schematic diagram of the one-dimensional exploitation simulation test apparatus for natural gas hydrate.
Energies 17 02078 g001
Figure 2. Reactor and temperature control system. (a) One-dimensional reactor. (b) High and low temperature thermostatic chamber.
Energies 17 02078 g002
Figure 3. Quartz sand specimen and reservoir preparation instruments. (a) Weighing instruments. (b) Sampling instruments. (c) Quartz sand.
Energies 17 02078 g003
Figure 4. Temperature, pressure, and standardized gas consumption variation curves and Englezos’ [42] theoretical pressure curve for nucleation. (a) Temperature–pressure curve. (b) Englezos’ theoretical pressure curve for nucleation.
Energies 17 02078 g004
Figure 5. Hydrate synthesis curves at different concentrations of NaCl solution. (a) Temperature–pressure curves for hydrate synthesis. (b) Normalized gas consumption for hydrate synthesis.
Energies 17 02078 g005
Figure 6. Hydrate synthesis curves with different ratios of EG solutions. (a) Temperature–pressure curves for hydrate synthesis. (b) Normalized gas consumption curves for hydrate synthesis.
Energies 17 02078 g006
Figure 7. Trend of temperature and pressure changes under hybrid inhibitor conditions. (a) Temperature–pressure curves for hydrate synthesis in Tests 2, 8, 9, and 10. (b) Temperature–pressure curves for hydrate synthesis in Tests 3, 11, 12, and 13. (c) Temperature–pressure curves for hydrate synthesis in Tests 4, 14, 15, and 16. (d) Temperature–pressure curves for hydrate synthesis in Tests 7, 10, 13, and 16. (e) Temperature–pressure curves for hydrate synthesis in Tests 6, 9, 12, and 15. (f) Temperature–pressure curves for hydrate synthesis in Tests 5, 8, 11, and 14.
Energies 17 02078 g007
Figure 8. Gas–water two-phase conversion ratio. (a) Water conversion rate. (b) Methane conversion rate.
Energies 17 02078 g008
Figure 9. Amount of methane consumed in each set of experiments.
Energies 17 02078 g009
Figure 10. Volume of synthesized hydrate.
Energies 17 02078 g010
Table 1. Indicators related to experimental materials.
Material NameParametersSource
Quartz sandGrain size, 15–53 μmOceanic quartz sand factory, Zhengzhou, China
Deionized waterConductivity, 0.5 mS/mLaboratory configuration
Methane gas99.9% purityQingdao Lu Dong gas Co., Qingdao, China
EG99.9% purity, freezing point −25 °CSinopharm chemical reagent Co., Qingdao, China
NaCl99.9% puritySinopharm chemical reagent Co., Qingdao, China
Table 2. Experimental conditions.
Type of Chemical ReagentExperimental GroupingMass Fraction of NaCl and Mass Ratio of the Water–AlcoholInitial Temperature (K)Initial Pressure (MPa)
H2OTest 1-H100%298.15 K10 MPa
NaClTest 2-N 1.5 wt%1.5 wt%
Test 3-N 2.65 wt%2.65 wt%
Test 4-N 3.5 wt%3.5 wt%
EGTest 5-H3E1H2O:EG = 3:1
Test 6-H5E1H2O:EG = 5:1
Test 7-H7E1H2O:EG = 7:1
NaCl + EGTest 8-N1.5-H3E1NaCl 1.5 wt% + (H2O:EG = 3:1)
Test 9-N1.5-H5E1NaCl 1.5 wt% + (H2O:EG = 5:1)
Test 10-N1.5-H7E1NaCl 1.5 wt% + (H2O:EG = 7:1)
Test 11-N2.65-H3E1NaCl 2.65 wt% + (H2O:EG = 3:1)
Test 12-N2.65-H5E1NaCl 2.65 wt% + (H2O:EG = 5:1)
Test 13-N2.65-H7E1NaCl 2.65 wt% + (H2O:EG = 7:1)
Test 14-N3.5-H3E1NaCl 3.5 wt% + (H2O:EG = 3:1)
Test 15-N3.5-H5E1NaCl 3.5 wt% + (H2O:EG = 5:1)
Test 16-N3.5-H7E1NaCl 3.5 wt% + (H2O:EG = 7:1)
Note: Experimental groups consisting of only NaCl solutions are denoted by a capital N—for example, N1.5 represents a 1.5 wt% NaCl solution. Experimental groups consisting of only EG solutions are differentiated by their water–alcohol mass ratio. For instance, H3E1 denotes a water–alcohol mass ratio of 3:1. Mixed inhibitors are abbreviated based on the nomenclature of a single inhibitor.
Table 3. Calculated data table for each parameter of the experiment.
Type of Chemical ReagentStabilizing Pressure (MPa)Amplitude of Warming (K) Δ n H , t ( m o l ) N G t C W H ( % ) V h (cm3) C C H 4 ( % )
Test 1-H1.463.62.790.1795.02354.6066.93
Test 2-N1.5 wt%4.543.32.310.1483.19293.8255.46
Test 3-N2.65 wt%5.152.72.030.1274.35258.0448.71
Test 4-N3.5 wt%5.242.61.990.1271.65252.8247.72
Test 5-H3E16.021.91.600.1058.61203.4238.39
Test 6-H5E15.142.72.030.1274.35258.0447.71
Test 7-H7E14.853.12.170.1379.46275.6452.05
Test 8-N1.5-H3E16.281.61.490.0954.41188.8235.64
Test 9-N1.5-H5E16.291.61.470.0953.68186.3035.16
Test 10-N1.5-H7E14.973.02.110.1377.46268.8550.74
Test 11-N2.65-H3E16.351.51.450.0953.13184.4034.81
Test 12-N2.65-H5E15.372.51.930.1270.56244.8746.22
Test 13-N2.65-H7E15.242.61.990.1272.80252.6747.69
Test 14-N3.5-H3E1-------
Test 15-N3.5-H5E16.011.91.620.1059.28203.4238.83
Test 16-N3.5-H7E15.372.51.930.1270.56244.2746.22
Disclaimer/Publisher’s Note: The statements, opinions and data contained in all publications are solely those of the individual author(s) and contributor(s) and not of MDPI and/or the editor(s). MDPI and/or the editor(s) disclaim responsibility for any injury to people or property resulting from any ideas, methods, instructions or products referred to in the content.

