Article

Diminishing Performance of Pt/CNT in Ethanol Oxidation after High-Potential Scanning

1
Laboratory of Advanced Energy Systems, CAS Key Laboratory of Renewable Energy, Guangzhou Institute of Energy Conversion, Chinese Academy of Sciences (CAS), Guangzhou 510640, China
2
Guangdong Provincial Key Laboratory of Terahertz Quantum Electromagnetics, GBA Branch of Aerospace Information Research Institute, Chinese Academy of Sciences (CAS), Guangzhou 510700, China
*
Authors to whom correspondence should be addressed.
Energies 2024, 17(9), 2122; https://doi.org/10.3390/en17092122
Submission received: 1 April 2024 / Revised: 26 April 2024 / Accepted: 28 April 2024 / Published: 29 April 2024
(This article belongs to the Section I3: Energy Chemistry)

Abstract

:
Regenerative fuel cells and the phenomenon of cell reversal (CR) necessitate creating robust catalyst layers for consistent performance in fuel cells. This research used in situ Raman spectroscopy to observe molecular alterations on carbon nanotube-supported platinum catalysts (Pt/CNT) during ethanol oxidation. Following a CR event simulation, the ethanol oxidation efficiency on Pt/CNT was amplified 2.8 times after high-potential scanning but reverted to its initial efficiency after 100 cycles. The adsorbed *CO2 species on Pt/CNT was pivotal for initiating ethanol oxidation, with the rate assessed through Raman analysis. In addition to water electrolysis, the carbon substrate was degraded. This study sheds light on the mechanisms behind catalyst degradation, steering the creation of more advanced catalysts.

1. Introduction

The polymer electrolyte membrane fuel cell (PEMFC) has emerged as a prominent contender in sustainable energy solutions for future modes of transportation, owing to its superior energy density, high efficiency in energy conversion, and zero-emission characteristics [1,2,3]. Despite these advantages, the full potential of PEMFCs is hindered by complex challenges within the catalyst layer, which pose significant barriers to the widespread adoption of fuel cell electric vehicles [3,4,5,6]. This introduction sets the stage for a deeper examination of these issues and the exploration of innovative solutions.
At the core of the operational limitations of PEMFCs is the occurrence of cell reversal (CR) incidents, which severely compromise the integrity and longevity of the fuel cells [7,8,9,10,11,12,13]. These incidents result in the oxidation of the carbon support at the anode, precipitating a destructive cycle that accelerates the degradation of the membrane electrode assembly (MEA) [12,14,15,16]. Understanding the underlying mechanisms of catalyst degradation during and after CR events is crucial for developing strategies to mitigate these effects and enhance cell durability.
Additionally, the unitized regenerative fuel cell (URFC) [17,18,19,20] represents a significant advancement by combining the functions of both an electrolyzer and fuel cell, thus supporting a variety of reactions, such as the hydrogen evolution reaction (HER) and oxygen evolution reaction (OER) during water electrolysis, and hydrogen oxidation reaction (HOR) and oxygen reduction reaction (ORR) during fuel cell operation. Consequently, the electrode material for a URFC must exhibit a dual functionality, effectively serving as both a hydrogen and an oxygen catalyst. Notably, the ORR and OER processes exhibit comparatively sluggish kinetics compared to HER and HOR, thus presenting a substantial challenge in developing efficient dual-function oxygen catalysts [16,20,21,22,23,24].
The quest for optimal catalyst support materials is crucial in addressing the efficiency and stability of both PEMFCs and URFCs [22,25,26,27]. In the realm of nanoparticles, particularly those with ultrafine sizes, the high surface energy tends to lead to rapid aggregation, which negatively impacts the durability of electrocatalysts. Thus, an ideal catalyst support should provide a substantial surface area for effective catalyst immobilization and exhibit high electrical conductivity to facilitate the transport of electrons and reactants [28,29,30,31,32]. For instance, Ramachandran et al. [33] illustrated that chemical strategies using ultrafine-sized PtCu/NrGO nanocomposites yield superior electrocatalytic activity for alcohol reactions. Similarly, Raj Kumar et al. [34] developed an rGO/Pt–Pd composite, noted for its efficacy as an electrocatalyst in ethylene glycol (EG) oxidation, underscored by enhanced mass activity. Attributes, such as high electrical conductivity, extensive surface area, and chemical stability, are critical; they promote the dispersion of catalyst nanoparticles and aid in electron and fuel transport. Our research primarily focuses on carbon-based nanomaterials, like carbon black, graphene, and notably carbon nanotubes (CNTs), which are preferred for their unique structural and conductive properties [35,36,37,38,39]. Specifically, this study centers on carbon nanotubes as a primary research subject due to their promising characteristics.
Incorporating advanced characterization techniques, such as Raman spectroscopy, we aim to deepen our understanding of molecular structures and catalytic behaviors under operational conditions. The use of in situ electrochemical Raman spectroscopy, in particular, allows for real-time analysis of the degradation dynamics of Pt/CNT catalysts and offers a unique perspective on the catalytic performance during reverse electrode events [40,41,42,43,44,45]. By employing a specialized Raman cell, the utilization of in situ electrochemical Raman spectroscopy offers an illuminating view into the catalytic performance of Pt/CNT electrocatalysts. In this endeavor, we emulate the degradation dynamics of Pt/CNT catalysts before and after reverse electrode events, utilizing the alcohol oxidation reaction in an alkaline medium as our testing ground, like in our previous work [46].
In summary, our research meticulously deciphers the shifts in catalytic activity of Pt/CNT catalysts due to battery reverse polarity. These insights will play a pivotal role in advancing robust electrocatalysts for regenerative fuel cells, thereby laying a strong foundation for augmenting the applicability of Pt/CNT electrocatalysts in the realm of sustainable energy systems. Through addressing these challenges and exploring innovative material solutions, we contribute to the broader goal of achieving sustainable and efficient energy conversion technologies that are crucial for the future of transportation and beyond.

2. Experimental Section

The fabrication of the electrocatalyst was carried out by synthesizing platinum supported on carbon nanotubes (50 mg). This process involved reducing a solution of H2PtCl6·xH2O (2.55 mL, 0.1 M) with an excess of sodium borohydride (NaBH4, 1.0 M) to achieve a platinum loading of 20 wt%. Precise control was exercised to deposit Pt/CNT at a rate of 20 µg cm−2 on carbon rod working electrodes.
The structure of the electrocatalysts was examined using field-emission scanning electron microscopy (FEI Quanta FEG 250, Hitachi SU-70, Tokyo, Japan). Electrochemical properties were assessed using a three-electrode setup in an electrolytic cell, utilizing a CHI660E electrochemical workstation (CHI660E, Shanghai Chenhua Instrument Co., Shanghai, China). In this arrangement, platinum foil (3.0 cm2) and Hg/HgO (1.0 M KOH) were used as counter- and reference electrodes, respectively. The electrolyte consisted of a 1.0 M KOH solution with the addition of 1.0 M ethanol, to aid in the ethanol oxidation reactions.
Raman spectroscopic analysis was conducted using a confocal Raman system (RTS-mini, Zolix, Beijing, China) equipped with a 532 nm continuous wave laser, delivering approximately 5 mW of power. A 50× microscope objective (M Plan Apo50×, Mitutoyo Co., Kawasaki, Japan) was used for focusing. Calibration of Raman shift was consistently performed using a silicon wafer for each set of measurements.
In situ electrochemical Raman spectra analysis was carried out in a specially designed Raman cell. This setup included a Hg/HgO reference electrode, a platinum wire counter electrode, and a specially designed working electrode consisting of a 0.3 cm2 glassy carbon (GC) electrode loaded with Pt catalyst (20 µg cm−2). The electrode potentials were controlled by an electrochemical workstation (CHI660E, Shanghai Chenhua Instrument Co., China). Spectra were captured with an exposure time of 5 s to optimize the signal-to-noise ratio. Cyclic voltammetry (CV) was performed at a scanning rate of 5 mV/s, with sampling intervals set at 50 or 100 mV per spectrum. For dynamic studies, potentials were maintained at −0.8 or 0.3 V for 100 s, during which Raman spectra were recorded at 2 s/spectrum. All potential measurements were standardized against Hg/HgO unless specified otherwise.

3. Findings and Analysis

3.1. Electrochemical Behavior of Pt/CNT Catalysts

Figure 1a presents the study of the electrochemical specific area (ECSA) of as-prepared Pt/CNT in a 1.0 M KOH aqueous solution, analyzed through cyclic voltammetry (CV) curves. These curves exhibit several dominant peaks, categorizable into three distinct regions: the underpotentially deposited hydrogen (Hupd) region, the double layer region, and the Pt-OHad region [47]. The Hupd region is particularly critical for evaluating the ECSA of Pt-based electrocatalysts due to Pt’s active response to hydrogen, unlike the inert carbon substrate. The ECSA is calculated using the following formula [48]:
E C S A = Q m Q H
where Qm is the integral area of the Hupd region and QH (=0.21 mC cm−2) is the charge density of the monolayer hydrogen adsorption on the Pt surface. Figure 1b,c illustrate that the as-prepared Pt/CNT features a more pronounced H-deposited peak, with an ECSA of 19.65, surpassing the ECSA of commercial Pt/C catalysts, which stands at 14.51. This indicates that the as-prepared Pt/CNT catalyst exposes more active sites to the electrolyte, potentially enhancing catalytic performance.
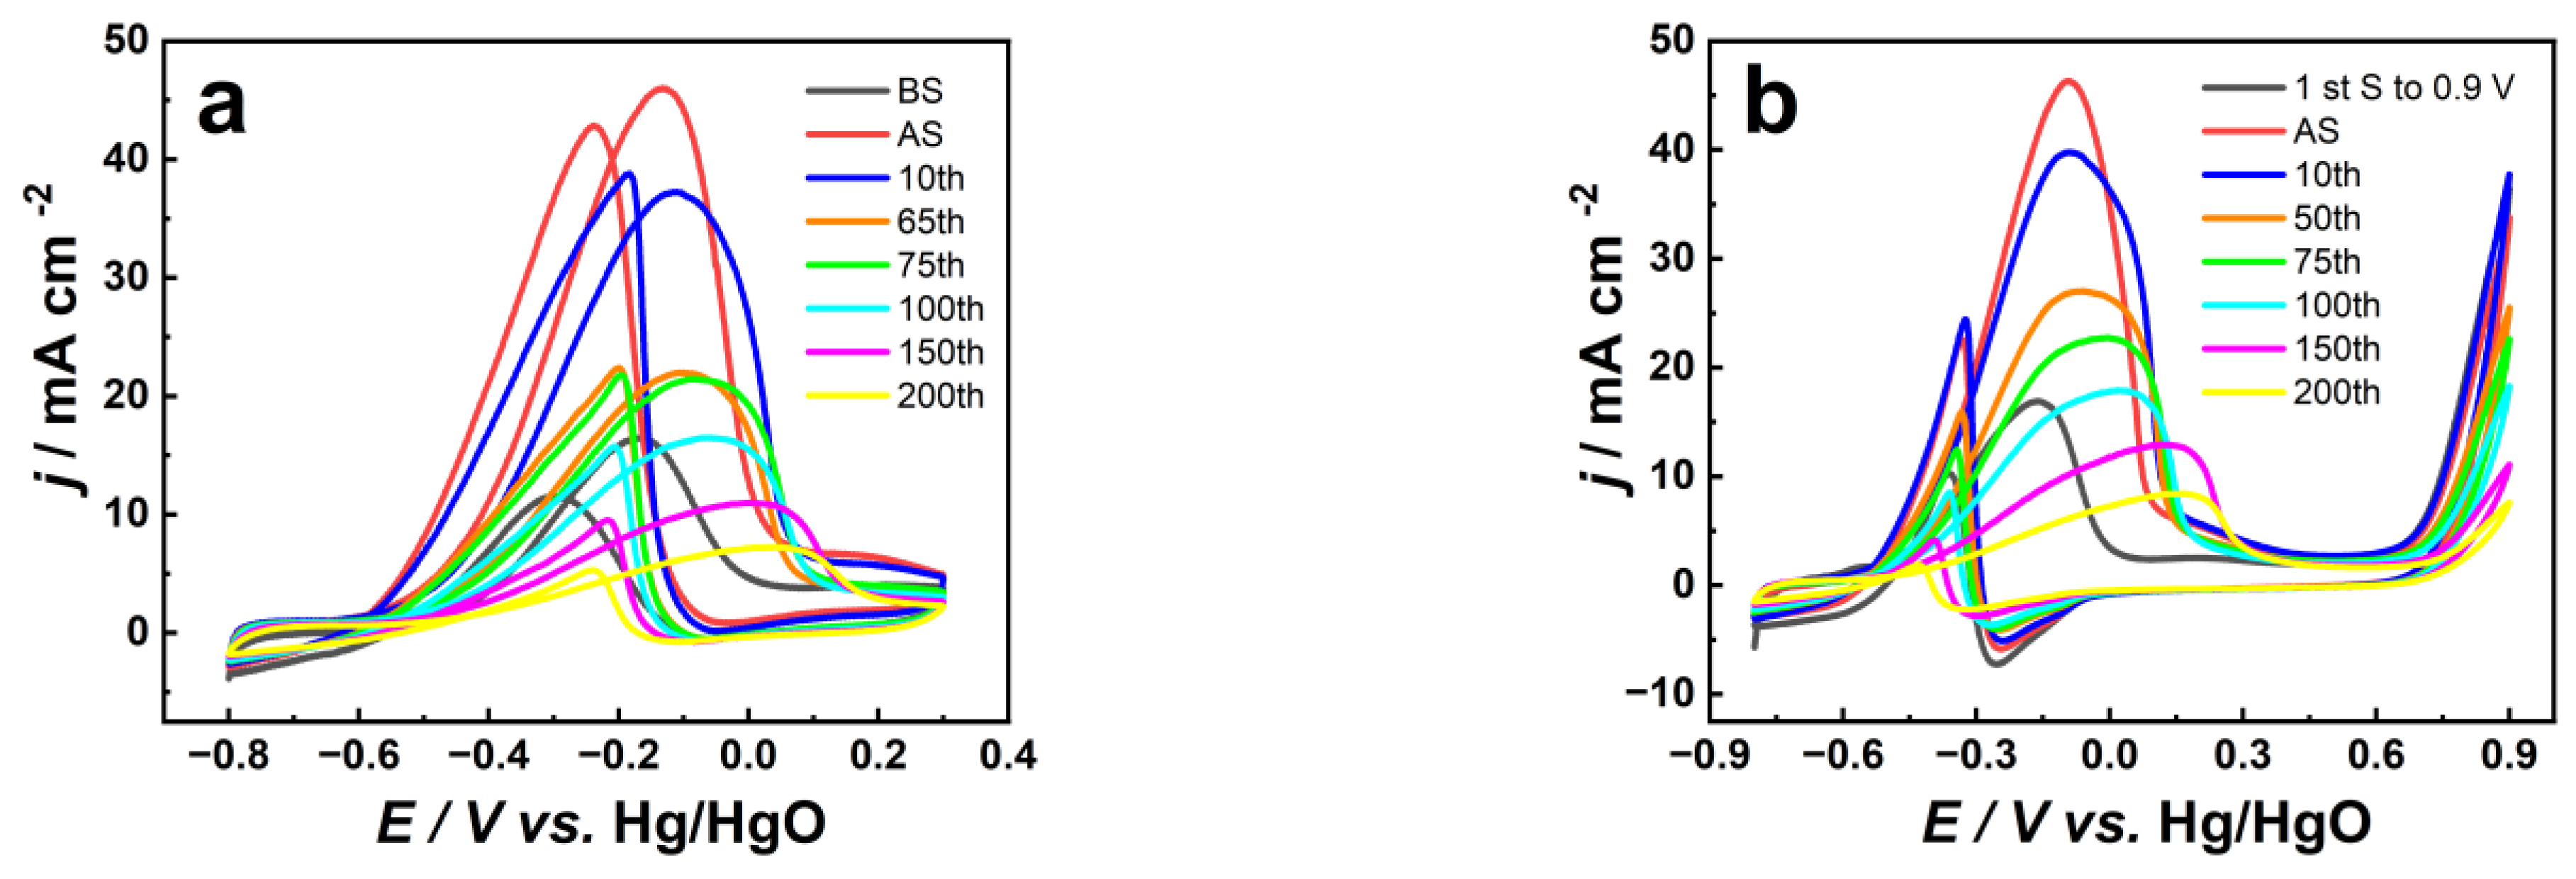
The cyclic voltammogram shown in Figure 2a illustrates the oxidation of ethanol at the Pt/CNT electrode over a scanning range of −0.8 V to 0.3 V (vs. Hg/HgO) across various cycle numbers. The figure clearly indicates that, after high-potential scanning (−0.8 V to 0.9 V), the peak current density of ethanol oxidation more than doubles. However, it declines quickly as the cycle number increases. The onset potential initially moves negatively but consistently shifts positively with more cycles. By the 100th cycle, while the peak current density remains nearly constant, the onset potential has moved positively, and the peak shape has broadened considerably. In contrast, Figure 2b displays the ethanol oxidation over a broader scanning range of −0.8 V to 0.9 V (vs. Hg/HgO) across different cycle numbers. Within the −0.8 V to 0.3 V range, the trends in peak current density and onset potential in Figure 2b align closely with those in Figure 2a. However, it is notable that the optimal cycle number for the water electrolysis reaction around 0.8 V is the tenth cycle, not the first. With increasing cycles, the water electrolysis reaction performance on Pt/CNT also declines sharply.
By integrating the information from Figure 2a,b, we understand that high-potential scanning significantly promotes ethanol oxidation on Pt/CNT catalysts in an alkaline environment. However, this enhancement is not stable, especially after the 100th cycle, where the catalytic activity of ethanol decreases rapidly until it becomes inactive.
To enhance our comprehension of the variations in ethanol oxidation efficiency on Pt/CNT, we detailed the association between the maximum current density of ethanol oxidation, its percentage compared to the peak current density without high-potential scanning, and the number of cycles, as depicted in Figure 3.
Clearly, high-potential scanning can increase the maximum current density from 16.39 mA cm−2 to 45.87 mA cm−2. When cycled to the 109th cycle, the peak current density drops to 95%, and it drops to 80% at 126th cycle. The inset in Figure 3a shows that the ethanol oxidation enhancement due to high-potential scanning on Pt/C and Pt/CNT electrodes is 1.4 times and 2.8 times, respectively. Meanwhile, as seen in Figure 3b, relative to the original peak current density of 16.39 mA cm−2, the peak current density after high-potential scanning increases to 280% of the original, and then drops to 100% of the original after 100th cycle. For the ethanol oxidation portion of the high-potential scanning curve, the maximum current density drops to the original 100% when cycled to the 110th cycle. Additionally, as the number of cycles grows, the peak current density experiences a greater decline under low-potential scanning compared to that under high-potential scanning, indicating that the catalytic oxidation performance of ethanol in the cyclic voltammetry scanning at low potential immediately after high-potential scanning is deteriorating faster. The inset of Figure 3b more clearly shows the performance changes in ethanol oxidation after low-potential scanning and high-potential scanning.
To evaluate the enduring reliability of the Pt/CNT catalysts, we analyzed the time-based potential curves of Pt/CNT at an elevated current density of 5 mA cm−2 after varying cycle counts of ethanol oxidation. From Figure 4a, we observed that after high-potential scans, the chronopotentiometric curve shows a noticeable negative shift, remaining at around −0.3 V for the examined duration of 300 s. In contrast, the curve without high-potential scans indicates electrode potential stability only within 150 s. However, when the cycle number reaches 65, the stability of Pt/CNT becomes worse than the electrode performance without high-potential scanning.
Figure 4b presents the chronopotentiometric curves after high-potential cyclic voltammetry scans. Interestingly, chronopotentiometric curves taken after different scanning ranges displayed varied results. There was minimal change in the curve post-high-potential scans, with a noticeable positive shift only after 25th cycle. Significant oscillations in the curve appear only after 75th cycle, and the maintained duration drops significantly below 150 s after the 150th cycle. While the initial chronopotentiometric curve post-high-potential scanning showed clear improvement, as the cycle number increased, the curve quality gradually deteriorated, aligning with the curve without high-potential scanning, and then further degraded until the activity was lost.
In summarizing the findings of our electrochemical study, we have observed that water electrolysis on Pt/CNT catalysts not only fails to impede the short-term oxidation performance of ethanol but also notably enhances its efficiency. Nonetheless, long-term stability remains less than optimal. Examination of the galvanostatic test results reveals that significant large-scale oscillations occur in the curve only after scanning to high potentials, primarily attributed to the accumulation of bubbles on the electrode surface rather than poisoning by CO adsorbed substances. However, all curves display minor fluctuations, indicating the presence of poisoning by CO-type adsorbed species. Remarkably, high-potential scanning does not compromise the durability of the electrode; instead, it augments it compared to low-potential scanning.

3.2. Characteristics of Pt/CNT Catalysts

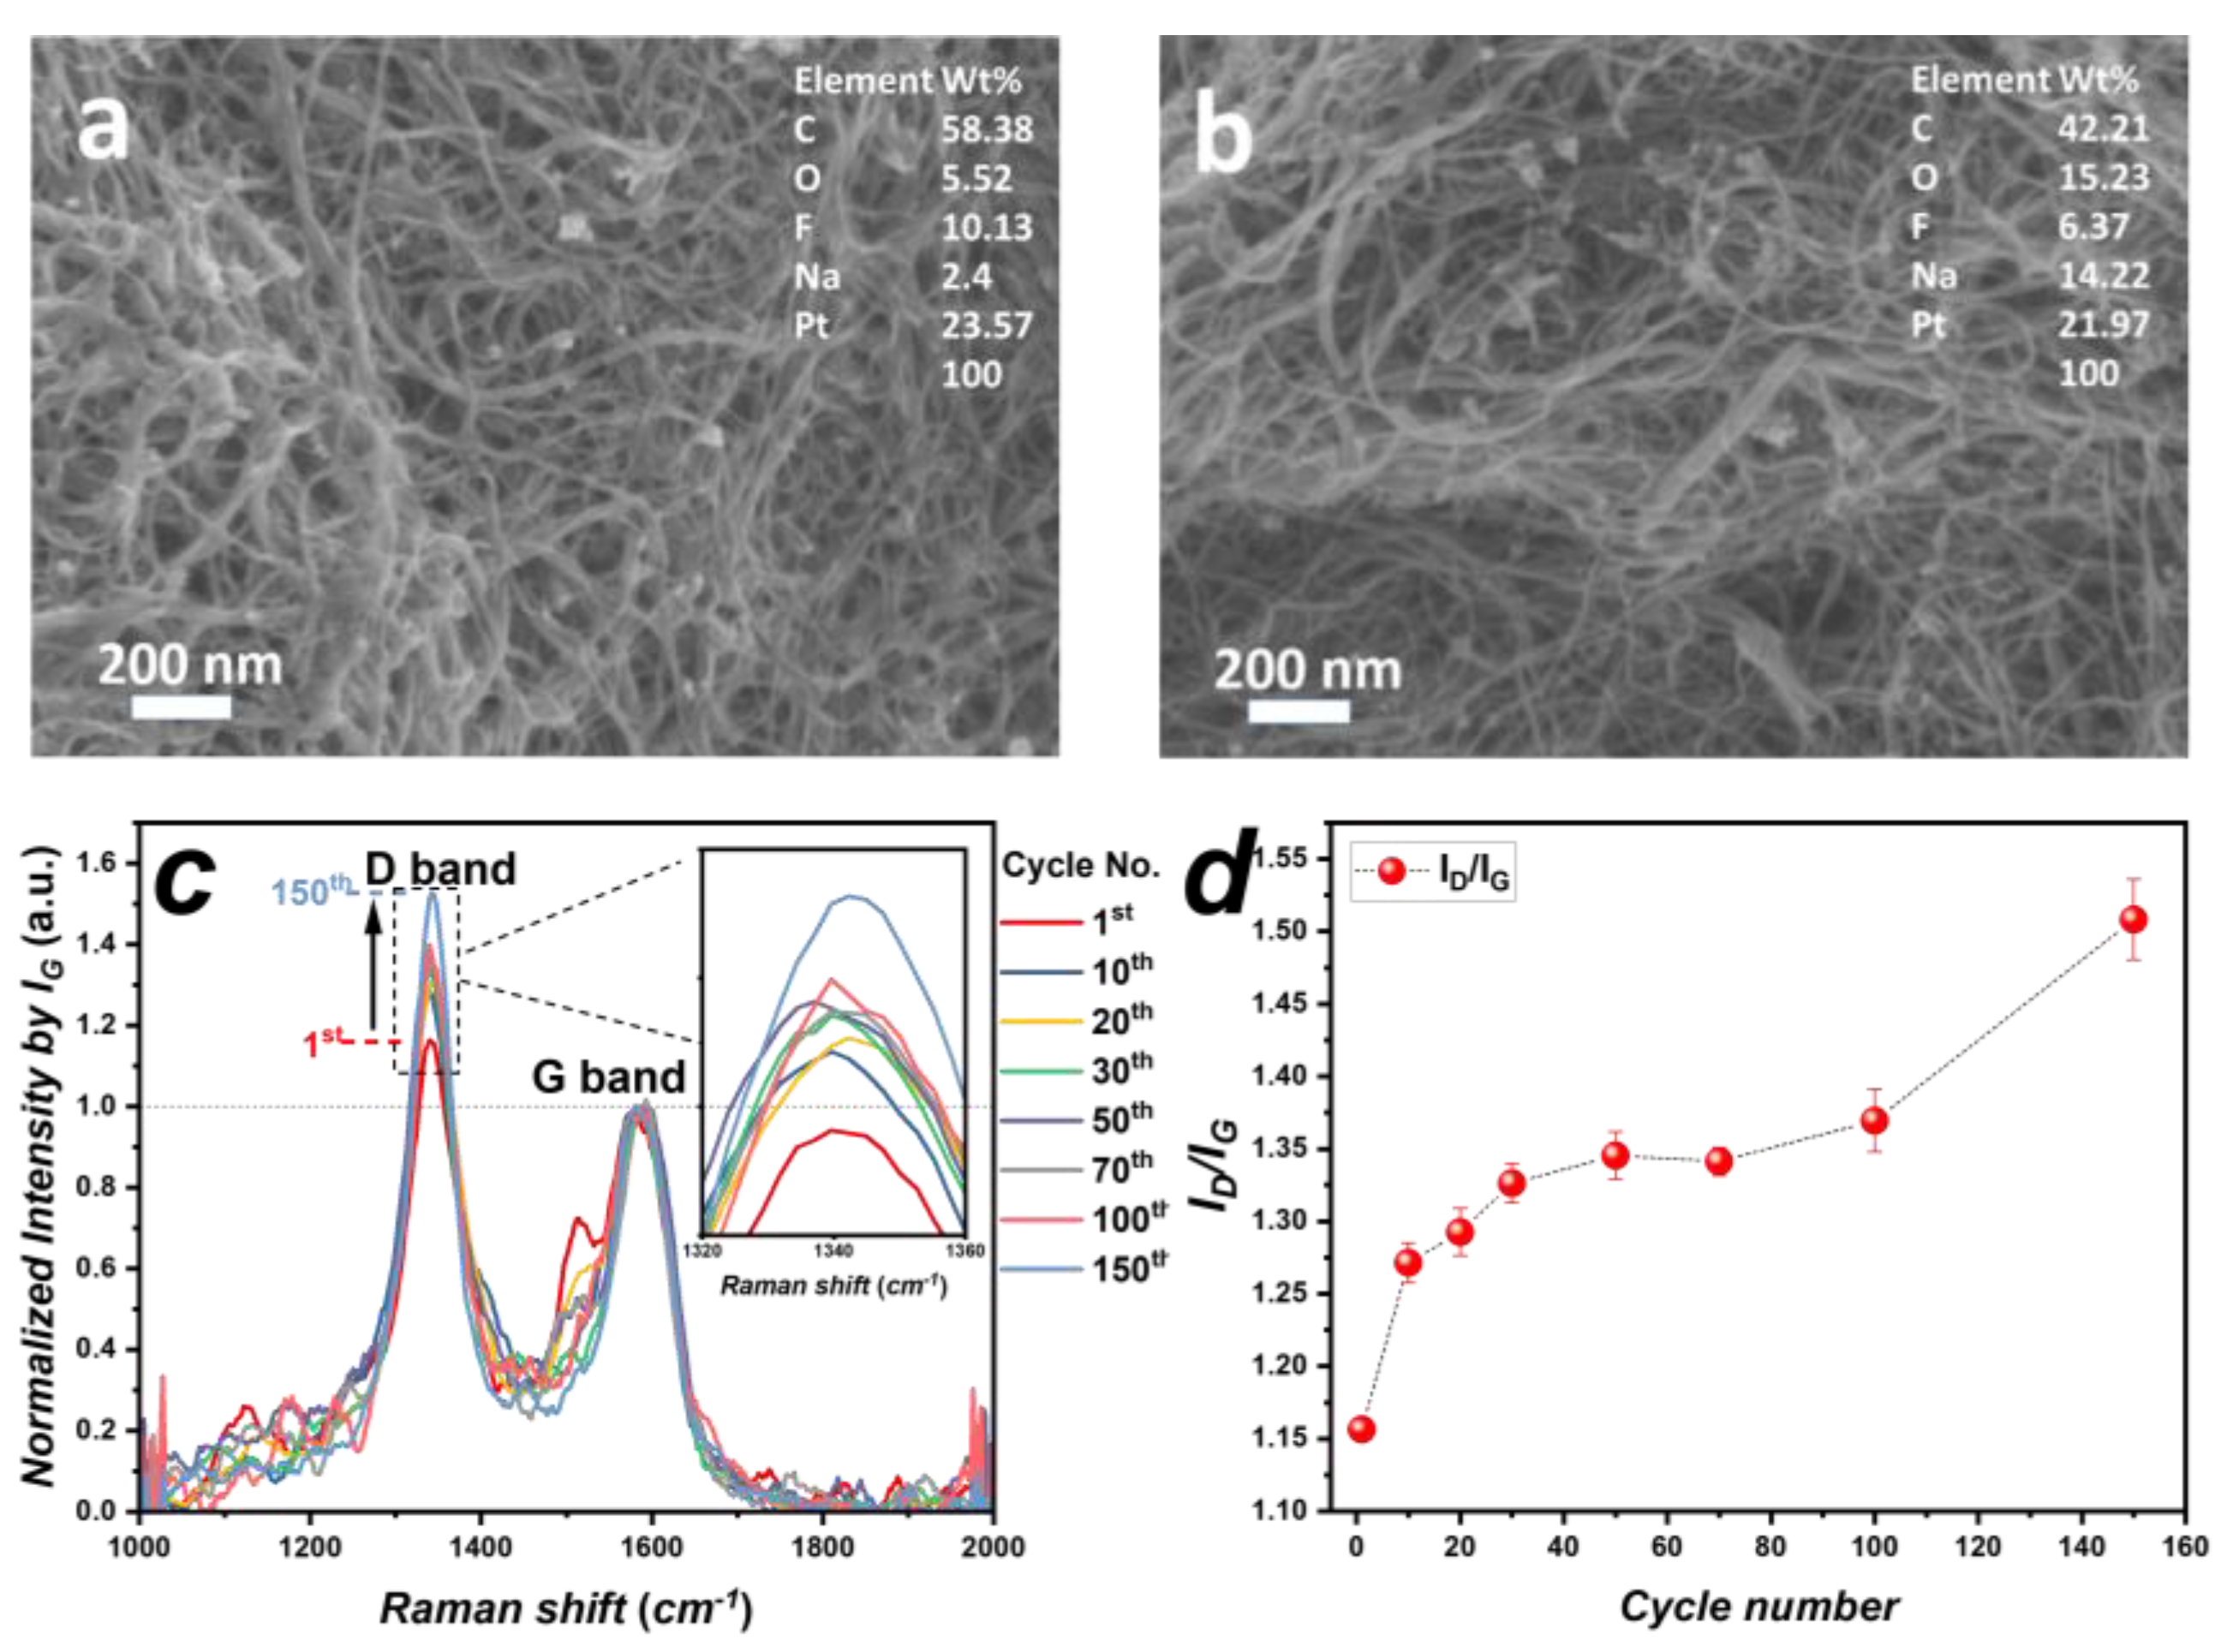
Figure 5 presents the SEM images and the corresponding energy spectrum analysis results of the electrode material before and after electrochemical tests (400 cycles; the catalyst has been deactivated). It is evident that the morphology of the electrode material remains largely unchanged before and after the electrochemical tests, indicating a lack of observable precious metal aggregation or detachment. However, the elemental analysis results indicate a slight decrease in the relative content of the precious metals, with the relative content of platinum decreasing from 28.7% before the test to 34.2% after the test, while the overall relative content of the carbon substrate shows a significant decrease.
The relative carbon contents before and after high-potential scanning are 71.3% and 65.8%, respectively. This implies that in addition to water electrolysis during high-potential scanning, the carbon substrate was also degraded. The degradation of the carbon substrate is further proven by the Raman spectrum, as illustrated in Figure 5c,d. When all the data are normalized by the G band (sp2), the D band (sp3) intensity shows a significant increase after the CV scans. Correspondingly, the ID/IG ratio is utilized to assess the level of disorder: a higher ID/IG ratio indicates greater disorder. According to the Raman patterns, the ID/IG value increases from 1.16 initially to 1.27 after 10 CV cycles and finally rises to 1.51 after 150 CV cycles. Apparently, the ID/IG value increases after the CV scans, which is the direct proof of higher disorder and, thus, of the carbon degradation.
In the subsequent in situ Raman tests, we will focus on examining the intermediate products during the degradation process of ethanol catalytic performance on Pt/CNT, aiming to understand which species enhance the catalytic performance and which reactions lead to the inability to maintain the improved activity.

3.3. Reaction Intermediates Analyzed through In Situ Raman

Figure 6 showcases real-time Raman spectroscopy carried out across the cyclic voltammetry range from −0.8 V to 0.3 V. The consistent presence of peaks around 1602 cm−1, corresponding to the sp2 graphene (G band), indicates the CNT substrate’s stability. For Pt/CNT, two distinct peaks, appearing approximately at 1141 and 1527 cm−1, had been identified in our deuteration study as being characteristic of the expansion and contraction modes of the adsorbed *CO2 species [46]. As the potential sweeps positively (from −0.8 to 0.3 V), these peaks intensify in the early stages (around −0.8 V to −0.6 V) but wane and nearly vanish by −0.2 V. On the flip side, during the negative sweep (0.3 to −0.8 V), these peak intensities start to rise around −0.2 V. The carbon element in *CO2 can only originate from two sources: the oxidation of ethanol or the corrosion of the CNT substrate. Then, to exclude the second possibility, a controlled experiment using pure CNT as catalyst was studied using in situ Raman spectroscopy. As shown in Figure 6c, there was no signal of *CO2 found in the Raman spectrum for CNT, indicating that the corrosion of CNT was not the origin of *CO2, but that the oxidation of ethanol was. The Raman intensity trends of the *CO2 species mirror those observed in the EOR polarization curves, highlighting the *CO2 species’ crucial role in initiating EOR on the Pt/CNT surface.
The formation of the *CO2 species results from the breaking of C-C bonds in ethanol. This cleavage predominantly occurs in the low-potential region, where no evident consumption of *CO2 is seen, as indicated by the minimal current density in the polarization curves. This results in a continuous buildup of the *CO2 species on the surface. As overpotentials rise, the *CO2 species begin to diminish, causing an uptick in the EOR Faradic current, which corresponds to a decrease in the Raman intensity of the *CO2 species. Upon reaching potentials above 0 V, the C-C bond cleavage halts, causing the Faradic current to approach zero after the complete utilization of the accumulated *CO2. In the negative scan, the C-C bond cleavage reinitiates around −0.2 V, causing a sharp increase in the EOR Faradic current. As the overpotential decreases, the rate at which the *CO2 species are used up slows, leading to their renewed accumulation at the surface.
The in situ Raman investigation suggests that the *CO2 formation and depletion primarily govern the EOR process. The low potential region facilitates the formation of *CO2, whereas its consumption occurs at elevated potentials. Two distinct potentials, −0.8 V and 0.3 V, were chosen to assess these reaction dynamics. At −0.8 V, the Raman intensity mirrors the formation rate of *CO2, as its consumption had not commenced. In contrast, at 0.3 V, the Raman intensity reflects the consumption rate, given that *CO2 formation halts.
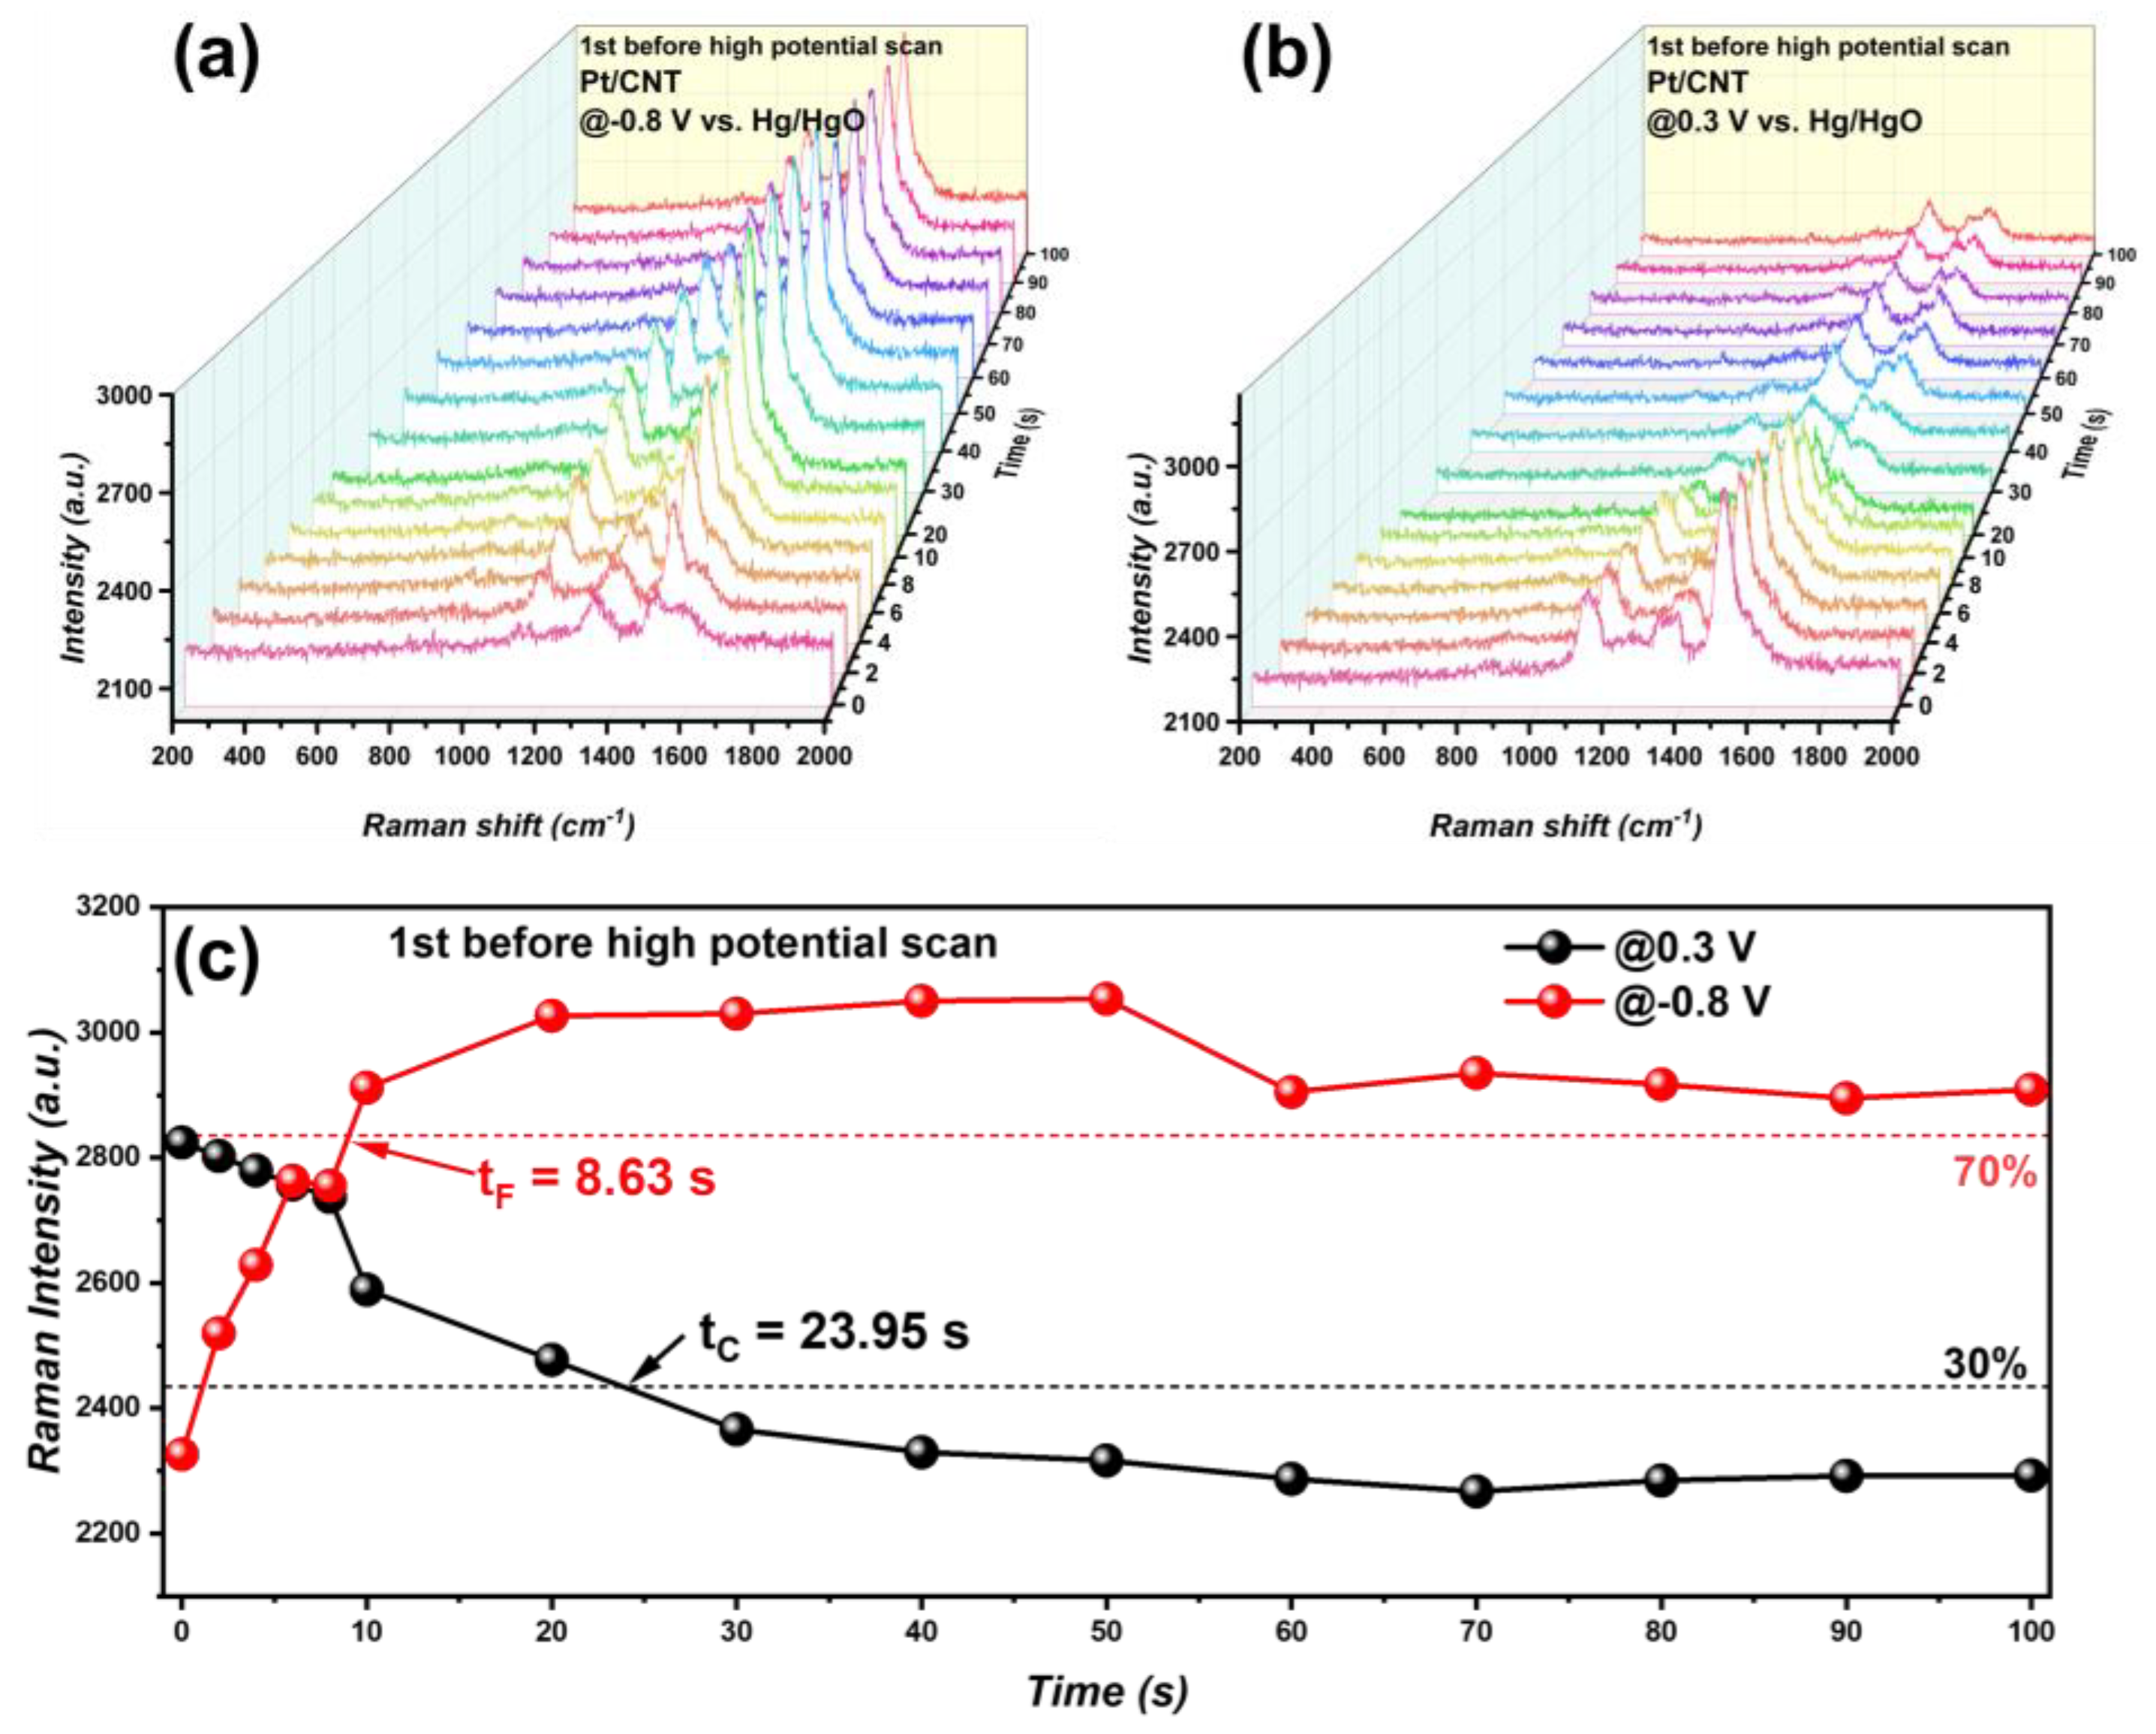
This behavior is illustrated in the time-resolved in situ Raman spectra in Figure 7. Figure 7a displays a rapid increase in Raman intensity at around 1141 and 1527 cm−1 at −0.8 V. Figure 7b showcases the progressive decrease in the *CO2 peak intensity at 0.3 V. Figure 7c plots these peak intensities over time. To determine reaction speeds, two metrics were defined: formation time (tF) and consumption time (tC). tF measures the time needed to attain 70% of peak intensity, while tC calculates the time to diminish it by 70%. The longer the duration needed to meet these thresholds, the slower the respective rates. As per Figure 7c, during the initial cycle, tF for *CO2 was about 2.77 times less than tC. This suggests that in the first cycle, while *CO2 was quickly formed, its consumption was the rate-limiting factor.
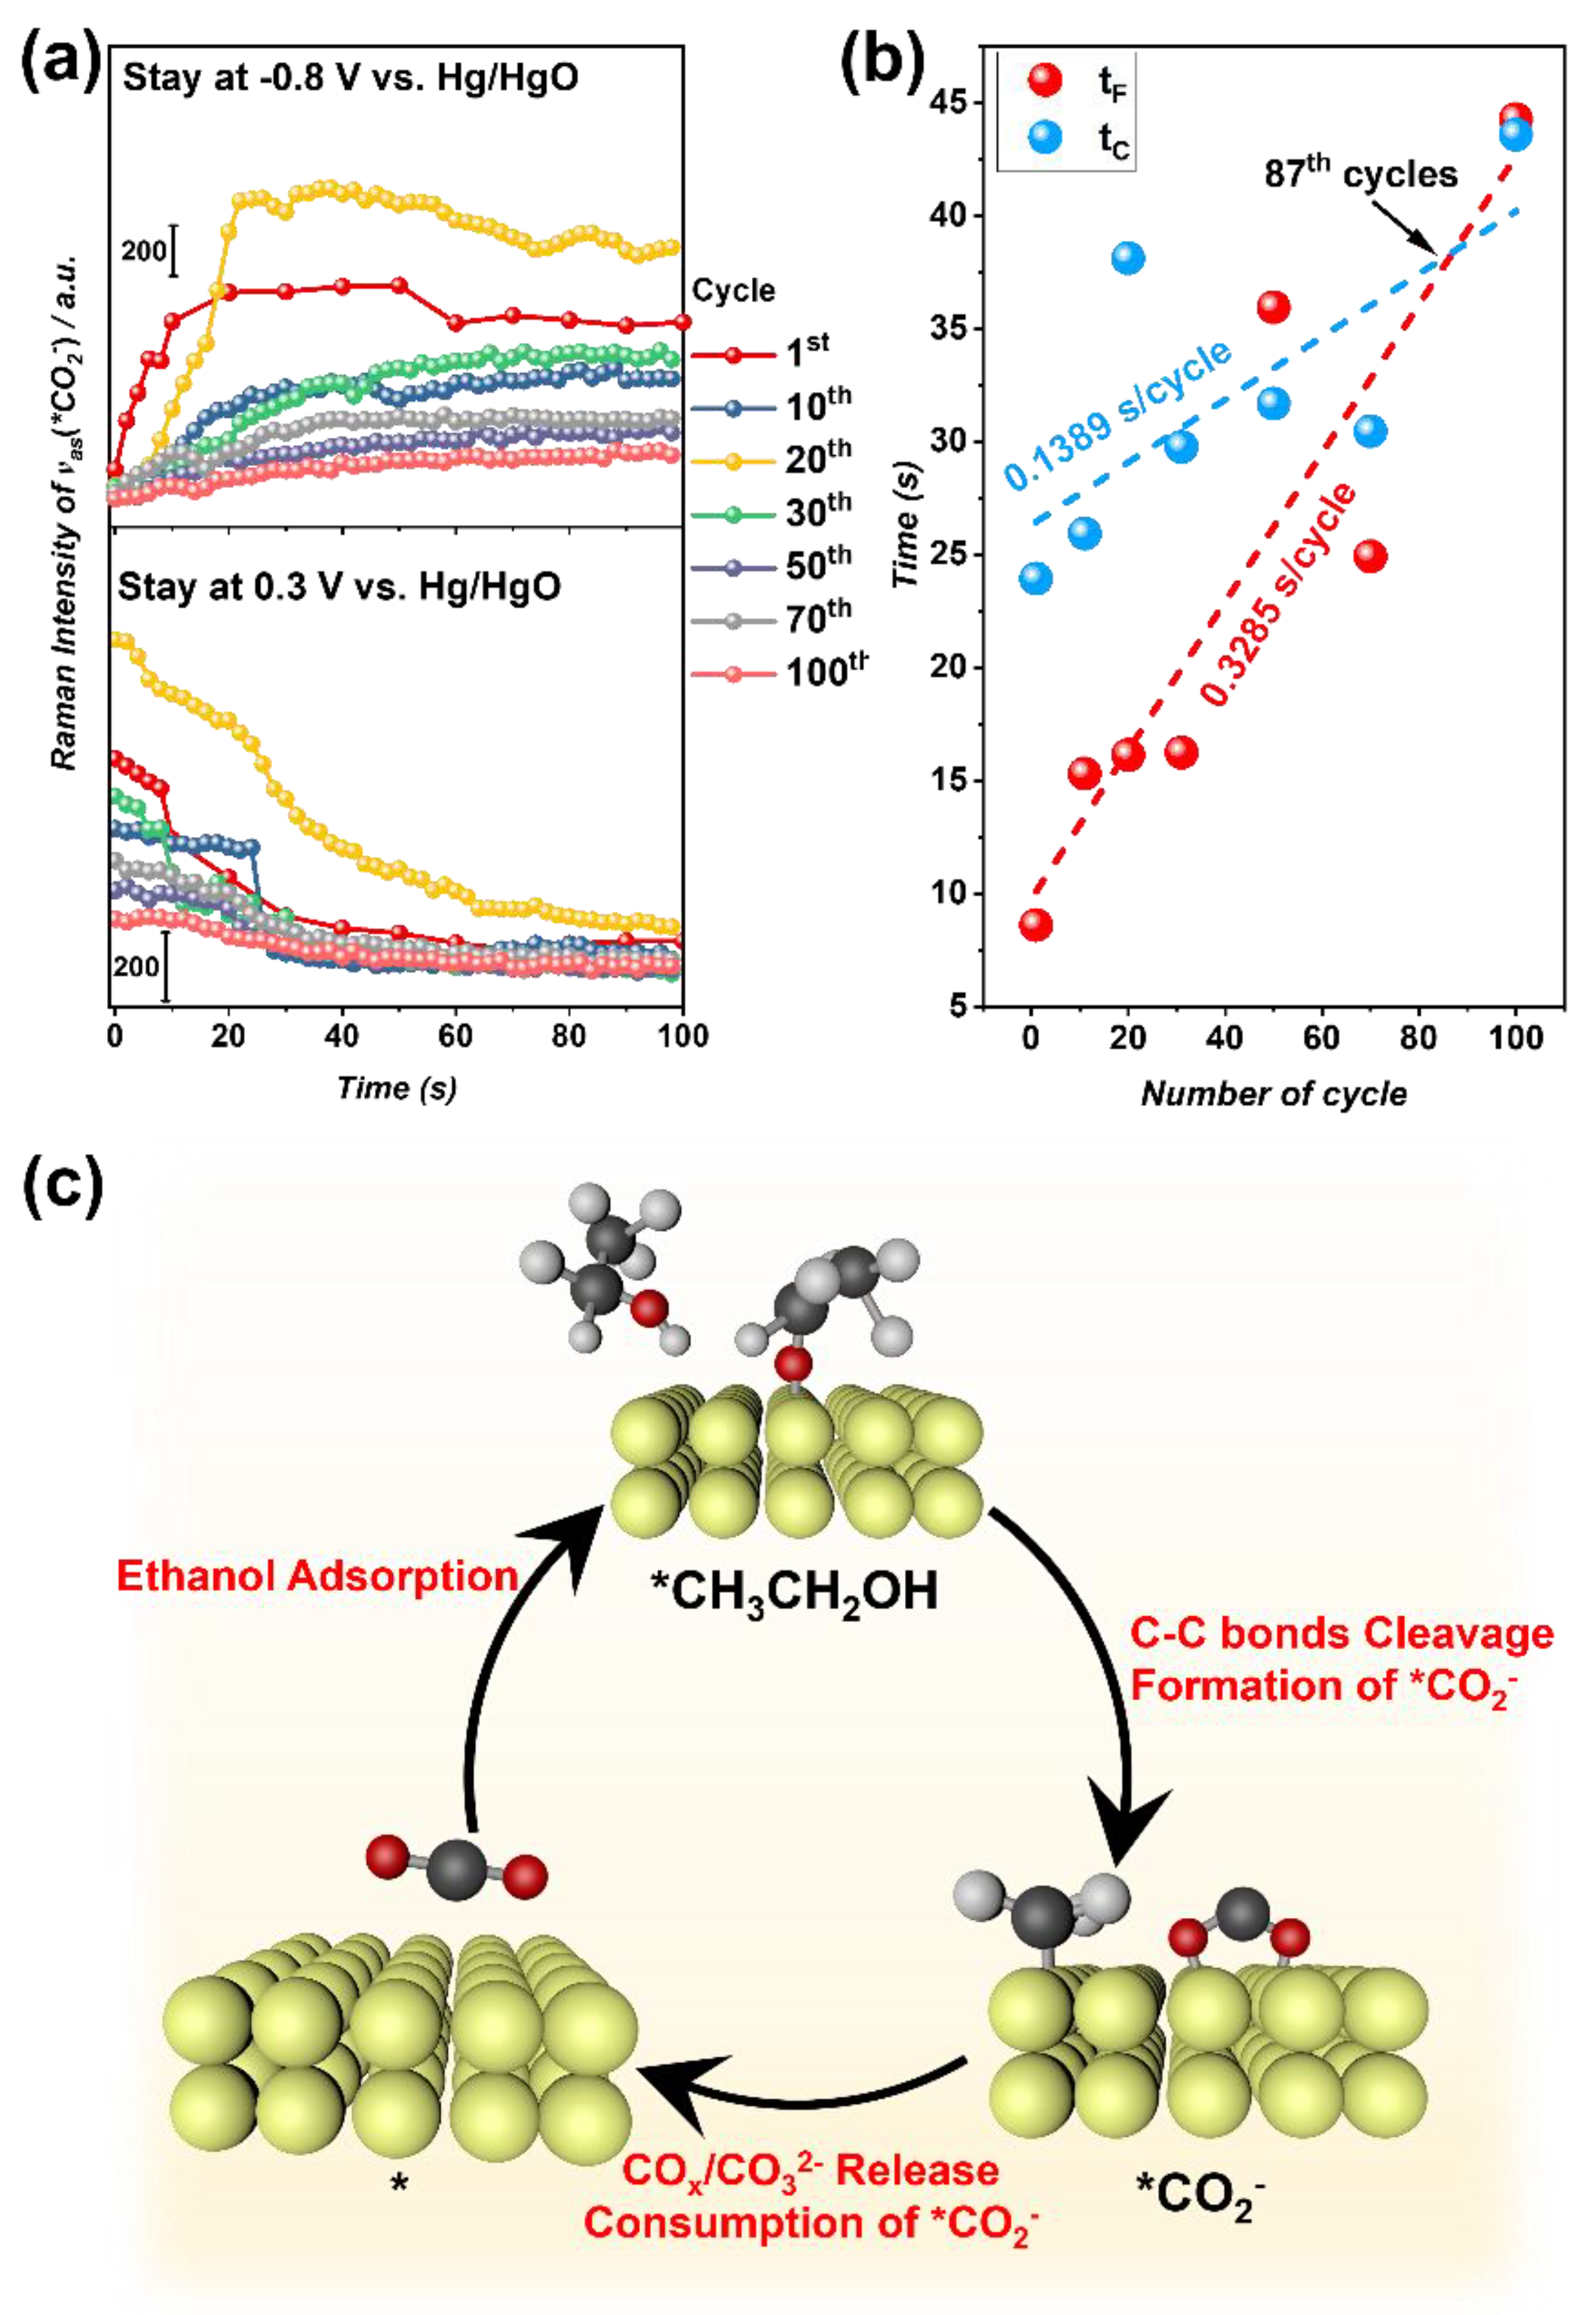
Additional studies were carried out to examine the formation and consumption rates of *CO2 across different CV cycle numbers. Using the methodology described earlier, the results are presented in Figure 8. With an increase in cycle number, both the formation and consumption curves started to stabilize, indicating reduced reaction rates. The metrics used to represent these rates, formation time (tF) and consumption time (tC), are showcased in Figure 8b.
At the outset, tC was greater than tF, indicating a slower consumption rate. But, as cycling continued, both tF and tC increased, reflecting slowing reaction speeds, and leading to decreased performance. Notably, the rate of decline for both formation and consumption were not the same. As shown in Figure 8b, the linear fit indicates that the formation rate decreased 2.36 times faster than the consumption rate. Around the 87th cycle, these two rates intersected, implying a change in the rate-determining step (RDS) over time. Initially, the *CO2 formation rate was faster than its consumption, making the consumption rate the primary determinant of the overall reaction rate. However, after a significant number of cycles, especially by the 87th cycle, the formation rate became the limiting factor, dictating the overall reaction rate.
As depicted in Figure 8c, the reaction pathway can be segmented into three stages: ethanol adsorption, *CO2 formation, and COx/CO32− release. Based on the Raman spectrum, ethanol molecules initially adhere to the catalyst’s surface, subsequently undergoing fragmentation into *CO2 and *CHx components. Subsequently, the *CO2 species disengage from the surface, leading to the formation of COx/CO32− species.

4. Conclusions

This study examines the degradation mechanism of synthesized Pt/CNT catalysts during ethanol oxidation after high-potential scanning, utilizing time-resolved in situ Raman spectroscopy. Initially, the catalysts displayed enhanced performance, but this was followed by a decline until inactivity. After high-potential scanning, the ethanol oxidation efficiency on Pt/CNT increased to 2.8 times its initial value. As cycling continued, the oxidation curve broadened and advanced. By the 100th cycle, the peak extended beyond 0.1V. Even at 126 cycles, the peak current density remained at 80% of its original value. Our findings indicate that the adsorbed *CO2 species is crucial for initiating EOR on Pt/CNT, with the overall EOR reaction rate being influenced by its formation and consumption. As cycling progressed, both these rates slowed down, accounting for the observed performance drop. Interestingly, the formation rate of *CO2 decreased more rapidly than its consumption. This resulted in a shift in the rate-determining step and introduced different reaction mechanisms during the degradation process. This analysis has provided us with a more profound comprehension of the elements impacting the catalytic efficacy of Pt/CNT catalysts under conditions of cell counter-polarity. These insights pave the way for developing electrocatalysts that are resilient to counter-polarity and bifunctional catalysts suitable for regenerative fuel cells.

Author Contributions

Conceptualization: F.H., Z.W. and F.J.; methodology, F.H.; software, F.H. and L.W.; validation, F.H., J.X. and L.W.; formal analysis, F.H. and J.X.; investigation, F.H., J.X. and L.W.; resources, Z.W. and F.J.; data curation, F.H. and J.X.; writing—original draft preparation, F.H.; writing—review and editing, F.J.; visualization, F.H.; supervision, F.J.; project administration, F.J.; funding acquisition, Z.W. and F.J. All authors have read and agreed to the published version of the manuscript.

Funding

This research was funded by National Natural Science Foundation of China (52006226, 61988102), the CAS-VPST Silk Road Science Fund 2022 (182344KYSB20210007), the Key Research and Development Program of Guangdong Province (2019B090917007), and the Science and Technology Planning Project of Guangdong Province (2022A0505050056, 2019B090909011).

Data Availability Statement

Data will be made available on request.

Acknowledgments

F.H.: L.W. and F.J. are grateful to our industrial partner, Zhongheng Shangneng (Chongqing) New Energy Technology Co., LTD, for their precious collaboration and assistance throughout this study.

Conflicts of Interest

The authors declare no conflict of interest.

References

  1. Jahromi, M.M.; Heidary, H. Automotive Applications of PEM Technology; INC: New York, NY, USA, 2022; pp. 347–405. [Google Scholar] [CrossRef]
  2. Parekh, A. Recent developments of proton exchange membranes for PEMFC: A review. Front. Energy Res. 2022, 10, 956132. [Google Scholar] [CrossRef]
  3. Hong, B.K.; Kim, S.H.; Kim, C.M. Powering the future through hydrogen and polymer electrolyte membrane fuel cells current commercialisation and key challenges with focus on work at Hyundai. Johns. Matthey Technol. Rev. 2020, 64, 236–251. [Google Scholar] [CrossRef]
  4. Tang, A.; Yang, Y.; Yu, Q.; Zhang, Z.; Yang, L. A Review of Life Prediction Methods for PEMFCs in Electric Vehicles. Sustainability 2022, 14, 9842. [Google Scholar] [CrossRef]
  5. Lee, S.W.; Lee, B.H.; Kim, T.Y.; Baik, C.; Kim, M.S.; Chai, G.S.; Pak, C. Multifunctional non-Pt ternary catalyst for the hydrogen oxidation and oxygen evolution reactions in reversal-tolerant anode. Catal. Commun. 2019, 130, 105758. [Google Scholar] [CrossRef]
  6. You, E.; Lee, S.W.; You, D.; Lee, B.; Pak, C. Effect of metal composition and carbon support on the durability of the reversal-tolerant anode with irru alloy catalyst. Catalysts 2020, 10, 932. [Google Scholar] [CrossRef]
  7. Gao, Z.; Liu, F.; Su, J.; Guo, L.; Liu, H. Experimental investigation of reverse voltage phenomenon during galvanostatic start-up of a proton exchange membrane fuel cell. Energy Convers. Manag. 2022, 258, 115386. [Google Scholar] [CrossRef]
  8. Qin, C.; Wang, J.; Yang, D.; Li, B.; Zhang, C. Proton exchange membrane fuel cell reversal: A review. Catalysts 2016, 6, 197. [Google Scholar] [CrossRef]
  9. Cai, C.; Wan, Z.; Rao, Y.; Chen, W.; Zhou, J.; Tan, J.; Pan, M. Water electrolysis plateau in voltage reversal process for proton exchange membrane fuel cells. J. Power Sources 2020, 455, 227952. [Google Scholar] [CrossRef]
  10. Chen, H.; Zhao, X.; Zhang, T.; Pei, P. The reactant starvation of the proton exchange membrane fuel cells for vehicular applications: A review. Energy Convers. Manag. 2019, 182, 282–298. [Google Scholar] [CrossRef]
  11. Dou, M.; Hou, M.; Liang, D.; Shen, Q.; Zhang, H.; Lu, W.; Shao, Z.; Yi, B. Behaviors of proton exchange membrane fuel cells under oxidant starvation. J. Power Sources 2011, 196, 2759–2762. [Google Scholar] [CrossRef]
  12. Wang, Y.; Xie, X.; Zhou, C.; Feng, Q.; Zhou, Y.; Yuan, X.Z.; Xu, J.; Fan, J.; Zeng, L.; Li, H.; et al. Study of relative humidity on durability of the reversal tolerant proton exchange membrane fuel cell anode using a segmented cell. J. Power Sources 2020, 449, 227542. [Google Scholar] [CrossRef]
  13. Cai, C.; Rao, Y.; Zhou, J.; Zhang, L.; Chen, W.; Wan, Z.; Tan, J.; Pan, M. Carbon corrosion: A novel termination mechanism of the water electrolysis plateau during voltage reversal. J. Power Sources 2020, 473, 228542. [Google Scholar] [CrossRef]
  14. Wang, Y.; Liao, J.; Li, Z.; Wu, B.; Lou, J.; Zeng, L.; Zhao, T. Ir-Pt/C composite with high metal loading as a high-performance anti-reversal anode catalyst for proton exchange membrane fuel cells. Int. J. Hydrogen Energy 2022, 47, 13101–13111. [Google Scholar] [CrossRef]
  15. Labi, T.; Van Schalkwyk, F.; Andersen, S.M.; Morgen, P.; Ray, S.C.; Chamier, J. Increasing fuel cell durability during prolonged and intermittent fuel starvation using supported IrOx. J. Power Sources 2021, 490, 229568. [Google Scholar] [CrossRef]
  16. Zhou, X.; Ji, H.; Li, B.; Zhang, C. High-Repetitive Reversal Tolerant Performance of Proton-Exchange Membrane Fuel Cell by Designing a Suitable Anode. ACS Omega 2020, 5, 10099–10105. [Google Scholar] [CrossRef]
  17. Wang, Y.; Leung, D.Y.C.; Xuan, J.; Wang, H. A review on unitized regenerative fuel cell technologies, part-A: Unitized regenerative proton exchange membrane fuel cells. Renew. Sustain. Energy Rev. 2016, 65, 961–977. [Google Scholar] [CrossRef]
  18. Rocha, A.; Ferreira, R.B.; Falcão, D.S.; Pinto, A.M.F.R. Experimental study on a unitized regenerative fuel cell operated in constant electrode mode: Effect of cell design and operating conditions. Renew. Energy 2023, 215, 118870. [Google Scholar] [CrossRef]
  19. Gayen, P.; Saha, S.; Liu, X.; Sharma, K.; Ramani, V.K. High-performance AEM unitized regenerative fuel cell using Pt-pyrochlore as bifunctional oxygen electrocatalyst. Proc. Natl. Acad. Sci. USA 2021, 118, e2107205118. [Google Scholar] [CrossRef]
  20. Rivera-Gavidia, L.M.; Fernández de la Puente, I.; Hernández-Rodríguez, M.A.; Celorrio, V.; Sebastián, D.; Lázaro, M.J.; Pastor, E.; García, G. Bi-functional carbon-based catalysts for unitized regenerative fuel cells. J. Catal. 2020, 387, 138–144. [Google Scholar] [CrossRef]
  21. Wang, Y.J.; Fang, B.; Wang, X.; Ignaszak, A.; Liu, Y.; Li, A.; Zhang, L.; Zhang, J. Recent advancements in the development of bifunctional electrocatalysts for oxygen electrodes in unitized regenerative fuel cells (URFCs). Prog. Mater. Sci. 2018, 98, 108–167. [Google Scholar] [CrossRef]
  22. Moore, C.E.; Eastcott, J.; Cimenti, M.; Kremliakova, N.; Gyenge, E.L. Novel methodology for ex situ characterization of iridium oxide catalysts in voltage reversal tolerant proton exchange membrane fuel cell anodes. J. Power Sources 2019, 417, 53–60. [Google Scholar] [CrossRef]
  23. Roh, C.W.; Kim, H.E.; Choi, J.; Lim, J.; Lee, H. Monodisperse IrOx deposited on Pt/C for reversal tolerant anode in proton exchange membrane fuel cell. J. Power Sources 2019, 443, 227270. [Google Scholar] [CrossRef]
  24. Mandal, P.; Hong, B.K.; Oh, J.G.; Litster, S. Understanding the voltage reversal behavior of automotive fuel cells. J. Power Sources 2018, 397, 397–404. [Google Scholar] [CrossRef]
  25. Chang, J.; Wang, G.; Chang, X.; Yang, Z.; Wang, H.; Li, B.; Zhang, W.; Kovarik, L.; Du, Y.; Orlovskaya, N.; et al. Interface synergism and engineering of Pd/Co@N-C for direct ethanol fuel cells. Nat. Commun. 2023, 14, 1346. [Google Scholar] [CrossRef] [PubMed]
  26. Begum, H.; Ahmed, M.S.; Lee, D.W.; Kim, Y.B. Carbon nanotubes-based PdM bimetallic catalysts through N4-system for efficient ethanol oxidation and hydrogen evolution reaction. Sci. Rep. 2019, 9, 11051. [Google Scholar] [CrossRef] [PubMed]
  27. Chen, W.; Chen, S.; Qian, G.; Song, L.; Chen, D.; Zhou, X.; Duan, X. On the nature of Pt-carbon interactions for enhanced hydrogen generation. J. Catal. 2020, 389, 492–501. [Google Scholar] [CrossRef]
  28. Azcoaga Chort, M.F.; Nagel, P.A.; Veizaga, N.S.; Rodríguez, V.I.; de Miguel, S.R. Effect of Sn content on Pt/CNT electrocatalysts for direct ethanol fuel cell application. Can. J. Chem. Eng. 2022, 100, 1848–1857. [Google Scholar] [CrossRef]
  29. Tian, M.H.; Yang, Y.; Desmond, C.; Liu, F.; Zhu, Z.Q.; Li, Q.X. Pt-Surface-Enriched Platinum–Tungsten Bimetallic Nanoparticles Catalysts on Different Carbon Supports for Electro-Oxidation of Ethanol. Catal. Lett. 2020, 150, 3386–3393. [Google Scholar] [CrossRef]
  30. Huang, H.; Zhang, W.; Fu, Y.; Wang, X. Controlled growth of nanostructured MnO2 on carbon nanotubes for high-performance electrochemical capacitors. Electrochim. Acta 2015, 152, 480–488. [Google Scholar] [CrossRef]
  31. Ning, L.; Liu, X.; Deng, M.; Huang, Z.; Zhu, A.; Zhang, Q.; Liu, Q. Palladium-based nanocatalysts anchored on CNT with high activity and durability for ethanol electro-oxidation. Electrochim. Acta 2019, 297, 206–214. [Google Scholar] [CrossRef]
  32. Hu, F.; Chen, W. End-opened carbon nanotube array supported Pd as anode for alkaline fuel cell. Electrochem. Commun. 2011, 13, 955–958. [Google Scholar] [CrossRef]
  33. Ramachandran, K.; Vinothkannan, M.; Kim, A.R.; Ramakrishnan, S.; Yoo, D.J. Ultrafine bimetallic alloy supported on nitrogen doped reduced graphene oxide toward liquid-fuel oxidation: Profile of improved performance and extended durability. Int. J. Hydrogen Energy 2019, 44, 21769–21780. [Google Scholar] [CrossRef]
  34. Raj Kumar, T.; Jin Yoo, D.; Kim, A.R.; Gnana Kumar, G. Green synthesis of Pt-Pd bimetallic nanoparticle decorated reduced graphene oxide and its robust catalytic activity for efficient ethylene glycol electrooxidation. New J. Chem. 2018, 42, 14386–14393. [Google Scholar] [CrossRef]
  35. Zhang, W.; Sherrell, P.; Minett, A.I.; Razal, J.M.; Chen, J. Carbon nanotube architectures as catalyst supports for proton exchange membrane fuel cells. Energy Environ. Sci. 2010, 3, 1286–1293. [Google Scholar] [CrossRef]
  36. Kim, M.J.; Lee, K.B.; Seo, M.G.; Lee, K.Y. Porous MnO2/CNT catalysts with a large specific surface area for the decomposition of hydrogen peroxide. Korean J. Chem. Eng. 2017, 34, 2147–2153. [Google Scholar] [CrossRef]
  37. Tang, T.; Gan, Q.; Guo, X.; Dong, H.; Zhang, J.; Zhao, Y.; Tian, J.; Yang, X. A hybrid catalyst of Pt/CoNiO2 on carbon nanotubes and its synergetic effect towards remarkable ethanol electro-oxidation in alkaline media. Sustain. Energy Fuels 2018, 2, 229–236. [Google Scholar] [CrossRef]
  38. Yin, S.; Zhu, Q.; Yang, L.; Qiang, Y.; Huang, F.; Luo, L. Carbon nanotubes supported Pt catalysts for ethanol oxidation in. Adv. Mater. Res. 2013, 662, 132–135. [Google Scholar] [CrossRef]
  39. Hu, F.; Cui, X.; Chen, W. Ultralong-CNTA-supported Pd-based anodes for ethanol oxidation. J. Phys. Chem. C 2010, 114, 20284–20289. [Google Scholar] [CrossRef]
  40. Dong, J.C.; Zhang, X.G.; Briega-Martos, V.; Jin, X.; Yang, J.; Chen, S.; Yang, Z.L.; Wu, D.Y.; Feliu, J.M.; Williams, C.T.; et al. In situ Raman spectroscopic evidence for oxygen reduction reaction intermediates at platinum single-crystal surfaces. Nat. Energy 2019, 4, 60–67. [Google Scholar] [CrossRef]
  41. Xu, J.; Wang, B.-X.; Lyu, D.; Wang, T.; Wang, Z. In situ Raman investigation of the femtosecond laser irradiated NiFeOOH for enhanced electrochemical ethanol oxidation reaction. Int. J. Hydrogen Energy 2023, 48, 10724–10736. [Google Scholar] [CrossRef]
  42. Tiwari, J.N.; Dang, N.K.; Park, H.J.; Sultan, S.; Kim, M.G.; Haiyan, J.; Lee, Z.; Kim, K.S. Remarkably enhanced catalytic activity by the synergistic effect of palladium single atoms and palladium–cobalt phosphide nanoparticles. Nano Energy 2020, 78, 105166. [Google Scholar] [CrossRef]
  43. Zhang, Y.J.; Zhu, Y.Z.; Li, J.F. Application of raman spectroscopy in fuel cell. Wuli Huaxue Xuebao/Acta Phys.-Chim. Sin. 2021, 37, 2004052. [Google Scholar] [CrossRef]
  44. Dong, J.C.; Su, M.; Briega-Martos, V.; Li, L.; Le, J.B.; Radjenovic, P.; Zhou, X.S.; Feliu, J.M.; Tian, Z.Q.; Li, J.F. Direct in Situ Raman Spectroscopic Evidence of Oxygen Reduction Reaction Intermediates at High-Index Pt(hkl) Surfaces. J. Am. Chem. Soc. 2020, 142, 715–719. [Google Scholar] [CrossRef]
  45. Wang, Y.H.; Zheng, S.; Yang, W.M.; Zhou, R.Y.; He, Q.F.; Radjenovic, P.; Dong, J.C.; Li, S.; Zheng, J.; Yang, Z.L.; et al. In situ Raman spectroscopy reveals the structure and dissociation of interfacial water. Nature 2021, 600, 81–85. [Google Scholar] [CrossRef] [PubMed]
  46. Hu, F.; Xu, J.; Wei, L.; Wang, Z.; Jiang, F. In situ Raman study of high potential scan enhanced Pt/C and Pd/C catalyst performance for ethanol oxidation. Electrochem. Commun. 2023, 154, 107561. [Google Scholar] [CrossRef]
  47. Wang, C.; Van Der Vliet, D.; More, K.L.; Zaluzec, N.J.; Peng, S.; Sun, S.; Daimon, H.; Wang, G.; Greeley, J.; Pearson, J.; et al. Multimetallic Au/FePt3 nanoparticles as highly durable electrocatalyst. Nano Lett. 2011, 11, 919–926. [Google Scholar] [CrossRef]
  48. Chen, T.W.; Huang, W.F.; Kang, J.X.; Zhang, D.F.; Guo, L. Cycling potential engineering surface configuration of sandwich Au@Ni@PtNiAu for superior catalytic durability. Nano Energy 2018, 52, 22–28. [Google Scholar] [CrossRef]
Figure 1. (a) The cyclic voltammetry curves of J-M Pt/C and Pt/CNT in 1.0 M KOH aqueous solution at a scan rate of 50 mV/s. (b) The evaluation of underpotentially deposited hydrogen. The inset is the integral area of the Hupd peaks. (c) The calculated ECSA of J-M Pt/C and Pt/CNT.
Energies 17 02122 g001
Figure 2. (a) Cyclic voltammograms for ethanol oxidation at Pt/CNT electrodes with scanning to 0.3 V (BS: before high-potential scanning; AS: after high-potential scanning), (b) Cyclic voltammograms for ethanol oxidation at Pt/CNT electrodes with scanning to 0.9 V, in 1.0 M KOH/1.0 M ethanol, at 303 K, scan rate: 50 mV s−1. Pt loading: 20 µg cm−2.
Energies 17 02122 g002
Figure 3. (a) Correlation between peak current density and number of CV cycles (inset shows peak current densities of ethanol oxidation on Pt/C [46] and Pt/CNT) in a 1.0 M KOH/1.0 M ethanol solution. (b) Percentage of relative peak current density for Pt/CNT electrodes (inset displays cyclic voltammograms of ethanol oxidation on Pt/CNT), at 303 K, with a scan rate of 50 mV s−1. Plainum loading: 20 µg cm−2.
Energies 17 02122 g003
Figure 4. (a) Chronopotentiometry of Pt/CNT electrodes after scanning to 0.3 V; (b) Chronopotentiometry of Pt/CNT electrodes after scanning to 0.9 V, under 5 mA cm−2, in a solution of 1.0 M KOH/1.0 M ethanol, at a temperature of 303 K, with a scan rate of 50 mV s−1. Pt loading: 20 µg cm−2.
Energies 17 02122 g004
Figure 5. Scanning electron microscopy pictures of Pt/CNT before (a) and subsequent to (b) electrochemical tests (insets are corresponding elemental analysis results). (c) The normalized Raman spectrum for Pt/CNT and (d) the extracted ID/IG value after different CV cycles.
Energies 17 02122 g005
Figure 6. (a) The real-time Raman spectrum for Pt/CNT captured during cyclic voltammetry in an aqueous solution of 1.0 M KOH with 1.0 M ethanol. (b) Variation in Raman intensity in relation to applied potentials for Pt/CNT. (c) The in situ Raman spectrum of CNT recorded during CV in a 1.0 M KOH aqueous solution mixed with 1.0 M ethanol. The scanning rate is maintained at 5 mV/s, and each spectrum is exposed for 5 s. Raman intensities have been normalized using the D band of carbon nanotubes (~1340 cm−1).
Energies 17 02122 g006
Figure 7. The real-time Raman spectroscopic profile of Pt/CNT taken at (a) −0.8 V and (b) 0.3 V, respectively. (c) The intensity of the Raman peak for νas(*CO2) changes with respect to time at −0.8 and 0.3 V in comparison to Hg/HgO. Room temperature, sample interval: 2 s/spectrum for 0 < t < 10 and 10 s/spectrum for 10 < t < 100, expose time: 2 s.
Energies 17 02122 g007
Figure 8. (a) The time-resolved peak intensity at ~1527 cm−1 after different cycles of CV. (b) The extracted tF and tC value at different number of cycles. (c) Depiction of the reaction mechanism based on experimental findings. Room temperature, scan rate: 200 mV/s, sample interval: 2 s/spectrum, expose time: 2 s.
Energies 17 02122 g008
Disclaimer/Publisher’s Note: The statements, opinions and data contained in all publications are solely those of the individual author(s) and contributor(s) and not of MDPI and/or the editor(s). MDPI and/or the editor(s) disclaim responsibility for any injury to people or property resulting from any ideas, methods, instructions or products referred to in the content.