Article

Health State Assessment of Lithium-Ion Batteries Based on Multi-Health Feature Fusion and Improved Informer Modeling

School of Electrical and Electronic Engineering, Hubei University of Technology, Wuhan 430070, China
*
Author to whom correspondence should be addressed.
Energies 2024, 17(9), 2154; https://doi.org/10.3390/en17092154
Submission received: 26 March 2024 / Revised: 18 April 2024 / Accepted: 26 April 2024 / Published: 30 April 2024
(This article belongs to the Section D: Energy Storage and Application)

Abstract

:
Accurately assessing the state of health (SOH) of lithium batteries is of great significance for improving battery safety performance. However, the current assessment for SOH suffers from the difficulty of selecting health features and the lack of uncertainty using data-driven methods. To this end, this paper proposes a health state assessment method for lithium-ion batteries based on health feature extraction and an improved Informer model. First, multiple features that can reflect the SOH of lithium-ion batteries were extracted from the charging and discharging time, the peak value of incremental capacity curve (ICC), and the inflection point value of differential voltage curve, etc., and the correlation between multiple health features and the health state was evaluated by gray correlation analysis. Then, an improved Informer model is proposed to establish a health state estimation method for lithium-ion batteries. Finally, the proposed algorithm is tested and validated using publicly available battery charge/discharge datasets and compared with other algorithms. The results show that the method in this paper can realize high-precision SOH prediction with a root-mean-square error (RMSE) of 0.011, and the model fit reaches more than 98%.

1. Introduction

With the increasing scale of new energy on-grid, the importance of energy storage in the new power system generation, transmission, distribution, and use of the link is becoming more and more prominent. Among them, lithium-ion batteries have become one of the mainstream energy storage systems in new power systems due to their high energy density, fast conversion rate, and easy deployment [1,2,3]. However, with the charging and discharging cycles of lithium-ion batteries, it will lead to the aging of lithium batteries, causing fire, explosion, and other accidents. The health state of lithium-ion batteries can effectively reflect the degree of battery aging, and in actual operation, replacing low SOH batteries based on a set threshold is one of the effective measures to ensure the safe and stable operation of battery energy storage systems.
Currently, Li-ion battery SOH assessment methods are divided into two main categories: model-driven-based methods and data-driven-based methods. Among them, the model-driven approach is mainly based on electrochemical models and equivalent circuit models. Electrochemical modeling usually employs partial differential equations to describe the electrochemical processes inside the battery, such as the growth mechanism of the solid electrolyte interfacial layer film, the loss process of lithium ions, and positive and negative active materials, etc., which leads to the derivation of the battery SOH [4,5].
Equivalent circuit modeling, on the other hand, abstracts the battery into components such as resistance and capacitance and reassembles them into circuits, thereby obtaining internal and external characteristics consistent with those of the battery. Equivalent circuit model parameter optimization is the key to improve the efficiency of battery SOH evaluation. Ref. [5] used a first-order equivalent circuit model to simulate the battery and estimated the key parameters of the model by injecting different frequency currents sequentially using the frequency scale separation method. Ref. [6] used a stochastic variational ant colony optimization algorithm to identify the key parameters of the PNGV (the partnership for a new generation of vehicles) battery model. In addition, recursive least squares [7], Kalman filtering [8], and other methods are widely used for battery model parameter identification. In general, the model-based battery SOH assessment method is more accurate, but the calculation process consumes a lot of arithmetic power, which makes it more difficult to be deployed in the BMS.
In order to solve the difficulties of algorithm deployment in practical application scenarios, data-driven battery SOH evaluation methods based on data have attracted extensive attention from researchers. Compared with the model-driven method, the data-driven method does not need to study the internal operation mechanism of the battery in depth, and only learns the change rule of input data through loop iteration, and then can give accurate evaluation results, which is more flexible [9]. Data-driven battery SOH-based assessments are usually performed based on timing monitoring data collected by the BMS, and thus the core of such approaches is the analysis and processing of timing data. Ref. [10] used a modified gated recurrent unit convolutional neural network to exploit the potential correlation between battery timing parameters and SOH by taking the voltage, current, and temperature profiles in the charging and discharging curves as network inputs. Ref. [11] proposed an intelligent battery health prediction method based on integrated deep transfer learning (EDTL) for efficient robust aging trajectory matching. It is demonstrated experimentally that the method can achieve accurate and reliable battery health prediction under different aging stages or incomplete data. Ref. [12] used a deep confidence network based on partial incremental capacity curves to evaluate the health of lithium-ion batteries, and the evaluation error can be reduced to less than 5%. The above data-driven SOH assessment method realizes the accurate assessment of SOH by mining the potential trends of battery monitoring data and constructing mapping relationships. However, most of the data-driven methods are based on gradient iterative optimization to determine the internal parameters, and the lack of interpretability hinders the engineering application of the methods to a certain extent.
In order to accurately estimate the SOH, in addition to improving the accuracy and efficiency of the SOH estimation algorithm, it is also important to accurately extract the Health Features (HFs) that characterize the aging of the battery. For this reason, some scholars have conducted battery SOH assessment based on extracting battery health characteristics from BMS timing monitoring data. Ref. [13] used a genetic algorithm to search for the optimal charging voltage range and parameters, and the obtained parameters were directly used to build a machine-learning-based SOH model for Li-ion batteries. Ref. [14] proposed a battery health state estimation method based on long- and short-term memory neural networks, in order to accurately describe the aging mechanism of the battery, features such as time and energy were extracted from the battery data as features for health state estimation. Ref. [15] proposed a weighted least squares support vector machine (WLS-SVM)-based early prediction method for lithium-ion battery cycle life using health indicators as input.
With the research in recent years, SOH estimation methods for Li-ion batteries based on the Informer model have begun to emerge. Ref. [14] extracted the actual currents, voltages, and temperatures by combining the Gaussian Process Regression (GPR) model with the Informer model using the Informer customized convolution kernel. Although the Informer model can realize accurate SOH estimation, there are still several problems: firstly, the traditional Informer model has some limitations and local information extraction ability. Second, the Informer model, as a deep learning model, has too high of a computational cost.
Based on the above conclusions, this paper proposes an SOH prediction method based on multi-feature extraction and a CCN-Informer model. By introducing a causal convolutional neural network in the self-attention mechanism, the local information extraction capability is enhanced to capture the surrounding anomalous fluctuation information that has a large impact on the time point and learn it, while retaining the important positional order and temporal information between the sequence data, and encoding the positional and temporal information of each sequence of the input data. The probabilistic sparse self-attention layer and distillation layer are utilized to control the sample computational cost of the encoder.
The main innovations of this paper include the following:
  • In order to accurately characterize the battery aging process, eight features were extracted from the battery data and classified into two categories: direct measurement features and second-order processing features.
  • An SOH estimation model for lithium-ion batteries based on causal convolutional neural network and the Informer model is established, which enhances the local information extraction capability of the Informer model, and is able to well capture the nonlinear relationship reflected by different features in the aging process of lithium-ion batteries.
The remaining chapters of this paper are organized as follows: Section 2 describes the process of extracting health features, Section 3 describes the health state assessment model based on CCN-Informer, Section 4 validates the possibility and accuracy of the methodology, and Section 5 summarizes the whole paper.

2. Health Feature Extraction Based on Battery Charging Profile

2.1. Health Feature Extraction Framework

Battery SOH: The maximum usable capacity of a usable battery is measured as the ratio of the nominal rated capacity of the battery [16], which is:
V S O H = C n o w C r a t e d × 100 %
where V S O H is the SOH of the battery, C r a t e d is the rated capacity of the battery, and C n o w is the current maximum usable capacity of the battery. The rated capacity is measured and calibrated before the battery leaves the factory, while the current maximum usable capacity is measured after the battery charge/discharge cycle is completed. Most of the existing battery BMSs can only monitor parameters such as battery charging voltage, current, and temperature, and it is difficult to directly measure the current maximum capacity of the battery. Therefore, existing data-driven methods usually take the battery monitoring parameters as inputs and construct mapping models to realize the estimation of battery SOH.

2.2. Experimental Dataset

CALCE: In this experiment, three lithium batteries were selected from the CALCE dataset, CS2-34, CS2-36, and CS-37, respectively, for experimental study [17,18]. The data were obtained from the lithium battery experimental system of ArbinBT2000, and the rated capacity of the battery was 1.1 Ah, which was charged and discharged at room temperature. Firstly, constant-current charging was carried out at a constant current of 0.45 A until the voltage reached 4.2 V, keeping the terminal voltage of the battery at 4.2 V, and continued charging until the charging current decreased to 0.05 A, and then discharged at a constant current of 0.45 A until the voltage decreased to 2.7 V. The discharge rate was kept at a constant 1 C during the experimental process.
NASA: The NASA battery degradation dataset is based on 18650 model lithium-ion batteries [18,19]. There are three batteries cited in this dataset, namely B0005, B0006, and B0007. The three battery datasets were obtained by charging and discharging the batteries in operation mode at room temperature of 24 degrees. The rated capacity of all three battery sets is 2 Ah.
The battery degradation curves for the two datasets are shown in Figure 1a,b.

2.3. Direct Measurement Feature Extraction

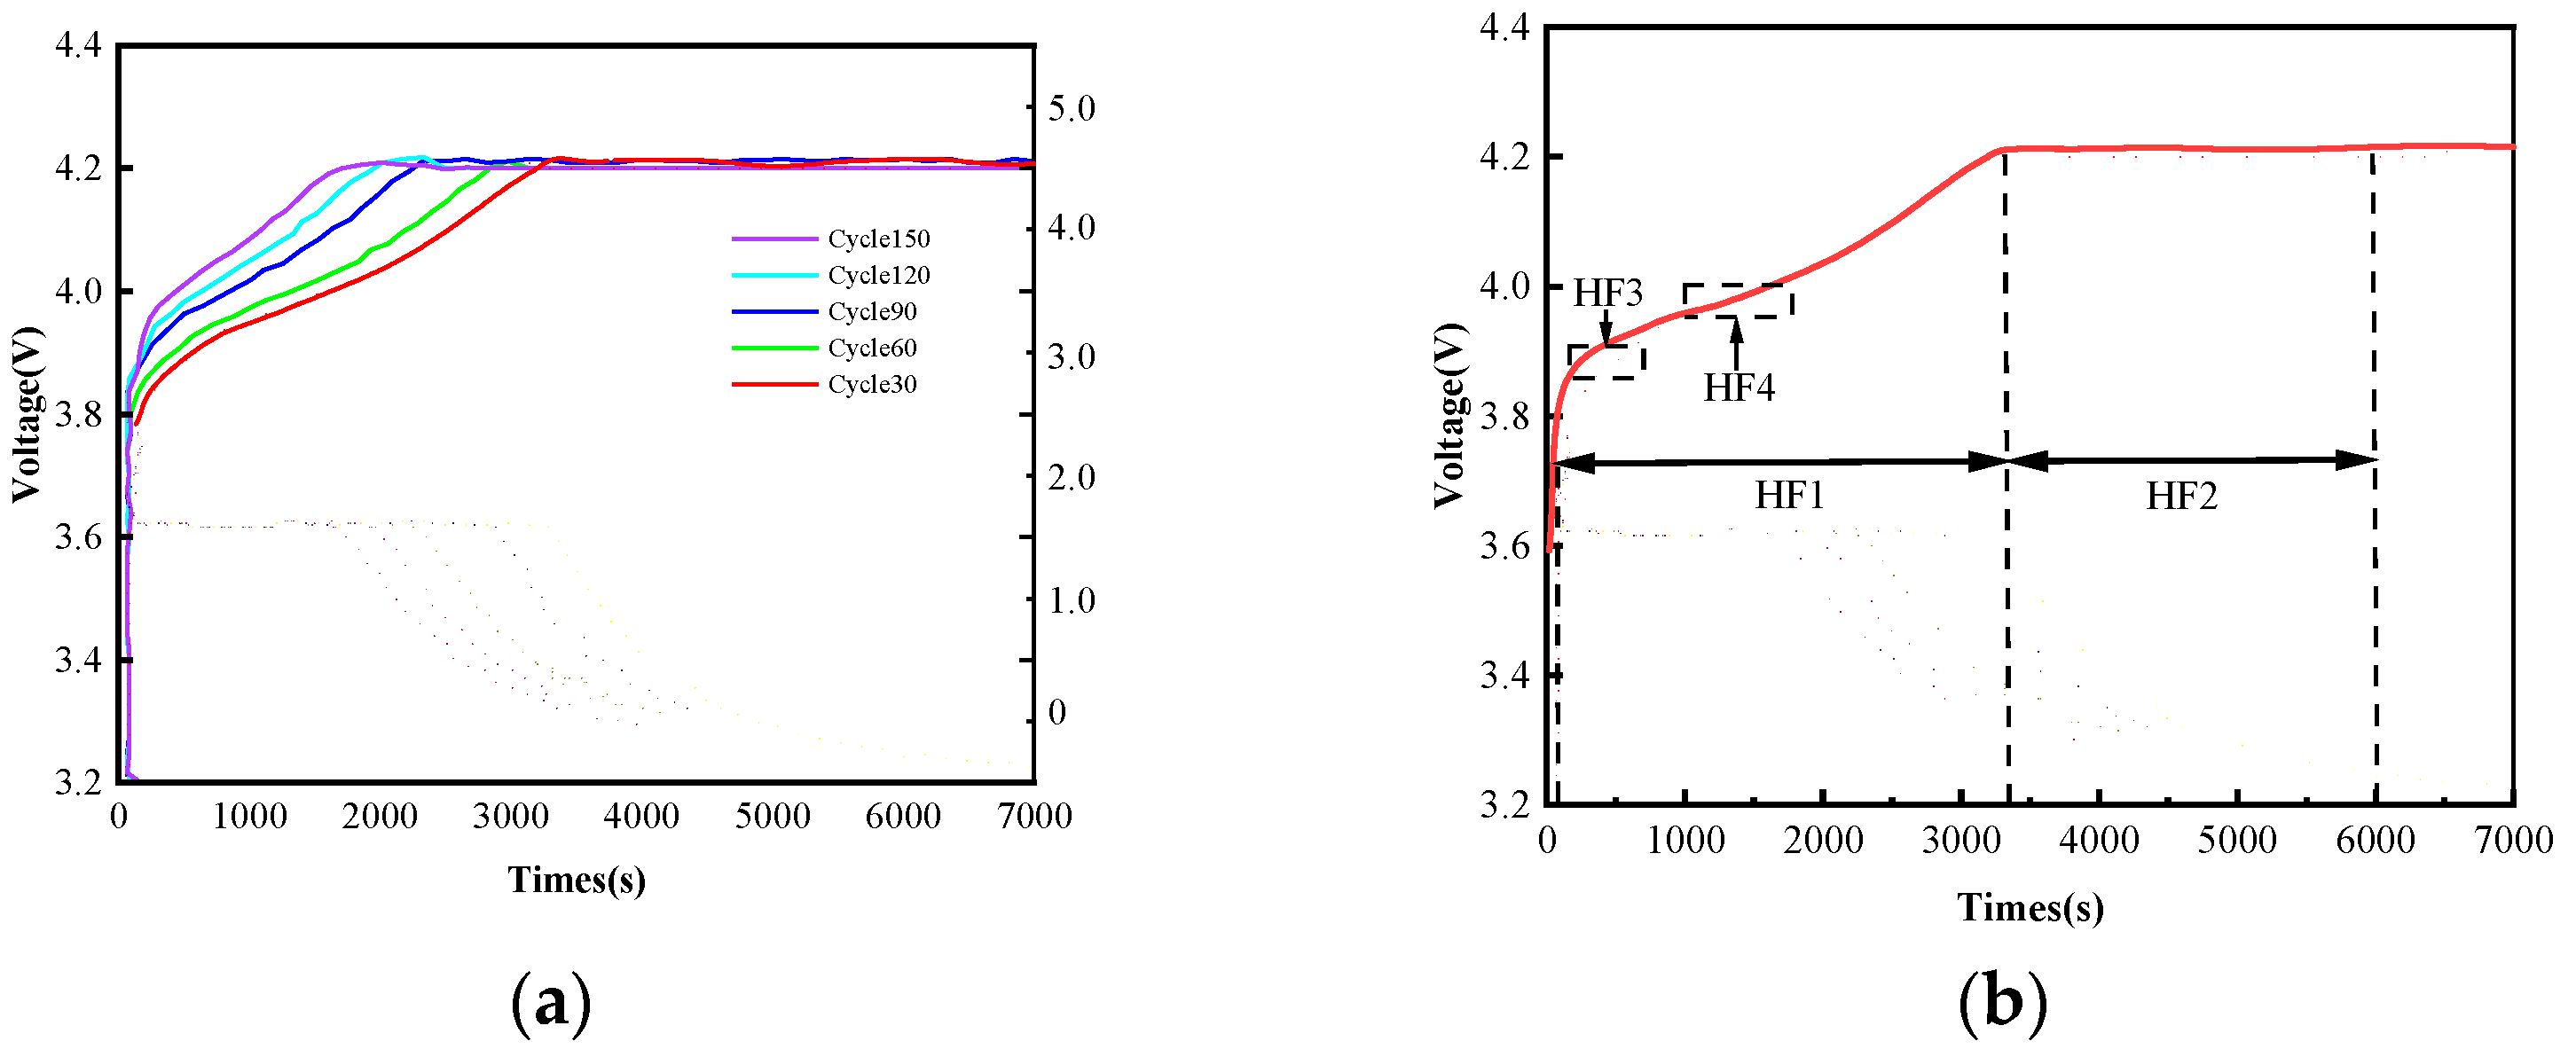
A large number of studies have shown that the charging voltage curve has a certain rule of change over time [20]. Taking the data of the battery numbered CS2-36 as an example, Figure 2a shows the charging voltage curves under different cycle times, with the increase in cycle times, the constant-current charging time is decreasing, while the constant-voltage charging time is increasing. For example, when cycling 30 times, the constant-voltage charging time is about 1500 s, while when cycling 150 times, the constant-voltage charging time increases to 3000 s. This phenomenon is caused by the decay of Li-ion battery materials over time. The charging time in the constant voltage stage tends to increase, and the slope of the curve in the constant-current charging stage gradually becomes steeper. In addition, the charging process of the battery is more stable than the discharging process, and the features extracted from it can be better adapted to different working conditions. Therefore, in this paper, four typical measurable parameters are extracted from the charging voltage curve of Li-ion batteries as HFs: constant-current charging time, constant-voltage charging time, optimal interval isobaric charging time, optimal interval isobaric charging voltage rise, and are named as HF1 to HF4. The specific meanings corresponding to each characteristic parameter in the charging voltage curve are shown in Figure 2b.
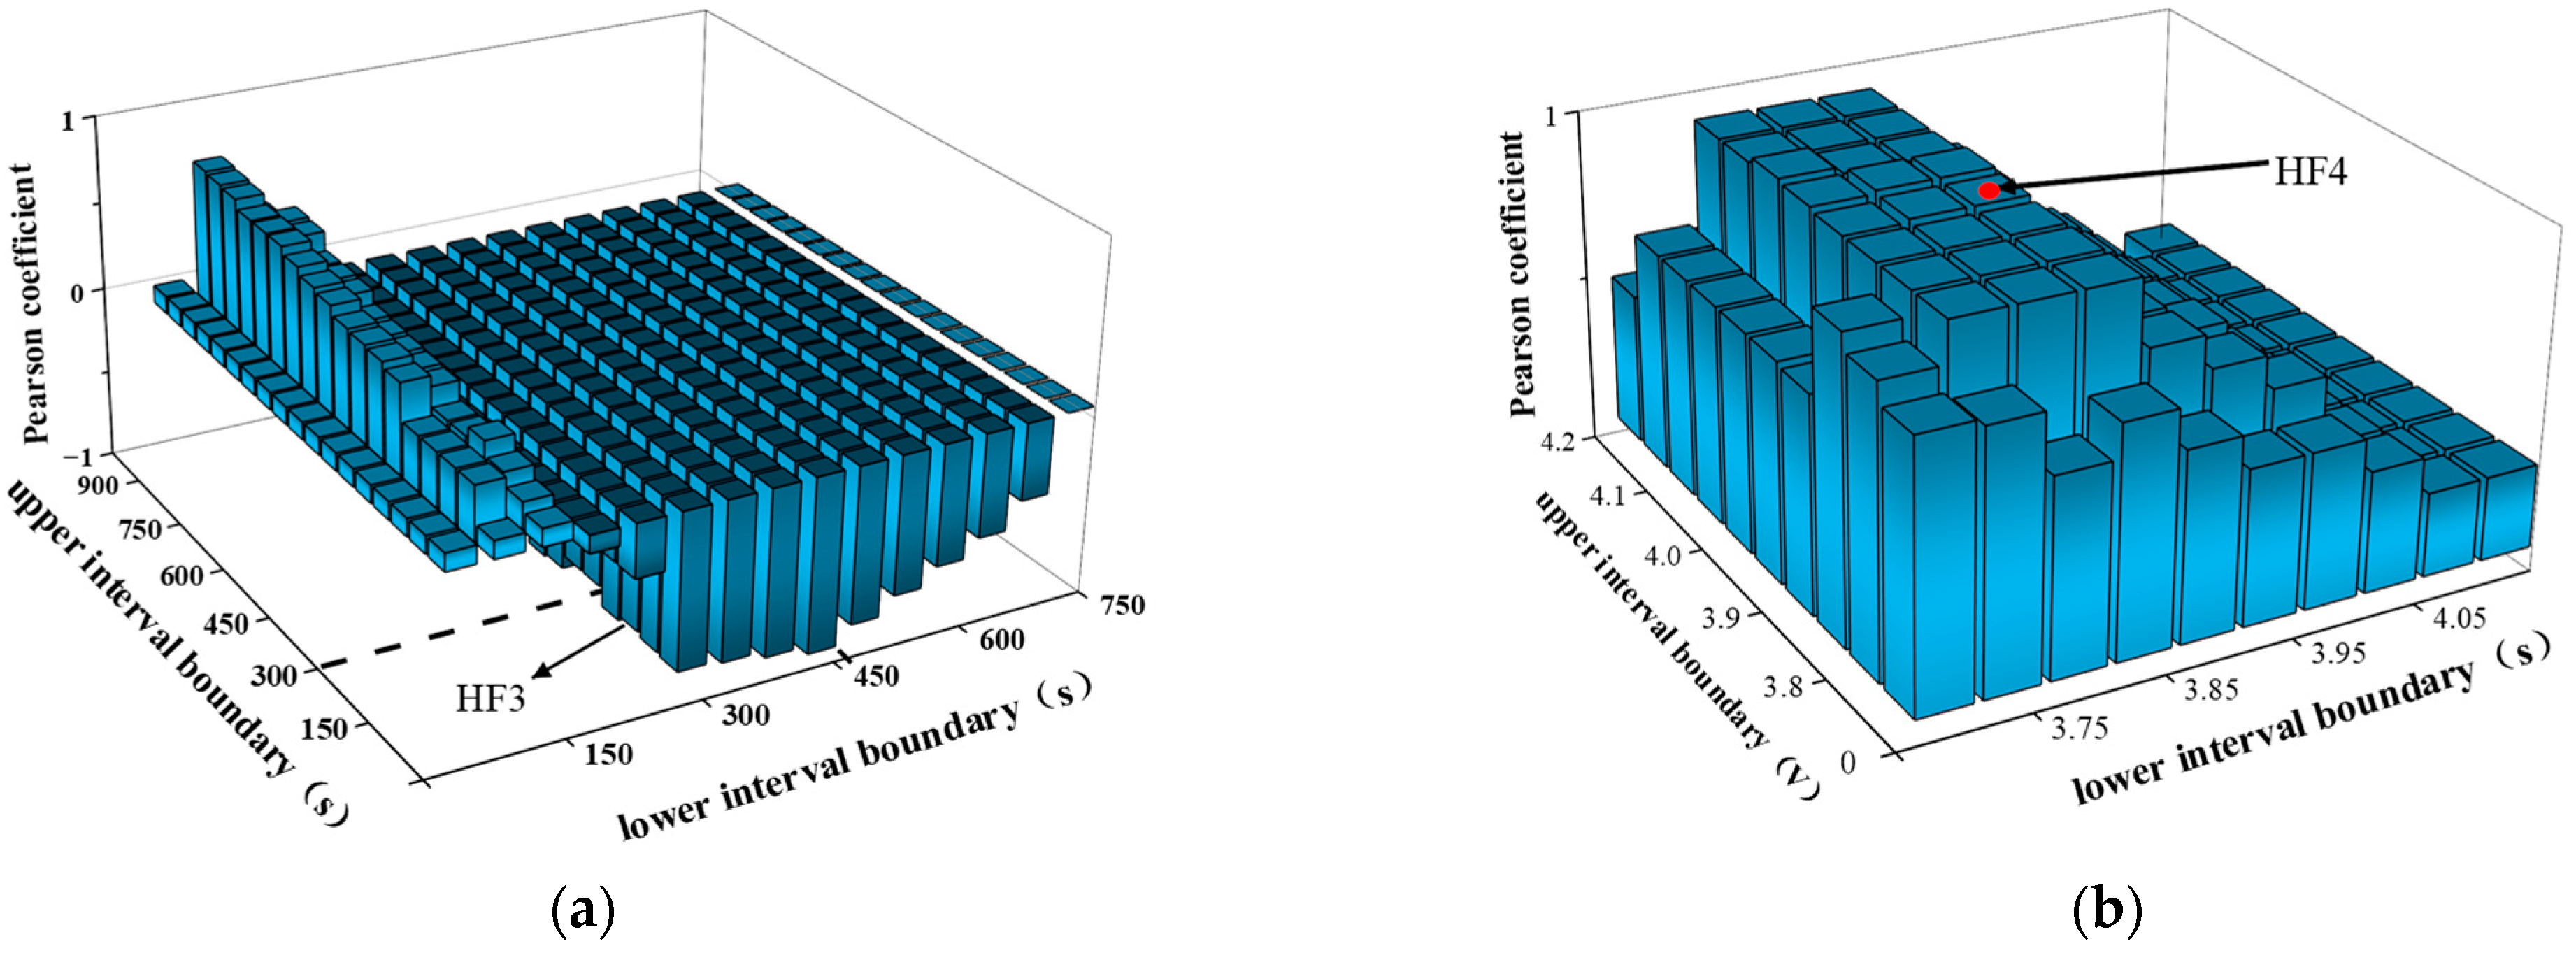
In addition, in order to extract the segment features HF3 and HF4 in the voltage profile, this paper uses the traversal method, which traverses the charging voltage profile by adjusting the time–voltage interval in order to obtain the relevant charging intervals of the features HF3 and HF4 [21,22]. And using the correlation calculation method in Section 2.5, the feature parameters corresponding to the time intervals and voltage intervals with the largest correlation coefficients are taken as the target features HF3 and HF4, which finally result in the charging intervals of [300, 450] s for HF3, and [3.85, 4.00] V for HF4. This traversal process is shown in Figure 3.

2.4. Second-Order Processing Feature Extraction

Battery second-order processing curves are obtained by derivation calculations on the battery monitoring data collected by the BMS, such as battery capacity increment curves, differential voltage curves, and so on.
The first-order derivative of the terminal voltage–capacity (VQ) curve under constant-current charging or discharging conditions is used to obtain the terminal voltage–capacity rate of change (VdQ/dV) curve, based on which the incremental capacity analysis (ICA) method is developed [23]. This type of method is based on the battery charge/discharge voltage curve, and several characteristic parameters (including peak height, peak position, etc.) are extracted from the IC curve to be analyzed as health characteristics. The IC curve can illustrate the phase change characteristics of the battery during the insertion of lithium-ion active materials, including information about lithium ions participating in electrochemical reactions under different aging states of the battery. During the CC discharge of the Li-ion battery, the IC calculation formula can be expressed as:
d Q d V = d Q d T d T d V = I d T d V
where Q , V , I , and T are the battery capacity, charge/discharge voltage, charge/discharge current, and charge/discharge time, respectively.
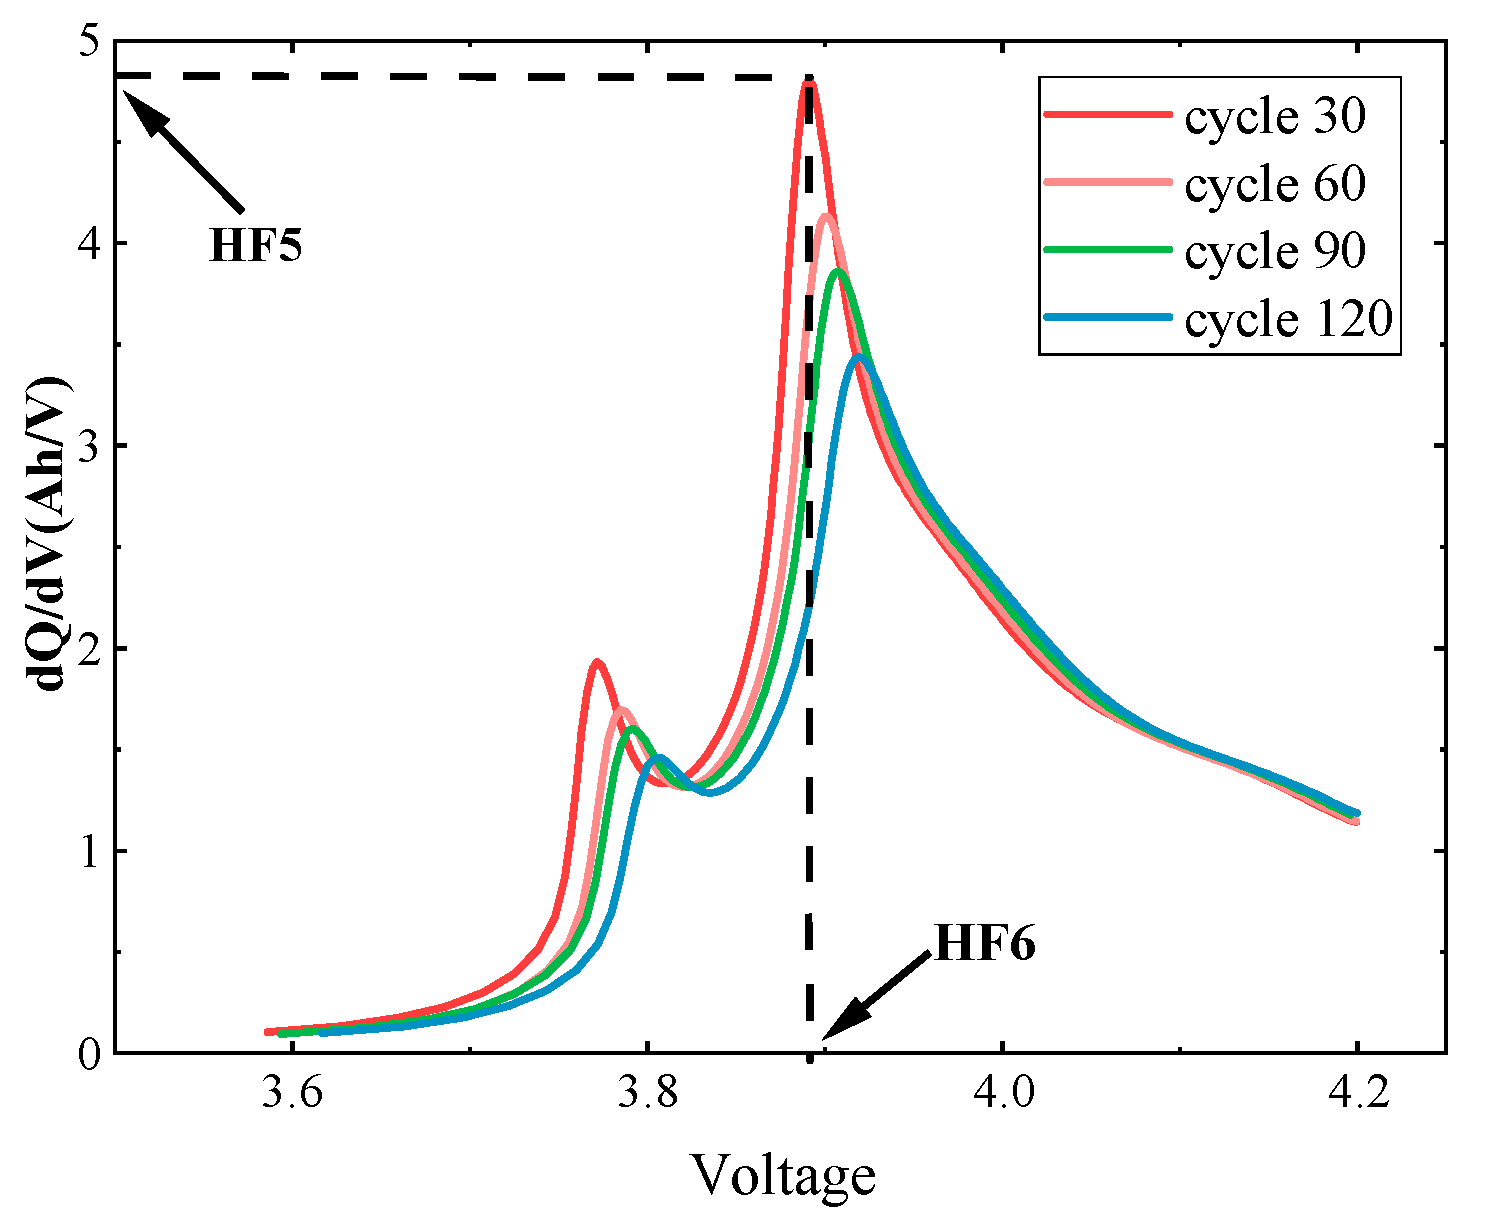
Figure 4 shows the IC curves of Li-ion batteries under different cycle times. It can be found that the peak value of IC gradually decreases and moves to the right as the number of cycles increases [24]. The reason for this phenomenon is that the electron transfer ability of the internal active material embedded in lithium gradually decreases during the charging and discharging process of the battery. In this paper, the peaks of the IC curves and the voltages at their corresponding positions are extracted as IC HFs, which are denoted as HF5 and HF6.
Differential Voltage (DV) value combines the external characteristics of the battery with the internal electrochemical process to reflect the degradation state of the battery capacity through the rate of change in voltage under a specific capacity increment [25]. According to the external characteristics of the battery, the capacity of the battery is measured by coulometer method, and its calculation formula is shown in Equation (3); then, the differential voltage curve is expressed in Equation (4). According to the electrochemical process inside the battery, the differential voltage of the battery is calculated as Equation (5). The DV curve of battery charging is shown in Figure 5.
Q = t = 1 r I d t
d V d Q = d V I × d T = 1 I × d V d T
d V c e l l ( Q ) d Q = d V p ( Q ) d Q d V n ( Q ) d Q = 1 m p d V p ( q p ) d q p 1 m n d V n ( q n ) d q n
From Equations (3)–(5) [26], it can be seen that the differential voltage inflection point value and its location are related to the battery capacity degradation [26]; therefore, the initial inflection point value of the charging differential voltage curve and its corresponding amount of time, and the peak value of the discharging differential voltage curve and its corresponding voltage value, are used as the indirect health factors for the SOH prediction of the batteries, which are denoted as HF7-HF8.

2.5. Feature Correlation Analysis

From the above analysis, it can be seen that the pattern of change of each extracted HF with battery aging is not consistent, and it is difficult to directly determine its correlation with capacity. Therefore, this paper adopts the Pearson correlation coefficient to further quantify the characteristic expression ability of each HF [27]. The Pearson correlation coefficient can effectively analyze the linear correlation between two variables, the larger the absolute value indicates that the correlation between the variables is higher, and if the absolute value is 1, it means that the two are completely correlated. Its calculation expression is:
P e a r s o n = E ( x y ) E ( X ) E ( Y ) E ( X 2 ) E 2 ( X ) E ( Y 2 ) E 2 ( Y )
where X and Y are the extracted feature samples and battery capacity samples, respectively. Table 1 shows the Pearson correlation coefficients between each HF and battery capacity for four different batteries, which confirms the correlation between the eight extracted feature parameters and the battery capacity.

3. Causal Convolutional Self-Attention-Based Health State Prediction Model for CCN-Informer Batteries

3.1. Causal Convolutional Neural Network

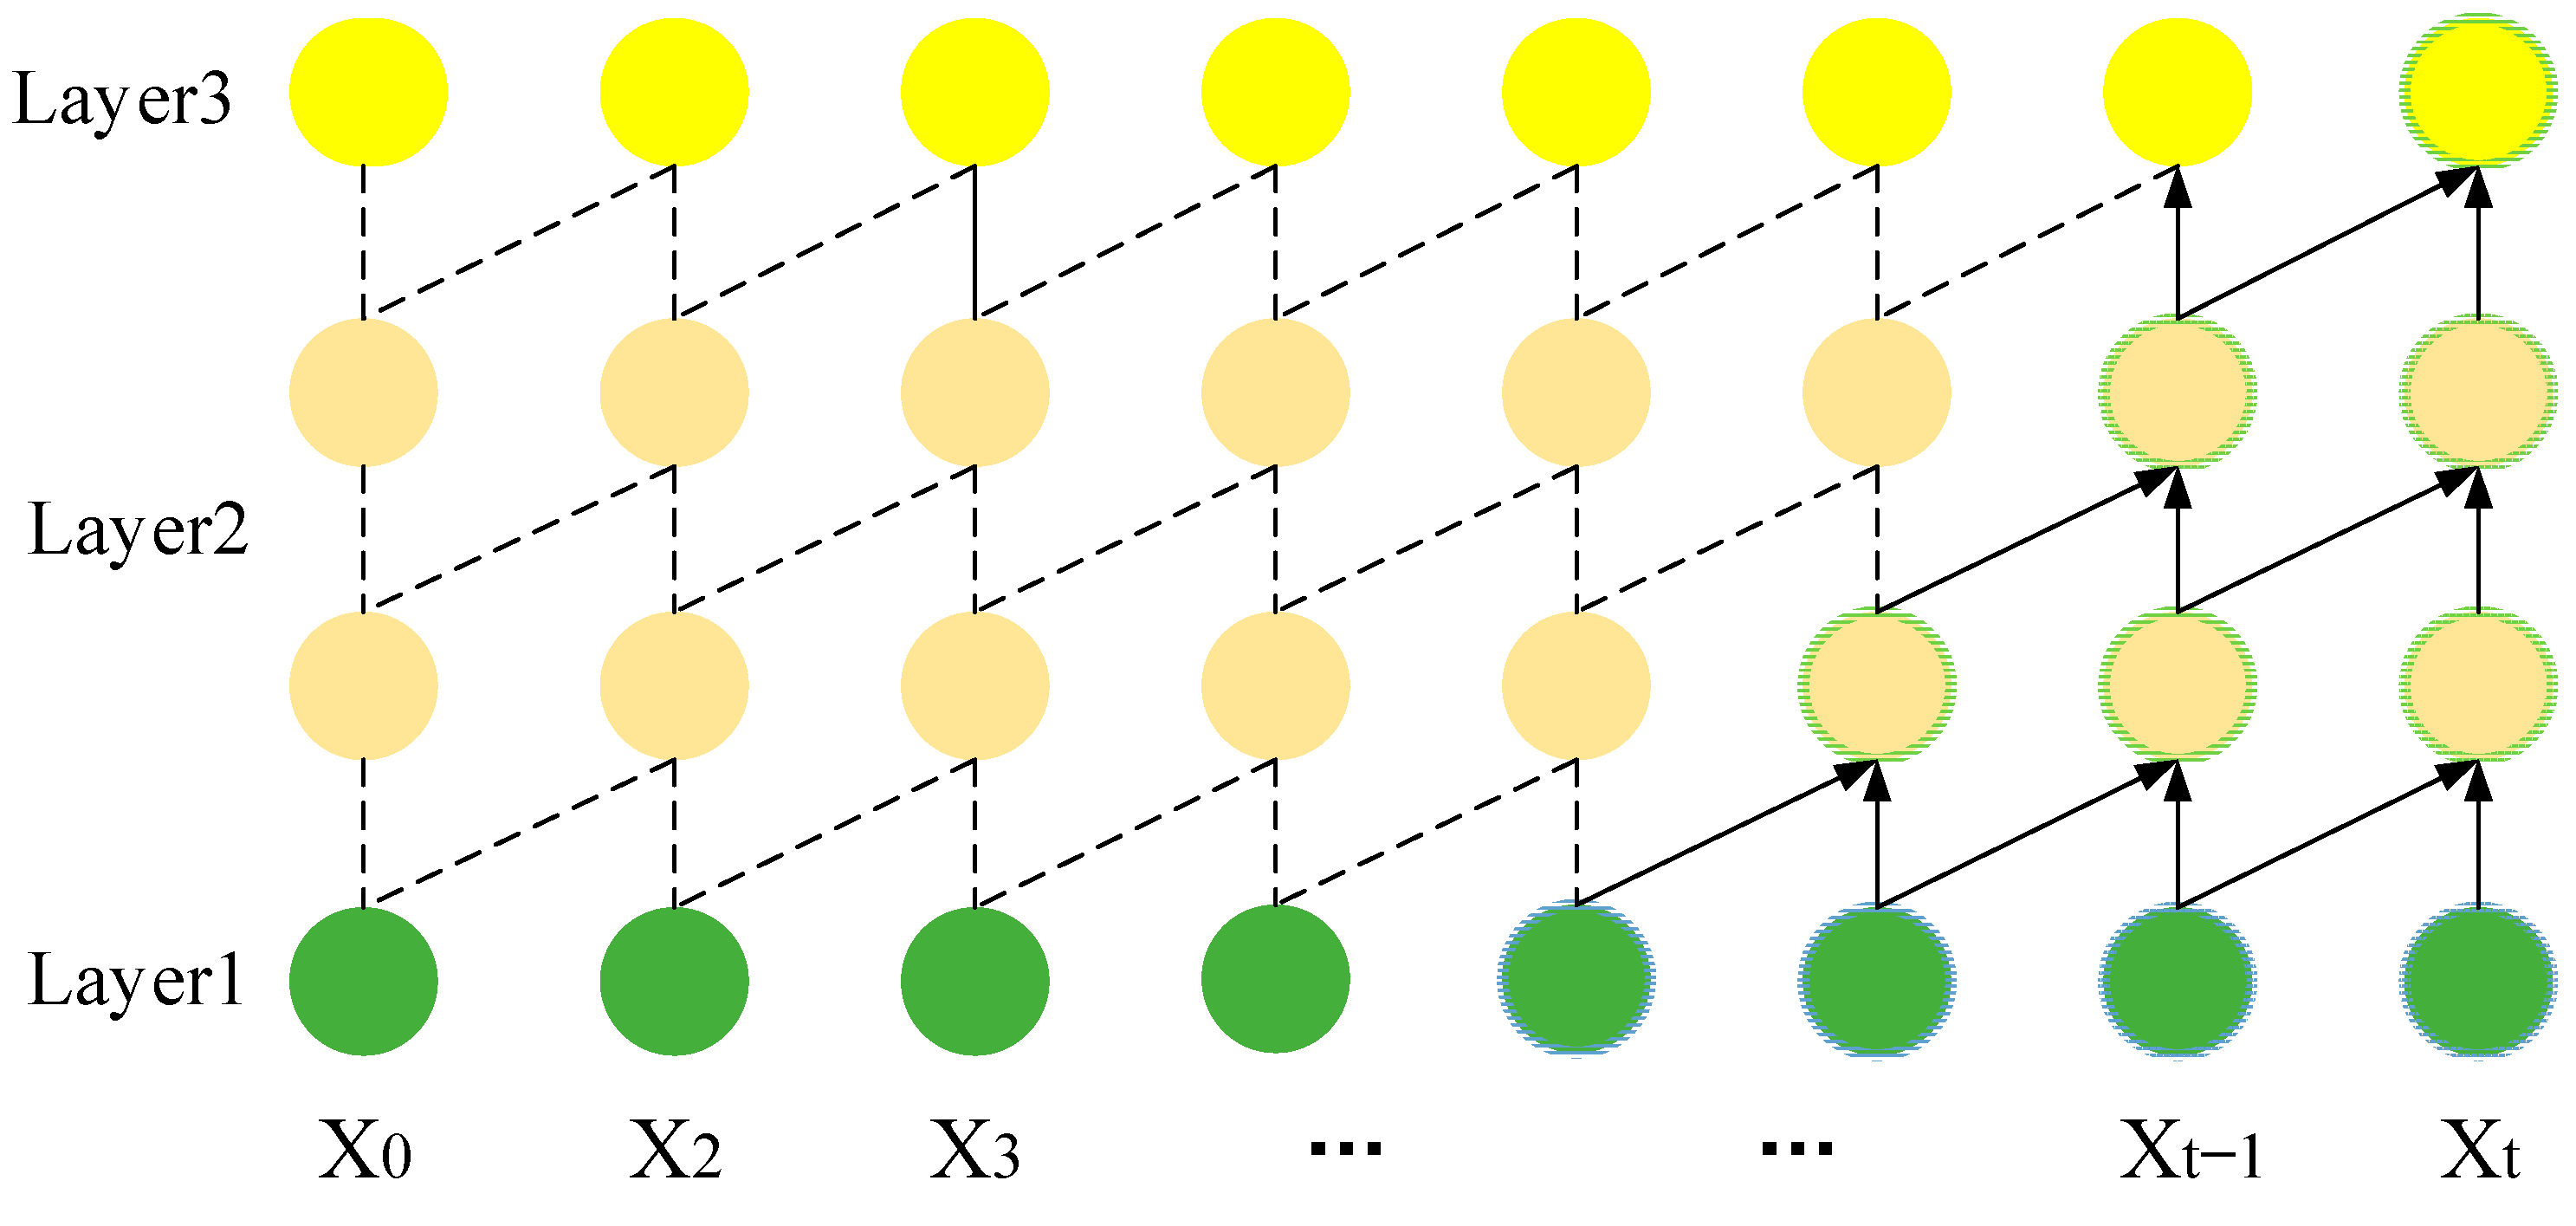
Causal convolutional neural network (CCN) consists of input, hidden, and output layers, respectively. Each layer uses the same type of neurons, and each layer is realized by masking with non-full connectivity between them [28]. Its structure is shown in Figure 6.
Layer1 denotes the input layer for inputting feature vectors, Layer2 denotes the hidden layer for extracting information from the original data, and Layer3 denotes the output layer for outputting results. A convolution kernel of size k is used, and the expression of the causal convolution function F for input X is:
F ( s ) = ( X f ) ( s ) = i k 1 f ( i ) x s i
where s denotes the input time series information, and s i denotes the localization of a certain location information in history. The convolution kernel k is used to set the sampling frequency of the network, and the edge positions are appropriately filled to ensure that the output and input dimensions are consistent. By deepening the layers of the network, the next layer of the causal convolutional neural network will have a wider field of view of the historical information of the neurons in the previous layer. The causal convolutional neural network in Figure 6 mainly stacks three one-dimensional convolutional layers with convolution kernel 2, and after three convolutions, the output has four fields of view of historical information.

3.2. Self-Attention Mechanisms Incorporating Causal Convolutions

The self-attention mechanism focuses on the correlation between different parts of the whole input, enabling the model to pay more attention to the critical information of the current task and less attention to other non-critical information in a large amount of information. The formula for the original self-attention internal operation model is:
A ( Q , K , V ) = Softmax ( Q K T d * ) V
In the conventional self-attention mechanism, the correlation between query q and index k is calculated based on the point-by-point dot product of the two, and the corresponding weighted aggregation is carried out, which does not incorporate the local information before and after the current node, and it is easy to ignore the influence of the change in the surrounding environmental factors at the current point in time.
The causal convolutional self-attention in this paper incorporates causal convolutional neural network characteristics in the canonical self-attention, fully considering that the time data have a strong dependence on the characteristics of the temporal dimension as well as the abnormal fluctuation problem that may occur; it deals with the time series problem by incorporating the input sequences into a one-dimensional causal convolutional module, using the convolution to extract the information around each node, and then utilizing the self-attention mechanism to learn the node relationships between them. At this point, the query q and index k in self-attention rely on the convolved information for computation, which enhances the similarity expression ability of the two in combination with local information, and the value vector maintains the characteristics of the sequence itself. By choosing different sizes of convolution kernel k, the causal convolution self-attention is able to focus on the influence of different scopes of local temporal information around the time point, instead of only considering the long-term dependency of a single time point of the regular pattern, which helps to make accurate predictions. The internal structure of the self-attention mechanism incorporating causal convolution is shown in Figure 7 in the following steps:
(1)
Using the feature that causal convolution can capture local features, the input time series is subjected to a one-dimensional convolution operation, the one-dimensional convolution kernel parameter is set to k, which is used to set the sampling frequency of the network, and the number of convolution kernels is gn, which yields the query vector q [ k , g n ] and the key value k [ k , g n ] .
(2)
Q and K for similarity calculation, which is Softmax-normalized to obtain the weights on the time series as shown in Equation (8).
(3)
After the fully connected layer is converted into a value vector V with the same shape as the result of the weight calculation, it is subjected to matrix dot product to obtain the data with attention features.

3.3. Informer Model Structure

Informer is a supervised learning model based on self-attention mechanism, which is mainly composed of four parts: input module, encoder, decoder, and output module. The encoder can obtain robust remote dependence of long sequence inputs, and the decoder realizes one-step generation of predicted output results, which effectively solves the problems of Transformer in time series prediction and computational complexity. The interior of its encoder consists of a stack of multi-head probabilistic sparse self-attention and distillation layers [29]. The encoder input vector expression is:
x e n = x t
where the encoder input x e n comes from the historical data of the training model. In addition, the decoder input vector expression is:
x e d = x 2 n d h a l f t + x 0
where the decoder input x e d consists of a partial sequence from the encoder and a zero-filled prediction sequence. The Informer model uses multi-head probabilistic sparse self-attention in the encoding and decoding layers to optimize the point-by-point accumulation operation of the original Transformer self-attention, which reduces the cost of the original self-attention quadratic dot product computation. Probabilistic sparsity self-attention uses a small number of dot products contributing to the main attention to pick out values whose probability distribution of attention for the corresponding query is far from the uniform distribution, converting the self-attention formula expression into a probabilistic formula:
A ( q i , k , ν ) = j L k k ( q i , k j ) i k ( q i , k i ) = E ρ ( k j q i ) [ ν i ]
p ( k j , q i ) = k ( q i , k j ) l k ( q i , k l )
q ( k j , q i ) = 1 L k
where let q i , k l , and ν i denote the i-th row in Q , K , and V , respectively. p ( k j , q i ) denotes the probability distribution of the attention of the i th query for all keys. q ( k j , q i ) denotes the uniform distribution of query.
Using KL scatter formula, the distance between P and Q distributions is calculated as a measure of the sparsity of the query, and the discrete KL scatter is defined as follows:
D ( P Q ) = i X P ( i ) [ log ( P ( i ) Q ( i ) ) ]
D ( P Q ) = x P ( x ) [ log ( P ( i ) Q ( i ) ) ] d x
The attention probability distribution and uniform distribution of the query are added to the KL dispersion, and the approximate expression for the sparsity of the query is finally defined as:
K L ( q p ) = max j { q , k j T d * ) 1 L k j = 1 L k ( q i k j T d * )
In the formula, the first term calculates the inner product of the i th query and all keys and selects the maximum value of it. Comparing with the arithmetic mean of the second term, the larger the difference of the result, the larger the variability of p and q is. In the set selection interval, the query with the higher difference ranking is selected, at this time, the dot product operation formula of sparsity probability self-attention in the Informer model is:
A ( Q , K , V ) = Softmax ( Q ¯ K T d * )
where Q denotes the first n query selected by sparsity computation. At this point, the value corresponding to the unselected query will be updated using the mean value.
Convolutional pooling is added between adjacent self-attention layers to perform a down-sampling operation on the output features of the self-attention, which effectively reduces the network parameters and output dimensions. The distillation operation from self-attention m to m + 1 layer is calculated as:
X m + 1 t = M A X P o o l ( E L U ( C o n v l d [ X m + 1 t ] A B )
where [ X m + 1 t ] A B denotes the output information of the sparse self-attention with multiple probabilities, Convld denotes the maximum pooling one-dimensional convolution operation on the time series, and ELU denotes the activation function. After the pooling layer, the length of the output sequence of the self-attention layer will be reduced by half.
The mask self-attention mechanism is generally used in decoders and serves to ensure that the prediction of the current moment is not affected by unknown future information. After the self-attention computation in this layer, the output query q and the index k and value of the encoder output in the last layer are fed into the encoder–decoder multi-attention layer, where the features of the encoder are incorporated into the decoder and recomputed [30,31]. Finally, after the fully connected layer, the long time series prediction output is obtained.
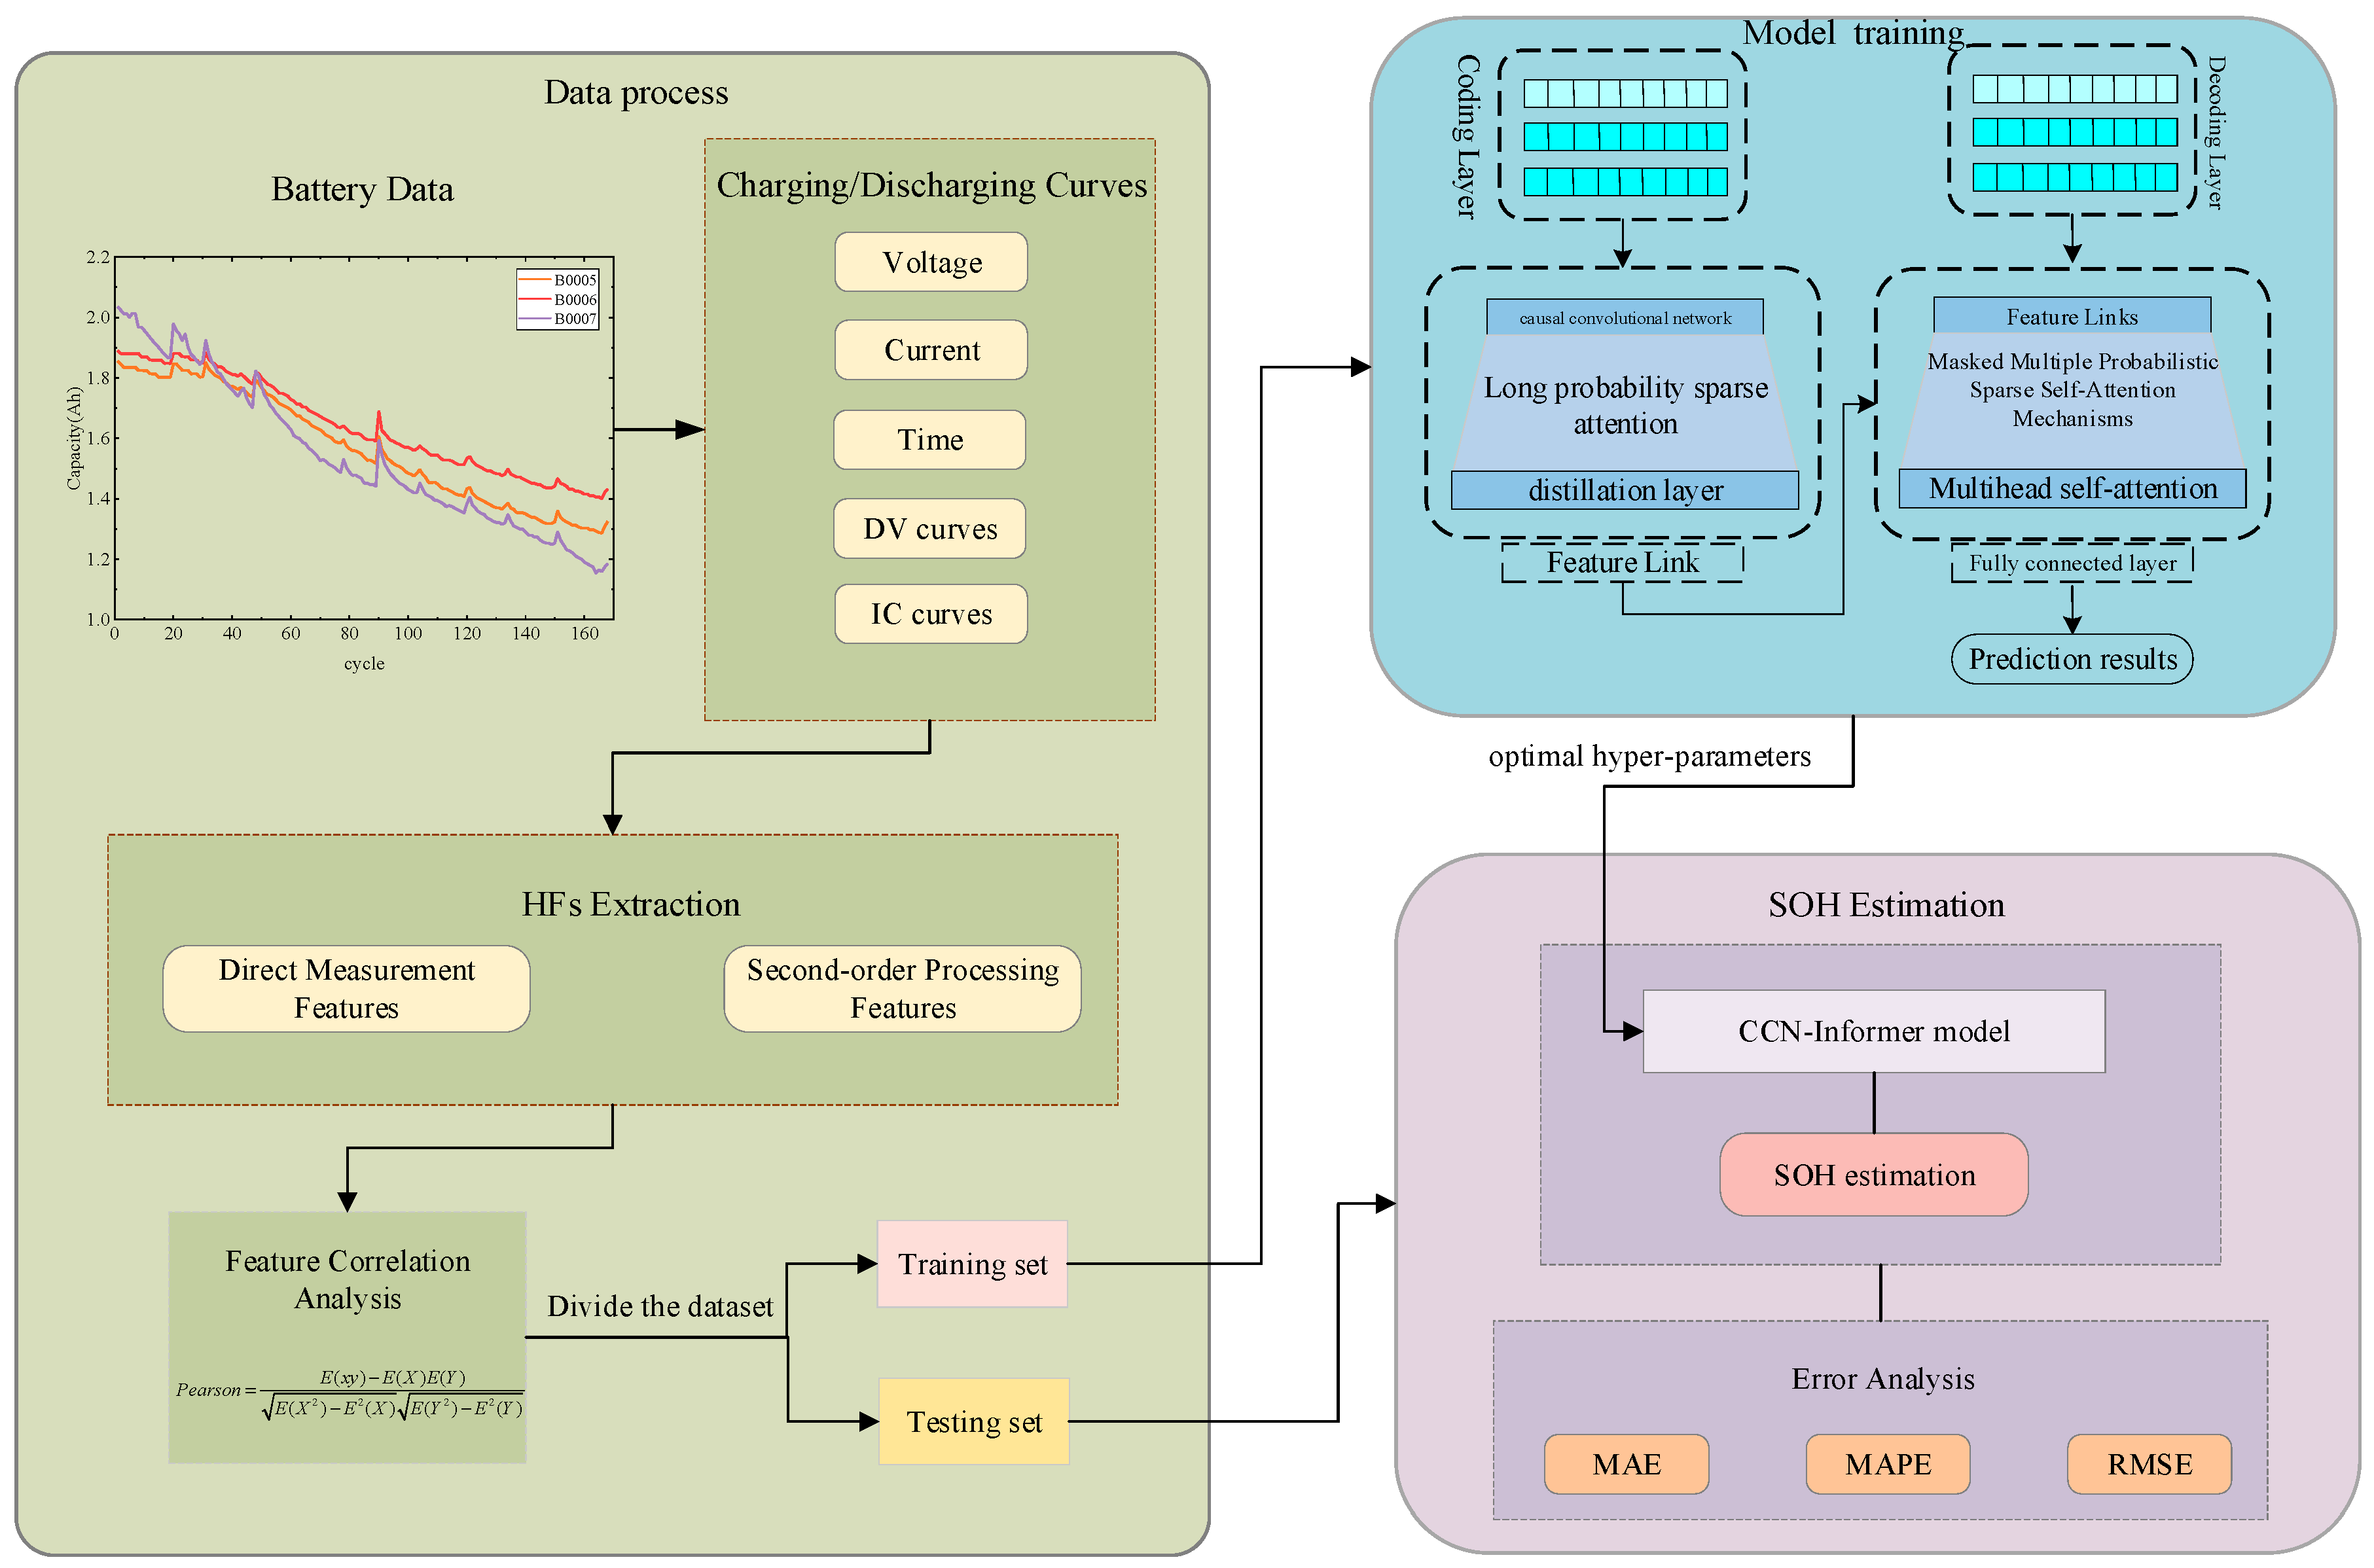
The prediction model based on causal convolutional self-attention and Informer is shown in Figure 8.

4. Calculation Validation and Analysis

4.1. Evaluation Indicators

In order to better quantify the SOH assessment accuracy of the proposed method, this paper introduces the mean absolute error (MAE), root-mean-square error (RMSE), mean absolute percentage error (MAPE), and decision coefficient (R2) to evaluate the error between the assessed value of the algorithm and the true value, which is calculated as shown in the following formula [32,33]:
M A E = 1 N i = 1 N | y i y i |
R M S E = 1 N i = 1 N ( y i y i ) 2
M A P E = 1 N i = 1 N y i y i y i
R 2 = 1 i = 1 N ( y i y i ) 2 i = 1 N ( y i y ) 2
where y i is the true SOH of the battery under the ith charging cycle; y i is the SOH of the battery evaluated by the model under the ith charging cycle; and N is the total number of charging cycles.

4.2. Analyzing and Validating the Prediction Results of Different Datasets

After constructing the structure of the CCN-Informer model, the datasets are analyzed and validated. In this paper, the leave-one-out validation method is used to produce the training set and validation set, i.e., the data of one battery are selected each time to produce the validation set, and the data of the remaining batteries are used as the training set, and it is repeated for four times until the data of each battery are validated as completing the validation process once [30]. The battery charging data used for validation are extracted as health features and then input into the trained CCN-Informer model to obtain the health state assessment results of this battery, and a 95% confidence interval is introduced to judge the reliability of the prediction results, i.e., the maximum allowable error range is [−0.05, 0.05].
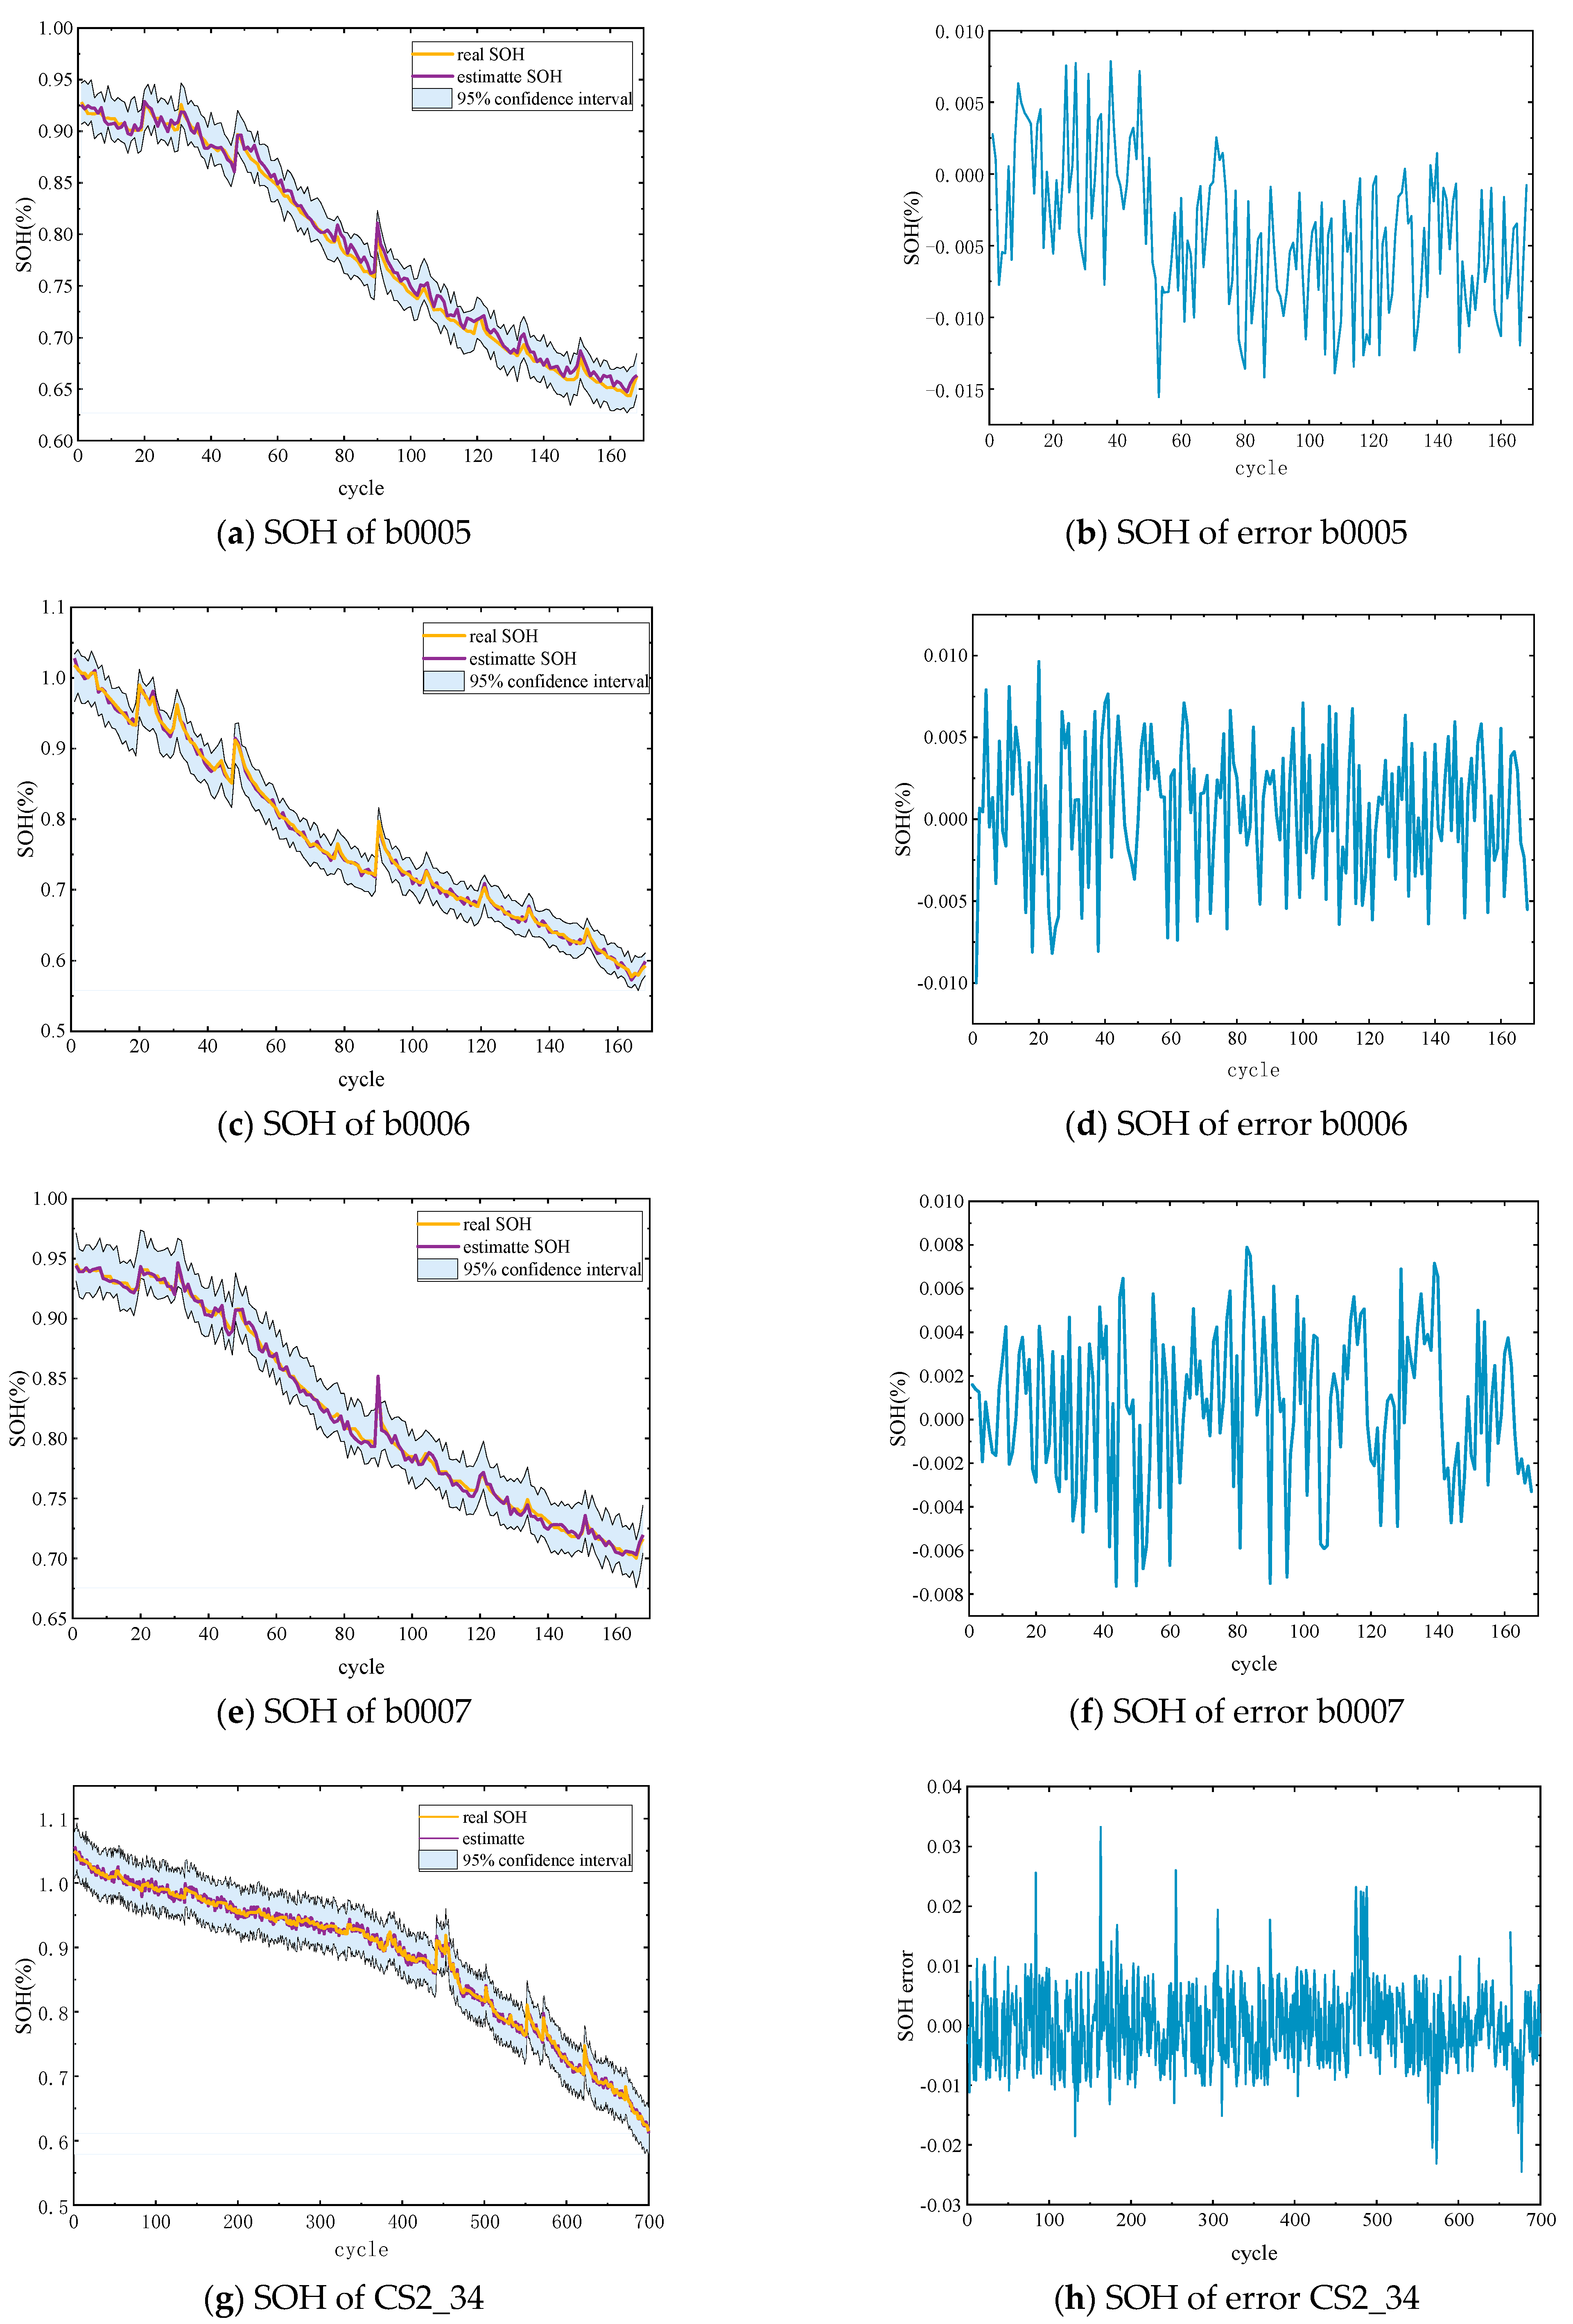
Figure 9 shows the SOH estimates and their relative error distributions for the six cell monomers under the CCN-Informer model. It can be found that the SOH curves predicted by the two types of datasets with a total of six battery monomers are in general agreement with the actual situation. The bandwidth in the figure indicates the uncertainty of the estimated model. In general, the smaller the 95% area, the more reliable the fixed value. The estimation result plots show that the bandwidths of all six tested battery cells are small. By analyzing the relative errors of the different cells, it can be seen that the relative errors on each cell are small, with most points having deviations in the range of [−0.02, 0.02]. The results of the monomer SOH prediction for the six cells are given in Table 2. From the table, it can be seen that the best estimated single cell in the CALCE dataset is CS2_36, with MAE, MAPE, RMSE, and R2 of 0.40%, 1.50%, 0.65%, and 99.87%, respectively. The best SOH-estimated cell in the NASA dataset is B0007, with MAE, MAPE, RMSE, and R2 of 0.27%, 1.27%, 0.23%, and 99.89%, respectively. The above results show that the method proposed in this paper can accurately identify the SOH of Li-ion batteries.

4.3. Comparative Analysis of Different SOH Prediction Models

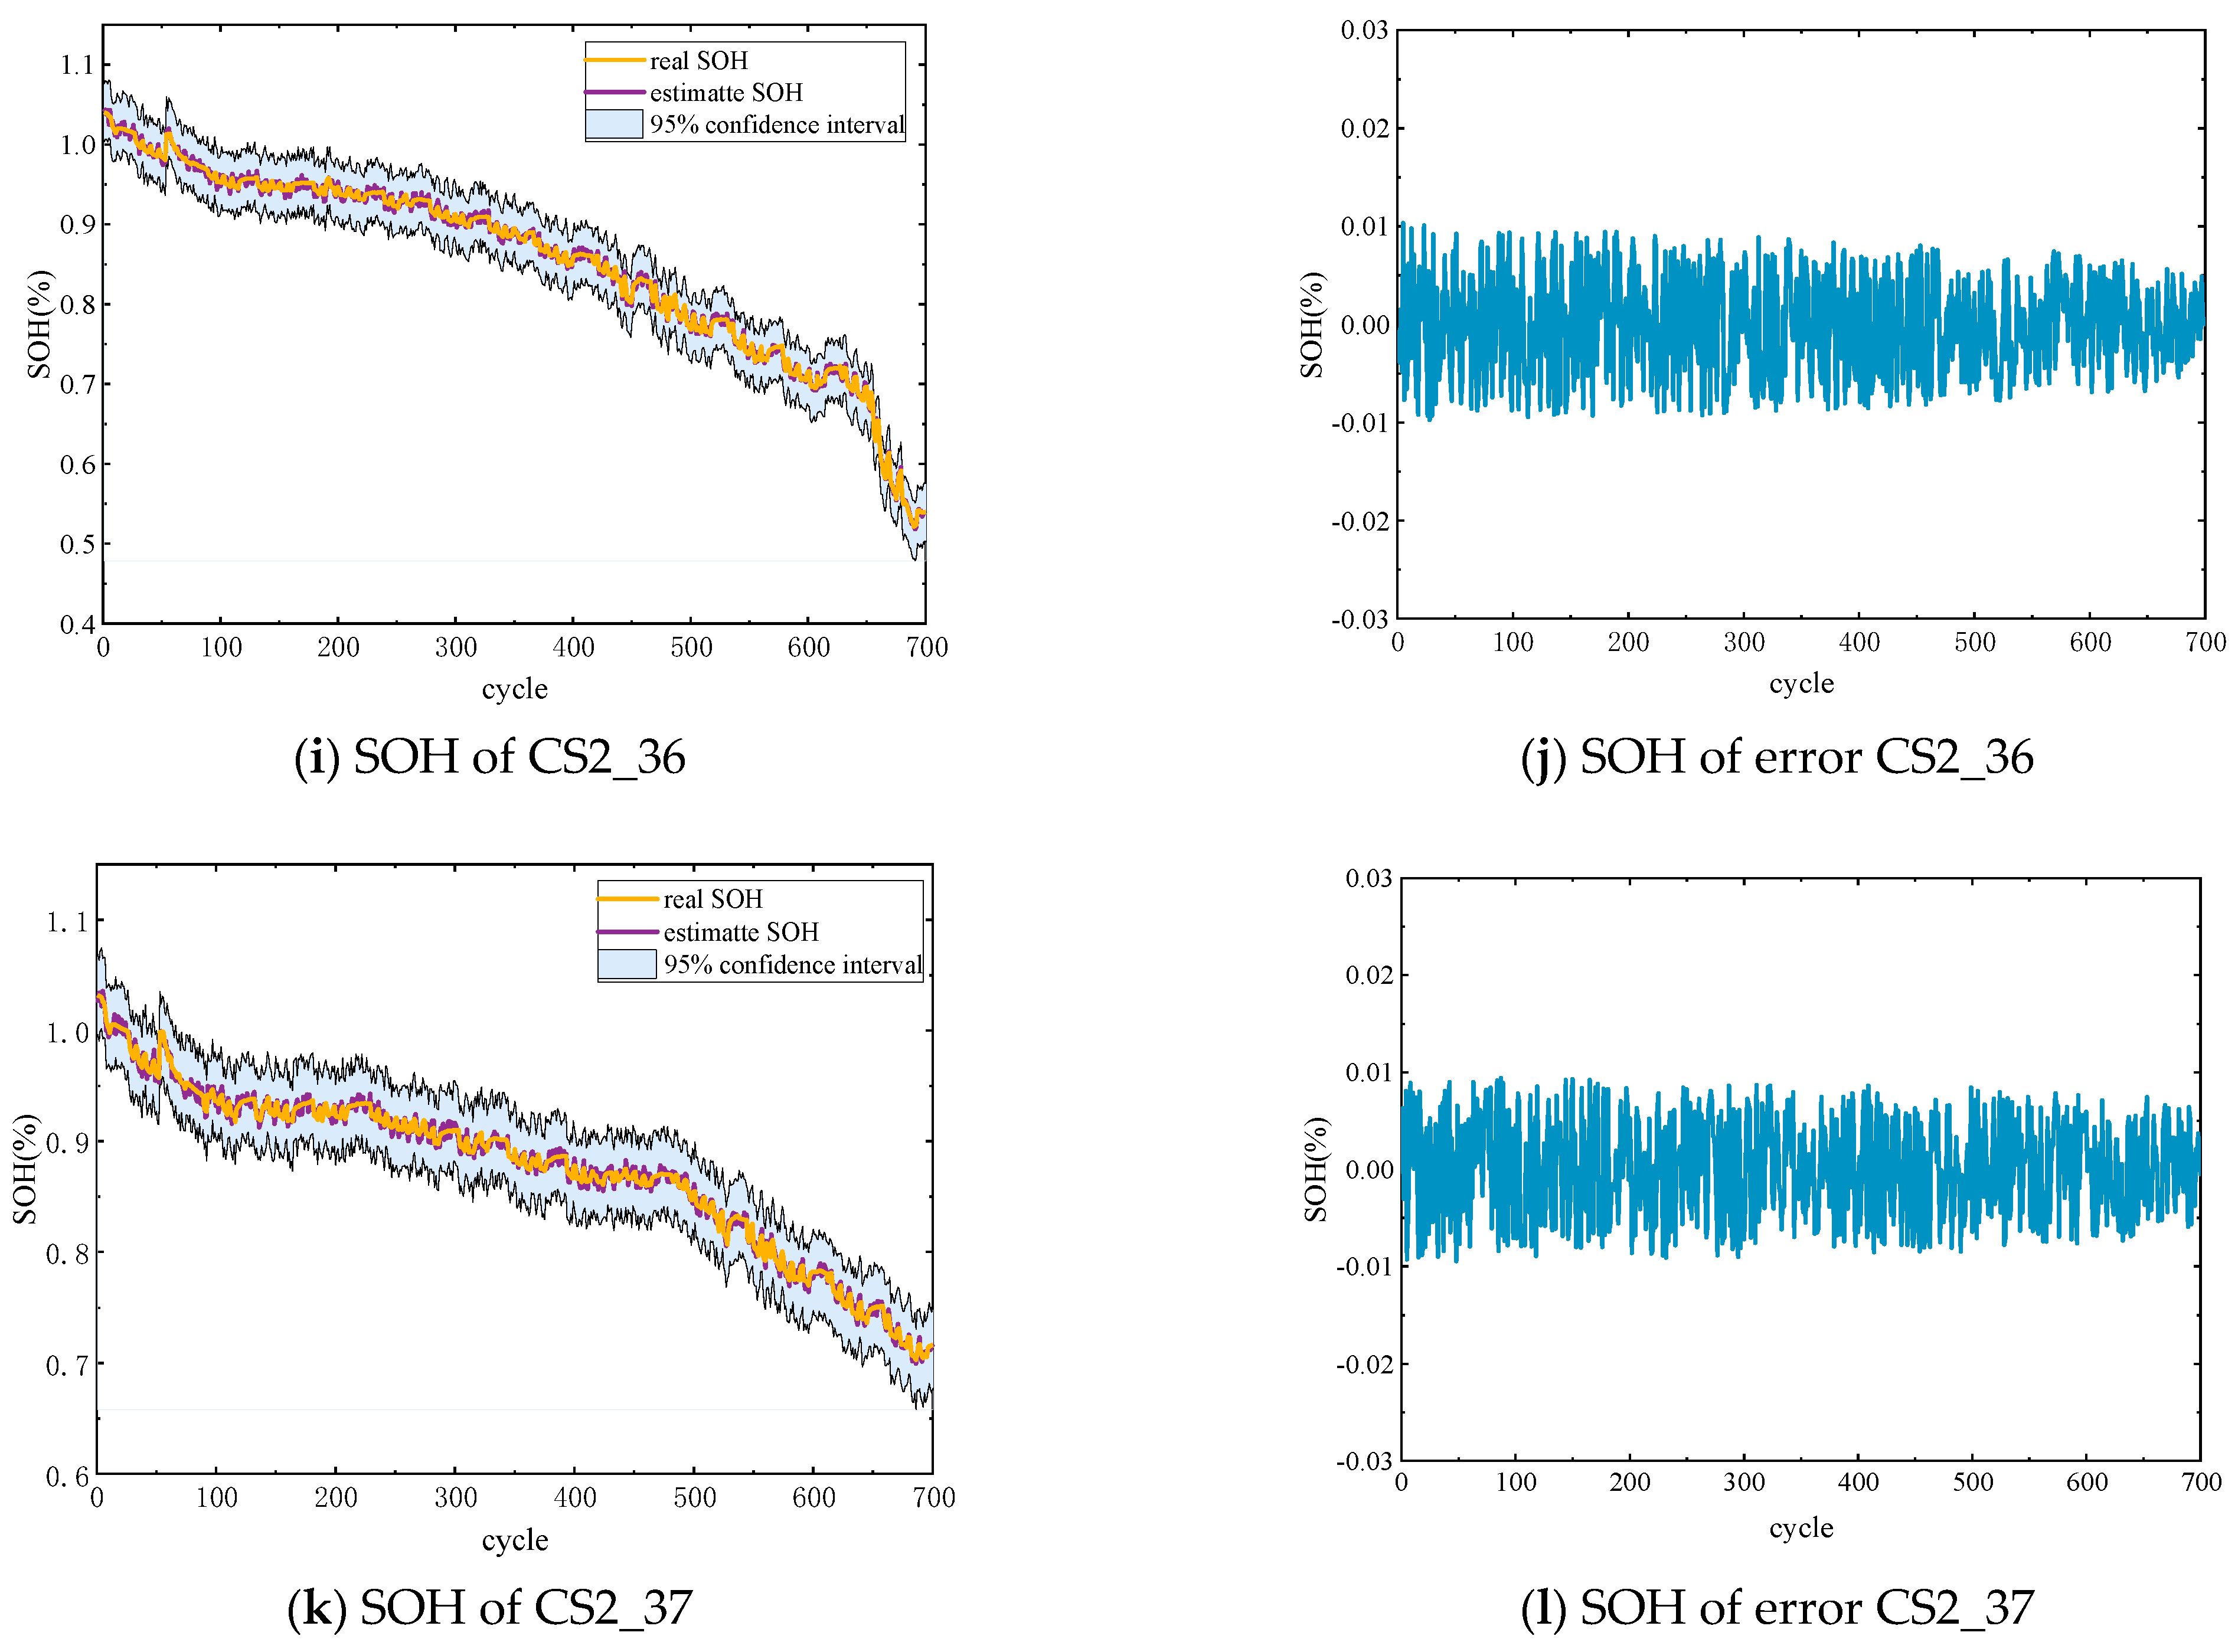
In order to further validate the effectiveness and superiority of the proposed method, a comparative study with the Informer model and LSTM model, which are widely used in the existing Ref. [14], is conducted in this section. The SOH estimation results and errors of the three methods for different batteries are shown in Figure 10.
From the figure, it can be seen that the prediction results of each model are good in the pre-prediction period, but the prediction errors of the Informer model and the LSTM model increase significantly with the increase in the number of prediction steps. This is because during the aging process of Li-ion batteries, the structural changes and complex electrochemical processes within the battery may not be immediately apparent in the pre-capacity degradation stage but have a cumulative effect in the long-term cycling. In the SOH prediction, the four lithium batteries constituting the training set and the test set follow the general aging pattern of the battery type, i.e., the aging trends of the batteries are basically the same. In the early-to-middle stage of prediction, the aging pattern of each battery is relatively single, and each model can basically fulfill the prediction task. However, in fact, it is difficult for the operating state and environment of each battery to be completely consistent, and the uncertainty factors in the prediction will affect the aging changes of different batteries and become more and more significant with the increase in the number of cycles, so the SOH prediction of the sub-models becomes more difficult at the later stage of the prediction. In this paper, the uncertainty problem in the prediction process is solved by introducing the CCN-Informer method, and the CCN-Informer prediction model, compared with LSTM and other predictions, is able to effectively avoid the gradient explosion and other situations that occur in this type of deep neural network, and has higher stability and prediction accuracy, which reflects the advantages of the prediction model in this paper in the problem of SOH prediction of batteries.
Table 3 lists the MAE, MAPE, RMSE, and R2 of the four prediction methods for estimating SOH, and it can be seen that the MAE, MAPE, RMSE, and R2 of the method used in this paper are higher than that of the other three methods. Taking the CS2-34 battery as an example, the MAE, MAPE, RMSE, and R2 of this paper’s method are 0.51%, 1.53%, 0.69%, and 99.77%, respectively; those of the Informer model are 0.77%, 3.84%, 0.79%, and 99.02%, respectively; the MAE, MAPE, RMSE, and R2 are 1.02%, 5.10%, 1.19%, and 97.99%, respectively, for LSTM. From the above analysis, it can be seen that the accuracies of the methods used in this paper are higher than the other two methods, and there is a significant improvement in the accuracy, which also reflects the importance of developing accurate battery state estimation methods.

5. Conclusions

Battery health state assessment is a prerequisite for the safe operation of battery energy storage systems. In this paper, indicators that can reflect the health state of lithium batteries, such as IC, DV, and CC level charge/discharge curves, are fused to obtain the characteristics of lithium-ion battery SOH. The CCN-Informer-based lithium-ion battery SOH assessment and analysis framework is constructed to realize high-precision and stable and reliable lithium battery health state detection and safety assessment, and the main conclusions of this paper are as follows:
  • Eight features that can reflect the health state of the battery are extracted from the battery charge/discharge data, which are categorized into direct measurement features and second-order processing features to effectively and comprehensively describe the degradation of the battery.
  • Improved the Informer model. Add causal convolutional neural network to the self-attention mechanism to enhance the ability of local information extraction, so that the CCN-Informer model has the function of capturing both global and local information, avoiding gradient explosion, and optimizing the model prediction performance.
In summary, the lithium battery health state assessment method based on multiple health features and an improved Informer model proposed in this paper can effectively improve the accuracy and reliability of the prediction results, provide more valuable reference information for battery management and maintenance, and thus guarantee the safe and stable operation of energy storage power stations and other installations with energy storage needs.

Author Contributions

Conceptualization, W.H. and B.Z.; Methodology, J.H.; Investigation, Z.Z.; Resources, Z.S.; Writing—original draft, X.L.; Visualization, Z.M. All authors have read and agreed to the published version of the manuscript.

Funding

This research received no external funding.

Data Availability Statement

The original contributions presented in the study are included in the article, further inquiries can be directed to the corresponding authors.

Conflicts of Interest

The authors declare no conflict of interest.

References

  1. Abdul, D.; Wenqi, J.; Tanveer, A. Prioritization of renewable energy source for electricity generation through AHP-VIKOR integrated methodology. Renew. Energy 2022, 184, 1018–1032. [Google Scholar] [CrossRef]
  2. Shah, S.A.A.; Solangi, Y.A. A sustainable solution for electricity crisis in Pakistan: Opportunities, barriers, and policy implications for 100% renewable energy. Environ. Sci. Pollut. Res. 2019, 26, 29687–29703. [Google Scholar] [CrossRef] [PubMed]
  3. Wen, J.; Zhao, D.; Zhang, C. An overview of electricity powered vehicles: Lithium-ion battery energy storage density and energy conversion efficiency. Renew. Energy 2020, 162, 1629–1648. [Google Scholar] [CrossRef]
  4. Wang, D.; Zhang, Q.; Huang, H.; Yang, B.; Dong, H.; Zhang, J. An electrochemical–thermal model of lithium-ion battery and state of health estimation. J. Energy Storage 2022, 47, 103528. [Google Scholar] [CrossRef]
  5. Song, Z.; Hou, J.; Li, X.; Wu, X.; Hu, X.; Hofmann, H.; Sun, J. The sequential algorithm for combined state of charge and state of health estimation of lithium-ion battery based on active current injection. Energy 2020, 193, 116732. [Google Scholar] [CrossRef]
  6. Jiang, Z.; Li, J.; Li, L.; Gu, J. Fractional modeling and parameter identification of lithium-ion battery. Ionics 2022, 28, 4135–4148. [Google Scholar] [CrossRef]
  7. Guo, X.; Kang, L.; Yao, Y.; Huang, Z.; Li, W. Joint estimation of the electric vehicle power battery state of charge based on the least squares method and the Kalman filter algorithm. Energies 2016, 9, 100. [Google Scholar] [CrossRef]
  8. Hongwen, H.; Rui, X.; Hongqiang, G. Online estimation of model parameters and state-of-charge of LiFePO4 batteries in electric vehicles. Appl. Energy 2012, 89, 413–420. [Google Scholar]
  9. Wei, Z.; Ruan, H.; Li, Y.; Li, J.; Zhang, C.; He, H. Multistage state of health estimation of lithium-ion battery with high tolerance to heavily partial charging. IEEE Trans. Power Electron. 2022, 37, 7432–7442. [Google Scholar] [CrossRef]
  10. Fan, Y.; Xiao, F.; Li, C.; Yang, G.; Tang, X. A novel deep learning framework for state of health estimation of lithium-ion battery. J. Energy Storage 2020, 32, 10–41. [Google Scholar] [CrossRef]
  11. Zhao, G.; Kang, Y.; Huang, P.; Duan, B.; Zhang, C. Chenghui Battery health prognostic using efficient and robust aging trajectory matching with ensemble deep transfer learning. Energy 2023, 282, 128228. [Google Scholar] [CrossRef]
  12. Wu, J.; Fang, L.; Dong, G.; Lin, M. State of health estimation of lithium-ion battery with improved radial basis function neural network. Energy 2023, 262, 125380. [Google Scholar] [CrossRef]
  13. Wei, J.; Dong, G.; Chen, Z. Remaining useful life prediction and state of health diagnosis for lithium-ion batteries using particle filter and support vector regression. IEEE Trans. Ind. Electron. 2017, 65, 5634–5643. [Google Scholar] [CrossRef]
  14. Liu, Q.; Kang, Y.; Qu, S.; Duan, B.; Wen, F.; Zhang, C. An online SOH estimation method based on the fusion of improved ICA and LSTM. In Proceedings of the 2020 IEEE/IAS Industrial and Commercial Power System Asia (I&CPS Asia), Weihai, China, 13–15 July 2020; pp. 1163–1167. [Google Scholar]
  15. Xiong, W.; Xu, G.; Li, Y.; Zhang, F.; Ye, P.; Li, B. Early prediction of lithium-ion battery cycle life based on voltage-capacity discharge curves. J. Energy Storage 2023, 62, 106790. [Google Scholar] [CrossRef]
  16. Choi, S.; Wang, G. Advanced lithium-ion batteries for practical applications: Technology, development, and future perspectives. Adv. Mater. Technol. 2018, 3, 1700376. [Google Scholar] [CrossRef]
  17. Sui, X.; He, S.; Vilsen, S.B.; Meng, J.; Teodorescu, R.; Stroe, D.-I. A review of nonprobabilistic machine learning-based state of health estimation techniques for lithium-ion battery. Appl. Energy 2021, 300, 117346. [Google Scholar] [CrossRef]
  18. Bian, X.; Wei, Z.; Li, W.; Pou, J.; Sauer, D.U.; Liu, L. State-of-health estimation of lithium-ion batteries by fusing an open circuit voltage model and incremental capacity analysis. IEEE Trans. Power Electron. 2022, 37, 2226–2236. [Google Scholar] [CrossRef]
  19. Dong, J.X.; Yu, Z.S.; Zhang, X.K.; Luo, J.J.; Zou, Q.H.; Feng, C.; Ma, X.Q. Data-driven predictive prognostic model for power batteries based on machine learning. Process Saf. Environ. Prot. 2023, 172, 894–907. [Google Scholar] [CrossRef]
  20. Zheng, L.F.; Zhu, J.G.; Lu, D.D.C.; Wang, G.X.; He, T.T. Incremental capacity analysis and differential voltage analysis based state of charge and capacity estimation for lithium-ion batteries. Energy 2018, 150, 759–769. [Google Scholar] [CrossRef]
  21. Agudelo, B.O.; Zamboni, W.; Monmasson, E. Application domain extension of incremental capacity-based battery SoH indicators. Energy 2021, 234, 121224. [Google Scholar] [CrossRef]
  22. Li, X.; Wang, Z.; Zhang, L.; Zou, C.; Dorrell, D.D. State-ofhealth estimation for Li-ion batteries by combing the incremental capacity analysis method with grey relational analysis. J. Power Sources 2019, 410, 106–114. [Google Scholar] [CrossRef]
  23. Chen, D.H.; Zhang, W.G.; Zhang, C.P.; Sun, B.X.; Zhang, L.J.; Cong, X.W. Data-driven rapid lifetime prediction method for lithium-ion batteries under diverse fast charging protocols. J. Energy Storage 2023, 74, 109285. [Google Scholar] [CrossRef]
  24. Su, X.; Sun, B.; Wang, J.; Zhang, W.; Ma, S.; He, X.; Ruan, H. Fast capacity estimation for lithium-ion battery based on online identification of low-frequency electrochemical impedance spectroscopy and Gaussian process regression. Appl. Energy 2022, 322, 119516. [Google Scholar] [CrossRef]
  25. Wang, Z.; Yuan, C.; Li, X. Lithium battery state-of-health estimation via differential thermal voltammetry with Gaussian process regression. IEEE Trans. Transp. Electrif. 2021, 7, 16–25. [Google Scholar] [CrossRef]
  26. Richardson, R.R.; Birkl, C.R.; Osborne, M.A.; Howey, D.A. Gaussian Process Regression for In Situ Capacity Estimation of Lithium-Ion Batteries. IEEE Trans. Ind. Inform. 2019, 15, 127–138. [Google Scholar] [CrossRef]
  27. Montaru, M.; Fiette, S.; Kon’e, J.-L.; Bultel, Y. Calendar ageing model of Li-ion battery combining physics-based and empirical approaches. J. Energy Storage 2022, 51, 104544. [Google Scholar] [CrossRef]
  28. Gong, D.; Gao, Y.; Kou, Y.; Wang, Y. State of health estimation for lithium-ion battery based on energy features. Energy 2022, 257, 124812. [Google Scholar] [CrossRef]
  29. Li, Y.; Stroe, D.-I.; Cheng, Y.; Sheng, H.; Sui, X.; Teodorescu, R. On the feature selection for battery state of health estimation based on charging–discharging profiles. Energy Storage 2021, 33, 102–122. [Google Scholar] [CrossRef]
  30. Liu, W.; Xu, Y. Data-driven online health estimation of Li-ion batteries using a novel energy-based health indicator. IEEE Trans. Energy Convers. 2020, 35, 1715–1718. [Google Scholar] [CrossRef]
  31. Pang, X.; Liu, X.; Jia, J.; Wen, J.; Shi, Y.; Zeng, J.; Zhao, Z. A lithium-ion battery remaining useful life prediction method based on the incremental capacity analysis and Gaussian process regression. Microelectron. Reliab. 2021, 127, 114405. [Google Scholar] [CrossRef]
  32. Damianou, A.; Lawrence, N.D. Deep gaussian processes. In Artificial Intelligence and Statistics; PMLR: New York City, NY, USA, 2013; pp. 207–215. [Google Scholar]
  33. Xing, Y.; Ma, E.W.M.; Tsui, K.-L.; Pecht, M. An ensemble model for predicting the remaining useful performance of lithium-ion batteries. Microelectron. Reliab. 2013, 53, 811–820. [Google Scholar] [CrossRef]
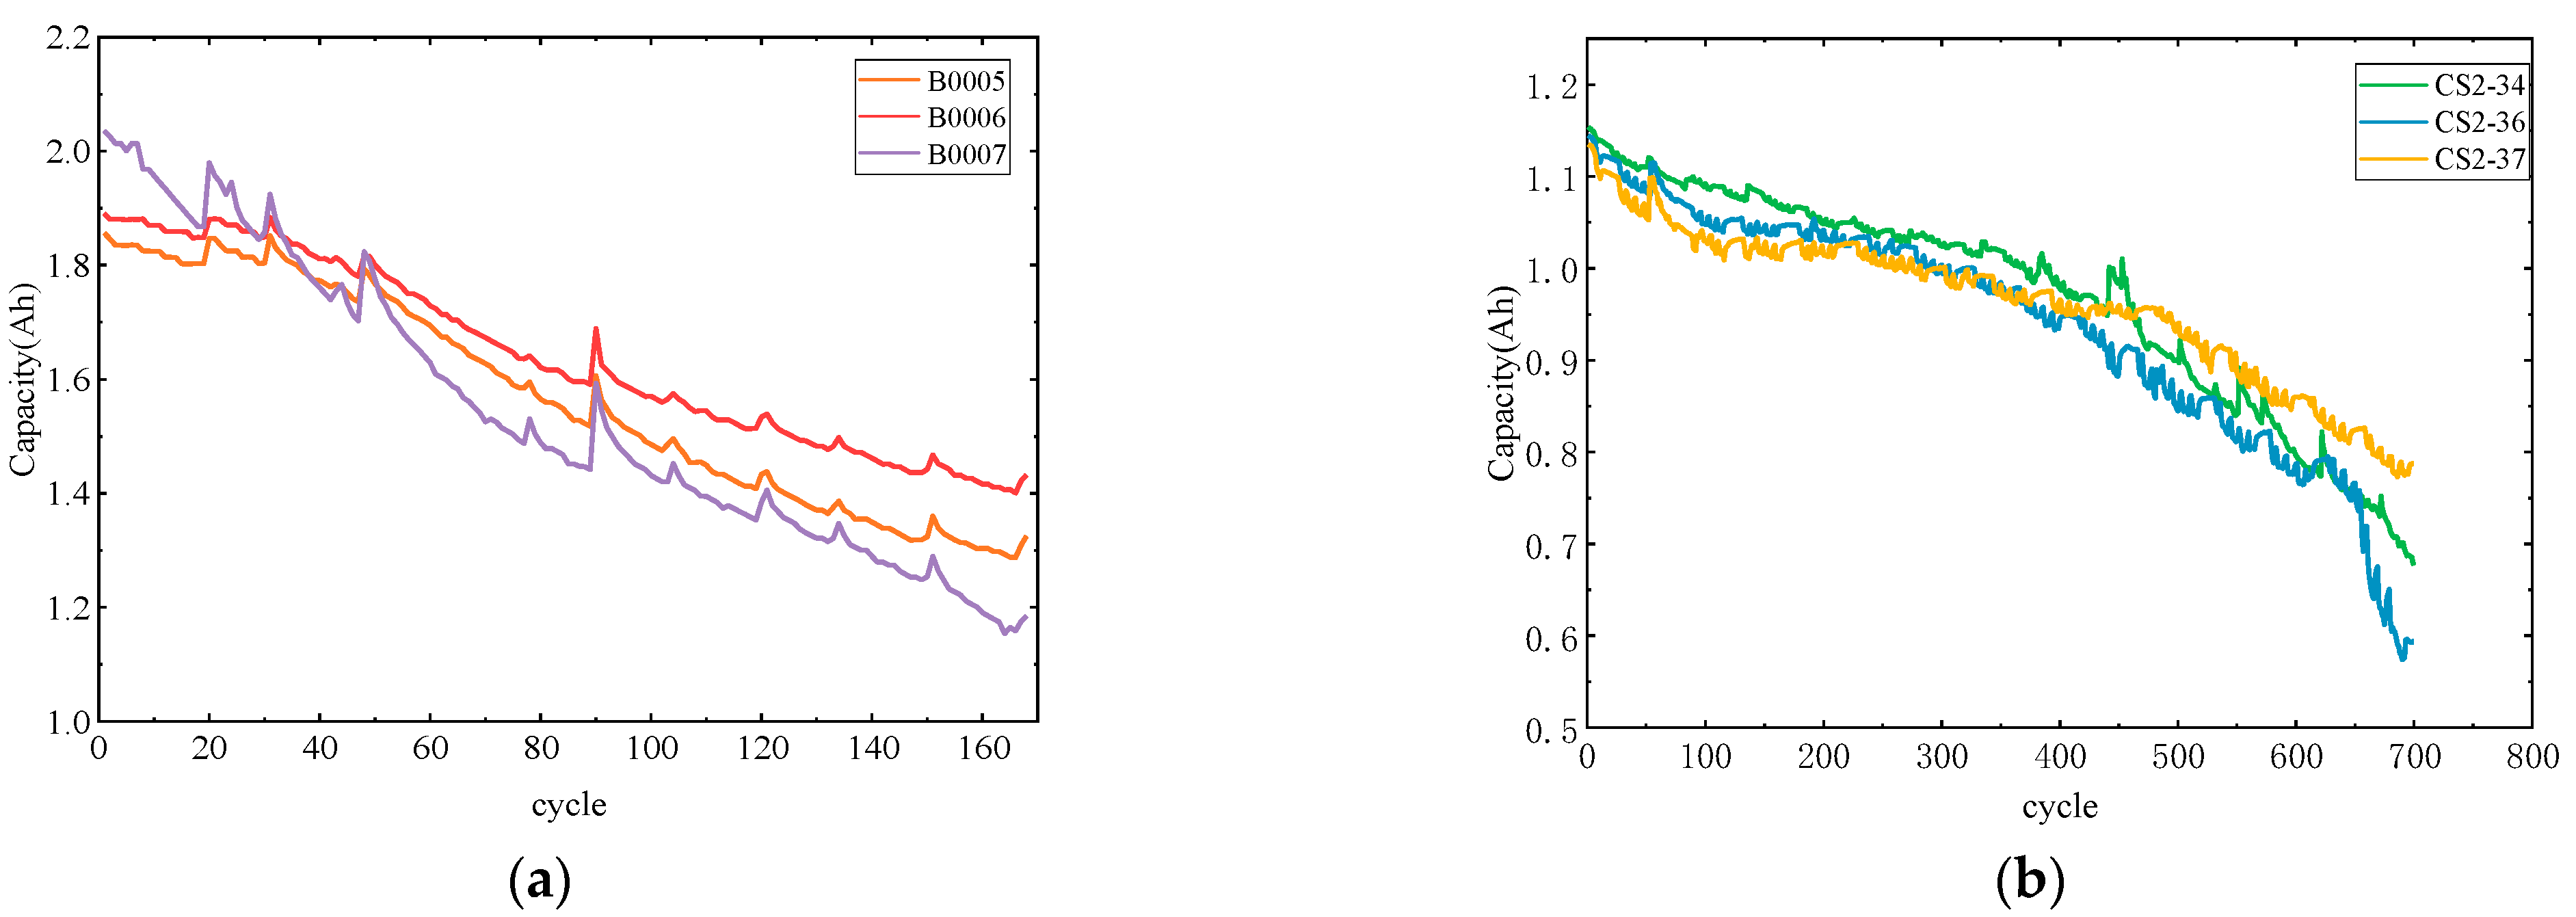
Figure 1. (a) Battery Capacity Degradation Curve for NASA Dataset; (b) Battery capacity degradation curves for the CALCE dataset.
Energies 17 02154 g001
Figure 2. (a) Variation in charging voltage profile with different number of cycles; (b) Schematic diagram of directly extracted health features at 30 cycles.
Energies 17 02154 g002
Figure 3. (a) Charging time interval Pearson coefficient calculation results; (b) Charging voltage range Pearson coefficient calculation results.
Energies 17 02154 g003
Figure 4. Incremental capacity curves.
Energies 17 02154 g004
Figure 5. Differential Voltage Curve.
Energies 17 02154 g005
Figure 6. Schematic of a causal convolutional neural network.
Energies 17 02154 g006
Figure 7. Causal Convolution-Self-Attention running mode.
Energies 17 02154 g007
Figure 8. A Framework for Predictive Modeling Based on Causal Convolutional Self-Attention and Informer.
Energies 17 02154 g008
Figure 9. Results of health state estimation under different datasets.
Energies 17 02154 g009aEnergies 17 02154 g009b
Figure 10. Results of health state estimation under different datasets. (a) b0005; (b) b0006; (c) b0007; (d) CS2_34; (e) CS2_36; (f) CS2_37.
Energies 17 02154 g010
Table 1. Pearson correlation coefficient.
HF1HF2HF3HF4HF5HF6HF7HF8
CALCECS2_340.92380.86300.97890.96860.99840.92650.86770.9739
CS2_360.61090.53980.82830.97910.98840.71770.62330.8001
CS2_370.92450.82150.97300.92870.99270.82430.92810.9656
NASAB00050.93030.87150.97310.95160.99470.87250.93210.9668
B00060.92820.97990.97240.98180.94550.84870.94390.9754
B00070.96860.94910.98090.97560.92110.89770.95020.9234
Table 2. SOH evaluation results of lithium-ion batteries based on CCN-Informer modeling.
MAEMAPERSMER2
CALCECS2_340.00510.01530.00690.9977
CS2_360.00400.01500.00650.9987
CS2_370.00430.01670.00660.9986
NASAB00050.00270.01310.00320.9988
B00060.00440.01610.00110.9854
B00070.00270.01270.00230.9989
Table 3. Evaluation results of different evaluation models for SOH of Li-ion batteries on CALCE and NASA datasets.
BatteryMethodMAEMAPERSMER2
B0005CCN-Informer0.00270.01310.00320.9988
Informer0.00540.02830.00690.9971
LSTM0.00900.04920.00790.9967
B0006CCN-Informer0.00440.01610.00110.9854
Informer0.00630.02370.00400.9854
LSTM0.01080.04420.00450.9845
B0007CCN-Informer0.00270.01270.00230.9989
Informer0.00560.03230.00970.9821
LSTM0.00880.04860.01330.9788
CS2_34CCN-Informer0.00510.01530.00650.9986
Informer0.00770.03840.00790.9902
LSTM0.01020.05100.01190.9799
CS2_36CCN-Informer0.00400.01500.00690.9977
Informer0.00660.04120.00890.9921
LSTM0.00930.06330.01320.9798
CS2_37CCN-Informer0.00430.01670.00660.9986
Informer0.00660.03480.01410.9801
LSTM0.00870.04330.01350.9659
Disclaimer/Publisher’s Note: The statements, opinions and data contained in all publications are solely those of the individual author(s) and contributor(s) and not of MDPI and/or the editor(s). MDPI and/or the editor(s) disclaim responsibility for any injury to people or property resulting from any ideas, methods, instructions or products referred to in the content.