Abstract
Due to the increasing demand for transport of electrical energy, measures for power flow control, congestion management, and higher utilisation of the existing grid play a decisive role in the transformation of the power system. Hence, enormous efforts must be undertaken using measures of congestion management. Modelling and integration of corresponding measures in optimisation tools to support grid and system operation and therewith reduce the resulting efforts become more important. This is especially true because of the high intermittency and decentralisation of renewable generation leading to increased complexity of the power system, higher loading of assets, and a growing need for control over flexible alternating current transmission systems (FACTS) and high-voltage direct current (HVDC) converters. This work therefore describes the implementation of optimised congestion management in an A Mathematical Programming Language (AMPL)-based nonlinear optimisation problem. AMPL is an effective tool to deal with highly complex problems of optimisation and scheduling. Therefore, the modelling of assets and flexibilities for power flow control in AC/DC systems in combination with an innovative grid operation strategy using predefined curative measures for the optimised use of the existing grid is introduced. The nonlinear mathematical optimisation aims at the optimal cost selection of flexibility measures. The application of the optimisation technique in a combined AC/DC system shows the optimal preventive and curative use of measures in operational congestion management. Simulation results prove that, by using predefined curative measures, the volume of cost-intensive preventive measures can significantly be reduced, especially in association with power flow control.
1. Introduction
1.1. Motivation
Safety, reliability, and economic efficiency are three of the essential maxims for the operation of the electric power system by the transmission system operators [1]. The interconnection of remote generation systems (e.g., offshore wind) to the power grid, and a long-lasting expansion of the grid (documented, e.g., in the grid development plans [2] for the German case), lead to increased challenges and complexity of operational congestion management. Therefore, measures for power flow control, congestion management, and higher utilisation of the existing grid infrastructure play a decisive role in the transformation of the power system. The modelling and integration of corresponding measures and system operation schemes allows for a higher utilisation of existing grid infrastructure. The use of optimisation tools to support grid and system operation appears to become more important due to the size and complexity of the electrical power system, the intermittency of renewables, and growing numbers of flexibilities and possibilities for power system control.
1.2. State of the Art
Applications of optimisations to manage power system congestion are manifold, as [3] also shows. Corrective or curative actions, respectively, classically are used in specific “if-then” dependencies. An approach for a wider use of curative actions in the power system operation is presented in [4]. An overview of possible technologies for a specific curative application in power systems is given in [5].
In many other works, more detailed applications for curative measures in power systems are presented. Oftentimes, these are technology specific but lack an overall optimisation approach in terms of the application in congestion management: the optimal calculation of curative actions using wind farms and FACTS, such as the unified power flow controller (UPFC), is given, e.g., in [6]. High-voltage direct current (HVDC) systems in different configurations are used in remedial and curative actions in [7,8]. Technology-open and overarching approaches for the evaluation of the value of curative actions are presented for large-scale transmission grids in [9] using a planning-based approach with a linearisation of the current power flow situation for the optimisation problem. An extended metaheuristic approach to identify critical constraint violations is used in [10] but does not include a mixture of pre- and post-contingency measures as in the previous solutions.
The schematic of preventive-curative actions is also presented in some works, in which the assessment of higher loaded power system operation in general [11] and a specific solution for a power system control centre demonstration [12] is presented. Nevertheless, these applications also do not try to include a combined modelling of all existing flexibilities in congestion management under the light of a combined use of preventive and predefined curative measures.
1.3. Contribution
This article introduces a modelling approach of assets for (specific) power flow control, of AC/high-voltage DC (HVDC) transmission systems, and of an innovative grid operation concept using preventive and predefined curative remedial actions. This approach uses the different given flexibilities in a combined way for an optimised utilisation of the existing network. The modelling is realised in AMPL [13], being one of the state-of-the-art mathematical optimisation languages with special strengths in nonlinear optimisation, which was chosen due to the possibility to exactly represent the hybrid AC/DC power flow description and the concomitant nonlinearity of the optimisation problem. Additionally, a mathematical optimisation approach promises reproducible results, which is of special interest for operational measures.
The main contribution lies in the demonstration of the possibility to realize a combined implementation of almost all flexibilities usable for preventive and predefined curative optimisation in congestion management for hybrid AC/DC power systems based on a full power flow representation in a specific environment for mathematical optimisation. Within the closed optimisation problem, flexibilities of various assets such as FACTS and HVDC systems and connected generation and consumption are modelled alongside classical optimisation of operational congestion management.
1.4. Structure
This work therefore is organised as follows. Section 2 introduces the modelling starting from a description of the implemented closed power flow formulation, the modelling of power flow controlling series flexible AC transmission systems (FACTS) elements, HVDC systems, and a system operation concept using preventive and predefined curative measures in congestion management. Different scenarios using the flexibilities by series FACTS and HVDC systems in the congestion management of a mixed AC/DC power system are presented in the use case in Section 3. Finally, Section 4 discusses the modelling and results of the use case and draws a conclusion.
2. Modelling
The optimisation framework with the AC power flow implementation used in this work was developed in [14] and enhanced by the authors of this work to a mixed AC/DC power flow in [15,16,17]. The following descriptions in Section 2.1, Section 2.2 and Section 2.3 serve as an introduction by recapping the reference works.
2.1. Power Flow Description
The general optimisation model is formulated as a non-linear mathematical problem as given in (1), in which the applied objective is described by fobj. Different realisations, such as reducing the set point changes of generation and HVDC systems, the redispatched power of generators, grid losses, etc., are introduced in detail in the use cases in Section 3.
The AC power flow is solved using the variable x by fulfilling all equality and inequality constraints ci and cj of the corresponding sets Ceq and Cineq of constraints. Therefore, a closed mathematical description of the power flow problem with objective function fobj is achieved. The bus-based power flow equality constraints are valid for the set KPQ,PV of all PQ- and PV-nodes for active powers (2) and for the set KPQ of all PQ-nodes for reactive powers (3).
Therein, the first terms describe the grid powers sN = pN + jqN flowing through branches and shunt compensation devices. The bus voltage magnitudes Vk and angles δk for buses kK are so-called state variables within the variable x of the optimisation problem. Grid topology and equipment admittances are represented by conductance gkm and susceptance bkm as parameters. They are derived from the bus admittance matrix YKK containing all information of the passive grid elements. The index m represents all buses in the system besides the current bus k. The second terms describe all active and reactive powers P and Q that are fed in or absorbed from buses, such as loads (index ‘load’), generation (index ‘gen’), series compensation elements (index ‘se’), or HVDC systems (index ‘HVDC’), and therefore referred to as bus powers Sbus,k. Additionally, voltage and line loading limits are implemented as inequality constraints cj. The decision variables as a second part of x are introduced in the next sections.
2.2. Series FACTS for Power Flow Control
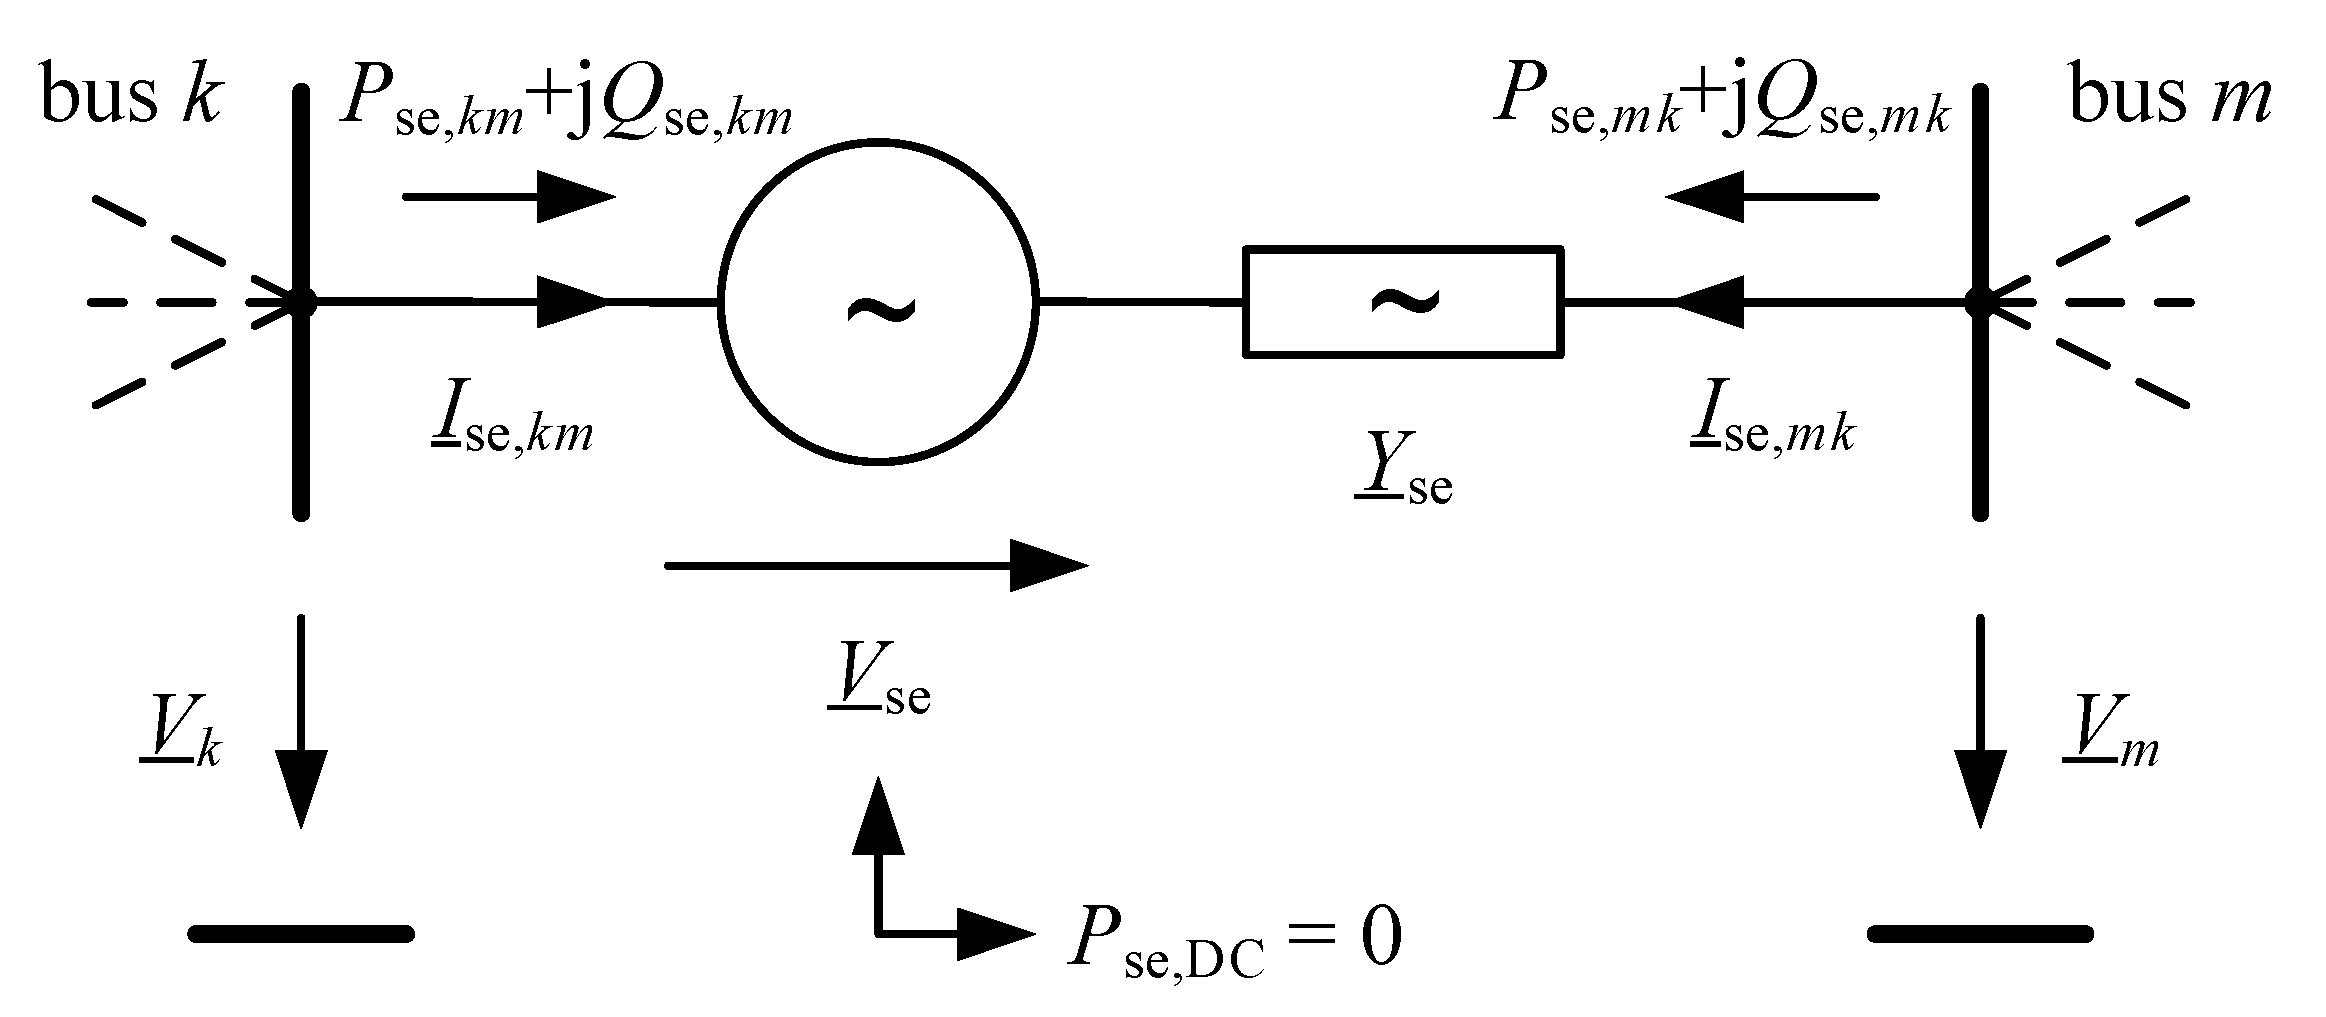
The basic modelling approach for series elements as already described by the author in [16] allows the representation of the most widely known series compensation and FACTS elements, such as the static synchronous series compensator (SSSC), mainly used for power flow control. For all series elements, one common modelling approach principally based on [18] (see Figure 1) is chosen, leading to a uniform implementation of all different series elements into the existing model and bus-based power flow representation.
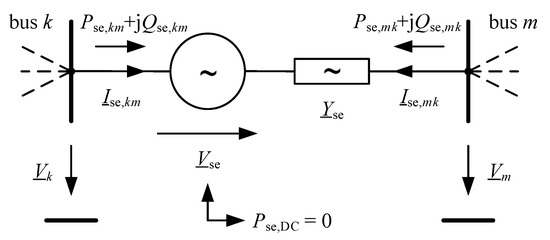
Figure 1.
Basic modelling approach for series elements (based on [16,18]).
The powers Sse,km/mk = Pse,km/mk + jQse,km/mk at the terminals of the series element (index ‘se’) are calculated as given in (4) and (5) with Yse being the admittance of the series element and Vse the internal (controllable) voltage as the decision variable of the optimisation problem.
These elements oftentimes are not equipped with an additional power source, so no active power PDC can be provided by the elements or its corresponding DC links. This can be realised through (6) by setting PDC = 0 as additional equality constraint.
Series elements are typically included in series with a transmission line. Hence, an explicit modelling of both buses k and m and the subsequent line to the next bus n would lead to a change in the bus admittance matrix YKK compared to the case without series element (additional node m and series admittance Yse). Therefore, a kind of superpositioning approach to model series elements without changing the admittance matrix while still representing the full π-line model is chosen as presented by the authors in [16]. Using the formulation presented therein, the series elements can be added as additional bus powers sse = pse + jqse as introduced in (2) and (3).
2.3. HVDC Systems and Combined AC/MTDC Power Flow
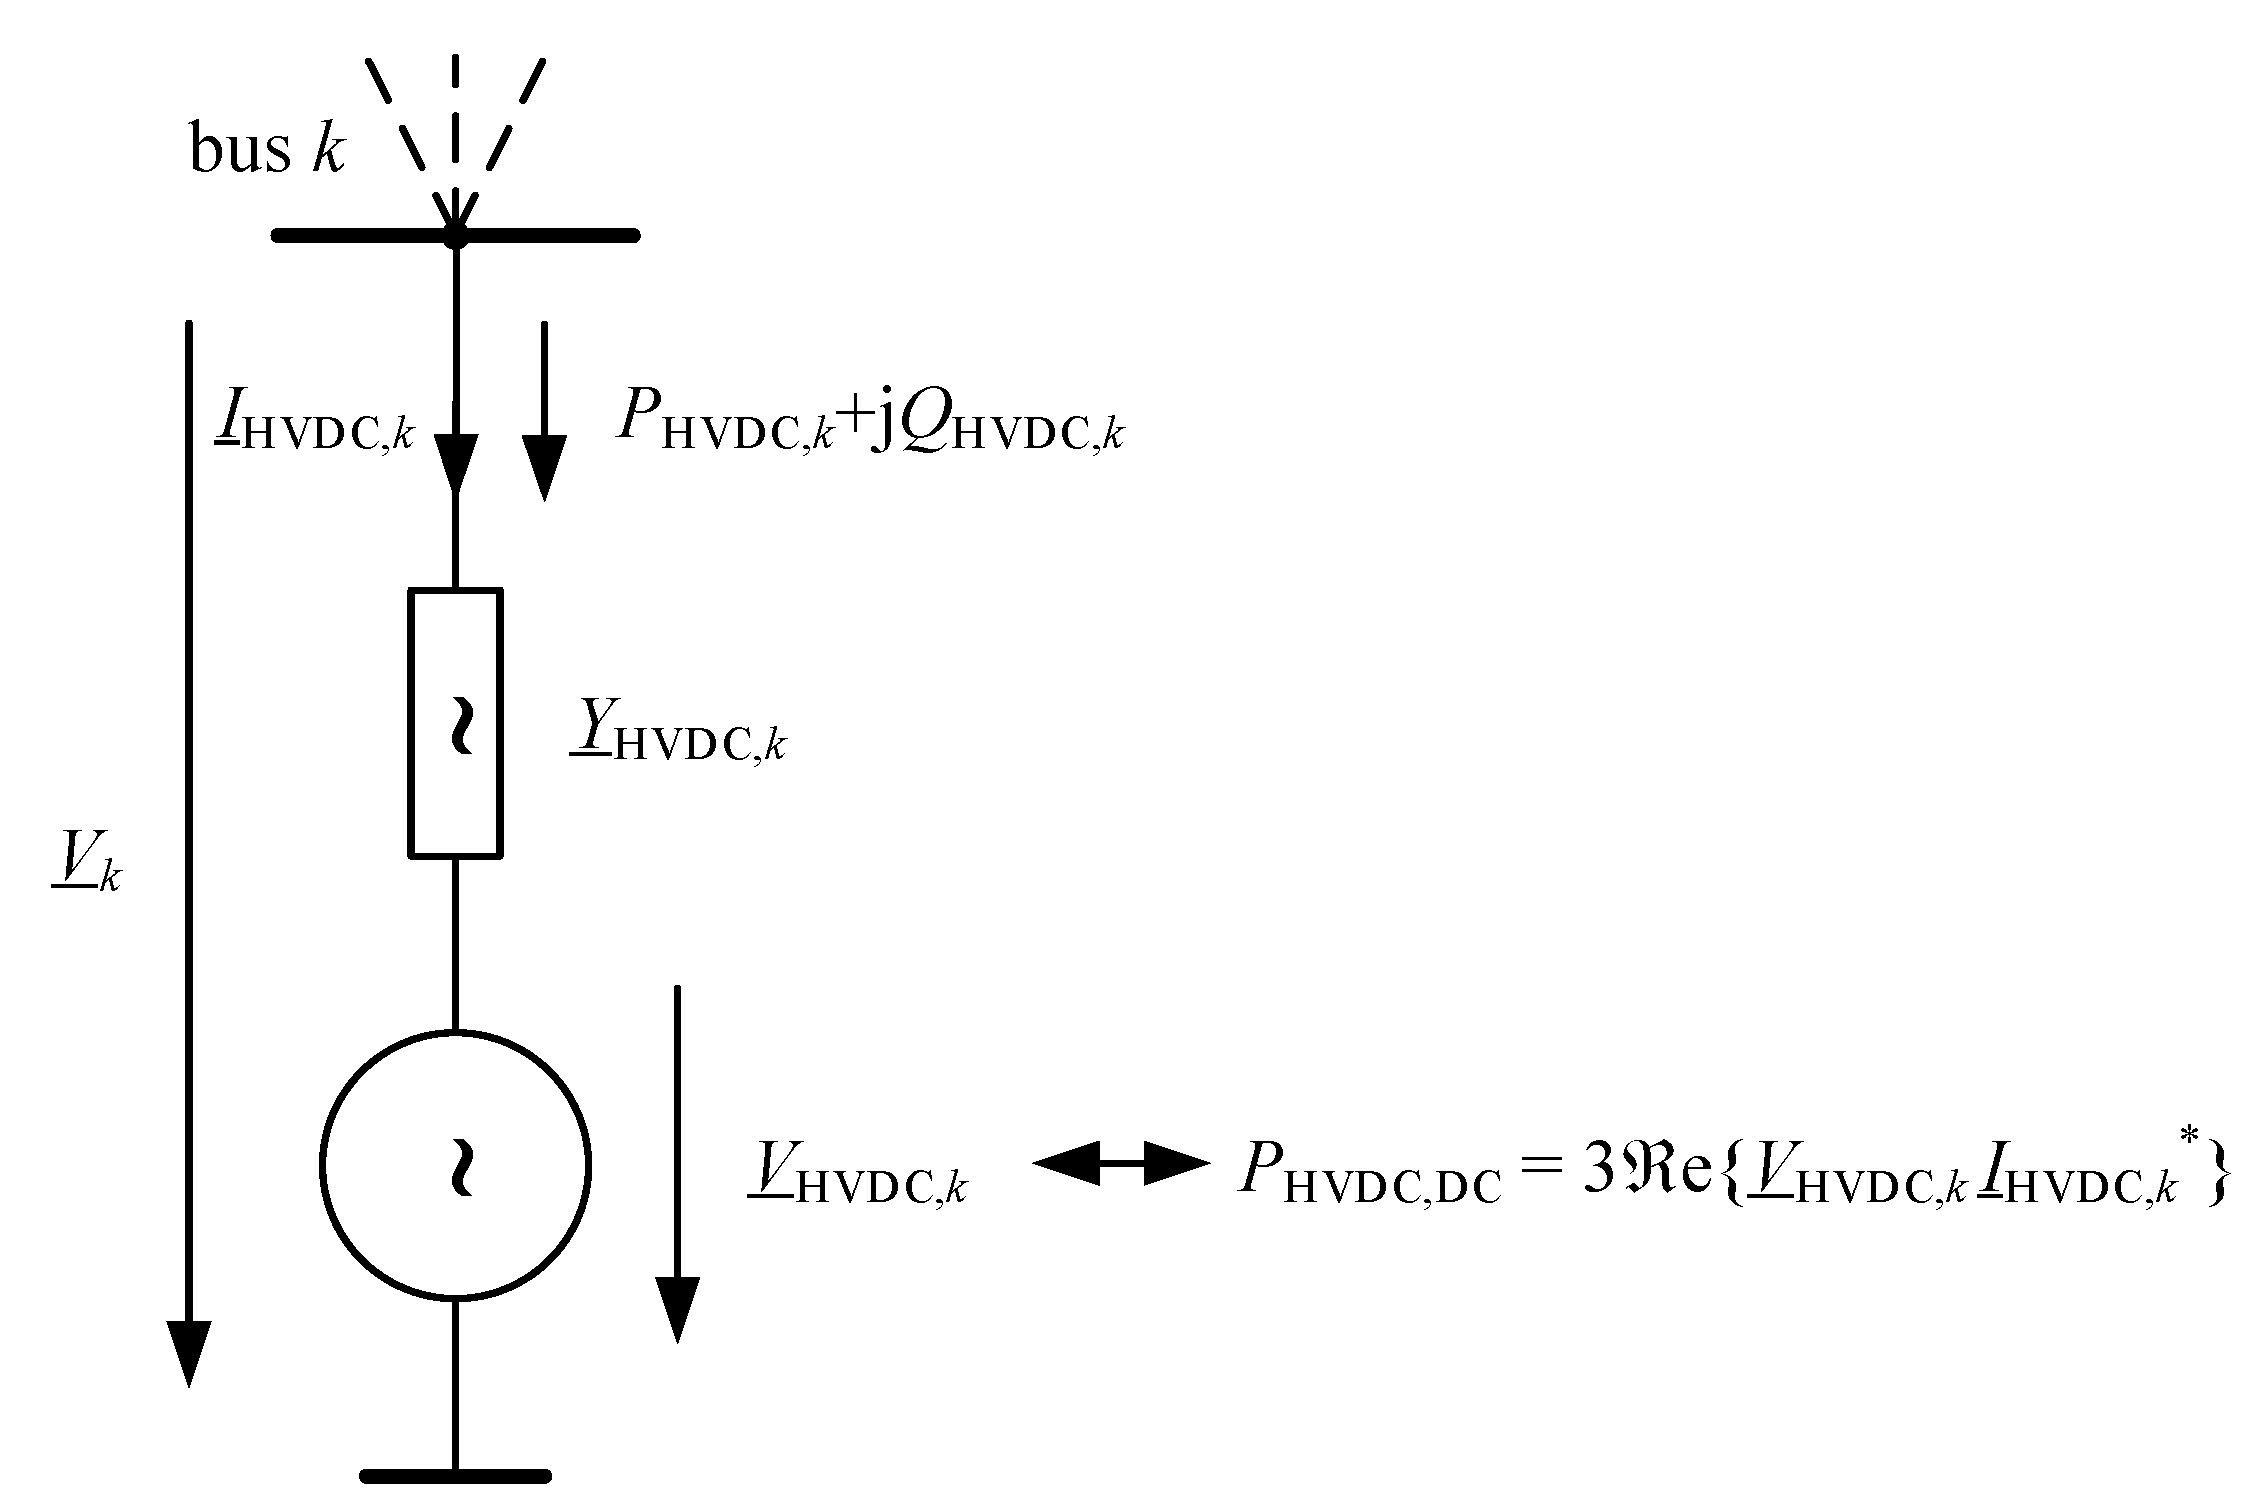
The behaviour of HVDC systems is mainly based on the characteristics of their converters. The description of the converters as shunt elements, as basically given in [18], is introduced for the modelling at hand by the authors in detail in [15]. Figure 2 shows the equivalent circuit for a converter connected to a bus k of the AC system.
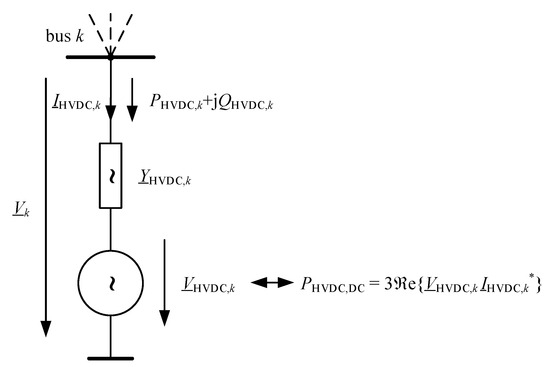
Figure 2.
General modelling approach for an HVDC converter connected to an AC system (based on [15,18]).
The apparent power flow SHVDC,k = PHVDC,k + jQHVDC,k of the HVDC converters’ terminals is given by (7) and (8) with YHVDC,k = GHVDC,k + jBHVDC,k being the admittance of the converter and VHVDC,k, the internal (controllable) voltage, as the decision variable of the optimisation problem.
PHVDC,DC accordingly describes the active power at the DC link and the connected buses of the set of DC buses KDC of the converter. Outside of the occurring active power losses by GHVDC,k of the coupling transformer, no losses of the converters are assumed, so (9) applies.
The advantage of this approach against the background of the introduced optimisation environment is the possibility to integrate the active and reactive power characteristics again directly in the converters (respectively) and therefore into the bus-based power flow constraints for the AC system as given in (2) and (3).
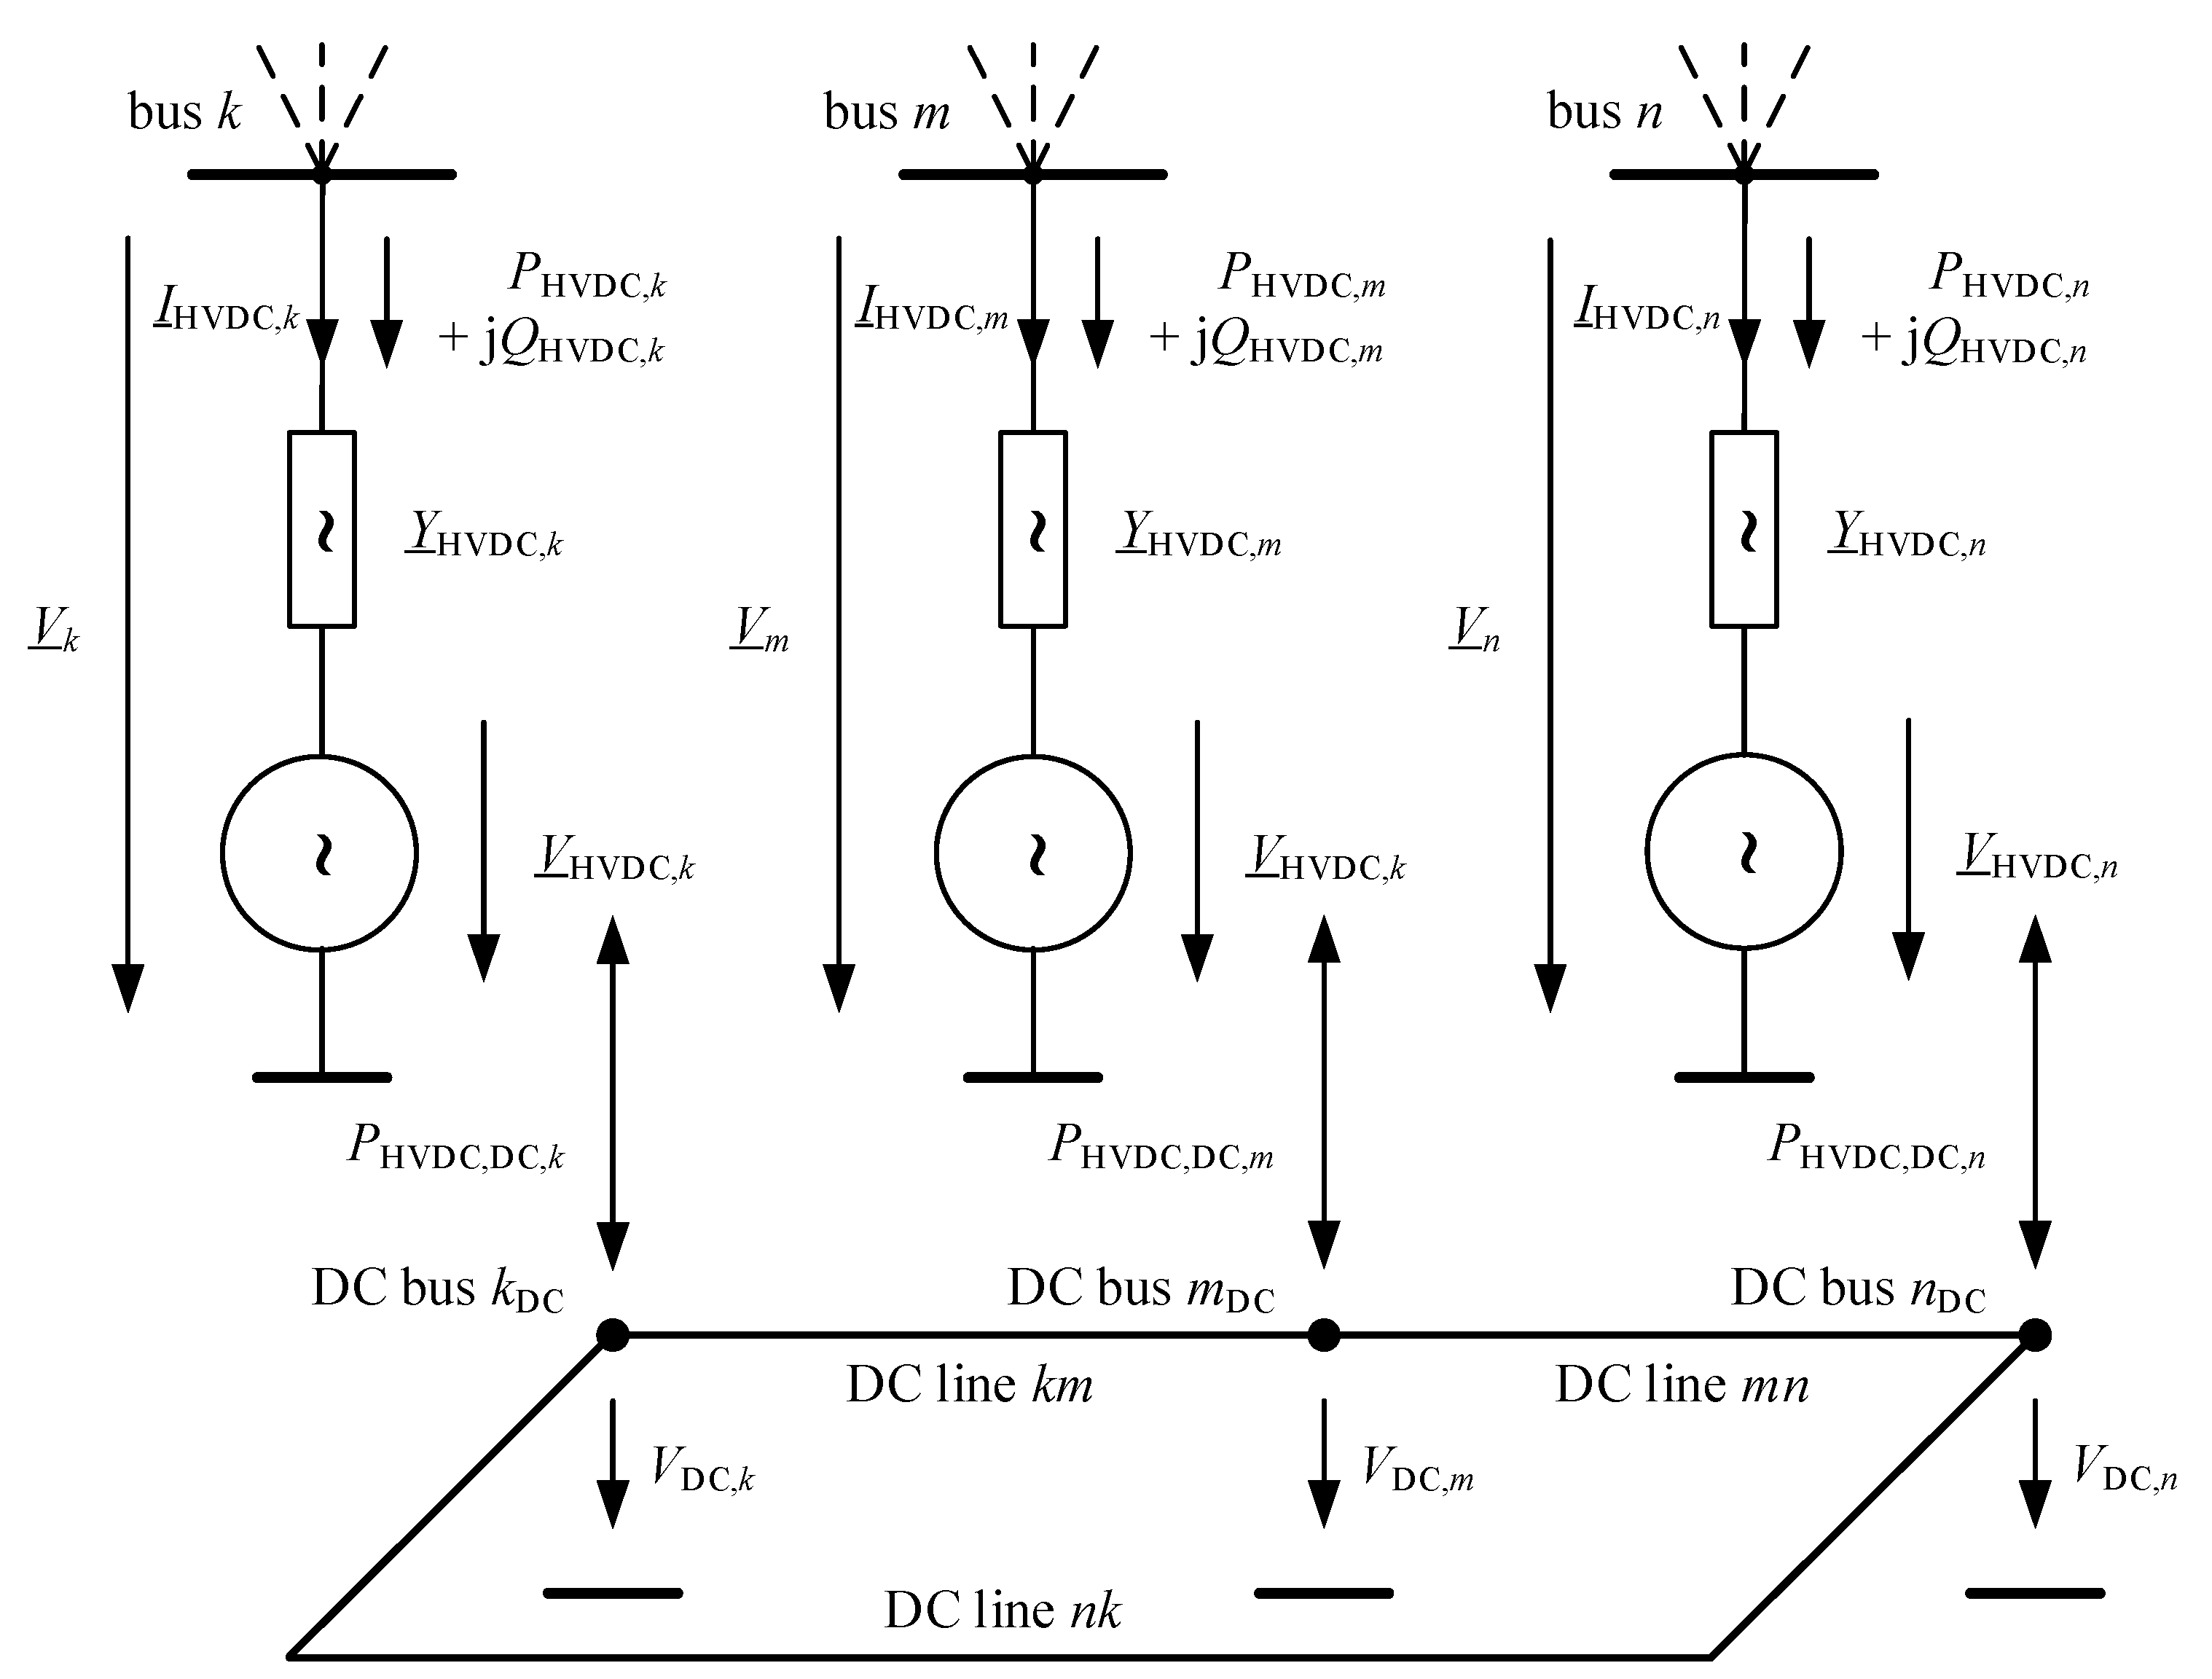
HVDC point-to-point (P2P) systems are the most common implementation of HVDC systems. HVDC P2P systems are connected via a DC line and therefore can be connected to remote buses. The typical application is the bulk power transfer, e.g., the generated power of large offshore wind farms, to load centres over long distances. For applications such as meshed DC systems, more complex structures are needed. A multi-terminal- (MTDC) modelling approach is given in Figure 3.
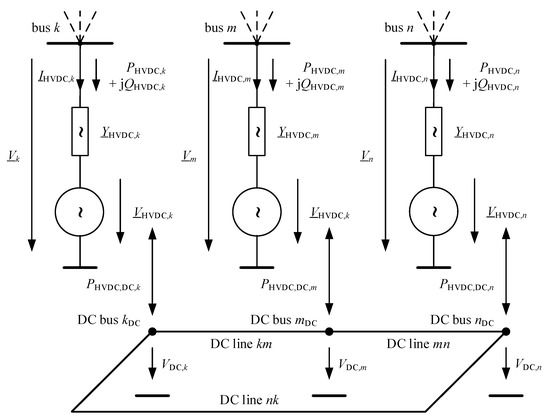
Figure 3.
Modelling approach for MTDC systems (see [15]).
For MTDC systems, a representation of a meshed DC grid structure has to be realised and can be set up equally, such as for AC systems with the simplification that just the real part of the admittance has to be considered. The power flow constraint can be described analogously to the AC power flow through (10) with PHVDC,DC,k being the exchanged power at the converters of the DC system, gki being the conductances of the DC lines, and VDC,k representing the DC bus voltage magnitudes.
Similarly, constraints for converter control modes realising the power balance in the DC system need to be considered. In general, and similarly to AC systems, at least one converter must act in balancing mode, comparable to the balancing node in an AC system. Therefore, it provides or absorbs the active power needed to keep the voltage at its DC side at its desired value, being the balancing node and in control mode ‘VDC’.
Apart from that, different control modes and combinations of control on the AC and DC sides are possible. For voltage source converters as considered within this work, the free controllability of active and reactive power on the AC side is especially essential. Outside of one ‘VDC’-controlled converter, the active power values of the other converters can be determined freely within their operating areas. Therefore, control modes such as active and reactive power set point (PQ-control) or active power and AC voltage magnitude (PV-control) can be realised. Furthermore, a converter can also serve as a balancing node for the AC system (SL-control).
2.4. Preventive and Predefined Curative Measures in Congestion Management
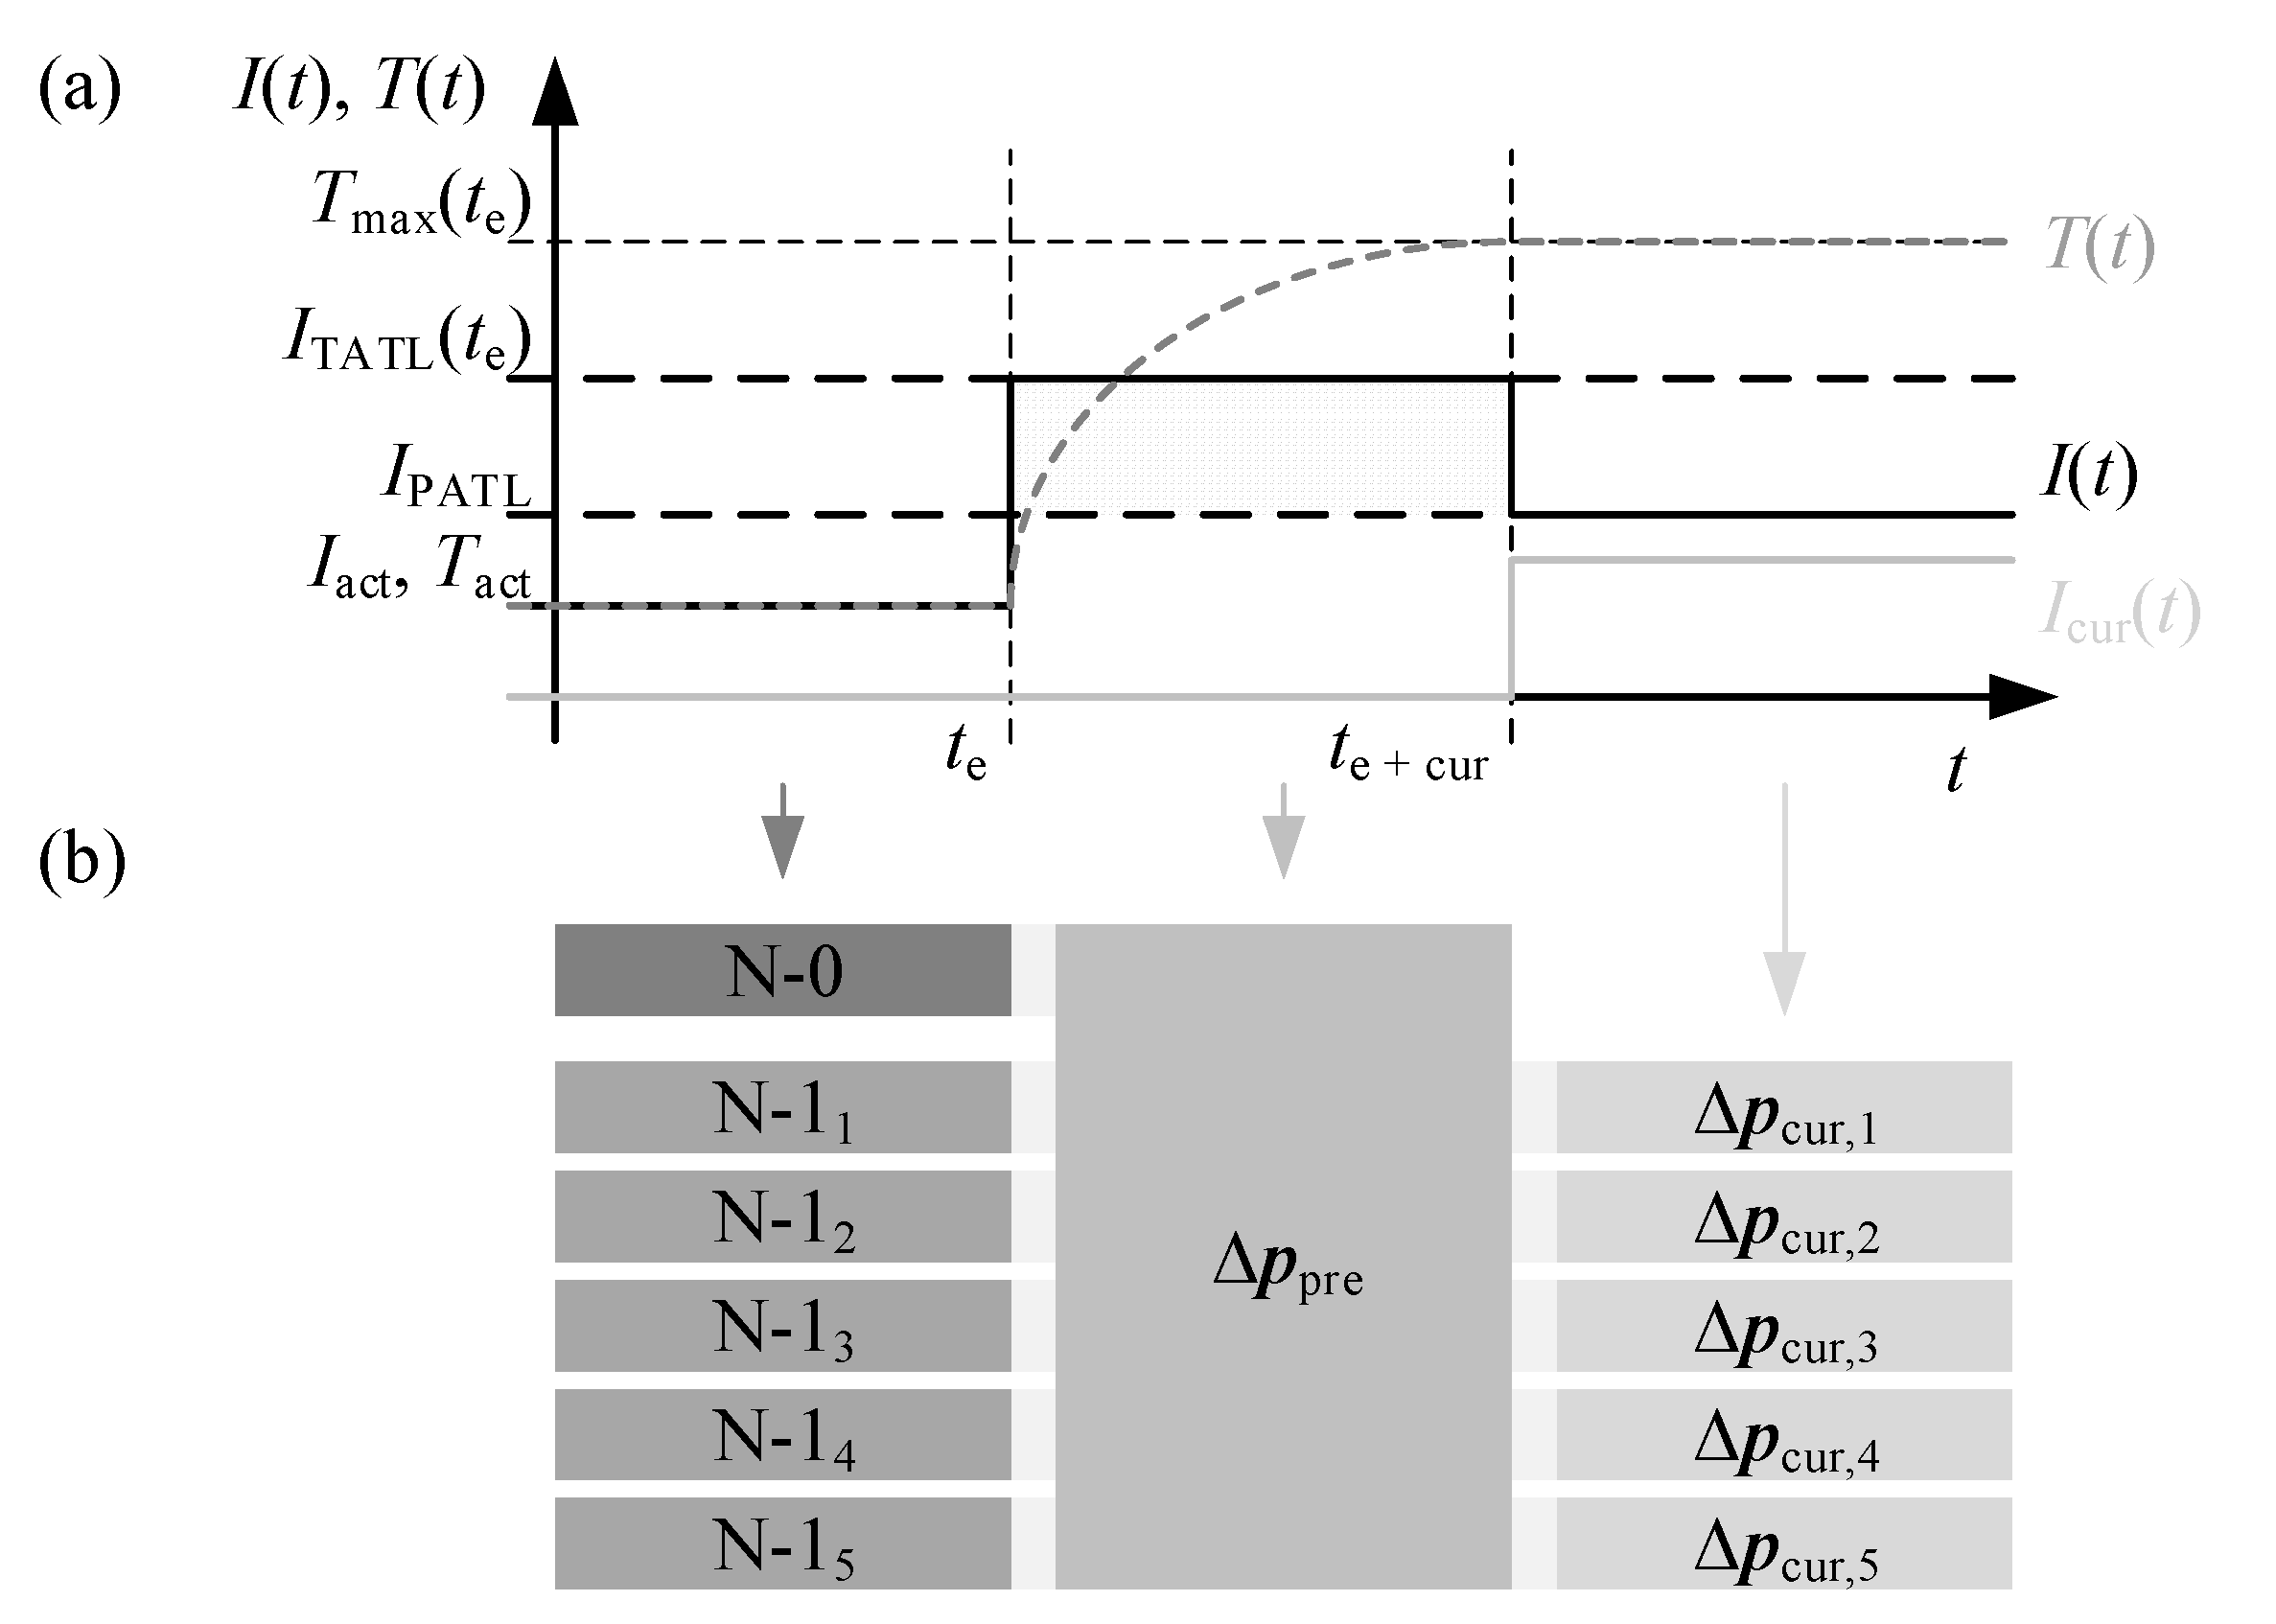
The combined use of preventive and predefined curative measures in congestion management as developed within the framework of [19] (see also [4]) builds on available temperature reserves to allow a temporal higher loading in case of occurrence of events for which remedial actions (“predefined curative measures”) are predefined and can be activated on short notice (ideally automatically). The basic working principle is illustrated in Figure 4a.
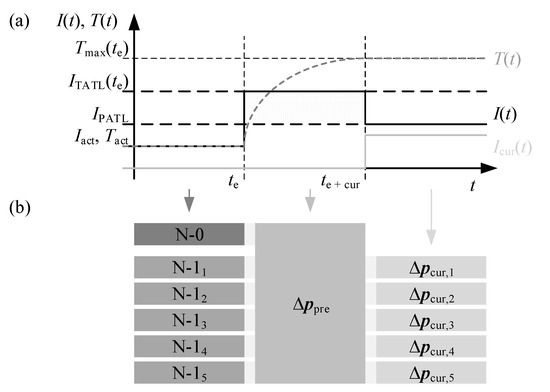
Figure 4.
Working principle (a) and modelling approach (b) for the predefined curative measures as used in this works.
Due to the direct dependency on preventive measures, the modelling of curative measures must be realised in a closed optimisation problem together with preventive measures (see also [20]). Three system states must be represented (as illustrated from left to right in Figure 4b):
- the power flow situation in the normal state (N-0-case), in which the permanent admissible transmission loading (PATL, represented by the current Iact and the corresponding conductor temperature Tact in Figure 4a) must be complied with using optimally chosen preventive measures (see Equation (11)),
- the power flow situation in the N-1-case before the curative measure takes effect, within which the temporary admissible transmission loading (TATL, represented by the current ITATL ensuring that the maximum temperature Tmax is not reached before the end of the full effect in timespan (te+cur − te) of the curative measure in Figure 4a) must be complied with using one set of preventive measures (see Equation (12)), and
- the power flow situation in the N-1-case after the curative measure has taken effect, in which the PATL (represented by the currents IPATL in Figure 4a) must be complied with by the optimal combined use of preventive and curative measure(s) activated accordingly for the event that has occurred (see Equation (13)).
The N-0-case as well as the two states before and after the curative measures have taken effect are to be considered in parallel for all relevant N-1-cases and can be represented, e.g., by three parallel power flow problems. As constraints for the compliance with the admissible loadings of the lines zZ, taking into account the preventive and curative active power changes ∆ppre,k and ∆pcur,k at the buses k, (11) to (13) can be formulated.
Depending on the design of the concept, different values may be applied for the permanently permissible current limits in the N-0- and N-1-cases, which are considered by the separate formulation of (11) and (13). As the formulations show, preventive measures are valid and the same for all scenarios s (with sS = {‘N-0’, ‘N-1TATL’, ‘N-1PATL’}). The curative measures may be different for each N-1-situation. In the context of modelling as an optimisation problem, this can be performed by formulating a constraint according to (14) for all scenarios (s,t)S.
Curative measures are determined on a failure-specific basis and are therefore scenario-dependent. Accordingly, the curative measures given as bus-based power changes ∆pcur,k,s must be determined specifically for each scenario (e.g., each failure variant). The result of the optimisation provides a way of assigning curative measures to the respective N-1-cases, which are selected and activated in network operation planning (after further checks), so that they can be triggered within short, specified times (automated, if necessary) in case of actual occurrence in real-time system operation. Consequently, the assignment of the corresponding measures to the individual scenarios sS must be considered, which can be calculated in a general form by the optimisation problem given in (21).
For the simulations below, a weighting factor of µ = 1000 in the objective is assumed for preventive measures to give preference to use curative measures. The respective preventive and curative measures are squared in the formulation of the objective function to achieve a continuous sign-adjusted addition of the selected measures.
In principle, power flow control measures can be considered as possible bus-based flexibilities ΔpK,k for preventive and curative actions provided, e.g., by
- power flow controlling resources,
- HVDC systems,
- redispatch, and
- feed-in management.
These measures are incorporated as flexibility (decision variables) into the formulated optimisation problem. For generation and load, power changes Δpgen/load are directly integrated into their respective formulation as additional decision variables.
In addition to the mathematical representation in (15), so-called slack variables iSL are included for the line currents, which enter the objective function via a large factor µSL. The constraints for the maximum line loadings thus become (16).
This leads to an improved solvability and ensures convergence even if the flexibilities available for congestion avoidance are too small. For the sake of clarity, these slack variables in the objective function and constraints are not explicitly given in (15).
3. Use Cases
3.1. System and Operational Congestions
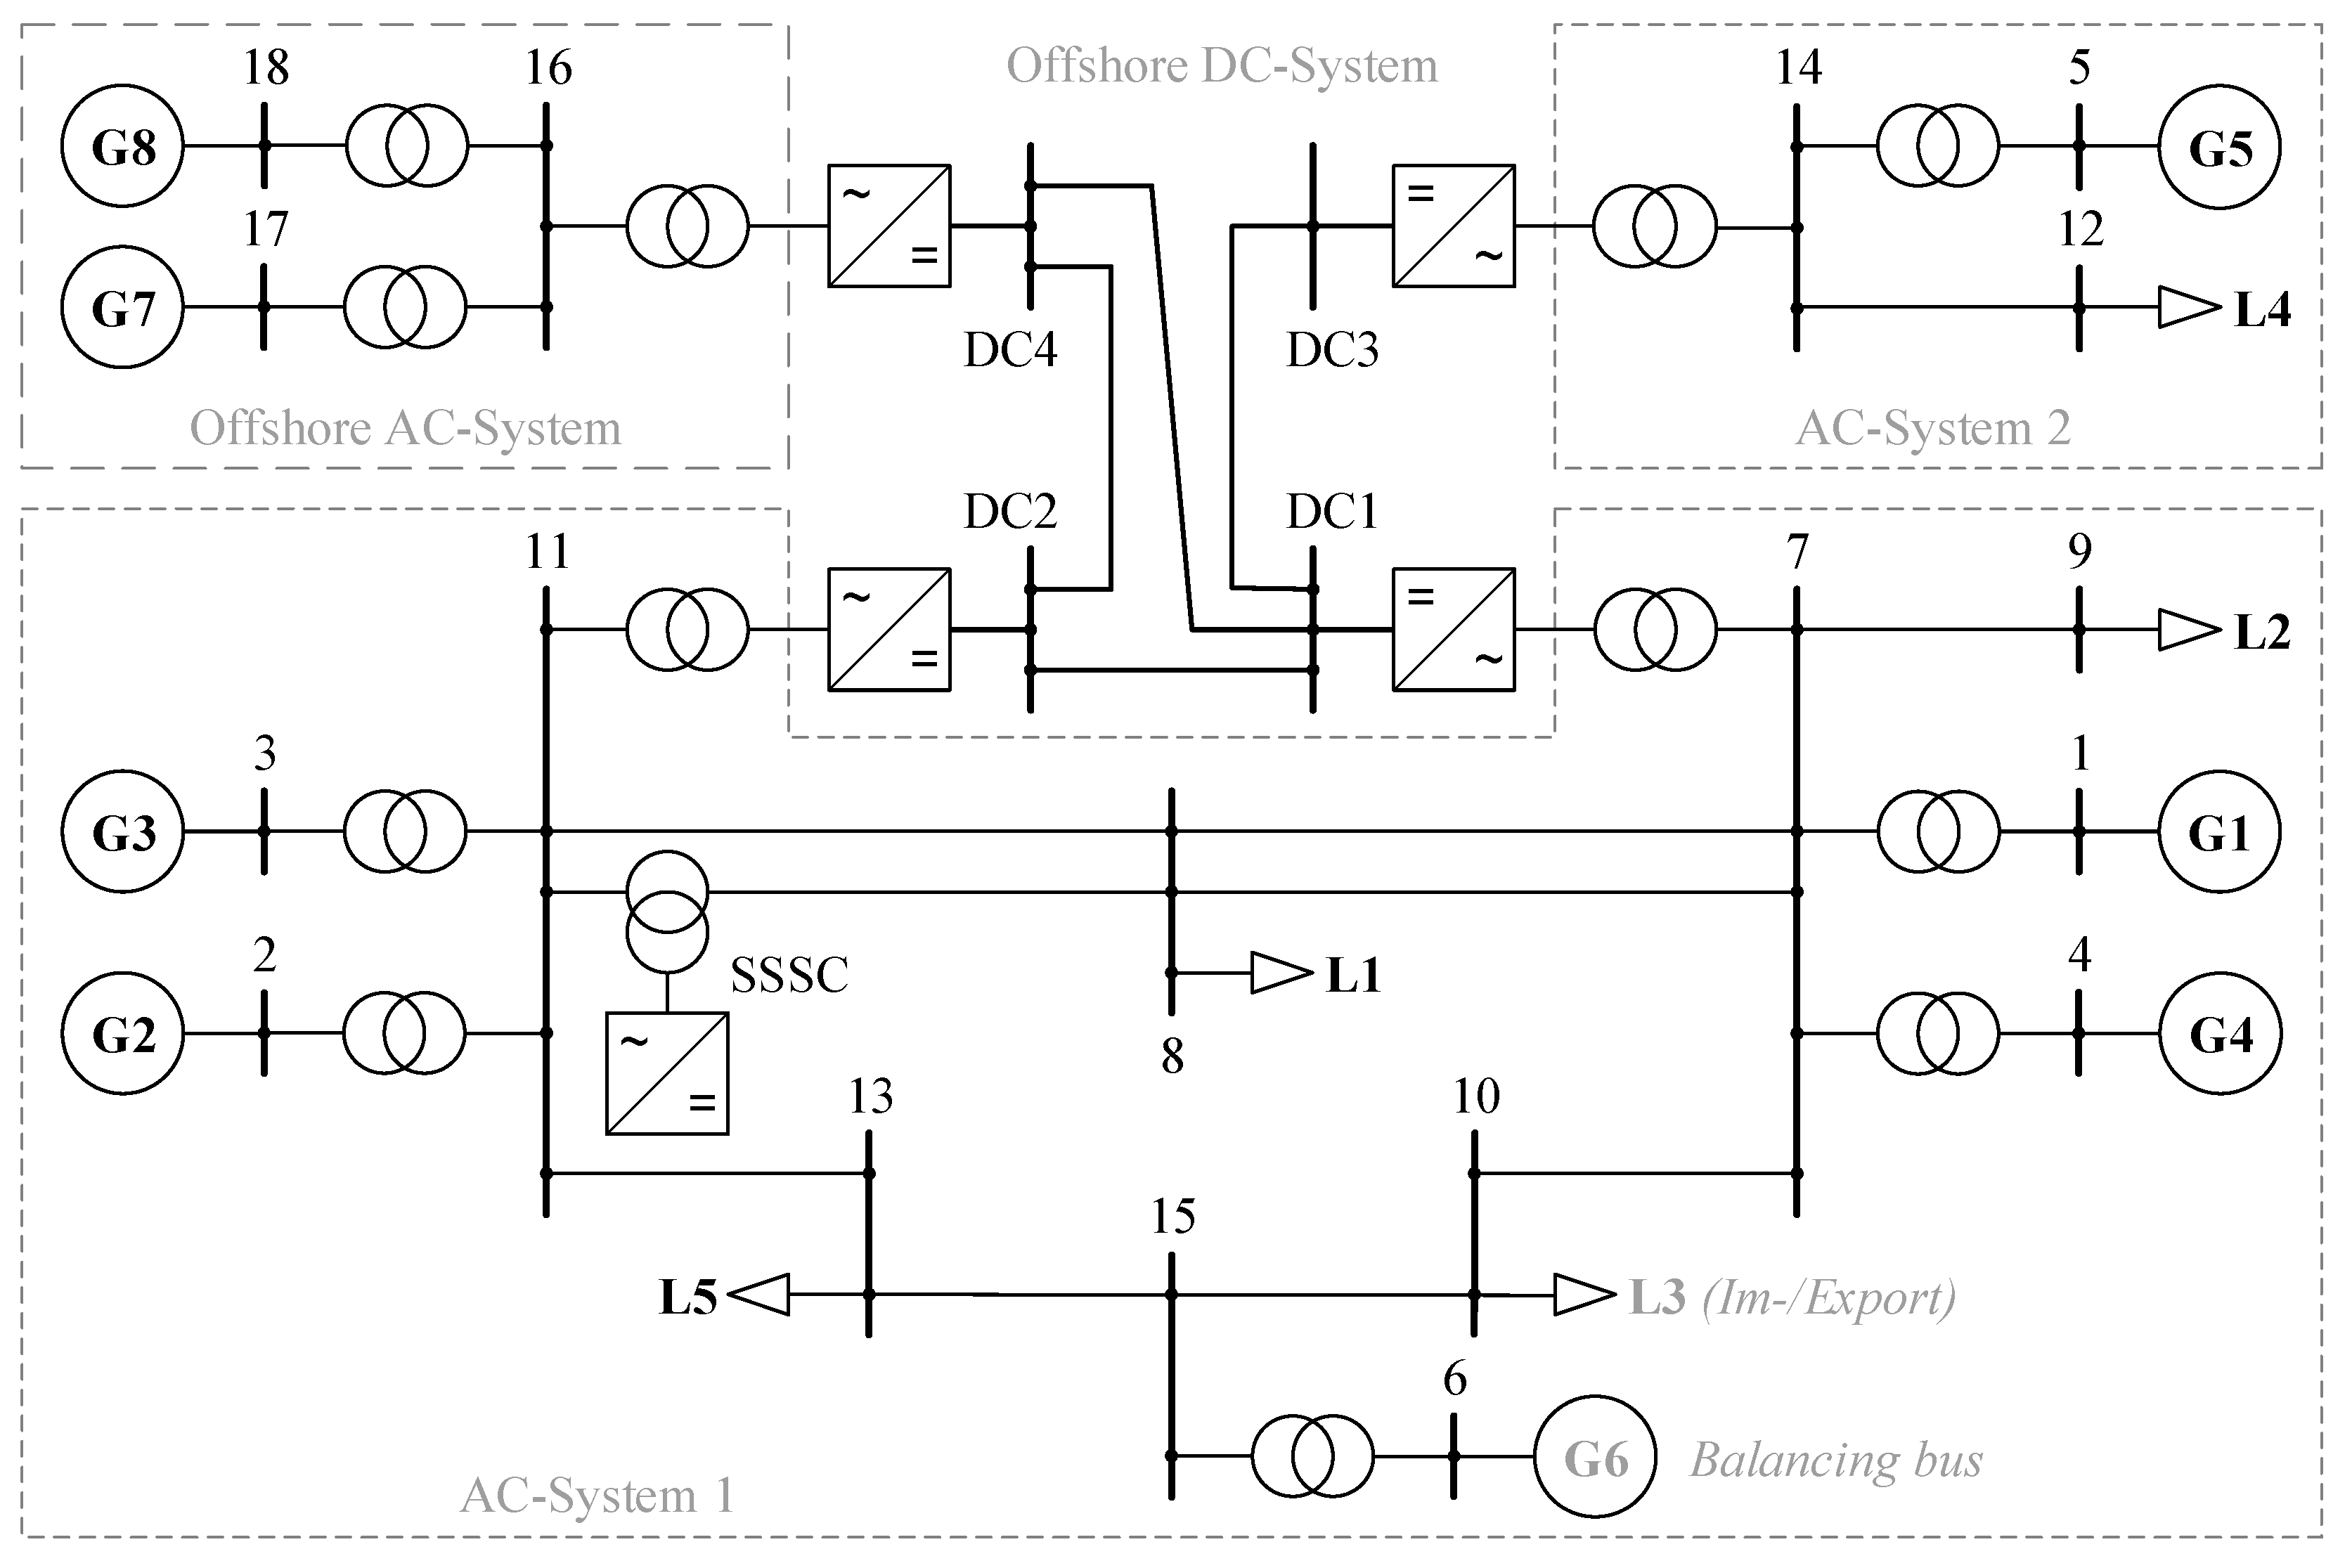
The evaluation of the presented modelling and optimised congestion management is realised in a combined AC/MTDC system representing a combination of the systems, their parameters and generation, as well as consumption time series used in the use cases of [15,16] (Figure 5).
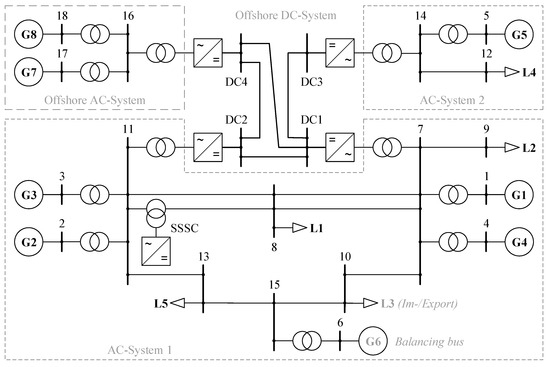
Figure 5.
Combined AC/MTDC system used for the scenario-based application.
For this purpose, the respective nodes 4 and 7 of the systems are combined and the SSSC for explicit power flow control is relocated from line 7–8 to line 8–11 running in parallel in the new configuration. The system therefore consists of a meshed AC system with two connections to an as well meshed DC system, representing, e.g., a future meshed offshore system. Additionally, two other AC systems are connected to the DC system, representing an offshore feed-in and a further simple AC system with generation and consumption.
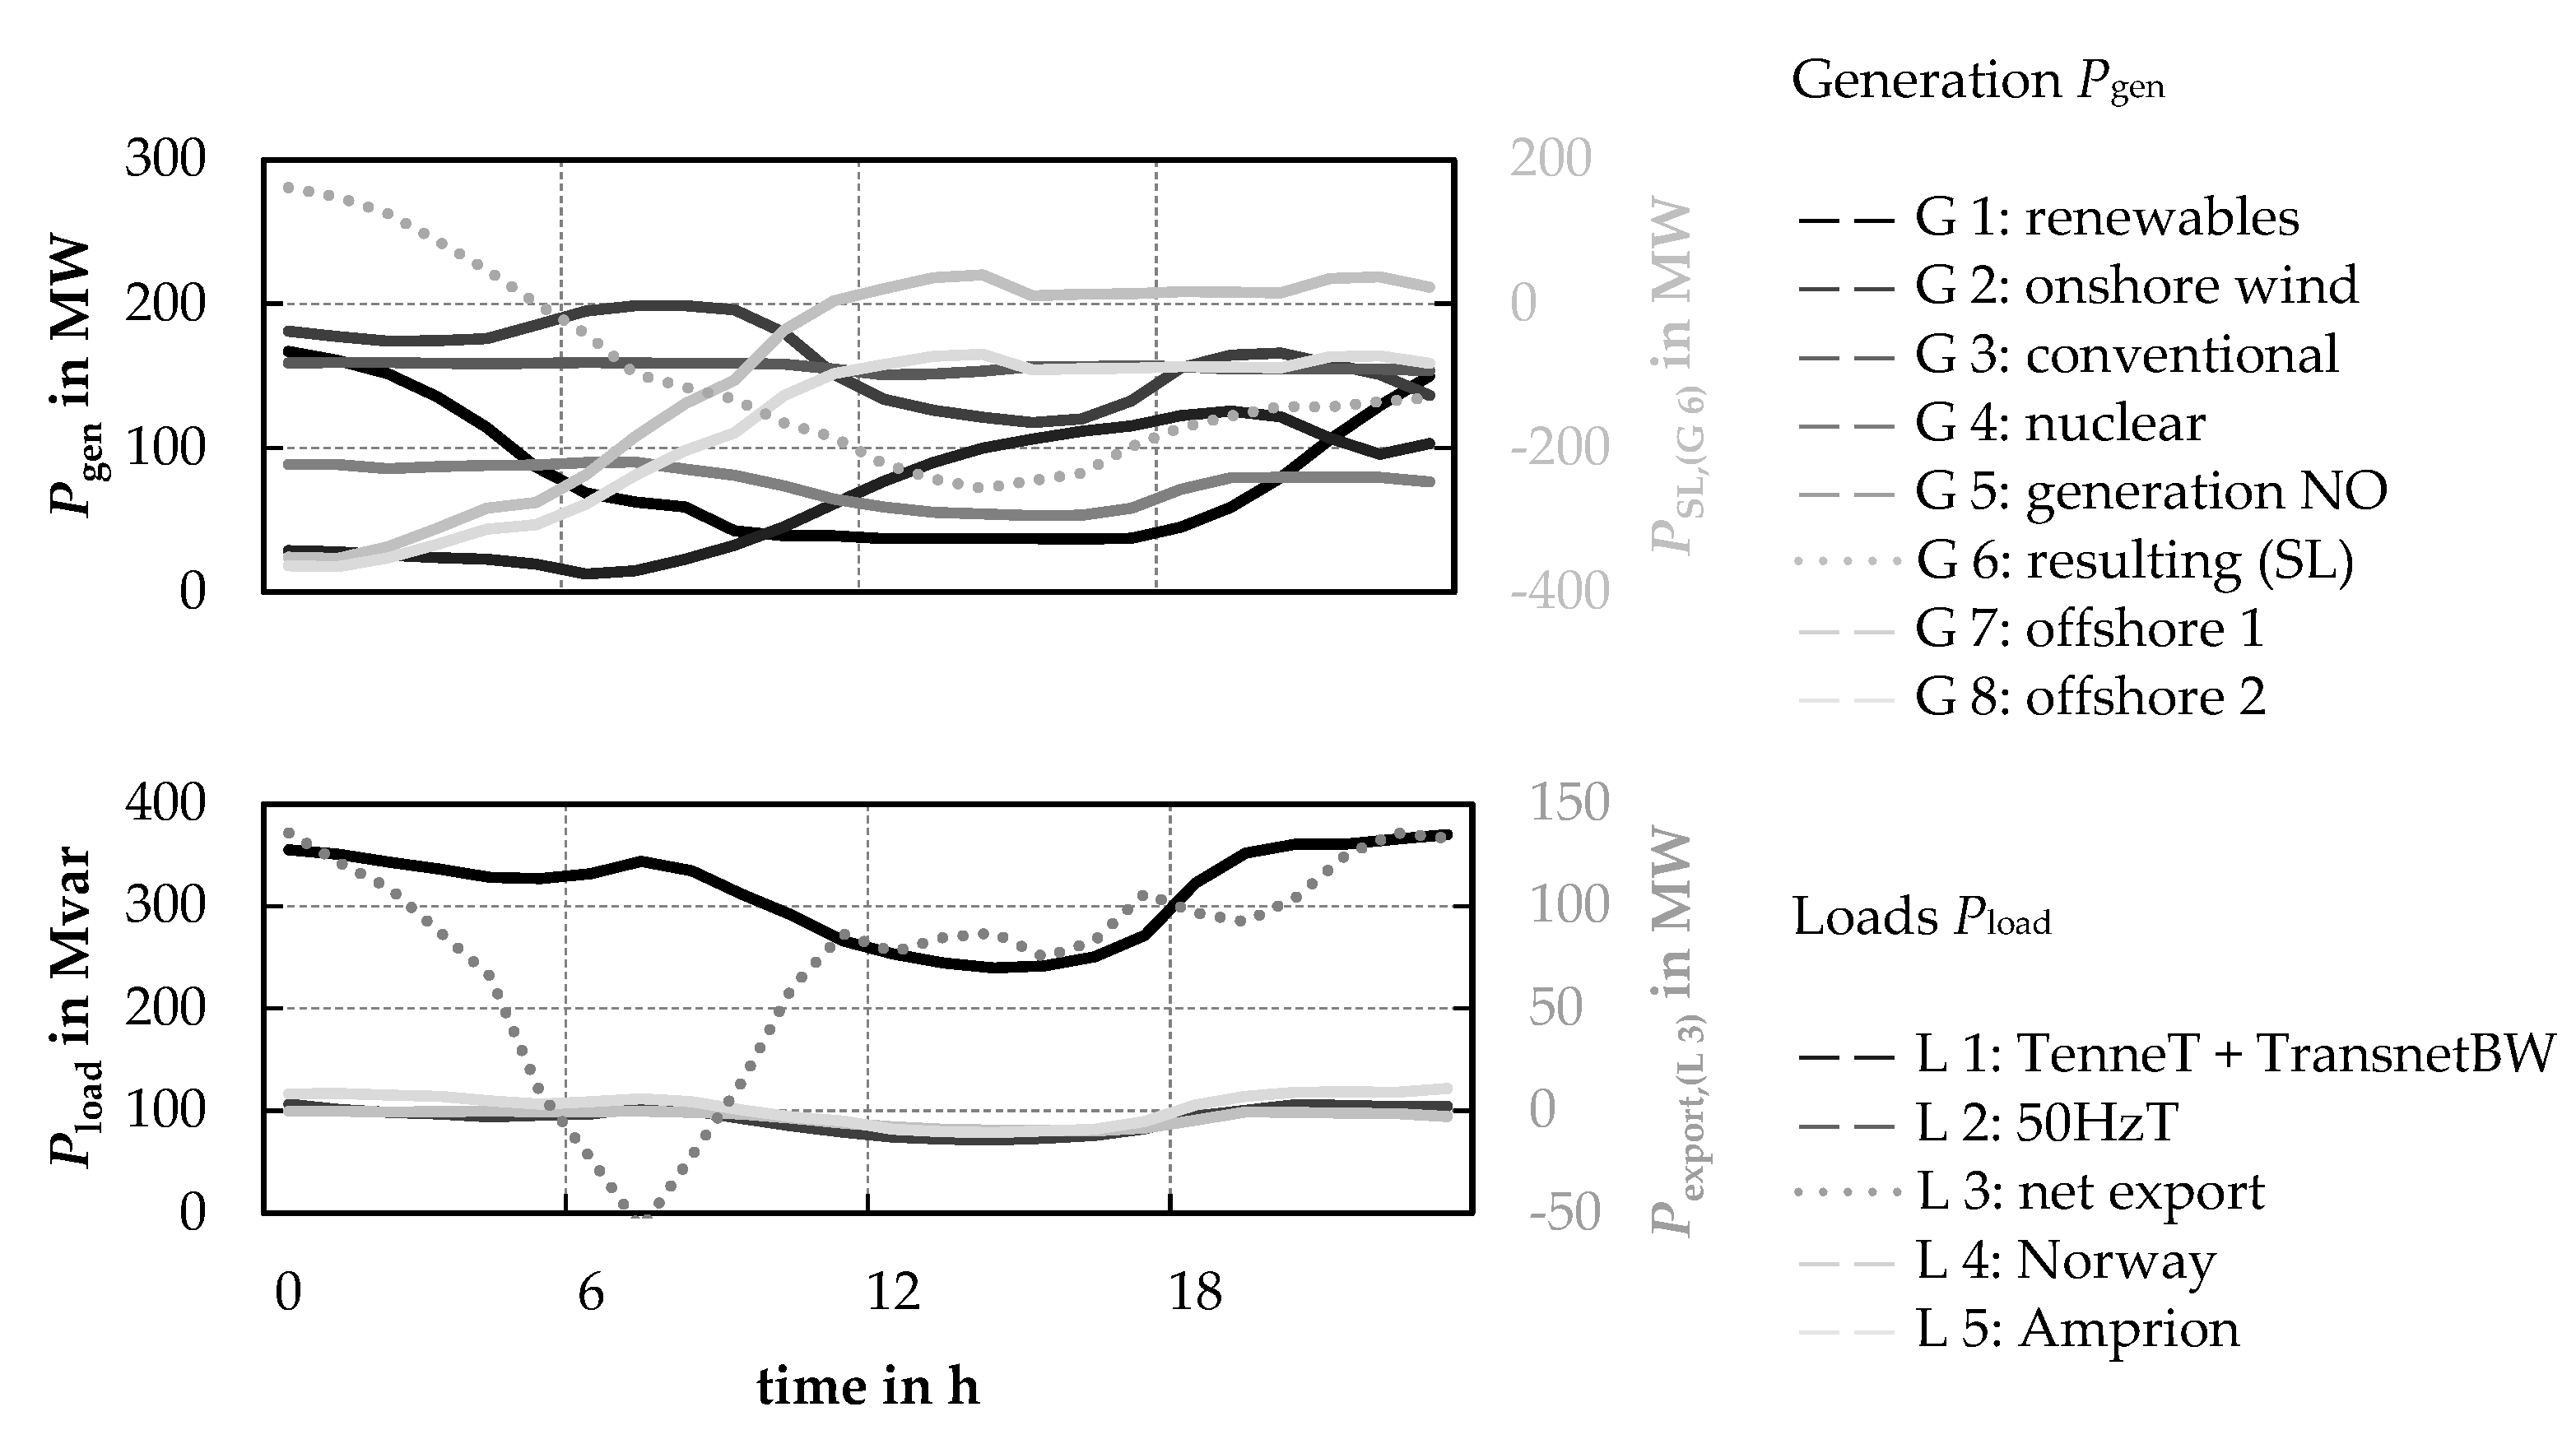
The investigated diurnal cycle contains strong changes in the individual generation, meaning that even within the relatively short period of 24 h, large differences in the resulting power flows in the grid occur, which consequently are resulting in differing challenges for ensuring a secure system operation. Figure 6 shows an overview of the resulting time series on the generator and consumer side.
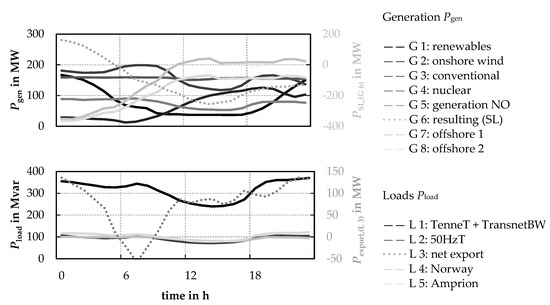
Figure 6.
Generation and consumption time series in the AC/MTDC system.
A base case is determined using the flexibilities provided by the HVDC system to minimise the system losses Ploss. The optimisation problem for loss minimisation can be represented by (17), where the nodal powers pK and qK include the flexibilities of the HVDC system pHVDC and qHVDC.
The optimisation problem uses voltage magnitudes and angles v and δ as state variables, and voltage magnitude and angle vHVDC and δHVDC of the HVDC equivalent circuit introduced in Section 2.3 as decision variables. In addition to the maximum and minimum bus voltage magnitudes vmax and vmin and maximum allowable branch currents imax, the maximum loadings ηmax of generating units and HVDC converters are considered.
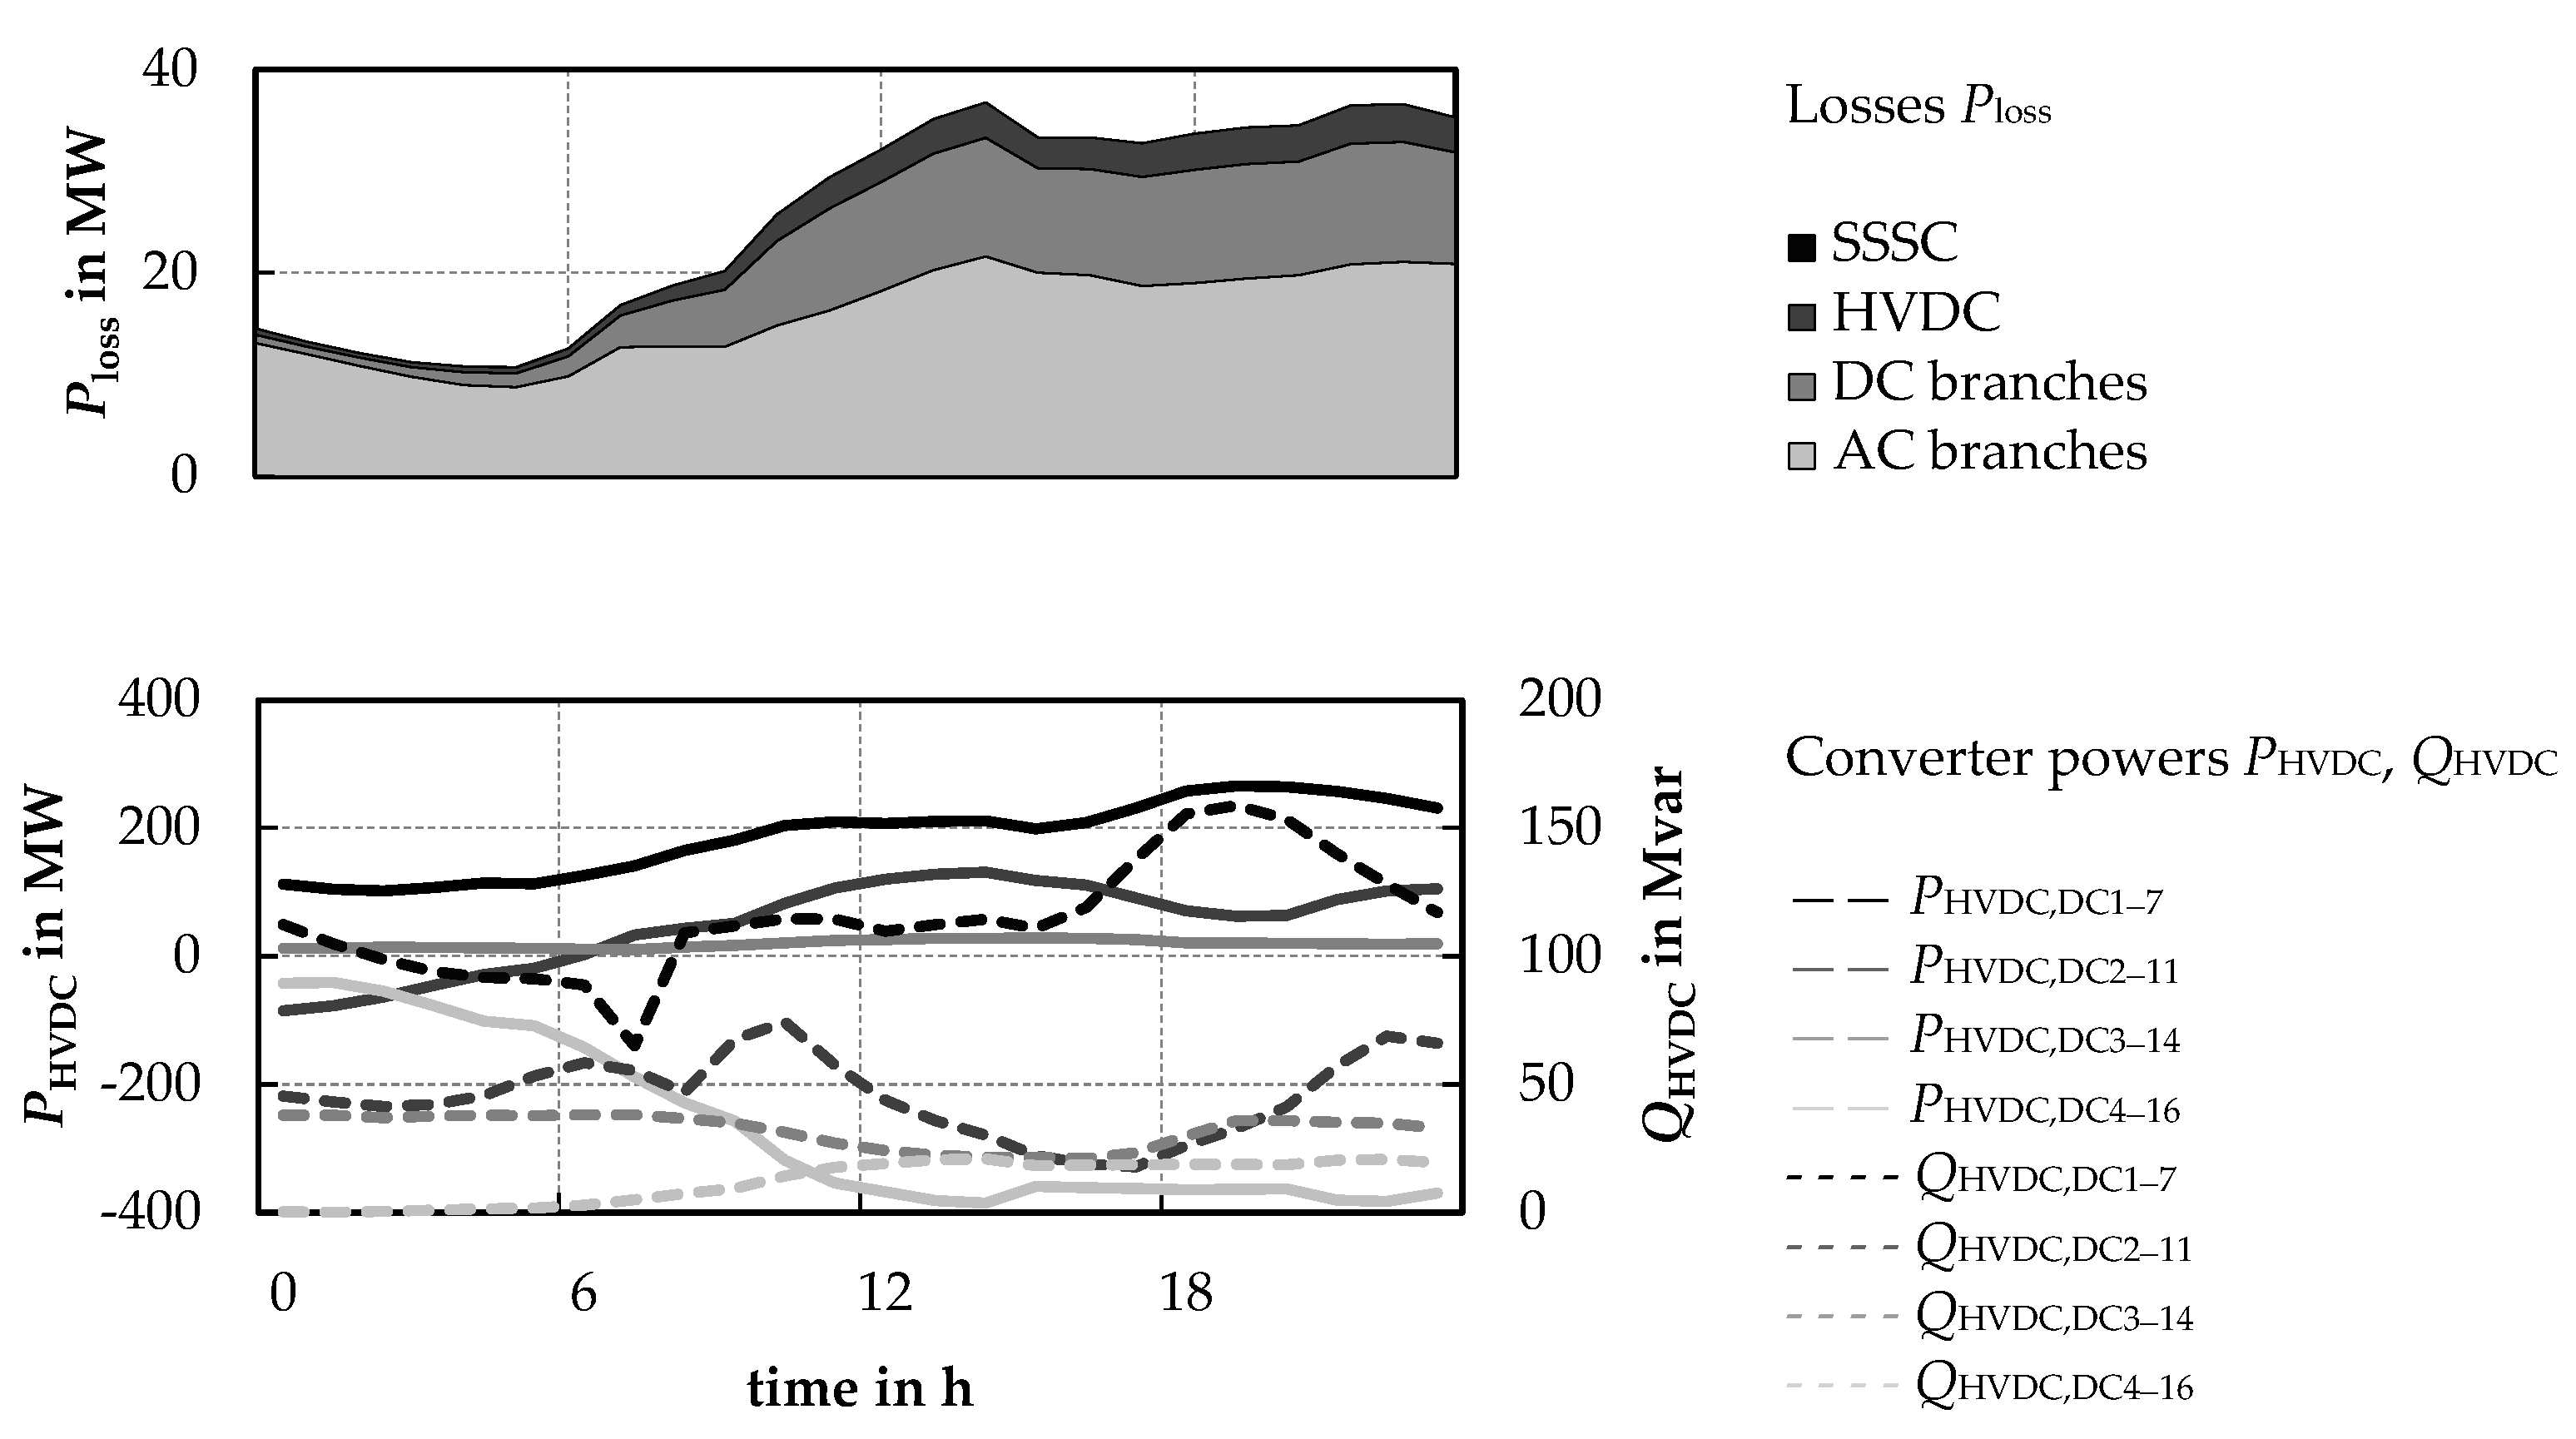
Figure 7 shows the resulting values of the objective function value broken down to individual losses considered and the resulting time series of the active and reactive power of the HVDC converters.
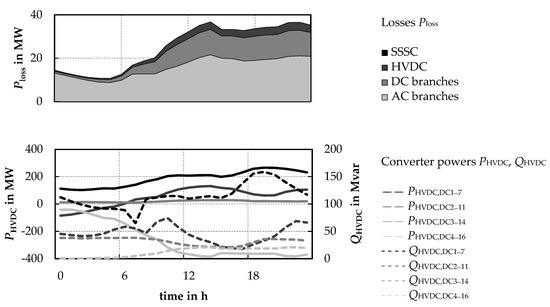
Figure 7.
Loss minimisation as base case: objectives (above) and HVDC set points for controllable converters (below).
The power flow control in the form of the SSSC system is initially assumed to be inactive for the base case. Due to the limits considered by the optimisation with respect to the loadings and voltage magnitudes, this result represents an N-0-secure state of the system over all optimised time steps.
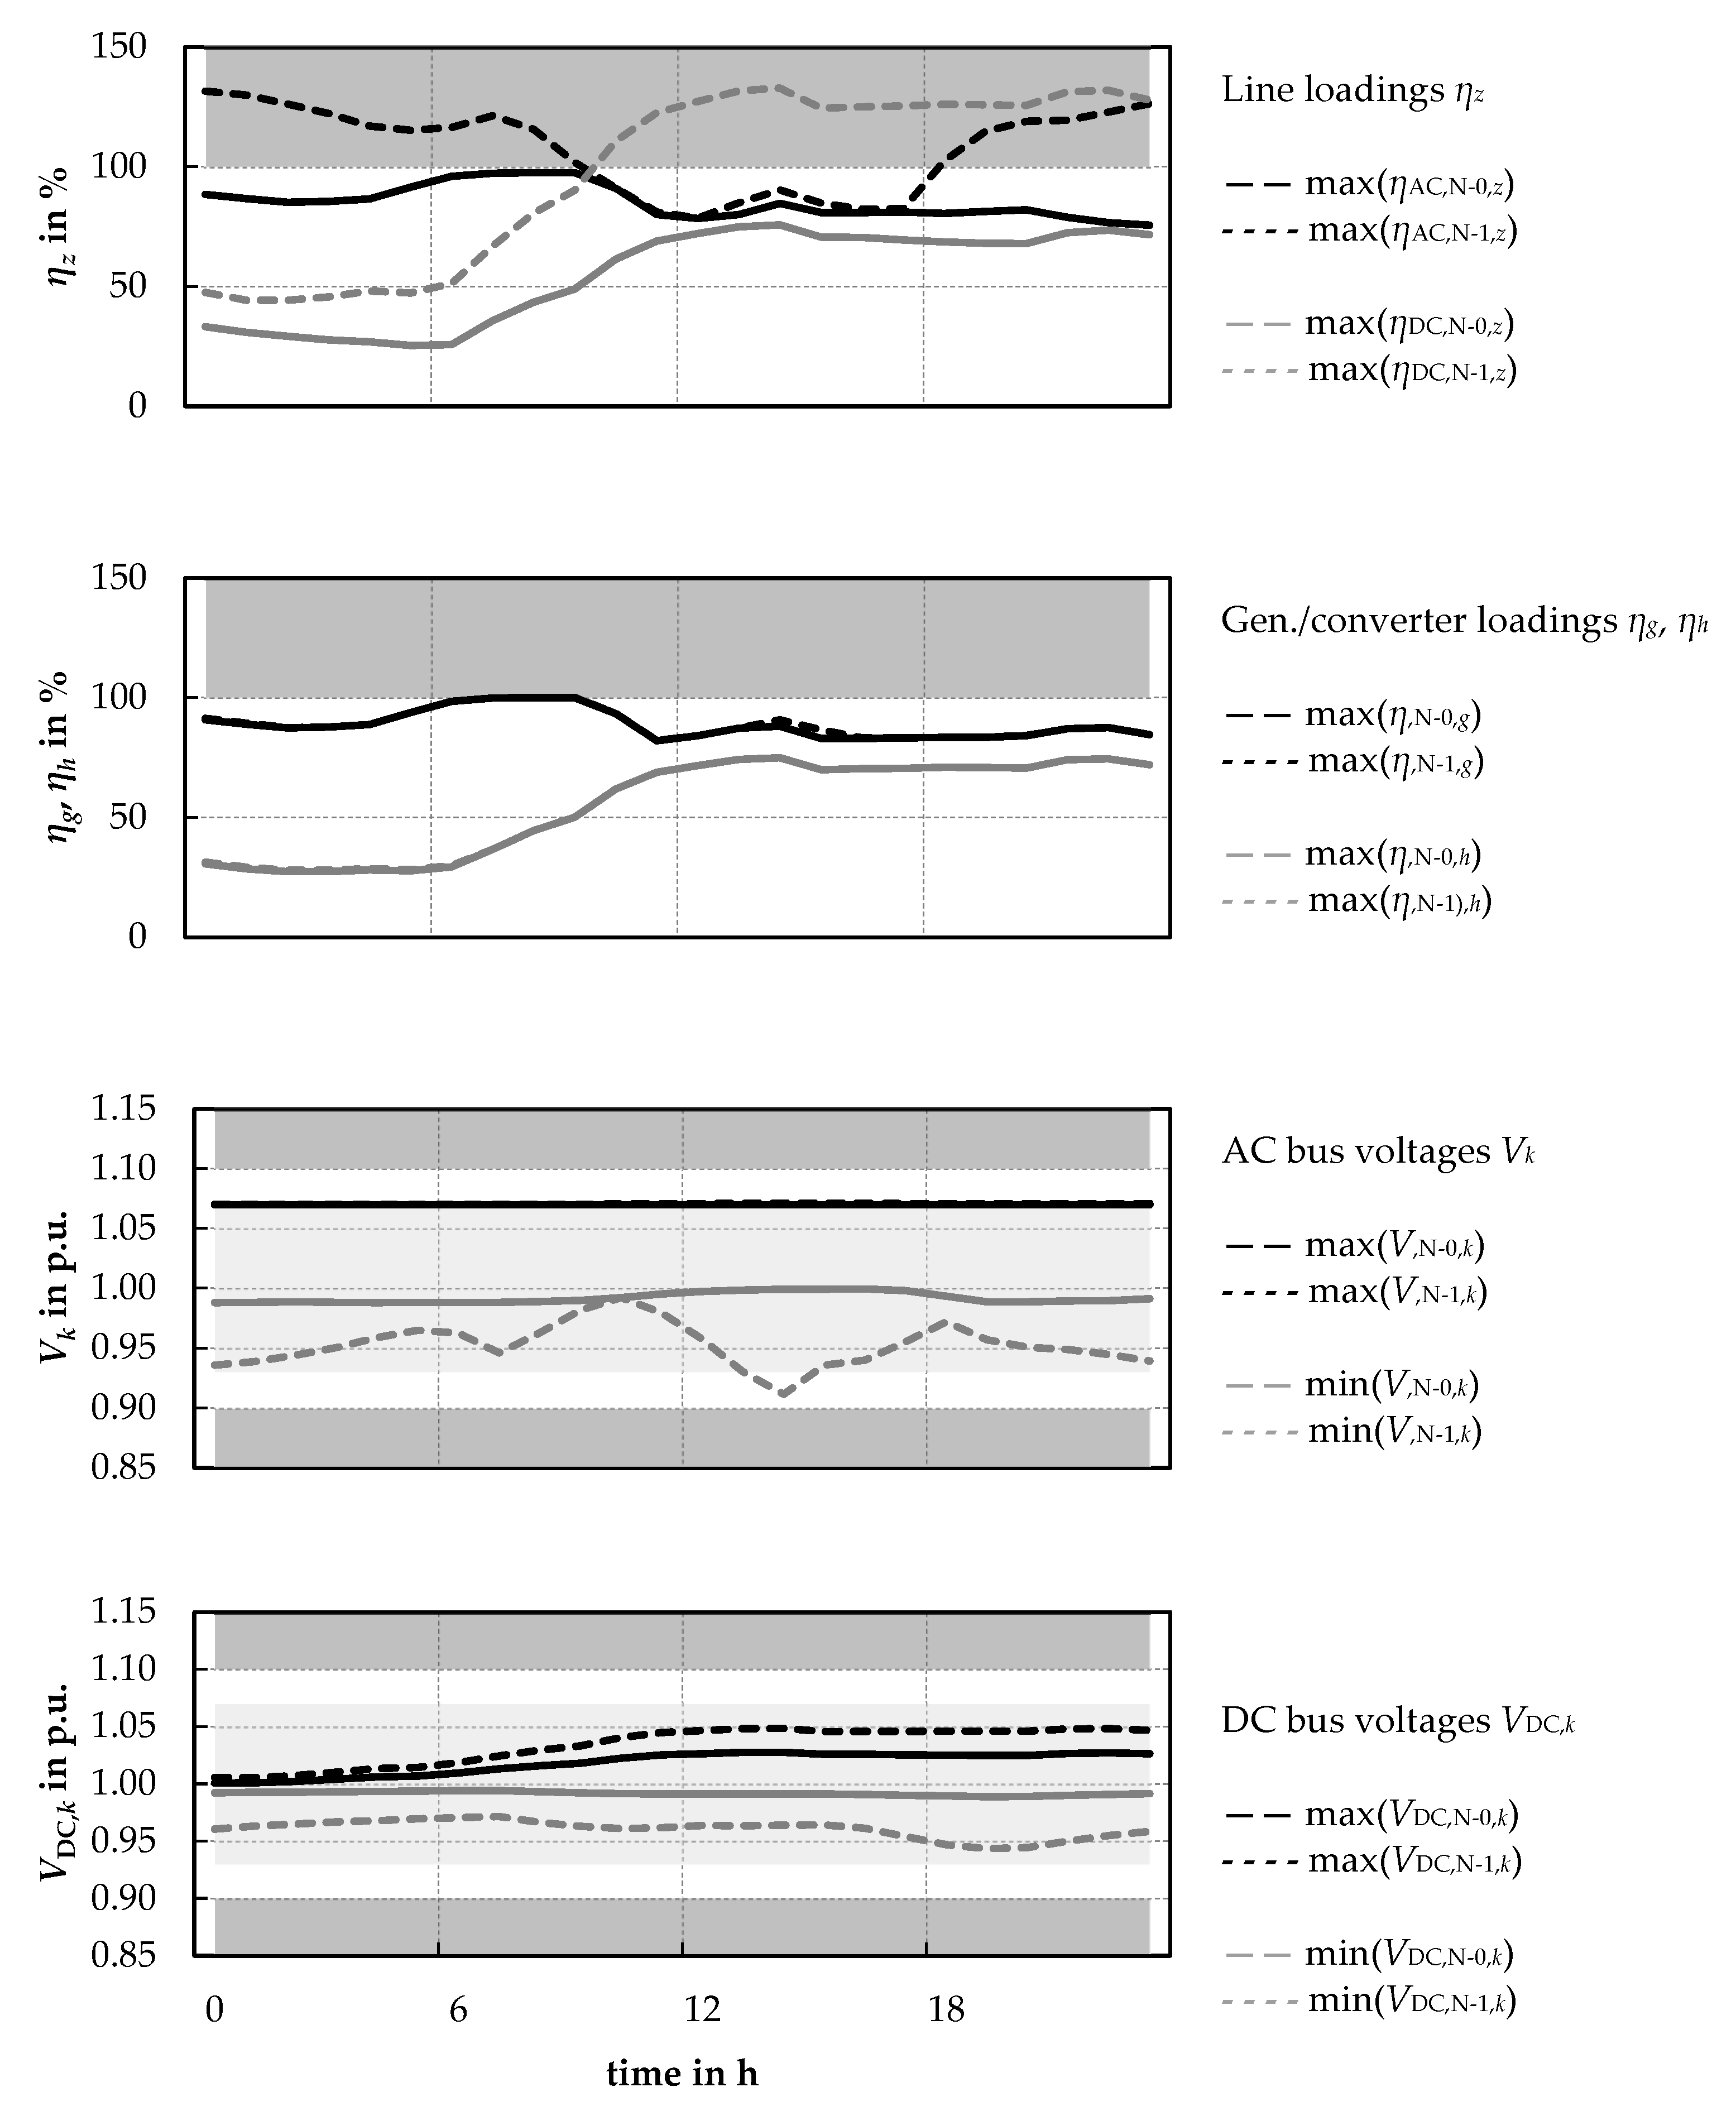
In a second step, a failure variant calculation is performed. For this purpose, line outages of the lines 7–8, 8–11, 10–15, and 13–15 of the AC system 1 (all of them referred to as ‘AC’ in Table 1) as well as of the lines DC 1–DC 2 and DC 1–DC 4 of the DC system (‘DC’ in Table 1) are evaluated, whereby the operating points of generation and consumption as well as of the HVDC system are kept as calculated in the base case. The failure variant calculation provides the load factors and resulting limit violations as shown in Figure 8 (values in the grey shaded area of the plot). These are shown together with the respective time series in the base case N-0, whereby the representation contains only the maximum and minimum values of the corresponding quantities over all elements and failure variants.

Table 1.
Scenario overview.
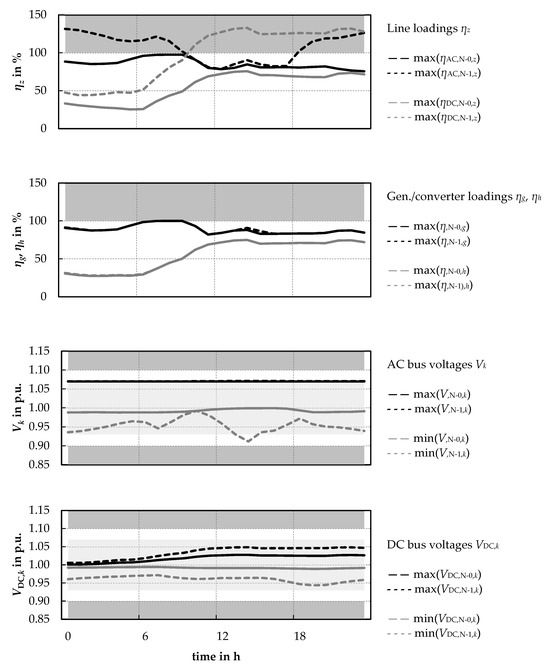
Figure 8.
Resulting maximum loadings and maximum/minimum bus voltages in AC and DC system.
As can be seen, the system is not in an N-1-secure state if chosen failure variants are considered due to the impermissible maximum line loadings (Figure 8). Only in time step ten are the maximum loadings of all lines in all failure variants below the permanently permissible loading. In the time series of loss minimisation of the N-0-case, the voltages are limited to the range between 0.93 and 1.07 p.u. In the failure variants, bus voltages up to limits of 0.90 to 1.10 p.u. are accepted.
Due to the resulting congestion determined by different limit violations, interventions are necessary. They are determined in the following with flexibilities available in operational congestion management. In addition to flexibilities on the generator and consumer sides, the curative use of corresponding measures and the additional effect of specific power flow control using series elements are calculated in different scenarios.
3.2. Scenario-Based Simulations
In the context of the use cases, different flexibilities are assumed in different scenarios. These are, in each case, adjustments in the operating point:
- of the generators G 7–G 8 (assumed to be offshore wind power plants) (flexible element ‘WG’ in Table 1),
- the HVDC systems (designated to the connection nodes DC 1–7, DC 2–11, DC 3–14 and DC 4–16) considering the control modes of the respective converters (flexible element ‘HVDC’ in Table 1),
- subordinate renewable generation plants (and their regulation) by the adjustment of the loads (L 1–L 5) (flexible element ‘Load’ in Table 1), as well as
- of series elements for specific power flow control (in the simulation by control of an SSSC) (flexible element ‘SSSC’ in Table 1).
Depending on the generation type (such as nuclear, fossil-fuelled (e.g., natural gas, coal, oil, wind, pumped-hydro), an adjustment Δp of the active power compared to the current operating point within the operating limits in the positive and negative directions by the generators (increase/decrease of generation), in the negative direction (reduction/curtailment) of the offshore wind turbines, as well as an increase of the loads (by an assumed reduction/curtailment of the distributed generation included in the mixed load) is allowed. The generator G 6 represents the balancing unit and therefore cannot be explicitly adjusted but is included in the determination of the preventive and curative operating point changes to avoid explicit congestion relief using the balancing generator. In addition, the operating point of the HVDC converters can be used as a flexibility option, with the DC 3–14 and DC 4–16 converters each taking over the balancing of the connected AC systems and the DC 2–11 converter taking over the DC side voltage regulation and thus the balancing of the DC system.
Table 1 shows an overview of the considered scenarios #1–#8 and the flexibility options assumed in each scenario. To enable a clear presentation of the results and the comparison of the different simulation scenarios, the further analysis is divided into three aspects, which are presented sequentially in the following:
- congestion management through preventive measures,
- curative measures to reduce preventive measures, and
- specific power flow control for the reduction of preventive and curative measures.
3.2.1. Congestion Management with Preventive Measures
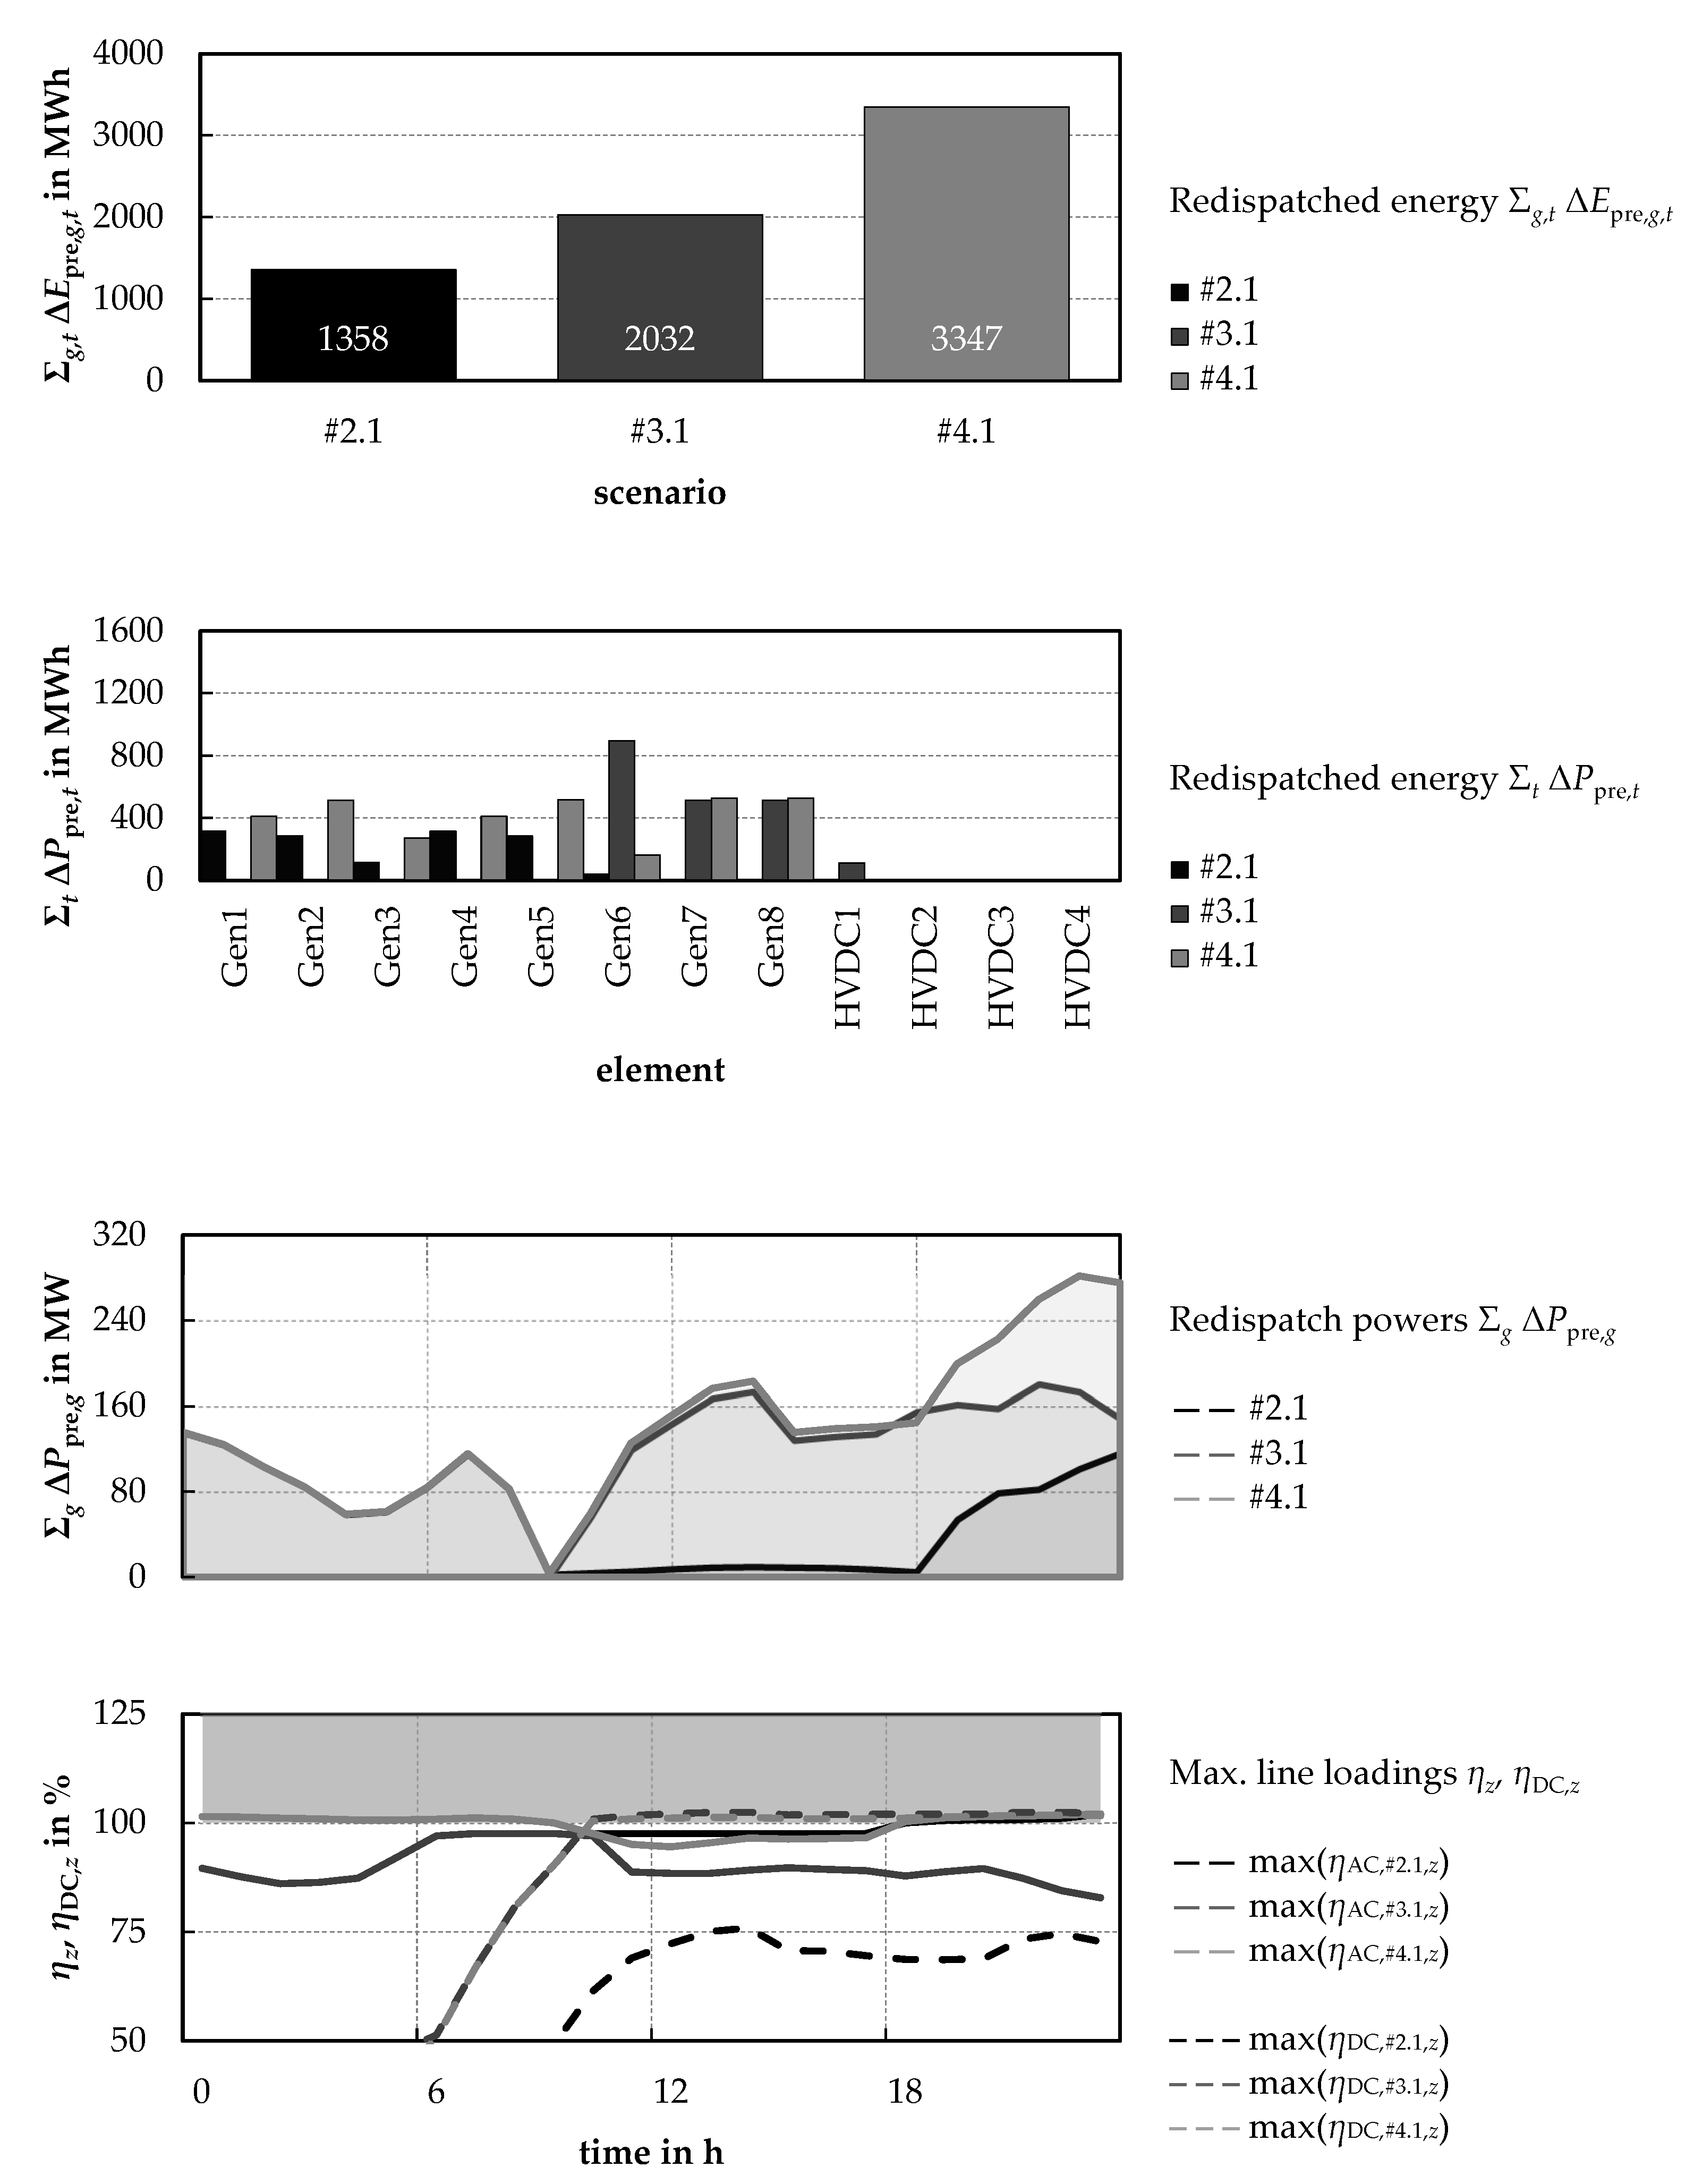
Firstly, operating point adjustments to simulate minimum necessary preventive measures in the preventive scenarios #2.1, #3.1, and #4.1 without specific power flow control are determined and compared. Preventive actions are the same in the N-0-case and all N-1-situations, which is why they are included in the problem without the scenario index s. Figure 9 shows a comparison of the necessary preventive measures to ensure a congestion-free system state for the specified failure variants.
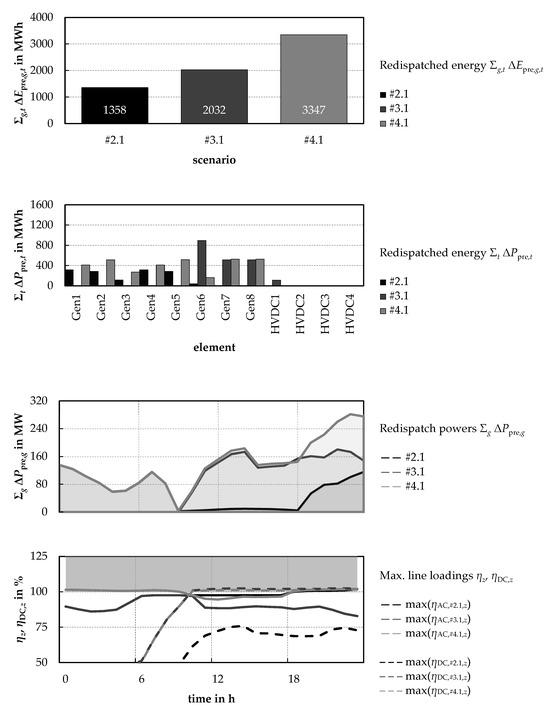
Figure 9.
Results of the preventive scenarios #2.1, #3.1, and #4.1.
As the results show, N-1-security can be achieved by adhering to the specified limits (represented here by the line utilisation) through preventive measures. Also formulated as constraints, but not explicitly shown, are generator and HVDC converter utilisation as well as maximum and minimum bus voltages in the AC and DC system.
A comparison of the scenarios shows that the measures required to ensure N-1-security in the AC and DC systems, respectively, do not simply add up, but can also be lower (as in the present example: #2.1 + #3.1: 3390 MWh, #4.1: 3347 MWh; Figure 9), but in other cases could also be higher. This is due to the inherent interdependencies in combined AC/DC systems and leads to the fact that these congestion mitigation measures have to be determined together.
The resulting generator and HVDC flexibilities for preventive control in scenario #4.1 serve as basis for comparison of necessary preventive measures in the further considerations to show the effect of the curative use of measures as well as the power flow control.
3.2.2. Effect of Curative Measures
In this simulation step, the curative measures deployment and its potential to reduce necessary preventive measures will be considered in comparison to the previously presented results of the preventive scenario #4.1. For this purpose, the preventive scenario #4.1 is compared with two other scenarios in which additional curative measures are available:
- (Preventive-curative) scenario #5.1: Preventive measures by all generators (G 1–G 8) with additional possibility of curative measures by the HVDC system.
- (Preventive-curative) scenario #8.1: Preventive measures by all generators (G 1–G 8) with additional possibility of curative measures by the HVDC system, the generators G 7 and G 8, as well as the decentralised subordinated generation power by increasing the loads L 1–L 5.
The possibility to use curative measures is based on existing reserves as well as on the thermal inertia of the operating assets which are permissibly loaded higher for a short time in case of a fault (as introduced above). Accordingly, higher current limit values can be applied, are mapped via the scenarios s, and are assumed for this simulation for AC lines with 110% of the nominal current (iTATL,AC) and for DC lines with 120% of the nominal current (iTATL,DC).
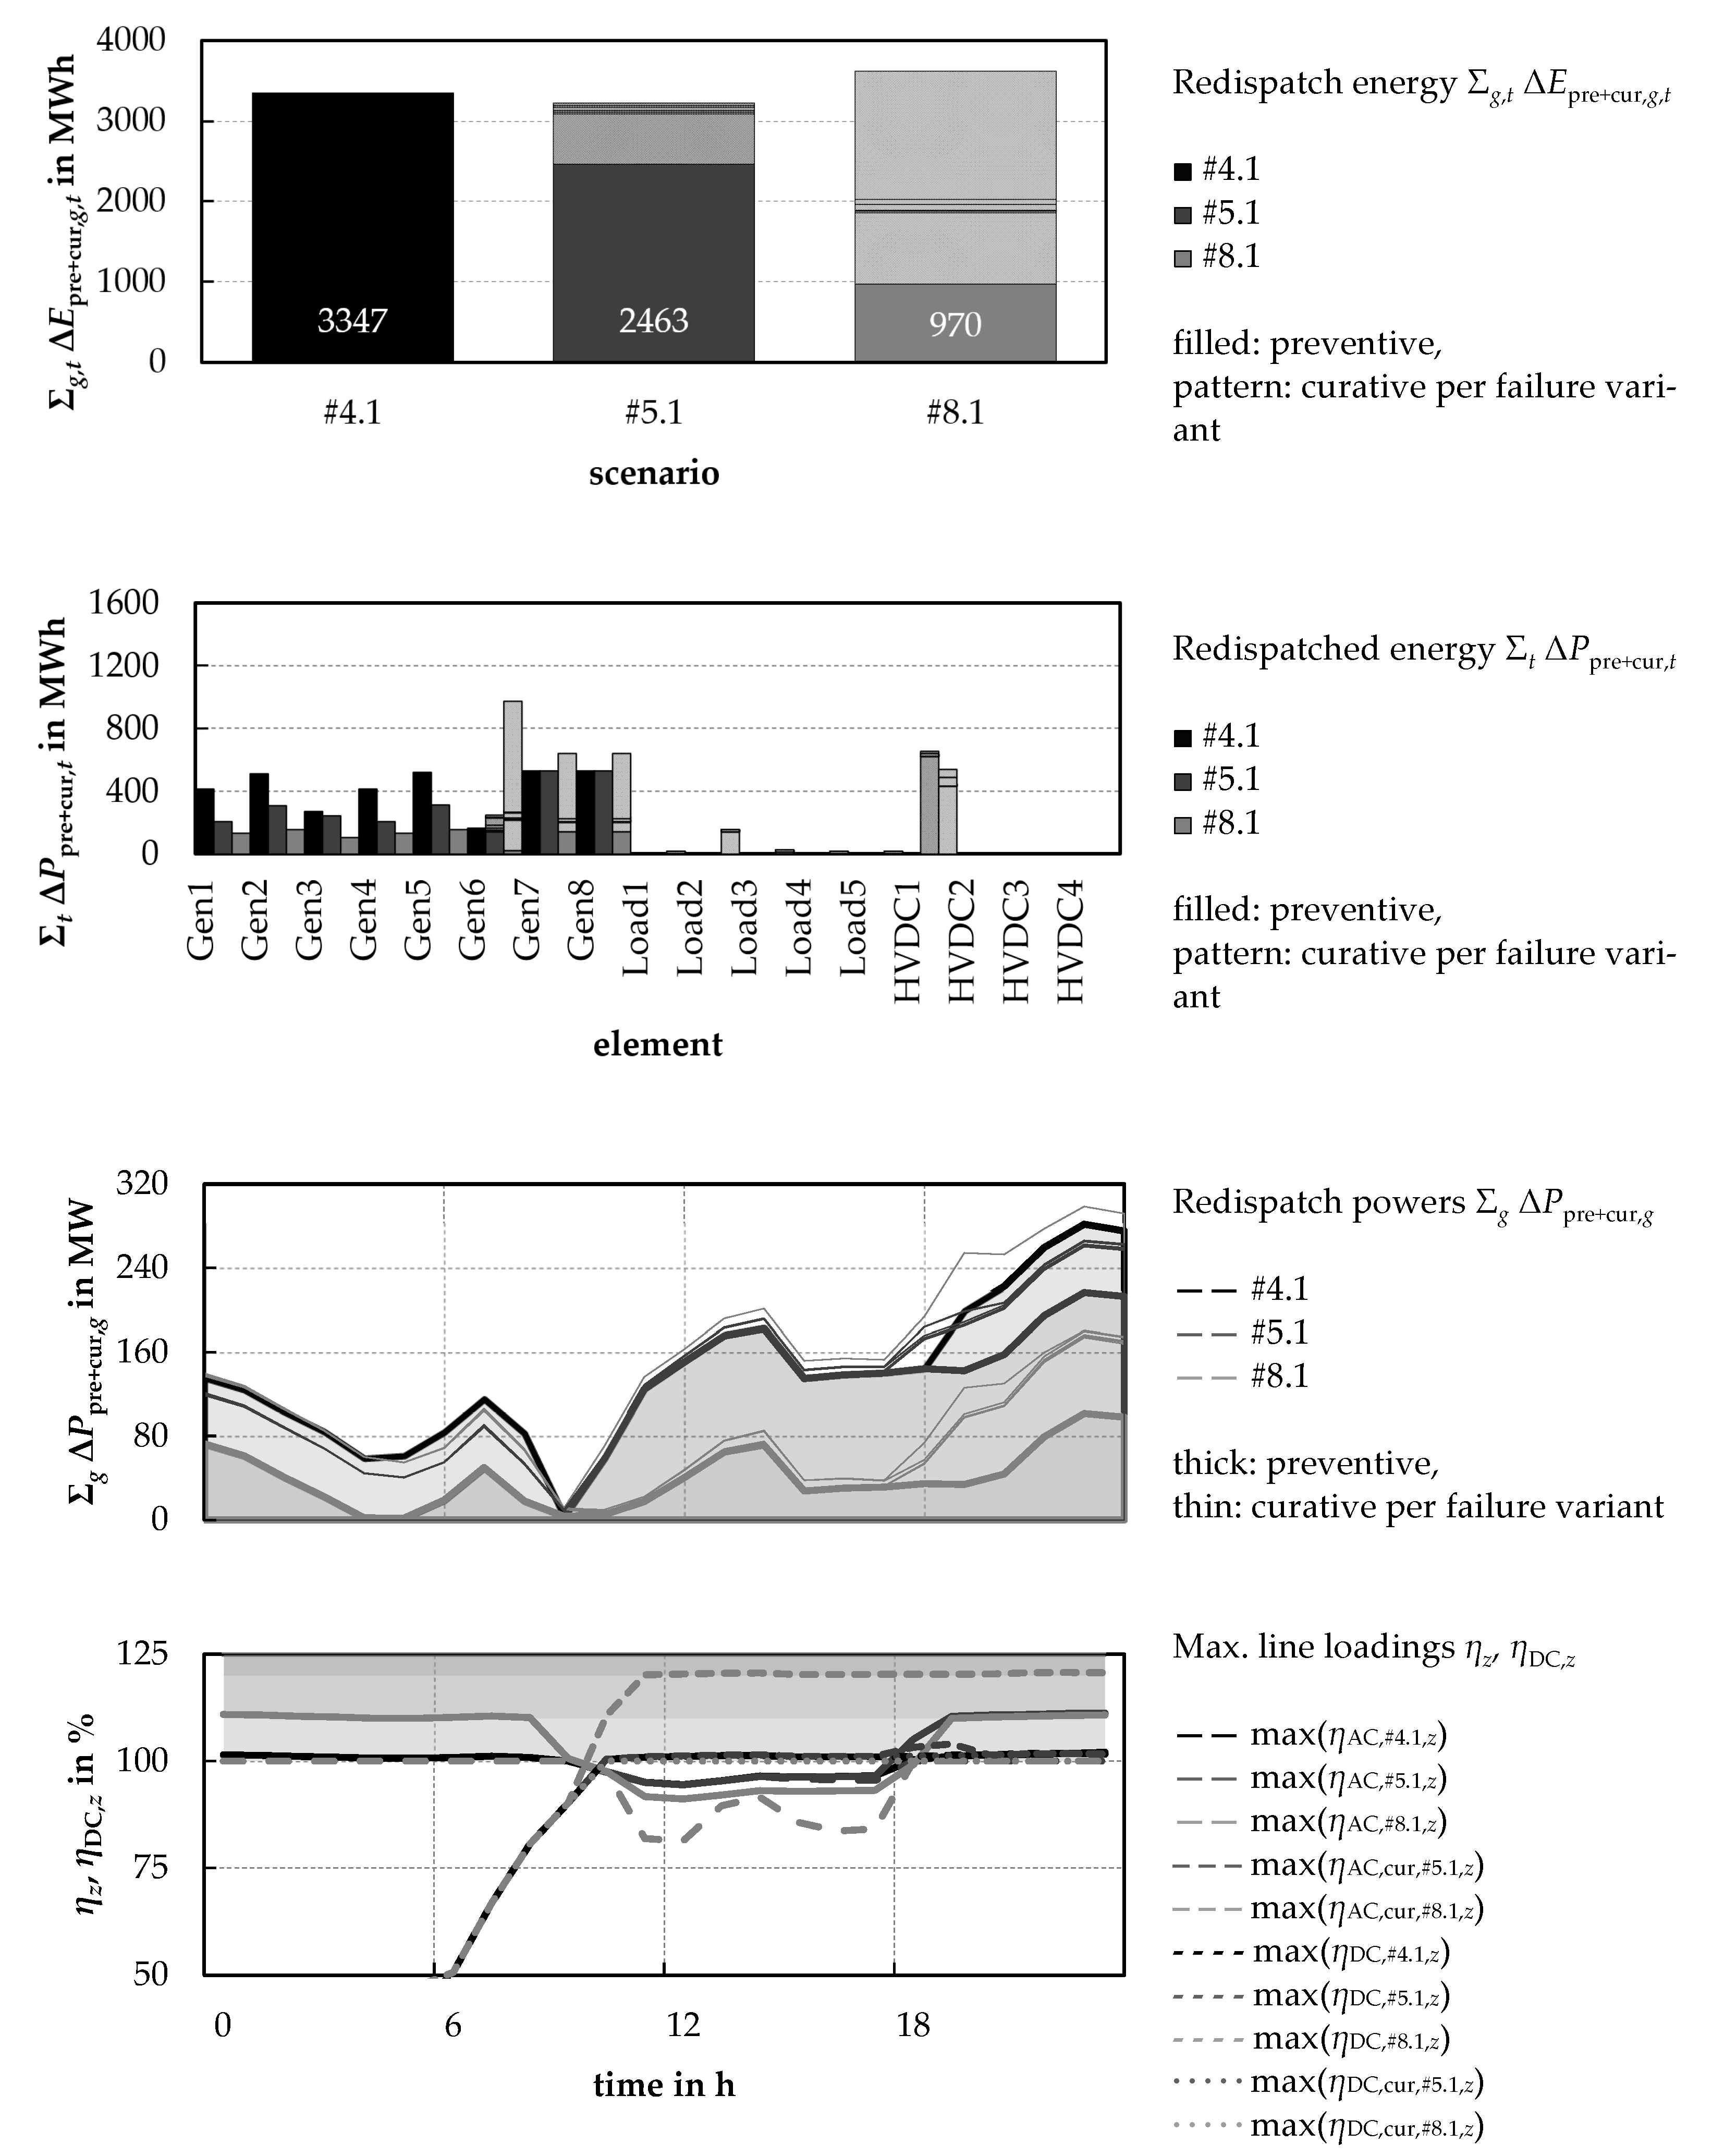
Figure 10 shows a comparison of the preventive scenario #4.1 with the preventive-curative scenarios #5.1 and #8.1 and the necessary use of preventive and curative measures (divided into the scope of the individual failure variants) for congestion avoidance. Corresponding to the temporarily permissible higher utilisation for curative measures, utilisation rates up to the respective temporarily permissible limits iTATL,AC/DC are achieved for individual lines in the AC and DC systems in the curative scenarios #5.1 and #8.1 (Figure 10). The curative deployment is preferably applied according to the optimisation goals and increases with an increasing number of flexibilities provided. The areas of curative measures shown here and in the following are stacked, and thus sub-divided, in a failure variant-specific manner. At the same time, preventive measures, which are implemented before a failure actually occurs and are usually associated with costs, can be reduced in the scenarios with curative measures.
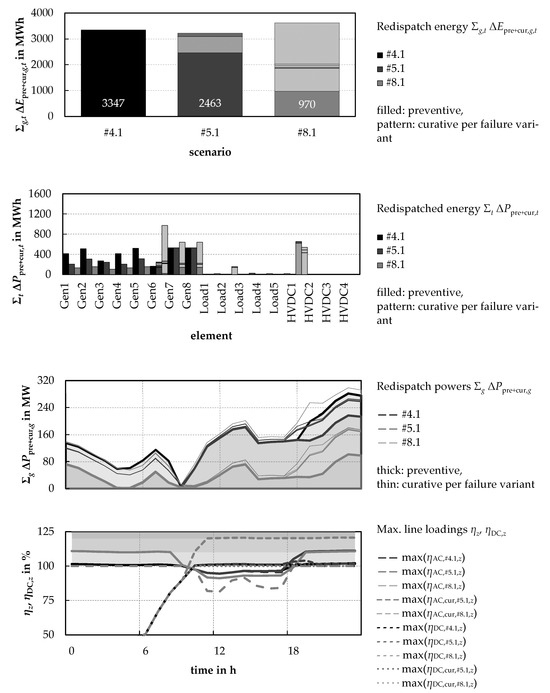
Figure 10.
Results of the preventive-curative scenarios #4.1, #5.1, and #8.1.
Here, in the comparison of the preventive scenario #4.1 with the curative scenario #5.1, on the one hand, the preventive measure input is reduced by more than 25% by the available curative operating point change, whereas on the other hand, the additional flexibility in the form of the HVDC converters (in the curative input) can also slightly reduce the total quantity of necessary measures. In comparison, an extensive curative deployment of various flexibilities in curative scenario #8.1 can reduce the preventive measure deployment by around 70%, whereas the total quantity of measures (when adding the curative measures determined per failure variant) increases slightly. This is since the curative measures used may have a lower sensitivity to the bottlenecks than the available preventive measures, but due to the preferential application via a lower weighting in the objective function, they are used more. Figure 10 shows that all available curative measures (decentralised curtailment of generation plants, curtailment of offshore wind energy, and HVDC working point change) are used to minimise the respective preventive input.
3.2.3. Effect of Specific Power Flow Control
In a third simulation step, the effect of specific power flow control for the reduction of preventive (and, if necessary, curative) measures will be addressed. Therefore, the preceding simulation scenarios are used, whereby specific power flow control by the SSSC integrated in line 8–11 is included as an additional flexibility. For distinction, these scenarios are referred to as preventive-curative scenarios with power flow control #4.2, #5.2, and #8.2.
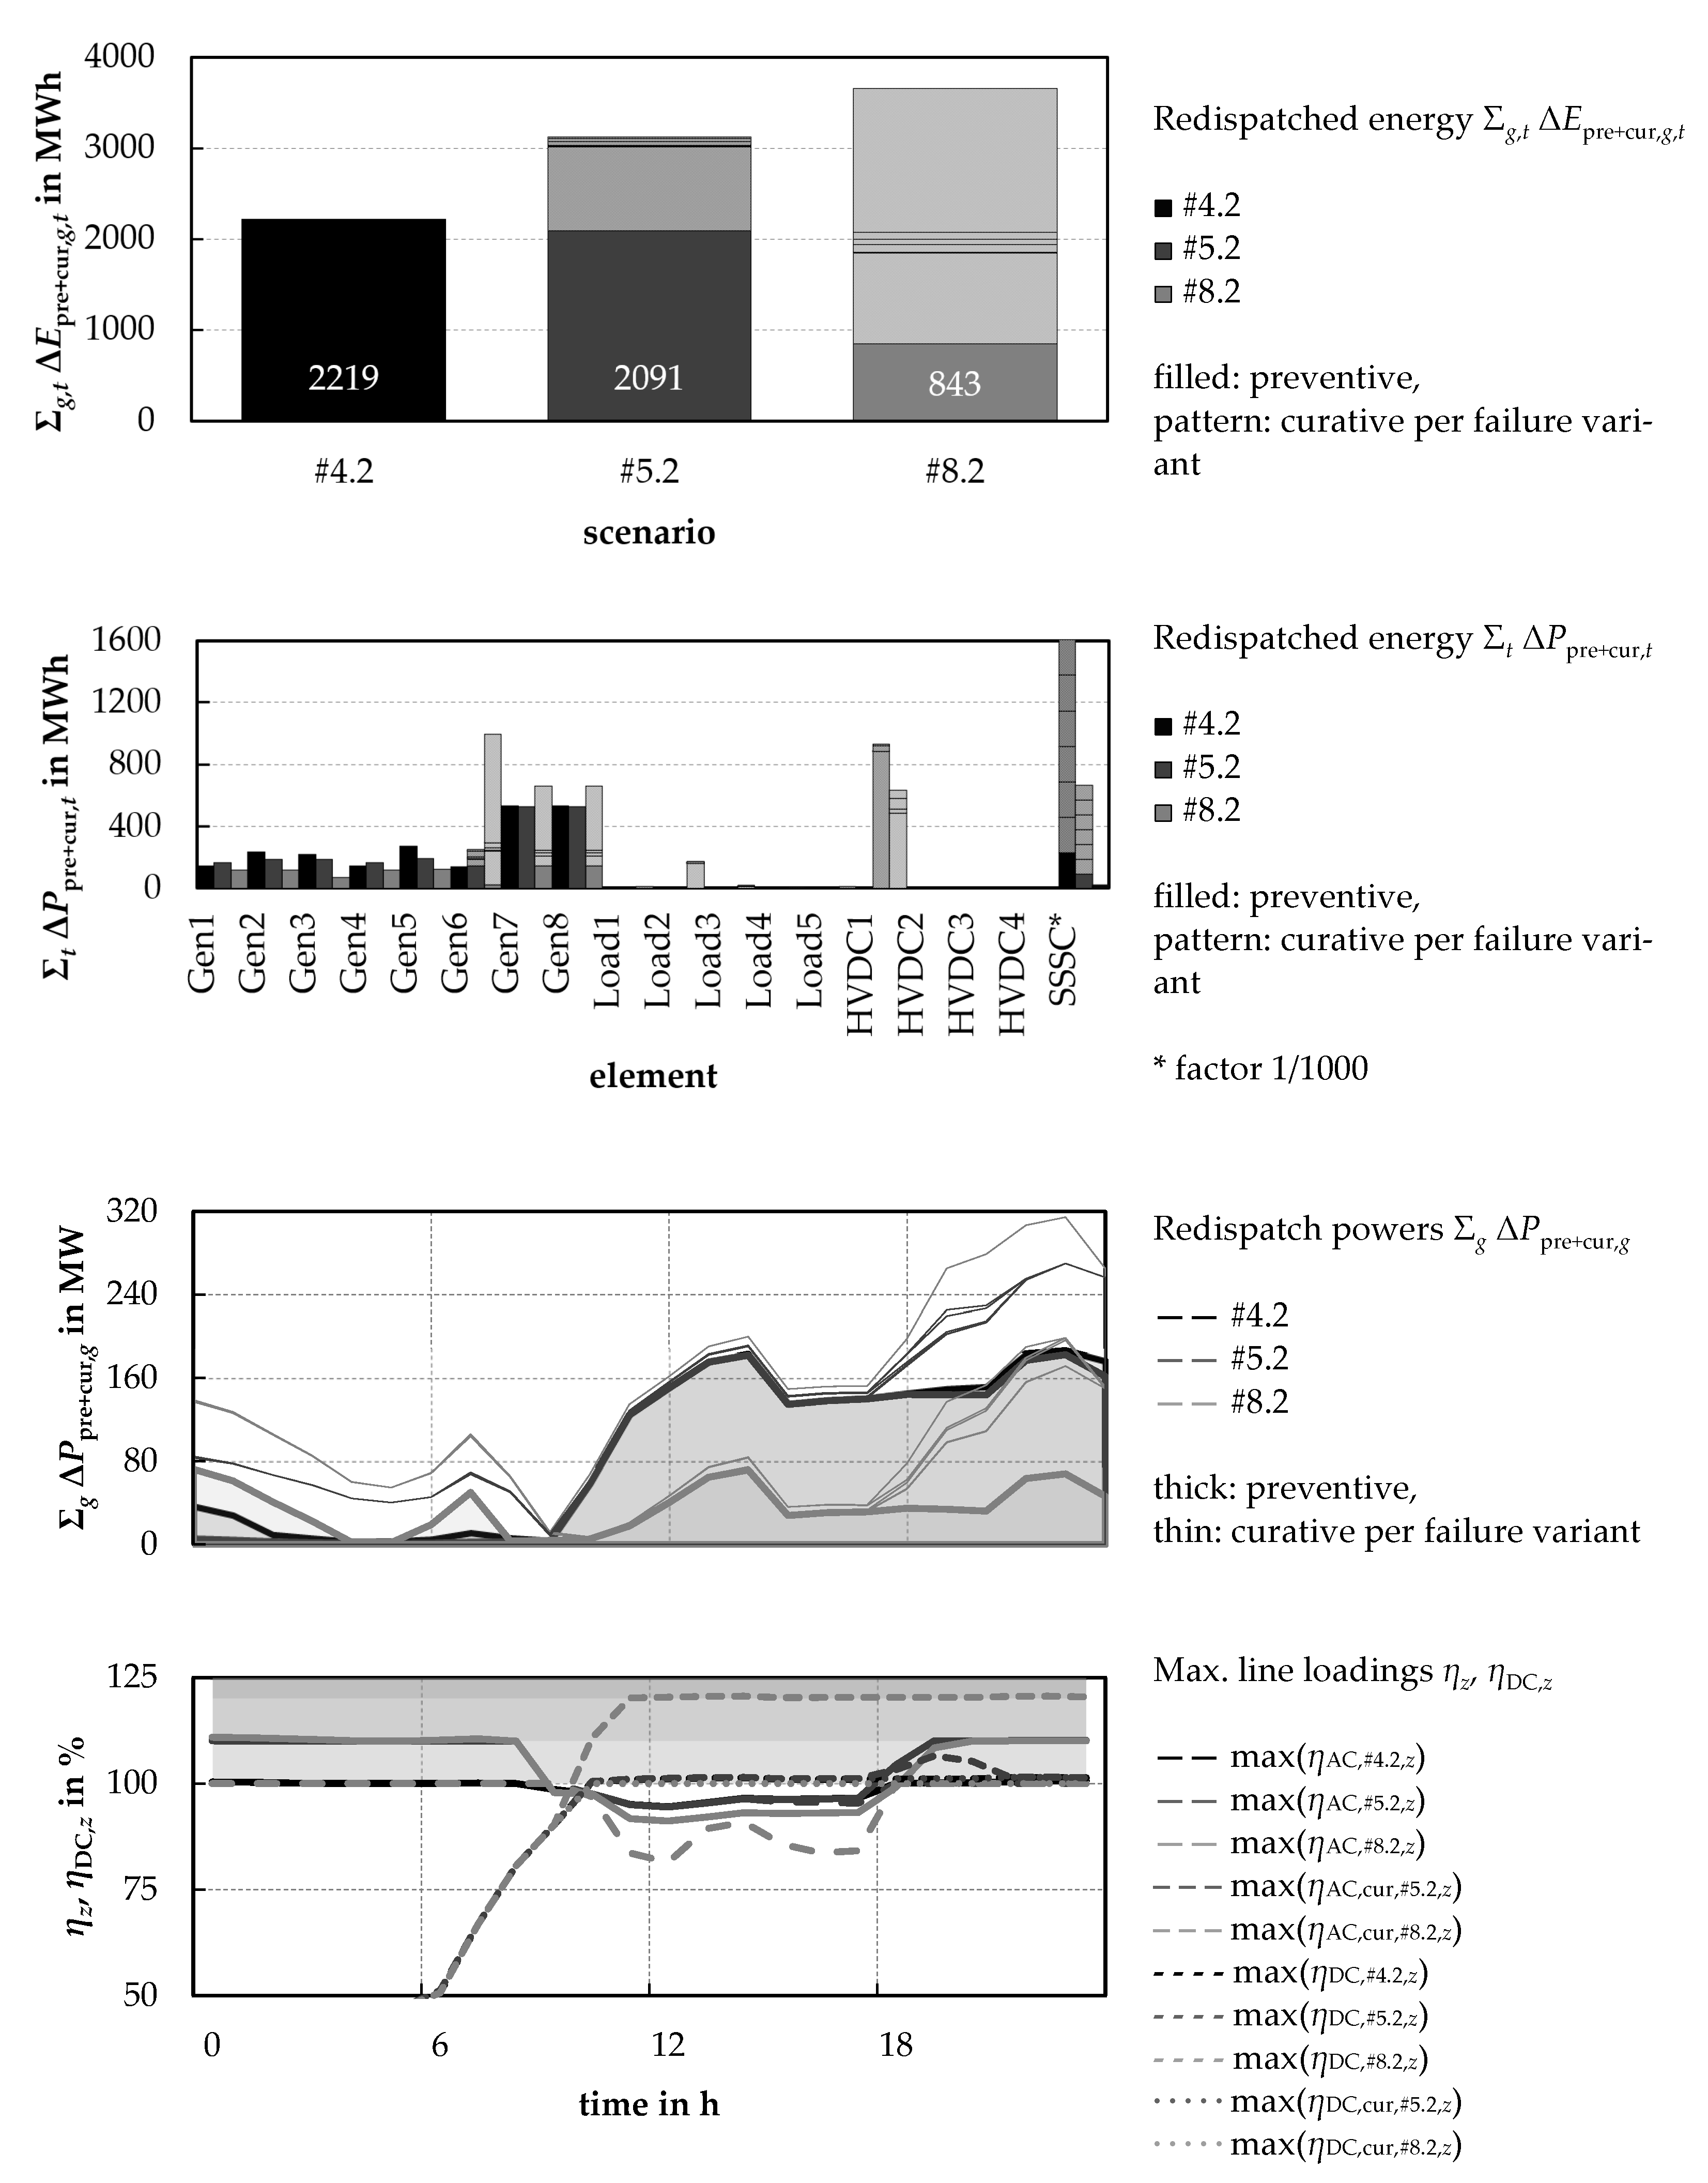
In addition to the formulation of the optimisation problem, the use of the SSSC is weighted by a factor of 1/1000 in the objective function to give it priority to the other preventive and curative measures. This is because power flow control within the grid goes along with no (or just marginal) cost for the grid operator compared to changes in generator dispatch, for which plants get compensation. Figure 11 shows the results for the necessary use of preventive and curative measures (classified by failure variants) with simultaneous use of specific power flow control via the SSSC.
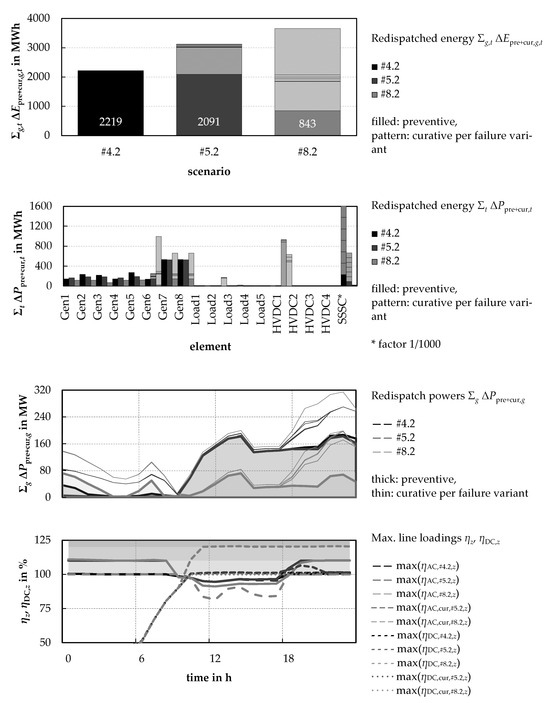
Figure 11.
Results of the preventive-curative scenarios including power flow control #4.2, #5.2, and #8.2.
The results are, to a large extent, in line with the previous section, whereby the basic level of the necessary preventive and curative measures can be significantly reduced by the possibilities of power flow control in all scenarios. In direct comparison, the use of measures for scenarios #5 and #8 with specific power flow control is 15 and 13% below the respective results of the comparable scenarios. However, the difference is most pronounced when considering the preventive scenario #4, where the reduction is over 33%. The comparison of the simulations with and without the specific and scenario-dependent power flow control demonstrates its potential for reducing the necessary preventive and curative measures within the scope of congestion management.
4. Discussion and Conclusions
The simulations in the previous sections provide an overview of possible applications of the developed optimisation tool in the context of operational congestion management. In addition to illustrating different degrees of freedom for avoiding congestion, an implementation variant for the optimal determination of preventive and curative measures is demonstrated. Furthermore, measures and resources for power flow control can be included in the consideration.
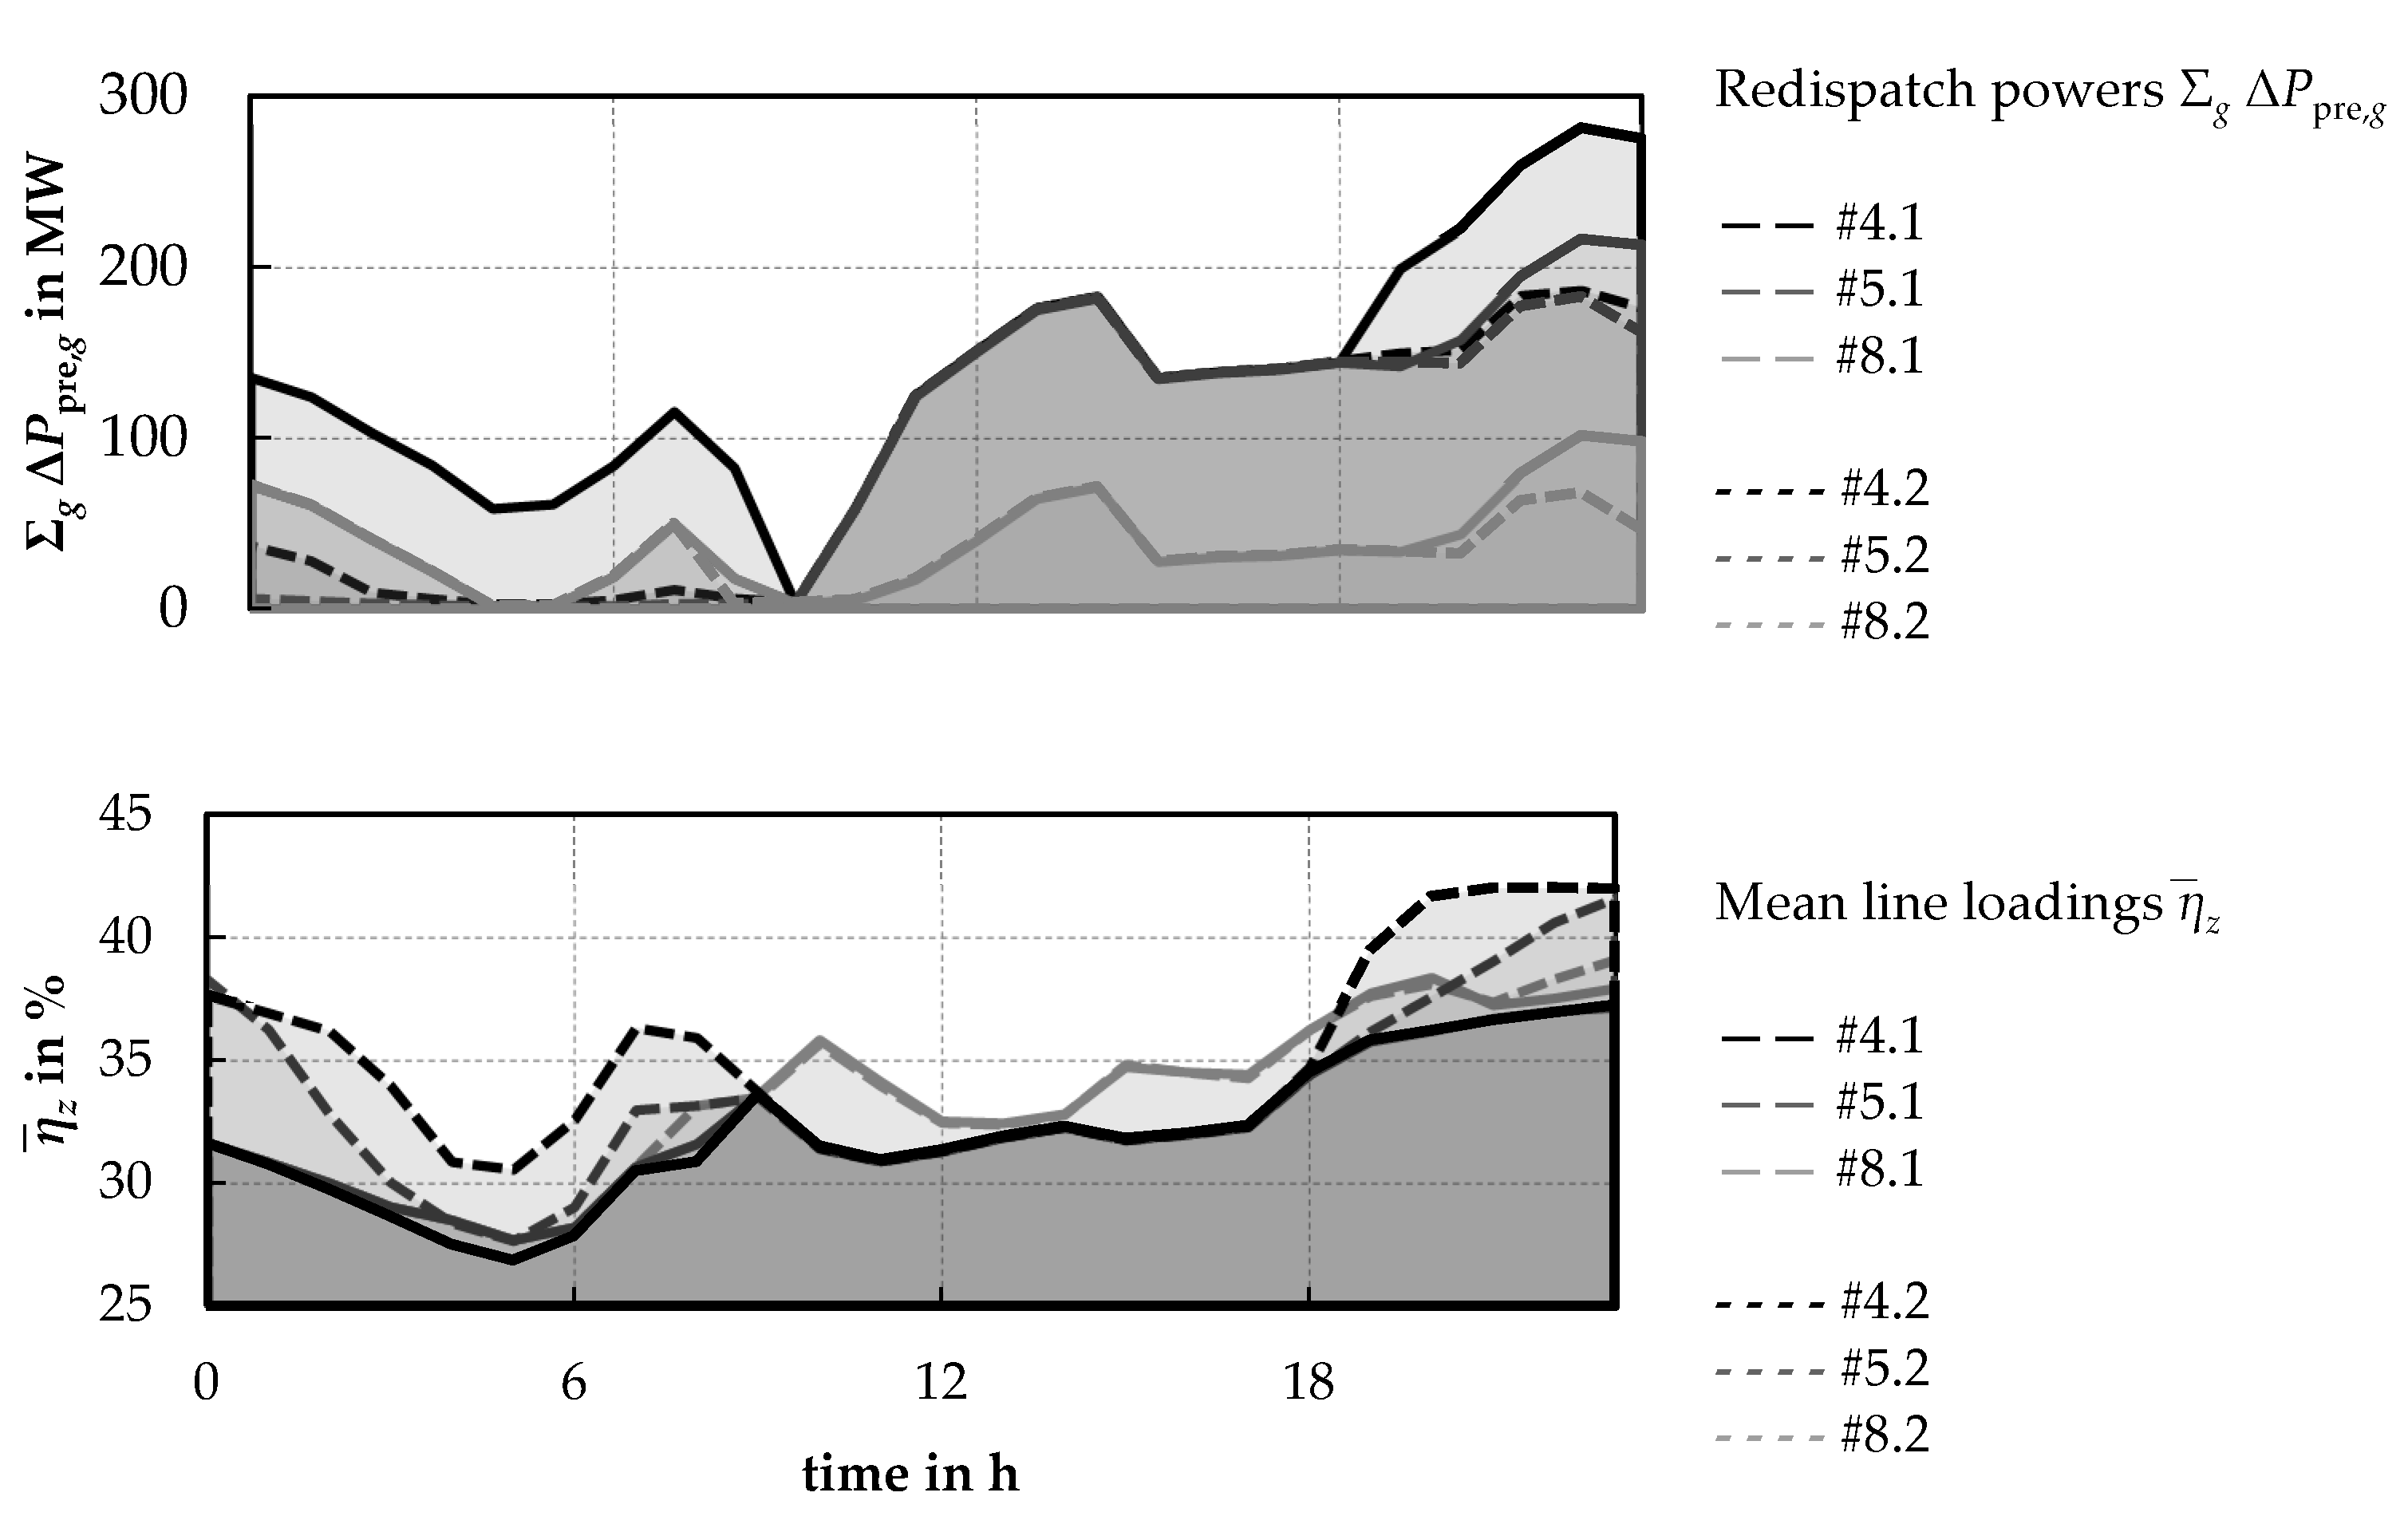
The simulations prove the general opportunities of power flow control measures by generation (in the form of changes in the operating point of generation units) and specific power flow control by dedicated resources in the context of congestion management. In summary, Figure 12, as an extract from Figure 10 and Figure 11, shows comparatively the preventive actions occurring over the time range considered, and the evolution of the average line load for the AC system in the N-0-case.
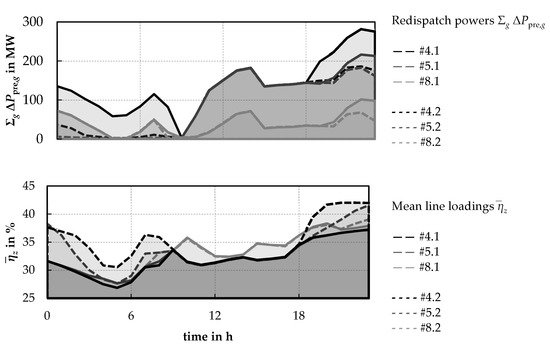
Figure 12.
Comparison of necessary preventive measures for N 1-security and mean line loadings in the corresponding N 0-case.
By using the curative measures, the preventive deployment in scenarios #5.1 and #8.1 can be slightly and significantly reduced, respectively, compared to the purely preventive reference scenario #4.1. Furthermore, curative measures are preferentially applied over preventive measures even with the simultaneous use of specific power flow control (in scenario #8.2). In this case, as the number of curative flexibilities made available increases, their use also increases.
Overall, however, the simultaneous use of power flow control by the SSSC reduces the amount of preventive and curative measures compared to the scenarios without additional power flow control. A direct comparison of scenarios #4.1 (no curative measures, no power flow control) and #8.2 (curative measures and power flow control) shows a reduction in the range of 75%. The values determined in the simulation qualitatively show the intended effect of the curative measures and the curative concept in conjunction with specific power flow control, but do not allow for drawing a direct conclusion about the quantitative effectiveness in any other system.
In the same way that preventive measures are replaced by curative measures, the transmission capability of the grid can be increased in the N-0-case through the use of curative measures and specific power flow control. Therefore, the actual transmission task, which results from the generation specified by the market and the consumer behaviour, is fulfilled in the best possible way. An indicator of the implementation of the specified transmission task can be obtained by comparing the line utilisation in the N-0-base case with the N-0-power flows, considering preventive and curative measures as well as explicit power flow control (Figure 12). Since the N-0-case includes the preventive measures to ensure N-1-security, a comparison of the average load factors can give an indication of the resulting transfer capability of the network after outage variant calculation. This possibility of higher utilisation is strongly dependent on the power flow situation as well as available flexibilities for its control. The comparison of the simulations illustrates the effect of the curative measures, which are only effective when a predefined failure variant actually occurs but allows a higher transfer capability in the N-0-case. Also, with regard to the increase of the transfer capability, the basic effectiveness can be proven by simulation.
In combination (depending on numerous other boundary conditions not considered here), the use of curative measures in conjunction with specific power flow control allow for the highest possible transfer capability in conjunction with minimal preventive measures while avoiding congestion. Similarly, when formulating the optimisation problem, undesired effects, such as operationally unfavourable power flow splitting or ring flows that arise, should be avoided, which is why appropriate formulations to avoid them should be part of the objective function. In the application for real systems, numerous dependencies arise, which were not considered in the context of the present simulations. These include, among others, questions concerning:
- the degree of permissible higher utilisation,
- further operational constraints on the generation plants (minimum generation capacities, constraints due to the primary energy supply (especially for renewable generation plants), reaction and change rates of the plants, communication, and accessibility, etc.),
- the permissible complexity of the decisions in terms of comprehensibility and implementability by the operator,
- regulatory boundary conditions for use in congestion management, and
- replacement measures for curative systems.
With respect to the presented modelling approaches and the basic formulation of the optimisation problem as non-linear problem, questions in terms of solvability for large-scale, real-world networks are still to be especially investigated in more detail. The work at hand with a combined AC/DC system already including 22 buses and a high number of flexibilities in terms of active and reactive power operating points for numerous assets tries to give a first indication that non-linear modelling approaches with a high number of flexibilities can also be realised and solved. A first analysis with a reduced set of flexibilities already shows that optimal power flow problems can also be solved in systems such as the overall German transmission system.
Separately, individual modelling aspects such as the integration of slack variables or the linear consideration of the displacement services by preventive and curative measures in the objective function as well as further scalability should be essential questions in further considerations.
Author Contributions
Conceptualisation, D.M. and L.H.; methodology, software, validation, D.M.; writing—original draft preparation, D.M.; writing—review and editing, D.M. and L.H.; visualisation, D.M.; supervision, L.H. All authors have read and agreed to the published version of the manuscript.
Funding
This research was supported by the German Federal Ministry of Economic Affairs and Climate Action within the framework of the projects “Innovationen in der Systemführung bis 2030 (InnoSys2030)” (FKZ: 0350036I) and “Kurative Systemführung im Verteilnetz (kurSyV)” (FKZ: 03EI6119A).
Data Availability Statement
The original contributions presented in the study are included in the article, further inquiries can be directed to the corresponding authors.
Conflicts of Interest
The authors declare no conflicts of interest.
References
- COMMISSION REGULATION (EU) 2017/1485 of 2 August 2017 Establishing a Guideline on Electricity Transmission System Operation: 2017/1485, in Official Journal of the European Union. 2021. Available online: https://eur-lex.europa.eu/legal-content/EN/TXT/PDF/?uri=CELEX:02017R1485-20210315&from=EN (accessed on 10 October 2021).
- 50Hertz Transmission GmbH, Amprion GmbH, TenneT TSO GmbH, TransnetBW GmbH, Grid Development Plan: Power. Available online: https://www.netzentwicklungsplan.de/en (accessed on 10 October 2021).
- Pillay, A.; Karthikeyan, S.P.; Kothari, D.P. Congestion management in power systems—A review. Int. J. Electr. Power Energy Syst. 2015, 70, 83–90. [Google Scholar] [CrossRef]
- Westermann, D.; Schlegel, S.; Sass, F.; Schwerdfeger, R.; Wasserrab, A.; Haeger, U.; Hachenberger, J. Curative actions in the power system operation to 2030. In Proceedings of the International ETG-Congress 2019, ETG Symposium, Magdeburg, Germany, 4–5 June 2019; pp. 1–6. [Google Scholar]
- Lindner, M.; Mende, D.; Wasserrab, A.; Saçar, I.; Ariatabar, M.; Lakenbrink, C.; Häger, U. Corrective Congestion Management in Transmission Grids Using Fast-Responding Generation, Load and Storage. In Proceedings of the 2021 IEEE Electrical Power and Energy Conference (EPEC), Virtual, 22–31 October 2021; pp. 1–6. [Google Scholar]
- Rostami, M.; Lotfifard, S. Optimal Remedial Actions in Power Systems Considering Wind Farm Grid Codes and UPFC. IEEE Trans. Ind. Inf. 2020, 16, 7264–7274. [Google Scholar] [CrossRef]
- Sennewald, T.; Linke, F.; Westermann, D. Preventive and Curative Actions by Meshed Bipolar HVDC-Overlay-Systems. IEEE Trans. Power Deliv. 2020, 35, 2928–2936. [Google Scholar] [CrossRef]
- Sass, F.; Sennewald, T.; Westermann, D. Automated Corrective Actions by VSC-HVDC-Systems: A Novel Remedial Action Scheme. IEEE Trans. Power Syst. 2020, 35, 385–394. [Google Scholar] [CrossRef]
- Hoffrichter, A.; Kollenda, K.; Schneider, M.; Puffer, R. Simulation of Curative Congestion Management in Large-Scale Transmission Grids. In Proceedings of the 2019 54th International Universities Power Engineering Conference (UPEC), Bucharest, Romania, 3–6 September 2019. Available online: https://ieeexplore.ieee.org/stamp/stamp.jsp?tp=&arnumber=8893627 (accessed on 5 April 2020).
- Gunda, J.; Harrison, G.P.; Djokic, S.Z. Remedial Actions for Security Constraint Management of Overstressed Power Systems. IEEE Trans. Power Syst. 2018, 33, 5183–5193. [Google Scholar] [CrossRef]
- Raab, A.; Mehlmann, G.; Schindler, J.; Luther, M.; Abel, M.; Horn, S.; Kubis, A. Security assessment for higher loaded power system operation to 2030. In Proceedings of the ETG Congress, Online, 18–19 March 2021; Volume 2021, pp. 142–147. [Google Scholar]
- Sennewald, T.; Brosinsky, C.; Schlegel, S.; Westermann, D.; Wiest, P.; Krebs, R. Closed Loop Assessment of Curative Actions in a Power System Control Center Demonstrator. In Proceedings of the ETG Congress, Online, 18–19 March 2021; Volume 2021, pp. 465–470. [Google Scholar]
- Fourer, R.; Gay, D.M.; Kernighan, B.W. AMPL: A Modeling Language for Mathematical Programming, 2nd ed.; Brooks/Cole: Belmont, CA, USA, 2009. [Google Scholar]
- Stock, D.S. Entwicklung eines Flexiblen Optimierungswerkzeuges zur Nichtlinearen Mathematischen Mehrzieloptimierung in der Netzführung und Netzplanung; Fraunhofer-Verlag: Stuttgart, Germany, 2020; Also: Ph.D. Thesis, Leibniz University Hanover, Hanover, Germany, 2019. [Google Scholar] [CrossRef]
- Mende, D.; Stock, D.S.; Hofmann, L. Implementation, Verification and Application Examples of a Mathematical Optimization for Grid Operation in Mixed AC/DC-Systems. In Proceedings of the Cigré International Symposium Aalborg, Aalborg, Denmark, 4–7 June 2019. Available online: https://e-cigre.org/publication/SYMP_AAL_2019-symposium-aalborg-2019 (accessed on 21 March 2024).
- Mende, D.; Stock, D.S.; Hofmann, L. Superposition-based Modelling of Series FACTS in Nonlinear Mathematical Optimized Grid Operation. In Proceedings of the 2020 IEEE PES Innovative Smart Grid Technologies Europe (ISGT-Europe), The Hague, The Netherlands, 26–28 October 2020; pp. 359–363. [Google Scholar]
- Mende, D. Modellierung von Maßnahmen der Leistungsflusssteuerung in einer Nichtlinearen Mathematischen Optimierung zur Anwendung im Operativen Engpassmanagement Elektrischer Energieversorgungssysteme; Fraunhofer-Verlag: Stuttgart, Germany, 2022; Also: Ph.D. Thesis, Leibniz University Hanover, Hanover, Germany, 2021. [Google Scholar] [CrossRef]
- Zhang, X.-P.; Rehtanz, C.; Pal, B. Flexible AC Transmission Systems: Modelling and Control; Springer: Berlin/Heidelberg, Germany, 2012. [Google Scholar]
- Lukaschik, A.; Wasserrab, A.; Sacar, I.; Abel, M.; Horn, S.; Askan, H.; Ferdowsi, M. Innovationen in der Systemführung bis 2030: Abschlussbericht. Erstellt durch die Projektpartner. 2022. Available online: https://www.innosys2030.de/wp-content/uploads/InnoSys2030_Abschlussbericht.pdf (accessed on 4 January 2023).
- van Leeuwen, T.; Meinerzhagen, A.-K.; Roehder, A.; Raths, S. Integration Kurativer Maßnahmen in das Engpassmanagement im Deutschen Übertragungsnetz. 16. Symposium Energieinnovation. 2020. Available online: https://www.tugraz.at/fileadmin/user_upload/tugrazExternal/4778f047-2e50-4e9e-b72d-e5af373f95a4/files/kf/Session_C6/365_KF_vanLeeuwen.pdf (accessed on 21 March 2024).
Disclaimer/Publisher’s Note: The statements, opinions and data contained in all publications are solely those of the individual author(s) and contributor(s) and not of MDPI and/or the editor(s). MDPI and/or the editor(s) disclaim responsibility for any injury to people or property resulting from any ideas, methods, instructions or products referred to in the content. |
© 2024 by the authors. Licensee MDPI, Basel, Switzerland. This article is an open access article distributed under the terms and conditions of the Creative Commons Attribution (CC BY) license (https://creativecommons.org/licenses/by/4.0/).

