Article

Carbon Footprint of Electricity Produced in the Russian Federation

by
Ekaterina Shirinkina
,
Yuliya Mozzhegorova
*,
Galina Ilinykh
and
Vladimir Korotaev
Environmental Protection Department, Perm National Research Polytechnic University, 614000 Perm, Russia
*
Author to whom correspondence should be addressed.
Energies 2025, 18(1), 14; https://doi.org/10.3390/en18010014
Submission received: 5 December 2024 / Revised: 16 December 2024 / Accepted: 19 December 2024 / Published: 24 December 2024
(This article belongs to the Section B: Energy and Environment)

Abstract

:
Energy generation makes a significant contribution to greenhouse gas emission. The carbon footprint of electricity significantly affects the total carbon footprint of a wide variety of products, which is especially relevant for energy-intensive industries (aluminum, platinum, carbon fiber-reinforced plastics, etc.) and hydrogen energy. The carbon footprint of aluminum, produced in Russia is 8.0–15.0 kg CO2-eq./kg. It is lower than the actual carbon footprint of aluminum produced in other countries due to the lower carbon intensity of Russian grid electricity in comparison with the world average. The carbon footprint of hydrogen, produced by photovoltaic modules with electricity consumption from the Russian national electricity grid is 16.6 kg CO2-eq./kg, while the world average carbon footprint of photovoltaic hydrogen is 18.1 kg CO2-eq./kg. The average carbon footprint of electricity generated and consumed in Russia ranges from 310 to 634 g CO2-eq./kWh. This paper analyzes methodological approaches to determining grid emission factors for Russian electricity. It has been established that different principles of spatial division of the Russian energy system can be used to determine grid emission factors (national average grid emission factor, grid emission factors for the integrated energy system, grid emission factors for price and non-price zones of the wholesale electricity market).

1. Introduction

Ensuring carbon neutrality while maintaining sustainable economic growth is the main idea behind the Strategy for the Russian Federation’s socio-economic development with low greenhouse gas emissions until 2050 [1]. In accordance with Decree of the President of the Russian Federation, No. 666 of 4 November 2020, by 2030, greenhouse gas emissions must be reduced to 70%, relative to the 1990 level [2].
The Russian Federation accounts for 7% of global carbon dioxide emissions. At the same time, the energy sector makes the largest contribution to the total greenhouse gas emissions in the Russian Federation [3,4]. In 1990, the contribution of the energy sector to the total anthropogenic greenhouse gas emissions (excluding the Land Use, Land-Use Change, and Forestry sectors), expressed in CO2 equivalent, was 81.5%, and in 2020, it was 77.9% [5].
Data on the carbon intensity of the Russian energy sector are currently published in reports by international organizations and analytical centers; additionally, such data are contained in various scientific publications, reviews, and reports [6,7,8,9,10,11,12,13,14,15,16]. The data were obtained at different periods of time, based on different methodological approaches using data from different sources, which should be taken into account when using certain numerical values when determining the carbon footprint of electricity.
It is also important to consider that carbon footprint depends on the method of energy generation and varies significantly across regions of the world depending on the prevailing technologies [17,18,19,20,21,22]. In Norway, around 90% of all electricity produced comes from hydropower [23,24], with an average national carbon footprint of 18 g CO2-eq./kWh as of 2023 [25]. The main source of electricity production in China is coal-fired thermal power plants (more than 62%) [26], so on average, electricity in China has a fairly high carbon footprint 582 g CO2-eq./kWh in 2023 [27,28].
When determining greenhouse gas emissions from electricity production and consumption, a significant task is to take into account the spatial structure of the country’s energy system for a higher accuracy of estimation.
In countries with a small territory, the spatial generation structure is simpler than in large ones [29]. For example, in some countries with a relatively small area (Iceland, Costa Rica), the entire energy system can be taken as a single one with common characteristics [30].
The energy systems of large countries such as the United States, China, and Russia have different spatial structures in their different regions. In order to improve the accuracy of calculations, the grid emission factors should be determined not for the entire energy system but for its separate parts, since each territorial unit has its own generation specificity. So, the US energy system is divided into three major regions: the Eastern Interconnection, which operates in the states east of the Rocky Mountains; the Western Interconnection, which covers the Pacific Ocean to the Rocky Mountain states; and the Texas Interconnected system [31].
In the United States, the carbon footprint of electricity is determined using factors that are calculated at the level of individual eGRID subregions. eGRID emission factors take into account the greenhouse gas emissions directly produced by generation facilities but do not include imports/exports of electricity to a definite state or any other group of plants. They also do not take into account energy losses during transmission and distribution between generation points and consumption points, or electricity purchases. In addition, eGRID does not take into account any pre-combustion emissions associated with the extraction, processing, and transportation of fuels and other materials used in plants, or any emissions associated with the construction of plants [32,33,34,35,36].
China operates on two wide area synchronous grids: the State Grid in the North and the China Southern Power Grid in the South [37]. In China, each subnational grid is composed of several provinces’ grids. Transfers of electricity among regions also take place [38].
The Russian energy system also has a complex structure, since individual integrated energy systems and regions have their own characteristics of electricity generation, which is important to take into account when determining the carbon footprint of electricity.
The carbon footprint of electricity has a significant impact on the carbon footprint of products that use electrical energy in their production. In the context of the need to address the problem of global climate change and tightening environmental legislation and the legislative regulation of greenhouse gas emissions, determining the carbon footprint of products is an important tool for managing climate risks. Calculating the carbon footprint allows organizations to report on greenhouse gas emissions as part of climate regulation, assess their environmental burden, identify activities and processes in which greenhouse gas emissions can be reduced, and develop measures to reduce the negative impact on the climate system.
Hydrogen is currently a promising energy resource for industrial decarbonization. However, most of the hydrogen currently produced is considered as «grey» because its production is accompanied by a significant consumption of electricity obtained from fossil fuels (e.g., steam methane reforming and coal gasification) and leads to additional CO2 emissions [39]. Thus, for the use of hydrogen in the energy sector to be promising, it is necessary to use low-carbon sources of electricity for hydrogen production.
Nowadays, mechanisms of economic responsibility for greenhouse gas emissions are being introduced (quotas for exceeding greenhouse gas emission standards, greenhouse gas emissions trading). Therefore, assessing the carbon footprint and effectively using mechanisms to reduce it will allow organizations to mitigate economic risks (fines, reduced sales of products, etc.) along with reputational risks (image, competitiveness of products).
Accounting for the carbon footprint of electricity is especially important in the production of energy-intensive materials and goods, such as aluminum, platinum, and other metals, and carbon fiber-reinforced plastics, etc. [40,41,42,43,44].
For example, in the production of aluminum at the Krasnoyarsk Aluminum Plant RUSAL (Russia), their own generating capacities (hydroelectric power plants) are used [45], so in this case, assessing the carbon footprint of their products does not present significant methodological difficulties. However, for most other product manufacturing, external electricity is used from the general network or from third-party suppliers. In this regard, there is a need to obtain adequate data on the carbon footprint of the electricity used. In practice, difficulties often arise with justifying the carbon footprint of the electricity used in product manufacturing due to a lack of data that would be approved or recommended by government authorities.
To assess the carbon footprint of electricity, the market or regional method can be used [46]. The market method is applicable only in those regions where markets for «green» contractual instruments have been formed, which allow consumers to choose electricity differentiated by origin.
Organizations mainly use electricity from public grids. In this case, the carbon footprint should be calculated using regional grid emission factors calculated by the organization on the basis of statistical data on fuel consumption and on the volumes of electricity and heat supplied from all external generating facilities located in the regional energy system of the constituent entity of the Russian Federation. However, the mechanism for calculating regional grid emission factors is not transparent enough, and the data presented in open sources have varying degrees of validity and often contradict each other. This creates difficulties in determining indirect energy emissions for organizations. Thus, a relevant task is the comparative analysis of greenhouse gas emission factors and approaches to establishing them in order to justify the use of the most adequate (legitimate) data for calculating the carbon footprint of consumed electricity.
This article presents an overview of the approaches used to assess carbon footprint, the available data on the carbon footprint of electricity produced in the Russian Federation, and their comparative analysis; identifies problems with the quality of the data and the calculations behind greenhouse gas emission factors; and provides recommendations for substantiating methodological approaches to assessing the carbon footprint of electricity in manufacturing products and for the use of certain data.
Since the energy complex of the Russian Federation is not uniform and has a complex territorial structure, when determining the carbon footprint of electricity, it is important to take into account the peculiarities of the electric power industry functioning both at the level of the state (at the level of the Unified Energy System of Russia) and at the level of integrated energy systems or at the level of a single region.

2. Materials and Methods

This research involved collecting and systematizing information on the structures and features of electric power generation in the Russian Federation at different levels, from the Unified Energy System (UES) to the integrated energy systems that are part of the UES. In addition, the features of generation in individual regions (using the Perm region as an example) and at separate enterprises were analyzed. The considered structure of electric power generation in the Russian Federation is presented in Figure 1.
Comparison of the generation structure at the level of the Unified Energy System of Russia, the Ural integrated energy system, the energy system of the Perm region, and individual generating capacities (electricity sources of large enterprises, thermal power plants, small and medium-sized generation facilities, etc.) is carried out in order to establish differences in the technologies used in electricity generation and the types of fuel combusted. The generation structure, the amount and type of fossil fuel consumed to generate electricity, ultimately determine its carbon intensity. Therefore, when determining the electricity carbon footprint, it is important to take into account the generation feature characteristics of different territories of the Russian Federation.
For a comparative analysis of existing methodological approaches to assessing the electricity carbon footprint, information from open sources publishing grid emission factors for the Russian Federation was collected and systematized.
The possibility and feasibility of using the data on grid emission factors was assessed on the basis of environmental legislation requirements and the features of generation structures in different territories of Russia.

3. Results

3.1. Structure and Features of the Russian Energy System

The Unified Energy System (UES) operates in the territory of the Russian Federation, representing one of the largest and most unique energy system associations in the world energy sector in terms of its quantitative and qualitative characteristics. The UES was created through the step-by-step unification and organization of parallel operations of regional energy systems, and the creation of interregional integrated energy systems. The UES of Russia consists of seven integrated energy systems: the East, Siberia, the Urals, the Middle Volga, the South, the Center, and the North-West, which are further divided into 75 regional energy systems. In addition to the UES, the Energy Complex of Russia includes five technologically isolated territorial energy systems (TITES) of the Kamchatka region, the Magadan and Sakhalin regions, the Chukotka Autonomous okrug, as well as the Norilsk-Taimyr technologically isolated energy system in the Krasnoyarsk Region [47]. Furthermore, the UES of Russia is conditionally divided into two synchronous zones. The first synchronous zone includes all the Unified Energy Systems, except for the integrated energy system of the East. The second synchronous zone includes the integrated energy system of the East, which operates in isolation from the first synchronous zone [48]. Centralized operational dispatch control of the technological regime of the UES of Russia on the territory of the constituent entities of the Russian Federation is carried out by JSC «System Operator of the Unified Energy System».
Electricity generation in Russia fully meets the domestic needs of consumers. In Russia, electricity generation in 2023 amounted to 1134.0 billion kWh, and consumption was 1121.6 billion kWh [49]. Industry (raw material mining and processing) is the main consumer of electricity in Russia, accounting for about 50% of electricity consumption. The population accounts for about 15% of electricity consumption [50].
As of 1 January 2024, the total installed capacity of power plants of the UES of Russia amounted to 248 164.88 MW, of which, thermal power plants accounted for 65.98%, hydroelectric power plants—20.24%, nuclear power plants—11.9%, wind power plants—1.01%), and solar power plants—0.87% [51]. The main fuel used at power facilities in Russia is natural gas. It accounts for about 71% of all fuel consumption in the electric power industry. At the generation facilities of the second synchronous zone, coal is predominantly used (up to 60% of consumption), which is due to a lower level of gasification. A comparative characteristic of the generation structure of the UES of Russia as a whole and individual IESs at the beginning of 2024 is presented in Table 1 [52].
One can see from the presented data that thermal power plants prevail in the generation structure of all integrated power systems; however, the integrated power system of Siberia, the integrated power system of the East, and the TITES are characterized by a relatively high share of hydroelectric power plants, since the largest hydroelectric power plants in Russia are located in Siberia (the Sayano-Shushenskaya, Krasnoyarsk, and Bratskaya power plants) [53]. The share of hydroelectric power plants in the generation structure of thermal power plants is high, while the main type of fuel for the production of electricity in isolated power systems is diesel fuel [54], which is used in low-power diesel units, which results in low efficiency rates of electricity supply and high costs of electricity production. The TITES is characterized by complex logistics of fuel delivery with limited timeframes for seasonal delivery to hard-to-reach areas [55].
There are no nuclear power facilities in the IES of Siberia and the IES of the East; the largest share of nuclear power plant generation is typical for the IES of the Center (27.3%), and the IES of the North-West (24.4%). Nuclear power plants in Russia are considered promising sources of generation in terms of ensuring low-carbon development of the economy, along with hydroelectric power plants. At the same time, in Europe, the question of recognizing nuclear power plants as a «sustainable» source of energy remains open [56].
The share of renewable energy sources in Russia is quite low, and their territorial distribution is extremely uneven. Most renewable energy sources are located in the IES of the South, since the South of Russia and the North Caucasus have a high level of insolation and acceptable wind loads for the development of wind energy.
According to the forecast presented in the Scheme and Program for the development of electric power systems of Russia for 2024–2029 [57], energy consumption is expected to grow. There are plans to commission additional power units at the Kursk nuclear power plant, and to build a wind power plant and a solar power plant.

3.2. Structure and Features of the IES of the Urals

The IES of the Urals is located in the territory of the Ural and Volga Federal Districts; the IES of the Urals includes 11 regions of the Russian Federation: the Republic of Bashkortostan, the Udmurt Republic, the Khanty-Mansi and Yamalo-Nenets Autonomous Okrugs, the Perm, Kirov, Orenburg, Sverdlovsk, Kurgan, Tyumen, and Chelyabinsk Regions.
The total installed capacity of power plants of the IES of the Urals, as of the beginning of 2024, is 53,318 MW. The IES of the Urals is characterized by the highest energy consumption among the other IES. According to data for 2023, electricity consumption in the IES of the Urals amounted to 260.8 billion kWh (23% of the total electricity consumption in the UES of Russia). The generation structure of the IES of the Urals includes thermal power plants (92.68%), hydroelectric power stations (3.64%), nuclear power plants (2.79%), and renewable energy sources (0.89%) [52].
The largest generating facilities in the structure of the IES of the Urals are the Surgut state district power plants (SDPP)—1 and 2, the Reftinskaya State District Power Plant (SDPP), the Perm SDPP, etc. [58]. The Beloyarsk NPP, located in the city of Zarechny (Sverdlovsk Region), operates as part of IES of the Urals and its capacity is being expanded [59].
Solar power plants are located in the Orenburg region. Also in 2024, measures were taken to put the Artinskaya and Chekmashskaya solar power plants into operation. The Artinsky district of the Sverdlovsk region is characterized by a greater number of sunny days per year than other territories of the region. With the introduction of two new solar power plants in the Sverdlovsk region, the total installed capacity of all solar power plants in the Ural IES reached 515 MW. There is the wind power plant «Tyupkildy» (Republic of Bashkortostan) operating in the IES of the Urals [60].

3.3. Structure and Features of the Perm Region Energy System

The energy system of the Perm region is one of the largest and most developed energy systems of the constituent entities of the Russian Federation and is part of the IES of the Urals. The total installed capacity of the generating equipment of the power plants of the Perm region at the beginning of 2022 was 7797.5 MW. The main energy hubs of the electric power system of the Perm region are the Permsko-Zakamsky, the Bereznikovsko-Solikamsky, the Kizelovsko-Chusovskoy, the Kungursky, and the Yuzhny energy hubs [61].
All the thermal power plants in the Perm region use natural gas as their main fuel. The growth potential of the large hydropower sector in the region has been exhausted. Water resources allow only for the development of a small hydropower sector.
The energy system of the Perm region is an energy surplus one. In 2021, 26,501.3 million kWh of electric energy were generated in the Perm region, of which, 3214 million kWh (12.1%) were transmitted to neighboring regions. The energy system of the Perm region is connected to the energy systems of the Kirov Region, Sverdlovsk Region, Udmurt Republic, and the Republic of Bashkortostan [62]. Electricity consumption in the Perm region in 2021 amounted to 25,745 million kWh [50].
A distinctive feature of the energy sector of the Perm region is its relatively high share of hydroelectric power plants (21.3%) [62] and the absence of nuclear power plants. In general, the Perm region, as well as Russia and the world, is characterized by a high share of thermal power plants in the generation structure. Compared with the global indicator, energy generation in Russia is characterized by a lower level of renewable energy sources [52].
Since 2017, most enterprises in the Perm region have conducted energy audits, developed energy saving programs, introduced automated energy consumption metering systems, new energy saving technologies and equipment, and are building their own energy sources.
To reduce the energy intensity of production in the economy at the current level of energy prices, it is advisable to focus on domestic energy sources [61].

3.4. Generating Capacities of the Companies

The creation of their own generating facilities by Russian industrial enterprises is primarily associated with the need to reduce energy costs. Examples of projects to create their own generating capacities of some companies in the Perm region are presented in Table 2.
The companies in the Perm region, on the one hand, invest in newly created facilities of their own generation (PJSC «LUKOIL», JSC «SIBUR-Khimprom»; PJSC «Uralkali»), on the other hand, purchase and then reconstruct previously created facilities (JSC «Solikamskbumprom»).
The goal of creating their own generating capacities is to ensure the stability and reliability of technological equipment operation and reduce energy costs. Individual generation facilities often have a higher efficiency and are located in close proximity to energy-consuming devices, and this eliminates the construction of expensive heating networks and power lines. Thus, the costs of transporting energy over long distances are eliminated. Additionally, individual generation facilities enable companies to reduce the carbon footprint of their products.

3.5. «Green» Certificates

Purchasing «green» energy from renewable energy sources is possible using the «green» certificates tool (certificates of energy origin). With the help of such certificates, electricity consumers acquire rights to positive environmental and social effects from electricity production using renewable energy sources. Purchasing and redeeming «green» certificates allows energy consumers to apply green labeling to their products and declare reduction in the carbon footprint of their products. By selling green certificates, generating companies can invest in the construction of new renewable energy production facilities [69,70].
The system of «green» certificates in Russia is at the implementation stage. On 1 February 2024, Federal Law No. 489 of 4 August 2023 “On Amendments to the Federal Law «On Electric Power Industry» [71] came into force, aimed at creating the Russian certification system for low-carbon electricity sources.
Carbon Zero LLC maintains a register of Intergovernmental Panel on Climate Change (IPCC) certificates, in which it records all transactions, including transfer and redemption, in relation to each certificate. The register of certificates is maintained electronically [69].
According to the data [72], the subsidiaries of the PJSC EL5-Energo, the «Azovskaya VES» LLC and the «Kolskaya VES» LLC, have concluded contracts for the sale and purchase of green certificates with the «LUKOIL-ENERGOSETI» LLC based on the fact of electricity production from renewable energy sources. The Azov and Kolsky wind farms of PJSC «EL5-Energo» were registered in February 2024 in the register of qualified generating facilities operating on the basis of renewable energy sources.
Thus, the system of «green» contractual tools in Russia is at the implementation stage. In connection with the tightening of carbon regulation, an increase in the number of companies acquiring the attributes of low-carbon generation should be expected.

3.6. Existing Approaches to Assessing Greenhouse Gas Emissions of Electricity Production

Greenhouse gas emissions of electricity production are estimated on the basis of the recommendations of international standards and methodologies. International standards contain general requirements and approaches to calculating emissions. Methodologies are based on the requirements of the standards and contain a calculation algorithm, necessary formulas and requirements for the initial data. Table S1 presents existing approaches to estimating greenhouse gas emissions from electricity production.
In accordance with the IPCC Guidelines for National Greenhouse Gas Inventories [73,74], the calculation can be made at three tiers.
The tier 1 approach is based on calculations for each source category and fuel. The IPCC emission factors for carbon dioxide in kg CO2-eq./TJ reflect the carbon content of the fuel and the assumption that the carbon oxidation factor is one. These factors depend only on the type of fuel combusted; their value does not depend on the industry where the combustion takes place. Thus, for crude oil, the emission factor is 73,300 kg CO2-eq./TJ for both crude oil combustion in the power industry and its combustion in industrial processes. The factors for methane and nitrous oxide have different numerical values for different source categories, since they depend on the combustion technology used at the source.
The tier 2 approach involves estimating emissions based on country-specific emission factors. Th tier 3 approach involves splitting the fuel combustion statistics over the different possibilities and using emission factors that are dependent upon these differences.At this tier, when calculating the country-specific emission factor, the possibility of taking into account the emissions of greenhouse gases other than carbon dioxide is indicated, data on emissions that can also be obtained through plant-specific data on emissions. However, these factors can only be used to calculate direct emissions from fuel combustion at a generation facility and cannot estimate indirect emissions from electricity consumption.
On the basis of the IPCC Guidelines, the National Inventory Report [75] developed emission factors for fuel types that reflect the total carbon content minus unoxidized carbon that passes into ash, soot, and particulate matter.
The IPCC Guidelines formed the basis for determining the carbon intensity of the Russian energy sector in a number of other sources [7,8,9], for example, data on IPCC factors for types of fuel were used in the research of Saneev et al. [7] and Brander et al. [9]. The methodology used in Russia for the quantitative determination of volumes of greenhouse gas emissions and greenhouse gas absorption [76] also contains emission factors for different types of combusted fuel in the electricity generation from the IPCC Guidelines and the National Inventory [75].
The GHG Protocol [46] and ISO 14064-1:2018 [77] provide requirements for organizations to determine greenhouse gas emissions from the generated electricity that they consumed. In accordance with the recommendations of these standards, grid emission factors do not take into account the stage of fuel production and the construction of power plants. The GHG Protocol provides for the accounting of electricity flows across regional boundaries.
The recommendations given in these standards have found their application in the Guidelines for the quantitative determination of the volume of indirect energy greenhouse gas emissions [78]. In addition, the principles of accounting for indirect greenhouse gas emissions are contained in GOST R ISO 140641-2021 [79]. In accordance with the Methodological Guidelines, organizations themselves determine emission factors using a regional or market approach. Regional grid emission factors are calculated by an organization using statistical data on fuel consumption and on the quantity of supplied electric power from all external generating objects located in the regional energy system of the constituent entity of the Russian Federation in which the organization consuming this electric power is located. The calculations also take into account the volumes of power supply and fuel consumption from neighboring regional energy systems for the reporting period.
In the case of an organization consuming electric energy on the basis of bilateral contracts and sale agreements, a market approach for the quantitative assessment of indirect energy emissions is provided.
The calculation of grid emission factors for the energy system of the Russian Federation in the context of individual constituent entities is carried out by HPB Solution LLC. To date, the company has patented regional emission factors for 85 subjects of the Russian Federation. The database contains calculation blocks for determining regional emission factors with the calculation methodology, an archive of initial data used for calculations, a summary table with the calculation results for all constituent entities, and a list of assumptions. The emission factors are intended for calculating indirect greenhouse gas emissions at the corporate level, and assessing the life cycle of products. The database is provided by HPB Solution LLC on a commercial basis [80].
Regional energy emission factors for the Russian Federation are published by the Carbon Footprint Ltd. [14] taking into account the generation structure and quantitative data on the types of fuel combusted. The Carbon Footprint Ltd. data include information on the GHG emission factors for electricity generation in the Russian Federation, the emission factors for the transmission and distribution of electricity (emissions that occur when delivering electricity from power plants to end consumers due to electricity losses in the transmission and distribution network), and factors for the extraction, refining, and transportation of fuel before its use in the power plant.
Emission factors for the Russian Federation are also published by a number of foreign sources. The International Energy Agency (IEA) develops GHG emission factors from electricity generation taking into account electricity trade with neighboring countries and taking into account losses during the transmission and distribution of electricity [13]. In accordance with the IEA methodology, factors for electricity generation, factors for the cogeneration of thermal and electrical energy, factors taking into account losses during its transportation and distribution, etc., are calculated. The factors developed by the IEA are provided to users on a commercial basis.
The United Nations Framework Convention on Climate Change (UNFCCC) methodology is designed to calculate the reduction in emissions from electricity generation during the implementation of Clean Development Mechanism (CDM) projects. Based on the methodological approaches of the UNFCCC, carbon emission factors were determined by Lahmeyer International in cooperation with the European Bank for Reconstruction and Development. The carbon emission factors were determined for the period from 2009 to 2020 based on an analysis of data on electricity generation and transmission in the energy system, and on an analysis of electricity demand. The carbon emission factors were determined for the period up to 2020 based on the creation of a Power System Simulation Model [15].
A similar approach is used by the IFI Technical Working Group (IFITWG) [5]. Their methodology [81] takes into account electricity generation without the interconnections of the country’s energy system with the energy systems of other countries. The methodology involves dividing energy sources into power plants of the Operating margin and the Build margin. The power plants of the Operating margin include plants with the highest operating costs, operating from fossil energy sources. The Build margin power plants are newly introduced power plants, the construction and operation of which may be affected by a renewable energy project, based on an assessment of planned and expected new generating capacities. When determining the Combined Margin Emission Factor, the Operating margin and the Build margin were taken into account, and the weighting ratios specified in the relevant industry documents were observed.
The emission factors for 2020 calculated in the research of the European Bank for Reconstruction and Development are currently given in the PNST 646-2022, the preliminary national standard of the Russian Federation’s «green» standards, «green» products, and «green» technologies, including the methodology for assessing the reductions in carbon footprint [82]. The standard was developed due to the need for an effective and visual tool for assessing the impact of «green» technologies and «green» products on the reduction of greenhouse gas emissions during their production and use. The methodology takes into account both direct and indirect greenhouse gas emissions excluding emissions from the combustion of biogas, biomass, and its processed products, losses associated with fuel distribution, or emissions in emergency situations.
Since 1 September 2021, the Association «NP Market Council» together with the JSC «TSA» launched a pilot project to calculate and publish grid emission factors. Within the framework of this project, the Concept for Calculating and Publicating Emission Factors of the Russian Power System was developed [79]. When developing the concept, the authors were guided by the requirements of the GHG Protocol and ISO 14064-1:2018 standards, as well as international methodologies of the IEA, CDM, and AIB. The authors of the Concept defined the boundaries for aggregation into subregions at the level of price and non-price zones of the wholesale electricity and capacity market, as well as at the level of isolated systems initially formed on the principle of the absence or presence of a minimal flow of electricity between these parts of the power system [8].
The publication of grid emission factors developed on the basis of the Concept [83] was carried out based on the resources of the JSC «TSA» for informational purposes [12]. These resources present the actual grid emission factors of the energy system. Their calculation is carried out annually on the basis of actual data on the functioning of electric power facilities over the past year, and the publication is in April of the year following the reporting year.
Actual values can be used to assess the carbon footprint of organizations and to form non-financial reports, while planned emission factors can be used for informational and analytical purposes. The Association «NP Market Council» and the JSC «TSA» take into account the actual volumes of electricity export/import, as well as existing electricity flows between price and non-price zones.
The Ecoinvent database contains energy emission factors according to generation facility types for the Russian Federation [84]. The database contains over 20,000 life cycle inventory datasets, not only in the energy sector. The carbon footprint of electricity production in the Ecoinvent database is determined on the basis of average electricity production conditions in Russia, rather than on the data for the production of a specific company or territory. Data on specific emissions per unit of electricity generation are differentiated according to generation types (coal, oil, natural gas, nuclear power plants, hydroelectric power plants, renewable energy sources). Average market data are also provided, taking into account the transmission of electricity between energy systems and the transmission of electricity from the distribution station to the consumer, taking into account the additional carbon footprint of the transformation and distribution of electricity through networks.
Most methodological approaches to determining energy system emission factors (with the exception of Ecoinvent) only take into account emissions from fuel combustion. Thus, the carbon footprint of renewable energy sources, hydroelectric power plants, and nuclear power plants is assumed to be zero.
There are no unified approved energy emission factors at the level of the entire country or individual regions in the Russian Federation. In accordance with the letter published by the Ministry of Energy of Russia on 23 January 2020, No. MU-644/09, currently not a single federal executive body is vested with the authority to approve grid emission factors for all regional and integrated energy systems, as well as greenhouse gas emission factors for all types of thermal coal, fuel oil, and natural gas used in Russia [85].
Independent calculations of grid emission factors is complicated by the lack of necessary data in the public domain, for example, data on the amount and types of fuel consumed in the energy system. Therefore, for emission calculations, they resort to using grid emission factors published in the public domain.
In the case of energy consumption under bilateral contracts and sale agreements (e.g., from small-scale generation facilities), greenhouse gas emissions are determined using the market approach. In this case, grid emission factors are contained in contracts and sale agreements or in certificates of electricity origin («green» certificates). If, along with electricity received under bilateral contracts, additional electricity is consumed (in excess of the volumes specified in the agreement), then energy emissions from this amount of electricity are determined using the residual emission factor. At the moment, residual emission factors are not determined for the Russian Federation, probably due to the fact that the system of «green» certificates is only just emerging. Therefore, the regional grid emission factor can be used for uncertified residual emissions.
Thus, at present, there are many sources of data on grid emission factors, the calculation of which is carried out with varying degrees of detail, using different methodological approaches in determining the boundaries of the life cycle of electricity generation and different sources of initial data. Grid emission factors are published in the resources of international organizations, the reports of analytical centers, and scientific publications. The determination of factors for conditionally balanced zones with minimal flows is carried out by the NP «Market Council» together with the JSC «TSA». Factors are published in the public domain for information purposes in accordance with the developed Concept. The Concept has passed validation, and, at this stage, the actual values of the factors can be used to assess the carbon footprint of electricity and the formation of climate reporting.

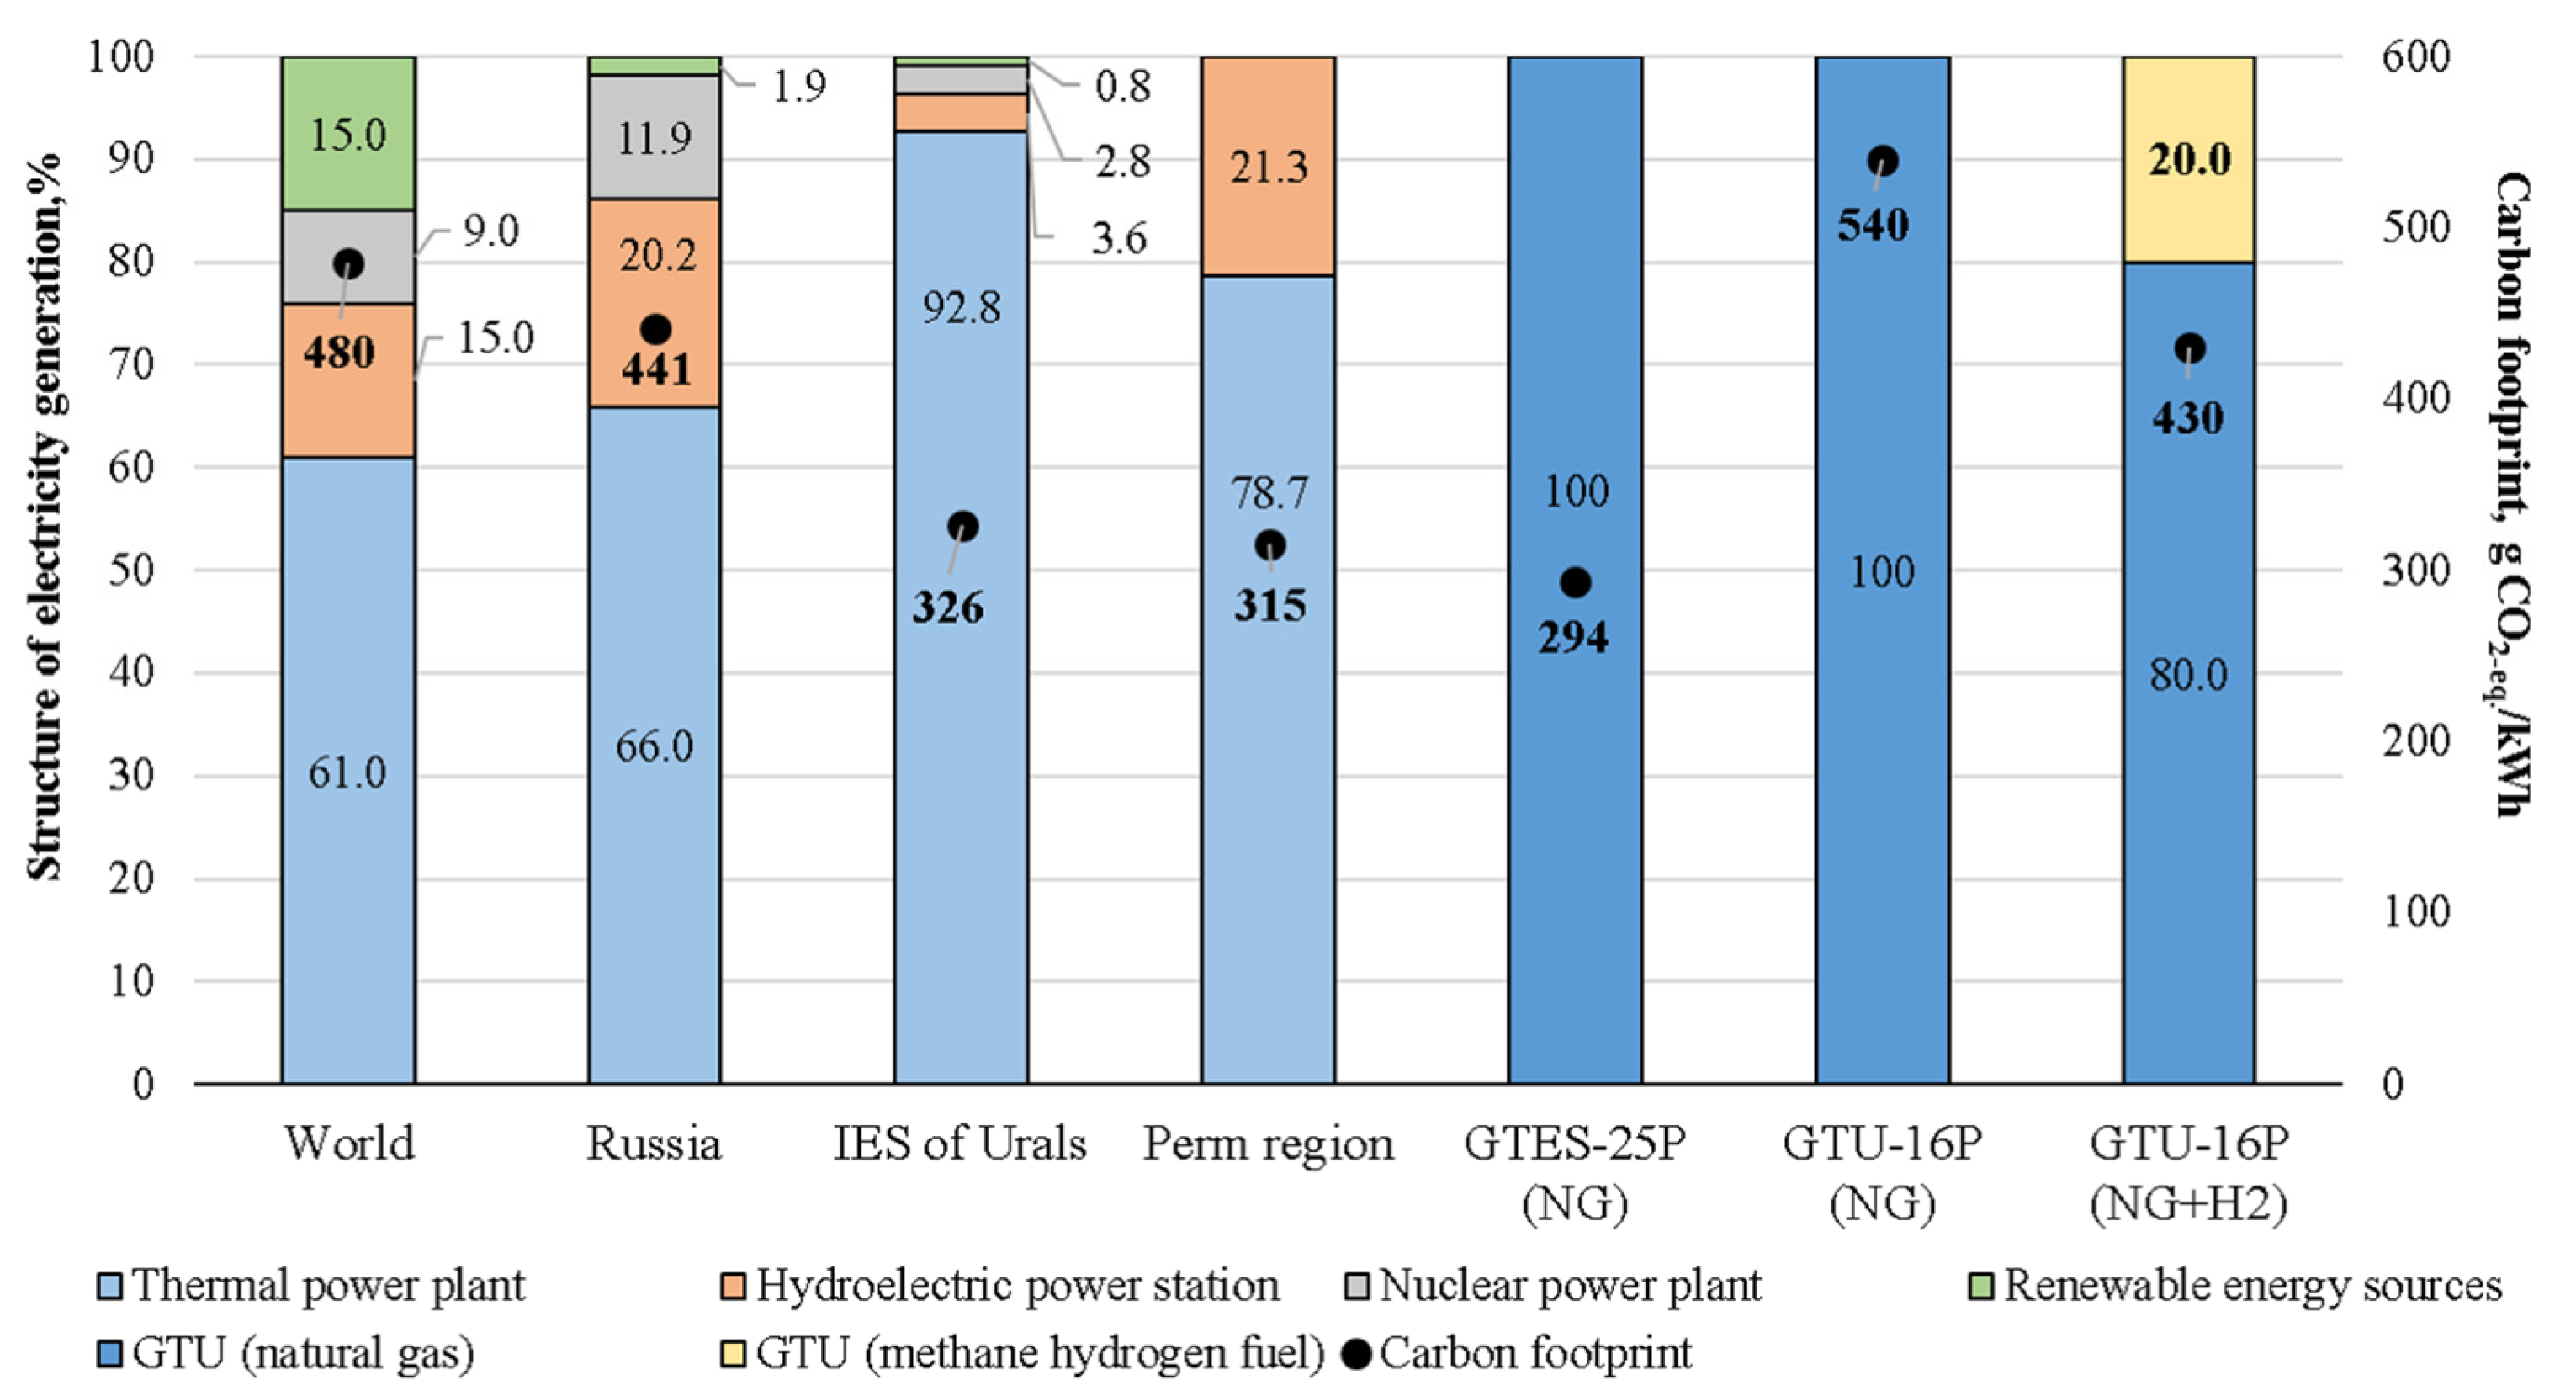
3.7. Carbon Footprint of Electricity Genereted in Russia
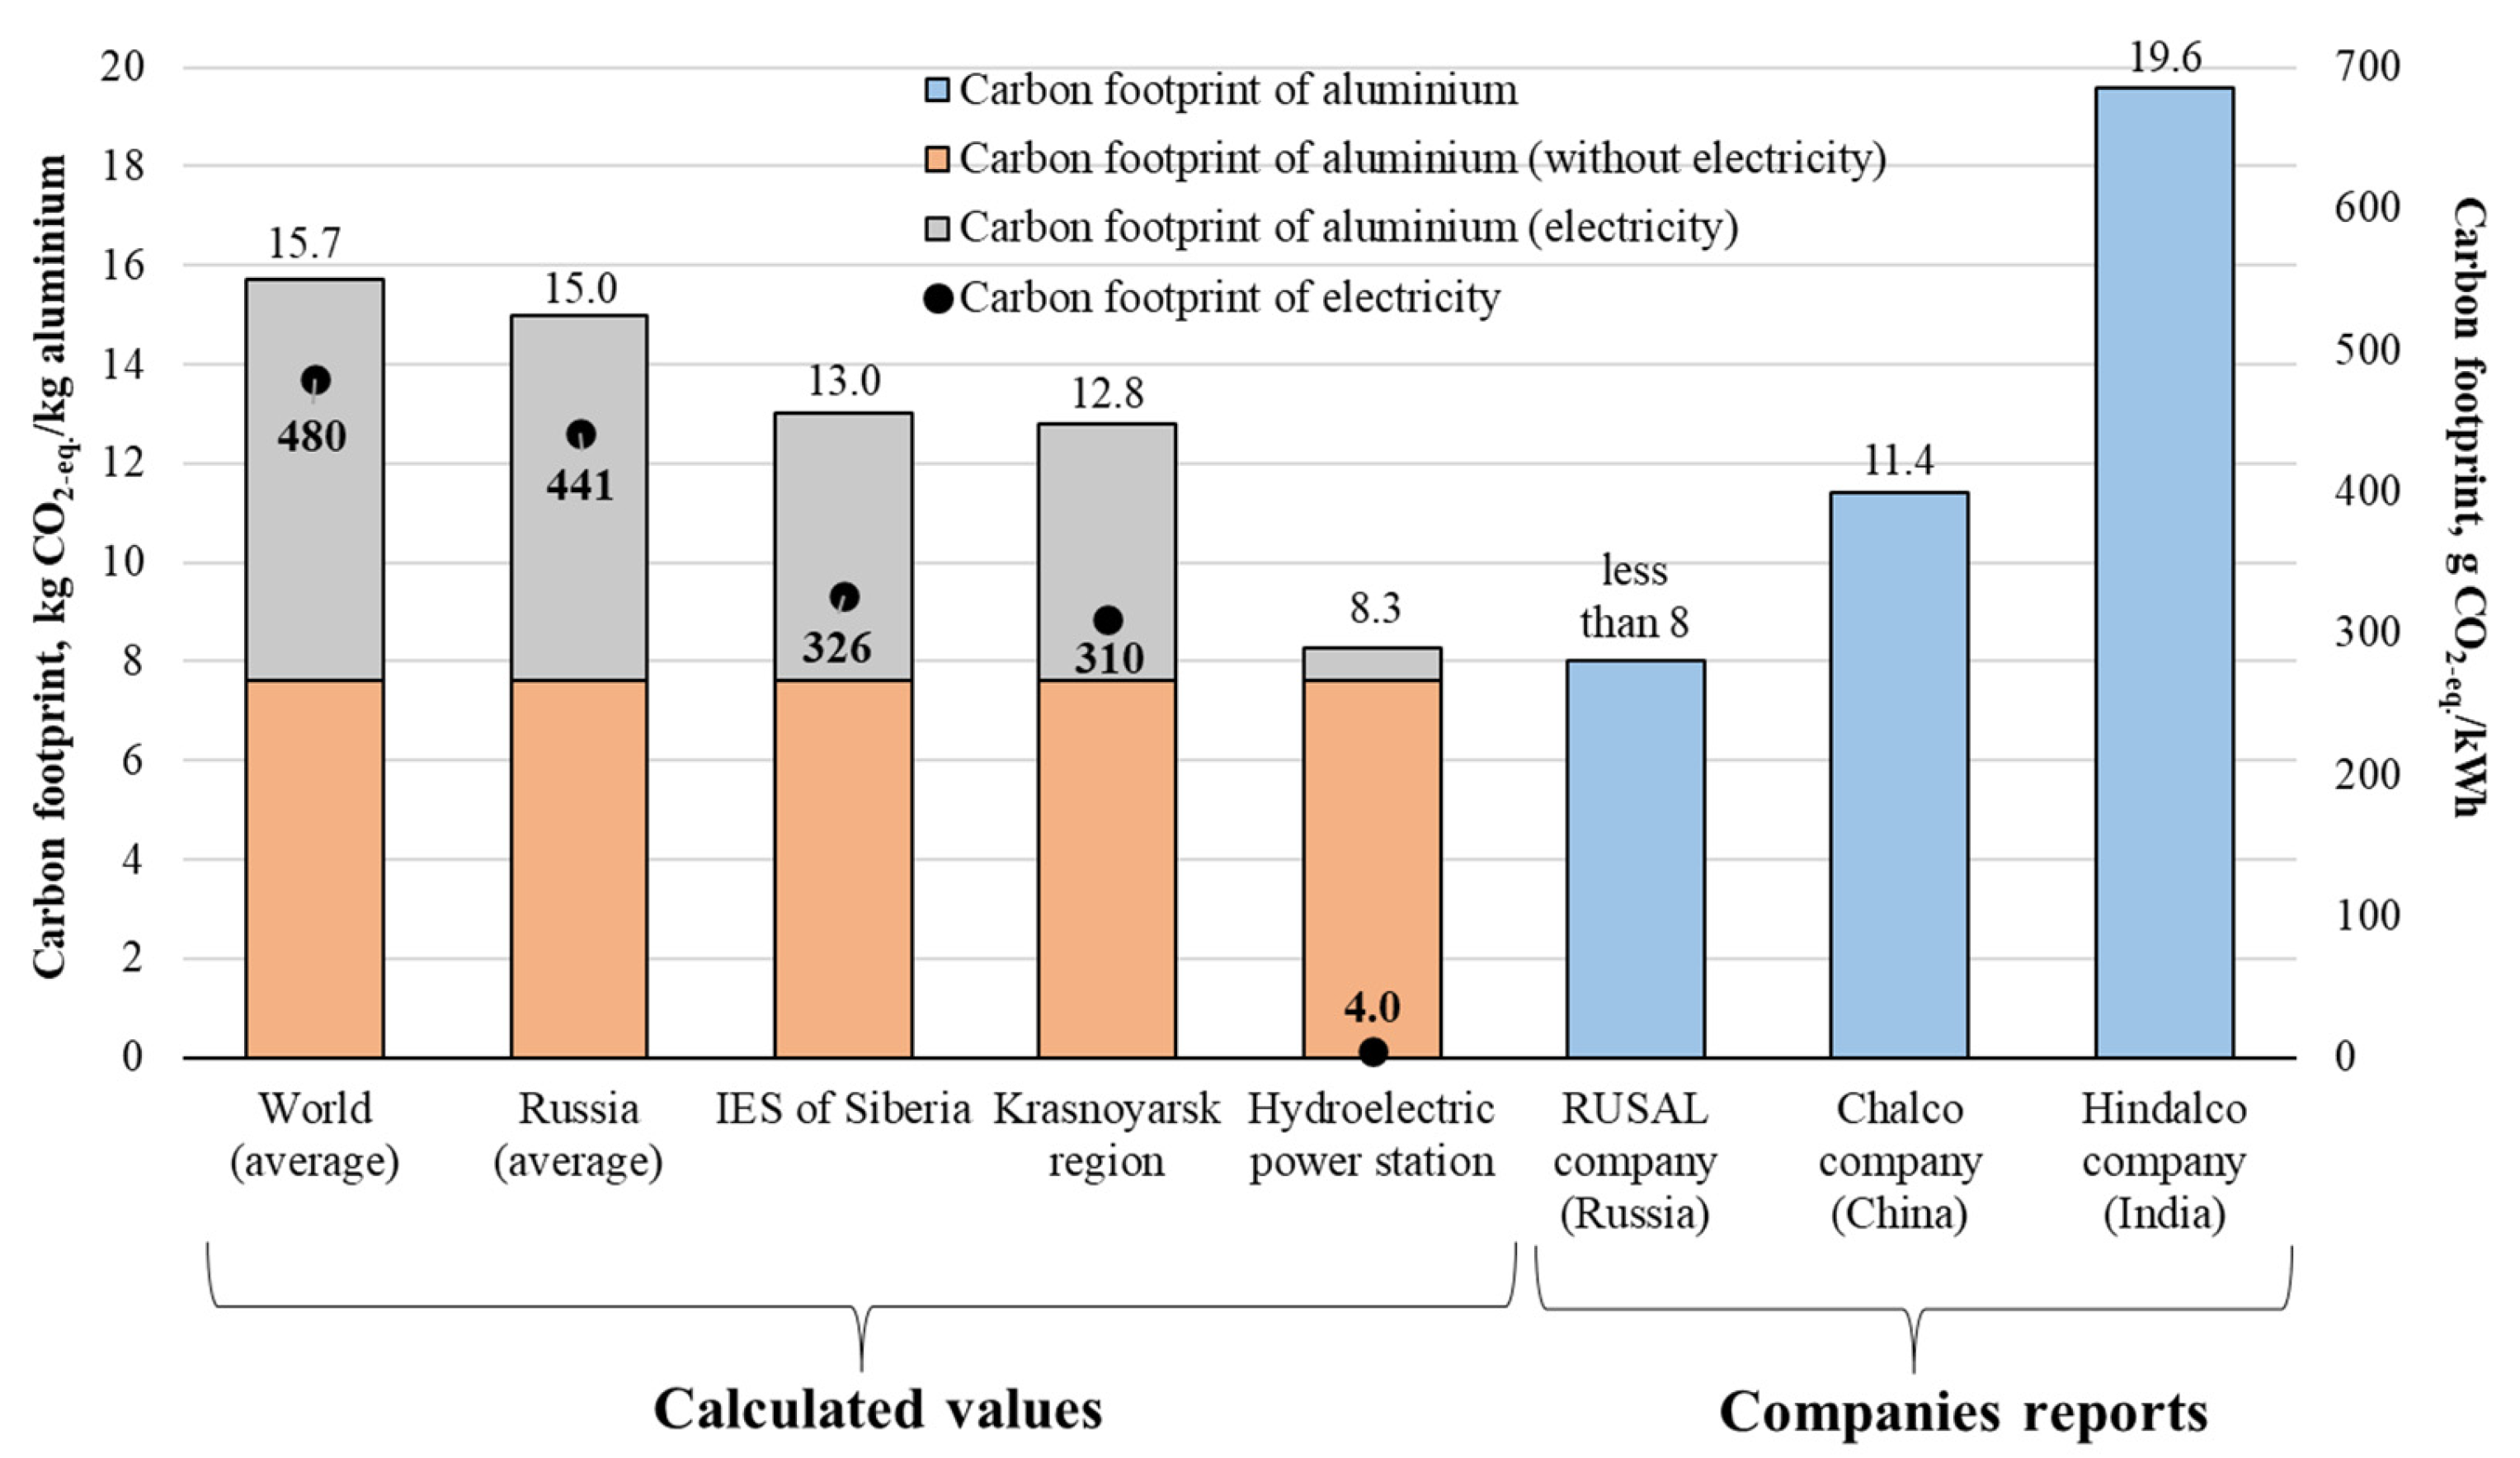
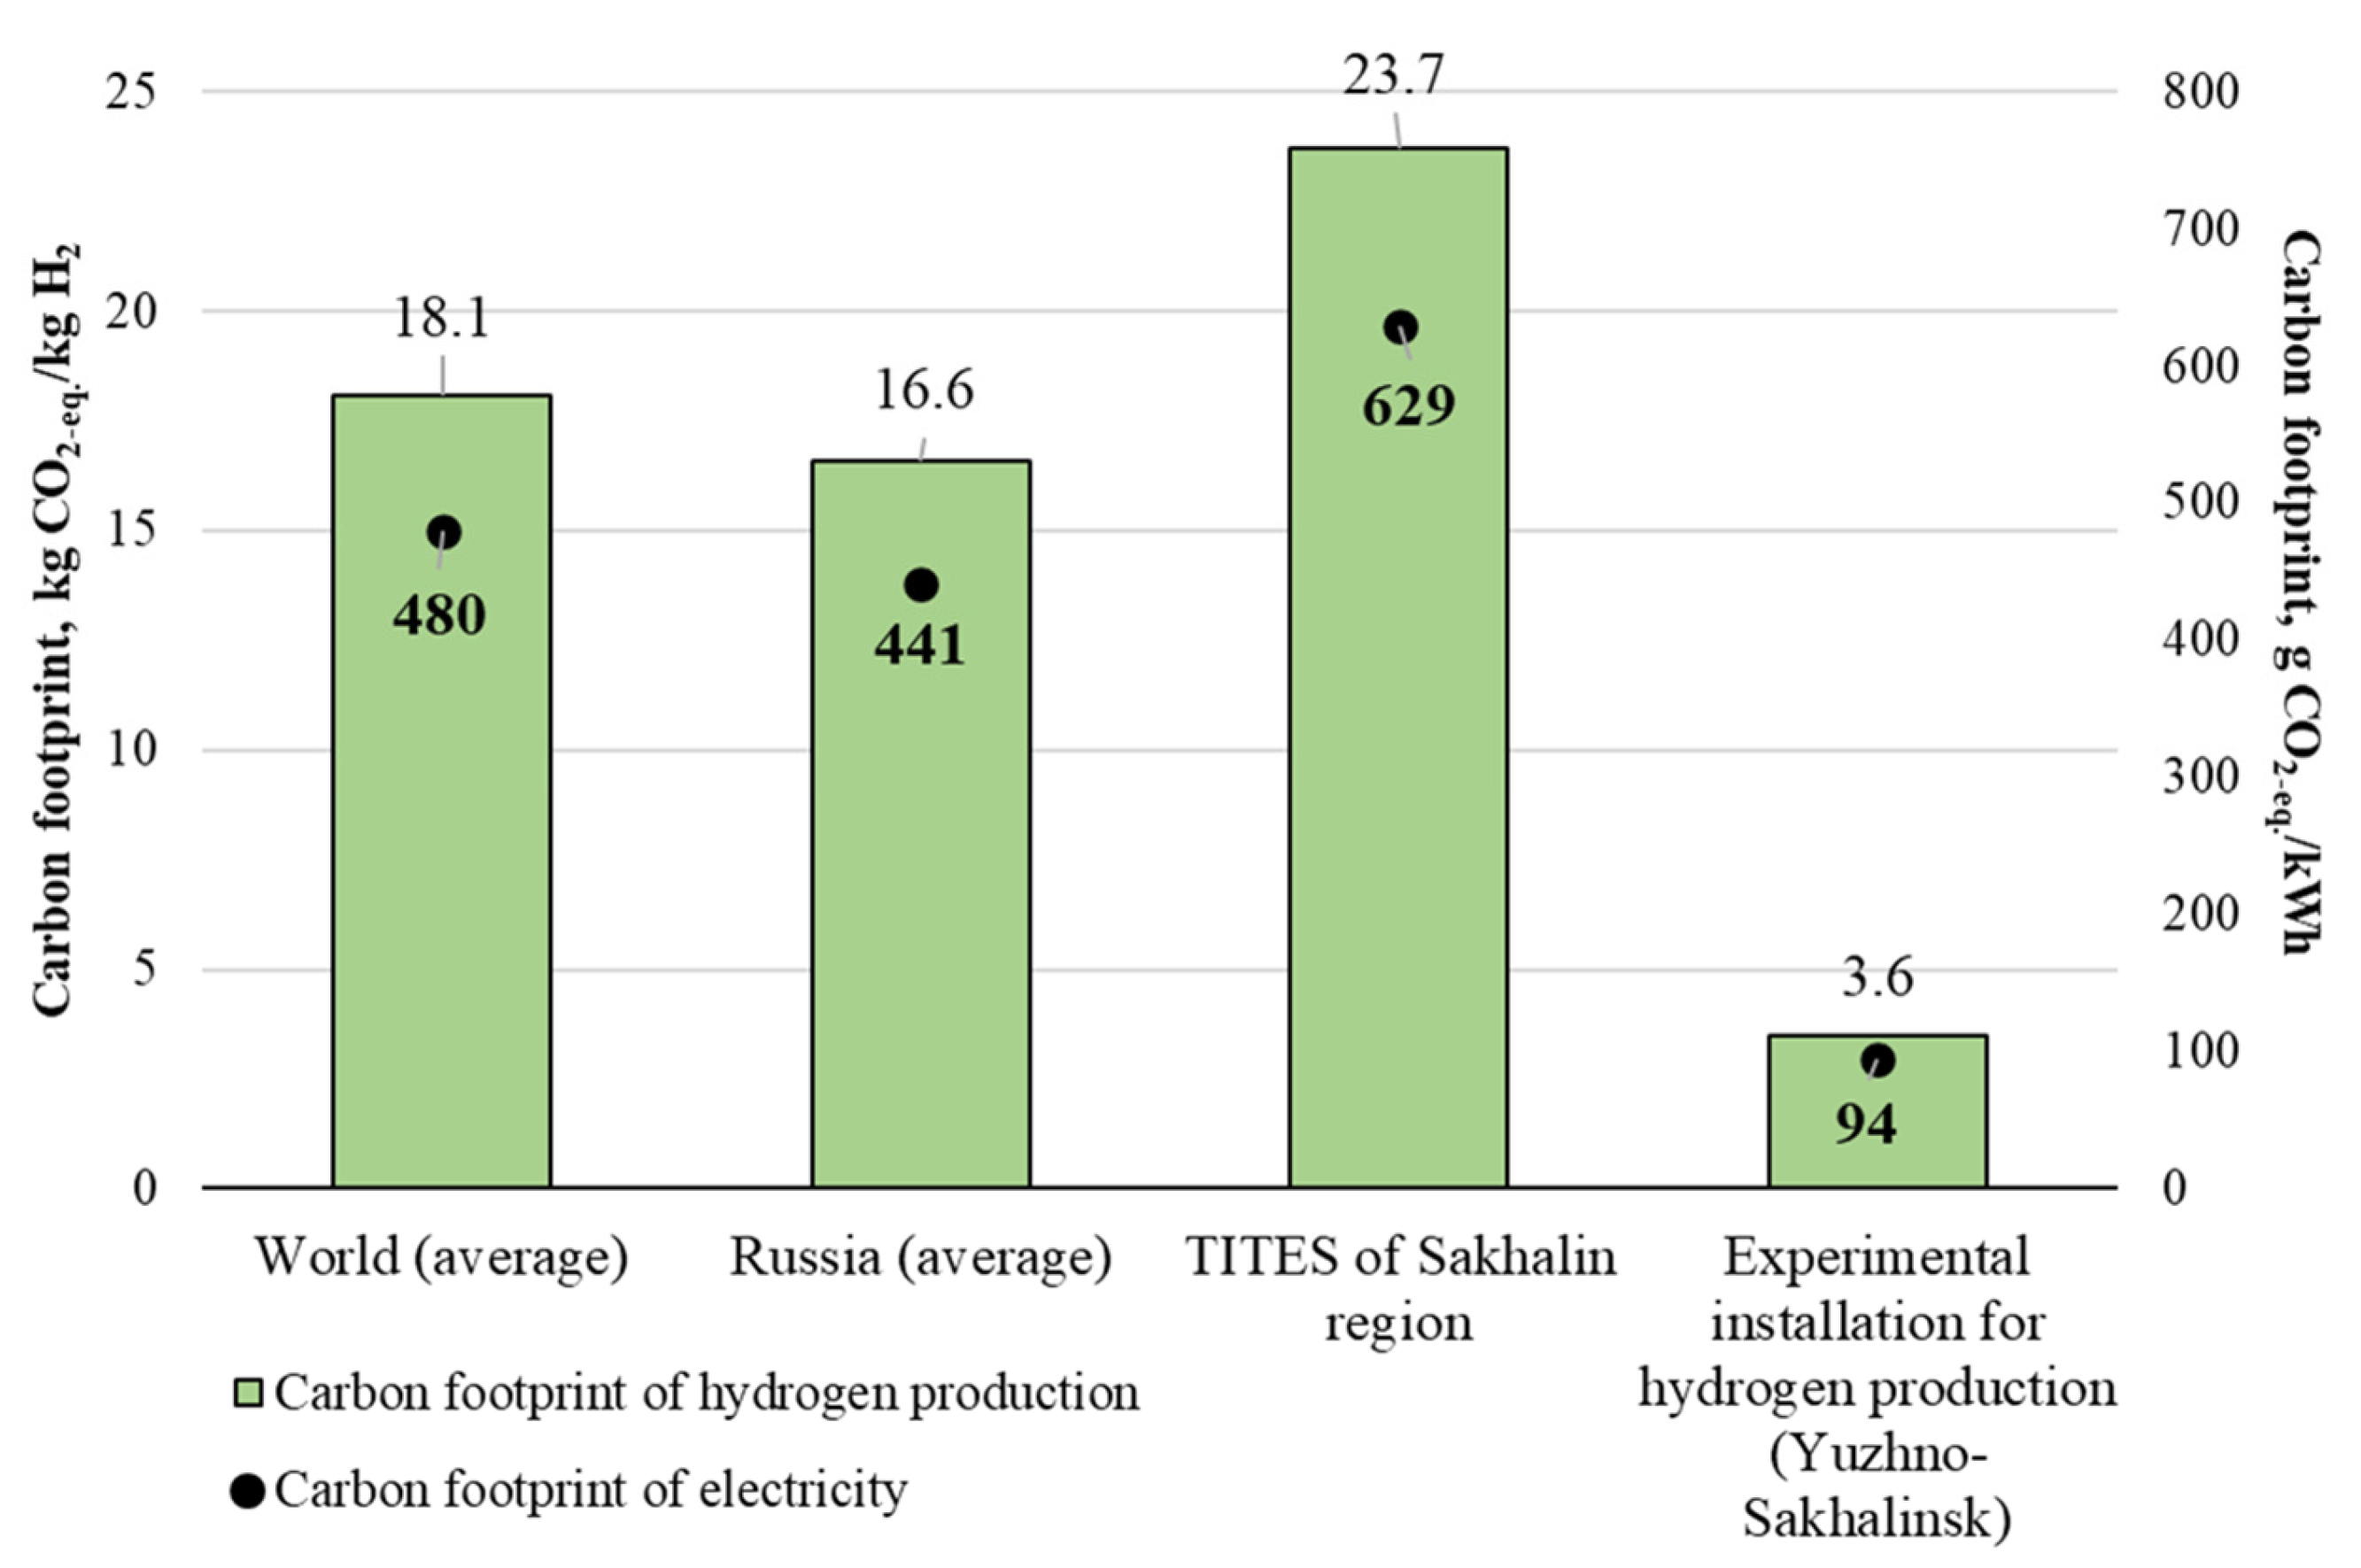
The data available today on the carbon footprint of electricity in Russia are obtained on the basis of different methodological approaches to calculation and relate to different time periods. Summary data on the carbon footprint of electricity generated in the Russian Federation are presented in Table S2.
Thus, according to the Climate Transparency data [11] for 2021, 321.8 g CO2-eq. is emitted for every kilowatt-hour of electricity in Russia, which is lower than the average for the G20 countries, which is 444.7 g CO2-eq./kWh. This is due to the use of relatively low-carbon natural gas in electricity generation at traditional thermal power plants, as well as a significant share of nuclear and hydroelectric power in Russia.
The Ember, a global energy think tank, reports that with emissions of 441 g CO2-eq./kWh in 2023, Russia’s electricity generation is less carbon-intensive than the global average (480 g CO2-eq./kWh). However, the figure for Russian energy is significantly higher than the European average (300 g CO2-eq./kWh) [10].
It should be noted that the data from the sources on the generation structure in the Russian Federation over the same period of time differ from each other. Thus, in the Ember report, the share of coal in the fuel balance of Russia in 2023 is 17%, and according to The Energy Institute Statistical Review of World Energy™, it is 12% [86].
Inconsistencies in the initial data of different sources ultimately results in different numerical values when calculating grid emission factors. Most factors do not take into account the stages of fuel production and power plant construction, thus, emissions from low-carbon generation facilities (hydroelectric power plants and nuclear power plants) and renewable energy sources are assumed to be zero. An exception is the Ecoinvent database data, which contain specific greenhouse gas emissions according to generation types and the types of fuel combusted, taking into account all stages of the electricity life cycle. In addition, the factors have different intended purposes. For example, the emission factors developed by the IFI Technical Working Group (IFITWG) and Lahmeyer International using the CDM methodology were intended for calculating emissions from electricity production in Russia to develop a baseline scenario for activities under the Joint Implementation Projects (JIP).
The Operating Margin Grid Emission factor takes into account emissions from power plants with the highest variable operating costs (thermal power plants on natural gas, oil, and coal), and for Russia, it is 476 g CO2-eq./kWh. The emission factor for power plants of the operating range for the Unified Energy System of Russia, determined on a basis of forecasts from the report of the European Bank for Reconstruction and Development and the Lahmeyer International in 2010, is 634 g CO2-eq./kWh.
The Carbon Footprint Ltd. data can be used to determine greenhouse gas emissions associated with electricity generation in the Russian energy system; the emission factor takes into account both electricity generation and its transmission and distribution. Country-level grid emission factors for the Russian energy system are also published by the Climate Transparency and the IRENA. However, they do not take into account the differences in the generation structure of integrated energy systems and regions of the country. Using grid emission factors that take into account the generation structure allows greenhouse gas emissions to be assessed more accurately, which is especially important for the complex and multi-level structure of the Russian energy system.
The carbon footprint of generated electricity has a wide range of values and varies depending on the territory structure, the fuel used, the stages of the electricity life cycle taken into account, etc. (Figure 2) [7,9,10,11,12,13,14,15,16,82,83,84,85,86,87,88,89,90,91,92,93,94,95].
Thus, the database of the JSC «TSA» is currently the priority source of initial data on emission factors for the energy system of the Russian Federation, despite the fact that today, at the legislative level, there is no single source for publishing energy emission factors and the factors of the JSC «TSA» are of an informational character.
It is worth noting that, in Russia, the system of «green» certificates is at the implementation stage, and emissions from the generation and consumption of electricity are determined using regional grid emission factors. The market approach is not currently used, and the residual emission factors are not published.

4. Discussion

A comparative description of the generation structure and the carbon footprint of generated electricity in the world, Russia, the IES of the Urals, the Perm region, and the individual generating capacities is presented in Figure 3 [6,10,15,52,96].
As can be seen from the presented data, the carbon footprint of electricity (generated mainly by thermal power plants) generated in Russia is lower than the average carbon footprint of electricity generated in the world, while the carbon footprint of electricity produced in different territories of the Russian Federation may also differ. The carbon footprint of electricity generated in the IES of the Urals is lower than the Russian average due to the use of natural gas as the predominant fuel at thermal power plants. In the Perm region, the carbon footprint of electricity is lower than the carbon footprint of electricity produced in the IES of the Urals due to the higher share of hydroelectric power plants.
The carbon footprint of electricity produced by individual generating capacities of companies will depend on the generation technology implemented. According to the research results [96], it was found that the carbon footprint of electricity generated by a gas turbine unit (using natural gas and methane–hydrogen fuel) has a higher value than when generating energy at gas turbine power plants, which is explained by the additional generation of heat, thereby reducing the carbon footprint of the electricity produced. The use of hydrogen in the fuel mixture in the energy sector will be promising if low-carbon electricity sources are used to produce hydrogen.
The carbon footprint of a product can be greatly influenced by the carbon footprint of the electricity consumed. For example, aluminium production is a very energy-intensive process, with the carbon footprint of aluminium varying from 4.0 to 19.6 kg CO2-eq./kg [44,97], with a global average of 12.5 kg CO2-eq./kg aluminium [44]. The RUSAL company (Russia) produces aluminum under the ALLOW brand with the carbon footprint of the whole life cycle of less than 8 kg CO2-eq./kg aluminum. The low carbon intensity of aluminium is the result of electricity from hydroelectric power plant consumption [98]. The life cycle carbon footprint of aluminium production includes, in addition to electricity consumption, greenhouse gas emissions from mining, manufacturing processes, resource use, and auxiliary materials [99]. According to Ecoinvent, the average carbon footprint of primary aluminium produced in the IAI Area, Russia and RER w/o EU27 and EFTA (including the Russian Federation, Bosnia and Herzegovina, Montenegro) is 7.7 kg CO2-eq./kg excluding the carbon footprint of electricity consumed [84]. With an average electricity consumption of 16.9 kW for the production of 1 kg of aluminum and a range of carbon footprint of electricity of 11.0–820 g CO2-eq./kWh [100], the total carbon footprint of aluminum, due only to a change in the source of electricity, with all other parameters remaining constant, can vary from 7.9 to 21.5 kg CO2-eq./kg.
The carbon footprint of aluminum depends on the grid emission factors for electricity consumed in the world, Russia, the IES of Siberia, and the Krasnoyarsk region (Figure 4). [10,12,84,98,101,102].
The use of the emission factor for a specific thermal power plant in calculations makes it possible to justify a significant reduction in the carbon footprint of aluminum compared with the similar carbon footprint obtained in calculations using averaged data on the national grid or regional energy system. The carbon footprint of aluminum in Russia is lower compared with the actual carbon footprint of aluminum produced in other countries due to the lower carbon intensity of electricity. At the same time, the use of low-carbon electricity from a certain power plant, for example, produced at a hydroelectric power plant, will achieve the lowest carbon footprint for aluminum production.
Another energy-consuming process is hydrogen production using electrolysis. The carbon footprint of hydrogen ranges from 1.0 to 76 kg CO2-eq./kg [103]. However, less than 2% of the carbon footprint value is generated by the production and operation of the alkaline electrolyzer for hydrogen production. In comparison, almost 98% is generated by the production of electricity. In other words, the key component of hydrogen’s carbon footprint is electricity and not the hydrogen production itself. [104].
To estimate the carbon footprint of hydrogen production, grid emission factors for electricity were used (the world average, Russia, the TITES of Sakhalin region) and hydrogen generation at an experimental installation with photovoltaic modules (Figure 5) [10,12,84,104].
The carbon footprint of hydrogen varies significantly depending on the grid emission factor used in calculations. The carbon footprint of hydrogen produced using grid power is 18.1 kg CO2-eq./kg (the world average grid emission factor) and 16.6 kg CO2-eq./kg (the national average grid emission factor), respectively. If hydrogen production takes place in the Sakhalin region, the carbon footprint will be quite high due to electricity consumption from thermal and diesel power plants. However, if hydrogen is produced at an experimental facility with photovoltaic modules in Yuzhno-Sakhalinsk, the carbon footprint of hydrogen could be reduced by up to 3.6 kg CO2-eq./kg.

5. Conclusions

The Russian energy system has a complex spatial structure; each territorial zone has its own generation specificity, which is important to take into account when calculating energy emissions.
The use of the country-level grid emission factor for the entire energy system of the Russian Federation will not allow obtaining reliable data, since it does not take into account the characteristics of generating facilities in different regions; in this regard, it is preferable to use grid emission factors determined for individual territorial entities within the framework of the Unified Energy System.
The grid emission factors published in open sources were developed using different initial data and they take into account different boundaries of the life cycle of electricity. At the same time, all of them are of an informational character, since no federal executive body has the authority to approve grid emission factors for all regional and integrated energy systems, as well as emission factors for all types of energy coal, fuel oil, and natural gas used in Russia. The database of the JSC «TSA» is currently the priority source of initial data on grid emission factors for the energy system of the Russian Federation, despite the fact that, at present, a single source for the publication of energy emission factors is not approved at the legislative level and the factors of the JSC «TSA» are of an informational character.
The carbon footprint of electricity produced in the IES of the Urals is below the average carbon footprint of Russian electricity, due to the use of natural gas at thermal power plants (92.7%) and the presence of nuclear power plants (2.8%) in the generation structure. Due to a high share of hydropower plants in the generation structure, electricity produced in the Perm region has a lower carbon footprint than electricity produced in the IES of the Urals. The carbon footprint of electricity produced by individual generating capacities of companies will depend on the generation technology being implemented. Thus, it is necessary to create a unified system for determining and publishing grid emission factors and approve unified grid emission factors at the legislative level.
The carbon footprint of a product can be greatly influenced by the carbon footprint of the electricity consumed. It is determined that the use of the emission factor for a specific thermal power plant in calculations makes it possible to justify a significant reduction in the carbon footprint of aluminum compared with the similar carbon footprint obtained in calculations using averaged data on the national grid or regional energy system. The carbon footprint of aluminum in Russia is lower compared with the actual carbon footprint of aluminum produced in other countries due to the lower carbon intensity of electricity.
The carbon footprint of hydrogen varies significantly, depending on the grid emission factor used in calculations. The carbon footprint of hydrogen produced using grid power is 18.1 kg CO2-eq./kg (the world average grid emission factor) and 16.6 kg CO2-eq./kg (the national average grid emission factor), respectively.

Supplementary Materials

The following supporting information can be downloaded at https://www.mdpi.com/article/10.3390/en18010014/s1, Table S1: Existing approaches to assessing greenhouse gas emissions from electricity generation; Table S2: Data on the carbon footprint of electricity generated in the Russian Federation.

Author Contributions

Conceptualization, E.S. and Y.M.; methodology, Y.M. and G.I.; validation, E.S. and G.I; investigation, E.S.; resources, V.K.; data curation, Y.M. and G.I.; writing—original draft preparation E.S. and Y.M.; writing—review and editing, V.K.; visualization, Y.M. and G.I.; supervision, E.S.; project administration, V.K.; funding acquisition, V.K. All authors have read and agreed to the published version of the manuscript.

Funding

The research was carried out with the financial support of the Ministry of Science and Higher Education of the Russian Federation (project No. FSNM-2023-0004 “Hydrogen energy. Materials and technology for storing, transporting, and using hydrogen and hydrogen-containing mixtures”).

Institutional Review Board Statement

Not applicable.

Informed Consent Statement

Not applicable.

Data Availability Statement

Data are contained within the article and Supplementary Materials.

Conflicts of Interest

The authors declare no conflicts of interest.

References

  1. Order of the Government of the Russian Federation of October 29, 2021 No. 3052-r “On Approval of the Strategy for the Socio-economic Development of the Russian Federation with Low Greenhouse Gas Emissions until 2050”. Available online: http://publication.pravo.gov.ru/Document/View/0001202111010022 (accessed on 2 October 2024).
  2. Decree of the President of the Russian Federation of 04.11.2020 No. 666 “On the Reduction of Greenhouse Gas Emissions”. Available online: http://www.kremlin.ru/acts/bank/45990 (accessed on 4 October 2024).
  3. Tsvetkov, P.; Andreichyk, A.; Kosarev, O. The impact of economic development of primary and secondary industries on national CO2 emissions: The case of Russian regions. J. Environ. Manag. 2024, 351, 119881. [Google Scholar]
  4. The Carbon Brief Profile: Russia. Available online: https://www.carbonbrief.org/the-carbon-brief-profile-russia (accessed on 14 October 2024).
  5. Russian Federation. National Communication (NC). NC 8. Biennial Reports (BR). BR 5. Available online: https://unfccc.int/documents/624780 (accessed on 2 September 2024).
  6. Schreider, A.; Eckert, P.; Bonneschky, A. Development of the Russian Electricity Carbon Emission Factors for the Period 2010–2020. In Proceedings of the Russia Power 2011, Moscow, Russia, 28–30 March 2011; 13p. Available online: https://www.researchgate.net/publication/319626357_Development_of_the_Russian_Electricity_Carbon_Emission_Factors_for_the_Period_2010-2020 (accessed on 19 November 2024).
  7. Saneev, B.; Ivanova, I.; Izhbuldin, A.; Maysyuk, E. Assessment of the spatial distribution of greenhouse gas emissions from energy facilities in Russia. Energy Policy 2022, 11, 92–103. [Google Scholar]
  8. Senchuk, D.; Korotchenko, V. Calculation of indirect energy greenhouse gas emissions: International standards, practice of calculating emission factors, current state in Russia. News Electr. Power Eng. 2023, 3, 66–73. [Google Scholar]
  9. Brander, M.; Sood, A.; Wylie, C.; Haughton, A.; Lovell, J. Technical Paper «Electricity-specific emission factors for grid electricity». Ecometrica 2011. Available online: https://ecometrica.com/assets/Electricity-specific-emission-factors-for-grid-electricity.pdf (accessed on 19 November 2024).
  10. Ember. Global Electricity Review 2024; Ember: London, UK, 2024; 191p, Available online: https://ember-energy.org/app/uploads/2024/05/Report-Global-Electricity-Review-2024.pdf (accessed on 12 November 2024).
  11. Russian Federation. Climate Transparency Report: Comparing G20 Climate Action; Russian Federation: Moscow, Russia, 2022; 20p, Available online: https://www.climate-transparency.org/wp-content/uploads/2022/10/CT2022-Russia-web.pdf (accessed on 2 September 2024).
  12. Greenhouse Gas Emission Factors of the Russian Energy System. JSC “TSA”. Available online: https://www.atsenergo.ru/results/co2all (accessed on 2 October 2024).
  13. IEA. Emissions Factors 2023. Annual GHG Emission Factors for World Countries from Electricity and Heat Generation. Available online: https://www.iea.org/data-and-statistics/data-product/emissions-factors-2023 (accessed on 2 October 2024).
  14. International Electricity Factors. Carbon Footprint. Available online: https://www.carbonfootprint.com/international_electricity_factors.html (accessed on 2 October 2024).
  15. European Bank for Reconstruction and Development. Development of the Electricity Carbon Emission Factors for Russia; Report; European Bank for Reconstruction and Development: London, UK, 2010; 102p, Available online: https://www.ebrd.com/downloads/sector/eecc/Baseline_Study_Russia_Final_Russian.pdf (accessed on 10 October 2024).
  16. Russian Federation. Energy Profile; Report; IRENA: Abu Dhabi, United Arab Emirates, 2024; 4p, Available online: https://www.irena.org/-/media/Files/IRENA/Agency/Statistics/Statistical_Profiles/Eurasia/Russian-Federation_Eurasia_RE_SP.pdf (accessed on 2 October 2024).
  17. Abulibdeh, A.; Jawarneh, R.N.; Al-Awadhi, T.; Abdullah, M.M.; Abulibdeh, R.; Kenawy, A.M. Assessment of carbon footprint in Qatar’s electricity sector: A comparative analysis across various building typologies. Renew. Sustain. Energy Rev. 2024, 189, 114022. [Google Scholar] [CrossRef]
  18. Li, X.; Zhao, Z.; Zhao, Y.; Zhou, S.; Zhang, Y. Prediction of energy-related carbon emission intensity in China, America, India, Russia, and Japan using a novel self-adaptive grey generalized Verhulst model. J. Clean. Prod. 2023, 423, 138656. [Google Scholar] [CrossRef]
  19. Kiehbadroudinezhad, M.; Hosseinzadeh-Bandbafha, H.; Rosen, M.A.; Gupta, V.K.; Peng, W.; Tabatabaei, M.; Aghbashlo, M. The role of energy security and resilience in the sustainability of green microgrids: Paving the way to sustainable and clean production. Sustain. Energy Technol. Assess. 2023, 60, 103485. [Google Scholar] [CrossRef]
  20. Ji, L.; Liang, S.; Qu, S.; Zhang, Y.; Xu, M.; Jia, X.; Jia, Y.; Niu, D.; Yuan, J.; Hou, Y.; et al. Greenhouse gas emission factors of purchased electricity from interconnected grids. Appl. Energy 2016, 184, 751–758. [Google Scholar] [CrossRef]
  21. Kilinc-Ata, N.; Proskuryakova, L.N. Empirical analysis of the Russian power industry’s transition to sustainability. Util. Policy 2023, 82, 101586. [Google Scholar] [CrossRef]
  22. Melekh, D. Development of a model for calculation greenhouse gas emissions in the category “Manufacturing industries and construction” in the “Energy” sector. Bull. Polotsk State Univ. Ser. F 2020, 16, 25–36. [Google Scholar]
  23. IEA. Norway. Available online: https://www.iea.org/countries/norway/electricity (accessed on 23 October 2024).
  24. Low-Carbon Power. Electricity in Norway in 2023/2024. Available online: https://lowcarbonpower.org/region/Norway (accessed on 23 October 2024).
  25. Nowtricity. Current Emissions in Norway. Available online: https://www.nowtricity.com/country/norway/#:~:text=In%202023%20the%20average%20emissions,countries%20in%20renewable%20energy%20production (accessed on 23 October 2024).
  26. Ember. China. Available online: https://ember-energy.org/countries-and-regions/china/ (accessed on 23 October 2024).
  27. Jia, M.; Zhang, Z.; Zhang, L.; Zhao, L.; Lu, X.; Li, L.; Ruan, J.; Wu, Y.; He, Z.; Liu, M.; et al. Optimization of electricity generation and assessment of provincial grid emission factors from 2020 to 2060 in China. Appl. Energy 2024, 373, 123838. [Google Scholar] [CrossRef]
  28. Carbon Intensity of the Power Sector in China from 2000 to 2023. Available online: https://www.statista.com/statistics/1300419/power-generation-emission-intensity-china/ (accessed on 23 October 2024).
  29. Arevalo, P.; Cano, A.; Jurado, F. Mitigation of carbon footprint with 100% renewable energy system by 2050: The case of Galapagos islands. Energy 2022, 245, 123247. [Google Scholar] [CrossRef]
  30. 11 Countries Leading the Charge on Renewable Energy. Available online: https://www.climatecouncil.org.au/11-countries-leading-the-charge-on-renewable-energy/ (accessed on 23 October 2024).
  31. EPA. U.S. Grid Regions. Available online: https://www.epa.gov/green-power-markets/us-grid-regions (accessed on 9 December 2024).
  32. Robinson, S.; Sullivan, G. Proposed guidelines for U.S. Scope 2 GHG reduction claims with renewable energy certificates. Electr. J. 2022, 35, 107160. [Google Scholar] [CrossRef]
  33. Chen, L.; Wemhoff, A.P. Predicting embodied carbon emissions from purchased electricity for United States counties. Appl. Energy 2021, 292, 116898. [Google Scholar] [CrossRef]
  34. Lueken, R.; Klima, K.; Griffin, W.M.; Apt, J. The climate and health effects of a USA switch from coal to gas electricity generation. Energy 2016, 109, 1160–1166. [Google Scholar] [CrossRef]
  35. Millstein, D.; O’Shaughnessy, E.; Wiser, R. Climate and air quality benefits of wind and solar generation in the United States from 2019 to 2022. Cell Rep. Sustain. 2024, 1, 100105. [Google Scholar] [CrossRef]
  36. The Emissions & Generation Resource Integrated Database. Available online: https://www.epa.gov/system/files/documents/2024-01/egrid2022_technical_guide.pdf (accessed on 23 October 2024).
  37. Climate Scorecard. China’s Power Grid Systems. Available online: https://www.climatescorecard.org/2023/01/chinas-power-grid-systems/ (accessed on 9 December 2024).
  38. Qu, S.; Liang, S.; Xu, M. CO2 Emissions Embodied in Interprovincial Electricity Transmissions in China. Environ. Sci. Technol. 2017, 51, 10893–10902. [Google Scholar] [CrossRef] [PubMed]
  39. Sosna, M.; Maslennikova, M.; Kryuchkov, M.; Pustovalov, M. «Green» and/or «Blue» Hydrogen. Neft. Petrochem. 2020, 34, 21–23. [Google Scholar]
  40. Hwang, H.; Kweon, T.; Kang, H.; Hwang, Y. Resource and Greenhouse Gas Reduction Effects through Recycling of Platinum Containing Waste. Sustainability 2024, 16, 80. [Google Scholar] [CrossRef]
  41. Rajulwar, V.V.; Shyrokykh, T.; Stirling, R.; Jarnerud, T.; Korobeinikov, Y.; Bose, S.; Bhattacharya, B.; Bhattacharjee, D.; Sridhar, S. Steel, Aluminum, and FRP-Composites: The Race to Zero Carbon Emissions. Energies 2023, 16, 6904. [Google Scholar] [CrossRef]
  42. Ekman Nilsson, A.; Macias Aragonés, M.; Arroyo Torralvo, F.; Dunon, V.; Angel, H.; Komnitsas, K.; Willquist, K. A Review of the Carbon Footprint of Cu and Zn Production from Primary and Secondary Sources. Minerals 2017, 7, 168. [Google Scholar] [CrossRef]
  43. Cao, Q.; Song, J.; Liu, C.; Yang, W. Evolving water, energy and carbon footprints in China’s food supply chain. J. Clean. Prod. 2023, 423, 138716. [Google Scholar] [CrossRef]
  44. Aluminium Sector Greenhouse Gas Emissions. Available online: https://international-aluminium.org/statistics/greenhouse-gas-emissions-aluminium-sector/ (accessed on 19 September 2024).
  45. RUSAL. Sustainability. Available online: https://rusal.ru/en/sustainability/ (accessed on 27 September 2024).
  46. Sotos, M. GHG Protocol Scope 2 Guidance. An Amendment to the GHG Protocol Corporate Standard; World Resources Institute: Washington, DC, USA, 2024; 120p, Available online: https://ghgprotocol.org/sites/default/files/2023-03/Scope%202%20Guidance.pdf (accessed on 14 October 2024).
  47. The System Operator and Technologically Isolated Power Systems Have Taken an Important Step Towards Centralizing Operational Dispatch Control. Available online: https://www.so-ups.ru/news/press-release/press-release-view/news/22171/ (accessed on 22 October 2024).
  48. Resolution of the Government of the Russian Federation of 13.08.2018 N 937 “On Approval of the Rules for the Technological Functioning of Electric Power Systems and on Amendments to Certain Acts of the Government of the Russian Federation. Available online: http://publication.pravo.gov.ru/Document/View/0001201808160007 (accessed on 22 October 2024).
  49. Russian Power System Operator. Report on the Functioning of the Unified Energy System of Russia in 2023; Russian Power System Operator: St. Petersburg, Russia, 2024; 4p, Available online: https://www.so-ups.ru/fileadmin/files/company/reports/disclosure/2024/ups_rep2023.pdf (accessed on 9 December 2024).
  50. Federal State Statistics Service. Electrical Balance. Available online: https://rosstat.gov.ru/search?q=%D1%8D%D0%BB%D0%B5%D0%BA%D1%82%D1%80%D0%BE%D0%B1%D0%B0%D0%BB%D0%B0%D0%BD%D1%81 (accessed on 24 October 2024).
  51. Russian Power System Operator. Available online: http://www.so-ups.ru (accessed on 22 October 2024).
  52. Russian Power System Operator. Report on the Implementation of the General Scheme for the Placement of Electric Power Facilities Until 2035; Russian Power System Operator; Russian Power System Operator: St. Petersburg, Russia, 2024; 23p, Available online: https://www.so-ups.ru/fileadmin/files/company/future_plan/genshema/genshena_reports/genshema_2023_report_.pdf (accessed on 20 October 2024).
  53. Hydropower in Russia. Available online: https://www.hydropower.ru/hydropower/analitics.php (accessed on 22 October 2024).
  54. Analytical Center Under the Government of the Russian Federation. Generation Facilities in Isolated and Hard-to-Reach Areas in Russia; Analytical Center Under the Government of the Russian Federation: Moscow, Russia, 2020; 78p. Available online: https://ac.gov.ru/uploads/2-Publications/analitika/%D0%B3%D0%B5%D0%BD%D0%B5%D1%80%D0%B0%D1%86%D0%B8%D0%B8_%D0%B2_%D0%98%D0%A2%D0%A2.pdf (accessed on 22 October 2024).
  55. Khondoshko, Y.; Vorobyov, A. Technologically isolated energy systems of Russia. Bull. Amur State Univ. 2023, 101, 88–91. [Google Scholar] [CrossRef]
  56. Novak, A. Nuclear energy development is a prerequisite for the global climate agenda. Energy Policy 2021, 9, 148. [Google Scholar] [CrossRef]
  57. Russian Power System Operator. Scheme and program for the development of the Electric Power Systems of Russia for 2024–2029; Substantiating materials. Consolidated report on the Unified Energy System of Russia; Russian Power System Operator: St. Petersburg, Russia, 2024; 224p, Available online: https://www.so-ups.ru/fileadmin/files/company/future_plan/public_discussion/2024/final/sipr_ups_2024-29_fin.pdf (accessed on 22 October 2024).
  58. Russian Power System Operator. Operating Area. Available online: https://www.so-ups.ru/odu-ural/odu-ural-zone/ (accessed on 22 October 2024).
  59. Russian Power System Operator. Beloyarsk NPP. Available online: https://www.so-ups.ru/odu-ural/odu-ural-zone/krupneishie-obekty-ehlektrogeneracii-oehs-urala/belojarskaja-aehs/ (accessed on 20 October 2024).
  60. Russian Power System Operator. Electricity Consumption in the IES of the Urals for the First 9 Months of 2022 Increased by 1.8% Compared to the Same Period in 2021. Available online: https://www.so-ups.ru/odu-ural/news/odu-ural-news-view/news/19792/ (accessed on 25 October 2024).
  61. Resolution of the Government of Perm Region Dated 04.12.2023 No. 953-p “On Approval of the Regional Program “Energy Saving and Increasing Energy Efficiency of Perm Region for 2023–2027”. Available online: https://permkrai.ru/upload/iblock/483/8o2kzhdt5hrhdevw07xfe1u2yxl8nk2q/953_p.pdf (accessed on 28 October 2024).
  62. Russian Power System Operator. Supporting Materials. Scheme and Program for the Development of Russian Electric Power Systems for 2023–2028. Perm Region. Available online: https://www.so-ups.ru/fileadmin/files/company/future_plan/public_discussion/support_materials/38_Permskii_krai.pdf (accessed on 25 October 2024).
  63. OJSC Uralkali Begins Construction of Power Plants. Available online: https://www.uralkali.com/ru/press_center/press_releases/item216/ (accessed on 22 October 2024).
  64. Sulimov, D.D.; Kapralov, D.A. The largest thermal power plant based on Russian GTES-25PA was commissioned in Perm. Turbine Disel 2015, 4–7. Available online: http://www.turbine-diesel.ru/sites/default/files/n6-2015/Aviadvigatel.pdf (accessed on 22 October 2024).
  65. Lukoil Launched a Power Plant in Perm Region for Beneficial Utilization of Associated Petroleum Gas. Available online: https://lukoil.ru/PressCenter/Pressreleases/Pressrelease/lukoil-zapustil-v-permskom-krae-elektrostantsiiu (accessed on 20 October 2024).
  66. A Power Plant for the Useful Utilization of Associated Petroleum Gas Has Been Launched in Perm Krai. Available online: https://www.permkrai.ru/news/v-permskom-krae-zapushchena-elektrostantsiya-dlya-poleznoy-utilizatsii-poputnogo-neftyanogo-gaza/ (accessed on 15 October 2024).
  67. Solikamsk Papermakers Completed Construction of New Thermal Power Plant for 4 Billion Rubles. Available online: https://www.kommersant.ru/doc/4041398 (accessed on 22 October 2024).
  68. “Aviadvigatel” Launches New Power Plant at “Sibur”. Available online: https://www.kr-media.ru/news/dvigatelestroenie/aviadvigatel-zapustil-novuyu-elektrostantsiyu-na-sibure/ (accessed on 22 October 2024).
  69. Carbon Zero. Green Electricity Certificates. Available online: https://carbonzero.ru/sertifikaty-zelenoj-elektroenergii/ (accessed on 11 November 2024).
  70. Russian Power System Operator. Carbon Tax. Available online: https://www.so-ups.ru/fileadmin/files/company/markets/dr/carbon_dr/carbon_dr_021221.pdf (accessed on 11 November 2024).
  71. Federal Law of 04.08.2023 N 489-FZ “On Amendments to the Federal Law “On Electric Power Industry” and Certain Legislative Acts of the Russian Federation”. Available online: http://www.kremlin.ru/acts/bank/49679 (accessed on 15 November 2024).
  72. The First Agreements on the Sale of Green Certificates for the Azov and Kola Wind Farms Under the National Certification System Have Been Signed. Available online: https://www.ruscable.ru/news/2024/03/18/Podpisany_pervye_dogovory_o_prodazhe_zelenyx_serti/ (accessed on 15 November 2024).
  73. 2006 IPCC Guidelines for National Greenhouse Gas Inventories. Available online: https://www.ipcc-nggip.iges.or.jp/public/2006gl/russian/vol2.html (accessed on 11 November 2024).
  74. IPCC Updates Methodology for Greenhouse Gas Inventories. Available online: https://www.ipcc-nggip.iges.or.jp/public/2019rf/vol2.html (accessed on 15 November 2024).
  75. NATIONAL INVENTORY REPORT of Anthropogenic Emissions by Sources and Removals by Sinks of Greenhouse Gases Not Controlled by the Montreal Protocol for 1990–2020; Part I. 468p. Available online: http://downloads.igce.ru/kadastr/RUS_NIR-2022_v1_rev.pdf (accessed on 1 November 2024).
  76. Order No. 371 of the Ministry of Natural Resources and Environment of Russia dated 27.05.2022 “On Approval of Methods for Quantitative Determination of Greenhouse Gas Emissions and Greenhouse Gas Absorption”. Available online: https://docs.cntd.ru/document/350962750 (accessed on 12 November 2024).
  77. ISO 14064-1:2018; Greenhouse Gases. Part 1: Specification with Guidance at the Organization Level for Quantification and Reporting of Greenhouse Gas Emissions and Removals. International Organization for Standardization: Geneva, Switzerland, 2018.
  78. Order No. 330 of the Ministry of Natural Resources and Environment of Russia dated 29.06.2017 “On Approval of Methodological Guidelines for Quantification of Indirect Energy Emissions of Greenhouse Gases”. Available online: https://docs.cntd.ru/document/456079014 (accessed on 9 November 2024).
  79. GOST R ISO 14064-1-2021; Greenhouse Gases. Part 1. Specification with Guidance at the Organization Level for Quantification and Reporting of Greenhouse Gas Emissions and Removals. Russian Institute of Standardization: Moscow, Russia, 2021.
  80. Grid Emission Factors. Available online: https://hpb-s.com/news/energeticheskie-koefficzienty/ (accessed on 10 November 2024).
  81. Methodological Approach for the Common Default Grid Emission Factor Dataset. Available online: https://unfccc.int/sites/default/files/resource/IFITWG_Methodological_approach_to_common_dataset.pdf (accessed on 2 October 2024).
  82. PNST 646-2022; “Green” Standards. “Green” Products and “Green” Technologies. Methodology for Assessing the Reduction of Carbon Footprint (Approved and Put into Effect by Order of Rosstandart Dated 26.04.2022 N 35-pnst. Preliminary National Standard of the Russian Federation: Moscow, Russia, 2022. Available online: https://gostassistent.ru/doc/0508f291-bfa8-46d3-86c3-cf7403ef7091 (accessed on 2 October 2024).
  83. Association “NP Market Council” and JSC “TSA”. The Concept of Calculation and Publication of Greenhouse Gas Emission Factors for the Energy System of the Russian Federation; Association “NP Market Council” and JSC “TSA”: Moscow, Russia, 2022; 41p, Available online: https://www.np-sr.ru/sites/default/files/koncepciya_kev.pdf (accessed on 2 October 2024).
  84. Ecoinvent Database, version 3.8; Ecoinvent: Zurich, Switzerland, 2021.
  85. Council of the Federation Federal Assembly of the Russian Federation. Implementation of Recommendations of Parliamentary Hearings (Ministry of Energy of Russia, Letter Dated 23.01.2020 No. MU-644/09). 23 January 2020. Available online: http://council.gov.ru/media/files/r5ZuW1lJGbzvzueXVYaBUAMbu8FCVQlK.pdf (accessed on 2 October 2024).
  86. Energy Institute. Statistical Review of World Energy. Available online: https://www.energyinst.org/statistical-review (accessed on 2 October 2024).
  87. Harmonized IFI Default Grid Factors 2021 v3.1. Available online: https://unfccc.int/sites/default/files/resource/IFI%20Default%20Grid%20Factors%202021%20v3.1_unfccc.xlsx (accessed on 25 October 2024).
  88. Brown to Green. The G20 Transition to a Low-Carbon Economy. Climate Transparency; Brown to Green: Berlin, Germany, 2017; 36p, Available online: https://www.climate-transparency.org/wp-content/uploads/2017/07/Brown-to-Green-Report-2017_web.pdf (accessed on 12 November 2024).
  89. Emission Factor. Electricity Supplied from Grid. Available online: https://www.climatiq.io/data/emission-factor/e47f88bd-e04f-4304-bd96-58746cc9e7b9 (accessed on 5 November 2024).
  90. Gimadi, V.; Kudrin, A.; Kutuzova, A.; Zvyagintsev, A.; Amiraghyan, A.; Kolobov, O.; Kolojanov, S.; Pominova, I.; Martynyuk, A.; Podlesnaya, A. Carbon intensity of electricity in the world and in Russia. Energy Bull. 2019, 28. Available online: https://ac.gov.ru/archive/files/publication/a/22245.pdf (accessed on 6 October 2024).
  91. Hirschberg, S.; Wiemer, S.; Burgherr, P. Seismic Risk. In Energy from the Earth. Deep Geothermal as a Resource for the Future? VDF Hochschulverlag AG an der ETH Zürich: Zollikon, Switzerland, 2015; 54p. [Google Scholar]
  92. Dones, R.; Bauer, C.; Bolliger, R.; Burger, B.; Faist Emmenegger, M.; Frischknecht, R.; Heck, T.; Jungbluth, N.; Röder, A. Life Cycle Inventories of Energy Systems: Results for Current Systems in Switzerland and Other UCTE Countries; Ecoinvent report No. 5; Paul Scherrer Institut Villigen, Swiss Centre for Life Cycle Inventories: Dübendorf, Switzerland, 2007. [Google Scholar]
  93. Dormann, C.F.; McPherson, J.M.; Araújo, M.B.; Bivand, R.; Bolliger, J.; Carl, G.; Davies, R.G.; Hirzel, A.; Jetz, W.; Kissling, W.D.; et al. Methods to Account for Spatial Autocorrelation in the Analysis of Species Distributional Data: A Review. Ecography 2007, 30, 609–628. [Google Scholar] [CrossRef]
  94. Jungbluth, N.; Büsser, S.; Frischknecht, R.; Flury, K.; Stucki, M. Feasibility of Environmental Product Information Based on Life Cycle Thinking and Recommendations for Switzerland. J. Clean. Prod. 2012, 28, 187–197. [Google Scholar] [CrossRef]
  95. Frischknecht, R.; Althaus, H.-J.; Bauer, C.; Doka, G.; Heck, T.; Jungbluth, N.; Kellenberger, D.; Nemecek, T. The Environmental Relevance of Capital Goods in Life Cycle Assessments of Products and Services. Int. J. Life Cycle Assess. 2007, 12, 1–12. [Google Scholar]
  96. Mozzhegorova, Y.; Ilinykh, G.; Korotaev, V. Life Cycle Assessment of a Gas Turbine Installation. Energies 2024, 17, 345. [Google Scholar] [CrossRef]
  97. Lapteva, A.V.; Lisenko, V.G.; Chesnokov, Y.N. Carbon footprint of aluminum production when obtaining alumina using the Bayer process. In Proceedings of the XIV International Scientific and Practical Conference. Sistema Upravleniya Ekologicheskoi Bezopasnostyu, UrFU, Ekaterinburg, Russia, 20–21 May 2020; Volume 93, pp. 264–268. [Google Scholar]
  98. RUSAL. ALLOW. Available online: https://rusal.ru/clients/allow/ (accessed on 11 December 2024).
  99. Peppas, A.; Politi, C.; Kottaridis, S.; Taxiarchou, M. LCA Analysis Decarbonisation Potential of Aluminium Primary Production by Applying Hydrogen and CCUS Technologies. Hydrogen 2023, 4, 338–356. [Google Scholar] [CrossRef]
  100. Carbon Dioxide Emissions from Electricity. Available online: https://world-nuclear.org/information-library/energy-and-the-environment/carbon-dioxide-emissions-from-electricity (accessed on 11 December 2024).
  101. Hindalco’s Net Zero Goals Redefined: On Track to Meet Clean Energy Targets Before Estimated Time. Available online: https://www.alcircle.com/news/hindalco-s-net-zero-goals-redefined-on-track-to-meet-clean-energy-targets-before-estimated-time-107956 (accessed on 11 December 2024).
  102. Chalco. Social Responsibility and Environmental Social and Governance Report 2022; Chalco: Beijing, China, 2022; 92p, Available online: https://www.chalco.com.cn/en/tzzgxen/yjbgen/202012/P020201215366846409370.pdf (accessed on 11 December 2024).
  103. How to Understand the Carbon Footprint of Clean Hydrogen. Available online: https://www.weforum.org/stories/2023/03/understand-carbon-footprint-green-hydrogen/ (accessed on 11 December 2024).
  104. Kolahchian Tabrizi, M.; Famiglietti, J.; Bonalumi, D.; Campanari, S. The Carbon Footprint of Hydrogen Produced with State-of-the-Art Photovoltaic Electricity Using Life-Cycle Assessment Methodology. Energies 2023, 16, 5190. [Google Scholar] [CrossRef]
Figure 1. Structure of electric energy generation in the Russian Federation.
Energies 18 00014 g001
Figure 2. Carbon footprint of generated electricity (recommended source of information is highlighted in red) [7,9,10,11,12,14,15,16,82,84,87,89,90].
Energies 18 00014 g002
Figure 3. Comparative characteristics of the generation structure and carbon footprint of produced electricity.
Energies 18 00014 g003
Figure 4. Carbon footprint of aluminum and electricity consumed.
Energies 18 00014 g004
Figure 5. Carbon footprint of hydrogen versus carbon footprint of electricity.
Energies 18 00014 g005
Table 1. Comparative characteristics of the structure of generation of energy systems in Russia.
Energy SystemShare of Actual Installed Capacity of a Generating Facility, %
Nuclear Power PlantHydroelectric Power Plants and Pumped Storage Power PlantsThermal Power PlantRenewable Energy Sources
UES of Russia11.920.266.01.9
IES of North-West24.411.8 *62.90.8
IES of the Center27.33.669.1
IES of the Middle Volga14.525.259.30.9
IES of South14.723.349.912.1
IES of the Urals2.83.6 *92.70.9
IES of Siberia48.5 *50.80.8
IES of the East41.258.8 *
TITES2.048.7 *49.20.04
* only hydroelectric power station.
Table 2. Own generating capacities of companies in the Perm region.
Object NameCommissioning YearPowerEquipmentSource
PJSC «Uralkali», BKPRU-4200512.9 MW
(1 GTU)
4 GTU (Siemens SGT-400), waste-heat boilers (JSC Belenergomash)[63]
LLC «LUKOIL-Permnefteorgsintez», GTPP2012200 MW,
40 t/h (steam)
8 power units GTES-25PA (JSC «UEC-Aviadvigatel»), waste-heat boilers MZ (JSC «ZiO-Podolsk»)[64]
PJSC LUKOIL, GTPP «Chashkino»202016 MWGTU-16 (JSC «UEC-Aviadvigatel»), 4 synchronous turbogenerators of 4 MW each (OOO «Elektrotyazhmash-Privod»)[65,66]
JSC «Solikamskbumprom»201955 MW3 gas-piston units (Wartsila, Finland)[67]
JSC «SIBUR-Khimprom»20146 MW
(1 GTPP), 420 ths tons/year (steam)
3 GTES «Ural-6000» (JSC “UEC-Aviadvigatel”), 3 waste-heat boilers (JSC «Belenergomash»)[68]
Disclaimer/Publisher’s Note: The statements, opinions and data contained in all publications are solely those of the individual author(s) and contributor(s) and not of MDPI and/or the editor(s). MDPI and/or the editor(s) disclaim responsibility for any injury to people or property resulting from any ideas, methods, instructions or products referred to in the content.

