Article

Integrated Stochastic Approach for Instantaneous Energy Performance Analysis of Thermal Energy Systems

by
Anthony Kpegele Le-ol
1,
Sidum Adumene
2,*,
Duabari Silas Aziaka
3,4,
Mohammad Yazdi
5 and
Javad Mohammadpour
5
1
Department of Mechanical Engineering, Rivers State University, Port Harcourt P.M.B. 5080, Nigeria
2
Department of Marine Engineering, Rivers State University, Port Harcourt P.M.B. 5080, Nigeria
3
Center of Power & Propulsion, Cranfield University, Cranfield MK43 0AL, UK
4
Center for Multidisciplinary Research & Innovation (CEMRI), Abuja 904101, Nigeria
5
Faculty of Science & Engineering, Macquarie University, Sydney 2113, Australia
*
Author to whom correspondence should be addressed.
Energies 2025, 18(1), 160; https://doi.org/10.3390/en18010160
Submission received: 24 November 2024 / Revised: 24 December 2024 / Accepted: 28 December 2024 / Published: 3 January 2025
(This article belongs to the Section J: Thermal Management)

Abstract

:
To ascertain energy availability and system performance, a comprehensive understanding of the systems’ degradation profile and impact on overall plant reliability is imperative. The current study presents an integrated Failure Mode and Effects Analysis (FMEA)–Markovian algorithm for reliability-based instantaneous energy performance prediction for thermal energy systems. The FMEA methodology is utilized to identify and categorize the various failure modes of the gas turbines, establishing a reliability pattern that informs overall system performance. Meanwhile, the Markovian algorithm discretizes the system into states based on its operational energy performance envelope. The algorithm predicts instantaneous energy performance according to upper and lower bounds criteria. This integrated methodology has been subjected to testing in three case studies, yielding results that demonstrate improved reliability and instantaneous energy performance prediction during system degradation. It was observed that after 14 years of operation, the likelihood of major failures increases to 79.6%, 88.7%, and 82.8%, with corresponding decreases in system performance reliability of 10.1%, 4.5%, and 7.8% for the Afam, Ibom, and Sapele gas turbine plants, respectively. Furthermore, the percentage of instantaneous mean power performance relative to the rated capacity is 37.9%, 35.1%, and 46.3% for the three gas turbine plants. These results indicate that the Sapele thermal power plant performs better relative to its rated capacity. Overall, this integrated methodology serves as a valuable tool for monitoring gas turbine engine health and predicting energy performance under varying operating conditions.

1. Introduction

The trend of the increasing use of technology in the energy and power industries has influenced the development of high-performance gas turbine systems [1]. The intent of which is to maintain and/or increase efficiency and performance, which subsequently induces additional fuel cost and maintainability challenges. Most importantly, the material response and survivability of gas turbine power plants under high-temperature regimes have not been comprehensively understood. In such a harsh (high temperature) operating environment, material degradation/deterioration plays a critical role in the plant components′ reliability and performance for the period under consideration. While certain criteria can be considered during the initial design phase of the infrastructure, it is essential to acknowledge that the system’s performance and responses can exhibit significant diversity throughout the operational cycle of a power plant. Specifically, in the demanding context of a gas turbine power plant, it becomes imperative to accurately capture and account for the dynamic variations and variability in material composition within the harsh operational environment. This meticulous consideration is vital for conducting a comprehensive and robust analysis of subsystem performance and reliability [2,3]. Also, complexity and dependency exist among critical subsystems that result in common cause failure or shock-induced failures among subsystems. The reviewed research literature shows that there is a limited understanding of the correlation of the gas turbine system’s performance with the subsystem’s reliability state [4]. This could be a result of the complex interdependencies and stochastic nature of the degradation-induced failure characteristic of the subsystems. There is a need to characterize the system’s performance in terms of mechanical degradation for reliability-based integrity management and energy performance analysis.
The current study presents an approach that integrates the FMEA with the Markovian algorithm for reliability-based energy performance analysis of gas turbine plants under degradation. The FMEA identified and classified the failure factors in the gas turbine plants. The identified failure modes are then mapped to define the performance state of the plants to indicate the failure propagation during operations. The performance states are structured and evaluated based on the initial state and transition probability matrix. The Markovian approach analyzes the effects of the state transition on the overall gas turbine system performance. The integrated approach is tested on gas turbine plants in tropical rainforests in Africa. The approach provides a better performance analysis, which is able to clearly deduce instantaneous energy output profiles for the systems under degradation. The application of the proposed approach provides condition monitoring tools for sustainable energy performance and optimum integrity management of the asset.

2. Overview of Gas Turbine Systems Analysis

Gas turbine power systems are subjected to a high-temperature operating environment. The harsh operating environments could create multiple failure tendencies and complexity, making it difficult to predict the system’s performance. The occurring failure modes/scenarios could have an economic and developmental impact with considerable financial losses. This mostly results in a loss of energy production and high downtime due to system breakdown. The functionality of a system can be described by its reliability. Several studies have been conducted to understand the performance of gas turbine systems and energy generation in the open-source literature [2,3,4,5,6,7,8,9]. Several different techniques have been proposed for reliability-based system analysis. These can be grouped into qualitative, quantitative, dynamic quantitative, and stochastic models and shall be examined in the following sections.

2.1. Reliability Approach for Gas Turbine Systems

A reliability analysis can be performed for different gas turbine systems and components, such as mechanical, electronic, electrical, and software components, at various stages of the engineering process. This is vital from the design stage to the operational phase of the gas turbine project. The FMEA approach captures various causes of failure by containing the common cause factors in a systemic structure, allowing for a reliability prediction [10]. Also, the different failure causes, events, hazards, faults, effects, and consequences associated with the infrastructure are identified. This shows the system’s structural interactions and performance functions, considering external factors, such as those experienced in high-temperature energy systems. The use of sheet-based, table-based, and diagram-based qualitative reliability methods to characterize system health states has been presented in the literature [10,11,12,13,14].
For instance, Katsavounis et al. [15]. and Scheu et al. [16] proposed the sheet-based approach checklist to determine and identify failure-influencing factors in the design, operation, and maintenance of energy power plants. The checklist provides a set of questions for reliability engineers and system operators for hazard identification to gather the facts on critical contributing parameters. Lazakis and Kougioumtzoglou [17] applied Hazard Identification (HAZID) and Failure Mode Effect Analysis (FMEA), as well as the Bayesian Network, in their failure analysis studies for an energy system; the probability of failure, as well as the annual cost with or without failure, was clearly analyzed. Similarly, Sharma et al. [18] proposed the use of FMEA for failure mode analysis of an aircraft gas turbine system. The FMEA was applied to grade the severity of all potential failure modes and for design improvement. The authors demonstrated the application of the FMEA on the rotor support system and identified poor welds, seals, or connections; chemical impurities in metal; voids, cracks, thin spots, or coatings; dirt or contamination on surfaces or in materials; incorrect positioning of the part; and design errors are common causes of early failure in gas turbine rotor support systems.
Several quantitative tools have been proposed to capture the likely failure modes and their effects on the mechanical systems’ reliability/performance [19,20,21,22,23]. Kappas [23] presents a review that focuses on the use of probabilistic methods for reliability analysis of gas turbine components failures. The author carried out a statistical failure analysis based on the component’s failure data over time by using a probability distribution. This is used to accurately predict the probability of occurrence of the given failure modes/components of the gas turbine systems.
A further methodology that experimentally and deductively represents the root cause of failures in the gas turbine system has been demonstrated [3,9,21,24]. Kolagar et al. [3] analyzed turbine failure due to the degradation of the blade. Bai [25] proposed the hybrid analytic hierarchy process (AHP) and fault tree technique for the reliability analysis of gas turbine components. This hybrid methodology captures the complexity of the fault based on the AHP criteria framework. The AHP establishes a pairwise comparison matrix for the criticality of the subsystems as it affects the functionality of the overall plant. The hierarchy structure is mapped into the fault tree for a quantitative analysis. However, the models could be limited for higher order complexity and with associated high degree of uncertainty. The stochastic nature of the failure characteristics of gas turbine components has not been fully studied yet.

2.2. A Stochastic Approach for Gas Turbine Systems’ Reliability

The failure characteristics of critical gas turbine systems could be space- and time-dependent. This could be a result of the causative failure factors mechanism. For instance, the corrosion mechanism, which is a failure-induced factor, presents an unstable phenomenon that could be difficult to predict. Also, the failure state of the subsystems can be represented using a multi-stage approach in which a soft failure (partial failure or pseudo-operational state) is presented [26]. In recent times, Jiang et al. [26] have demonstrated the Markov process’s applicability for the prediction of the reliability of gas turbine subsystems. The Markov process is a state–space methodology that represents the failure rate as the rate of the transition of one component from a functioning state to a degraded state and to a failed state for three-state systems. The authors further integrate the Markov process with reliability importance indices for component priority determination. This was evaluated based on Birnbaum’s measurement indices. The approach shows a capacity for the stochastic modelling of the gas turbine systems; however, the correlation of the characterized state with power output performance was not considered. Limited studies exist in the open-source literature that have characterized the performance output with the reliability state of the gas turbine mechanical subsystems. There is a need to quantitatively correlate the mechanical systems’ reliability with the plant’s performance output, considering interdependencies among gas turbine subsystems.
The current study presents the development of an integrated FMEA–Markovian approach for instantaneous energy performance predictions for gas turbine plants under degradation.

3. Methodology

This section presents the developmental steps used to create an integrated energy-based stochastic model for the prediction of a gas turbine power plant’s reliability and energy performance, as shown in Figure 1. The approach’s development begins with defining the plant’s systems and their subsystem performance and identifying the systems’ likely failure modes. The following steps briefly describe the model development process.
Step 1: The plant under study is defined based on its system and subsystem performance states, functionality, and health state based on degradation data for elements such as fuel systems, generator systems, combustion systems, shafting systems, cooling systems, etc. This also includes identifying the likely failure modes of the systems and their subsystems using FMEA and developing a logical relationship among the failure-causative parameters.
Step 2: The various plant performance dataset is collected. This includes, but is not limited to, failure data, repair/maintenance data, reliability, and manufacturer’s data. The data are used to estimate the failure rate of the various subsystems statistically, as well as the mean time between failures, mean time to failure, and mean time to repair. When one considers multi-state system (MSS) evolution in the space of states during a system operation period T, the following random variables may be of interest:
Time to failure, T f is the time from the beginning of the system’s life up to the instant when the system first enters the subset of unacceptable states.
The time between failures, T b is the time between two consecutive transitions from the subset of acceptable states to the subset of unacceptable states.
Number of failures, N T , is the number of times the system enters the subset of unacceptable states during the time interval [0T].
Equations (1)–(3) show the mathematical relations for the highlighted parameters’ prediction.
M e a n   t i m e   t o   f a i l u r e   M T T F = λ 1
For multi-state systems, the MTTF can also be the cumulative time during which the process remains in each state where j > i, such that
M T T F i = j = i + 1 k 1 λ j , j 1
M e a n   t i m e   t o   r e p a i r   M T T R = μ 1
where λ and μ are the failure rate and repair rate, respectively.
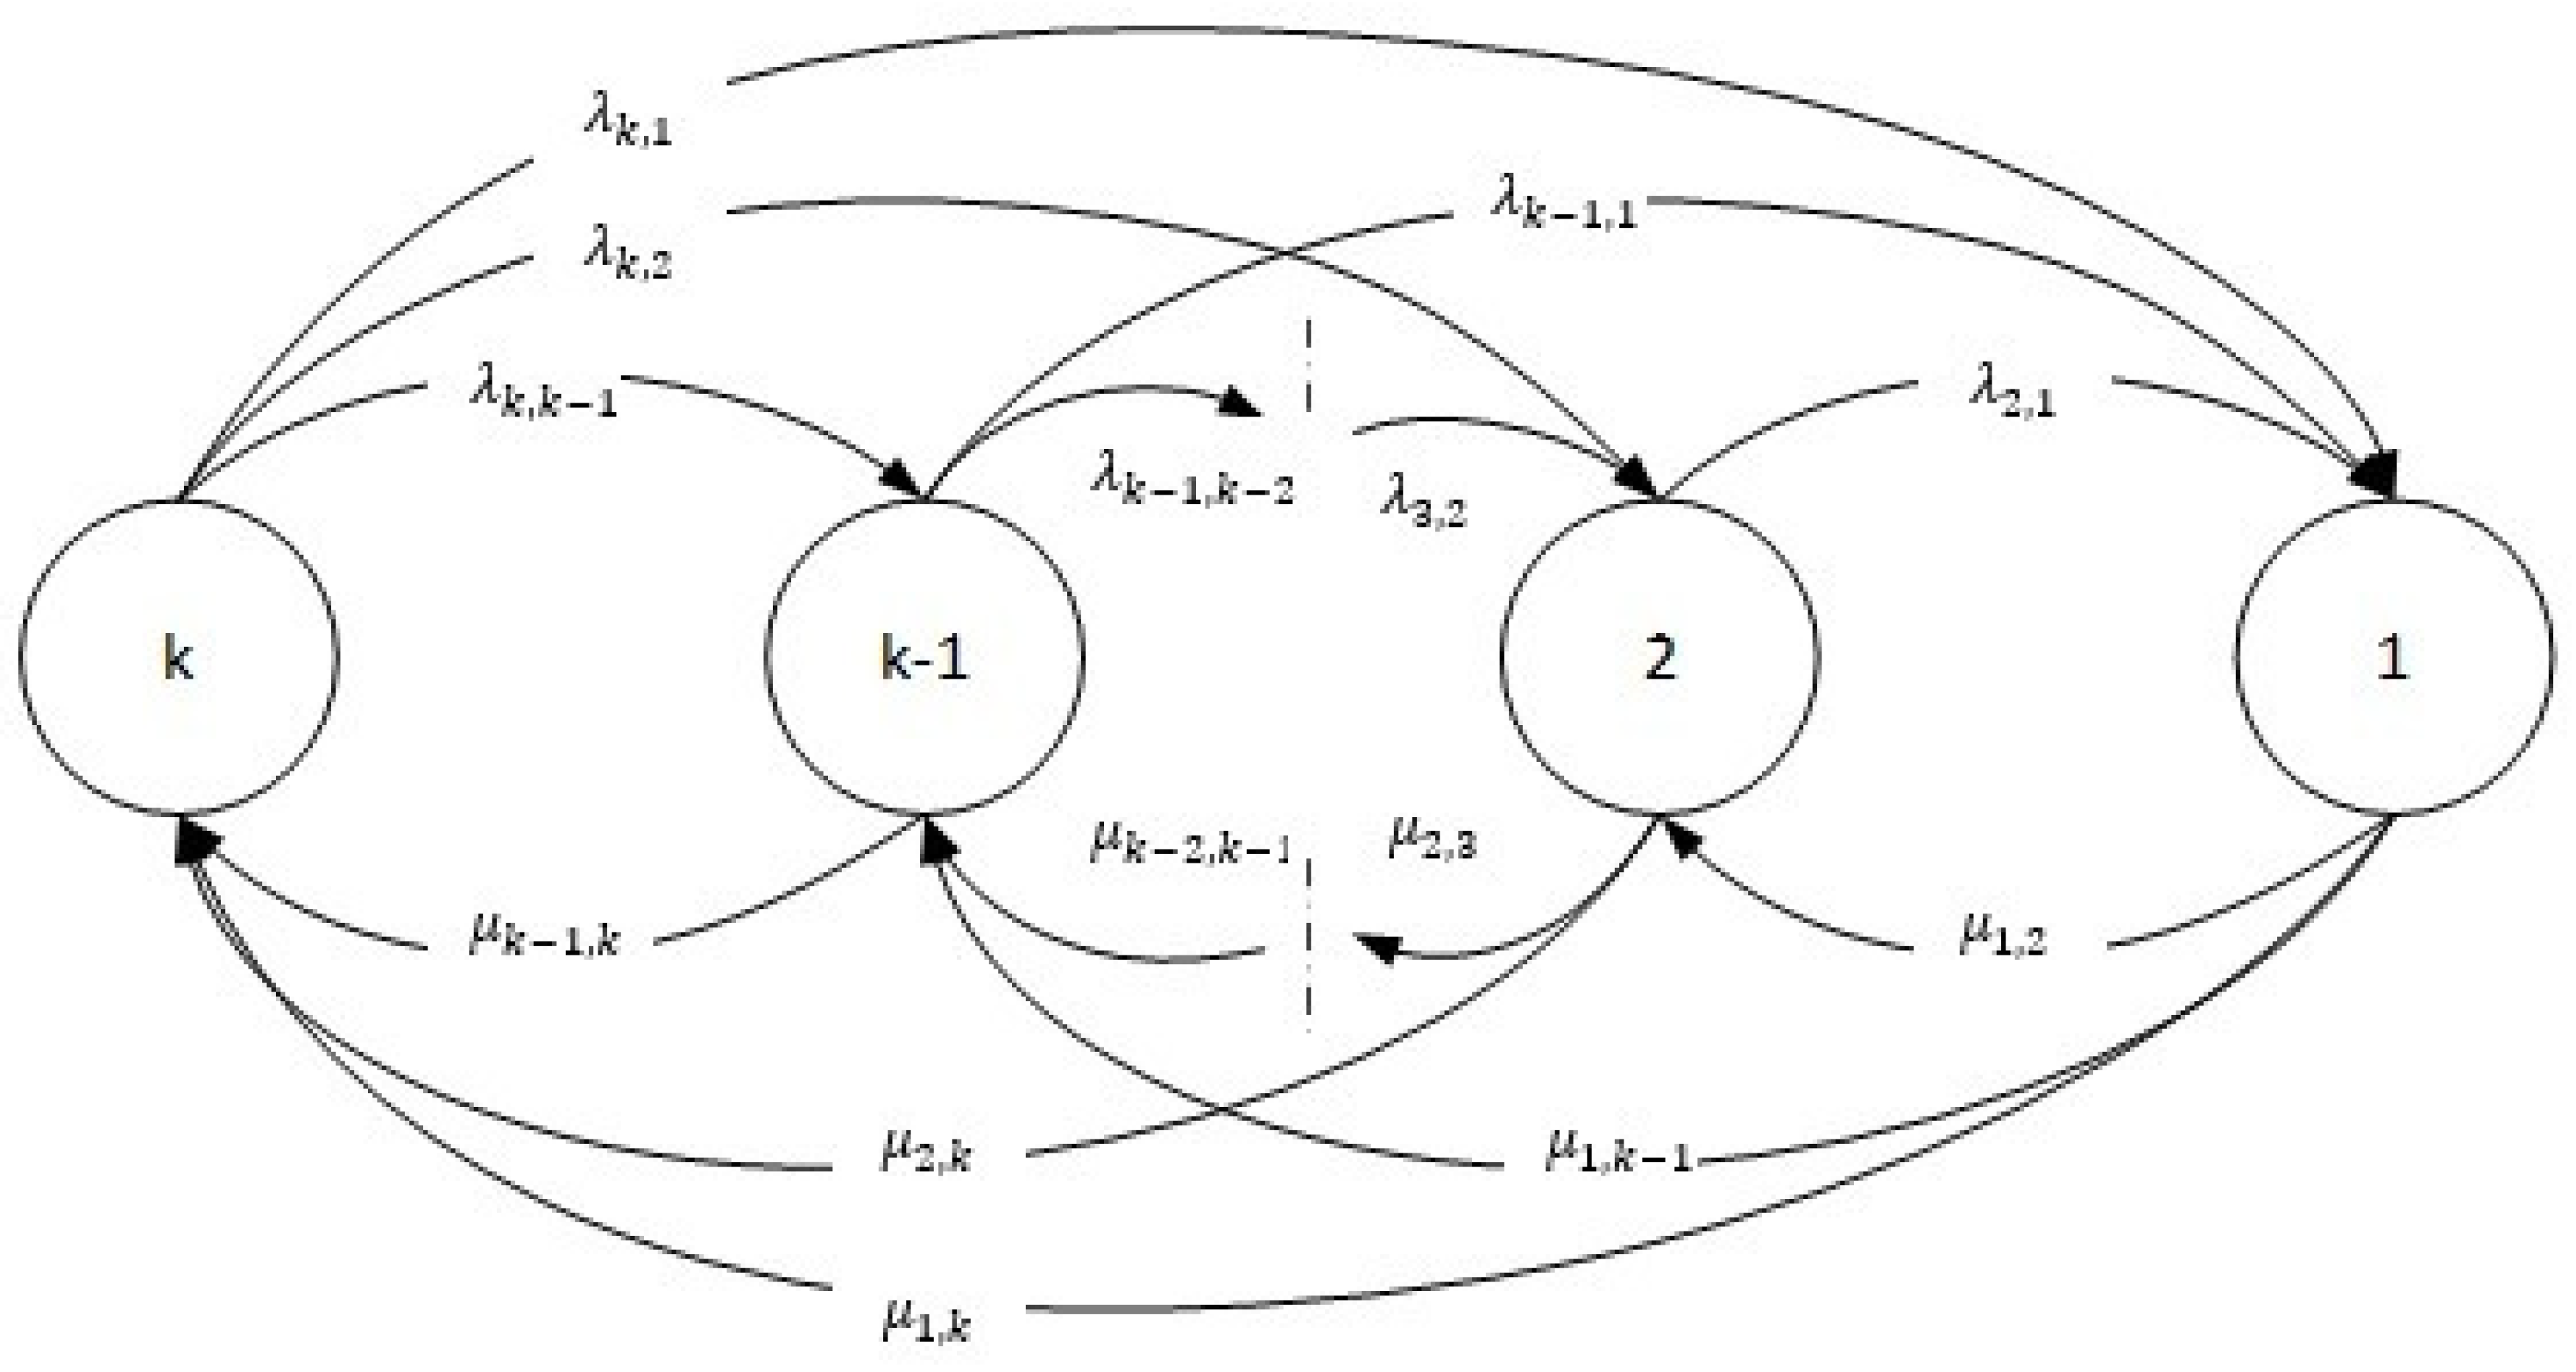
For the multi-state elements, the system and sub-systems are discretized into states that characterize the degradation process of the system. This represents the state of soft/minor failures as the elements transit from an operational to a degradable state. For any element in the system designated j , there is k j different states with corresponding performance rates based on the energy or exergy analysis of the plant. This is represented by g j = g j 1 , g j k j based on the Markovian stochastic process. However, the current state of the element j and the values of the element of the performance rate (net power output) G j (t) at any instant time t are randomly distributed. The performance rate of the element G j (t) can take values from g i : G j ( t ) ϵ g j . When mapping the system performance to the degradation state of the subsystems, the element evolution in the state space is used as a performance degradation criterion to characterize the stochastic process G ( t ) t 0 . The intensity of the state transition from state i to state i 1 is λ i , i + 1 , i = 2 , . , k . But, for repairable systems, the repair rate ( μ j , j + 1 ) is factored into the transition process considering minor or major repairs via a restoration profile, as shown in Figure 2.
Step 4: To evaluate the transition probability matrix, the prior state of the mechanical system and subsystems are defined. This defines the initial state of the system at the start of operation. It is represented by Equation (4). The generator matrix describes the state transition intensity (failure and repair rates) for the system elements under consideration. Equation (5) is based on the Kolmogorov set of differential equations for a system element with three state spaces to evaluate the transition across the states. Equation (6) shows the transition probability matrix.
π = π 1 π 2 : : π N
π T A = ( ( π T A ) 1 , π T A N ) , with elements, π T A j = i = 1 N π i a i j
d P 3 ( t ) d t = λ 3,2 + λ 3,1 P 3 t + μ 2,3 P 2 t + μ 1,3 P 1 t d P 2 ( t ) d t = λ 3,2 P 3 t λ 2,1 + μ 2,3 P 2 t + μ 1,2 P 1 t     d P 1 ( t ) d t = λ 3,1 P 3 t + λ 2,1 P 2 t μ 1,2 + μ 1,3 P 1 t                
where π is the prior probability distribution of the system states given as 1 0 0 when the system is fully operational. P 1 , . ,   P 3 are the transition probabilities for the four-state element. Initially, the system had P 3 0 = 1 ,   P 2 0 = P 1 0 = 0 . Table 1 shows the transition profile based on the three states (operational, minor failure, and major failure) in the system’s performance.
T r a n s i t i o n   p r o b a b i l i t y   m a t r i x   =   A   =   a i j = P 11 P 12 P 1 m P 21 P 22 P 2 m P m 1 P m 2 P m m
Step 5: The evaluated transition probability from step 4 is used as an input to predict the system’s element reliability state. Based on this result, the system reliability can be predicted using Equation (7) [28]. This can also be mapped to the possible performance level of the gas turbine plant. For instance, assume the possible performance level of the plant based on the power output as g k m , g k p , g k o , , the system element means that an instantaneous performance occurs at time t , and E t can be predicted using Equation (8).
T h e   s y s t e m   e l e m e n t   r e l i a b i l i t y   f u n c t i o n   R i t = 1 P 1 t = j = i + 1 k P j t
E t = k = 1 3 g k P k t = g k o P 3 t + g k p P 2 t + g k m P 1 t
Therefore, in a different instance, the system’s reliability based on the energy output performance could be predicted and used to develop a profile for integrity-related decision-making. Three energy performance criteria are formulated for the analysis, as shown below. Upper and lower bounds for the energy demand can be generated based on the g k values to develop a mean instantaneous energy generation profile using Equation (8). The approach of mapping the thermal plant system’s health with performance using Markovian process modelling has been demonstrated by Lisnianski et al. [29] and is based on the operational performances of the selected plants.
For a fully operational state: 80   MW   <   g k o     160   MW .
For a partial/minor failure or loss state: 20   MW   <   g k p     80   MW .
For a major failure: 0   MW   <   g k m     20   MW .

4. Methodology Implementation

The developed Markovian stochastic process was tested on three gas turbine power plants operating in the tropical rainforest. The first plant is an ALSTOM GT-I3E2 manufactured by ALSTOM, Saint-Quen-sur-Seine, France, and has an installed capacity of 180 MW (base load 160 MW). The ALSTOM GT-13E2 operates on a simple Brayton cycle. The main mechanical components include a five-stage turbine, a 21-stage axial compressor mounted on the same shaft, and a single annular ring coiled counter flow combustion chamber placed in between the compressor and the turbine. The second plant is a GE-Frame 9/PG9161 (E), manufactured by General Electric, Louisville, KY, USA, with three (3) units and a total installed capacity of 191 MW (unit 1 with 38 MW, unit 2 with 38 MW, and unit 3 having 115 MW). In the period referred to in this study, only phase one and unit 3 (GTG-3) with 115 MW installed capacity were operational, exporting an average of 2400 MWH per day to the national grid. The GE-Frame 9/PG9161 (E) is a single-shaft gas turbine operating on a simple Brayton cycle with a three-stage axial flow turbine, a seventeen-stage axial flow compressor mounted on the same shaft, and a can-annular type combustion chamber. The third plant has four (4) Gas Turbine Generating Units of 112.5 MW capacity each, totaling 450 MW. It is a GE Frame 9E (GE FRAME PG9171E) manufactured by General Electric, Louisville, KY, USA, a simple-cycle operation plant with provision for future conversion into a combined-cycle plant. The GT is a single shaft, three bearing heavy duty industrial unit with a 17–stage axial flow compressor, can-annular type combustor and a 3-3-stage axial flow turbine. The environmental conditions show that the relative humidity varies between a minimum of 70% and a maximum of 90%, and power plants mostly operate at average temperature of 28 °C in the Niger Delta, although most power plants installed in the Delta are designed for 15 °C ISO conditions. Field operational and components’ failure and maintenance data were collated from log sheets kept in the control rooms of the plants and direct measurements from the human–machine inter-phase (HMI) from the various GT plants. Ten years’ worth of data were collected from the plants for analysis. The key information and parameters include inlet (ambient) and exit temperatures and the pressures of the different components of the gas turbine engine (compressor, combustor, and turbine), air, fuel, and exhaust gas flow rates, and overall operational management strategy. The specific fuel consumption, work output, power output, and pressure ratio were calculated using standard thermodynamic relations. These data were used as the input data, and the analysis results (output) are shown in Section 5.

5. Results and Discussion

The research objective was to develop a reliable methodology for reliability-based system performance prediction for energy generation over time, given the health state of the plant subsystems.

5.1. Failure Modes Analysis of Plants’ Performances

A failure assessment technique was adopted to assess the plants’ functionality in view of the design performance. The Failure Mode and Effect Analysis (FMEA) explored the system subsystem performance, their failure characteristics, and the common causes of failure in the overall turbine plant for critical decision-making. The FMEA was applied to grade the severity of all potential failure modes and for design improvement. The results of the FMEA on the compressor, combustion, rotor support system, turbine, and generator are shown in Table 2.
To further assess the health state of the plants (i.e., the Afam gas turbine plant, Ibom gas turbine plant, and Sapele gas turbine plant, respectively), the mean time to failure, which is a reliability measurement parameter, was evaluated. The mean time to repair, characterized by the plant’s maintenance strategy, was evaluated, as shown in Table 3a–c, for the Afam gas turbine plant, Ibom gas turbine plant, and Sapele gas turbine plant, respectively. The failure rate and repair rate for the plant subsystems were predicted and used to model the formulated Markovian stochastic approach.

5.2. State Probabilities Prediction Under Different Plants’ Performance

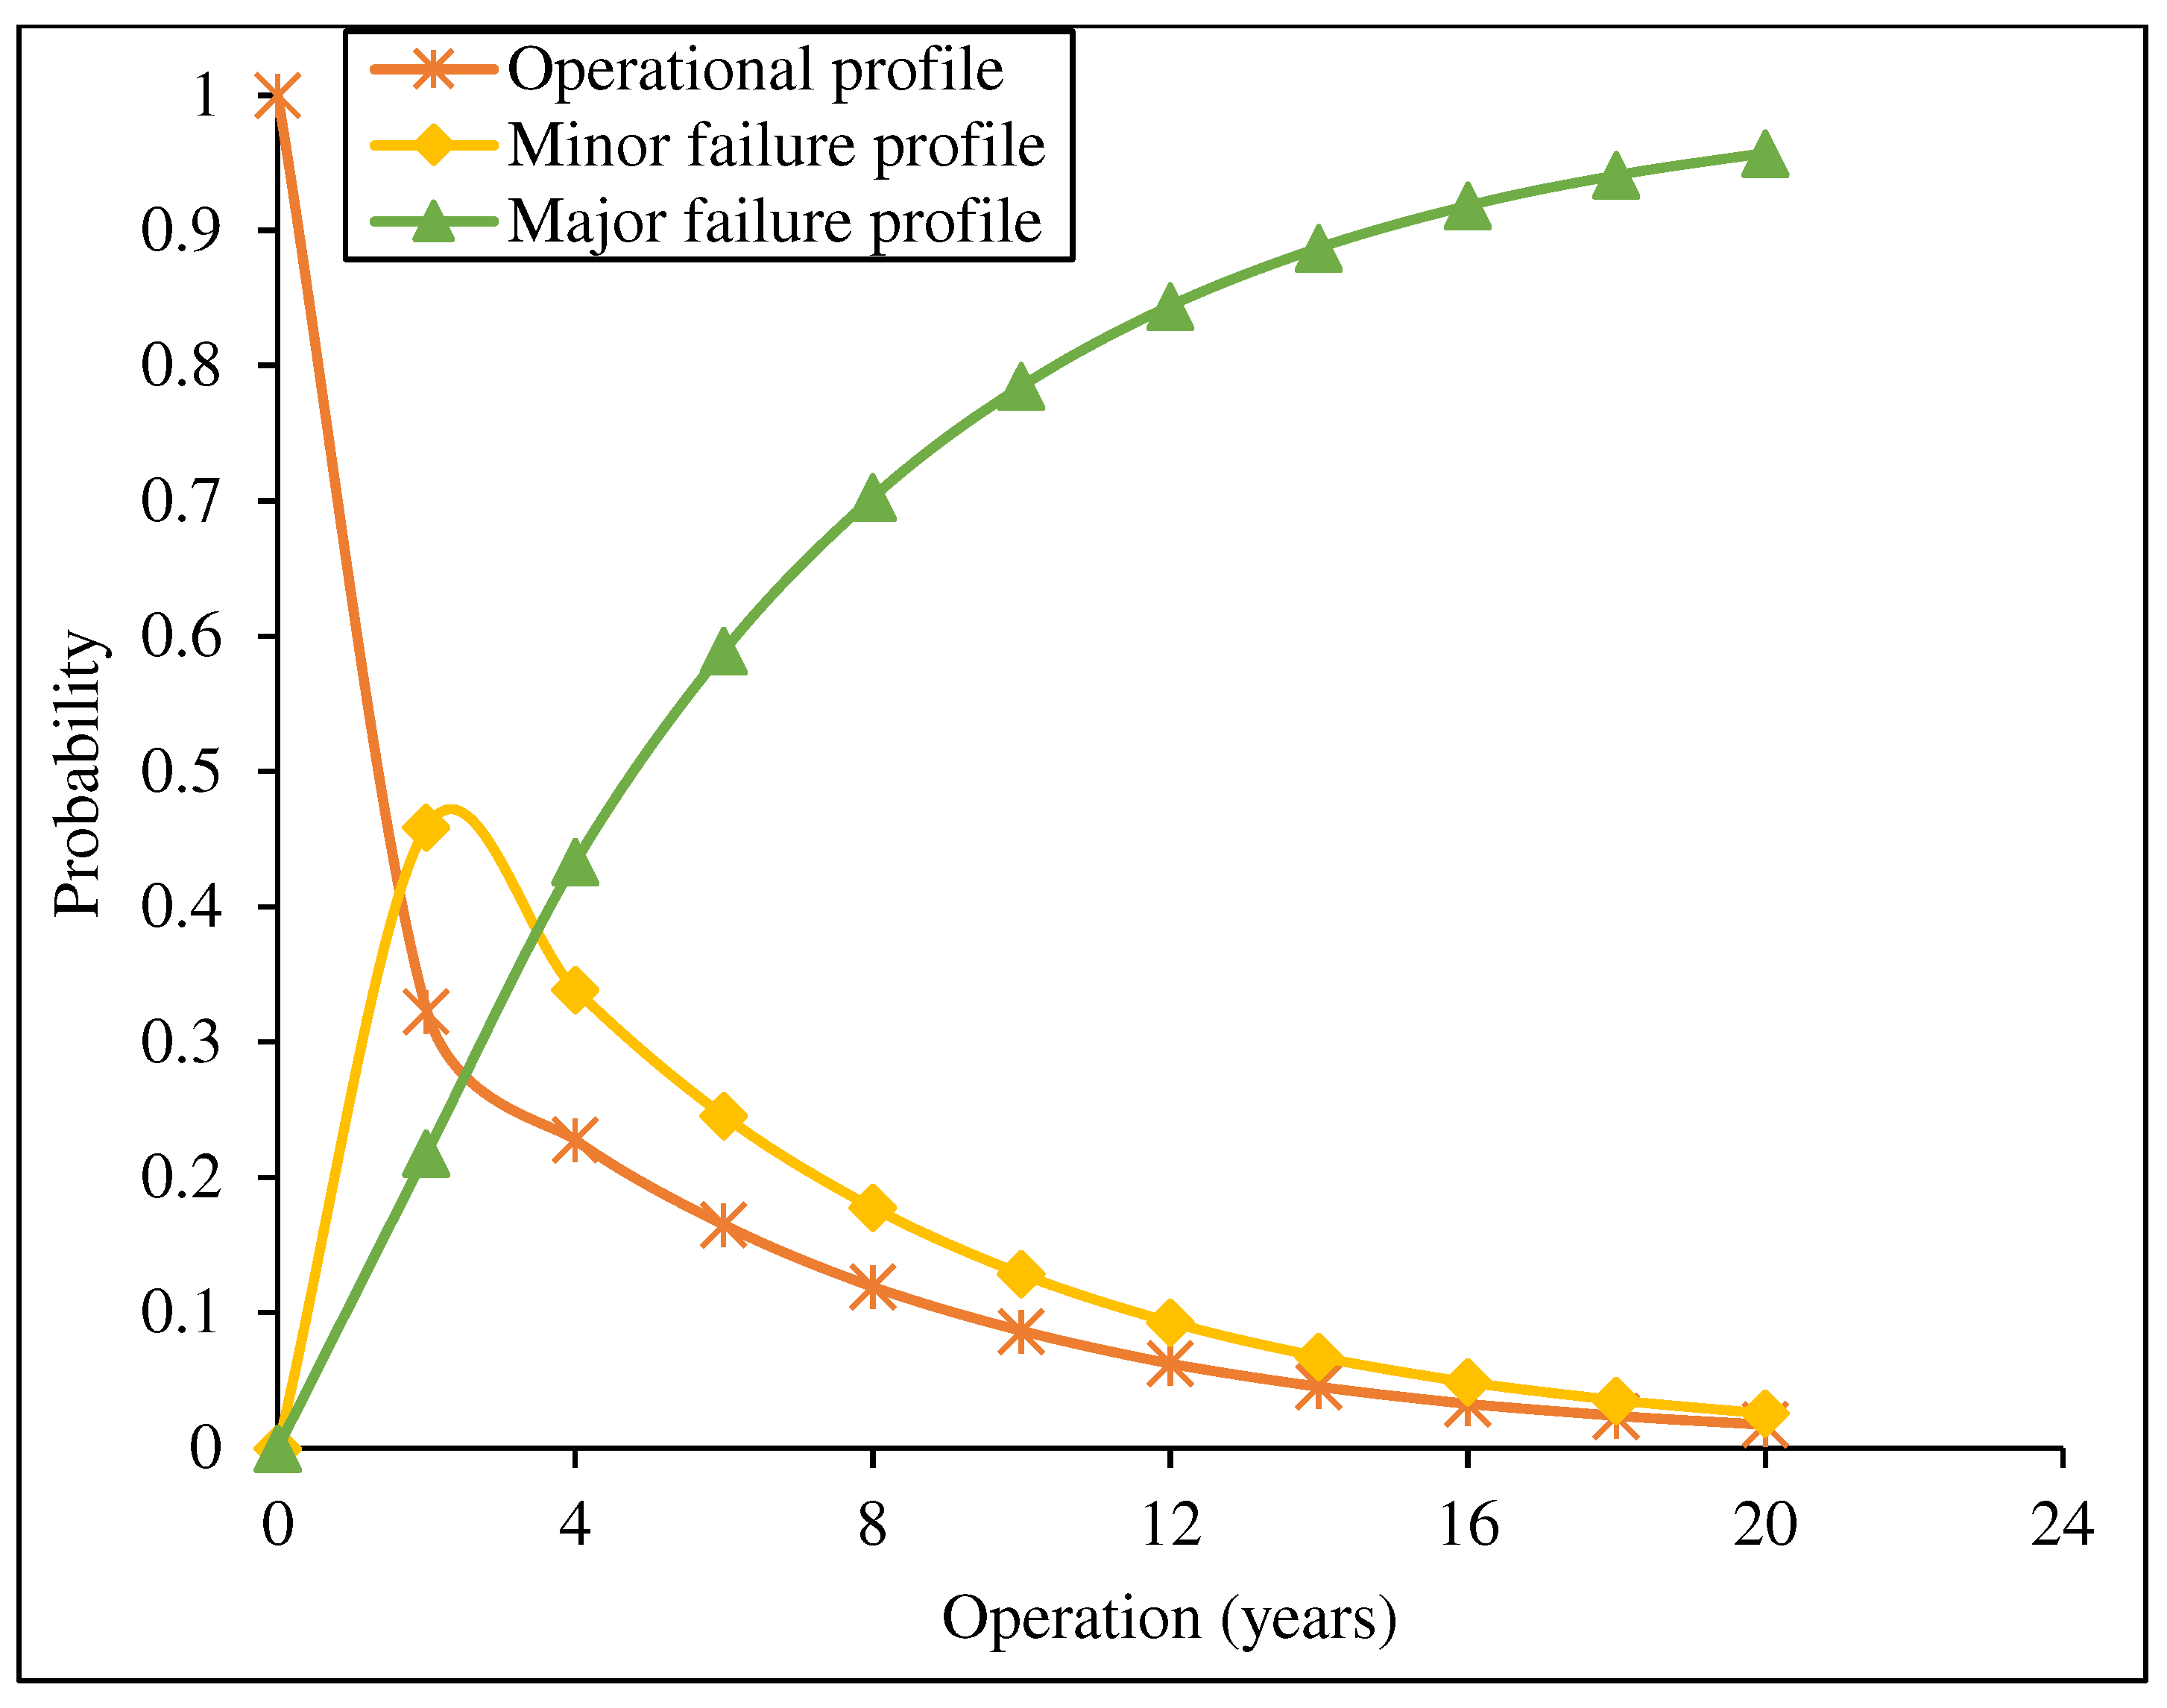
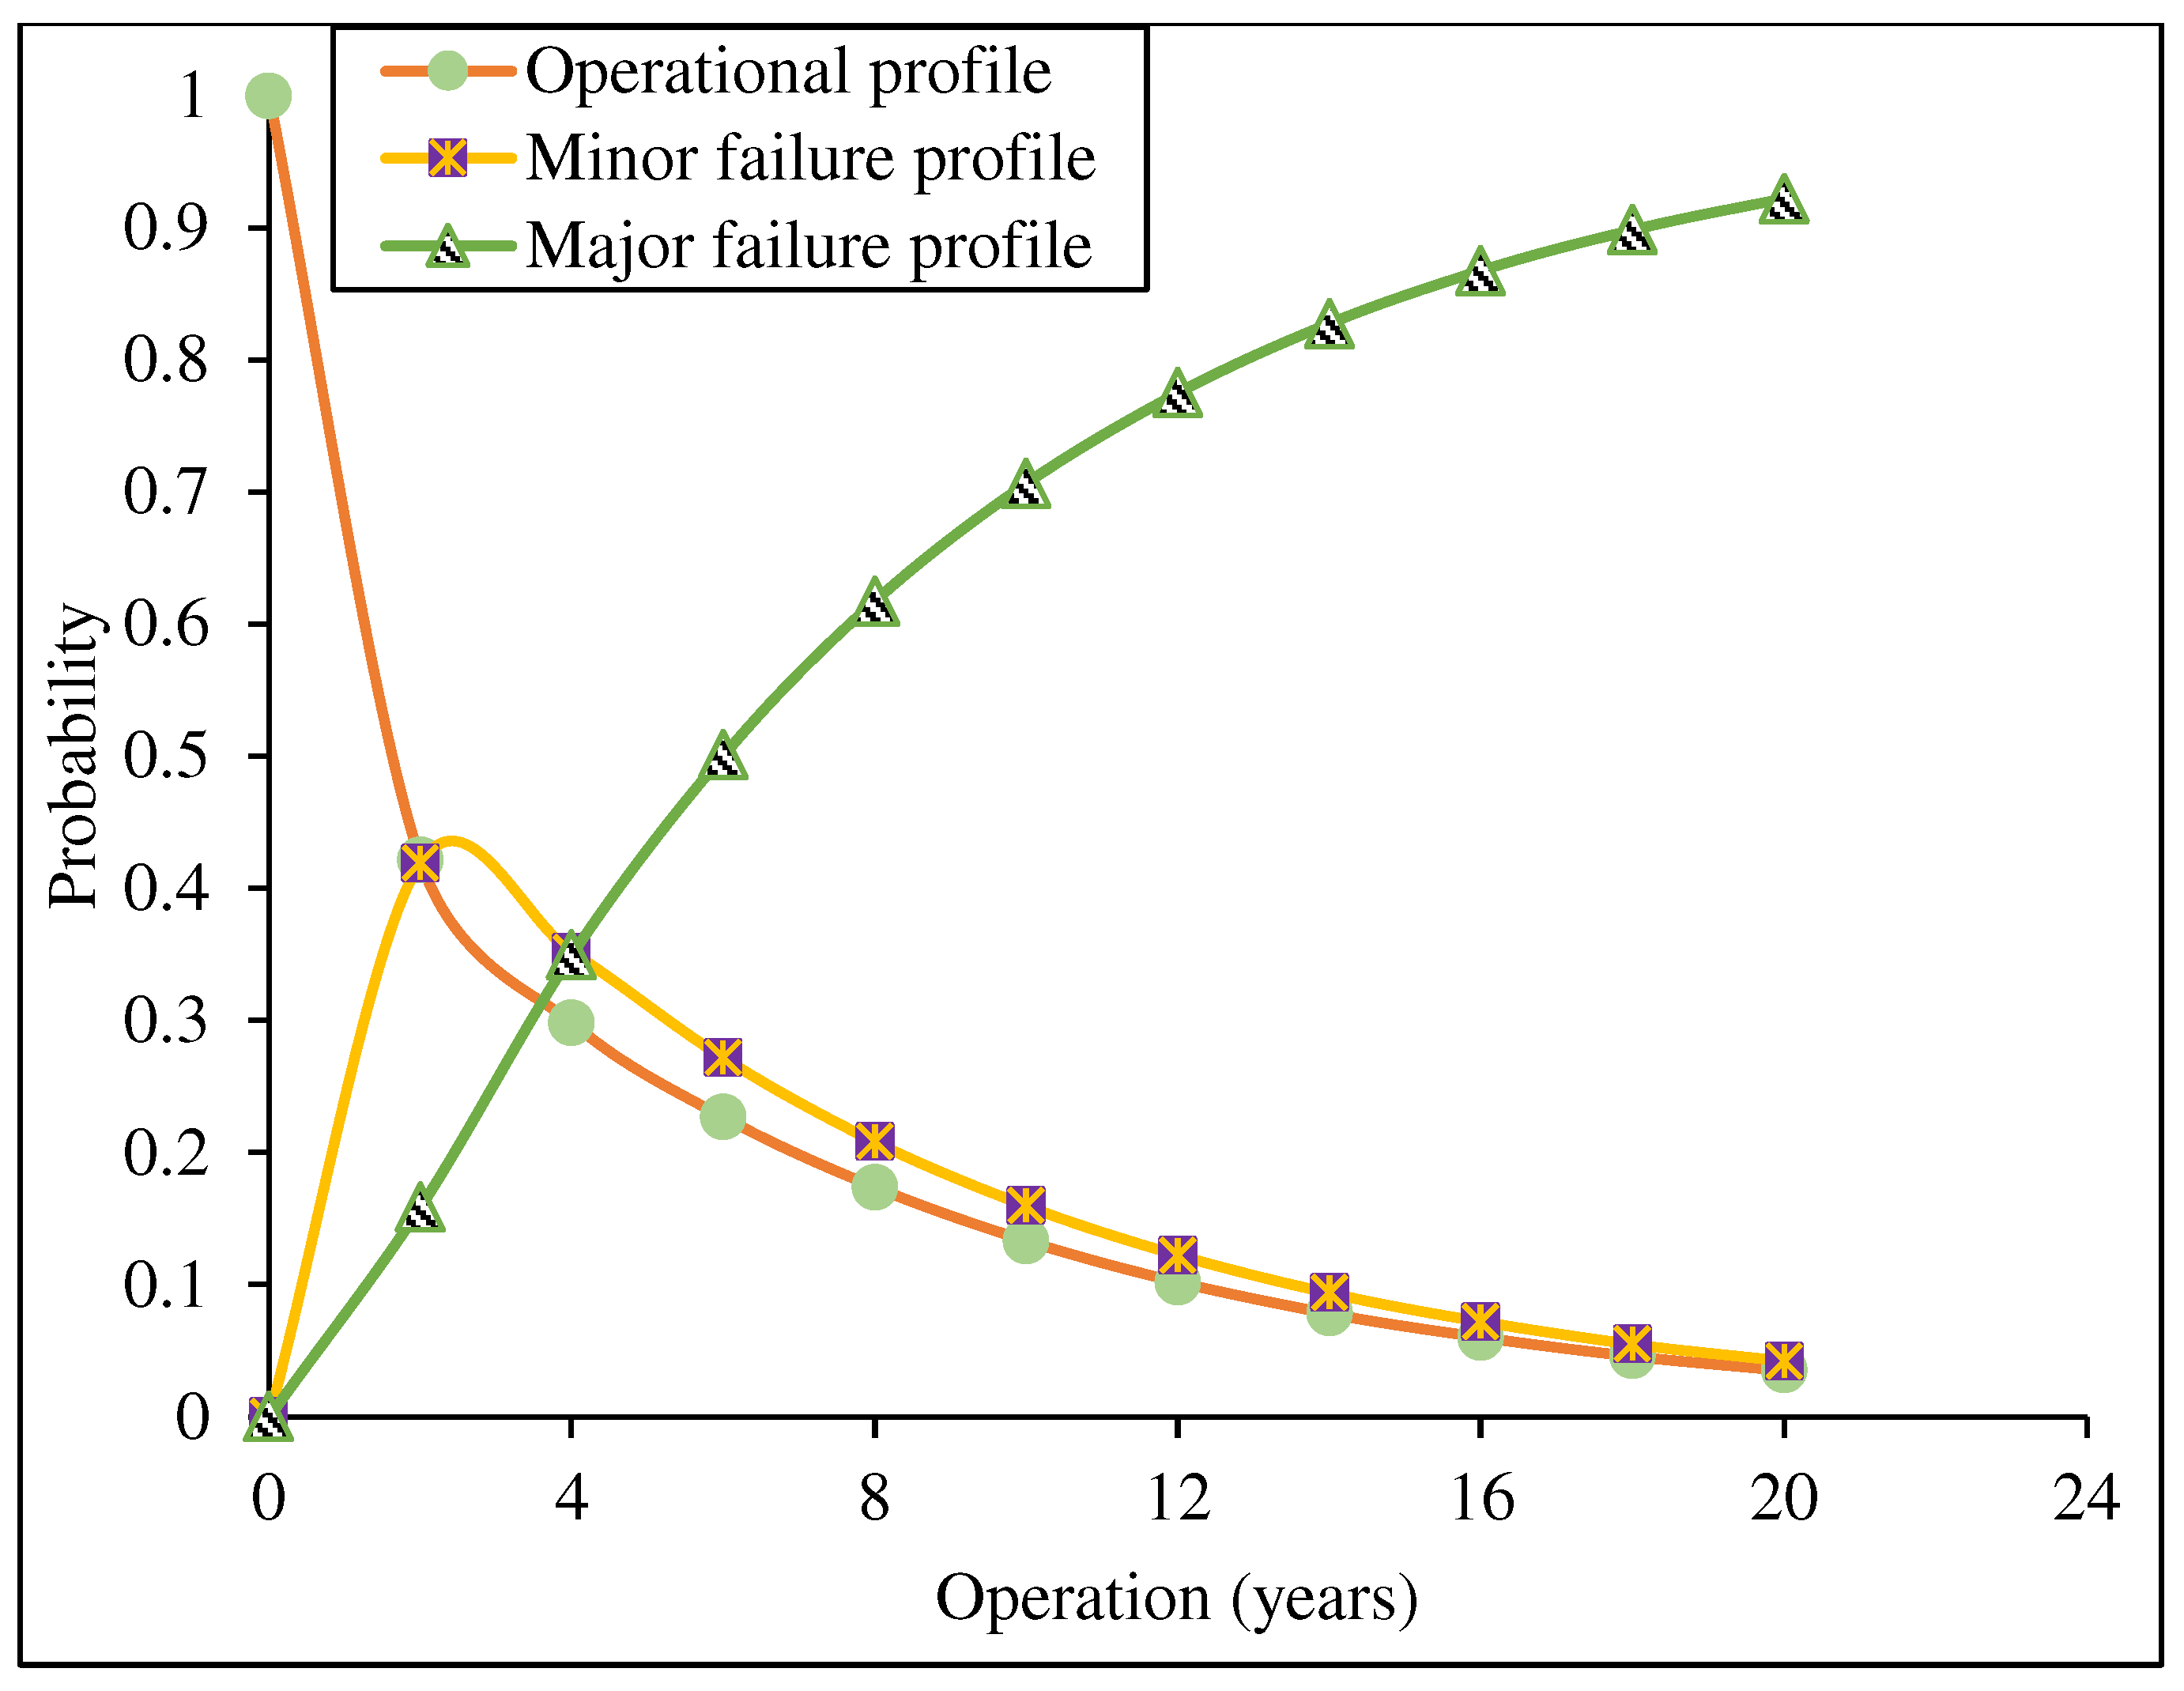
The predicted failure rate and the repair rate for the gas turbine were deduced from the failure and repair data and used to characterize the plant’s transition states for the prevailing operation condition. The mean time to failure is a reliability function that can be estimated given the failure rate for the period under consideration. The maintainability of the plant with respect to optimum energy generation and plant availability can be deducted based on the results for the three gas turbine plants. For the Afam Gas Turbine Plant, the transition rate, as shown in Figure 3, indicates the likely stochastic change in the plant behaviour with time to the point of total failure under an imperfect maintenance strategy. Similarly, Figure 4 and Figure 5 show the performance state transition for the Ibom gas turbine and Sapele turbine plants, respectively.
The result of the prediction of the plant performance based on the estimated state probability for the operational, minor failure and major failure profiles are presented in Figure 3. Based on the existing maintenance strategy for the power plant, the predicted state transition for fourteen (14) years of operations gives a likely state probability of 79.6% for the major failure state for the Afam gas turbine plant. The major failure based on the FMEA can be attributed to the turbine blade damage, axial shaft bearing damage and rotor bearing failure. The complex failure mechanism of the gas turbine is due to interdependencies among the sub-systems. The power generation and investment sustainability are a function of the plant’s health state and availability for the period under consideration.
After fourteen (14) years of operation of the Ibom and Sapele gas turbine plants, the plant performance state indicates an 88.7% and 82.8% likelihood of a major failure, respectively, as shown in Figure 4 and Figure 5. The essence of this method is to predict the system state performance given the plant operating and maintenance strategy and how these health state probabilities will impact the overall energy generation with time.
The results indicate a progressing decline in the reliability of the gas turbine system, which reflects the effect of the degradation of the component over time. The health state profiles give a true representation of the state’s performance. To further monitor the plant performance, the reliability is estimated after fourteen (14) years of operation for the three power plants, respectively. The results show a 10.1%, 4.5%, and 7.8% decline in the system performance reliability for the Afam, Ibom and Sapele gas turbine plants, respectively. The key performance indicators for condition monitoring can be updated based on the result analysis to sustain system performance and energy efficiency. One such indicator is the application of a proactive integrity management strategy for optimizing system maintenance.
The current study demonstrates the novel application of an integrated stochastic Markovian approach for the assessment of the system reliability and energy performance of gas turbine power plants. The results of the instantaneous energy generation prediction, given the state of the plants and the state probabilities, are detailed in the subsequent Section 5.3.

5.3. Instantaneous Energy Performance Under System Degradation

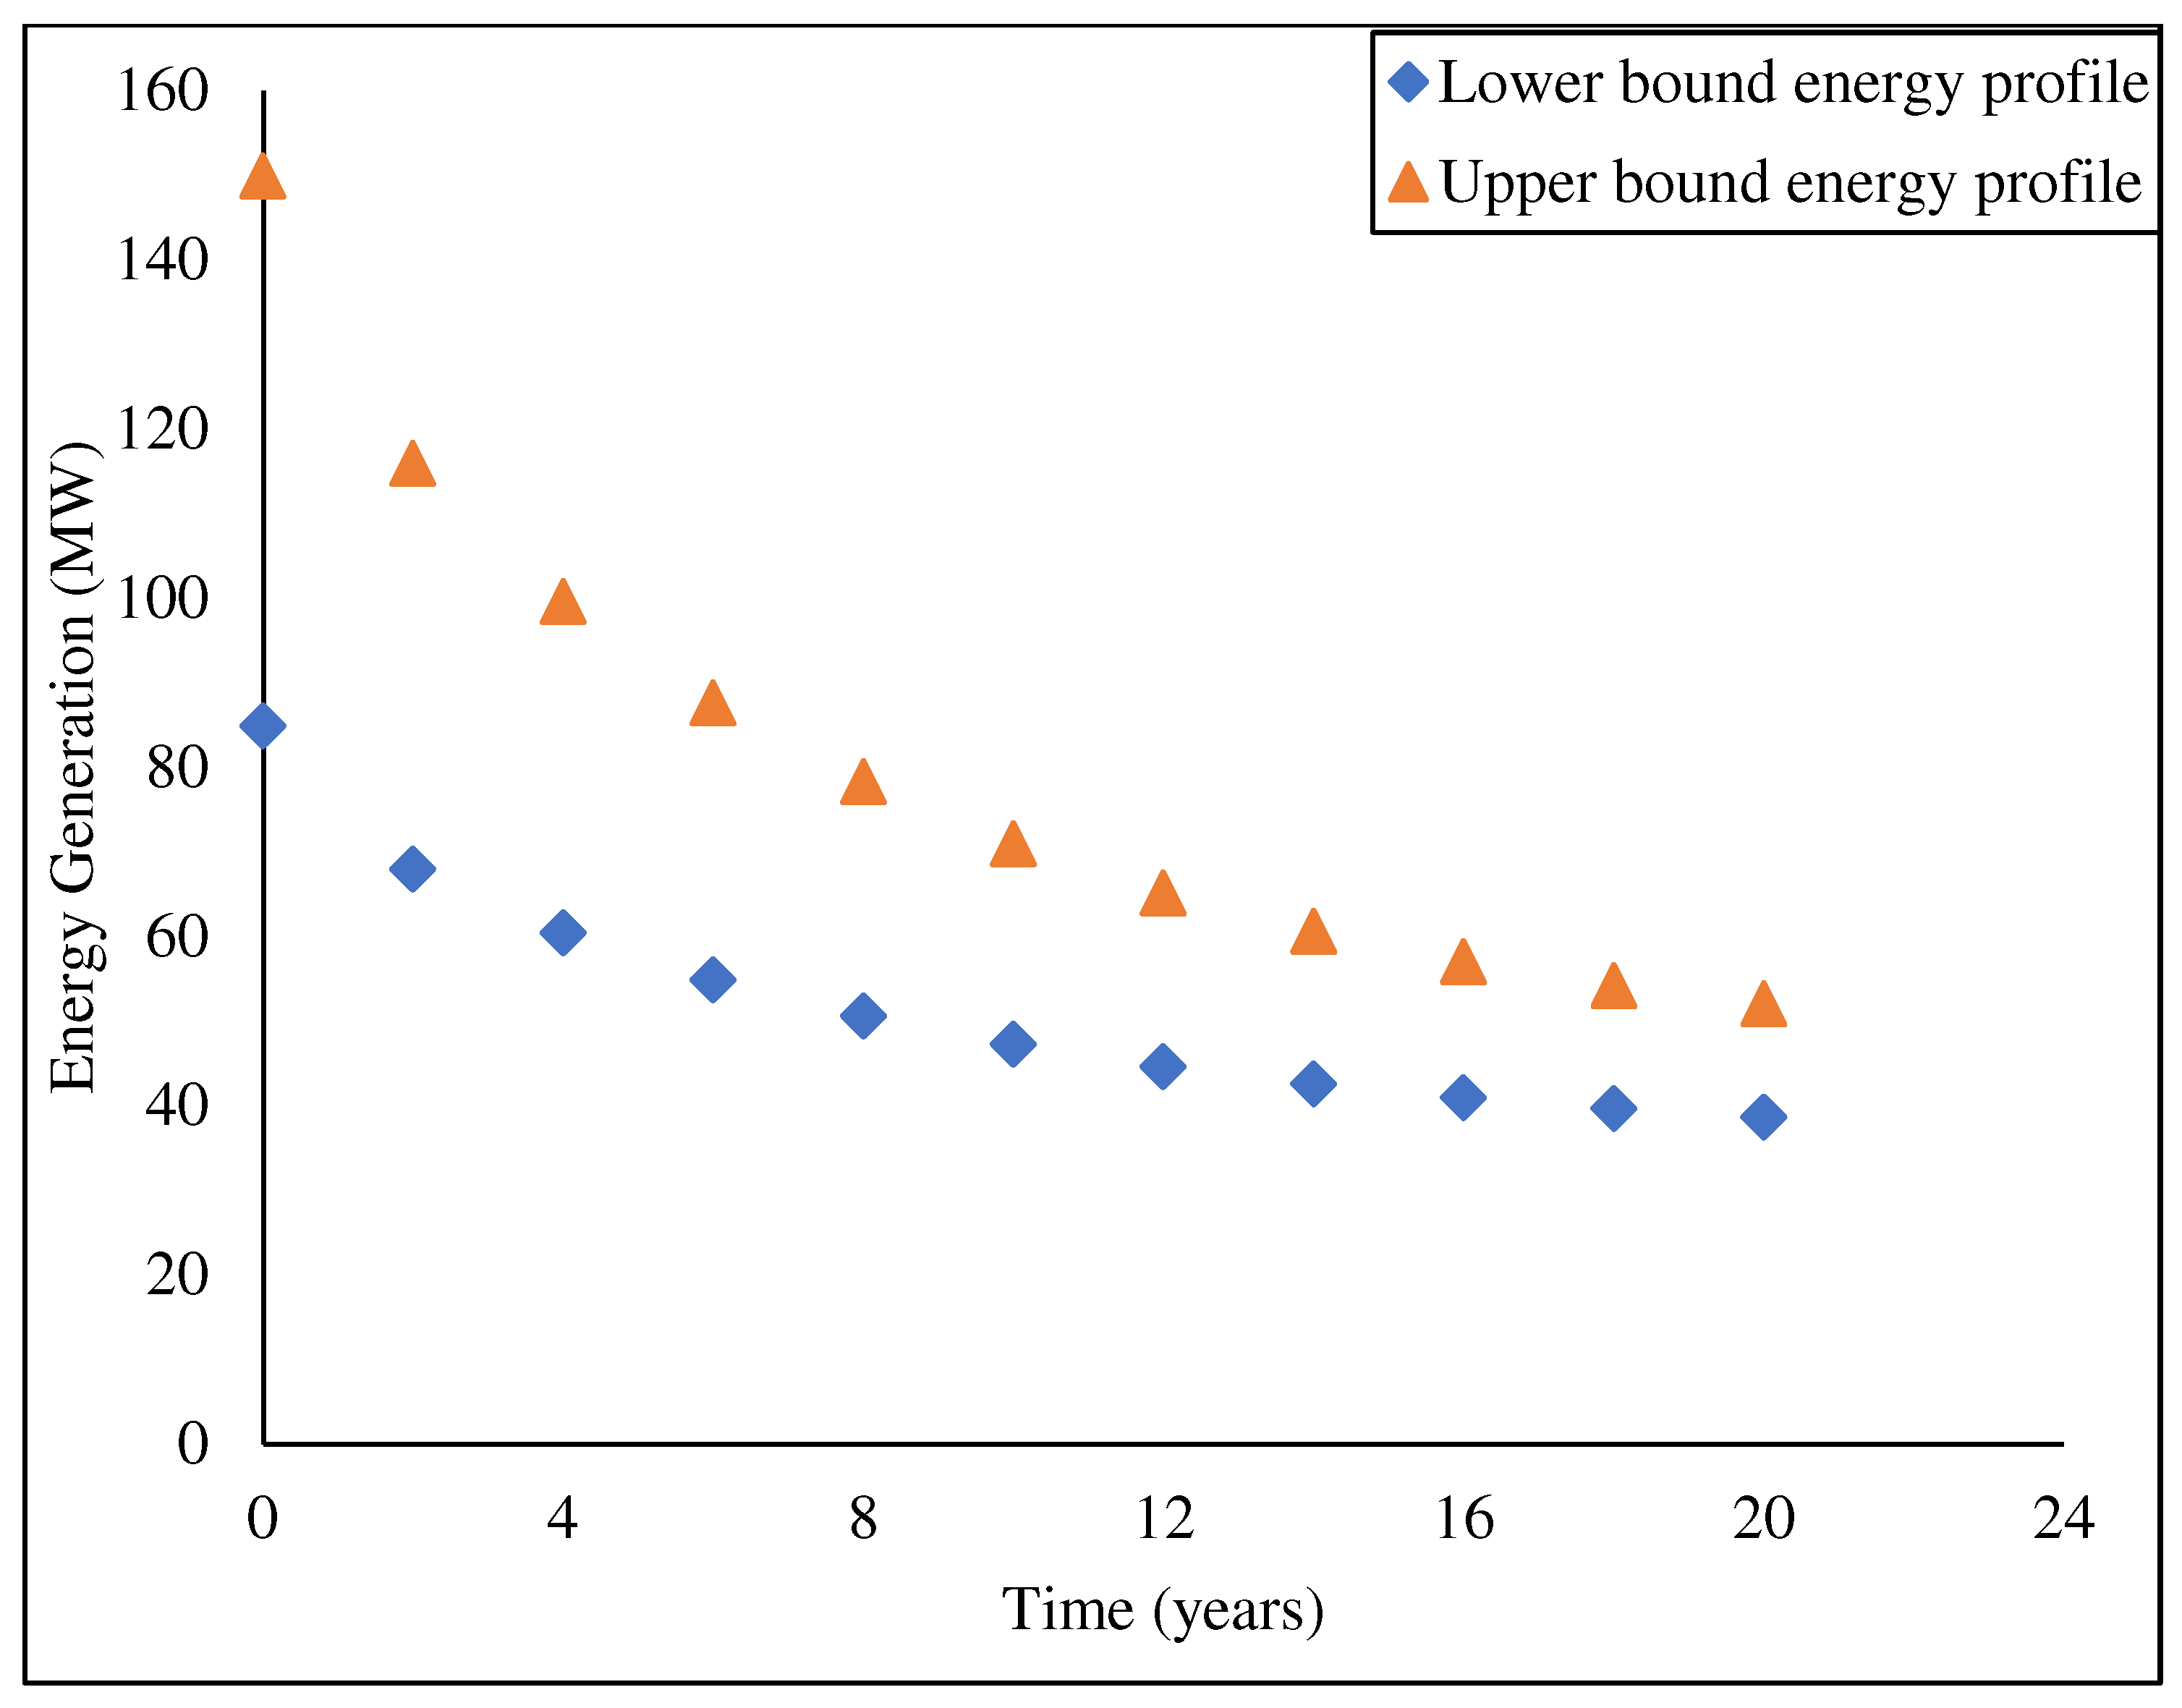
The time evolution of instantaneous power generation can be predicted by defining the stochastic process of the performance degradation of the gas turbine. Figure 6, Figure 7 and Figure 8 show the mean instantaneous energy performance for the Afam, Ibom, and Sapele gas turbine plants. The result in Figure 6 indicates a progressive decline in the plant power generation as a function of system deterioration and time. The stochastic performance process is space- and time-dependent, capturing the instability of the failure elements and propagating their effect on the overall power output for the period. The difference in the upper and lower bound performance ratings reduces as the operating time increases. For instance, at fourteen (14) years of operation, the Afam plant shows a 37.9% mean performance based on the rated capacity. This reflects a 62.06% decrease in the plant power generation capability in comparison to the design rating. As discussed earlier, the rate of the turbine system deterioration and poor maintenance strategy play a key role in the overall power output, as shown.
Similarly, the mean instantaneous power generation for the Ibom and Sapele gas turbine plants, as shown in Figure 7 and Figure 8, gives mean performances of 35.1% and 46.3% relative to their rated capacities. This result shows that the Sapele gas turbine performs better relative to its rated capacity. The state of the plant performance in this study is conditioned by the system’s health state and the poor maintenance strategy by the management of the plants. The results provide a well-informed performance analysis that could aid integrity managers and management in developing the best maintenance and performance improvement strategies to provide an optimum return on investment.
The results further show the amount of power loss based on the system’s degradation and poor integrity management. For investment assessment and overall return analysis, the energy generated per kW can be predicted in line with the net expected value. The proposed approach provides a performance monitoring tool for cost and energy managers to allow them to carry out proactive planning and adopt a sustainable maintenance strategy.
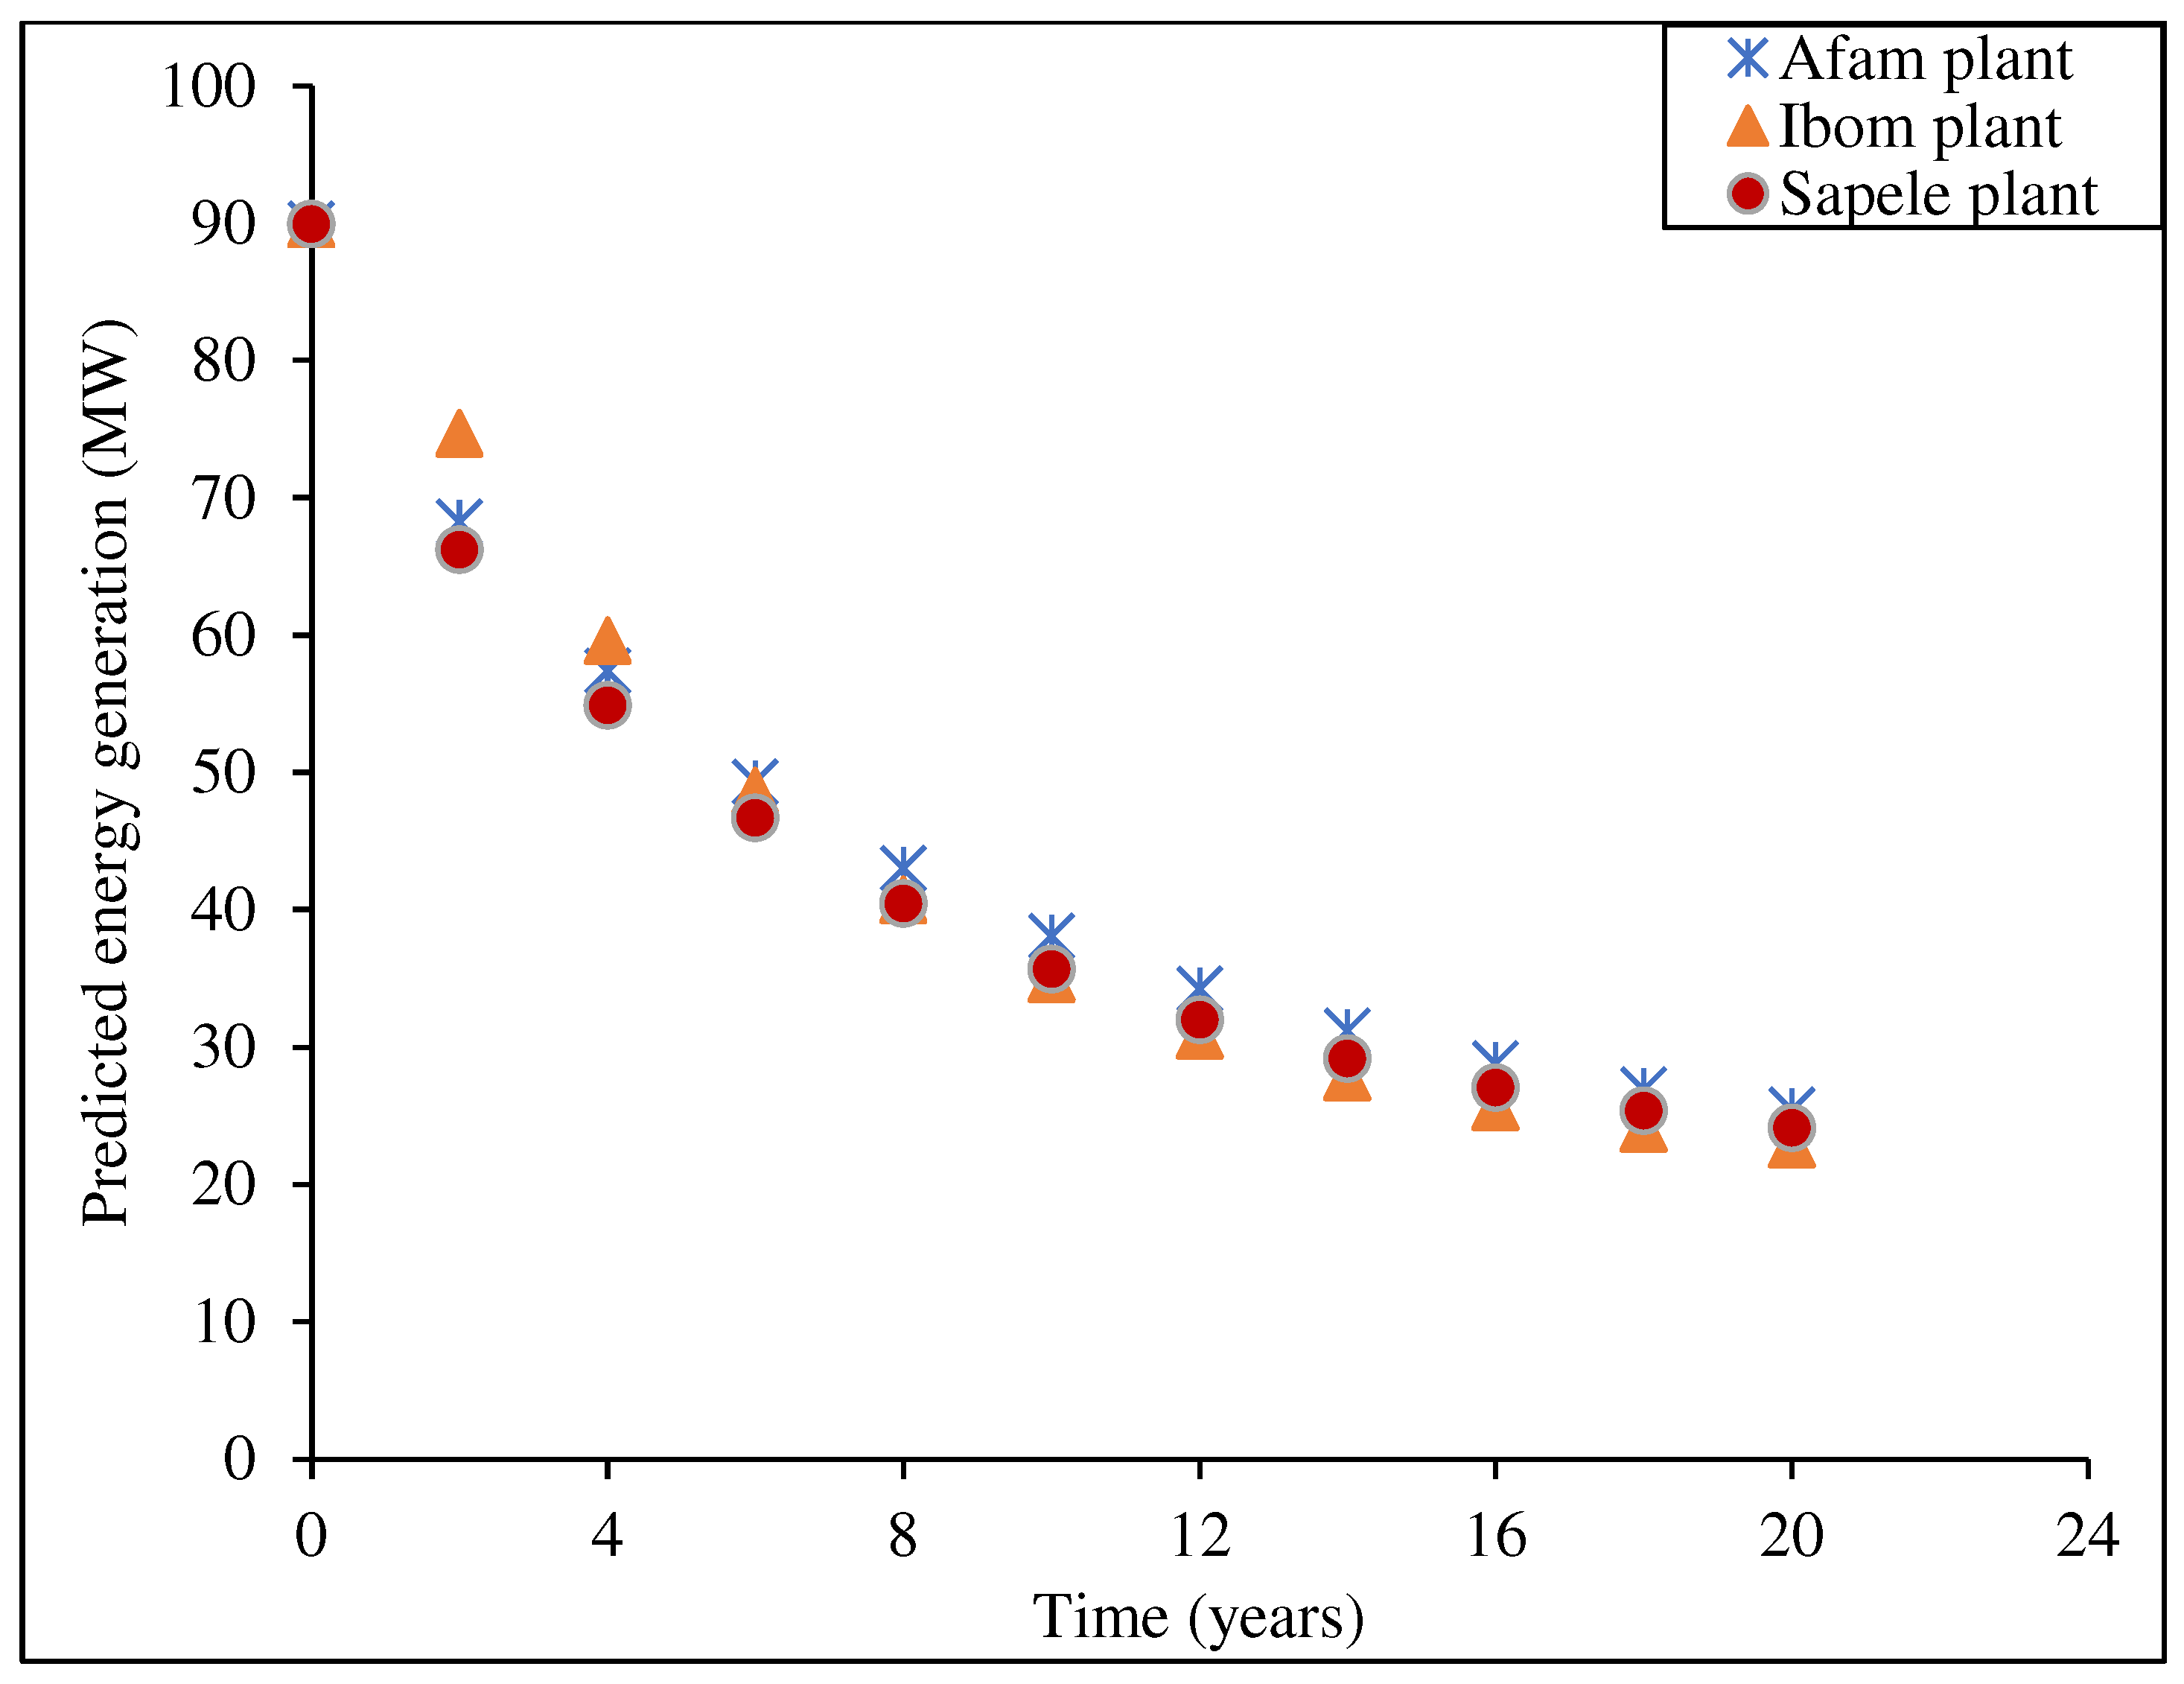
Figure 9 shows the result of the comparative assessment of plant mean instantaneous power generation under the same constraints. The result indicates that, after fourteen (14) years of operation, under the prevailing deterioration of the subsystems, the mean instantaneous power output will be 31.2 MW, 27.9 MW, and 29.3 MW for the Afam, Ibom, and Sapele gas turbine plants, respectively. The percentage drop in the plant’s performance compared with the design performance rating indicates the worst system failure scenario. It is important to note that every system management strategy that performs below average, as shown in the case study, should be reviewed. An updated analysis of the investment measurement could be carried out using the profile in Figure 9 to predict the expected return and identify areas of intervention. An improved, cost-effective management strategy is needed to sustain the plant’s overall performance and minimize energy loss.
The stochastic Markovian process has demonstrated the capacity for a condition-based reliability performance for power generation and system availability prediction of gas turbine power plants. The current model offers an energy performance and well-informed integrity management tool for plant performance monitoring for optimum decision-making and energy availability. The proposed approach performs better than approaches proposed in previous studies [5,19,21,26].

6. Conclusions

Our research objective was to develop a robust and adaptive stochastic model for reliability-based energy system performance evaluation considering unstable degradation and a poor maintenance strategy. The study emphasizes the application of the Markovian process to characteristics of the failure causes’ elements’ state transition during the gas turbine power generation. Three gas turbine plants of different capacities were evaluated, considering the prevailing operation of the asset to develop the FMEA, fault propagation structure, and state transition probability, and the overall mean instantaneous power generation was predicted for a period of 20 years of operation. The following are the key findings that can be drawn from the current study.
  • The proposed approach provides a holistic assessment of the failure mode of the gas turbine plant, considering the prevailing operating environment.
  • The failure and repair rates, which defined the reliability and maintainability function, were reliably predicted from the failure and repair data. This was used to characterize the state transition of the failure causal elements for the three gas turbine plants, as shown.
  • The analysis shows a 10.1%, 4.5%, and 7.8% decline in the system performance reliability for the Afam, Ibom, and Sapele gas turbine plants, respectively.
  • The subsystem degradation impacted the mean instantaneous power output by different percentage drops with respect to the design performance rating.
  • Under the prevailing deterioration of the subsystems and poor maintenance strategy, the plant’s percentage performance relative to the rated capacity is 37.9%, 35.1%, and 46.3% for the Afam, Ibom, and Sapele gas turbine plants in the 14th year of operation. This shows a different level of performance decline and its implication on the economic viability of the investment.
  • The approach provides a performance monitoring tool for gas turbine engine health assessment and energy performance prediction for any given operating state of the asset. A proactive integrity management strategy could be inferred from the analysis of the results to support decision-making in the management options of the gas turbine power plants.
The proposed model provides a real-time capability to monitor the system’s health state and predict the instantaneous energy performance of the gas turbine under degradation. However, the developed approach can be further enhanced in future research by integrating the Markov Decision Process and dynamic modelling tool, which is able to capture the unstable degradation-induced failure characteristics and dependencies among failure causative factors for optimum condition monitoring.

Author Contributions

Conceptualization, A.K.L.-o. and S.A.; methodology, A.K.L.-o. and S.A.; software, S.A.; validation, A.K.L.-o., S.A. and D.S.A.; formal analysis, S.A.; investigation, A.K.L.-o.; writing—original draft preparation, A.K.L.-o. and S.A.; writing—review and editing, D.S.A., M.Y. and J.M. All authors have read and agreed to the published version of the manuscript.

Funding

This research received no external funding.

Data Availability Statement

Data used are contained within the article.

Conflicts of Interest

The authors declare that they have no known competing financial interests or personal relationships that could have appeared to influence the work reported in this paper.

References

  1. Nkoi, B.; Pilidis, P.; Nikolaidis, T. Techno-Economic Assessment of Large-Scale Aero-Derivative Industrial Gas Turbines Combined-Heat-And-Power. Int. J. Eng. Technol. 2015, 5, 225–240. [Google Scholar]
  2. Meher-Homji, C.B.; Chaker, M.A.; Motiwala, H.M. Gas turbine performance deterioration. In Proceedings of the 30th Turbomachinery Symposium, Houston, TX, USA, 17–20 September 2001; pp. 139–176. [Google Scholar]
  3. Kolagar, A.M.; Tabrizi, N.; Cheraghzadeh, M.; Shahriari, M.A. Failure analysis of gas turbine first stage blade made of nickelbased superalloy. Case Stud. Eng. Fail. Anal. 2017, 8, 61–68. [Google Scholar] [CrossRef]
  4. Jagtap, H.; Bewoor, A.; Kumar, R.; Ahmadi, M.H.; Lorenzini, G. Markov-based performance evaluation and availability optimization of the boiler–furnace system in coal-fired thermal power plant using PSO. Energy Rep. 2020, 6, 1124–1134. [Google Scholar] [CrossRef]
  5. Ghasemian, H.; Zeeshan, Q. Failure Mode and Effect Analysis (FMEA) of Aeronautical Gas Turbine using the Fuzzy Risk Priority Ranking (FRPR) Approach. Int. J. Soft Comput. Eng. 2017, 7, 81–92. [Google Scholar]
  6. Yuhua, D.; Datao, Y. Estimation of failure probability of oil and gas transmission pipelines by fuzzy fault tree analysis. J. Loss Prev. Process Ind. 2005, 18, 83–88. [Google Scholar] [CrossRef]
  7. Hunter, I.; Daleo, J.; Wilson, J.; Ellison, K. Analysis of Hot Section Failures on Gas Turbines in Process Plant Service. In 28th Turbomachinery Symposium; Turbomachinery Laboratories, Texas A&M University: College Station, Mexico, TX, USA, 1999. [Google Scholar]
  8. Ebikeme, D.S. A Feasibility Assessment of a Gas-to-Power Plant Scheme at the Gulf of Guinea, Nigeria. Oil and Gas Engineering, University of Aberdeen: Scotland, UK, 2018. [Google Scholar]
  9. Bhangu, N.S.; Pahuja, G.L.; Singh, R. Application of Fault Tree Analysis for Evaluating Reliability and Risk Assessment of a Thermal Power Plant. Energy Sources, Part A: Recover. Util. Environ. Eff. 2015, 37, 2004–2012. [Google Scholar]
  10. Leimeister, M.; Kolios, A. A review of reliability-based methods for risk analysis and their application in the offshore wind industry. Renew. Sustain. Energy Rev. 2018, 91, 1065–1076. [Google Scholar] [CrossRef]
  11. Abaei, M.M.; Abbassi, R.; Garaniya, V.; Chai, S.; Khan, F. Reliability assessment of marine floating structures using Bayesian network. Appl. Ocean Res. 2018, 76, 51–60. [Google Scholar] [CrossRef]
  12. Li, Z.; Xu, T.; Gu, J.; Dong, Q.; Fu, L. Reliability modelling and analysis of a multi-state element based on a dynamic Bayesian network. R. Soc. Open Sci. 2018, 5, 171438. [Google Scholar] [CrossRef] [PubMed]
  13. Lau, B.C.P.; Ma, E.W.M.; Pecht, M. Review of offshore wind turbine failures and fault prognostic methods. In Proceedings of the IEEE 2012 Prognostics and System Health Management Conference PHM-2012, Beijing, China, 23–25 May 2012; pp. 1–5. [Google Scholar]
  14. Yazdi, M.; Ding, Y.; Adumene, S.; Shafie, P. Progressive system safety and reliability analysis: A sustainable game theory approach. Qual. Reliab. Eng. Int. 2022, 39, 1559–1572. [Google Scholar] [CrossRef]
  15. Katsavounis, S.; Patsianis, N.; Konstantinidis, E.I.; Botsaris, P.N. Reliability Analysis on Crucial Subsystems of a Wind Turbine through FTA Approach. In Proceedings of the Maintenance Performance Measurement And Management Conference, Coimbra, Portugal, 4–5 September 2014; pp. 221–228. [Google Scholar] [CrossRef]
  16. Scheu, M.N.; Kolios, A.; Fischer, T.; Brennan, F. Influence of statistical uncertainty of component reliability estimations on offshore wind farm availability. Reliab. Eng. Syst. Saf. 2017, 168, 28–39. [Google Scholar] [CrossRef]
  17. Lazakis, I.; Kougioumtzoglou, M.A. Assessing offshore wind turbine reliability and availability. Sage J. 2018, 233, 1–24. [Google Scholar] [CrossRef]
  18. Sharma, V.; Kumari, M.; Kumar, S. Reliability improvement of modern aircraft engine through failure modes and effects analysis of rotor support system. Int. J. Qual. Reliab. Manag. 2011, 28, 675–687. [Google Scholar]
  19. Wojcik, J.D.; Wang, J. Feasibility study of Combined Cycle Gas Turbine (CCGT) power plant integration with Adiabatic Compressed Air Energy Storage (ACAES). Appl. Energy 2018, 221, 477–489. [Google Scholar] [CrossRef]
  20. Feng, Q.; Xia, J.; Wen, L.; Yazdi, M. Failure analysis of floating offshore wind turbines based on a fuzzy failure mode and effect analysis model. Qual. Reliab. Eng. Int. 2024, 40, 2159–2177. [Google Scholar] [CrossRef]
  21. Salpingidou, C.; Tsakmakidou, D.; Vlahostergios, Z.; Isirlis, D.M.; Flouros, M.; Yakinthos, K. The effect of turbine blade cooling on the performance of recuperative cycles for gas turbines applications. Chem. Eng. Trans. 2017, 61, 1027–1032. [Google Scholar]
  22. Lampreia, S.; Vairinhos, V.; Lobo, V.; Requeijo, J. A Statistical State Analysis of a Marine Gas Turbine. Actuators 2019, 8, 54. [Google Scholar] [CrossRef]
  23. Kappas, J. Review of Risk and Reliability Methods for Aircraft GasTurbine Engine. Van. Nostrand’s Sci. Encycl. 2005, 1–55. [Google Scholar]
  24. Li, H.; Yazdi, M. Developing failure modes and effect analysis on offshore wind turbines using two-stage optimization probabilistic linguistic preference relations. In Advanced Decision-Making Methods and Applications in System Safety and Reliability Problems: Approaches, Case Studies, Multi-criteria Decision-Making, Multi-objective Decision-Making, Fuzzy Risk-Based Models; Springer International Publishing: Cham, Switzerland, 2022; pp. 47–68. [Google Scholar]
  25. Bai, Z. Reliability Analysis of Gas Turbine Based on Analytic Hierarchy Process and FTA. In Proceedings of the International Conference on Mathematics, Modeling, Simulation and Statistics Application (MMSSA 2018), Shanghai, China, 22–23 December 2018; pp. 183–186. [Google Scholar]
  26. Jiang, J.; Wei, X.; Gao, W.; Kuroki, S.; Liu, Z. Reliability and Maintenance Prioritization Analysis of Combined Cooling, Heating and Power Systems. Energies 2018, 11, 1519. [Google Scholar] [CrossRef]
  27. Nitonye, S.; Adumene, S.; Sigalo, B.M.; Orji, C.U.; Le-ol, A.K. Dynamic failure analysis of renewable energy systems in the remote offshore environments. Qual. Reliab. Eng. Int. 2020, 37, 1436–1450. [Google Scholar] [CrossRef]
  28. Adumene, S.; Okoro, A. A Markovian reliability approach for offshore wind energy system analysis in harsh environments. Eng. Rep. 2020, 2, e12128. [Google Scholar] [CrossRef]
  29. Lisnianski, A.; Frenkel, I.; Ding, Y. Multi-State System Reliability Analysis and Optimization for Engineers and Industrial Managers; Springer: London, UK, 2010. [Google Scholar]
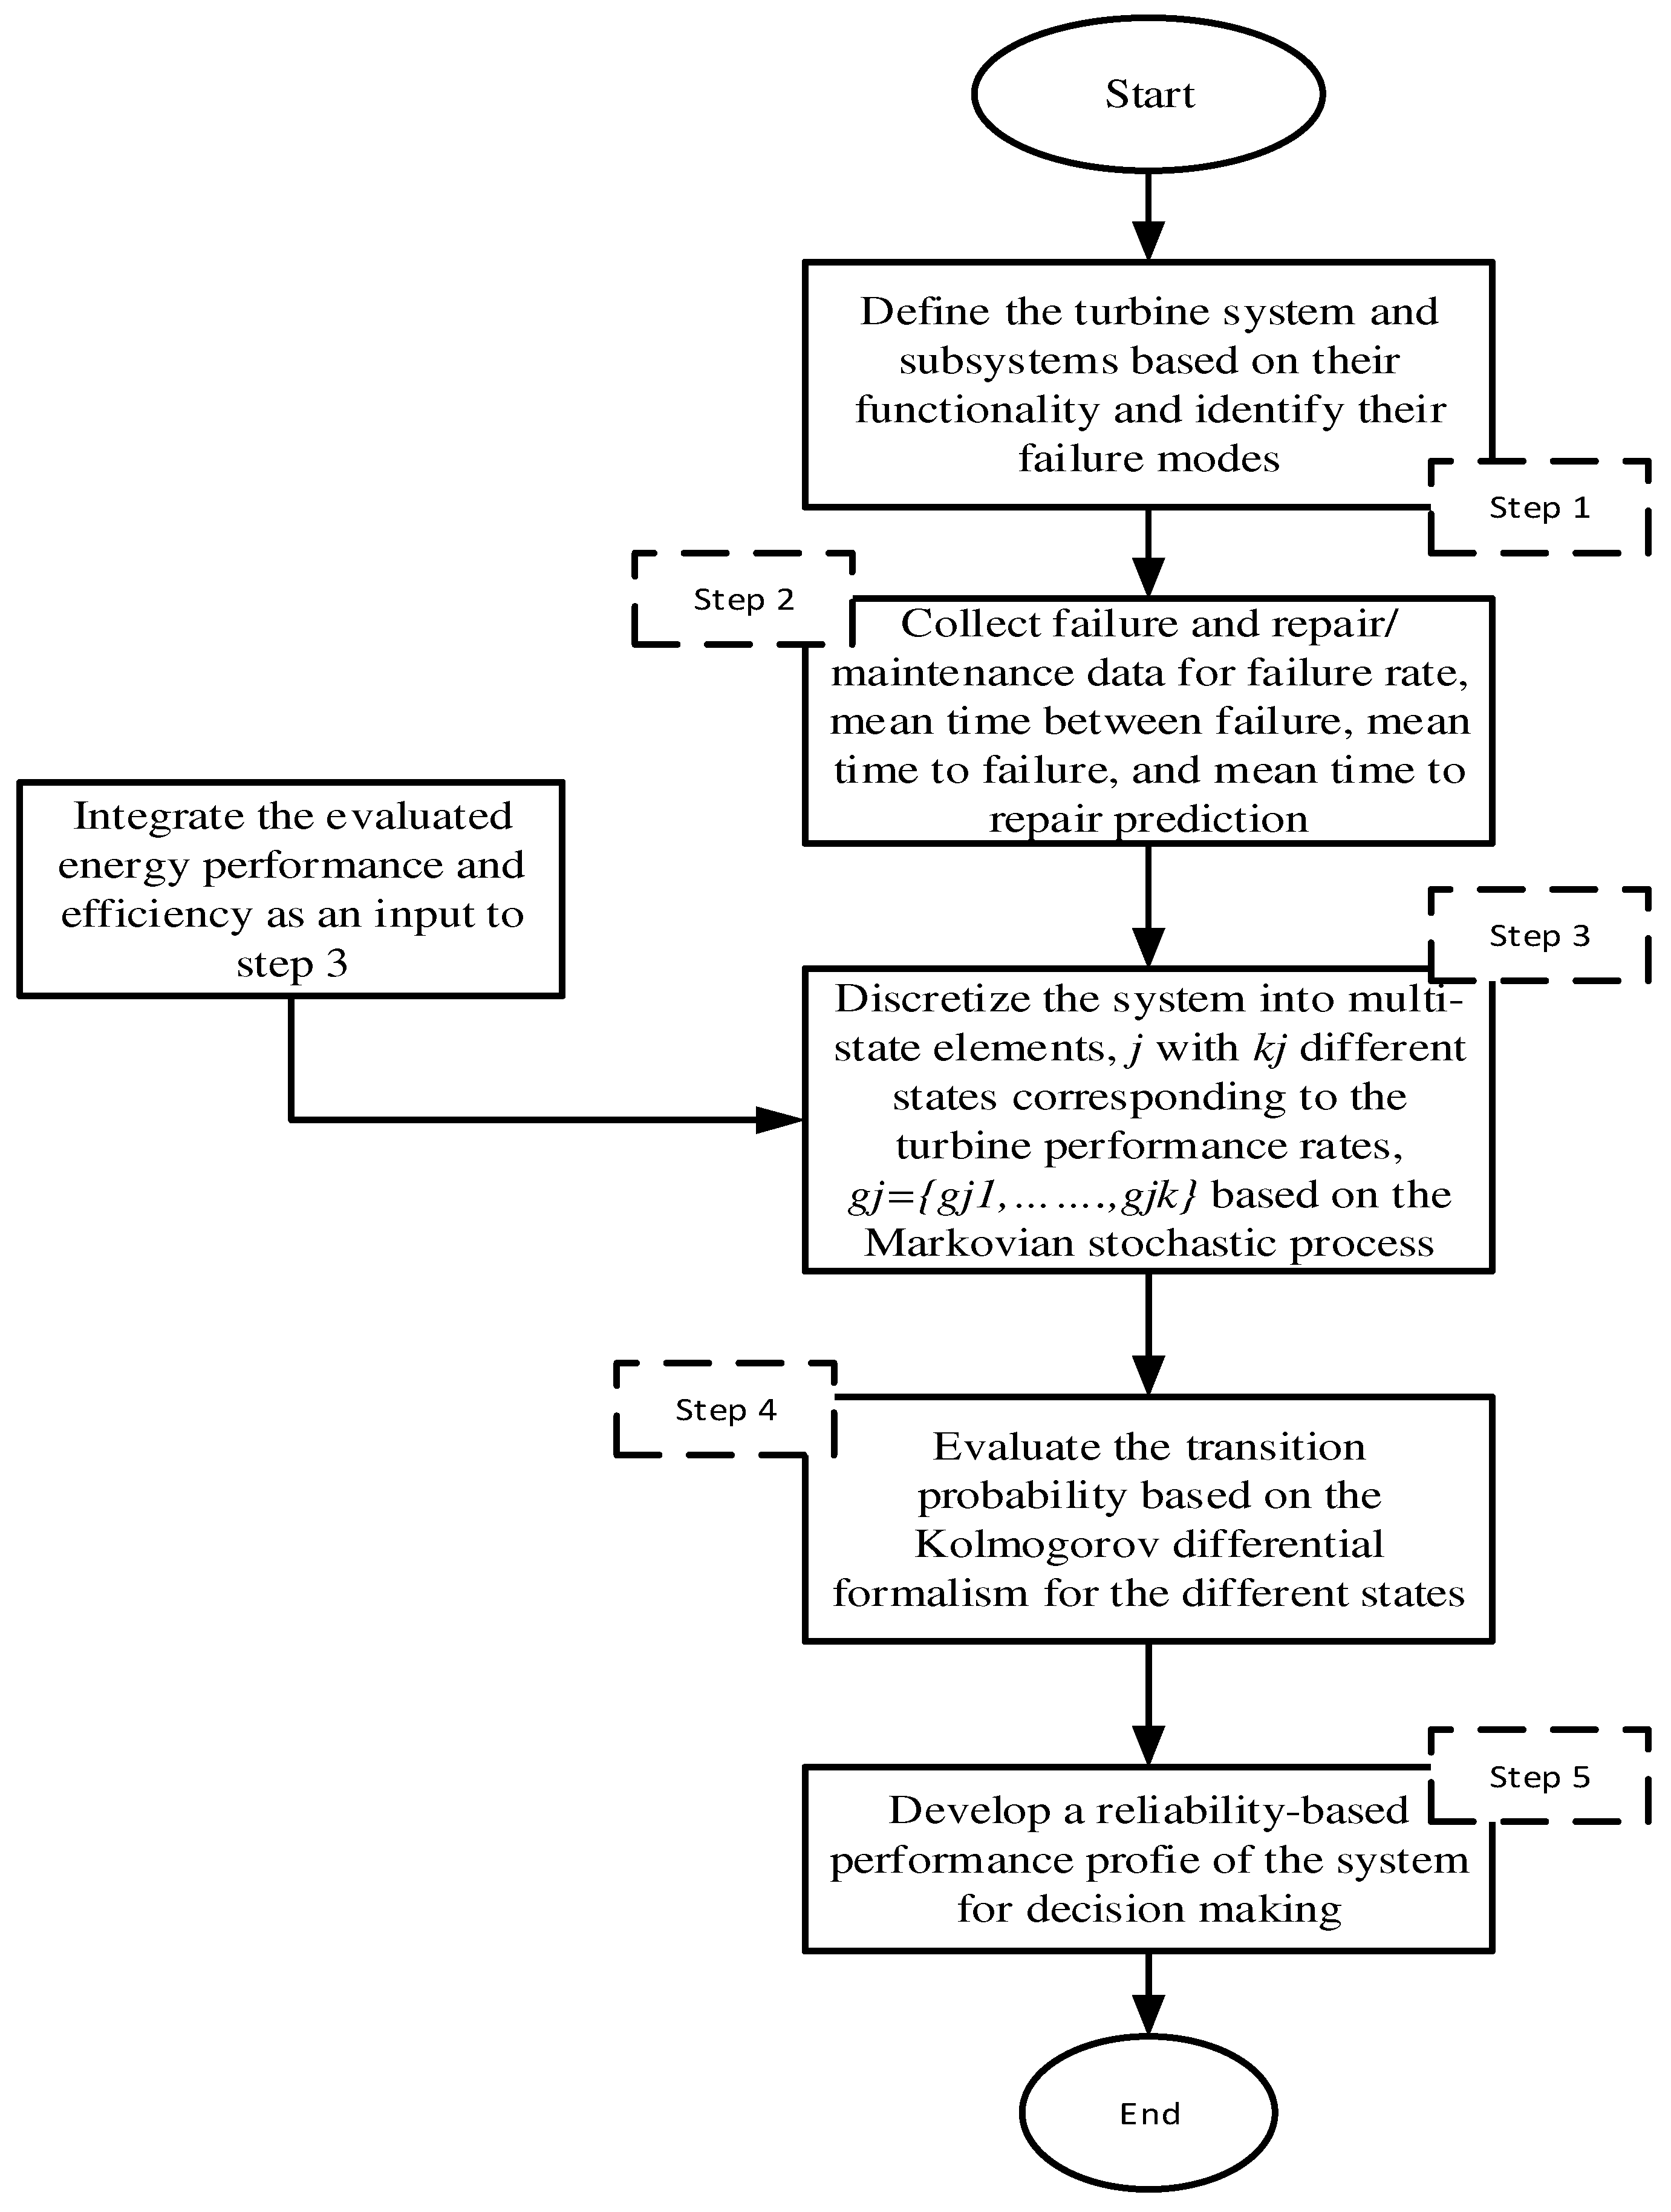
Figure 1. An algorithm for the reliability-based energy performance analysis of a gas turbine plant.
Energies 18 00160 g001
Figure 2. State transition diagram for the gas turbine systems (Adopted from Nitonye et al. [27]).
Energies 18 00160 g002
Figure 3. Turbine health state profile for a period of operation (Afam gas turbine plant).
Energies 18 00160 g003
Figure 4. Turbine health state profile for a period of operation (Ibom gas turbine plant).
Energies 18 00160 g004
Figure 5. Turbine health state profile for a period of operation (Sapele gas turbine plant).
Energies 18 00160 g005
Figure 6. Mean instantaneous energy performance under system degradation state and failed maintenance strategy (Afam gas turbine plant).
Energies 18 00160 g006
Figure 7. Mean instantaneous energy performance under system degradation state and failed maintenance strategy (Ibom gas turbine plant).
Energies 18 00160 g007
Figure 8. Mean instantaneous energy performance under system state and failed maintenance strategy (Sapele gas turbine plant).
Energies 18 00160 g008
Figure 9. Comparative mean instantaneous energy performance under system degradation state and failed maintenance strategy for the three gas turbines.
Energies 18 00160 g009
Table 1. State transition relationship between the turbine components.
t t + t
OFMinorFMajor
O e λ 3,2 + λ 3,1 t λ 3,2 λ 3,2 + λ 3,1 1 e λ 3,2 + λ 3,1 t λ 3,1 λ 3,2 + λ 3,1 1 e λ 3,2 + λ 3,1 t
FMinor μ 2,3 λ 2,1 + μ 2,3 1 e λ 2,1 + μ 2,3 t e ( λ 2,1 + μ 2,3 ) Δ t λ 2,1 λ 2,1 + μ 2,3 1 e λ 2,1 + μ 2,3 t
FMajor001
where O is the operational state, FMinor is the minor failure state, and FMajor is the major failure state.
Table 2. Principal events in gas turbine power plant performance failure.
Main EventsCodesIntermediate EventsCodesBasic EventsCodes
Electric generator system failureT1Generator trip faultA2Damage to generator casingA11
Starting/governing system failureKGenerator damageA1Generator Rotor bowing A12
Failure of compressor systemEGenerator electrical faultA3Damage to generator guide wayA13
Failure of air-inlet systemCOperational fault due to human errorA4Loss of field to the main exciterT31
Failure of turbine systemIFailure of relay systemA5Short circuit faultT32
Failure of combustion systemGFailure due to damaged fuseA6Loss of a.c supply to excitationT33
Failure to generate output voltageT2Coupling shaft stressT61
Generator excitation system failureT3Loose connectivityT62
Turbine failure to reach desired speedT4Pump motor insulation failureC71
Turbine blade failure due to Improper pressure T5Motor failure due to high currentC72
Loose coupling of shaftT6No power supply at the motor terminalC73
Improper burning of fuelT7Motor overloadC91
Low/high pressure of combustor air inletT8Motor overheats due to cooling failureC92
Turning gear failureK1Motor failure due to wrong connectionC93
Start-up system failureK2Failure of cooling system of the lube systemE51
Gearbox system failureK3Faulty pressure gaugeE61
Torque converter systemK4Failure of heating systemE62
Lubrication system failureE5Failure of temperature sensorE63
Loss of water supply from reservoirE6Ballooning of torque converterK41
Vane system turbine failureI1Clutch of the torque converterK42
Turbine radial bearing failureI2Earth fault-induced failureA31
Turbine cylinder failureI3Copper dusting occur in the generatorA32
Turbine exhaust system failureI4Generator fault due to reverse voltageA33
Turbine cylinder exhaust system failureI5Generator failure due to inter turn faultA34
Exhaust connection system failureI6Generator failure due to short circuit faultA35
Combustion system wear and tearG1Too early operation from human operator A41
Igniter system failureG2Too late operation from human operatorA42
Combustion cooling system failureG3Out sequence operation by human operatorA43
Damaged basket of shellG4Delay in open the relay contactA51
Failure of evaporator coolerC1Relay contacts freezeA52
Failure of water supply systemC3Relay contacts bounceA53
Pipe section ruptureC4Relay coils burn outA54
Faulty pump systemC5Fuse open on low currentA61
Valves failed to open on demandC6Fuse fails to open on high currentA62
Damaged pump motorC7Fuse partially openedA63
Rupture seal houseC8Vane’s damageI11
Motor OverheatingC9Pins of vane system damageI12
Compressor blade failureE1Broken blade rings of turbine cylinder systemI31
Journal bearing failureE2Broken blade of the turbine systemI33
Compressor thrust bearing failureE3Failure of the exhaust collector of the exhaust systemI41
Journal bearing casing failureE4Failure of the pads of the radial bearingI21
Failure of thermocouples in the radial bearing systemI22, I52
Damage of the shell of the radial bearing systemI23
Damage of the static seal of the exhaust systemI61
Damage of the exhaust pipesI62
Damage casing of the exhaust cylinderI51
Flame tube failureG11
Shell cylinder failureG12
Igniter system spring failureG21
Igniter system piston failureG22
Failure of the igniter in the igniter systemG23
Blockage of the cooling system vesselsG31
Failed to open of the bypass valve of the cooling systemG32
Cooling system controller failureG33
Damaged transition piece in the basketG41
Damaged burner in the basketG42
Humid badges burstD1
Water pipes damageD2
Pipes failure due to corrosionD3
Valve failure due to mechanical faultD4
Valve failure due to controller faultD5
Rupture of seal house due to high temperatureD9
Seal house rupture due to drynessD10
Motor overloadD11
Filter system cloggedD14
Broken rings in the blade systemF1
Broken inlet guide vane in the blade systemF2
Vibration of shaftF3
Broken stationary blades in the casing systemF4
Damaged casing in the cooling system F5
Rupture of the pad in the casing systemF6
Broken housing of the thrust bearingF7
Broken shoes of the thrust bearingF8
Broken filler of thrust bearing F9
Pressure gauge failureF11
Failure of heating systemF12
Vibration of gearbox bearingK31
Failure of gearbox self shifting clutchK32
Excessive hogging of the gearbox bearingK33
Table 3. System performance and energy generation loss due to plant health state ((a)—Afam Gas Turbine Plant, (b)—Ibom Gas Turbine Plant, and (c)—Sapele Gas Turbine Plant).
Likely Failure StateCumulative Mean Time to Failure (hours)Rate of FailureCumulative Mean Time to Repair (h)Rate of Repair
(a) System performance and energy generation loss due to plant health state (Afam Gas Turbine Plant)
Axial shaft bearing leakage622.981.61 × 10−3200.94.98 × 10−3
System disturbance/low system voltage/grid failure4499.72.22 × 10−4398.92.51 × 10−3
Fan problem483.452.07 × 10−3287.83.47 × 10−3
Bus bar differential protection failure3980.92.51 × 10−4729.51.37 × 10−3
Medium pressure turbine differential expansion failure90.81.10 × 10−225.33.95 × 10−2
Transformer leakage/GT oil leakage105.989.44 × 10−365.61.52 × 10−2
Generator breaker failure6789.91.47 × 10−4698.81.43 × 10−3
Generator pole slippage567.81.76 × 10−3209.34.78 × 10−3
Relay system failure3862.59 × 10−3117.18.54 × 10−3
Pump motor system failure4332.31 × 10−389.91.11 × 10−2
Blade system failure98.91.01 × 10−276.71.30 × 10−2
Vane system failure105.999.43 × 10−355.81.79 × 10−2
Thrust bearing failure144.876.90 × 10−398.61.01 × 10−2
Radial bearing failure981.31.02 × 10−3288.73.46 × 10−3
Combustion system failure166.95.99 × 10−367.31.49 × 10−2
Governing system failure1885.32 × 10−388.21.13 × 10−2
Turning gear failure78.91.27 × 10−247.42.11 × 10−2
Seal house ruptured487.22.05 × 10−3209.74.77 × 10−3
Rotor bowing failure312.83.20 × 10−3112.58.89 × 10−3
Mechanical fault failure478.62.09 × 10−3101.49.86 × 10−3
Vibration induced failure201.84.96 × 10−389.71.11 × 10−2
Gearbox system failure812.81.23 × 10−3398.12.51 × 10−3
Control system failure109.879.10 × 10−367.81.47 × 10−2
Turbine system failure81.981.22 × 10−2109.69.12 × 10−3
Torque system failure321.83.11 × 10−399.81.00 × 10−2
Igniter system failure657.781.52 × 10−3110.99.02 × 10−3
(b) System performance and energy generation loss due plant health state (Ibom Gas Turbine Plant)
Axial shaft bearing leakage589.71.70 × 10−3109.89.11 × 10−3
System disturbance/low system voltage/grid failure2199.94.55 × 10−4483.22.07 × 10−3
Fan problem398.82.51 × 10−3190.45.25 × 10−3
Bus bar differential protection failure1778.15.62 × 10−4478.92.09 × 10−3
Medium pressure turbine differential expansion failure100.49.96 × 10−3144.86.91 × 10−3
Transformer leakage/GT oil leakage39.62.53 × 10−212.67.94 × 10−2
Generator breaker failure4987.12.01 × 10−4289.73.45 × 10−3
Generator pole slippage345.32.90 × 10−3118.78.42 × 10−3
Relay system failure502.21.99 × 10−3386.22.59 × 10−3
Pump motor system failure298.93.35 × 10−3113.18.84 × 10−3
Blade system failure64.21.56 × 10−212.58.00 × 10−2
Vane system failure211.84.72 × 10−356.71.76 × 10−2
Thrust bearing failure238.94.19 × 10−3102.49.77 × 10−3
Radial bearing failure1011.99.88 × 10−4597.81.67 × 10−3
Combustion system failure189.65.27 × 10−345.62.19 × 10−2
Governing system failure119.88.35 × 10−387.71.14 × 10−2
Turning gear failure88.91.12 × 10−231.53.17 × 10−2
Seal house ruptured507.11.97 × 10−3105.69.47 × 10−3
Rotor bowing failure4022.49 × 10−3209.24.78 × 10−3
Mechanical fault failure339.92.94 × 10−389.61.12 × 10−2
Vibration induced failure2883.47 × 10−366.81.50 × 10−2
Gearbox system failure9081.10 × 10−3206.24.85 × 10−3
Control system failure118.98.41 × 10−347.52.11 × 10−2
Turbine system failure67.91.47 × 10−2109.79.12 × 10−3
Torque system failure409.82.44 × 10−3211.14.74 × 10−3
Igniter system failure779.71.28 × 10−3219.44.56 × 10−3
(c) System performance and energy generation loss due to plant health state (Sapele Gas Turbine Plant)
Axial shaft bearing leakage543.81.84 × 10−3112.18.92 × 10−3
System disturbance/low system voltage/grid failure3887.32.57 × 10−4897.51.11 × 10−3
Fan problem3542.82 × 10−389.71.11 × 10−2
Bus bar differential protection failure4002.92.50 × 10−4172.25.81 × 10−3
Medium pressure turbine differential expansion failure97.91.02 × 10−256.31.78 × 10−2
Transformer leakage/GT oil leakage105.989.44 × 10−357.11.75 × 10−2
Generator breaker failure5986.71.67 × 10−4456.82.19 × 10−3
Generator pole slippage433.52.31 × 10−3109.89.11 × 10−3
Relay system failure408.42.45 × 10−399.81.00 × 10−2
Pump motor system failure309.73.23 × 10−3202.64.94 × 10−3
Blade system failure79.91.25 × 10−289.91.11 × 10−2
Vane system failure110.79.03 × 10−368.71.46 × 10−2
Thrust bearing failure209.54.77 × 10−3101.29.88 × 10−3
Radial bearing failure1011.49.89 × 10−4209.74.77 × 10−3
Combustion system failure204.84.88 × 10−367.81.47 × 10−2
Governing system failure1089.26 × 10−377.81.29 × 10−2
Turning gear failure104.89.54 × 10−356.21.78 × 10−2
Seal house ruptured508.71.97 × 10−3201.24.97 × 10−3
Rotor bowing failure411.42.43 × 10−378.91.27 × 10−2
Mechanical fault failure399.82.50 × 10−3103.49.67 × 10−3
Vibration induced failure199.25.02 × 10−356.71.76 × 10−2
Gearbox system failure598.21.67 × 10−3287.53.48 × 10−3
Control system failure249.14.01 × 10−397.51.03 × 10−2
Turbine system failure69.91.43 × 10−287.91.14 × 10−2
Torque system failure246.54.06 × 10−3109.89.11 × 10−3
Igniter system failure789.81.27 × 10−3243.94.10 × 10−3
Disclaimer/Publisher’s Note: The statements, opinions and data contained in all publications are solely those of the individual author(s) and contributor(s) and not of MDPI and/or the editor(s). MDPI and/or the editor(s) disclaim responsibility for any injury to people or property resulting from any ideas, methods, instructions or products referred to in the content.