Article

Sealing Effects on Organic Pore Development in Marine Shale Gas: New Insights from Macro- to Micro-Scale Analyses

1
State Key Laboratory of Oil and Gas Reservoir Geology and Exploitation, Chengdu University of Technology, Chengdu 610059, China
2
Guizhou Engineering Research Institute of Oil and Gas Exploration and Development, Department of Natural Resources of Guizhou Province, Guiyang 550004, China
*
Authors to whom correspondence should be addressed.
Energies 2025, 18(1), 193; https://doi.org/10.3390/en18010193
Submission received: 18 November 2024 / Revised: 27 December 2024 / Accepted: 30 December 2024 / Published: 5 January 2025

Abstract

:
The physics of how organic pores change under high thermal evolution conditions in overmature marine shale gas formations remains unclear. In this study, systematic analyses at the macro- to micro-scales were performed to reveal the effects of the sealing capacity on organic pore development. Pyrolysis experiments were conducted in semi-closed and open systems which provided solid evidence demonstrating the importance of the sealing capacity. Low-maturity marine shale samples from the Dalong Formation were used in the pyrolysis experiments, which were conducted at 350 °C, 400 °C, 450 °C, 500 °C, 550 °C, and 600 °C. The pore characteristics and geochemical parameters of the samples were examined after each thermal simulation stage. The results showed that the TOC of the semi-closed system decreased gradually, while the TOC of the open system decreased sharply at 350 °C and exhibited almost no change thereafter. The maximum porosity, specific surface area, and pore volume of the semi-closed system (10.35%, 2.99 m2/g, and 0.0153 cm3/g) were larger than those of the open system (3.87%, 1.97 m2/g, and 0.0059 cm3/g). In addition, when the temperature was 600 °C, the pore diameter distribution in the open system was 0.001–0.1 μm, while the pore diameter distribution in the semi-closed system was 0.001–10 μm. The pore volumes of the macropores and mesopores in the semi-closed system remained larger than those in the open system. The pore volumes of the micropores in the semi-closed and open systems were similar. The pyrolysis results indicated that (1) the pressure difference caused by the sealing capacity controls organic pore development; (2) organic pores developed in the semi-closed system, and the differences between the two systems mainly occurred in the overmature stage; and (3) the differences were caused by changes in the macropore and mesopore volumes, not the micropore volume. It was concluded that the sealing capacity is the key factor for gas pore generation in the overmature stage of marine shale gas reservoirs when the organic matter (OM) type, volume, and thermal evolution degree are all similar. The macropores and mesopores are easily affected by the sealing conditions, but the micropores are not. Finally, the pyrolysis simulation results were validated with the Longmaxi shale and Qiongzhusi shale properties. The Longmaxi shale is similar to semi-closed system, and the Qiongzhusi shale is similar to open system. Two thermal evolution patterns of organic pore development were proposed based on the pyrolysis results. This study provides new insights into the evolution patterns of organic pores in marine shale gas reservoirs.

1. Introduction

Marine shale is a type of sedimentary rock that forms from the accumulation of fine-grained particles, such as clay, silt, and organic material, in a marine environment. Organic pores are major storage spaces in overmature marine shale gas formations, which have a vitrinite reflectance (Ro) > 2.0% [1]. However, the physics of how organic pores develop or decrease under high thermal evolution conditions remains unclear. This is because in previous research, the characterization of organic pores has focused on static descriptions. The genesis of organic pores, which involves dynamic thermal and pressure evolution processes, has not been sufficiently discussed. For example, many studies have concluded that a high TOC (total organic carbon) content of 4–5% yields a high porosity [2,3]. However, previous researchers have also found that a high TOC content of 5–6% yields a low porosity [4,5]. The inhibiting effects are believed to be due to compaction after carbonization or methane adsorption that narrows down the pore throat. In addition, the prevailing understanding is that organic pores are less developed in the overmature stage [6,7]. When the Ro exceeds 3.5%, the organic matter (OM) starts to graphitize, which may result in a decrease in the toughness and easy collapse of the organic pores when subjected to external stresses [8]. However, a previous study also found that organic pores developed well in the Whitehill Formation when the Ro was 3.8–4.3% [9]. Previous conclusions about organic pore development patterns are conflicting. Thus, the mechanism of organic pore development in overmature marine shale gas reservoirs requires further study.
The sealing capacity may be the key to explaining organic pore development differences in overmature shale gas reservoirs, but there is a lack of discussion of this aspect in previous studies. The sealing capacity usually refers to the roof–floor properties [10,11,12,13,14]. According to hydrocarbon generation pressurization theory, the dense lithology of the roof and floor layers results in overpressure conditions (formation pressure coefficient Cp > 1.0). Overpressure conditions yield a high porosity as the excessive pressure supports the pores and keeps them open during the burial process. However, this relationship does not always occur. Organic pores have also been found to develop in normal-pressure shale gas reservoirs [15]. The differences in formation pressure conditions are not sufficient to account for the heterogeneity of organic pores.
In addition, compared to the roof–floor sealing capacity, the importance of the micro-sealing capacity has not yet been addressed. The micro-sealing capacity is the sealing condition at the pore scale, which is defined by the hydrocarbon expulsion degree during the thermal evolution process [16]. The micro-sealing capacity can be classified into three types (closed, semi-closed, and open), which refer to the three types of pressure systems that can exist during hydrocarbon generation and expulsion. In closed conditions, no hydrocarbons are expelled from the organic pores, while in semi-closed conditions, some of the hydrocarbons are expelled from the organic pores and in open conditions, hydrocarbons within the organic pores are freely exchanged with the outside environment. Previous research found that a high micro-sealing capacity retrains the efficiency of the liquid hydrocarbon expulsion and restricted organic pore development during the primary thermal evolution stage [17]. However, organic gas pores are mainly generated during second thermal evolution processes, which involve cracking of the residual kerogen and the bitumen at the overmature stage [18,19]. How the micro sealing capacity affects the generation of organic pores at the overmature stage is unknown.
Pyrolysis experiments are an efficient method for revealing the dynamic changes in the organic pore structure during thermal evolution processes. The types of pyrolysis instruments include gold tubes, copper tubes, high-water-pressure reactors, and thermo-pressure hydrocarbon generation simulators (e.g., WYMN-3). The latter instrument is the best for simulating real formation conditions as it can apply both lithostatic and formation pressures and can simulate different systems by controlling the degree of hydrocarbon expulsion [20]. Previous pyrolysis experiments have focused on closed or semi-closed systems [21,22,23]. In fact, organic-rich shale gas reservoirs are mainly semi-closed systems during the burial evolution process. Under certain conditions, such as during tectonic movements, the system may change from semi-closed to open. Closed systems rarely exist in formations. A comparative analysis of organic pore characteristics in open and semi-closed systems is currently lacking.
A systematic study at the macro- to micro-scales and from the static to dynamic state is significant for explaining the sealing effect that occurs during organic pore development. In this study, the Longmaxi and Qiongzhusi Formations were selected as typical overmature marine shale gas formations to investigate the relationship between organic pore development and sealing capacity through breakthrough pressure evaluations at the macro-scale. In addition, low-maturity Dalong shale samples were used in semi-closed and open system pyrolysis experiments, which provided solid evidence that demonstrated the importance of sealing capacity on organic pore development at the micro-scale. The aims of this study were (1) to investigate the differences in organic pore development in semi-closed and open systems; (2) to quantify the sealing effect through organic pore characterizations under different pressure and temperature conditions; and (3) to reveal the mechanism of the sealing effect on organic pore development. Our systematic analyses provided new insights into the evolution of organic pores in overmature marine shale gas reservoirs.

2. Formation Characteristics

2.1. Wufeng–Longmaxi and Qiongzhusi Formations

The Upper Ordovician–Lower Silurian Wufeng–Longmaxi Formation and Lower Cambrian Qiongzhusi Formation are both overmature and OM-rich shale gas reservoirs. The Longmaxi Formation was mainly deposited in the depression area after paleo-uplift occurred in the Sichuan Basin. The TOC content of the Longmaxi Formation is 2.0–4.5% within the Sichuan Basin [24]. The Qiongzhusi Formation is mainly distributed inside the Mianyang–Changning intracratonic sag area in the southern part of the Sichuan Basin [25]. The TOC content of the Qiongzhusi Formation is 2.0–4.0% within the Sichuan Basin [26,27]. Compared to lacustrine shale formations [28], the TOCs of Longmaxi and Qiongzhusi are much higher. The Longmaxi Formation is usually divided into three members, and the color of the rocks from bottom to top changes from dark to light as the silt content increases. The Qiongzhusi Formation is also divided into three members based on the electrical properties, lithology, color, and mineral contents of the rocks (Figure 1). The tectonic deformation in the study area is weak, with moderate folds and small-scale faults [24,29].
The properties of the First Members of the Longmaxi Formation (combined with the Wufeng Formation) and Qiongzhusi Formation were compared in the Weiyuan area (wells WA and WB), Changning area (wells Ning201 and Ning203), and Fuling area (wells JY1 and JY2) (Figure 2). All of the wells’ information for the Longmaxi and Qiongzhusi Formation comparison was collected from the literature [24,25,26,27]. The average porosity, TOC, and Ro of the First Member of the Longmaxi Formation are 5.3%, 3.5%, and 2.7%. The average porosity, TOC, and Ro of the First Member of the Qiongzhusi Formation are 2.4%, 2.4%, and 3.4%. The clay content, siliceous content, and carbonate content of the First Member of the Longmaxi Formation are 37.8%, 43.6%, and 18.6%. The corresponding values of the First Member of the Qiongzhusi Formation are 40%, 49.5%, and 10.5%. In lacustrine shale formations [30], the main mineral contents are clay, carbonate, and terrigenous detrital. The OM in the First Members of the Longmaxi Formation and Qiongzhusi Formation is type I.
The greatest difference is in their porosities, followed by the carbonate content, TOC, Ro, siliceous content, and clay content. This indicates that the two strata have significantly different porosities, despite having similar TOC, Ro, and mineral contents. The difference in their organic pore development may be caused by their different sealing conditions.
The floor of the Longmaxi Formation is composed of the gray limestone of the Upper Ordovician Baota Formation. The bottom of the Qiongzhusi Formation is in unconformable contact with the Dengying Formation outside of the sag area. The unconformity between the Qiongzhusi and Dengying Formations formed during the Tongwan tectonic period, which may have resulted in poor floor sealing conditions for the First Member of the Qiongzhusi Formation.

2.2. Dalong Formation in Northwestern Part of the Sichuan Basin

The Upper Permian Dalong Formation in the northwestern part of the Sichuan Basin is a low-maturity, high-TOC shale gas reservoir, and samples from this formation were used in the pyrolysis simulation experiments. The thickness of the Upper Permian Dalong Formation in the northwestern part of the Sichuan Basin varies from a few meters thick to tens of meters thick. In the Guangyuan Changjianggou area, the thermal maturity of the Dalong Formation is low, the organic carbon content is high, and the OM type is I–II1 [31,32,33]. The Upper Dalong Formation comprises microcrystalline limestone, while the Lower Dalong Formation comprises interbedded limestone and shale [34]. The outcrop samples were collected from the Lower Dalong Formation (Figure 3). The mineral compositions of the outcrop samples were quite different and had high heterogeneity (Table 1). Overall, the median Ro was 0.6% and the TOC content was 1.97%. The OM type in this area is type I according to a maceral analysis (Table 2). The Dalong shale in the Guangyuan Changjianggou area had a similar TOC content and OM type compared to the First Members of the Longmaxi and Qiongzhusi Formations, but it had a low thermal maturity, which is ideal for the pyrolysis simulation experiments.

3. Experimental Methods

3.1. Pyrolysis Simulation

The pyrolysis simulation experiments were performed using a WYMN-3HTHP instrument, which is a hydrocarbon generation and expulsion instrument developed by the Sinopec Wuxi Institute of Petroleum Geology (Wuxi, China). The WYMN-3HTHP instrument consists of a high-temperature and high-pressure reaction system, two-way hydraulic control system, automatic hydrocarbon collection system, and fluid charging system. The shale samples can retain their original state after preparation for this type of pyrolysis experiment.
The shale samples were cut into 12 columnar samples (3.5 cm in diameter and 10 cm in length). The burial evolution and overpressure development history of the Longmaxi Formation from well JY1 [35] were used to set the temperature and pressure constraints in the pyrolysis experiments. Six simulation temperatures and their corresponding pressures were set at the beginning of each pyrolysis experiment, as shown in Table 3.
Two sets of pyrolysis experiments, semi-closed and open systems, were carried out separately. The only difference between the semi-closed system and open system experiments was the formation pressure. The semi-closed system maintained a certain formation pressure in the system. When the pressure difference was greater than 10–15 MPa, hydrocarbon expulsion began. In the open system, the hydrocarbon expulsion occurred at any time without a required pressure difference. All of the other experimental steps were the same for the semi-closed and open systems.
The major steps of each simulation experiment were as follows:
(1)
Six column samples were selected as a single set (total of two sets, one set for the semi-closed system and one set for the open system, total of 12 column samples).
(2)
The sample was placed in the thermal simulation instrument for hydrocarbon generation and expulsion (the surrounding void was filled with fragments).
(3)
The temperature was increased to 350 °C at a rate of 20 °C/h, and this temperature was maintained for 48 h. The fluid pressure was then measured, and the fluid was cooled to room temperature.
(4)
The column samples were removed after the thermal simulation experiment and sectioned into slices for field emission scanning electron microscopy (FE-SEM) observations.
(5)
The fragment samples were removed from the thermal simulation instrument and used for geochemical, low-pressure N2 and CO2 adsorption and desorption, high-pressure mercury injection, and alcohol porosity tests.
(6)
Steps 3 to 5 were repeated using target temperatures of 400 °C, 450 °C, 500 °C, 550 °C, and 600 °C.
To better simulate the actual formation conditions, brine (salinity of 40 g/L) was used as the fluid stream in each pyrolysis simulation experiment based on the results from previous studies [36,37].

3.2. FE-SEM

The FE-SEM shale sample preparation and observations were performed in the State Key Laboratory of Oil and Reservoir Geology and Exploitation (Chengdu University of Technology, Chengdu, China). The shale samples were mechanically polished using a Leica TXT polisher and then coated with a thin layer of gold (10–20 nm) to improve the electrical conductivity. The scanning electron microscope (Quanta250 FEG) was set to the high-vacuum mode at a voltage of 20 kV.

3.3. Other Analyses

The geochemical, low-pressure N2 and CO2 adsorption desorption, high-pressure mercury injection, and alcohol porosity tests were performed by the Sichuan Keyuan Engineering Technology Test Center (Chengdu, China) in accordance with Chinese National Standard GB/T 19587-2004. The instrument used to conduct the adsorption desorption test was a Micromeritics ASAP 2460 2.02 instrument. The samples were crushed to 40–100 mesh and were subsequently dried and degassed in an environment with inert gases for 72 h. The instrument used to conduct the high-pressure mercury injection test was a Micromeritics Autopore 9500 mercury injection apparatus. Under vacuum conditions, mercury was injected into the sample tube and the pore spaces were gradually filled by continuously increasing the pressure. The minerals in the shale samples were measured using X-ray diffraction (XRD). The <200-mesh powder samples were analyzed using a BRUKER X-ray diffractometer. The TOC content was measured using a LECOCS230 carbon and sulfur analyzer. Approximately 250–500 mg of sample powder was used for each TOC measurement. The Ro was estimated through conversion of the pyrobitumen reflectance (BRr). The BRr was determined by analyzing a polished sample under reflected light using a 3Y micro-photo-metric system.

4. Results and Discussion

4.1. Effect of Roof–Floor Sealing Capacity on Organic Pore Development

The breakthrough pressure can be used to quantify the sealing capacity of the roof–floor layers. The higher the breakthrough pressure is, the better the sealing capacity is. The breakthrough pressure can be calculated from the permeability. The relationship between the breakthrough pressure and permeability was initially derived based on the capillary effects [38]:
P t = σ k o F 1 φ k ,
where P t is the threshold pressure, σ is the surface tension, k o is the shape factor, F is the formation resistivity factor, φ is the porosity, and k is the permeability. The semi-empirical equation (Equation (2)) has been widely applied in breakthrough pressure studies; assuming that all of the other parameters are constant,
P b = a × 1 k b ,
where a and b are fitting parameters, P b is the breakthrough pressure, and k is the permeability. By applying the natural log on both sides, we can obtain
ln P b = b ln k + ln a .
Equation (3) shows that the relationship between the breakthrough pressure P b and permeability k is linear if the tortuosity of the real rock and the interaction between the fluid and the pore wall are disregarded, which is not appropriate for shale. The gas breakthrough pressure of shale may be not induced by the capillary effect but rather by the mechanical effect, which results in the expansion of the pore space or an increase in the dilatancy of the flow pathways in a porous medium [39]. The relationship between the mechanical breakthrough pressure and the permeability is exponential:
P b = a × e x p ( b × k ) .
By applying the natural log on both sides, we can obtain
ln P b = ln e b k + ln a = b k + ln a .
Based on previous experimental results for shale samples [40], fitting parameters b and a were estimated. The breakthrough pressure of the Qiongzhusi Formation was estimated using Equation (5). The permeability of the Qiongzhusi Formation was obtained using lab measurements and ranged from 0.004 to 0.45 mD. The sample depth ranged from 3000 m to 3242 m in the Qiongzhusi Formation.
The diamonds in Figure 4 are the calculated breakthrough pressures of the Qiongzhusi Formation (3.39–20.73 MPa), which are reasonable based on the breakthrough pressures of the Qiongzhusi Formation obtained through lab measurements [41]. When the permeability was equal to 0.01 mD, 0.02 mD, and 0.03 mD, the breakthrough pressures measured in the lab were 17.8 MPa, 17.3 MPa, and 16.8 MPa. The calculated breakthrough pressures were 20.3 MPa, 19.3 MPa, and 18.6 MPa (differences of 11%, 12%, and 14%, respectively).
The breakthrough pressures of the Qiongzhusi Formation were compared with those of the Longmaxi Formation (Table 4 and Table 5). The breakthrough pressures of the Longmaxi Formation were obtained from the literature. The floor of the Longmaxi Formation has a higher breakthrough pressure (40 MPa) than the shale layer (27–34 MPa). For the Qiongzhusi Formation, the breakthrough pressure of the floor is 3.4 MPa, which is significantly lower than that of the shale layers (20.1 MPa).
The above calculated breakthrough pressure results indicate that the sealing capacity of the floor may be the key to explaining the difference in organic pore development in the First Members of the Longmaxi and Qiongzhusi Formations. However, the above results only demonstrate that there may be a correlation between the sealing capacity of the floor and organic pore development. How the sealing capacity of the floor impacts organic pore development needs to be further investigated to obtain direct evidence at the micro-scale.

4.2. Effect of Micro-Sealing Capacity on Organic Pore Development

In this study, the difference in the organic pore development caused by the micro-sealing capacity was observed using SEM (Figure 5), which provided direct evidence of the effects of the sealing capacity on organic pore development. The two well samples were both collected from the Longmaxi Formation and had similar TOC.
Figure 5a presents an SEM image of the semi-closed system. The bio-skeleton was replaced by pyrite and the shape of the pyrite was circular. Most of the OM was trapped within the bio-skeleton and part of the OM (bitumen) had migrated to the outside through the microcracks. The TOC content of the sample was 4.5% and the Ro of the sample was 3.05%. In the semi-closed system, the bitumen remained around the original kerogen and continually cracked and generated more organic pores under certain pressure and temperature conditions. In addition, the organic pore pressure was greater than the surrounding pressure, which caused the organic pore volume to continually expand, especially in the bitumen part. The organic pores within the semi-closed system were developed, and the organic pores on the edge (generated due to bitumen cracking) were larger than the organic pores inside the kerogen.
Figure 5b presents an SEM image of the open system. No hard minerals were present around the OM. In the open system, the bitumen was in the liquid phase and could migrate out of the shale, and it did not surround the original kerogen. The OM had been destroyed and deformed due to the compaction. The TOC content of the sample was 3.4% and the Ro of the sample was 1.52%. Organic pores were not present inside of the kerogen or on the edge of the kerogen. Organic pores did not develop due to a lack of bitumen cracking and compaction of the kerogen pores.
Based on the above SEM results, the following hypothesis about the organic pore development mechanism was proposed: the sealing capacity controls bitumen migration, which is the key process for gas pore generation in the overmature stage. The semi-closed system causes the bitumen to migrate over short distances, which results in organic pore generation through residual kerogen and bitumen cracking (secondary cracking). The open system may cause the bitumen to migrate out of the shale, resulting in reduced organic pore development.

4.3. Discussion and Comparison of Pyrolysis Simulation Experiment Results

To verify the above discussion and hypothesis, semi-closed- and open-system pyrolysis simulation experiments were conducted on low-maturity shale samples from the Dalong Formation. The temperature of the pyrolysis experiments ranged from 350 °C to 600 °C, corresponding to the three hydrocarbon maturity stages: mature, high maturity, and overmature [42]. The TOC, Ro, and mineral contents of the shale samples were measured after each heating step to set the temperature. The characteristics (porosity (Φ), specific surface area (SSA), pore diameter (PD), and pore volume (PV)) of the organic pores were quantified using N2 and CO2 adsorption desorption, high-pressure mercury intrusion, and alcohol porosity tests.

4.3.1. TOC, Ro, and Mineral Contents in the Semi-Closed and Open Systems

Table 6 presents the geochemical characteristics and whole-rock analysis results for the Dalong shale samples at each temperature in the semi-closed and open systems. In the semi-closed system, the TOC content changed from 1.97% to 1.41% at 350°C, while in the open system, the TOC content decreased dramatically from 1.97% to 0.99% at 350 °C. The trends in the TOC changes in the two systems were different at the beginning. This occurred because the thermal evolution was in the primary cracking stage, when the OM mainly generated liquid hydrocarbons. In the semi-closed system, part of the liquid hydrocarbons remained, while in the open system, all the liquid hydrocarbons were discharged, which resulted a sharp decrease in the TOC at the beginning.
In the semi-closed and open systems, the Ro increased from 0.6% to 2.6% and from 0.6% to 2.4% at 600 °C, indicating that the pressure had a limited impact on the thermal maturity of the OM. The mineral contents also did not exhibit noticeable changes after the shale samples were heated in both the semi-closed and open systems. The most abundant minerals were still calcite and dolomite, followed by quartz and clay. The minor differences may have been caused by the heterogeneity of the shale samples.

4.3.2. Pore Morphology in the Semi-Closed and Open Systems

Four types of organic pores were observed during the pyrolysis simulation experiments. The kerogen oil pores were small and dispersed within the kerogen (Figure 6a,b). The clay mineral intergranular pores were generated as a result of the transformation of montmorillonite to illite (Figure 6c,d). The shrinkage cracks formed on the edge of the kerogen (Figure 6e,f). The gas pores were intensively generated in the bitumen (Figure 6g,h).
Figure 7 shows the pore morphology at the different thermal evolution stages in the semi-closed and open systems. At the mature stage (350 °C to 400 °C, Ro = 1.2–1.5%), organic pores did not develop in both systems (Figure 7a,b). During the post-mature stage (400 °C to 500 °C, Ro = 1.4–2.1%), organic gas pores developed as a flocculent structure (Figure 7c,d). When the thermal evolution reached the overmature stage (600 °C, Ro = 2.4–2.6%), the two systems exhibited a clear difference. In the semi-closed system, the pores were interconnected and exhibited a decomposed OM framework. The pores were larger and their shape was circular (Figure 7e). In the open system, the pore size was smaller and the shapes of the pores were deformed into dispersed stacked pores (Figure 7f).

4.3.3. Pore Structure in the Semi-Closed and Open Systems

The pore structure parameters are summarized in Table 7 and Figure 8. The porosity was significantly higher in the semi-closed system than in the open system at the same temperature. The difference in organic pore development in the two systems was small at the beginning, and it increased until the overmature stage was reached. In addition, the SSA and PV from both the CO2 and N2 adsorption and desorption results were larger in the semi-closed system than in the open system.
The isothermal adsorption curves for carbon dioxide were convex (Figure 9). The adsorption rate increased rapidly at the beginning and slowed down in the later stage. The adsorption was always greater in the semi-closed system than in the open system, indicating that organic pores developed in the semi-closed system. In the open system, the adsorption increased as the temperature increased from 400 °C to 450 °C (Ro = 1.4–1.8%), and almost no change occurred as the temperature increased from 450 °C to 550 °C (Ro = 1.8–2.4%). In addition, in the semi-closed system, the adsorption decreased as the temperature increased from 450 °C to 550 °C (Ro = 1.9–2.5%), indicating that the percentage of micropores decreased.
The liquid nitrogen isothermal adsorption and desorption curves further demonstrated that the decrease in the micropores was caused by an increase in mesopores (Figure 10). As the temperature increased, the area of the hysteresis ring and adsorption both gradually increased. When the temperature was 400 °C and 450 °C, the type of curve was H3 and the corresponding micropore shape was a lamellate shape. When the temperature was 550 °C and 600 °C, the type of curve was H2 and the corresponding mesopore shape was a bottle shape.

4.3.4. Pore Diameter Distribution in the Semi-Closed and Open Systems

Figure 11 shows the high-pressure mercury intrusion curves. In the semi-closed system, the saturation of the mercury injection was high at temperatures of 400 °C and 600 °C. In the open system, the saturation of the mercury injection, as well as the mercury withdrawal rate, was low, indicating that the pore connection was poor. In addition, the displacement pressure in the open system was high, which implies that macropores did not develop in the open system. The pore diameter distributions in the two systems were similar at 450 °C. However, when the temperature reached 600 °C, all of the pores in the open system were smaller than 0.1 μm, and half of the pores in the semi-closed system were larger than 0.1 μm (Figure 12).

4.4. Effect of Sealing Capacity on Macro-, Meso-, and Micropore Development

The previous results demonstrated that organic pore development was better in the semi-closed system. The major differences between the two systems occurred in the overmature stage (500–600 °C), which may have been caused by the generation of macropores and mesopores. To validate these observations, the changes in the PVs of the macropores, mesopores, and micropores with Ro in the two systems were compared.
The PVs of the semi-closed system and open system both increased as the thermal maturity increased. In the overmature stage, the PV of the macropores in the semi-closed system continually increased, but the PV of the macropores in the open system remained almost unchanged (Figure 13b). The PV of the mesopores was also greater in the semi-closed system than in the open system (Figure 13c). The PVs of the micropores in the two systems were similar in the overmature stage (Figure 13d). The difference between the two systems in the overmature stage was caused by changes in the PVs of the macropores and mesopores. That is, the macropores and mesopores were easily affected by the sealing conditions, but the micropores were not.

4.5. Similarity Analyses of Pyrolysis Results and Shale Pore Evolution

The pyrolysis simulation results were compared with the pore characteristics of the First Members of the Longmaxi and Qiongzhusi Formations. The porosity and Ro in the semi-closed system were within the ranges of those of the First Member of the Longmaxi Formation, and the porosity and Ro in the open system were close to those of the First Member of the Qiongzhusi Formation (Figure 14).

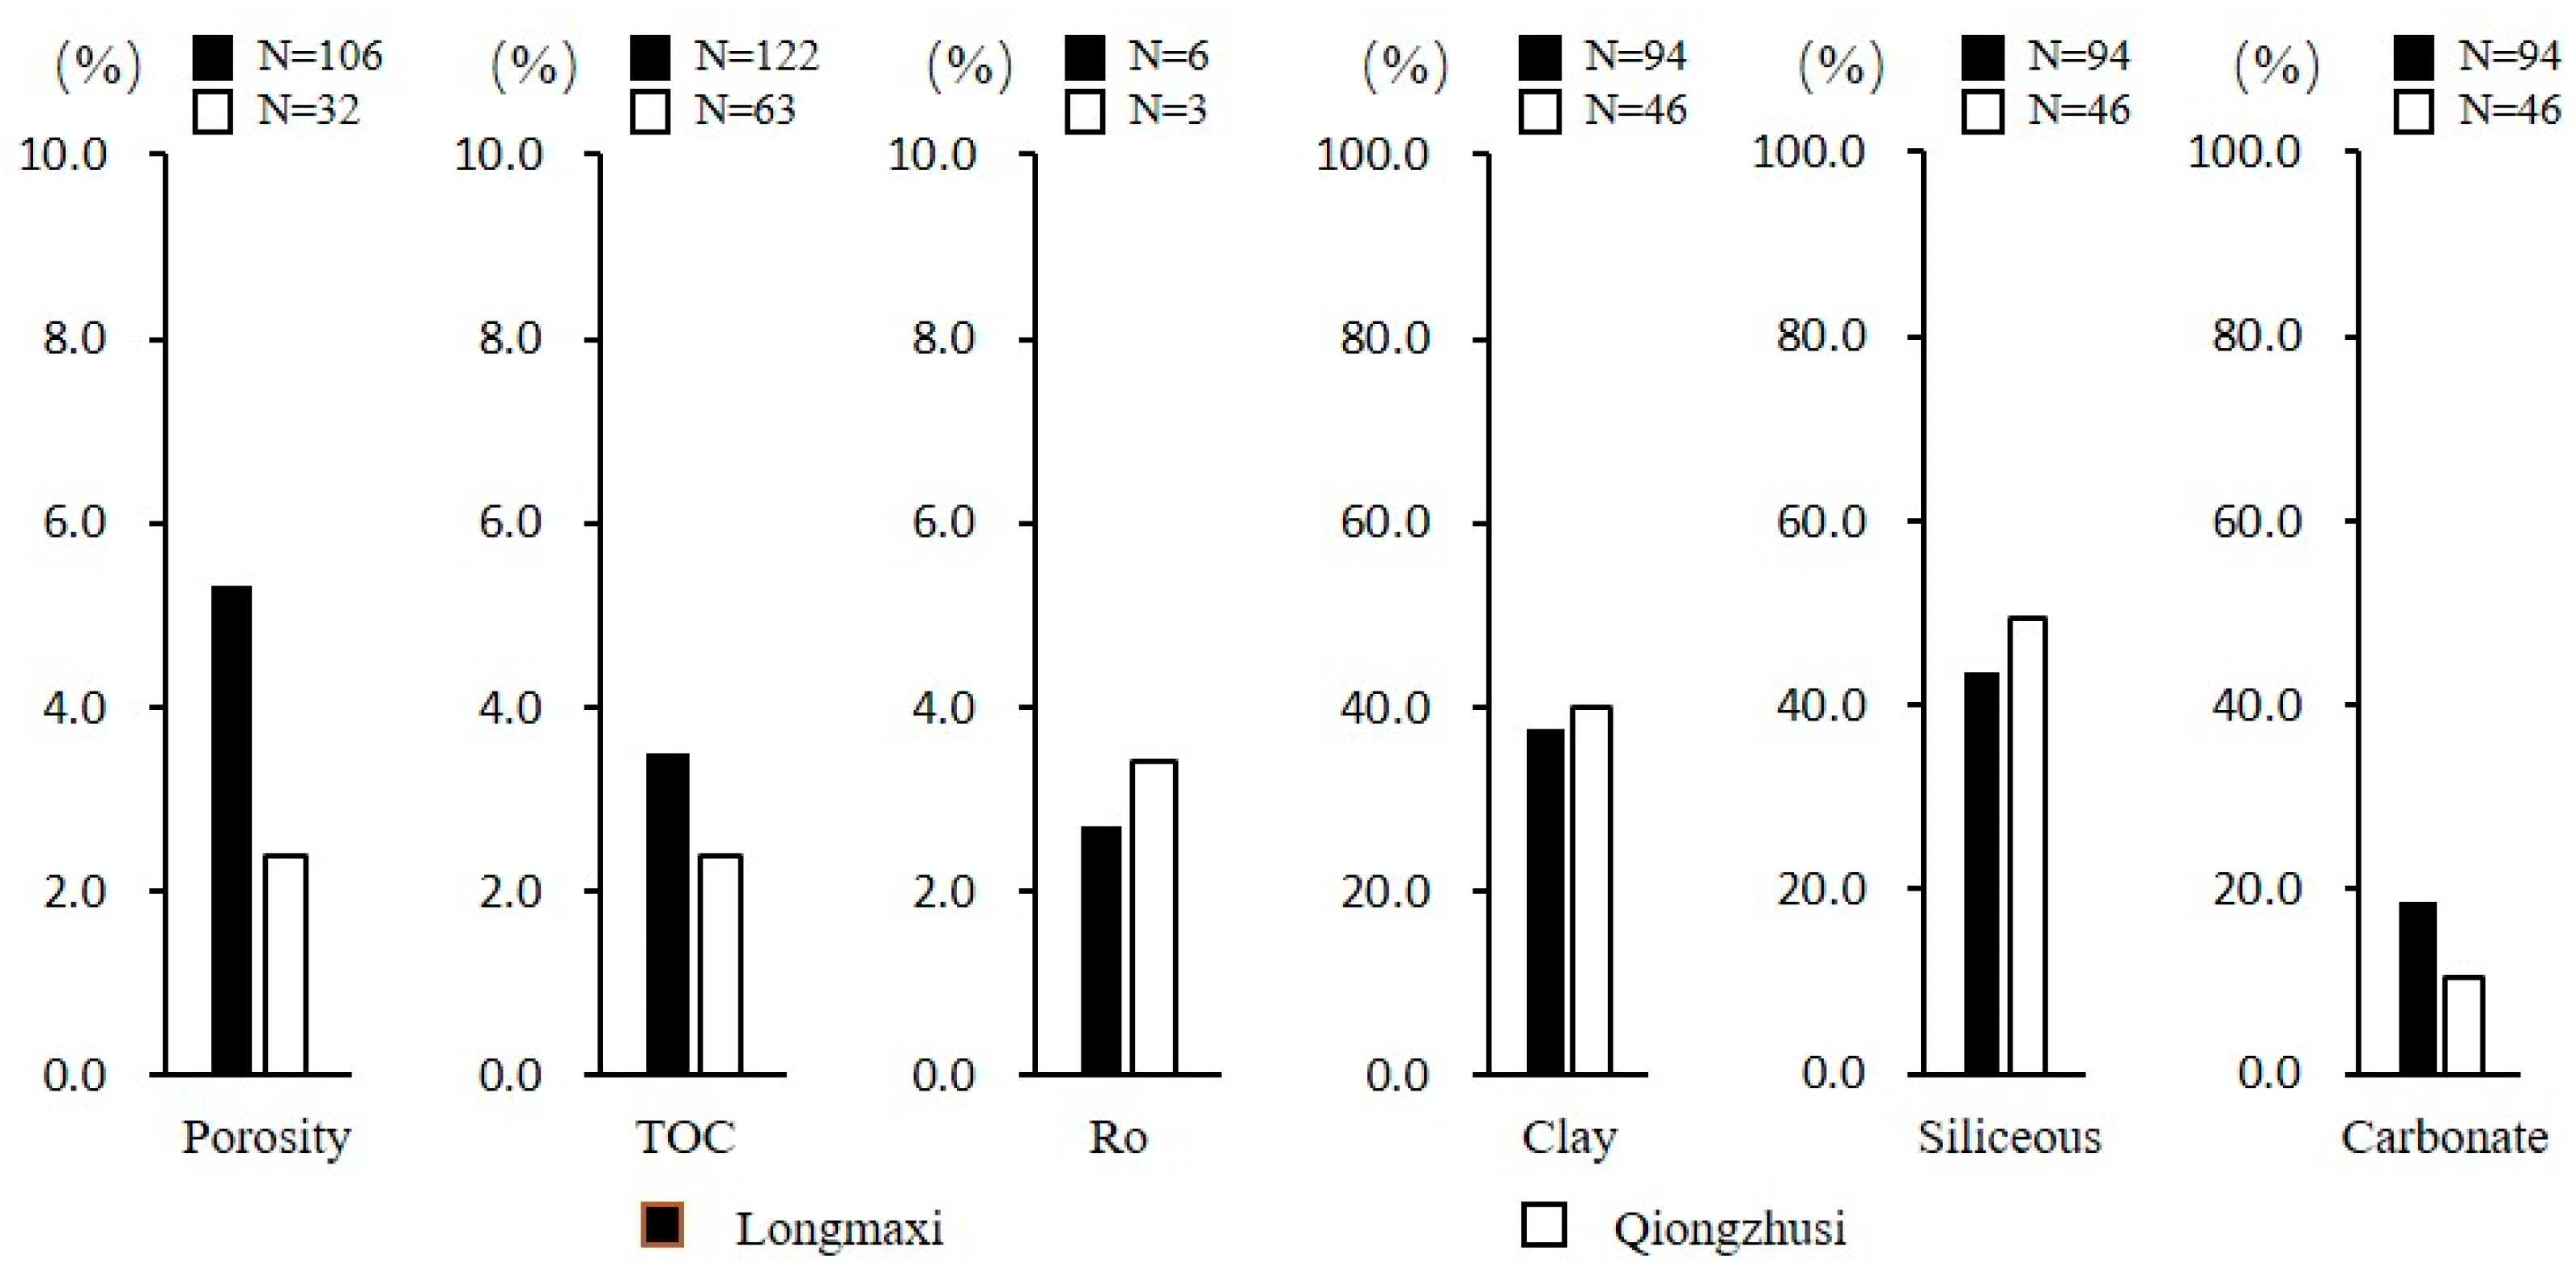
4.6. Organic Pore Development Patterns in the Longmaxi and Qiongzhusi Formations

The patterns of organic pore development in overmature marine shale gas reservoirs based on the pyrolysis simulation results and similarity analyses were proposed. Initially, the organic pores existed as micropores within the kerogen. The size of the organic pores within the kerogen was limited by the solid kerogen framework. In the semi-closed system (e.g., the Longmaxi Formation), part of the generated liquid hydrocarbons (oil and bitumen) remained around the original kerogen, or it filled in the mineral matrix pores after migrating a short distance. The organic gas pores were abundant as a result of bitumen cracking. The micro-gas bubbles grew larger as they moved into the liquid hydrocarbon part according to bubble nucleation theory. In addition, the organic pores deformed but remained within the kerogen and bitumen in the overmature stage as a result of the excess pressure support (Figure 15a). In the open system (e.g., the Qiongzhusi Formation), all of the liquid hydrocarbons flowed away through microcracks. The organic pores were less developed due to a lack of bitumen for secondary cracking. During the overmature stage, the organic pores within the kerogen were deformed and even compacted into dispersed stacked pores (Figure 15b).
If the gas generated was a mixture produced from kerogen and liquid hydrocarbon cracking, it had a strong carbon isotope inversion; in other words, δ13C1(CH4) was larger than δ13C2(C2H6). If the gas was mainly generated from solid kerogen, the inversion of the carbon isotopes was weak [43]. Previous research confirmed a relationship between the sealing capacity and carbon isotope order (Table 8). This geochemical evidence provides additional support regarding the effect of the sealing capacity on bitumen reservation, which is a key process for organic pore development in overmature marine shale gas reservoirs.

5. Conclusions

In this study, a systematic investigation at the macro- to micro-scales and from a static to dynamic state was conducted to explain the influence of sealing effects on organic pore development. The main findings of this work can be summarized as follows:
(1)
The trend in the mineral contents, TOC, and Ro changes with temperature in the semi-closed and open systems indicated that the pressure difference caused by the sealing capacity had limited impacts on the thermal maturity and mineral contents, but it could control the organic carbon content.
(2)
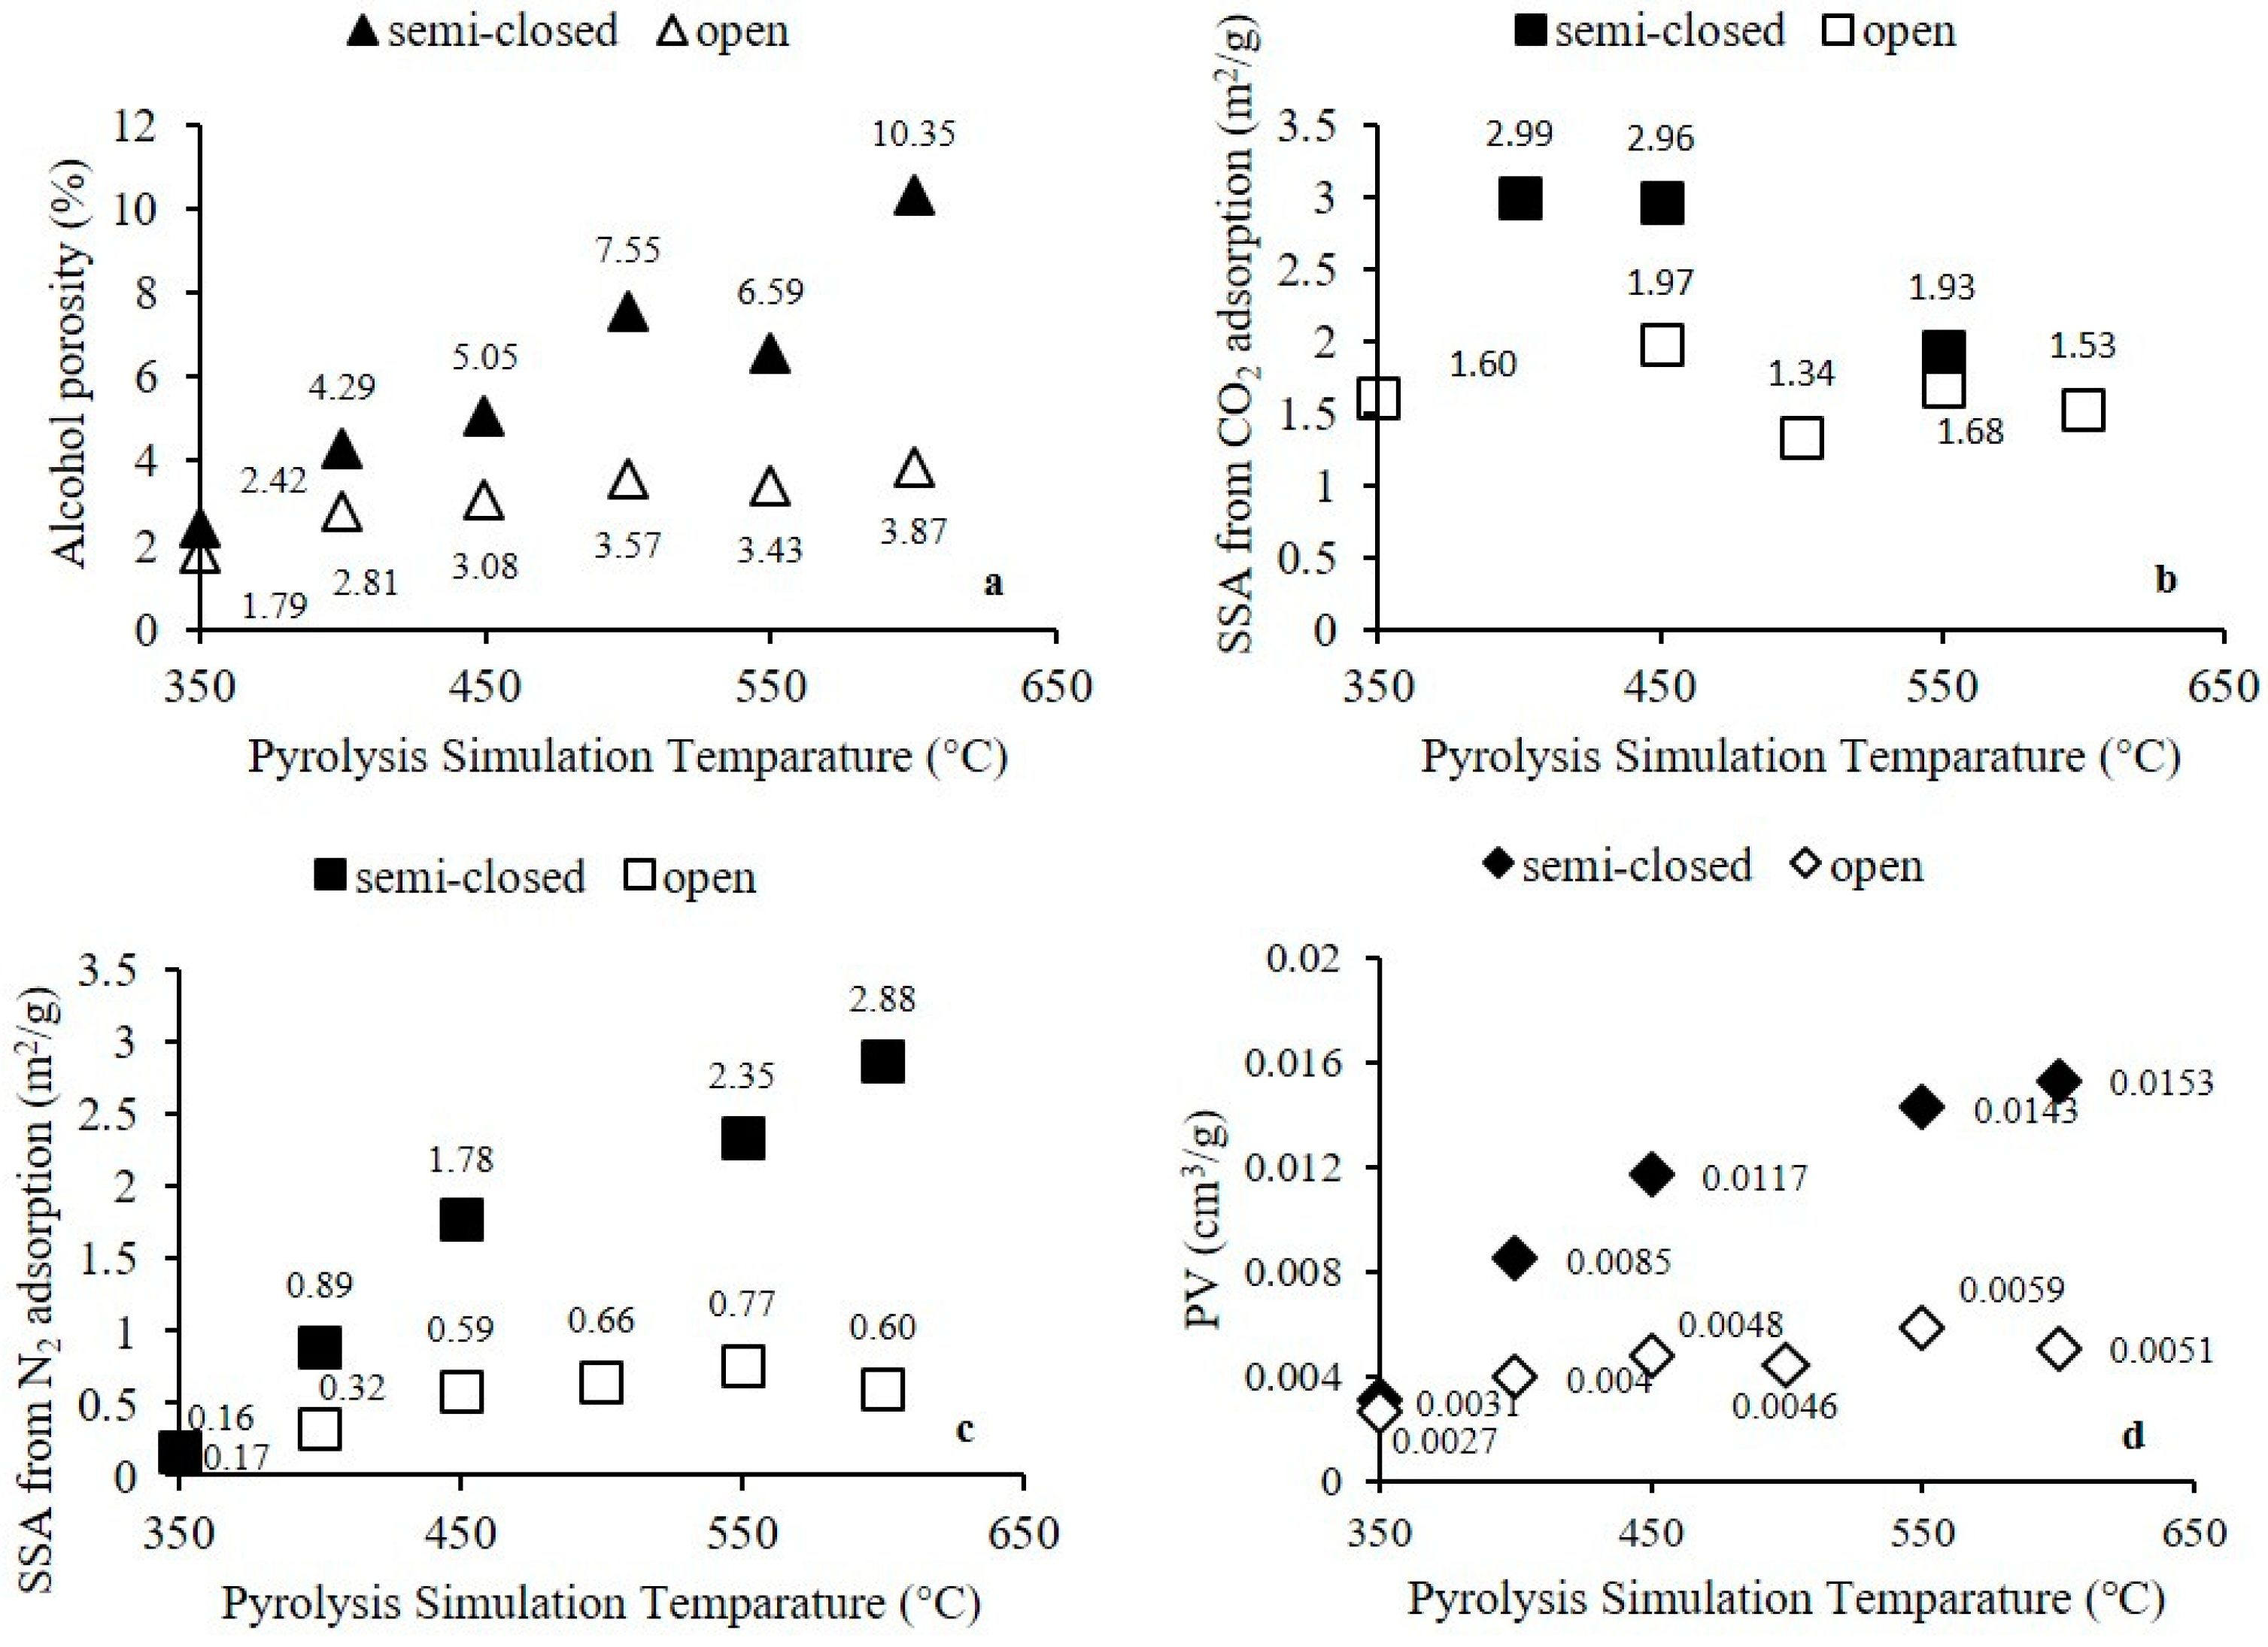
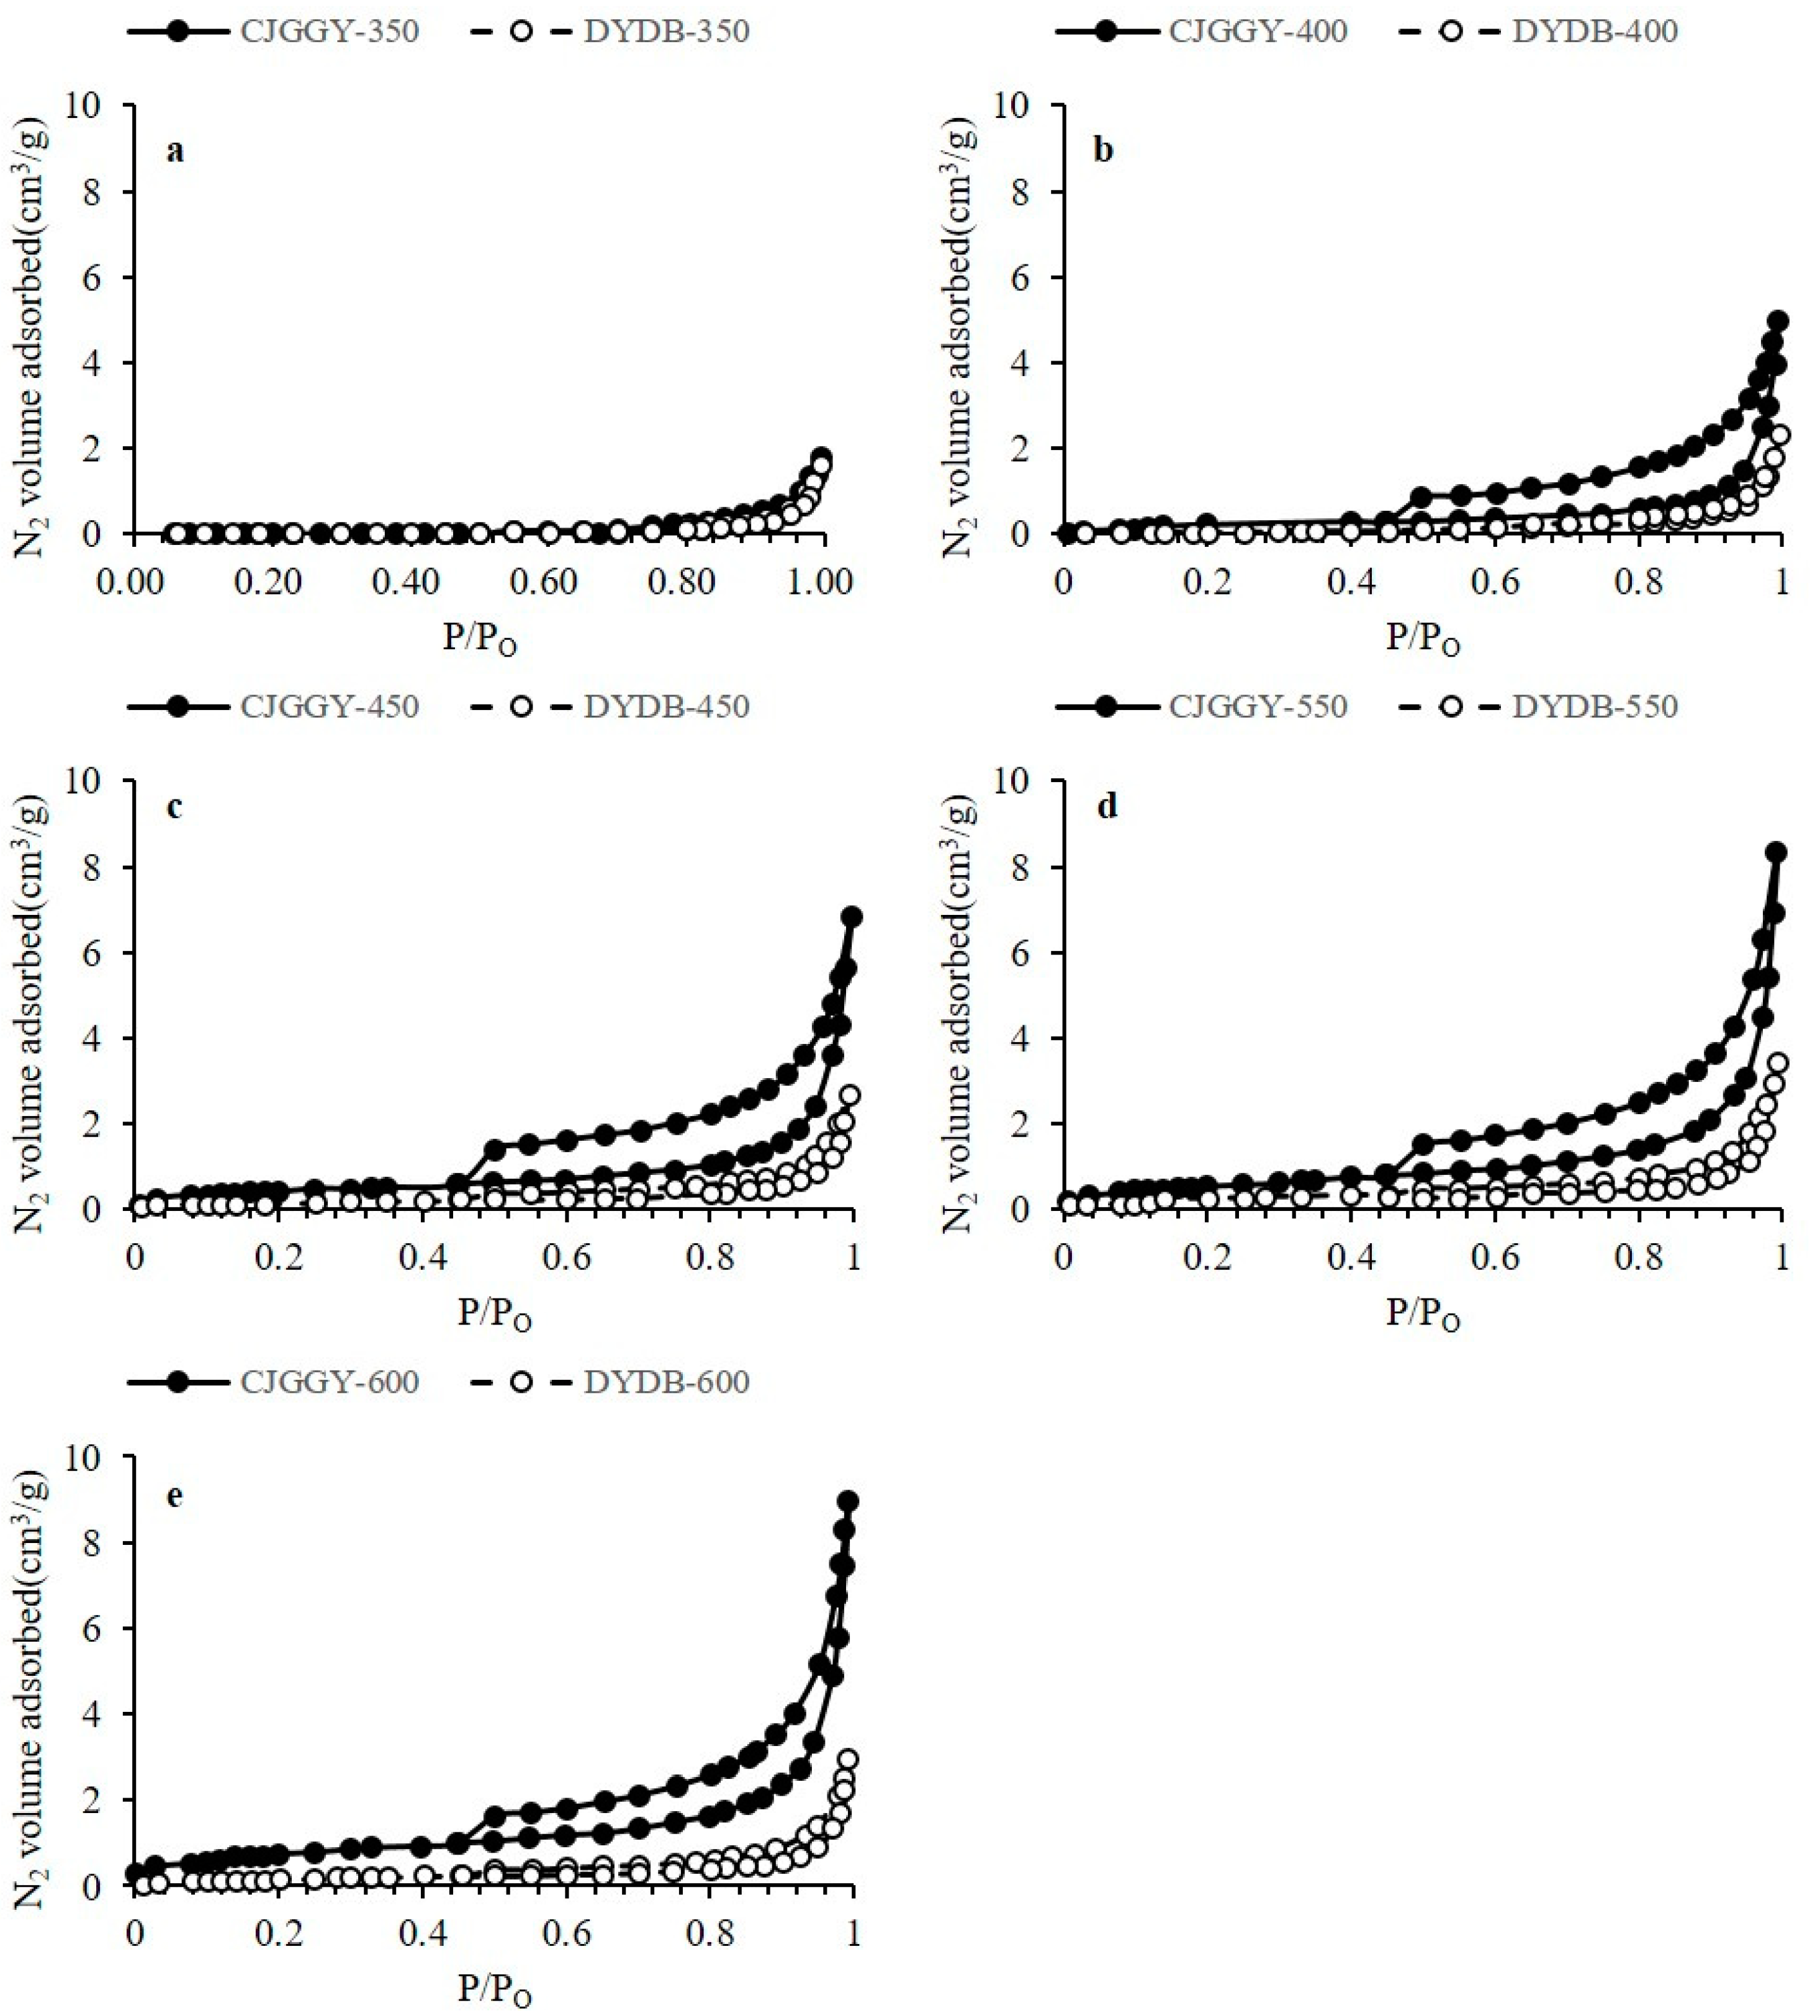
The porosity, SSA, PV, and PD were higher in the semi-closed system than in the open system. These differences mainly occurred in the overmature stage. Moreover, based on the comparison of the PV changes in different pores at different thermal stages, the results showed that the macropores and mesopores were easily affected by the sealing conditions, but the micropores were not.
(3)
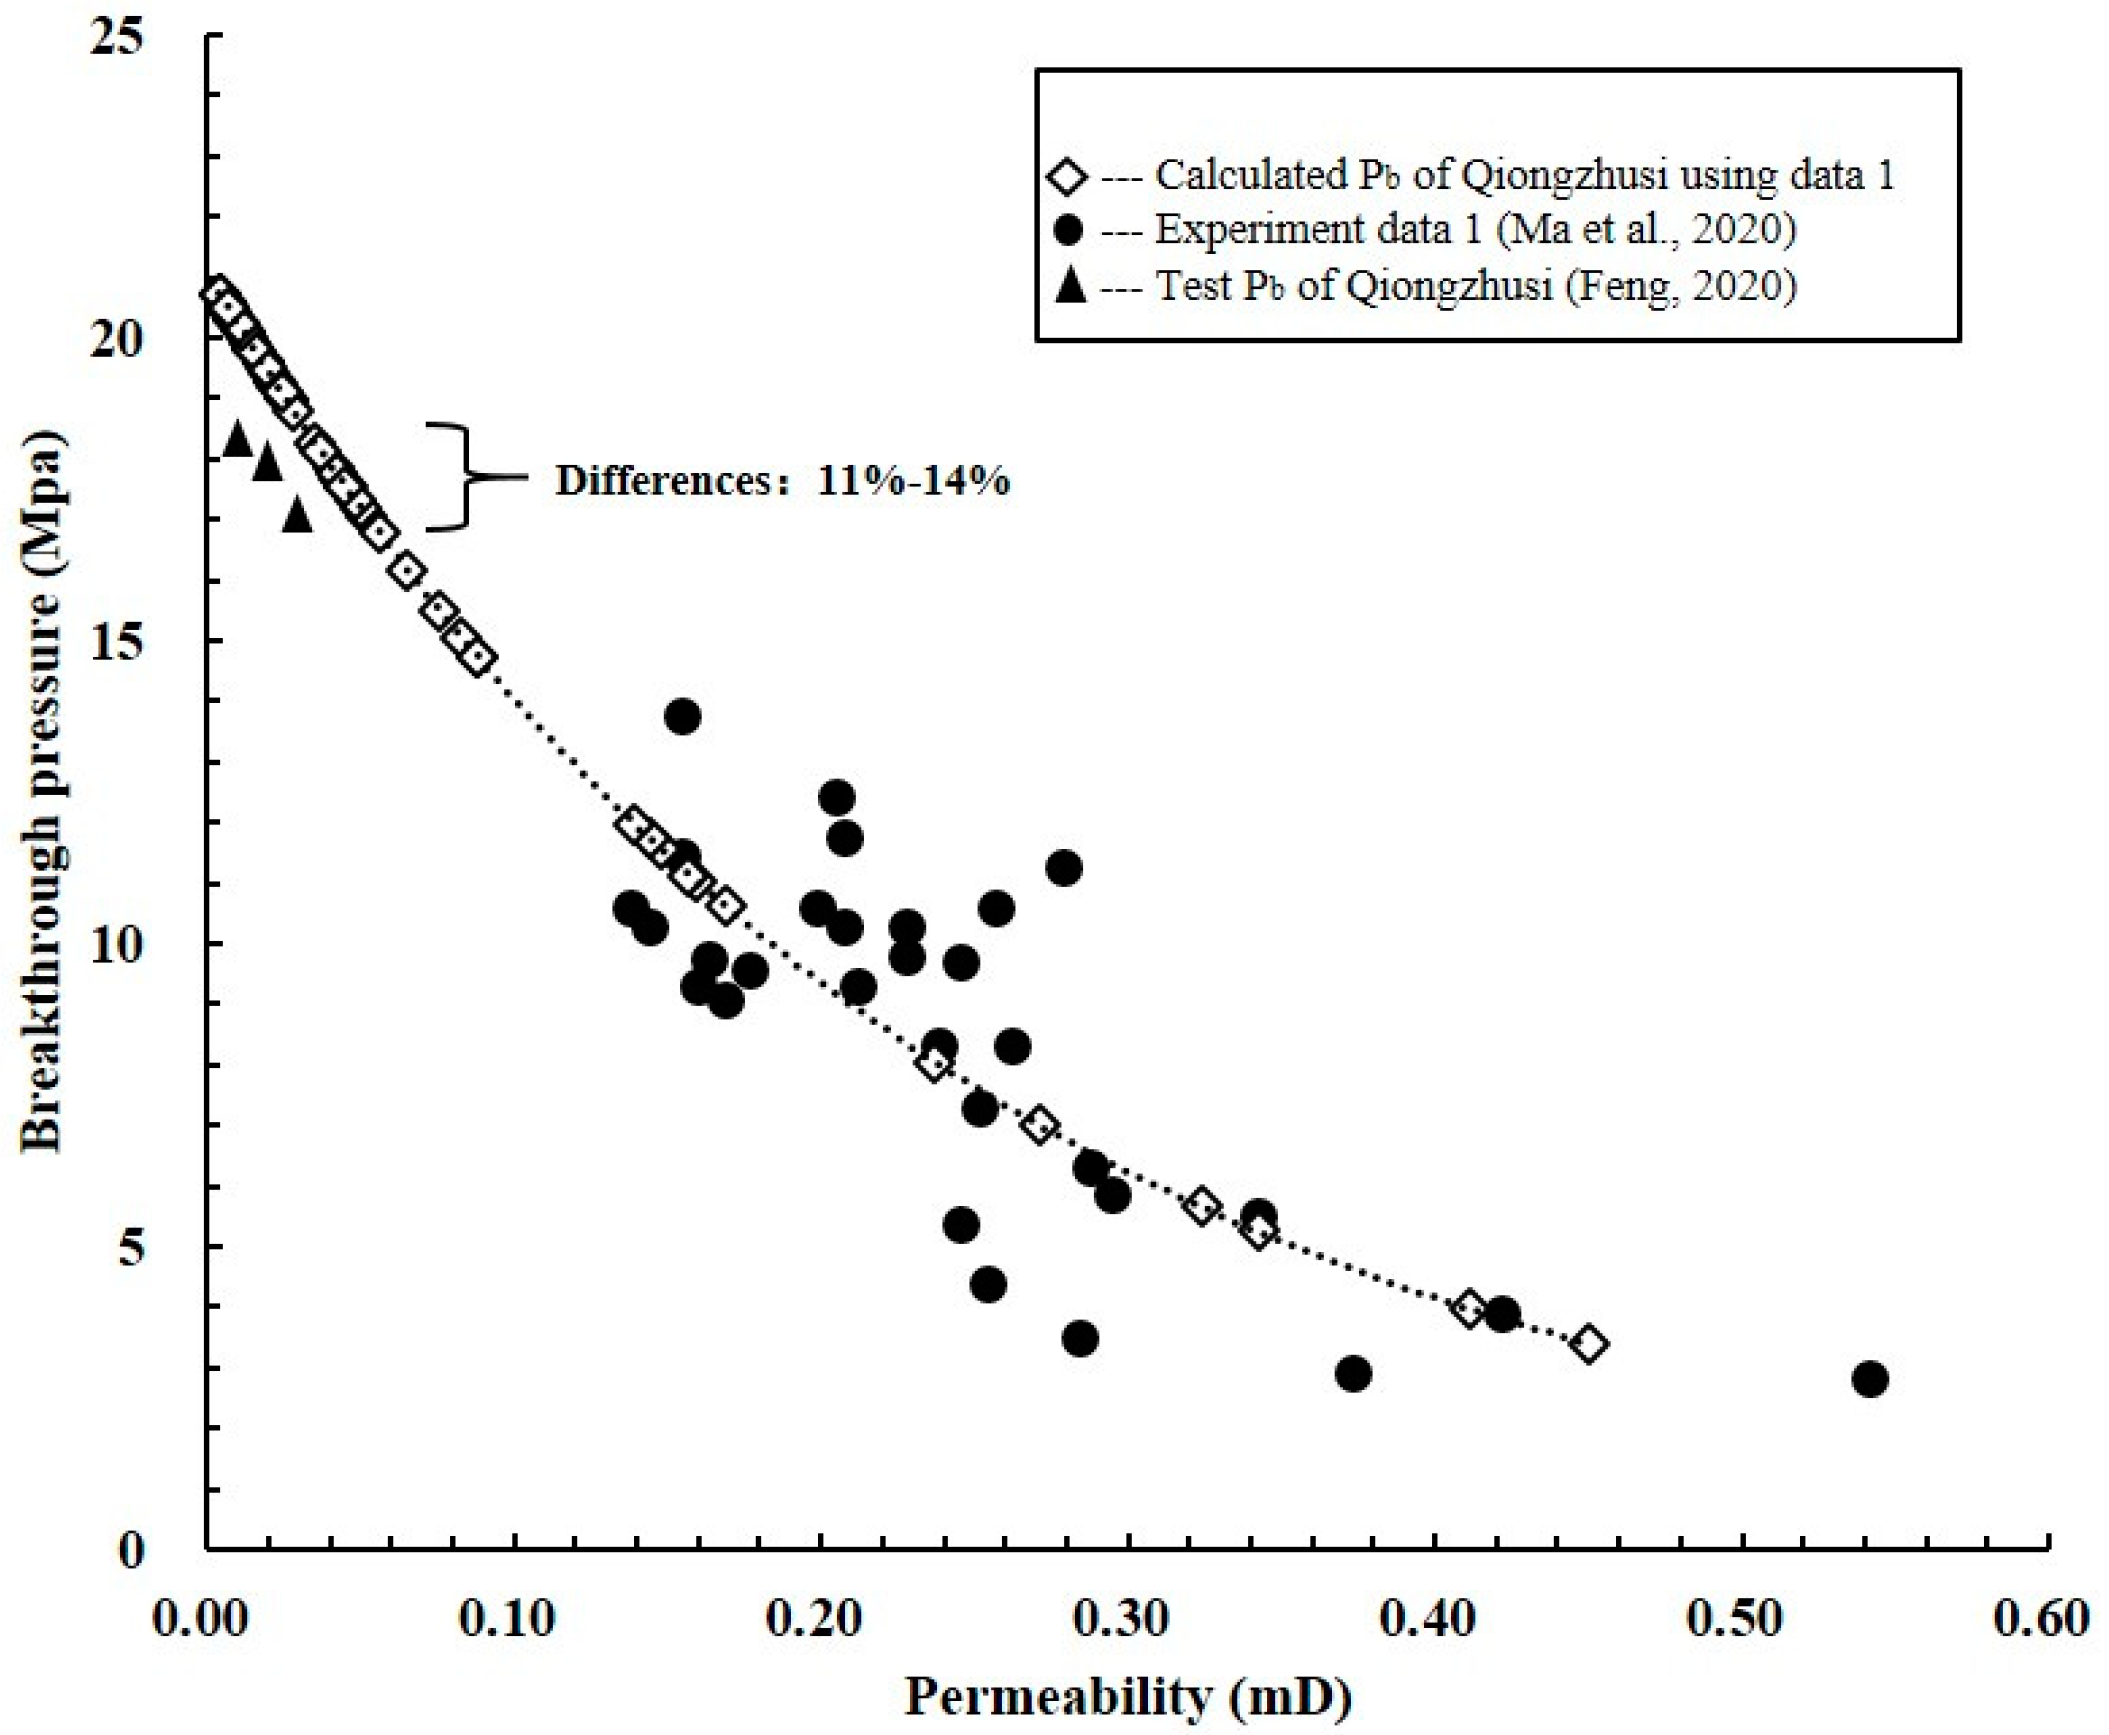
On the macro-scale, the sealing capacity of the Longmaxi floor layer was higher than the sealing capacity of the Qiongzhusi floor layer (quantified using breakthrough calculations). On the micro-scale, the SEM results revealed that organic pores developed in the semi-closed system, and the organic pores on the edge were larger than the organic pores inside the kerogen.
(4)
Finally, the pyrolysis simulation results were validated with the Longmaxi shale and Qiongzhusi Formations properties. The Longmaxi shale is similar to the semi-closed system, and the Qiongzhusi shale is similar to the open system.

Author Contributions

Conceptualization, W.Z.; Methodology, Q.Z.; Validation, H.X., R.L. and K.J.; Formal analysis, Q.Z.; Investigation, Q.Z.; Resources, H.X.; Data curation, X.Z.; Writing—original draft, Q.Z.; Writing—review & editing, H.X., R.L. and K.J.; Visualization, Q.Z.; Supervision, W.Z.; Project administration, Q.Z.; Funding acquisition, Q.Z. All authors have read and agreed to the published version of the manuscript.

Funding

This research was supported by the National Natural Science Foundation of China (grant number 42202189).

Data Availability Statement

The original contributions presented in this study are included in the article. Further inquiries can be directed to the corresponding authors.

Conflicts of Interest

The authors declare no conflict of interest.

References

  1. Delle Piane, C.; Ansari, H.; Li, Z.S.; Mata, J.; Rickard, W.; Pini, R.; Dewhust, D.N.; Sherwood, N. Influence of organic matter type on porosity development in the Wufeng-Longamxi Shale: A combined microscopy, neutron scattering and physisorption approach. Int. J. Coal Geol. 2022, 249, 103880. [Google Scholar] [CrossRef]
  2. Liu, W.; Zhang, C.; Gao, G.; Luo, C.; Hu, X. Controlling factors and evolution laws of shale porosity in Longmaxi Formation, Sichuan Basin. Acta Pet. Sin. 2017, 38, 175–184. [Google Scholar]
  3. Hu, G.; Pang, Q.; Jiao, K.; Hu, C.; Liao, Z. Development of organic pores in the Longmaxi Formation overmature shales: Combined effects of thermal maturity and organic matter composition. Mar. Pet. Geol. 2020, 116, 104314. [Google Scholar] [CrossRef]
  4. Milliken, K.; Rudnicki, M.; Awwiller, D.N.; Zhang, T. Organic matter-hosted pore system, Marcellus Formation (Devonian), Pennsylvania. AAPG Bull. 2013, 97, 177–200. [Google Scholar] [CrossRef]
  5. Pan, B.; Li, Y.; Zhang, M.; Iglauer, S. Effect of total organic carbon (TOC) content on shale wettability at high pressure and high temperature conditions. J. Pet. Sci. Eng. 2020, 193, 107374. [Google Scholar] [CrossRef]
  6. Curtis, M.; Cardott, B.J.; Sondergeld, C.H.; Rai, C.S. Development of organic porosity in the Woodford Shale with increasing thermal maturity. Int. J. Coal Geol. 2012, 103, 26–31. [Google Scholar] [CrossRef]
  7. Chen, L.; Jiang, Z.; Liu, K.; Tan, J.; Gao, F.; Wang, P. Pore structure characterization for organic-rich Lower Silurian shale in the Upper Yangtze Platform, South China: A possible mechanism for pore development. J. Nat. Gas Sci. Eng. 2017, 46, 1–15. [Google Scholar] [CrossRef]
  8. Walters, C.C.; Kliewer, C.E.; Awwiller, D.N.; Rudnicki, M.D.; Passey, Q.R.; Lin, M.W. Influence of turbostratic carbon nanostructures on electrical conductivity in shales. Int. J. Coal Geol. 2014, 122, 105–109. [Google Scholar] [CrossRef]
  9. Kenneth, C.; Emese, M.; Angelique, C. Evolution of porosity and pore geometry in the Permian Whitehill Formation of South Africa—A FE-SEM image analysis study. Mar. Pet. Geol. 2018, 91, 262–278. [Google Scholar]
  10. Jin, Z.; Nie, H.; Liu, Q.; Zhao, J.; Jiang, T. Source and seal coupling mechanism for shale gas enrichment in upper Ordovician Wufeng Formation—Lower Silurian Longmaxi Formation in Sichuan Basin and its periphery. Mar. Pet. Geol. 2018, 97, 78–93. [Google Scholar] [CrossRef]
  11. Li, X.; Jiang, Z.; Song, Y.; Zhai, G.; Bao, S.; Li, Z.; Tang, X.; Wang, P.; Li, T.; Wang, G.; et al. Porosity evolution mechanisms of marine shales at overmaturity stage: Insight from comparable analysis between Lower Cambrian and Lower Silurian inside and at the margin of the Sichuan Basin, South China. Interpretation 2018, 6, T739–T757. [Google Scholar] [CrossRef]
  12. Zhao, J.; Jin, Z.; Hu, Q.; Wang, R. Mineral composition and seal condition implicated in pore structure development of organic-rich Longmaxi shales, Sichuan Basin, China. Mar. Pet. Geol. 2018, 98, 507–522. [Google Scholar] [CrossRef]
  13. Tang, L.; Song, Y.; Jiang, S.; Li, L.; Li, Z.; Li, Q.; Yang, Y. Sealing Mechanism of the Roof and Floor for the Wufeng-Longmaxi Shale Gas in the Southern Sichuan Basin. Energy Fuels 2020, 34, 6999–7018. [Google Scholar] [CrossRef]
  14. Zhang, K.; Song, Y.; Jia, C.; Jiang, Z.; Han, F.; Wang, P.; Yuan, X.; Yang, Y.; Zeng, Y.; Li, Y.; et al. Formation mechanism of the sealing capacity of the roof and floor strata of marine organic-rich shale and shale itself, and its influence on the characteristics of shale gas and organic matter pore development. Mar. Pet. Geol. 2022, 140, 105647. [Google Scholar] [CrossRef]
  15. Jiang, S.; Li, C.; Chen, G. Occurrence of normally-pressured shale gas in China and the United States and their effects on mobility and production: A case study of southeast Sichuan Basin and Appalachia Basin. Pet. Reserv. Eval. Dev. 2022, 12, 399–406. [Google Scholar]
  16. Zhou, W. Interview with Dr. Wen Zhou, Chengdu University of Technology. AAPG Learn Blog. 2020. Available online: https://www.aapg.org/publications/blogs/learn/article/articleid/56649/interview-with-dr-wen-zhou-chengdu-university-of-technology?utm_medium=website&utm_source=See_Also_Sidebar_Text&srsltid=AfmBOooBiyj_By9-cpZ6EwrFE961g9XpXYugu4qMy3t51MQxQFd5B87w (accessed on 18 November 2024).
  17. Wang, P. The Correlation Between Shale Sealing Capacity and the Gas Generation Characteristics of Shale Organic Matter, Minerals Compositions and Pore Structure. Ph.D. Dissertation, University of Chinese Academy of Sciences, Guangzhou Institute of Geochemistry, Guangzhou, China, 2017. [Google Scholar]
  18. Mastalerz, M.; Drobniak, A.; Stankiewicz, A.B. Origin, properties, and implications of solid bitumen in source-rock reservoirs: A review. Int. J. Coal Geol. 2018, 195, 14–36. [Google Scholar] [CrossRef]
  19. Wang, R.; Nie, H.; Hu, Z.; Liu, G.; Liu, W. Controlling effect of pressure evolution on shale gas reservoirs: A case study of the Wufeng-Longmaxi Formation in the Sichuan Basin. Tianranqi Gongye/Nat. Gas Ind. 2020, 40, 1–11. [Google Scholar]
  20. He, C.; Li, T. Studying advances in effects of pressure on organic matter maturation. Acta Sedimentol. Sin. 2018, 36, 1041–1047. [Google Scholar]
  21. Shi, M.; Yu, B.; Zhang, J.; Huang, H.; Yuan, Y.; Li, B. Evolution of organic pores in marine shales undergoing thermocompression: A simulation experiment using hydrocarbon generation and expulsion. J. Nat. Gas Sci. Eng. 2018, 59, 406–413. [Google Scholar] [CrossRef]
  22. Shao, D.; Zhang, T.; Zhang, L.; Li, Y.; Meng, K. Effects of pressure on gas generation and pore evolution in thermally matured calcareous mudrock: Insights from gold-tube pyrolysis of the Eagle Ford Shale using miniature core plugs. Int. J. Coal Geol. 2022, 252, 103936. [Google Scholar] [CrossRef]
  23. Song, D.; Tuo, J.; Dai, S.; Wu, C.; Sun, L.; Zhang, M.; Su, L. New insights into the role of system sealing capacity in shale evolution under conditions analogous to geology: Implications for nanopore evolution. Mar. Pet. Geol. 2022, 143, 105831. [Google Scholar] [CrossRef]
  24. Zhao, W.; Li JYang TWang, S.; Huang, J. Geological difference and its significance of marine shale gases in South China. Pet. Explor. Dev. Online 2016, 43, 547–559. [Google Scholar] [CrossRef]
  25. Liu, R.; Zhou, W.; Xu, H.; Zhou, Q.; Jiang, K.; Shang, F.; Gao, W.; Song, W.; Liu, D.; Zhao, H.; et al. Impact of mineral and sealing systems on the pore characteristics of the Qiongzhusi Formation Shale in the southern sichuan basin. ACS Omega 2021, 7, 15821–15840. [Google Scholar] [CrossRef] [PubMed]
  26. Zhou, W.; Xu, H.; Yu, Q.; Xie, R.; Deng, K. Shale gas-bearing property differences and their genesis between Wufeng-Longmaxi Formation and Qiongzhusi Formation in Sichuan Basin and surrounding areas. Lithol. Reserv. 2016, 28, 18–25. [Google Scholar]
  27. Jiang, P.; Wu, J.; Zhu, Y.; Zhang, D.; Wu, W.; Zhang, R.; Wu, Z.; Wang, Q.; Yang, Y.; Yang, X.; et al. Enrichment conditions and favorable areas for exploration and development of marine shale gas in Sichuan Basin. Acta Sedimentol. Sin. 2023, 44, 92–109. [Google Scholar]
  28. Shi, J.; Jin, Z.; Liu, Q.; Zhang, R.; Huang, Z. Cyclostratigraphy and astronomical tuning of the middle Eocene terrestrial successions in the Bohai Bay Basin, Eastern China. Glob. Planet. Change 2019, 174, 115–126. [Google Scholar] [CrossRef]
  29. Li, X.; Pan, I.; Wu, W.; Yan, J.; Lu, Y. Shale gas comparision and evaluation of Longmaxi Formation and Qiongzhusi Formation of lower Palaeozoic in the area of southern Sichuan. Petrochem. Ind. Appl. 2016, 1, 101–108. [Google Scholar]
  30. Shi, J.; Jin, Z.; Liu, Q.; Huang, Z. Depositional process and astronomical forcing model of lacustrine fine-grained sedimentary rocks: A case study of the early Paleogene in the Dongying Sag, Bohai Bay Basin. Mar. Pet. Geol. 2020, 113, 103995. [Google Scholar] [CrossRef]
  31. Fu, X.; Qin, J.; Teng, G.; Wang, X. Evaluation on Dalong Formation source rock in the north Sichuan Basin. Pet. Geol. Exp. 2010, 32, 567–577. [Google Scholar]
  32. Dai, H.; Shen, B.; Li, K.; Zhang, X.; Xu, X.; Xu, Z.; Zhou, J. Characteristics and hydrocarbon generation process of the organic-rich shale of Permian Dalong Formation in North Sichuan: Pyrolysis experiments with geological constraint. J. Nanjing Univ. (Nat. Sci.) 2020, 56, 383–392. [Google Scholar]
  33. Guo, J.; Hu, G.; He, K.; Mi, J.; Tian, L.; He, F.; Guo, C.; Lu, M. Geochemical characteristics and sedimentary environment of source rocks of Permian Dalong Formation in Northern Sichuan Basin. Lithol. Reserv. 2023, 35, 139–152. [Google Scholar]
  34. Teng, G.; Qin, J.; Fu, X.; Li, W.; Rao, D.; Zhang, M. Basin conditions of marine hydrocarbon accumulation in northwest Sichuan Basin. Pet. Geol. Exp. 2008, 30, 479–483. [Google Scholar]
  35. Wei, S.; He, S.; Pan, Z.; Guo, X.; Yang, R.; Dong, T.; Yang, W. Models of shale gas storage capacity during burial and uplift: Application to Wufeng-Longmaxi shales in the Fuling shale gas field. Mar. Pet. Geol. 2019, 109, 233–244. [Google Scholar] [CrossRef]
  36. Song, Y.; Liu, C.; Gao, H.; Li, S.; Zhang, P.; Wang, Z.; Han, Y. Chemical characteristics of flowback water and production characteristics of Zhaotong shale gas wells. Nat. Gas Explor. Dev. 2020, 43, 102–109. [Google Scholar]
  37. Zhang, G.; Nie, H.; Tang, X. Evaluation of shale gas preservation conditions based on formation water index: A case study of Wufeng-Longmaxi Formation in Southeastern Chongqing. Reserv. Eval. Dev. 2021, 11, 47–55. [Google Scholar]
  38. Wu, T.; Pan, Z.; Connell, L.D.; Liu, B.; Fu, X.; Xue, Z. Gas breakthrough pressure of tight rocks: A review of experimental methods and data. J. Nat. Gas Sci. Eng. 2020, 81, 103408. [Google Scholar] [CrossRef]
  39. Xu, L.; Ye, W.; Chen, B. A new approach for determination of gas breakthrough in saturated materials with low permecapacity. Engingering Geol. 2018, 241, 121–131. [Google Scholar] [CrossRef]
  40. Ma, C.; Lin, C.; Dong, C.; Elsworth, D.; Wu, S.; Wang, X.; Sun, X. Determination of the critical flow pore diameter of shale caprock. Mar. Pet. Geol. 2020, 112, 104042. [Google Scholar] [CrossRef]
  41. Feng, G. High-Temperature High-Pressure Methane Adsorption and Shale Gas Occurrence in Lower Cambrian Shale, Upper Yangtze Area. Ph.D. Dissertation, China University of Mining and Technology, Xuzhou, China, 2020. [Google Scholar]
  42. Hartkopf-Froder, C.; Konigshof, P.; Littke, R.; Schwarzbauer, J. Optical thermal maturity parameters and organic geochemical alteration at low grade diagenesis to anchimetamorphism A review. Int. J. Coal Geol. 2015, 150–151, 74–119. [Google Scholar] [CrossRef]
  43. Milkov, A.; Faiz, M.; Etiope, G. Geochemistry of shale gases from around the world: Composition, origins, isotope reversals and rollovers, and implications for the exploration of shale plays. Org. Geochem. 2020, 143, 103997. [Google Scholar] [CrossRef]
Figure 1. Geographic locations of the well sites and stratigraphic columns of the Longmaxi and Qiongzhusi Formations. The floor of the Longmaxi Formation is composed of the limestone of the Baota Formation. The floor of the Qiongzhusi Formation, where the Madiping layer is missing, is composed of the Dengying Formation, and they are separated by the Tongwan unconformity (modified from [24,25,26,27]).
Energies 18 00193 g001
Figure 2. Comparative analyses of the average porosity, TOC, Ro, and mineral content of the First Members of the Longmaxi and Qiongzhusi Formations in selected wells. The well data for the First Member of the Longmaxi Formation are from wells WA, WB, Ning 201, Ning203, JY1, and JY2. The well data for the First Member of the Qiongzhusi Formation are from wells WA and WB (the values are from [24,25,26,27]).
Energies 18 00193 g002
Figure 3. Outlook sample of Dalong shale from the Guangyuan Changjianggou area. (a) Outlook samples collection site; (b) Sample used for pyrolysis simulation experiments.
Energies 18 00193 g003
Figure 4. Relationship between the breakthrough pressure and permeability in the Qiongzhusi Formation [40,41].
Energies 18 00193 g004
Figure 5. Micro-sealing conditions observed using SEM. (a) The sample of the semi-closed system was collected from the Sanxingcun outcrop (TOC = 4.5%, Ro = 3.05%), OM pores developed. (b) The sample of the open system was collected from well S2 (TOC = 3.4%, Ro = 1.52%), OM pores did not develop.
Energies 18 00193 g005
Figure 6. Morphology of the organic pores in the semi-closed and open systems. The kerogen oil pores were generated in the (a) semi-closed and (b) open systems; OM–clay mineral complex pores in the (c) semi-closed and (d) open systems; OM shrinkage cracks in the (e) semi-closed and (f) open systems; bitumen pores in the (g) semi-closed and (h) open systems.
Energies 18 00193 g006
Figure 7. Organic pores in the semi-closed and open systems at different temperatures. (a) T = 350 °C, semi-closed system; (b) T = 350 °C, open system; (c) T = 500 °C, semi-closed system; (d) T = 500 °C, open system; (e) T = 600 °C, semi-closed system; and (f) T = 600 °C, open system.
Energies 18 00193 g007
Figure 8. Thermal evolution of (a) porosity, (b,c) SSA, and (d) PV in the semi-closed and open systems.
Energies 18 00193 g008
Figure 9. Carbon dioxide adsorption curves for the semi-closed and open systems at different temperatures: (a) T = 400 °C, (b) T = 450 °C, and (c) T = 550 °C.
Energies 18 00193 g009
Figure 10. Nitrogen adsorption and desorption curves for the semi-closed and open systems at different temperatures: (a) T = 350 °C, (b) T = 400 °C, (c) T = 450 °C, (d) T = 550 °C, and (e) T = 600 °C.
Energies 18 00193 g010
Figure 11. Mercury intrusion curves for the semi-closed and open systems at different temperatures: (a) T = 400 °C, (b) T = 450 °C, and (c) T = 600 °C.
Energies 18 00193 g011
Figure 12. Pore diameter distributions in the semi-closed and open systems from the high-pressure mercury intrusion experiments at different temperatures: (a) T = 400 °C, (b) T = 450 °C, and (c) T = 600 °C.
Energies 18 00193 g012
Figure 13. PV vs. Ro: (a) all pores; (b) macropores; (c) mesopores; and (d) micropores.
Energies 18 00193 g013
Figure 14. Similarity between the pyrolysis simulation results and the Longmaxi and Qiongzhusi Formations’ real properties. The black points represent the pyrolysis simulation results. The red points represent the Longmaxi and Qiongzhusi Formations’ properties that were obtained from lab experiments and filed data.
Energies 18 00193 g014
Figure 15. Thermal evolution patterns of the organic pores in a (a) semi-closed system and (b) open system.
Energies 18 00193 g015
Table 1. Original properties of the Dalong outcrop samples from the Guangyuan Changjianggou area.
SampleMineral Contents (%)Ro (%)TOC (%)OM Type
QuartzPlagioclaseCalciteDolomitePyriteClay
CJG-13953002240.576.46I
CJG-23442444300.59.14I
CJG-3181423540\1.57\
CJG-4534341080.652.17I
CJG-522015492120.761.76I
CJG-6210224458\1.83\
CJG-8162234928\1.97\
CJG-91306312012\1.04I
CJG-10244490617\5.43I
Median21.02.030.035.02.012.00.61.97I
Table 2. Maceral identification and classification of kerogen for the Changjianggou Dalong samples.
SampleSapropelite (%)Vitrinite (%)Exinite (%)Inertinite (%)OM Type
PhytoplanktonAmorphous OMHydrogen-RichNormal Fusinite
CJG-19860500I
CJG-28870500I
CJG-3\\\\\\\
CJG-45870800I
CJG-58850700I
CJG-6\\\\\\\
CJG-8\\\\\\\
CJG-97880500I
CJG-104900600I
Table 3. Experimental parameters for semi-closed (CJGGY) and open (DYDB) systems.
SystemSample
Number
Simulation
Temperature
(°C)
Simulation
Time
(h)
Fluid
Type
Formation
Pressure (MPa)
Lithostatic
Pressure
(MPa)
Semi-closedCJGGY-35035048Brine3789
CJGGY-40040048Brine50125
CJGGY-45045048Brine59148
CJGGY-50050048Brine61153
CJGGY-55055048Brine71176
CJGGY-60060048Brine79196
OpenDYDB-35035048Brine\89
DYDB-40040048Brine\125
DYDB-45045048Brine\148
DYDB-50050048Brine\153
DYDB-55055048Brine\176
DYDB-60060048Brine\196
Table 4. Breakthrough pressures of the Longmaxi Formation (modified from [13]).
LayerStratigraphyLithologyDepth (m)Breakthrough Pressure (MPa)
RoofS1l2Argillaceous shale226238
ShaleS1l1, O3wSiliceous shale2309–232227–34
FloorO2bLimestone233240
Table 5. Breakthrough pressures of the Qiongzhusi Formation (floor layer data are from [41]).
LayerStratigraphyLithologyDepth (m)Breakthrough Pressure (MPa)
Roof1z2Argillaceous shale3080–314119.9
Shale1z1Siliceous shale3141–324520.1
FloorZ2dn4Dolomite3245–33103.4
Table 6. TOC, Ro, and mineral contents in the semi-closed (CJGGY) and open (DYDB) systems.
SystemSampleTOC (%)Ro (%)Mineral Contents (%)
QuartzPlagioclaseCalciteDolomitePyriteClay
ORIGIN1.970.6021.002.0030.0035.002.0012.00
Semi-ClosedCJGGY-3501.411.1810.000.0035.0038.001.0016.00
CJGGY-4001.401.479.001.0044.0034.000.0012.00
CJGGY-4501.241.854.005.0047.0023.000.0021.00
CJGGY-5001.112.1610.001.0034.0038.001.0016.00
CJGGY-5501.152.506.001.0042.0040.001.0010.00
CJGGY-6001.082.634.003.0041.0040.001.0011.00
OpenORIGIN1.970.6021.002.0030.0035.002.0012.00
DYDB-3500.991.2916.001.0035.0040.002.006.00
DYDB-4000.951.3912.001.0021.0058.001.007.00
DYDB-4500.941.8114.001.0023.0054.001.007.00
DYDB-5001.012.1215.001.0024.0053.002.005.00
DYDB-5500.982.3515.001.0026.0050.002.006.00
DYDB-6001.012.4314.001.0025.0053.002.005.00
Table 7. Pore structure parameters in the semi-closed and open systems.
Temperature (°C)SystemPorosity (%)CO2 SSA (m2/g)N2 SSA (m2/g)PV (cm3/g)
OriginSemi-closed0.441.710.270.0012
3502.42\0.160.0031
4004.292.990.890.0085
4505.052.961.780.0117
5007.55\\\
5506.591.932.350.0143
60010.35\2.880.0153
OriginOpen0.441.710.270.0012
3501.791.600.170.0027
4002.81\0.320.0040
4503.081.970.590.0048
5003.571.340.660.0046
5503.431.680.770.0059
6003.871.530.600.0051
Table 8. Correlation between the sealing capacity and carbon isotope composition (modified from [14]).
Sealing Capacityδ13C1(CH4) (‰)δ13C2(C2H6) (‰)δ13C1(CH4) − δ13C2(C2H6) (‰)
Good−29.5 to −31.0−34.7 to −35.94.9 to 6.0
Poor−29.6 to −41.4−29.0 to −39.4−10 to 1.4
Disclaimer/Publisher’s Note: The statements, opinions and data contained in all publications are solely those of the individual author(s) and contributor(s) and not of MDPI and/or the editor(s). MDPI and/or the editor(s) disclaim responsibility for any injury to people or property resulting from any ideas, methods, instructions or products referred to in the content.

