
Petroleum System Analysis and Migration Pathways in the Late Paleozoic Source Rock Strata and Sandstone Reservoirs in the Ordos Basin

Abstract
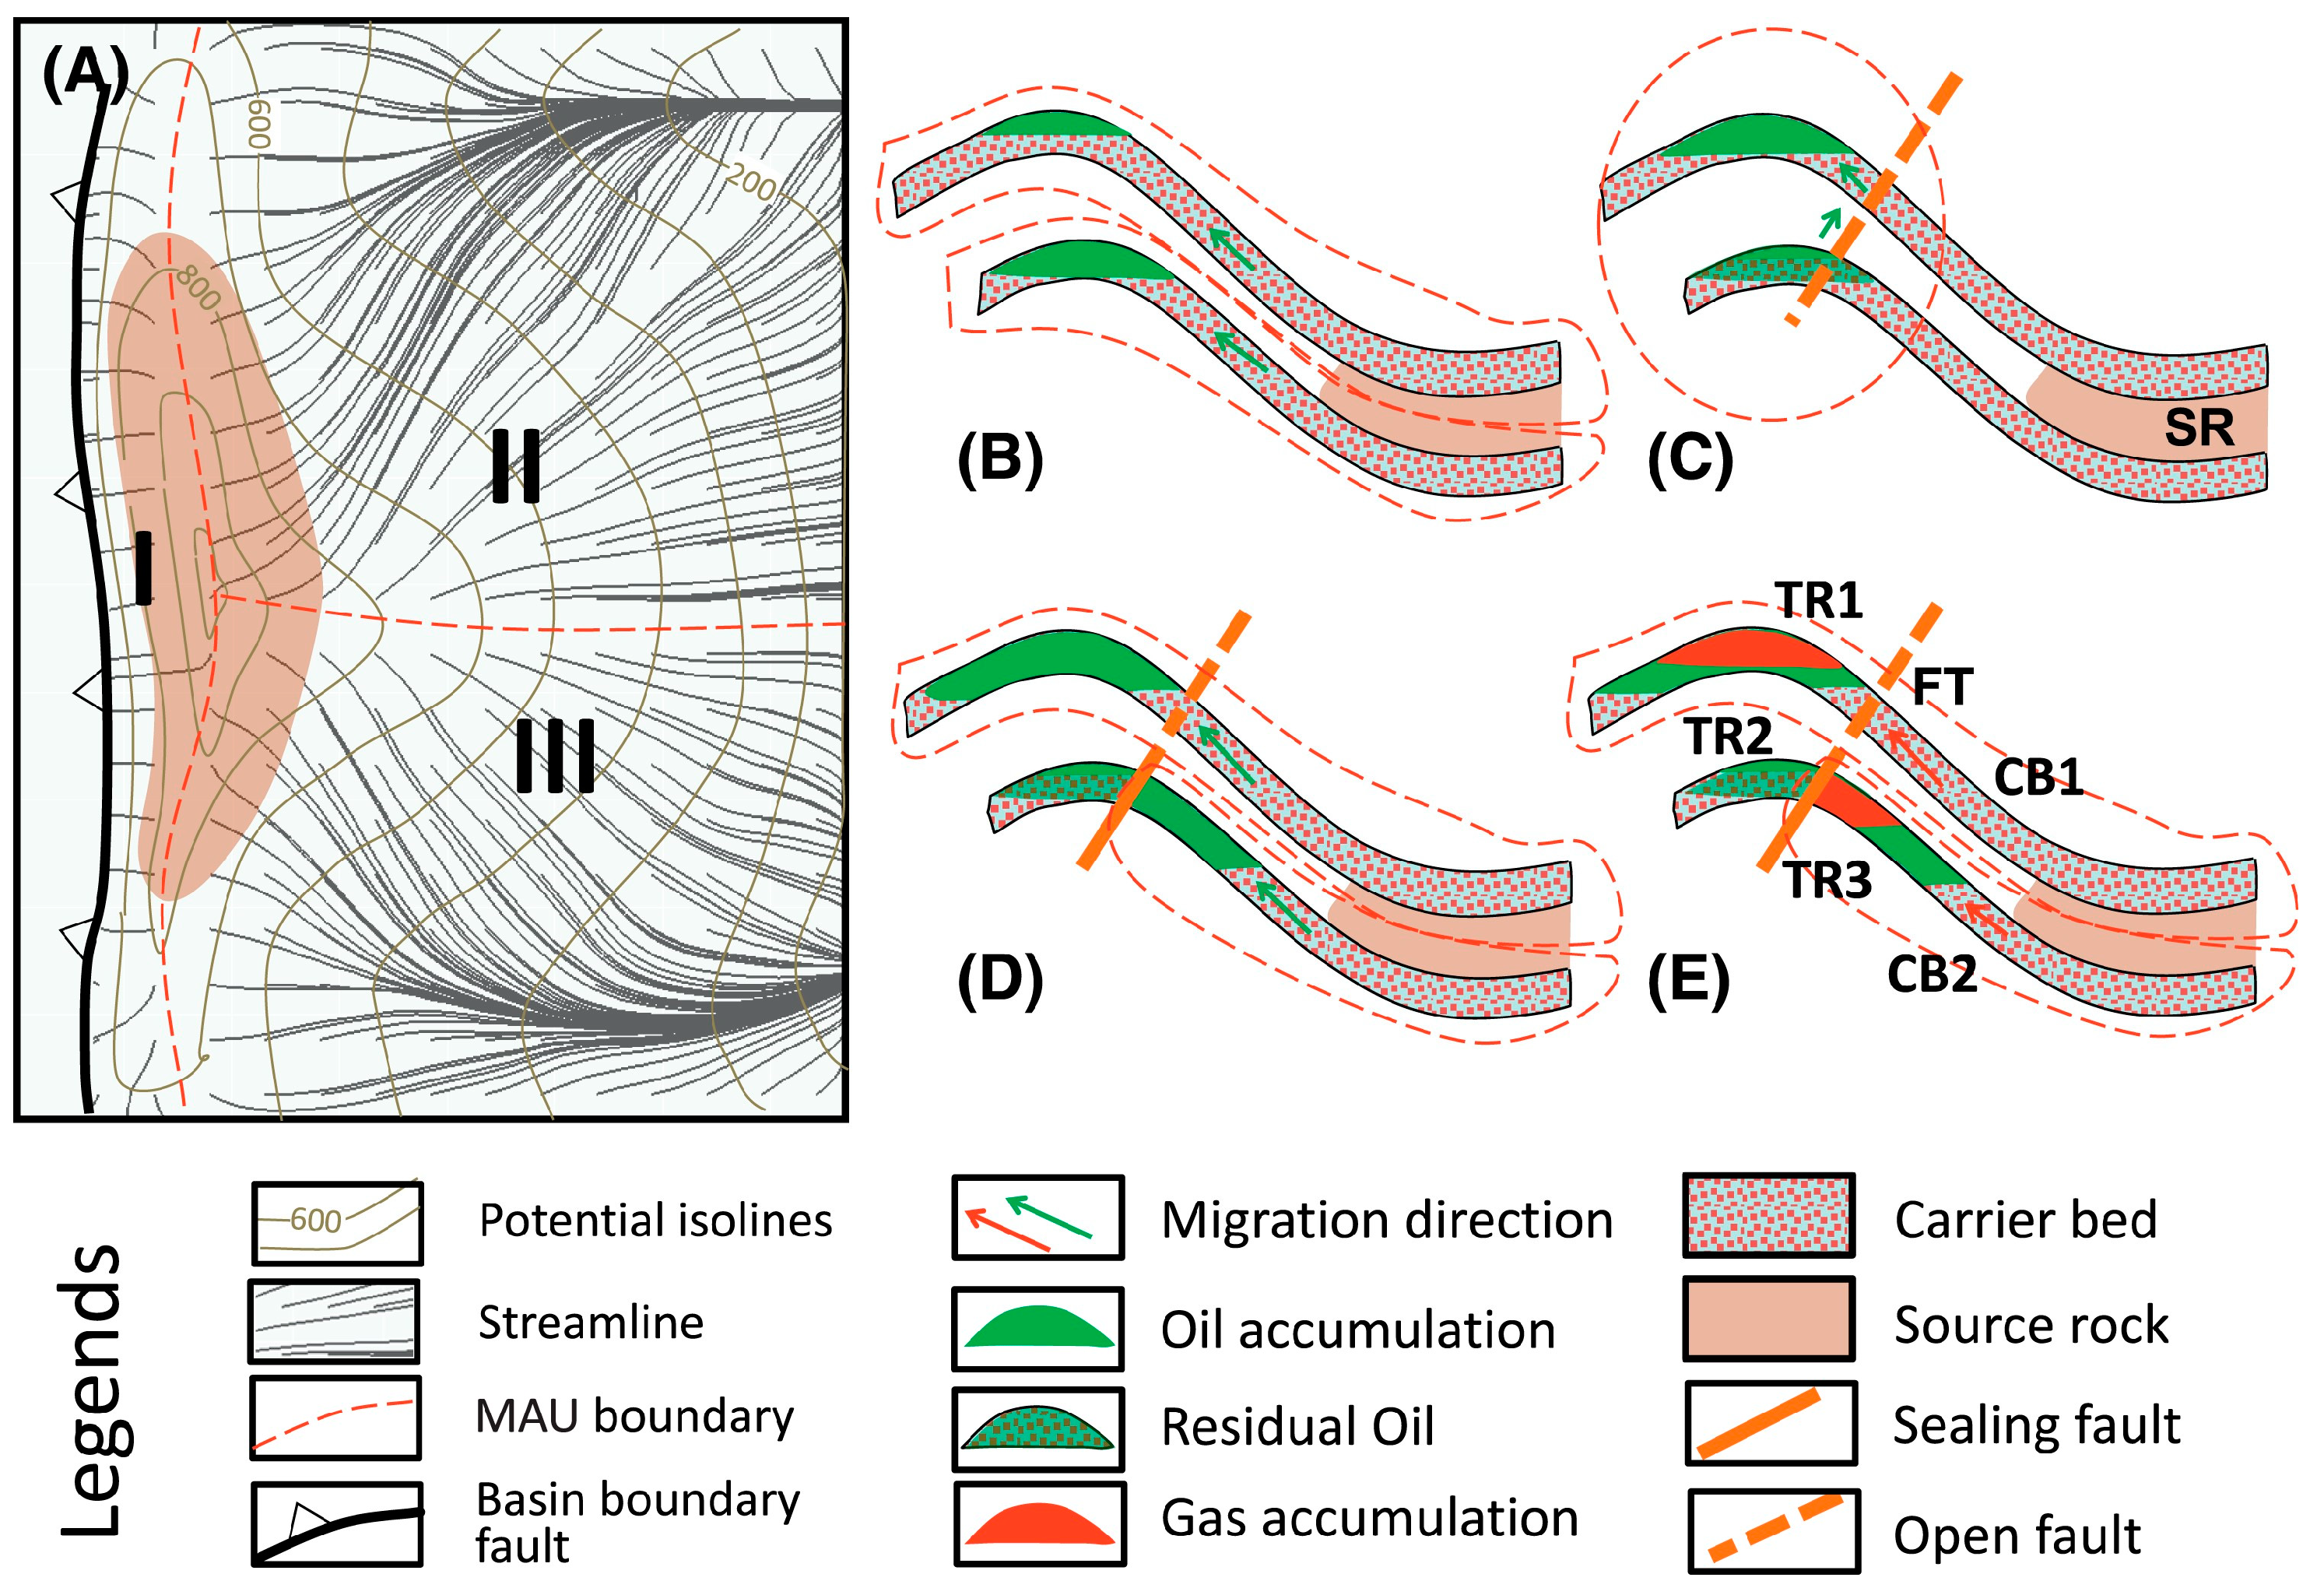
:1. Introduction
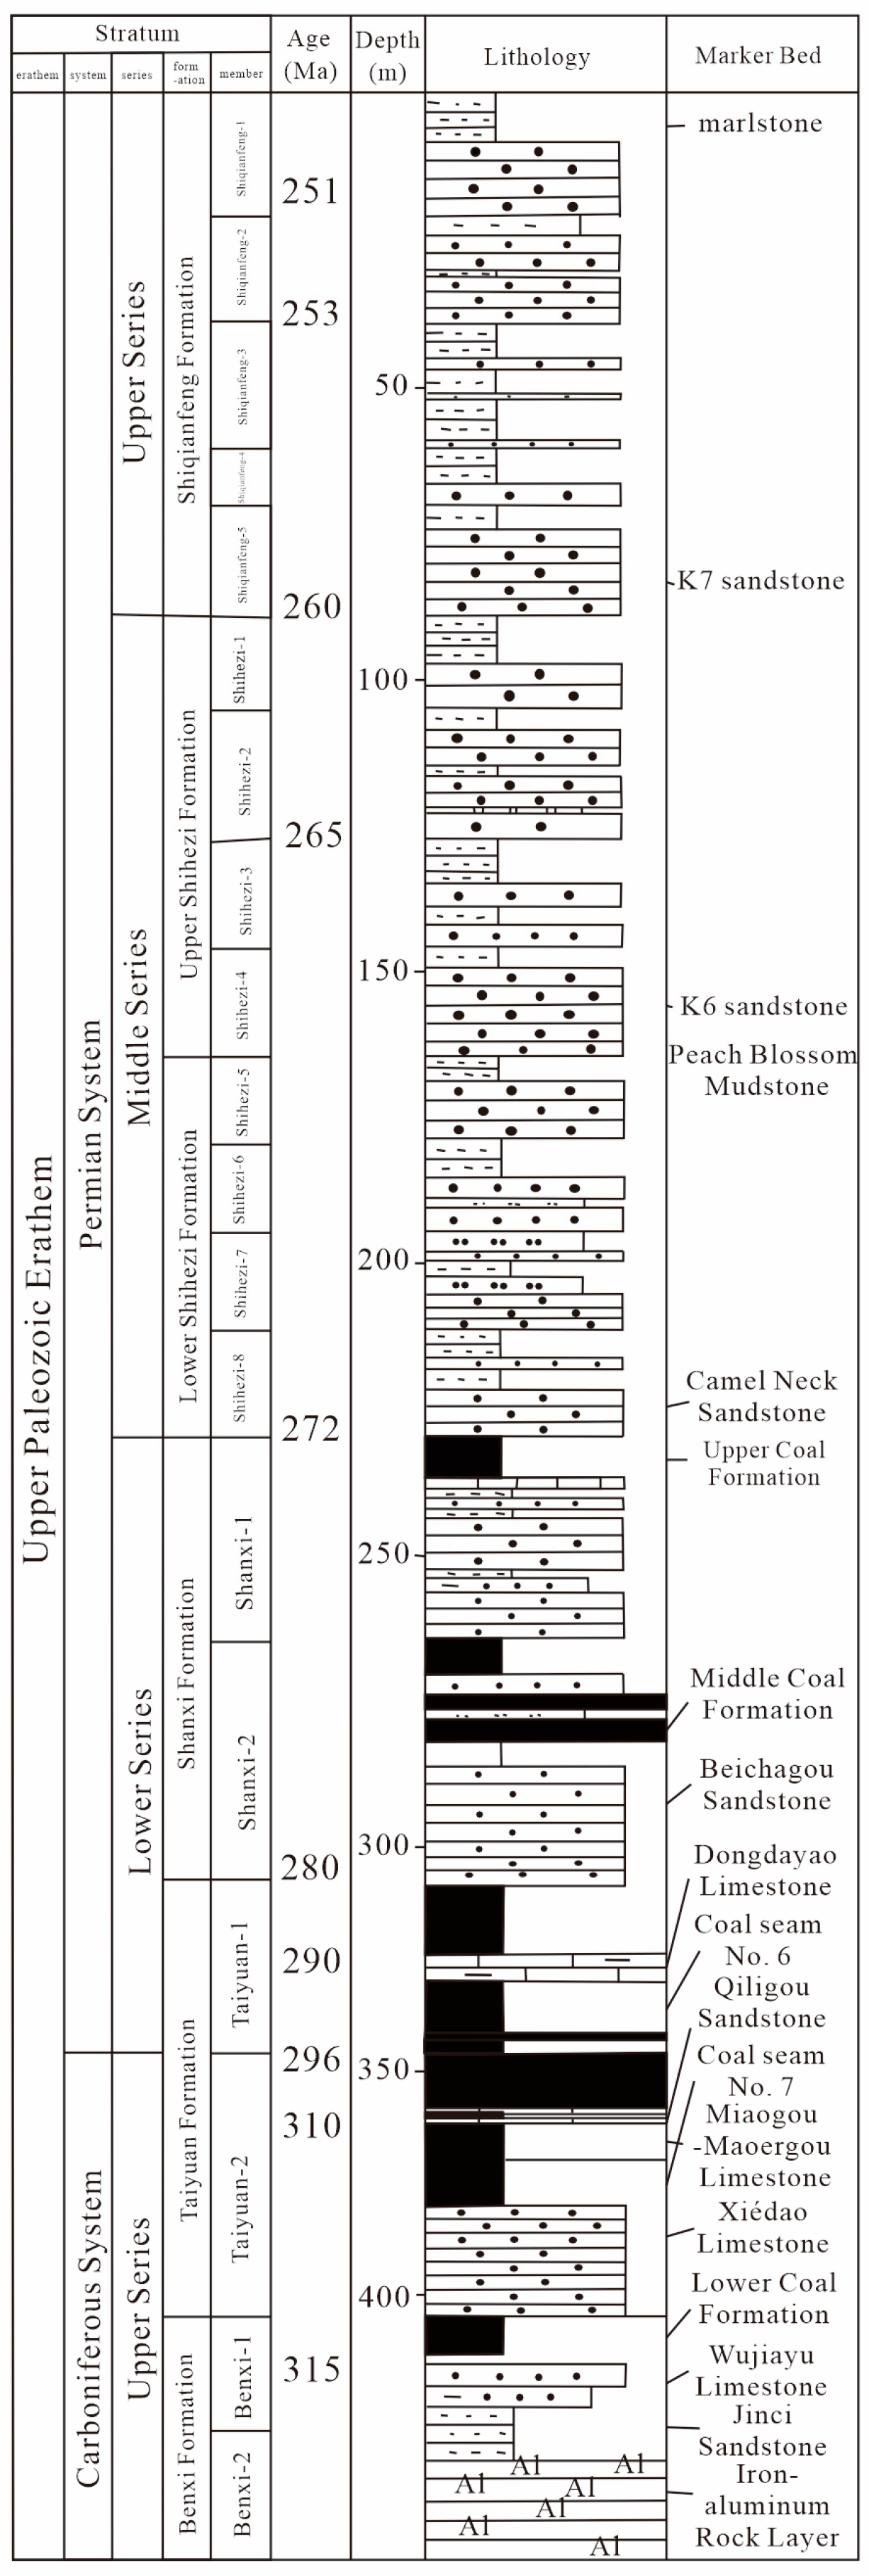
2. Geological Setting
3. Experimental Methods
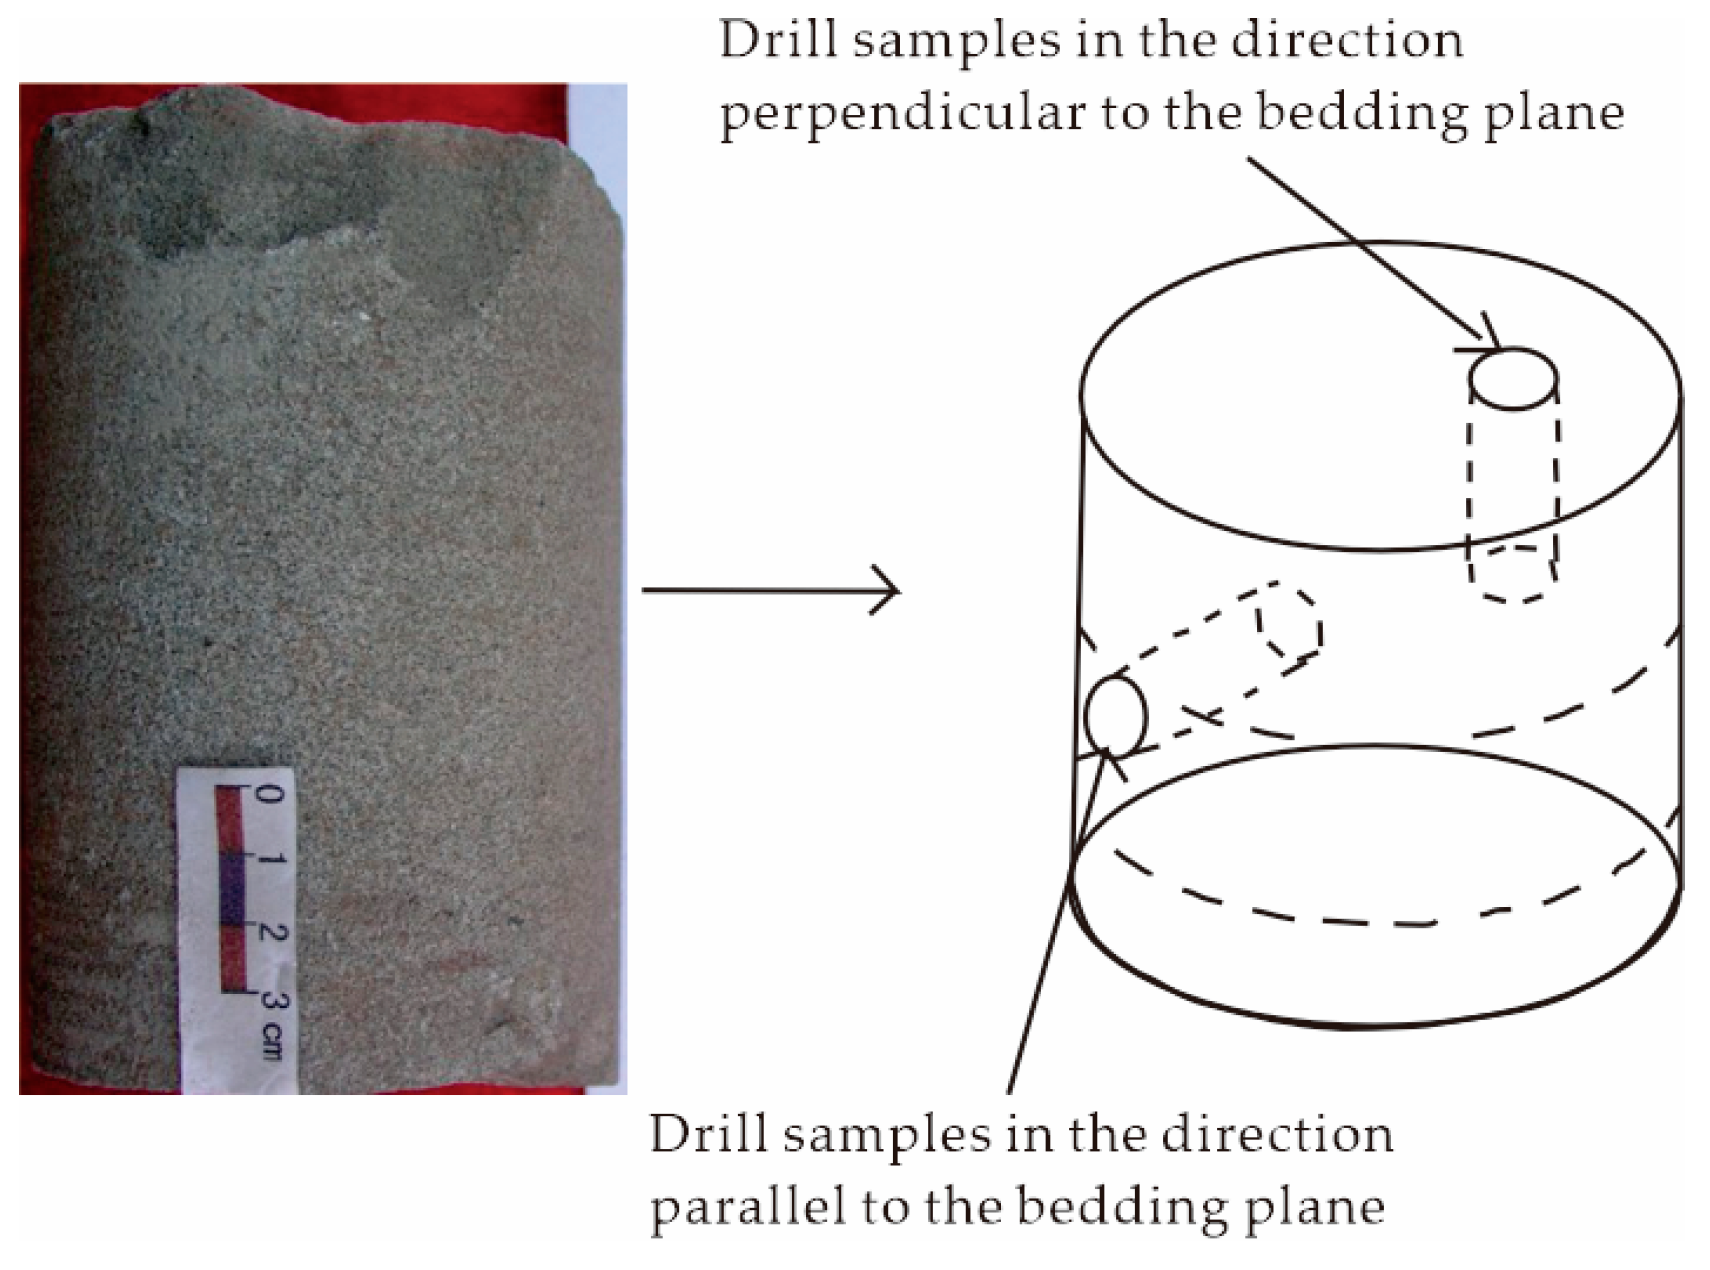
3.1. Experimental Sampling
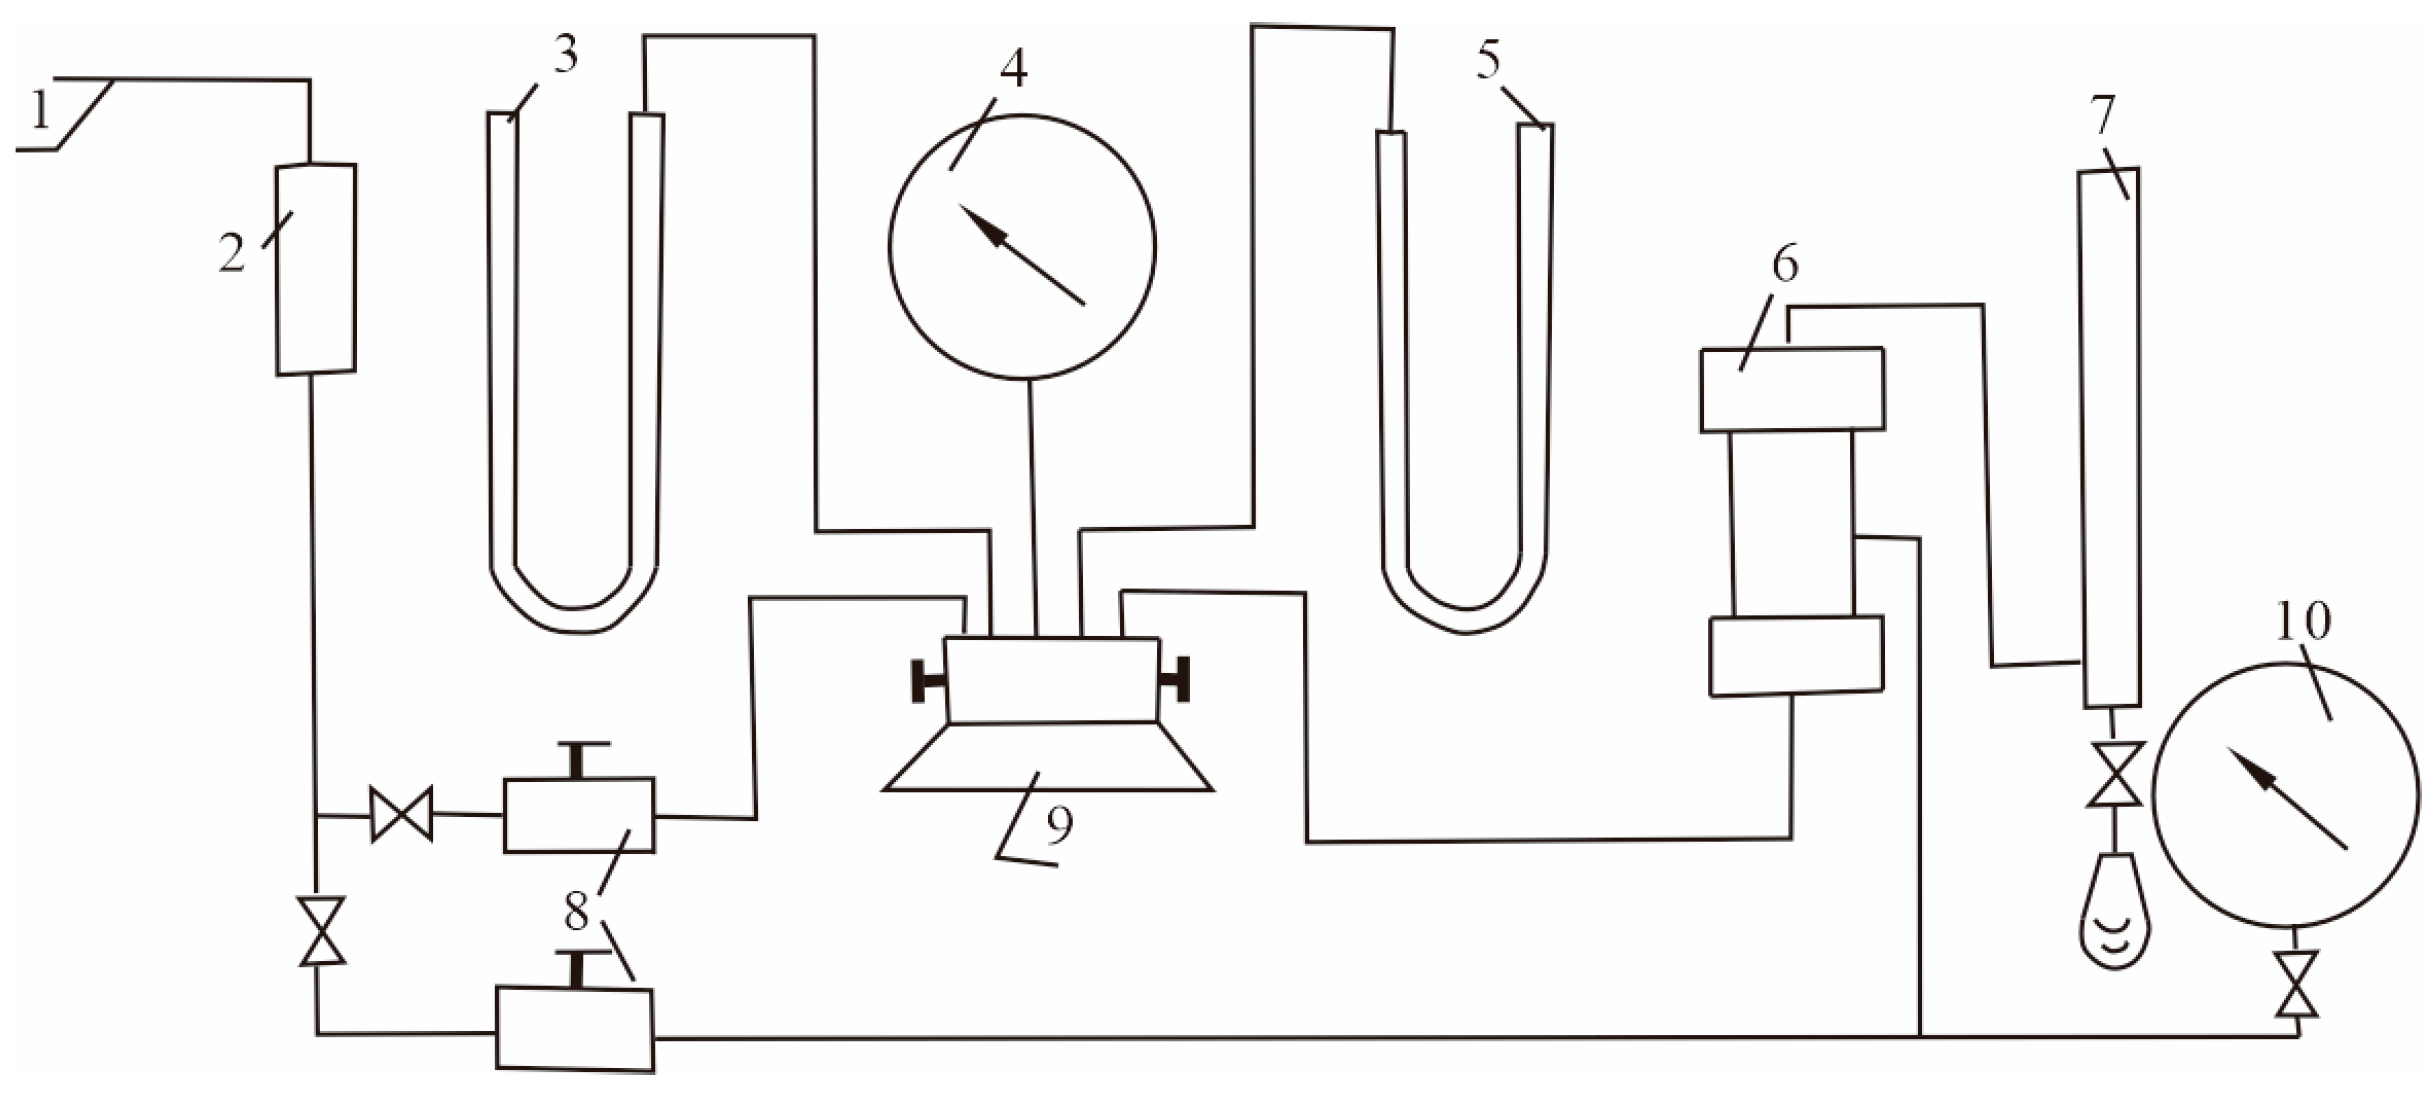
3.2. Experimental Principles for Characterizing Full-Diameter Permeability
- (1)
- Measurement Principle
- ka represents the permeability of the rock, with the unit of μm2;
- Pa represents the applied pressure, with the unit of Pa;
- Qo represents the flow rate of air passing through the rock per unit time, with the unit of cm3/s;
- μ represents the viscosity of the fluid, with the unit of 10⁻3 Pa·s;
- L represents the length of the rock, with the unit of cm;
- p1 and p2 represent the pressure differences before and after the fluid passes through the rock, with the unit of MPa;
- A represents the cross-sectional area through which the air passes through the rock, with the unit of cm2.
- (2)
- Instruments and Equipment
- ①
- Permeameter;
- ②
- Full-diameter core holder;
- ③
- Vacuum pump;
- ④
- Pressure pump;
- ⑤
- High-pressure gas cylinder;
- ⑥
- Air compressor.
- (3)
- Experimental Steps
- ①
- After removing oil (salt) from the samples to be tested, dry them and place them in a desiccator for standby.
- ②
- Use 2–3 standard blocks to test the instrument’s reliability. That is, compare the measured values with the calibrated values. If the relative error does not exceed 5%, the instrument is considered qualified.
- ③
- The cylindrical rock sample’s side surface is divided into four equal sections (as shown in Figure 5). Surfaces 1 and 3 form one pair of air inlet and outlet surfaces, while surfaces 2 and 4 form another pair. One pair of surfaces (1, 3) is selected as the measurement direction, with surfaces 2 and 4, which are perpendicular to surfaces 1 and 3, representing the alternative measurement direction. In the report, the permeability value measured along the middle direction is labeled as Rmax, and the two other measured values are denoted as R90.
- ④
- Cover surfaces 1 and 3 with two metal meshes of corresponding sizes, and then cover the meshes with two smooth metal arc plates of the same size.
- ⑤
- Place the metal mesh and the arc plate on one pair of surfaces of the core, and fix them with rubber bands. Evacuate the air and send the core into the holder, ensuring that the rock sample and the upper and lower plungers are on the same central line. Push a pressure 0.05 MPa higher than the confining pressure into the top of the core, and then add a confining pressure of 1.4–2.8 MPa. To avoid turbulence, the flow velocity of the test gas should be less than 8 cm3/s. After the flow velocity becomes stable, record the upstream and downstream pressures (C value, hw) and the value of the restrictor.
- ⑥
- For vertical permeability measurement, place a sieve of appropriate size on both the upper and lower end surfaces of the rock sample. After evacuating the air, insert the core into the core holder and release the air. Apply an upward pressure of 0.05 MPa higher than the confining pressure, followed by adding a confining pressure between 1.4 and 2.8 MPa. Begin measuring the flow velocity. Once the flow velocity stabilizes, record the upstream and downstream pressures as well as the flow value of the restrictor.
- ⑦
- After a batch of samples has been measured, it is necessary to use 2–3 standard samples to measure their values to verify the reliability of the instrument throughout the entire testing process.
3.3. Experimental Principles for Characterizing Porosity and Permeability
- (1)
- Measurement Principle
- (2)
- Instruments and Equipment
- ①
- Pressure gauges, mercury manometers, and water column manometers;
- ②
- Soap film flow meters or restrictors;
- ③
- Hassler-type core holders are designed for cylindrical rock samples. To ensure a proper seal, the rubber sleeves in the holders must have good elasticity and the confining pressure should be set between 1.4 and 2.8 MPa.
- (3)
- Experimental Steps
- ①
- Use 3–5 standard blocks to check the instrument’s reliability. Compare the measured values of the standard blocks with their calibrated values. If the relative error is within 5%, the instrument used is considered qualified.
- ②
- For the measurement of core dimensions, vernier calipers can be used to measure regularly shaped rock samples. If the rock samples need to be encapsulated with other materials, use calipers to measure their lengths, and use other methods to measure their volumes. Then, divide the total volume by the length to obtain the average cross-sectional area of the rock samples.
- ③
- Load the rock samples to be tested into the appropriate core holders and apply the sealing pressure.
- ④
- When dry gas flows through the rock samples, measure the gas flow velocity and adjust the pressure difference across the sample by controlling the gas flow rate. Record both the inlet and outlet pressures, as well as the gas flow velocity.
- ⑤
- After a batch (one time) of samples has been measured, re-measure the standard blocks according to the requirements in the first step of this procedure. Compare the measured values with the standard values to check whether they meet the requirements. If they do not meet the requirements, find out the reasons and re-measure the samples.
4. Results Analysis
4.1. Bedding Plane Impact on Mudstone Pore Network Distribution
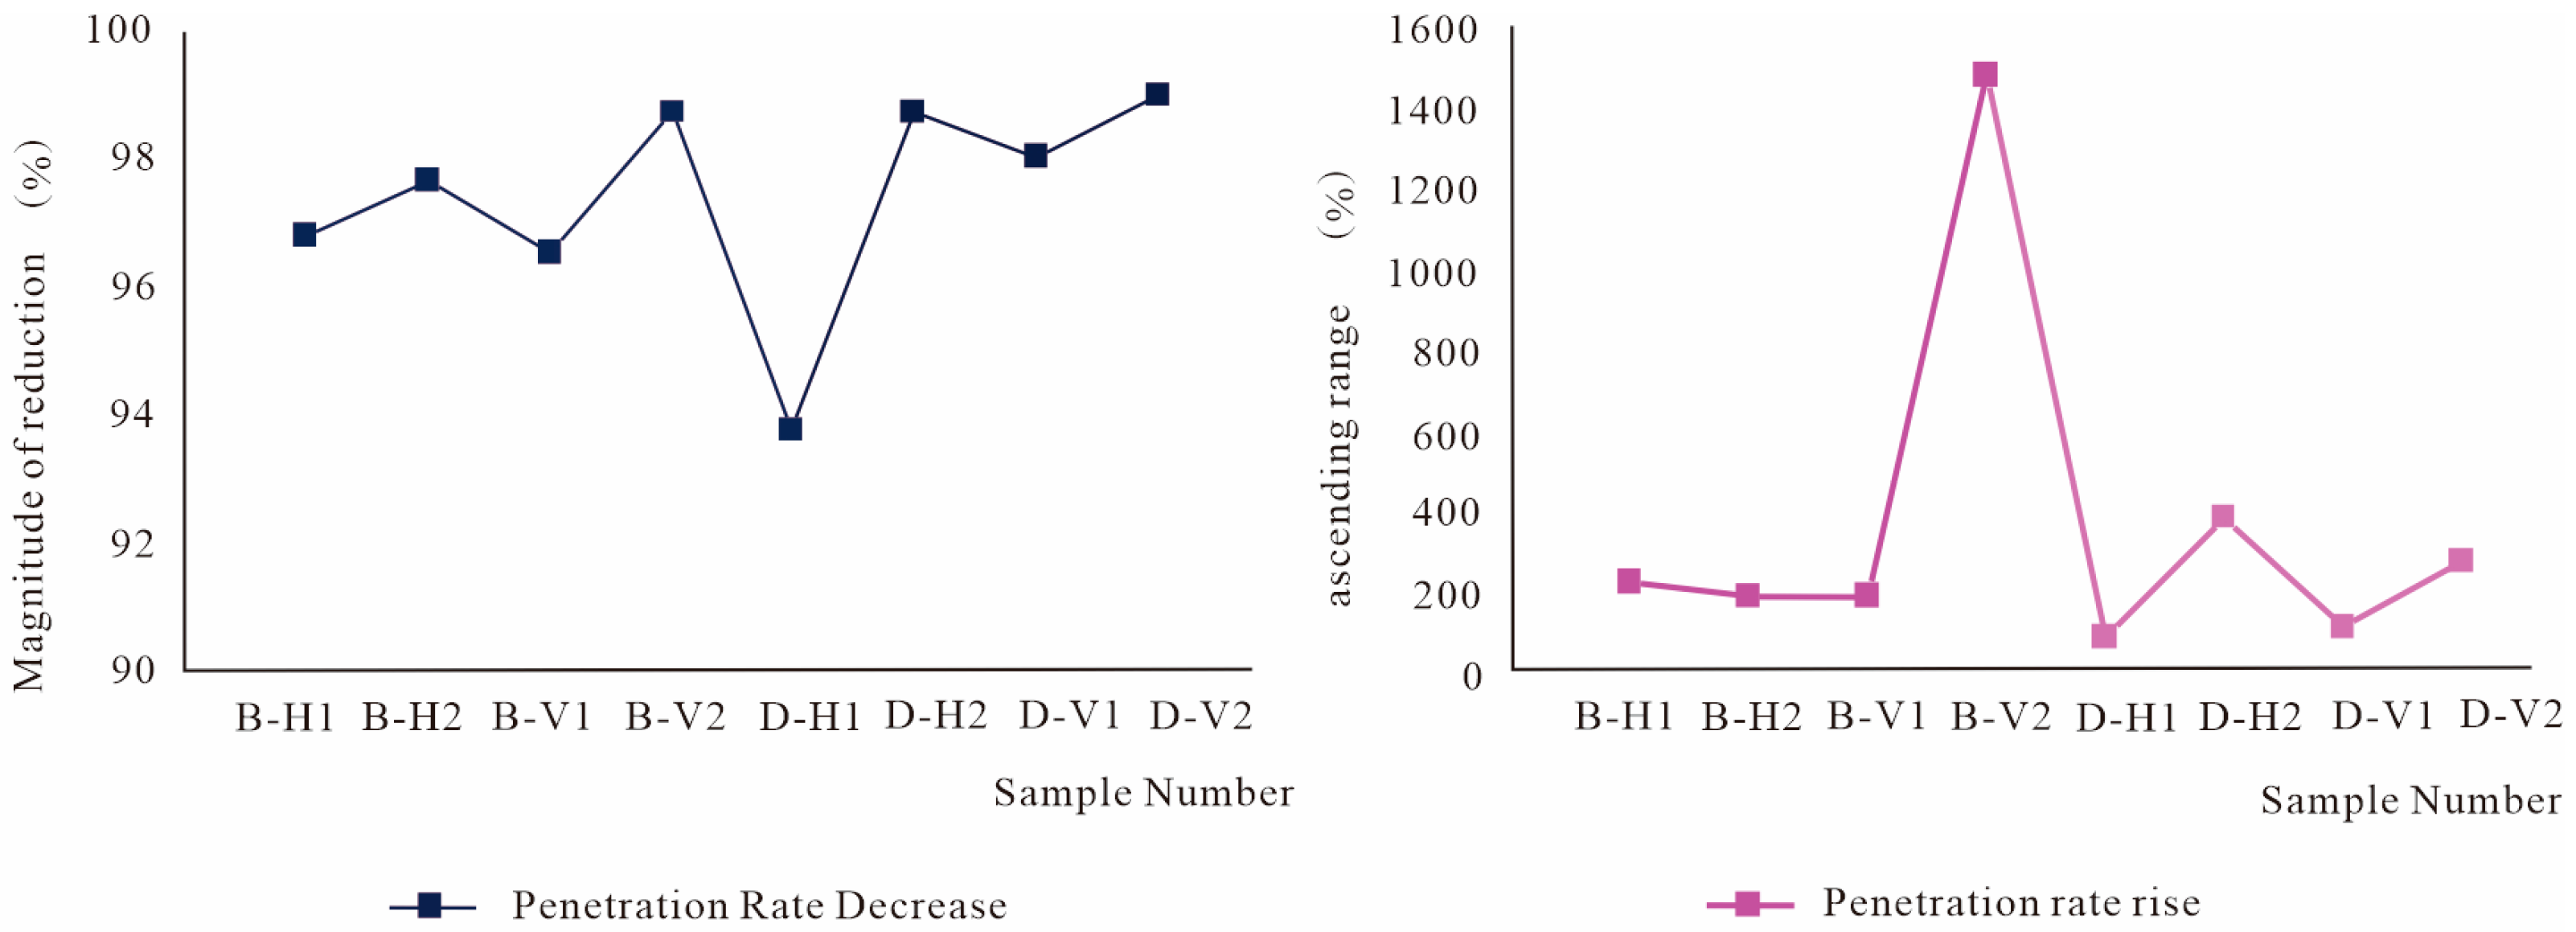
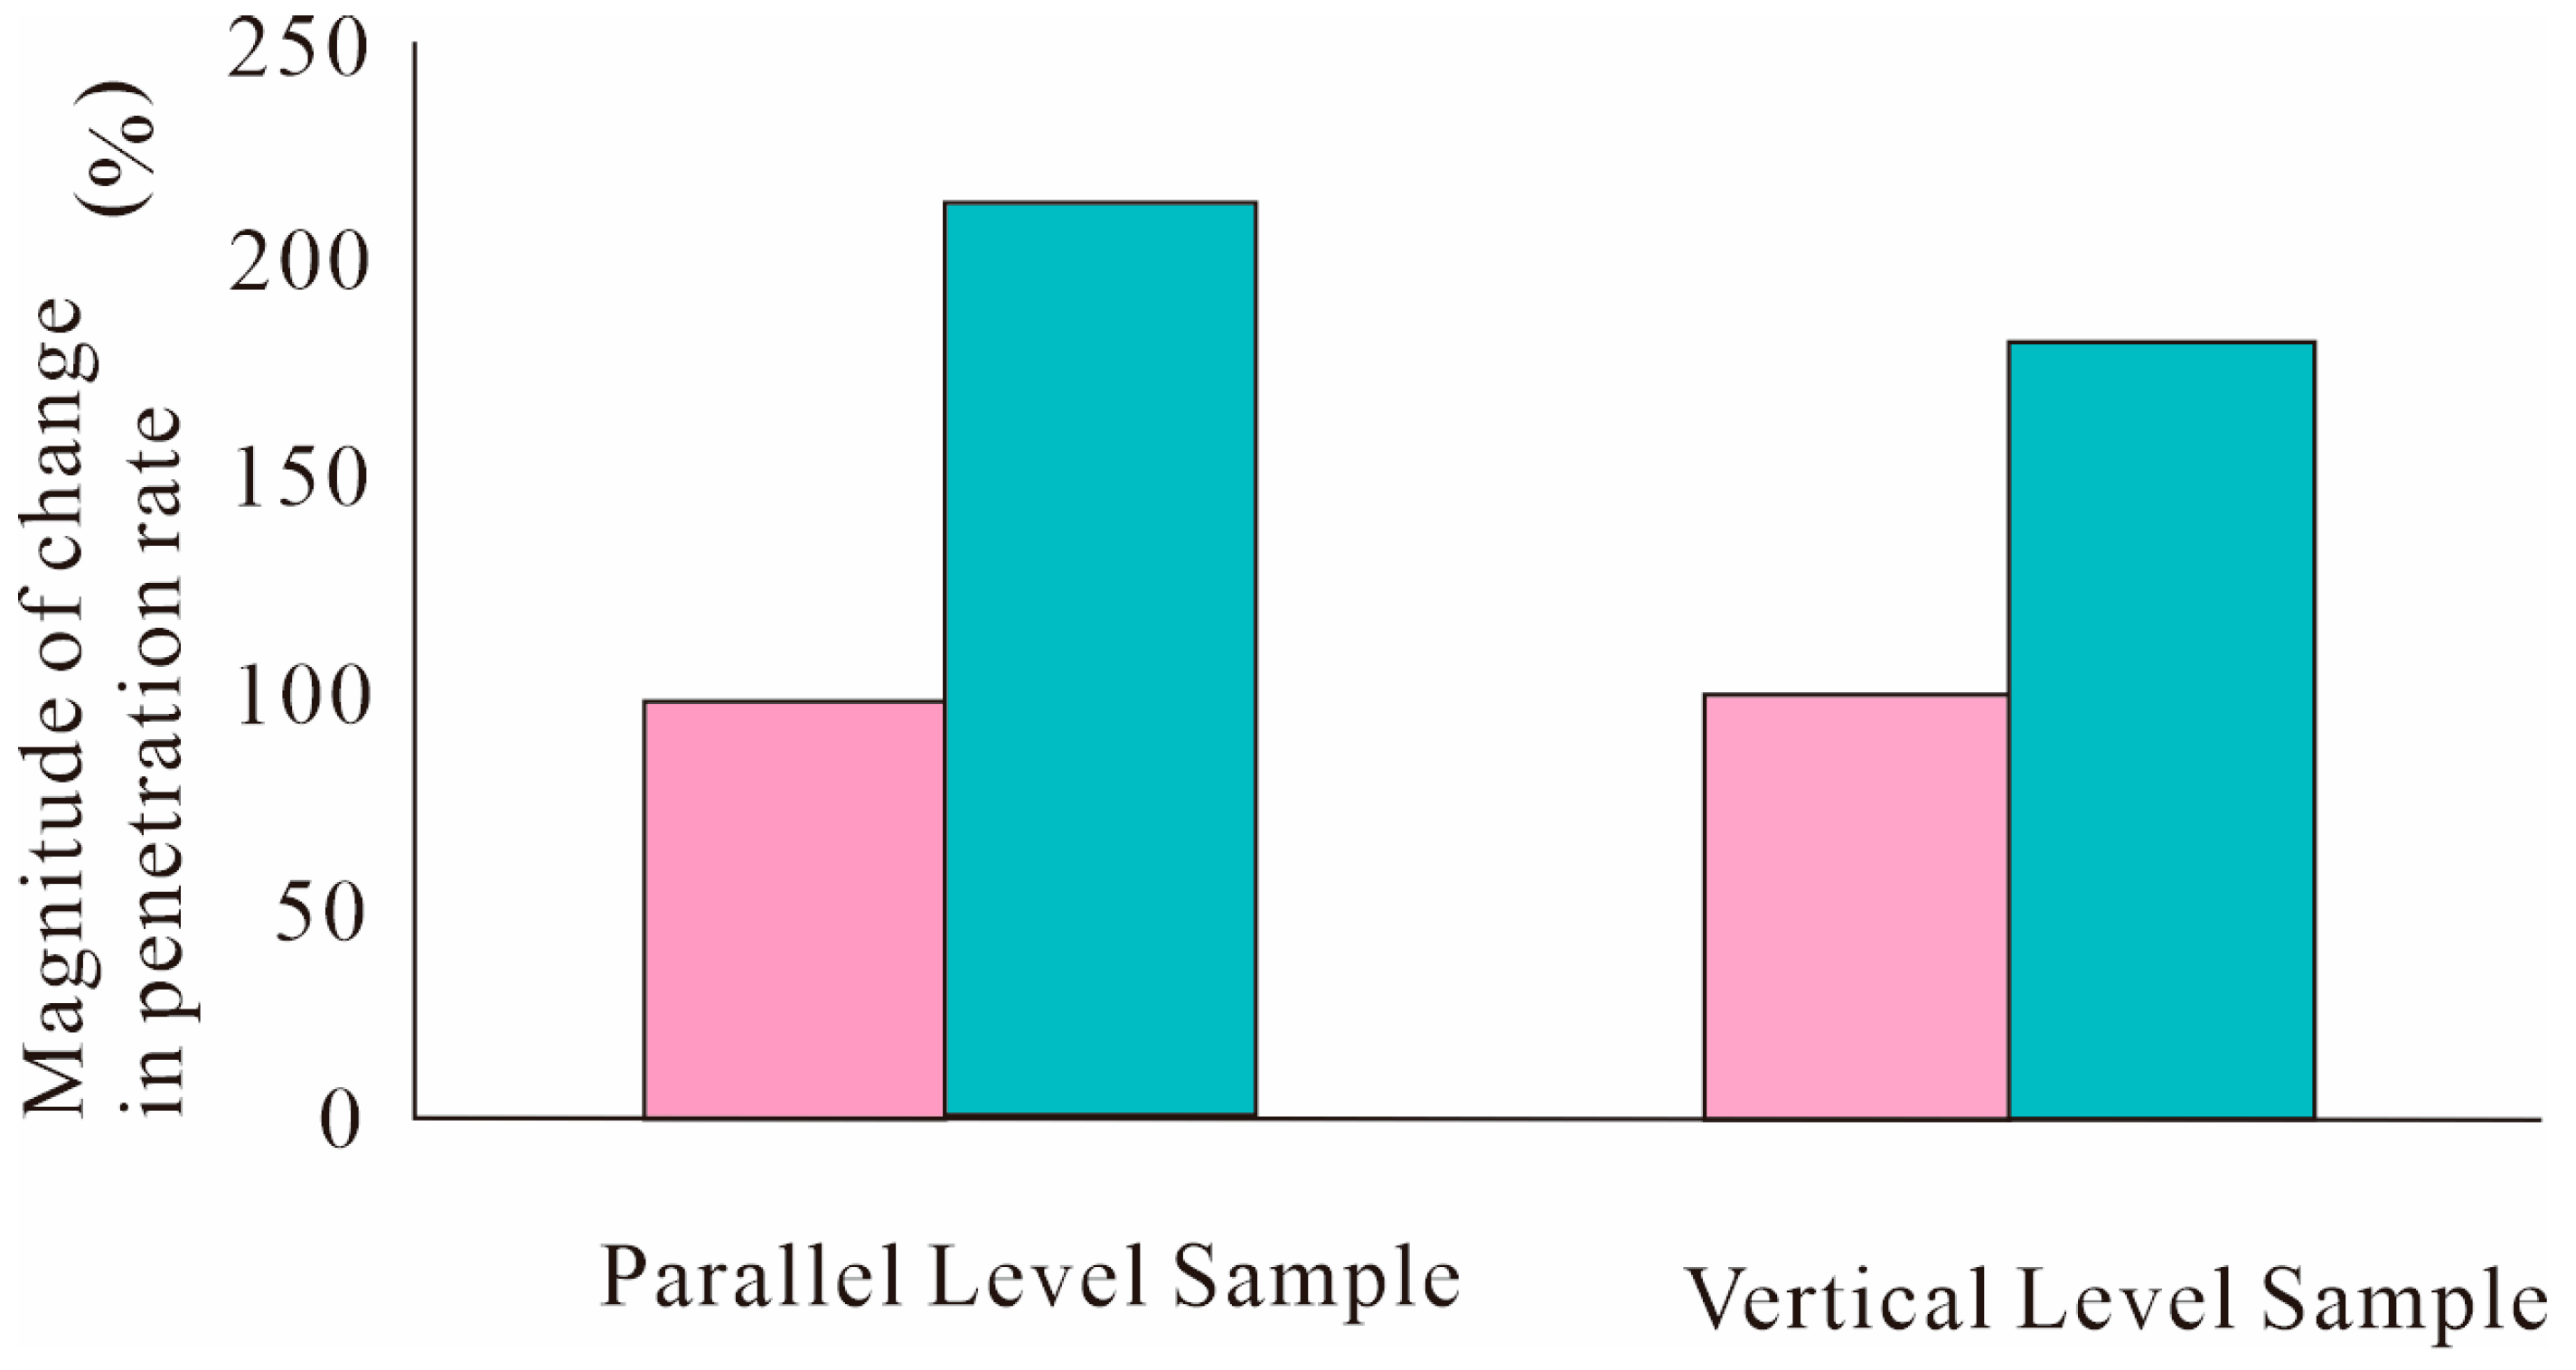
4.2. Variation in Porosity and Permeability in Mudstone Under Pressure Changes
4.3. Permeability and Fracturing in Mudstone Samples
4.4. Bedding Plane Impact on Sandstone Pore Network Distribution
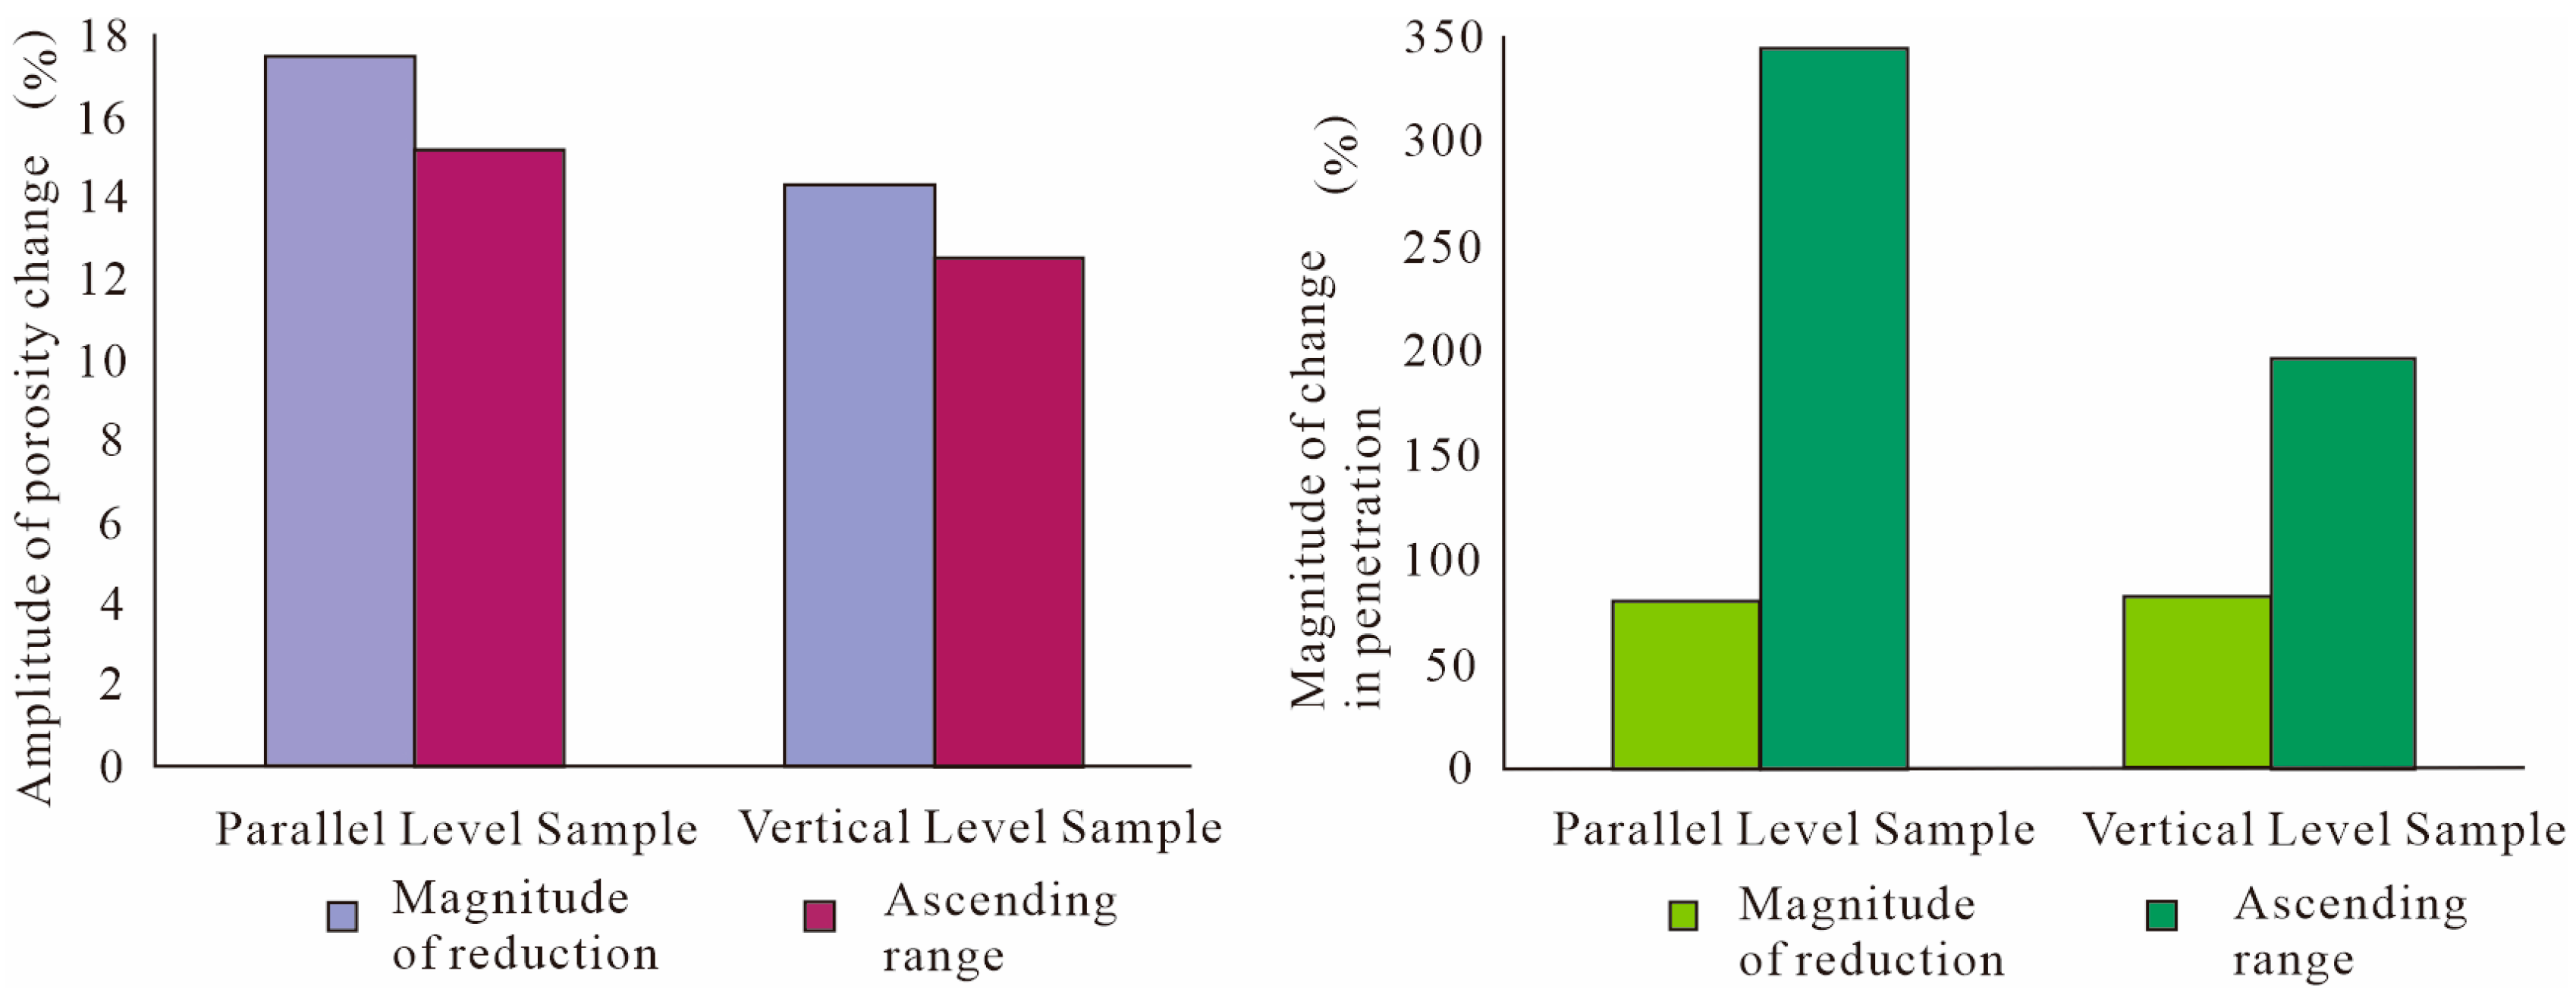
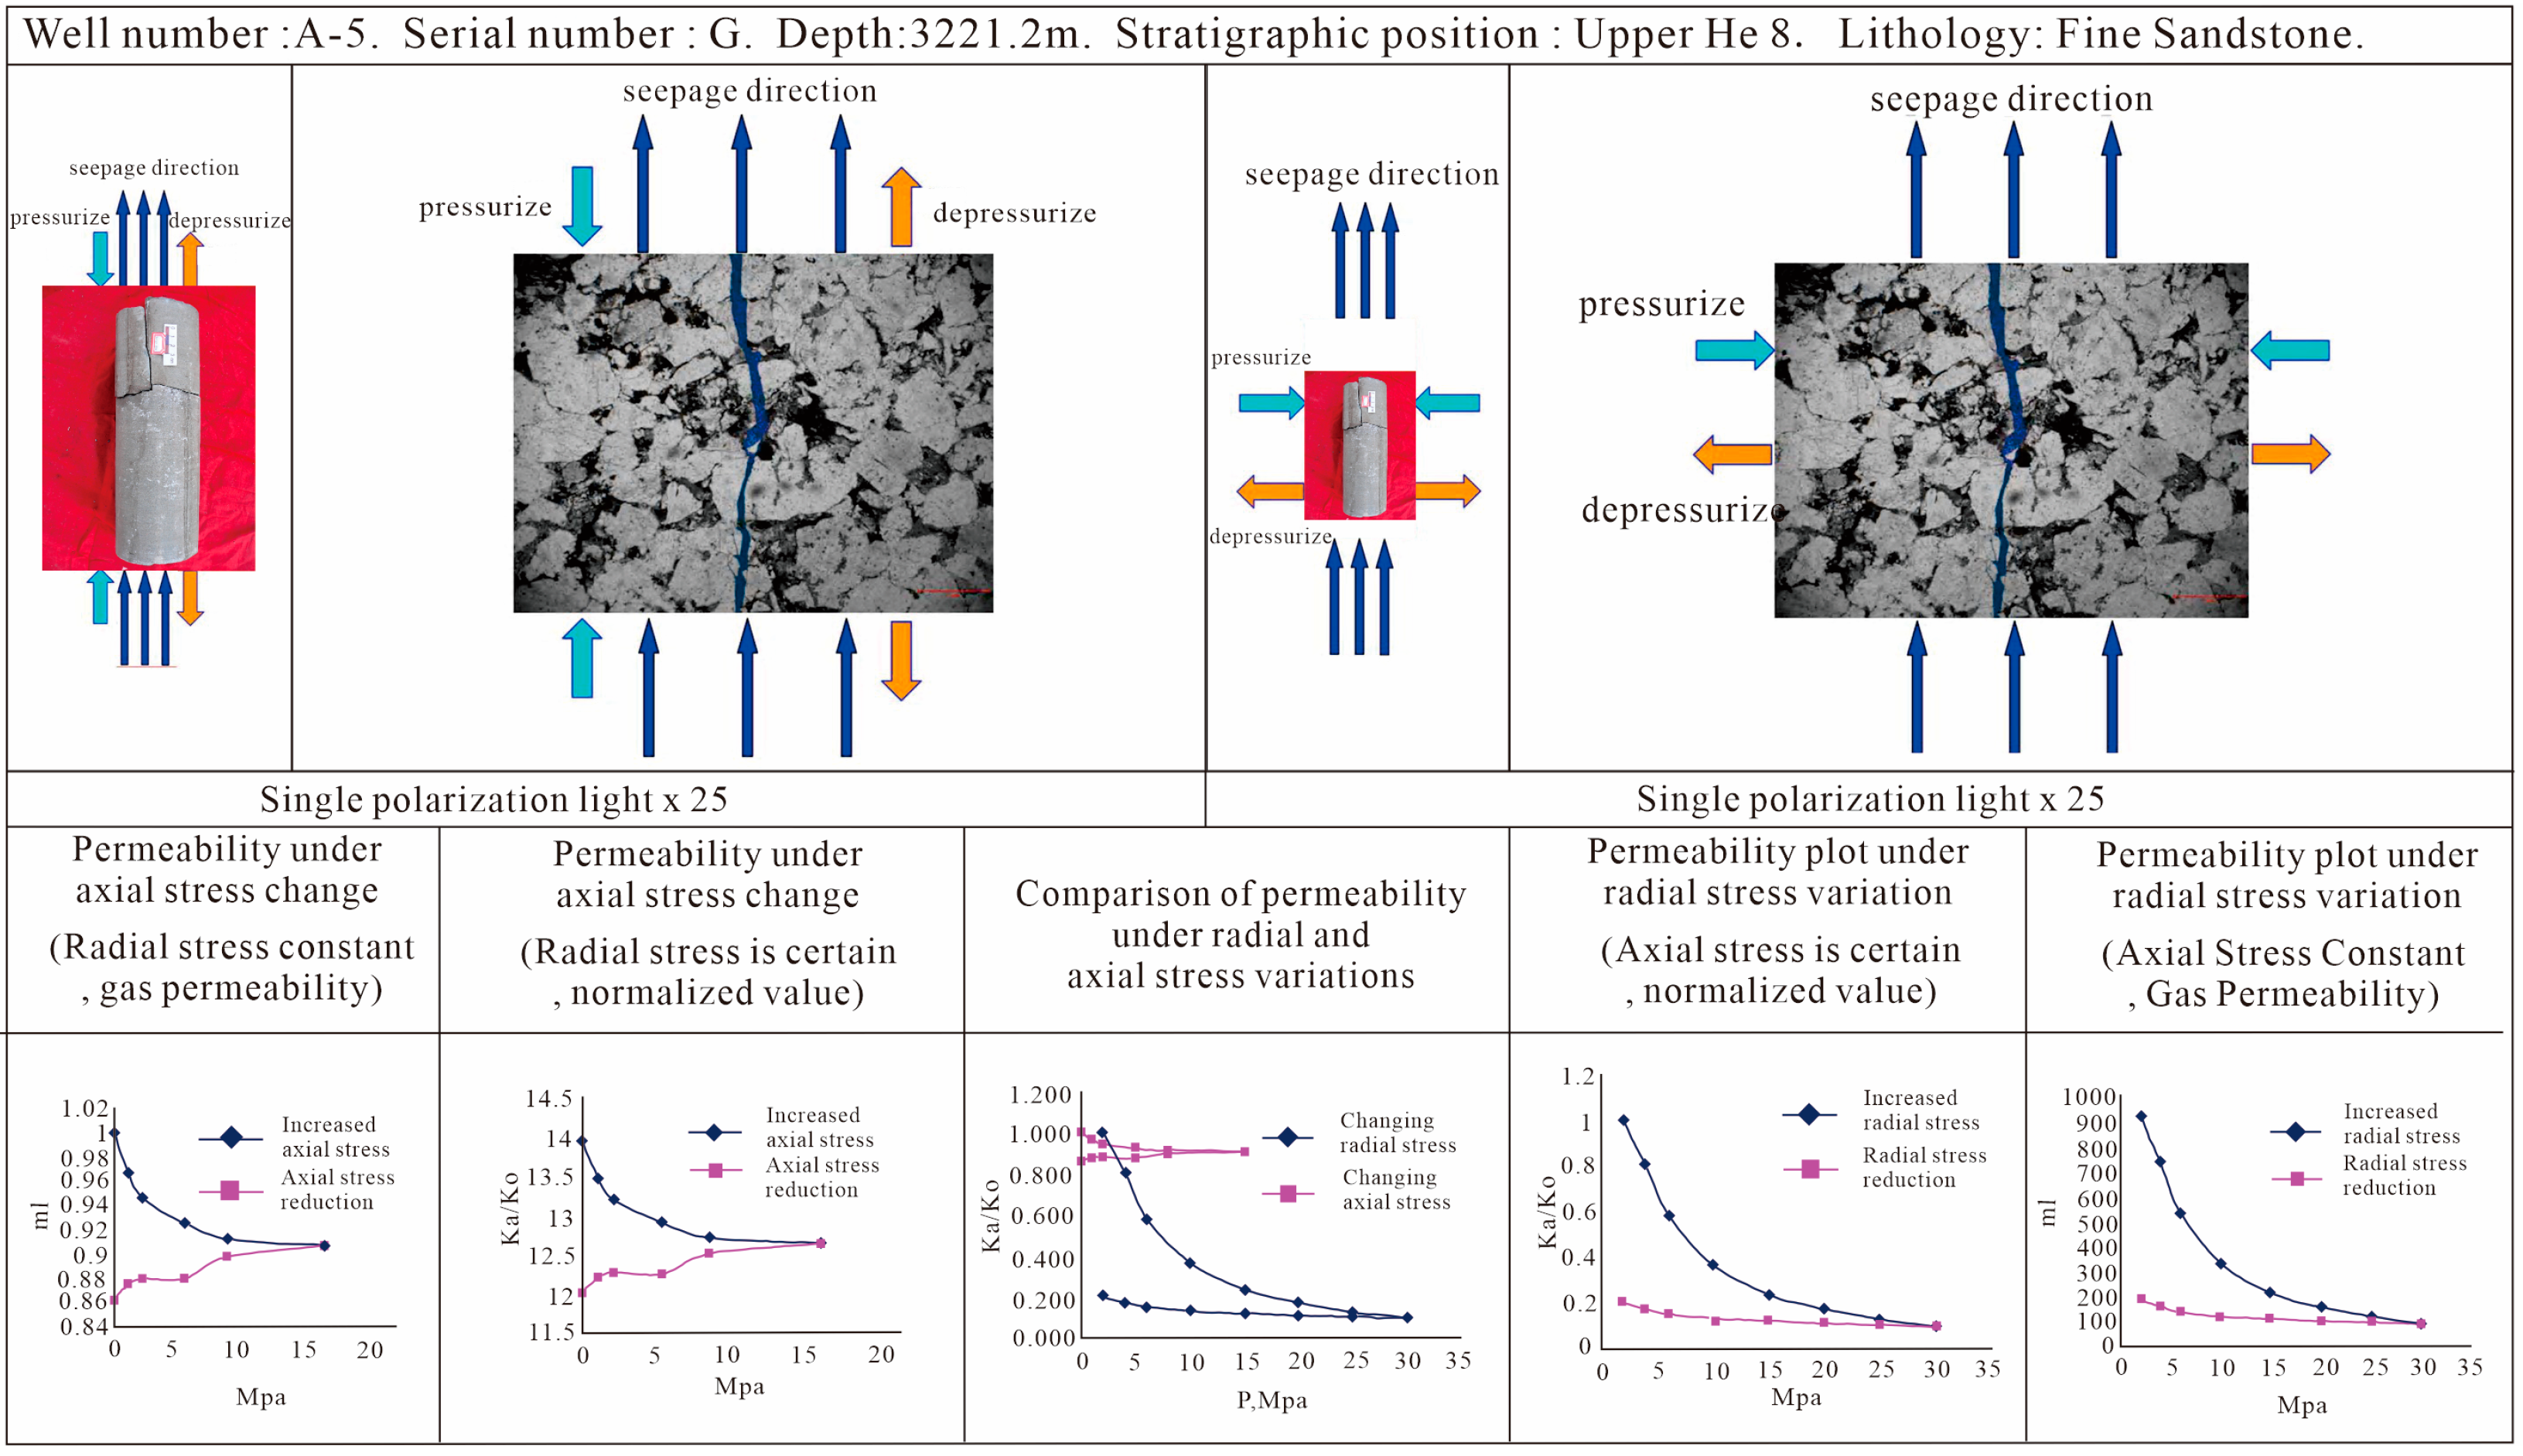
4.5. Variation in Porosity and Permeability in Sandstone Under Pressure Changes
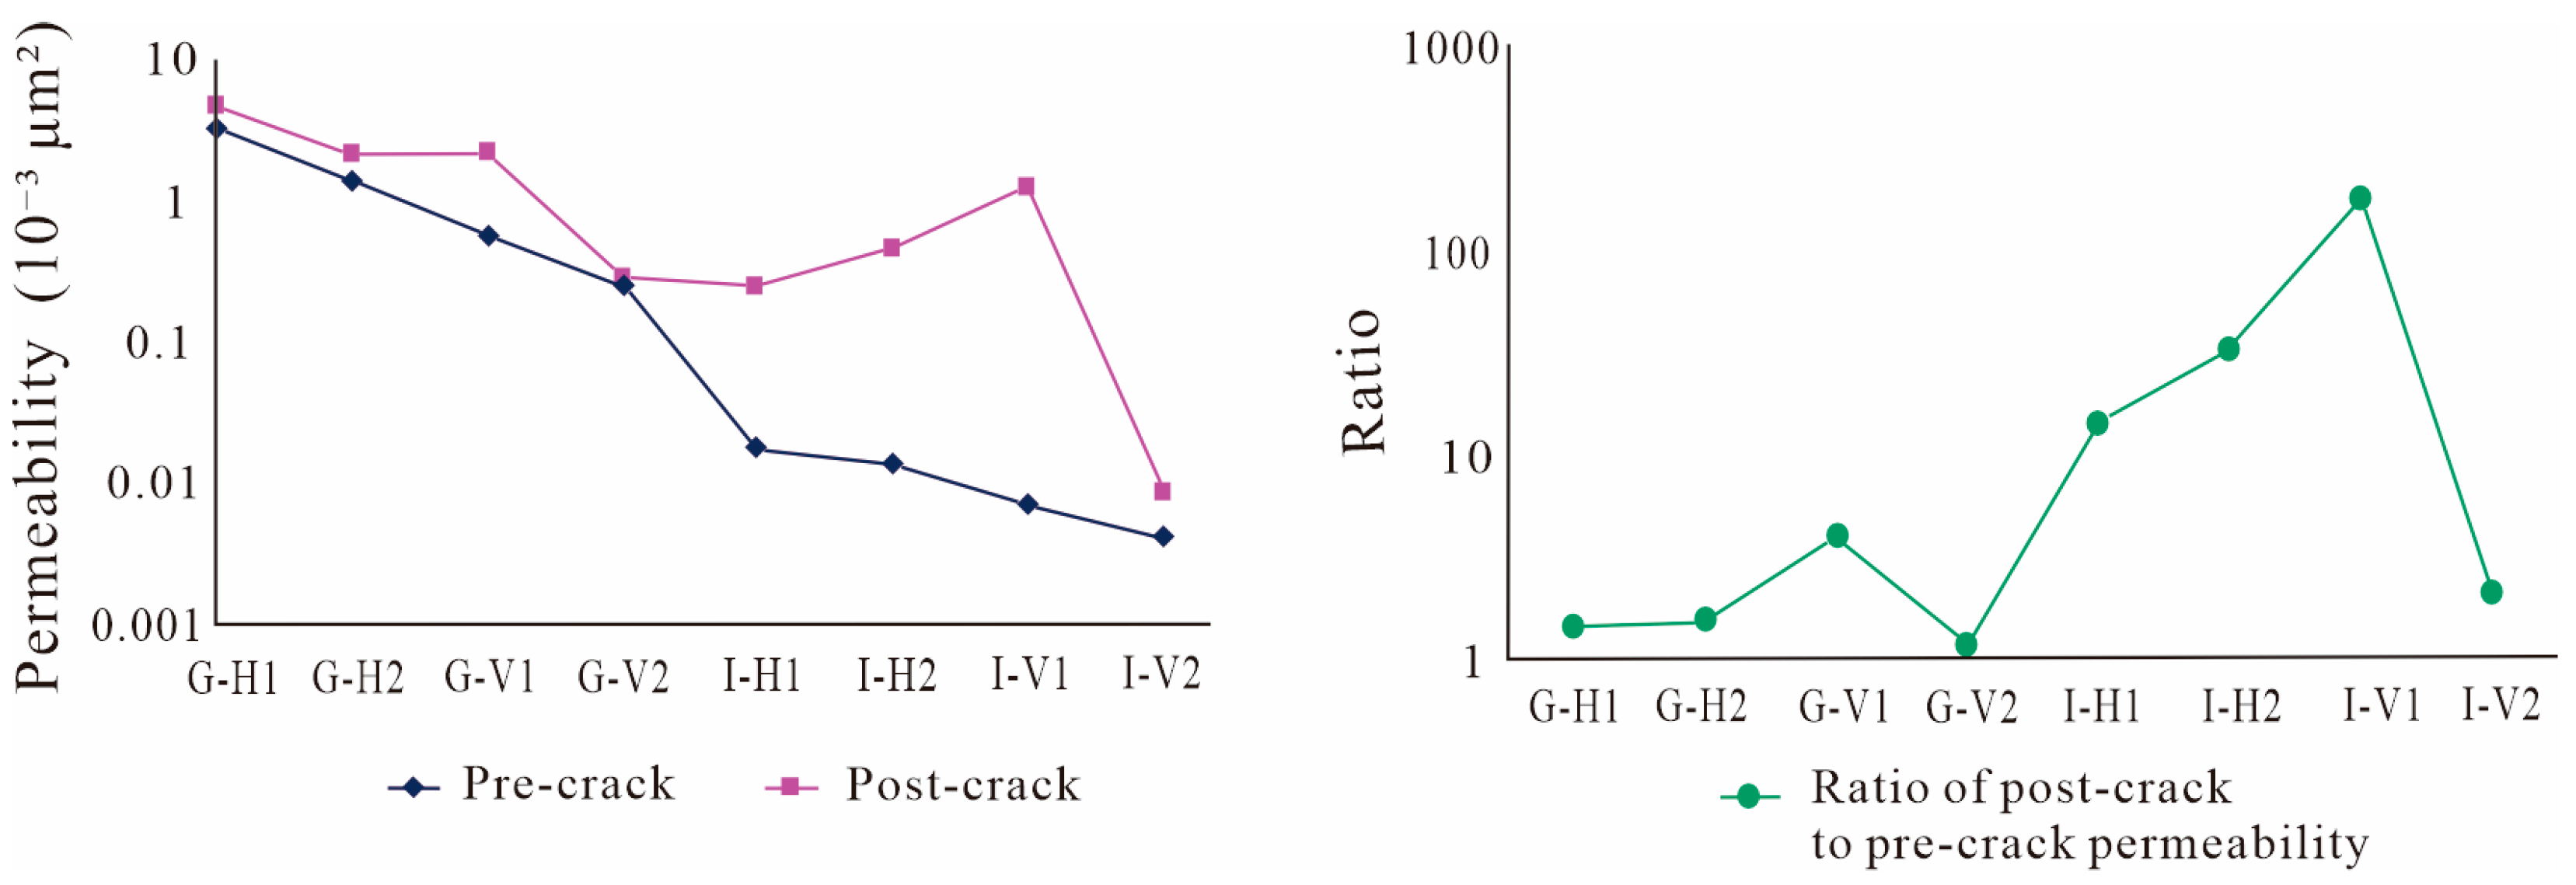
4.6. Permeability and Fracturing in Sandstone Samples
5. Discussion
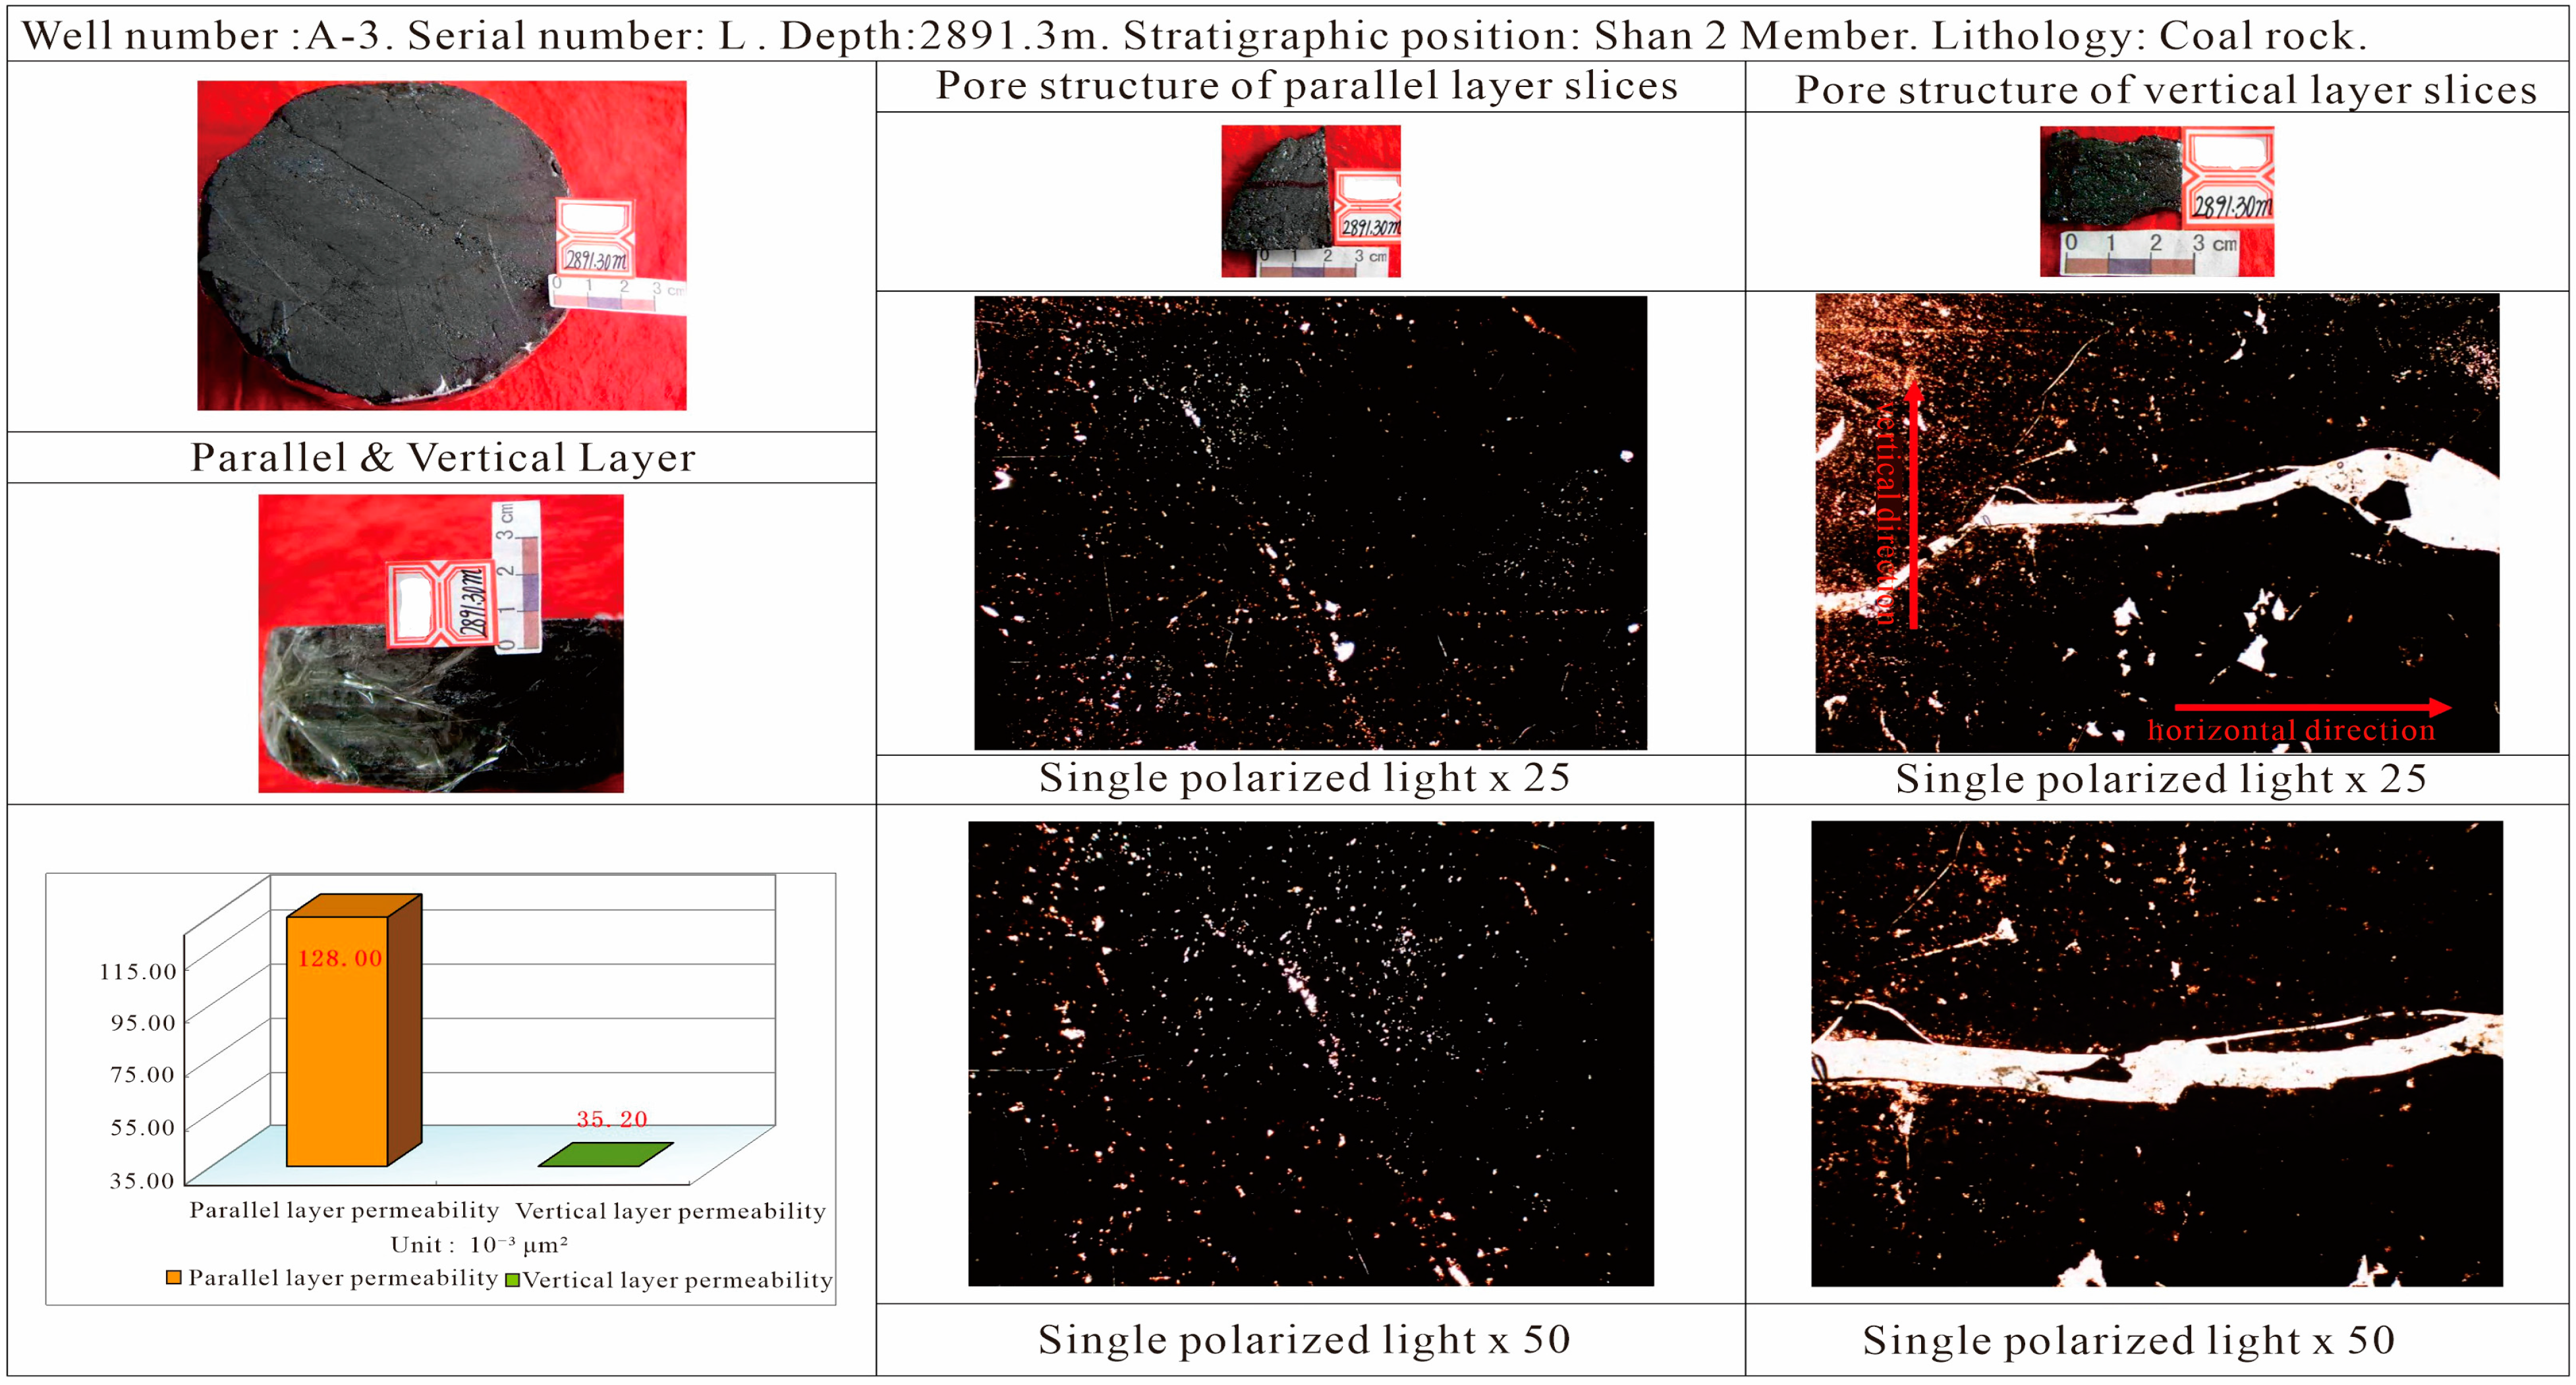
5.1. Analysis of Differences in Transport Properties of Source Rocks (Mudstone and Coal Rock)
5.2. Analysis of Differences in Transport Properties of Sandstone
6. Conclusions
- This experimental study demonstrates that, across different rock types, the permeability parallel to the bedding plane is greater than that perpendicular to it. This is primarily due to the higher number of throat channels parallel to the bedding plane compared to those perpendicular.
- As burial depth increases, formation pressure also rises, leading to a decline in the connectivity of various rock types. However, when the pressure reaches a level sufficient to induce fractures, the permeability of the rock increases more than onefold compared to its pre-fracture state. This indicates that rocks exhibit better connectivity when fractures are present.
- Since the connectivity parallel to the bedding plane is superior to that perpendicular to it, migration pathways parallel to the bedding plane will become the dominant channels for both primary and secondary oil and gas migration. In the context of shale gas exploration in the Late Paleozoic of the Ordos Basin, greater attention should be given to studying migration pathways parallel to the bedding plane. This approach will offer new research perspectives for oil and gas migration and contribute to further exploration of potential shale gas resources in the Late Paleozoic of the Ordos Basin.
Author Contributions
Funding
Data Availability Statement
Acknowledgments
Conflicts of Interest
References
- Fu, G.; Meng, Q. Migration translocationsystem and its controlling to reservoir forming and distribution of natural gas in deep strata of Xujia weizi region. Pet. Geol. Recovery Effic. 2004, 11, 18–20. [Google Scholar]
- Guo, Q.; Li, S.; Jin, Z.; Zhou, X.; Liu, C. Characteristics and exploration targets of Chang 7 shale oil in Triassic Yanchang Formation, Ordos Basin, NW China. Pet. Explor. Dev. 2023, 50, 878–893. [Google Scholar] [CrossRef]
- Hu, D.; Wei, Z.; Liu, R.; Wei, X.; Chen, F.; Liu, Z. Enrichment control factors and exploration potential of lacustrine shale oil and gas: A case study of Jurassic in the Fuling area of the Sichuan Basin. Nat. Gas Ind. B 2021, 41, 113–120. [Google Scholar] [CrossRef]
- Jiang, F.; Hu, M.; Hu, T.; Lyu, J.; Huang, L.; Liu, C.; Jiang, Z.; Huang, R.; Zhang, C.; Wu, G.; et al. Controlling factors and models of shale oil enrichment in Lower Permian Fengcheng Formation, Mahu Sag, Junggar Basin, NW China. Pet. Explor. Dev. 2023, 50, 812–825. [Google Scholar] [CrossRef]
- Jia, J.; Yi, W.; Qiu, N.; Chen, C.; Zhou, M.; Miao, W. Petroleum carrier systems and migration and accumulation patterns in Chang8 member of Yanchang Formation in Honghe oilfield. Oil Gas Geol. Recovery 2016, 23, 9–15. [Google Scholar]
- Ju, J. Hydrocarbon Transmission System Characteristics of Buried Hills in West Sag, Liaohe of Depression. Spec. Oil Gas Reserv. 2022, 29, 55–61. [Google Scholar]
- Liu, C.; Chen, S.; Zhao, J.; Chen, G.; Gao, Q. Hydrocarbon transportation system and accumulation simulation of Mesozoic-Cenozoic in south slope of Kuqa foreland basin. Nat. Gas Geosci. 2021, 32, 1450–1462. [Google Scholar]
- Liu, H.; Zhao, S.; Liang, S.; Guo, Q.; Zhu, Y.; Han, X. Hydrocarbon transportation system and reservoir forming model of Es3 in slope belt of Chezhen depression. J. China Univ. Pet. (Ed. Nat. Sci.) 2021, 45, 42–53. [Google Scholar]
- Jin, Z.; Zhang, J.; Tang, X. Unconventional natural gas accumulation system. Nat. Gas Ind. B 2021, 41, 58–68. [Google Scholar] [CrossRef]
- Li, Y.; Xu, K.; Yan, S.; Lin, Y. Study on hydrocarbon carrier system in petroliferous basins. Pet. Geol. Recovery Effic. 2015, 22, 32–36. [Google Scholar]
- Liu, Z. Research on Type Division and Distribution of the Gas Passage Systems in Upper Paleozoic of Ordos Basin. Master’s Thesis, Northwest University, Xi’an, China, 2013. [Google Scholar]
- Shi, X.; Wu, W.; Wu, Q.; Zhong, K.; Jiang, Z.; Miao, H. Controlling Factors and Forming Types of Deep Shale Gas Enrichment in Sichuan Basin, China. Energies 2022, 15, 7023. [Google Scholar] [CrossRef]
- Wang, Y.; Liu, L.; Ji, H.; Song, G.; Wang, X.; Sheng, Y. Structure of a pre-Triassic unconformity and its hydrocarbon transporting characteristics, Wuerhe-Fengnan area, Junggar Basin, China. J. Pet. Sci. Eng. 2019, 173, 820–834. [Google Scholar] [CrossRef]
- Liu, Y. Study on Reservoir Transportation System and Caprock Characteristics of Mesozoic Yanchang Formation in Ordos Basin. Master’s Thesis, Northwest University, Xi’an, China, 2022. [Google Scholar]
- Xu, S.; Hao, F.; Xu, C.; Zou, H.; Zhang, X.; Zong, Y.; Zhang, Y.; Cong, F. Hydrocarbon migration and accumulation in the northwestern Bozhong subbasin, Bohai Bay Basin, China. J. Pet. Sci. Eng. 2019, 172, 477–488. [Google Scholar] [CrossRef]
- Zhang, H.; Zhao, X.; Wang, J.; Jin, F.; Liu, H.; Pu, X.; Dong, X.; Zhao, C.; Wu, F.; Dong, X. Hydrocarbon Migration Pathways and Its Control on Accumulation in Chengbei Fault Zone of Qikou Sag, Bohai Bay Basin, East China. Earth Sci. 2023, 48, 3053–3067. [Google Scholar]
- Zhang, H.; Wang, X.; Jia, C.; Li, J.; Meng, Q.; Jiang, L.; Wang, Y.; Bai, X.; Zheng, Q. Whole petroleum system and hydrocarbon accumulation model in shallow and medium strata in northern Songliao Basin, NE China. Pet. Explor. Dev. 2023, 50, 784–797. [Google Scholar] [CrossRef]
- Yang, G.; Zheng, R.; Zhao, Y.; Wang, Z.; Xie, C.; Wu, Y.; Wang, C. New understanding of petroleum migration and accumulation law in Kendong area, Jiyang depression. Pet. Geol. Recovery Effic. 2015, 22, 10–15. [Google Scholar]
- Zhang, P.; Zhang, Z.; Jiang, S.; Zhou, D.; Wan, J.; Sun, B.; Zhou, C.; Wang, Z. Geological characteristics and enrichment model of Permian Mao 1 Member shale gas reservoirs in Nanchuan area. Nat. Gas Ind. B 2022, 9, 96–105. [Google Scholar] [CrossRef]
- Zhang, J.; Shi, M.; Wang, D.; Tong, Z.; Hou, X.; Niu, J.; Li, X.; Li, Z.; Zhang, P.; Huang, Y. Fields and directions for shale gas exploration in China. Nat. Gas Ind. B 2022, 9, 20–32. [Google Scholar] [CrossRef]
- Wang, W.; Pang, X.; Chen, Z.; Chen, D.; Wang, Y.; Yang, X.; Luo, B.; Zhang, W.; Zhang, X.; Li, C.; et al. Quantitative evaluation of transport efficiency of fault-reservoir composite migration pathway systems in carbonate petroliferous basins. Energy 2021, 222, 119983. [Google Scholar] [CrossRef]
- Zumberge, J.E.; Curtis, J.B.; Reed, J.D.; Brown, S.W. Migration happens: Geochemical evidence for movement of hydrocarbons in unconventional petroleum systems. In Proceedings of the SPE/AAPG/SEG Unconventional Resources Technology Conference, San Antonio, TX, USA, 1–3 August 2016. [Google Scholar]
- Luo, X.; Hu, C.; Xiao, Z.; Zhao, J.; Zhang, B.; Yang, W.; Zhao, H.; Zhao, F.; Lei, Y.; Zhang, L. Effects of carrier bed heterogeneity on hydrocarbon migration. Mar. Pet. Geol. 2015, 68, 120–131. [Google Scholar] [CrossRef]
- Song, X.; Lü, X.; Shen, Y.; Guo, S. Hydrocarbon migration and accumulation history in deep reservoirs: A case study of Mesozoic sandstone gas reservoirs in the Kelasu-Yiqikelike structural belt of the Kuqa Depression, Tarim Basin. Geosci. J. 2019, 23, 69–86. [Google Scholar] [CrossRef]
- Zeng, X.; Li, J.; Tian, J.; Wang, B.; Guo, J.; Sha, W. Physical simulation experimental study on gas accumulation in the late tectonic belts of the northern border of Qaidam Basin. Nat. Gas Geosci. 2018, 29, 1301–1309. [Google Scholar]
- Zhang, W.; Jiang, Y.; Hou, S.; Jing, A.; Sun, C. Characteristics of the Paleocene Oil and Gas Transmission System in North Kengdong Area. Spec. Reserv. 2023, 30, 31–39. [Google Scholar]
- Wu, Y.; Zhang, J. Geochemical characteristics and identification criteria of effective source rock in Mesozoic Yanchang Formation, southern margin of Ordos Basin. Int. J. Oil Gas Coal Technol. 2018, 19, 379–395. [Google Scholar] [CrossRef]
- Luo, X.; Zhang, L.; Lei, Y.; Yang, W. Petroleum migration and accumulation: Modeling and applications. AAPG Bull. 2020, 104, 2247–2265. [Google Scholar] [CrossRef]
- Zhang, Z.; Wang, H.; Yang, H. Study on passage system of petroliferous basins. Oil Gas Geol. 2000, 21, 133–135. [Google Scholar]
- Zhou, X.; Wang, D.; Yu, H.; Yang, H.; Li, L. Major controlling factors and hydrocarbon accumulation models of large-scale lithologic reservoirs in shallow strata around the Bozhong sag, Bohai Bay Basin, China. Pet. Explor. Dev. 2022, 49, 758–769. [Google Scholar] [CrossRef]
- Liu, M.; Zhang, H.; Guo, H.; Zhao, W.; Wang, Y.; Shi, S.; Wang, Q.; Liu, J. The impact of marine influence on the hydrocarbon generation potential and process of Upper Paleozoic coal in the eastern Ordos Basin, China: Implications for unconventional gas exploration of coal measures. Energy Fuels 2024, 38, 12700–12717. [Google Scholar] [CrossRef]
- Xiao, X.M.; Zhao, B.Q.; Thu, Z.L.; Song, Z.G.; Wilkins, R.W.T. Upper Paleozoic petroleum system, Ordos Basin, China. Mar. Pet. Geol. 2005, 22, 945–963. [Google Scholar] [CrossRef]
- Yang, H.; Fu, J.; Liu, X.; Meng, P. Accumulation conditions and exploration and development of tight gas in the Upper Paleozoic of the Ordos Basin. Pet. Explor. Dev. 2012, 39, 315–324. [Google Scholar] [CrossRef]
- Liu, M.; Kong, Q.; Wang, H.; Zhang, H.; Guo, H.; Wang, Y.; Shi, S.; Wang, Q.; Liu, J.; Peng, P.A. Generation Potential and Kinetics of Gaseous Hydrocarbons from Upper Paleozoic Carboniferous Benxi Formation Mudstone in Ordos Basin, China. ACS Omega 2024, 9, 39088–39099. [Google Scholar] [CrossRef]
- Wu, M.; Qin, Y.; Zhang, G.; Shen, J.; Yu, J.; Ji, X.; Zhu, S.; Wang, W.; Wan, Y.; Liu, Y.; et al. Geochemistry and Mineralogy of Upper Paleozoic Coal in the Renjiazhuang Mining District, Northwest Ordos Basin, China: Evidence for Sediment Sources, Depositional Environment, and Elemental Occurrence. Minerals 2024, 14, 1045. [Google Scholar] [CrossRef]
- Yuan, Y.; Fu, H.; Yan, D.; Wang, X. The constraints of the sedimentary environment on the evolution of bauxite reservoir characteristics within the benxi formation in the Linxing area, Ordos Basin, China. Energy Sci. Eng. 2024, 12, 5520–5541. [Google Scholar] [CrossRef]
- Sun, F.; Qu, C.; Cao, G.; Xie, L.; Shi, X.; Luo, S.; Liu, Z.; Zhang, L.; Ma, X.; Zhou, X.; et al. Oolitic Sedimentary Characteristics of the Upper Paleozoic Bauxite Series in the Eastern Ordos Basin and Its Significance for Oil and Gas Reservoirs. Processes 2024, 12, 2123. [Google Scholar] [CrossRef]
- Liu, G.; Sun, Z.; Luo, D.; Ding, Y.; Liu, W.; Yang, D. Critical review on microscopic differences of rock characteristics and flow behaviour for tight sandstone reservoirs in Ordos Basin, China. J. Pet. Sci. Eng. 2022, 218, 110669. [Google Scholar] [CrossRef]
- Wang, J.; Wang, J.; Zhang, Y.; Zhang, D.; Sun, L.; Luo, J.; Wang, W.; Gong, L.; Liu, Z.; Gao, S. Multi-scale fracture patterns and their effects on gas enrichment in tight sandstones: A case study of the Upper Paleozoic in the Qingshimao gas field, Ordos Basin, China. Front. Earth Sci. 2024, 12, 1448238. [Google Scholar] [CrossRef]
- Bai, Y.; Ma, L.; Wu, W.; Ma, Y. Geological characteristics and resource potential of oil shale in Ordos basin. Geol. China 2009, 36, 1123–1137. [Google Scholar]
- Yang, Y.; Li, W.; Ma, L. Tectonic and stratigraphic controls of hydrocarbon systems in the Ordos basin: A multicycle cratonic basin in central China. AAPG Bull. 2005, 89, 255–269. [Google Scholar] [CrossRef]
- Du, J.; Li, X.; Bao, H.; Xu, W.; Wang, Y.; Huang, J.; Wang, H.; Wanyan, R.; Wang, J. Geological conditions of natural gas accumulation and new exploration areas in the Mesoproterozoic to Lower Paleozoic of Ordos Basin, NW China. Pet. Explor. Dev. 2019, 46, 866–882. [Google Scholar] [CrossRef]
- Wang, M.; He, D.; Bao, H.; Lu, R.; Gui, B. Upper Palaeozoic gas accumulations of the Yimeng uplift, Ordos Basin. Pet. Explor. Dev. 2011, 38, 30–39. [Google Scholar]
- Yan, T.; Yao, Y.; Liu, D. Critical tectonic events and their geological controls on gas generation, migration, and accumulation in the Weibei coalbed methane field, southeast Ordos basin. J. Nat. Gas Sci. Eng. 2015, 27, 1367–1380. [Google Scholar] [CrossRef]
- Liu, X.; Pan, X.; Zhao, H.; Wang, Z.; Meng, P.; Zheng, D.; Hu, J.; Yan, X. Control of differential diagenesis of tight sandstone reservoirs on the gas–water distribution: A case study on the Upper Paleozoic He 8 Member in the northern Tianhuan depression of the Ordos Basin. Energy Explor. Exploit. 2022, 40, 302–327. [Google Scholar] [CrossRef]
- Ma, S.; Li, J.; Wang, L.; Gao, H.; Zhang, J. Provenance, tectonic setting and source-area paleoweathering of the Upper Paleozoic sandstones in the northwestern Ordos Basin, China: Evidence from whole-rock geochemistry. Carbonates Evaporites 2021, 36, 64. [Google Scholar] [CrossRef]
- Zhao, X.; Pang, J.; Zhao, L.; Liu, X. Characteristics of the Upper Paleozoic marker layers and their formation mechanism in the Ordos Basin. J. Geol. 2024, 48, 49–58. [Google Scholar]


| Well Number | Sample Number | Depth (m) | Stratigraphic Position | Lithology |
|---|---|---|---|---|
| A-1 | B-Horizontal strata (H)1 | 1666.25 | Qian 5 | Interbedded argillaceous siltstone and silty mudstone |
| B-H2 | ||||
| B-Vertical strata (V)1 | ||||
| B-V2 | ||||
| A-1 | D-H1 | 2046.7 | Shan 1 | Silty mudstone |
| D-H2 | ||||
| D-V1 | ||||
| D-V2 | ||||
| A-1 | E-H1 | 2041.7 | Shan 1 | Coarse sandstone |
| E-H2 | ||||
| E-V1 | ||||
| E-V2 | ||||
| A-1 | G-Coalface fractures (C) | 1684.5 | Qian 5 | Medium sandstone |
| G-CH | ||||
| G-CV | ||||
| A-1 | I-Fractures perpendicular to the plane (F) | 1685.05 | Qian 5 | Medium sandstone |
| I-FH | ||||
| I-FV | ||||
| A-2 | J-H1 | 2727.85 | Benxi Formation | Silty mudstone |
| J-H2 | ||||
| J-V1 | ||||
| J-V2 | ||||
| A-3 | K-H1 | 2851.55 | Lower He 8 | Medium sandstone |
| K-H2 | ||||
| K-V1 | ||||
| K-V2 | ||||
| A-3 | L-H | 2891.3 | Shan 2 | Coal rock |
| L-V | ||||
| A-4 | M-C | 3589.1 | Upper He 8 | Fine sandstone |
| M-CH | ||||
| M-CV | ||||
| A-5 | N-H1 | 3221.2 | He 7 | Fine sandstone |
| N-H2 | ||||
| N-V1 | ||||
| N-V2 | ||||
| A-5 | O-C | 3215.4 | He 7 | Coarse sandstone |
| O-CH | ||||
| O-CV | ||||
| A-5 | P-F | 3646.7 | Upper He 8 | Coarse sandstone |
| P-FH | ||||
| P-FV | ||||
| A-6 | Q-F | 3182.94 | Shan 1 | Fine sandstone |
| Q-FH | ||||
| Q-FV |
| Well Number | Depth (m) | Lithology | Sample Number | Porosity (%) | Air Permeability (10−3 μm2) | Average Permeability -H (10−3 μm2) | Average Permeability -V (10−3 μm2) | Average Permeability -H/V | Annotation |
|---|---|---|---|---|---|---|---|---|---|
| A-1 | 1666.25 | Interbedded argillaceous siltstone and silty mudstone | B-H1 | 10.2 | 0.0802 | 0.0802 | 1.516 | Sample B-H2 contains fractures | |
| B-H2 | 9.1 | 130.0 | |||||||
| B-V1 | 10.4 | 0.0440 | 0.0529 | ||||||
| B-V2 | 9.9 | 0.0618 | |||||||
| A-1 | 2046.7 | Silty mudstone | D-H1 | 1.4 | 0.0194 | 0.01915 | 1.013 | ||
| D-H2 | 1.6 | 0.0189 | |||||||
| D-V1 | 0.7 | 0.0216 | 0.0189 | ||||||
| D-V2 | 0.8 | 0.0162 | |||||||
| A-2 | 2727.85 | Silty mudstone | J-H1 | 1.4 | 0.0551 | 0.08155 | 3.811 | ||
| J-H2 | 1.5 | 0.1080 | |||||||
| J-V1 | 2.2 | 0.0223 | 0.0214 | ||||||
| J-V2 | 1.1 | 0.0205 | |||||||
| Mean value | 1.34 | 0.0603 | 0.03107 | 2.113 | Samples of the B series are excluded | ||||
| Well Number | Depth (m) | Lithology | Sample Number | Stratigraphic Position | Porosity (%) | Air Permeability (10−3 μm2) | Average Permeability -H (10−3 μm2) | Average Permeability -V (10−3 μm2) | Average Permeability -H/V |
|---|---|---|---|---|---|---|---|---|---|
| A-1 | 2041.7 | coarse sandstone | E-H1 | Shan 1 | 9.8 | 4.540 | 3.845 | 2.80 | |
| E-H2 | 10.2 | 3.150 | |||||||
| E-V1 | 10.3 | 1.170 | 1.375 | ||||||
| E-V2 | 9.7 | 1.580 | |||||||
| A-3 | 2851.55 | medium sandstone | K-H1 | Lower He 8 | 7.3 | 0.182 | 0.182 | 2.53 | |
| K-H2 | 7.7 | 0.181 | |||||||
| K-V1 | 5.2 | 0.072 | 0.072 | ||||||
| K-V2 | 6.1 | 0.073 | |||||||
| A-5 | 3221.2 | fine sandstone | N-H1 | He 7 | 1.3 | 0.0486 | 0.0489 | 1.38 | |
| N-H2 | 1.3 | 0.0492 | |||||||
| N-V1 | 1.9 | 0.0391 | 0.0354 | ||||||
| N-V2 | 2.4 | 0.0317 |
| Well Number | Depth (m) | Sample Number | Lithology | Stratigraphic Position | Porosity (%) | Air Permeability (10−3 μm2) | Permeability H/V | The Ratio of Fracture Permeability to Parallel Bedding Plane Permeability |
|---|---|---|---|---|---|---|---|---|
| A-1 | 1684.5 | G-C | Medium Sandstone | Qian 5 | 15.9 | 28800 | 1.59 | 36,970.47 |
| G-CH | 6.8 | 0.78 | ||||||
| G-CV | 6.6 | 0.49 | ||||||
| A-1 | 1685.05 | I-F | Medium Sandstone | Qian 5 | 5.6 | 2510 | 2.36 | 12,938.14 |
| I-FH | 4.3 | 0.19 | ||||||
| I-FV | 4.1 | 0.08 | ||||||
| A-4 | 3589.1 | M-C | Fine Sandstone | Upper He 8 | 3.3 | 28100 | 1.18 | 536,259.54 |
| M-CH | 1 | 0.05 | ||||||
| M-CV | 1.5 | 0.04 | ||||||
| A-5 | 3215.4 | O-C | Coarse Sandstone | He 7 | 15.6 | 19400 | 1.26 | 13,379.31 |
| O-CH | 16.3 | 1.45 | ||||||
| O-CV | 15.7 | 1.15 | ||||||
| A-5 | 3646.7 | P-F | Coarse Sandstone | Upper He 8 | 6.5 | 52600 | 1.37 | 407,751.94 |
| P-FH | 5.3 | 0.13 | ||||||
| P-FV | 5 | 0.09 | ||||||
| A-6 | 3182.94 | Q-F | Fine Sandstone | Shan 1 | 7.9 | 649 | 2.85 | 6300.97 |
| Q-FH | 5.1 | 0.10 | ||||||
| Q-FV | 4.9 | 0.04 |
Disclaimer/Publisher’s Note: The statements, opinions and data contained in all publications are solely those of the individual author(s) and contributor(s) and not of MDPI and/or the editor(s). MDPI and/or the editor(s) disclaim responsibility for any injury to people or property resulting from any ideas, methods, instructions or products referred to in the content. |
© 2025 by the authors. Licensee MDPI, Basel, Switzerland. This article is an open access article distributed under the terms and conditions of the Creative Commons Attribution (CC BY) license (https://creativecommons.org/licenses/by/4.0/).
Share and Cite
Guan, Q.; Zhang, J. Petroleum System Analysis and Migration Pathways in the Late Paleozoic Source Rock Strata and Sandstone Reservoirs in the Ordos Basin. Energies 2025, 18, 210. https://doi.org/10.3390/en18010210
Guan Q, Zhang J. Petroleum System Analysis and Migration Pathways in the Late Paleozoic Source Rock Strata and Sandstone Reservoirs in the Ordos Basin. Energies. 2025; 18(1):210. https://doi.org/10.3390/en18010210
Chicago/Turabian StyleGuan, Qingfeng, and Jingong Zhang. 2025. "Petroleum System Analysis and Migration Pathways in the Late Paleozoic Source Rock Strata and Sandstone Reservoirs in the Ordos Basin" Energies 18, no. 1: 210. https://doi.org/10.3390/en18010210
APA StyleGuan, Q., & Zhang, J. (2025). Petroleum System Analysis and Migration Pathways in the Late Paleozoic Source Rock Strata and Sandstone Reservoirs in the Ordos Basin. Energies, 18(1), 210. https://doi.org/10.3390/en18010210