Abstract
This paper presents a simulation framework for evaluating power flow, energy efficiency, thermal behavior, and energy consumption in electric vehicles (EVs) under standardized driving conditions. A detailed Simulink model is developed, integrating a lithium-ion battery, inverter, permanent magnet synchronous motor (PMSM), gearbox, and a field-oriented control strategy with PI-based speed and current regulation. The framework is applied to four standard driving cycles—UDDS, HWFET, WLTP, and NEDC—to assess system performance under varied load conditions. The UDDS cycle imposes the highest thermal loads, with temperature rises of 76.5 °C (motor) and 52.0 °C (inverter). The HWFET cycle yields the highest energy efficiency, with PMSM efficiency reaching 92% and minimal SOC depletion (15%) due to its steady-speed profile. The WLTP cycle shows wide power fluctuations (−30–19.3 kW), and a motor temperature rise of 73.6 °C. The NEDC results indicate a thermal increase of 75.1 °C. Model results show good agreement with published benchmarks, with deviations generally below 5%, validating the framework’s accuracy. These findings underscore the importance of cycle-sensitive analysis in optimizing energy use and thermal management in EV powertrain design.
1. Introduction
Electric vehicles (EVs) have emerged as a critical component of sustainable transportation due to their potential to reduce greenhouse gas emissions and dependency on fossil fuels. The optimization of EV energy efficiency across various driving scenarios stands as a main research area because it affects both system performance and operational range, as well as user acceptance rates [1]. EVs are governed by complex interdependencies among electrical, mechanical, and thermal subsystems. The battery, inverter, electric motor, transmission, and vehicle dynamics are tightly coupled through instantaneous torque and speed demands, control strategies, and heat generation. These interrelated processes influence energy flow, thermal stress, and system efficiency, particularly under varying real-world load conditions. Accurate modeling of these components is essential for understanding energy distribution and losses within the system [2,3]. The research conducted by Miri et al. [4] emphasized the need for complete models that illustrate the dynamic relationships between these elements to obtain maximum energy utilization. Yang et al. [5] proved that urban driving conditions benefit from energy recovery technologies, especially regenerative braking, because they cut down total energy usage. Research conducted by Asim et al. [6] demonstrated that advanced thermal management systems are essential components for EV operations because they offer enhanced power electronics and battery efficiency, together with optimal operating conditions.
Widely used driving cycles, including the Urban Dynamometer Driving Schedule (UDDS) and the Highway Fuel Economy Test (HWFET), enable the evaluation of electric vehicles under real road conditions. Driving cycles replicate different velocity patterns that permit researchers to study power usage patterns. Brady et al. [7] recently discovered that urban driving zones, with their frequent stops and starts, give vehicles better opportunities to harness energy through braking recovery systems, while highway driving mostly verifies an engine’s ability to hold steady power outputs. Building on this, Settey et al. [8] evaluated the impact of traffic density and road gradients on energy consumption during these cycles, highlighting the need for location-specific optimization strategies. Enhancing electric vehicle efficiency occurs through both component optimization and progressive energy management system deployment. The use of silicon carbide (SiC)-based inverters enables advanced EV systems to function at higher performance rates and produce decreased thermal waste [9]. Permanent magnet synchronous motors (PMSMs) have become popular because they show outstanding performance, alongside high efficiency and small energy dissipation [10]. Furthermore, Mei et al. [11] investigated the potential of axial flux motors, which offer compact designs and reduced weight, making them attractive for next-generation EVs. The development of solid-state batteries, along with other battery technology innovations, has boosted both the energy density and cycle lifetime, advancing the efficiency of EVs [12]. In addition, Fanoro et al. [13] emphasized the importance of using advanced battery management systems (BMS) to reduce problems such as overcharging and thermal runways, expanding battery life and ensuring frequent performance. Such tools allowed Mersha et al. [14] to detect design optimization and evaluate the effects of driving conditions on energy efficiency.
In addition, Jaramillo et al. [15] demonstrated the integration of the machine learning algorithm into a simulation environment to predict energy consumption patterns based on historical driving data, leading to more accurate and adaptive energy management strategies. Zhao et al. [16] performed an experimental analysis of the energy drift of electric vehicle (EV) batteries under various environmental temperatures, revealing that they had significant consequences for overall performance and efficiency. They discovered that the driving range reached its maximum at 23 °C (256.09 km), compared to −7 °C (162.89 km) and 35 °C (198.69 km). At −7 °C, increased energy losses were attributed to lower charging/discharging performance and increased heating needs, while at 35 °C, compressor electricity consumption accounted for a significant portion of strength use (up to 15.25%). These findings emphasize the essential function of thermal control in retaining EV performance across distinctive climates. Sayed et al. [17] investigated the strength consumption and performance of EV powertrains across unique well-known usage cycles using simulations. The findings revealed that various driving styles had an effect on power usage and identified opportunities to enhance powertrain performance. The results highlighted the significance of optimizing driving behavior and electricity control strategies to enhance overall EV performance and amplify the usage range. Teh [18] developed a method to quantify the environmental and economic impacts of motor vehicle braking by assigning “price tags” to braking events, including power consumption, gasoline utilization, monetary value, and emissions. The findings revealed that braking accounted for about 45% of general fuel intake in urban driving, with the potential for financial savings of over 50% by using braking avoidance strategies such as maintaining large gaps and predictive driving. This approach highlights the critical role of driving behavior in enhancing gasoline performance and lowering emissions, contributing to broader sustainability goals. Kiyakli and Solmaz [19] developed a dynamic version of an EV using Simulink to assess power intake and performance under the New European Driving Cycle (NEDC) and the Worldwide Harmonized Light Vehicle Test Procedure (WLTP). Their model showed that the EV consumed 15.87 kWh/100 km, achieving a range of 177 km within the NEDC, and 17.93 kWh/100 km, with a range of 157 km in the WLTP cycle. In addition, regenerative braking achieved power savings of up to 8.21% within the NEDC. These results highlight the significance of regenerative braking and driving cycles in optimizing EV efficiency and extending range.
While numerous studies have explored individual aspects of electric vehicle (EV) performance, a key gap persists: few researchers have provided an integrated simulation that combines electrical power flow, thermal behavior, and control dynamics—especially in the context of standardized driving cycles. Existing works often isolate battery power analysis from thermal modeling, or evaluate thermal effects without capturing drive cycle-specific load variability [20,21]. Additionally, few studies examine transient PMSM efficiency variations or state-of-charge (SOC) behavior in real time, limiting their relevance for system-level optimization and control validation [22]. To address these limitations, a comprehensive simulation framework must fulfill the following requirements:
- Integrate electrical and thermal subsystems in a single modeling environment.
- Simulate dynamic responses across a range of standardized drive cycles.
- Simultaneously quantify battery power flow, SOC depletion, and temperature rise in key components.
- Support real-time control strategies such as field-oriented control (FOC) and regenerative braking.
This study presents a unified Simulink-based model for EV powertrain analysis that meets these requirements. The model includes a lithium-ion battery, inverter, PMSM, gearbox, vehicle dynamics, and closed-loop control with PI-based speed and current regulators. Simulations are conducted across four widely used driving cycles—UDDS, HWFET, WLTP, and NEDC—to evaluate battery power profiles, SOC variation, motor and inverter temperatures, and overall drivetrain efficiency. In contrast to earlier studies that examine electrical or thermal behavior in isolation, this work offers an integrated evaluation of EV powertrain dynamics under realistic operating conditions. By coupling energy flow, efficiency, and thermal response within a single simulation environment, the proposed framework provides deeper insight into the performance of EVs and contributes a practical foundation for energy-aware and thermally robust powertrain design. Based on the above gaps, this study aims to develop a unified simulation framework that integrates power flow, thermal behavior, and control strategies to assess EV performance under different standardized driving cycles.
2. Methodology
This study employed a methodology that involved using an electric vehicle (EV) powertrain model to simulate the energy efficiency and power flow of an EV subjected to varying driving conditions. Simulink R2022b, a platform for simulating complex power electronic systems, was used to create the model. The key system components within the powertrain system included a lithium-ion battery bank as the main energy source, an inverter to convert the battery power from DC to AC for the motor, a permanent magnet synchronous motor (PMSM) to propel the vehicle, a gearbox mounted on the motor to handle torque, and finally, a vehicle dynamic model to represent how the vehicle interacts with its surroundings. Figure 1 shows the key components of an EV powertrain.
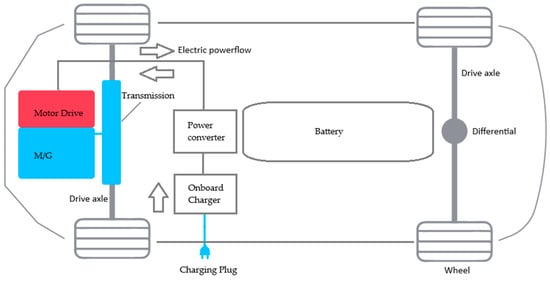
Figure 1.
EV powertrain components.
Energy management strategies were added to the model to enhance its capabilities in order to improve the total efficiency of the system and system performance. The strategies included a regenerative braking mechanism, which recaptured kinetic energy during deceleration, and speed and torque control algorithms, which optimized motor operations under different operating scenarios. These were designed as control systems to simulate the real-time management of energy flow and provide a simple illustration of the impact of advanced techniques on the conservation of and increase in energy efficiency. This study also simulated driving cycles to test the EV powertrain model developed in this study under a realistic operating environment. Standardized speed profiles were used to represent real-world driving patterns, allowing researchers to evaluate powertrain system performance and energy efficiency across many scenarios.
To model a wide range of driving conditions, four standardized driving cycles were utilized in this study: the Urban Dynamometer Driving Schedule (UDDS), the Highway Fuel Economy Test (HWFET), the Worldwide Harmonized Light Vehicle Test Procedure (WLTP), and the New European Driving Cycle (NEDC). The UDDS is designed to replicate urban driving, which is characterized by frequent stops, starts, accelerations, and decelerations. It mirrors the demands of city driving, which involves short periods of high power usage and fluctuations in energy usage due to traffic signals, intersections, and congestion. The HWFET is representative of highway driving in a steady state, characterized by high velocity consistence, few halts, and higher operating speeds, at which point aerodynamic drag becomes more substantial, and the motor runs closer to its optimum efficiency. The WLTP presents a balanced view of typical driving scenarios, combining urban, suburban, and highway driving segments, and the NEDC represents urban driving with moderate accelerations. In this study, the driving cycles were effectively modeled, and the powertrain performance, regenerative braking, energy consumption, and thermal behavior of the driveline were comprehensively assessed across a range of realistic scenarios. The selected driving cycles reflect a range of real-world operating conditions. UDDS is designed to replicate urban traffic, with frequent stops and accelerations. HWFET represents typical highway driving with steady speeds and low variability. WLTP combines urban, suburban, and highway segments, making it representative of global mixed-use driving. NEDC simulates older European test procedures and includes both urban and extra-urban elements, offering a moderate composite of city and light highway behavior.
All control measures and speed trajectories applied in this research existed inside an automated Simulink testing environment with closed-loop operations. This work did not include reverse-time hardware deployment nor dynamic vehicle speed calculation through mechanical rotor and transmission system equations. Standardized speed inputs served as the input conditions for evaluation purposes to maintain universal assessment across diverse driving cycles. Future research aims to achieve real-time embedded system control and complete electromechanical coupling to enable comprehensive validation.
2.1. System Architecture
The EV powertrain architecture was designed for multi-domain integration, aiming to replicate the energy distribution from the battery to the power electronics, motor, transmission system, and wheels. The EV powertrain was modeled for each of its components using pre-defined libraries and customizable Simulink blocks, ensuring a balance between accuracy and computational efficiency was achieved. Figure 2 and Figure 3 show the system architecture and Simulink block diagram, respectively. The AC-DC rectifier and associated DC-DC converter shown in the schematic represent the vehicle’s grid-interactive charging interface. However, these components were bypassed and deactivated during all drive cycle simulations in this study. They were retained in the diagram solely to reflect the model’s future expandability for bidirectional charging scenarios and do not influence the simulation results presented.
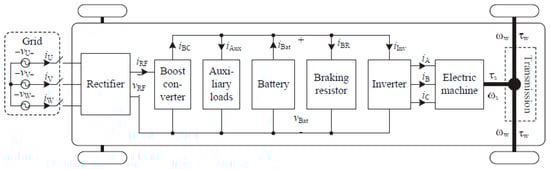
Figure 2.
The system architecture [23].
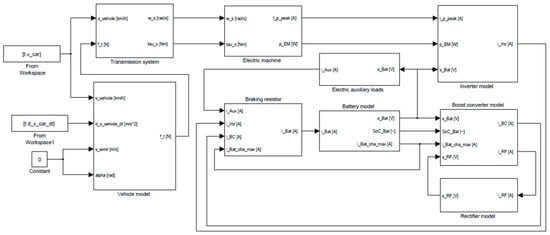
Figure 3.
Simulink model.
While high-fidelity models offer detailed thermal and electrical representations of batteries, motors, and control systems, this study adopts a simplified architecture to prioritize computational efficiency and system-level insight. The reduced-order model allows for rapid simulation across multiple driving cycles while capturing key interactions in power flow, regenerative braking, and thermal trends. This enables clearer comparison of performance trade-offs under dynamic operating conditions. Preliminary testing with more detailed component blocks showed similar behavioral trends but introduced considerable simulation overhead without proportionate gains in analytical clarity. Therefore, the selected model structure offers a practical balance between simulation speed and engineering relevance. Future work will expand this framework by incorporating higher-fidelity subsystems and benchmarking against standard reference architectures to enhance validation and technical robustness. The system architecture includes the following main components:
- Battery: In order to model energy storage and discharge, a lithium-ion battery model was chosen. Li-ion batteries are the most prevalent rechargeable battery solution because they offer excellent energy density, along with lightweight construction and an extended cycling ability [24]. The chosen parameters were the nominal voltage, Ah capacity, interconnection resistance, and SOC variation over time. The charge–discharge cycles of the battery were modeled through the accumulation of the current over time, and energy loss was incorporated through internal resistance to control voltage drop and heat production. The SOC calculation also involved the energy used for propulsion and the energy recovered by regenerative braking, which provided a real-time simulation to test the battery load.
- Inverter: An inverter was utilized to transform the battery-generated DC power into AC. This step has been adopted in EV design to maintain the electric motor and extend the battery life. Therefore, the inverter was designed based on a power electronics block capable of converting the DC output from the battery into a 3-phase AC signal suitable for driving the motor. The pulse-width modulation (PWM) method was used to control the switches, thereby controlling the frequency of the motor and, hence, the speed and torque. Using the PWM method allowed for optimal consumption of the energy from the battery, reducing switching losses in the system while maintaining motor stability. The inverter simulated both the battery electronic components and their control logic, offering a realistic representation of the battery–motor interface [25]. The inverter is directly supplied by the battery, and no intermediate DC-DC converter is modeled. As such, the DC-link voltage reflects the battery terminal voltage and varies dynamically during simulation based on load and state of charge. This approach avoids architectural ambiguity and ensures consistency in power flow analysis.
- Motor: Due to its exceptional productivity and precise speed and torque control, the interior permanent magnet synchronous motor (PMSM) is widely used in electric vehicles [1]. Hence, the electric motor was parameterized using the characteristics of a typical interior PMSM, based on data provided by the manufacturer and implemented through the standard Simulink PMSM block. For the motor block, all specific features, including the torque–speed characteristics, electromagnetic losses, and mechanical losses, were modeled. The system calculates torque based on the interaction force between stator current signals and rotor flux linkage () which stands for the magnetic field created by rotor permanent magnets. Motor specifications provided the rotor flux linkage, which was considered a constant parameter throughout the mathematical model. A complete model of PMSM electromagnetic losses included both copper losses and core (iron) losses. The copper losses were computed by combining the stator current measurement with the known stator resistance value following regular electric machine analytical procedures. Core losses, including hysteresis and eddy current losses, were represented using a speed-dependent empirical model based on motor datasheet characteristics and validated literature. Furthermore, static or dynamic motor efficiency maps were utilized to evaluate the power conversion efficiency under different operating conditions. This enabled accurate modeling of the flow of power and achievable performance parameters.
- Transmission: A single-gear transmission with a quantitative gear ratio was used to successfully model the coupled mechanical system linking the motor to the vehicles’ wheels. The transmission model accounts for losses due to gears, friction, and other mechanical impedances frequently encountered in practical models. These losses are used to determine the actual torque transmitted to the wheels and the corresponding vehicle speed. The simple concept of the single-speed transmission model conforms to the general architecture of most EVs, which benefit from the broad operating range of the motor and, therefore, do not require multi-speed gearboxes.
- Auxiliary loads: An auxiliary loads block is included in the system architecture to account for non-propulsion electrical consumers such as HVAC, lighting, infotainment, and onboard electronics. In this simulation, the auxiliary load was modeled as a constant power drain of 700 W across all driving cycles, reflecting typical values reported for compact EVs. This ensures that total battery power consumption includes realistic background loads, thereby improving the fidelity of energy consumption results.
- Vehicle dynamics: The simulated vehicle used in this research corresponds to a standard electric passenger car which shows similar attributes to actual market-ready EVs like the Nissan Leaf and Hyundai Ioniq. The key vehicle parameters, including the mass, drag coefficient, frontal area, and rolling resistance coefficient, were selected from validated studies and datasets in the literature [25] to ensure realistic performance. The vehicle dynamics were analyzed using formulas that account for the vehicle’s mass, road–tire interaction, air resistance, and road inclination. These factors collectively influence the forces acting on the vehicle, enabling precise predictions of its longitudinal motion. Figure 4 presents a free-body diagram (FBD) illustrating the forces acting on a vehicle moving on an inclined plane. Several forces were considered in this analysis. Gravitational force acts downward and has a component along the incline calculated as the product of the vehicle mass, gravitational acceleration, and the sine of the road slope angle; normal force is exerted by the road surface perpendicular to the incline, balancing the perpendicular component of gravity; rolling resistance opposes motion due to the tire–road interaction and depends on the normal force; aerodynamic drag acts in opposition to the vehicle’s motion and is influenced by wind velocity; traction force is required to overcome resistive forces and accelerate the vehicle; propulsion force is generated by the powertrain and transmitted through the wheels.
 Figure 4. Vehicle FBD.
The model established a system to emulate longitudinal vehicle behavior by applying Newton’s second law, which requires traction force to surpass aerodynamic drag together with rolling resistance and road slope forces and vehicle inertia. The governing equation is given as follows [26]:
where is the vehicle mass, is the longitudinal velocity, is the traction force transmitted through the wheels, and represents the total resistive forces acting on the vehicle. This equation determines the acceleration , which is numerically integrated to update vehicle velocity over time. The longitudinal dynamics are directly influenced by both the control system and road conditions, making this model essential for evaluating energy consumption and regenerative braking performance under different driving cycles. The traction force is derived from the electromagnetic torque output of the PMSM, passed through the gearbox [27]:
where is the electromagnetic torque generated by the motor, is the gearbox efficiency, and is the wheel radius. The total resistive force consists of aerodynamic drag, rolling resistance, and gravitational force from road inclination, given by [28]:
where is the air density, is the frontal area of the vehicle, is the aerodynamic drag coefficient, is the rolling resistance coefficient, is the gravitational acceleration, and is the road slope angle.
2.2. Control System Implementation
A closed-loop simulation environment allowed the control system to achieve optimal powertrain performance and energy efficiency for EVs. The system relies on Field-Oriented Control (FOC) as a vector control approach to manage the PMSM by allowing precise torque management and independent flux regulation. Feedback loops developed inside Simulink perform dynamic power flow control while boosting drivability and maximizing regenerative braking capabilities during different driving conditions.
2.2.1. Speed and Torque Control Using FOC
A PI controller was used in the outer loop to regulate vehicle speed by comparing the reference velocity with the actual speed. The resulting error signal was used to generate the q-axis current for the motor. In the inner loop, two additional PI controllers were implemented to regulate the d-axis and q-axis stator currents and . These controllers output the reference voltages (), which were transformed using inverse Park and Clarke transformations to produce three-phase voltage signals for the voltage source inverter (VSI). This control structure enables dynamic and decoupled control of torque and flux, which is essential for EV applications [29]. The PI controller structure used in this study follows conventional field-oriented control (FOC) architecture, as commonly described in the engineering literature, and was adapted to the Simulink environment for simulation.
Figure 5 illustrates the field-oriented control (FOC) structure implemented in the Simulink environment for the PMSM drive. The outer loop includes a PI speed controller that compares the reference speed with the actual motor speed , producing a reference q-axis current . This value, along with a constant or zero d-axis current reference , is fed into the inner current control loop. Two PI controllers regulate the stator current errors to generate reference voltages and , which are transformed through inverse Park and Clarke transformations before being applied to the voltage source inverter (VSI). The inverter generates the three-phase voltages that drive the PMSM. A feedback loop returns key signals—motor speed and measured d/q-axis currents—to close the loop and enable dynamic torque and flux control.
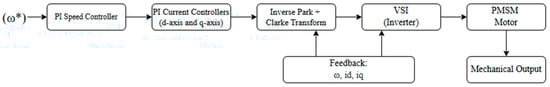
Figure 5.
PI-controlled FOC regulates PMSM speed and current.
The FOC-based control approach implements two cascaded control loops that operate sequentially. The outer control loop functions as a PI speed controller which compares motor reference speed against actual motor speed to track target values. The controller generates the reference q-axis current that defines the required torque for vehicle motion. The PI control law is given by [30]:
In the inner loop, separate PI controllers regulate the d-axis and q-axis stator currents and , generating the corresponding voltage commands and . These voltages are transformed through inverse Park and Clarke transformations and fed into the inverter. The current control law for the d-axis and q-axis, are given by [30]:
The motor torque is generated primarily by the q-axis current. The electromagnetic torque of the PMSM in the rotating d-q reference frame is calculated as follows [30]:
where is the number of poles, is the rotor flux linkage, and and are the d- and q-axis inductances. In many EV applications, particularly with surface-mounted PMSMs, ≈ , and , simplifying the torque equation to
Independent control of motor speed alongside torque control becomes achievable through this method, which preserves high operational efficiency while enabling rapid response to varying driving conditions [31]. The PI controllers in the FOC scheme received their tuning parameter values through conventional adjustment methods that leveraged system dynamics together with empirical parameter modifications. A successful gain adjustment combination was established to reach the reference speed efficiently with minimal overshoot and minimal oscillation. The and commands produced by the outer loop can be tracked effectively by designing current controller gains with high bandwidth. Multiple iterations of testing within Simulink resulted in finalizing the parameters which delivered consistent driving results across multiple cycles. In this study, the FOC structure was developed in Simulink and customized specifically for the modeled EV propulsion system. The PI controller parameters were tuned iteratively based on the motor’s torque constant, moment of inertia, and the typical transient loads observed across the four driving cycles. The control design ensured fast torque response, minimal current ripple, and high-speed tracking accuracy across variable conditions. Moreover, the FOC block was fully integrated with the inverter, battery, and thermal subsystems, allowing the simulation to accurately reproduce regenerative braking behavior and analyze power loss distribution and temperature rise during real-world transient events. This adaptation was essential for achieving the core objectives of the study: evaluating powertrain efficiency and thermal response under different operating scenarios. In addition, regenerative braking occurred actively throughout the driving simulations. During deceleration, the PMSM operates in generator mode and returns energy to the battery, which is fully accounted for in the SOC calculation using bidirectional current integration. While a braking resistor is included in the full Simulink architecture for extendibility, it was disabled during all simulations. Therefore, no energy was diverted to thermal dissipation through resistance, and all recoverable energy was routed to the battery system.
2.2.2. PMSM Electrical Model
The PMSM electrical behavior was modeled through the d-q rotating reference frame because this framework provides independent control of torque and flux. Stator voltage equations derived from Kirchhoff’s voltage law provide a mathematical expression of the relationships between applied voltages and induced electromotive forces (EMFs) and their impact on stator current evolution through d- and q-axis components. The differential equations are given by [32]:
where and are the applied stator voltages, is the stator resistance. The electrical angular velocity is related to the rotor angular velocity by [32]:
2.2.3. Rotor Mechanical Dynamics
The PMSM rotor mechanical dynamics describe the angular motion of the shaft, which connects electromagnetic stator torque to vehicle drivetrain operation. This dynamic behavior is governed by Newton’s second law for rotational systems and is expressed as follows [27]:
where is the total rotational inertia of the motor and load, is the opposing torque due to drivetrain and vehicle resistance, and is a viscous damping coefficient representing internal friction. The load torque can be expressed in terms of the vehicle’s longitudinal resistance as follows [27]:
where is the total resistive force acting on the vehicle, is the effective wheel radius, and is the gear efficiency. This equation creates a fundamental connection between electric torque generation and vehicle movement which requires simultaneous numerical solution with motor and vehicle system dynamics.
2.2.4. Thermal Model
This study utilized the Simulink environment to integrate thermal models based on lumped-parameter networks for analyzing both motor and inverter thermal behavior. The simulation models assess the temperature change of components under standard driving cycles by analyzing internal power loss signatures. Understanding thermal responses provides important information about energy efficiency along with component stresses, potential thermal derating requirements, and protection methods. The thermal modeling method employs resistance–capacitance (RC) equivalent circuits that depict electrical losses as heat sources which transmit heat through thermal resistances until they reach ambient temperature. The modeling approach treated each component as a single thermal node equipped with internal heat-generation capability and thermal time constants determined by their associated capacitances.
- Motor thermal model: The PMSM’s thermal model incorporates both copper losses and core losses as internal heat sources, and they are modeled as follows [33]:where is the stator phase current and is the stator resistance, is a speed-dependent loss coefficient, and is the mechanical angular velocity of the rotor. The total motor losses are applied to a thermal RC model representing the stator winding and housing as follows [33]:where is the motor temperature, is the ambient temperature, and and are the thermal resistance and capacitance of the motor assembly.
- Inverter thermal model: The inverter was modeled as a single thermal node with internal heat generation based on conduction and switching losses in the power semiconductors. The conduction and switching losses ( and ) are governed by the following laws [34]:where is the root mean square current, is the on-state resistance of the semiconductor switch, is the DC-link voltage, is the peak current, is the switching transition time, and is the switching frequency. The total inverter power loss isthis heat input is applied to a thermal RC circuit representing the inverter’s cooling path as follows [34]:where is the inverter temperature and and are the thermal resistance and capacitance of the inverter.
While lumped-parameter RC thermal models offer rapid simulation capabilities and are suitable for system-level analysis, they inherently lack spatial resolution. As a result, they cannot capture internal component temperature gradients or localized hot spots, which are critical in high-fidelity thermal analysis. For more accurate thermal predictions, future work could consider distributed parameter models or coupling with CFD-based solvers to resolve detailed heat transfer paths, cooling behavior, and component-level thermal stress.
2.3. Motor Efficiency Mapping
A PMSM efficiency map was generated based on typical electric vehicle motor characteristics, as shown in Figure 6. Efficiency is plotted as a function of motor speed and torque. Overlaid are the simulated operating points for each driving cycle (UDDS, HWFET, WLTP, and NEDC), illustrating how different driving profiles interact with motor efficiency. The UDDS cycle, which is characterized by frequent acceleration and deceleration events, exhibits a wide spread of operational points. In contrast, the HWFET cycle points cluster around higher speeds and moderate torques, reflecting steadier driving conditions. The WLTP and NEDCs display intermediate distributions. This visual analysis supports the responsiveness and accuracy of the proposed model in capturing cycle-specific powertrain dynamics. The PMSM efficiency map used in the simulation was constructed using a physics-based model that incorporates copper, iron, and mechanical losses. These losses were calculated across a 20 × 20 grid of torque and speed points using the actual motor parameters listed in Table 1. The efficiency at each operating point was computed as the ratio of mechanical output to electrical input power. The map includes both motoring and regenerative quadrants and was implemented in Simulink using a 2D lookup table with bilinear interpolation for real-time evaluation during dynamic cycles. Inverter losses were modeled separately using IGBT switching and conduction losses and are included in the system’s energy balance but are not embedded within the motor efficiency map.

Figure 6.
PMSM efficiency map with operating points for all standard cycles.

Table 1.
Motor parameters for efficiency map construction.
2.4. Study Parameters
To simplify the simulation framework while maintaining realistic performance prediction, the following assumptions were made:
- The ambient temperature was considered constant at 20 °C throughout all simulations.
- The gearbox efficiency was assumed to be fixed and independent of load or temperature variations.
- The thermal models employed lumped-parameter (RC network) approaches, assuming uniform heat distribution within motor and inverter components.
- Battery aging effects, degradation phenomena, and temperature-dependent capacity loss were not included.
- External disturbances such as tire slip, varying road slopes, and aerodynamic side forces were not modeled.
These simplifications allow a focused comparison of drivetrain performance across different driving profiles while preserving sufficient accuracy for thermal and energy analysis.
The simulation results depend heavily on input parameters which decide system behavior and maintain both accuracy and reliability. The current analysis utilized an interior permanent magnet synchronous motor which appears in electric vehicles because of its superior torque density and efficient operation as an EV motor. Table 2 presents all key input values, which include data regarding vehicle dynamics and battery configuration together with inverter efficiency and motor parameters. While these cycles are typically defined for flat-road conditions, a moderate 5° slope was introduced in this study to emulate real-world uphill segments commonly encountered in urban and peri-urban environments. This added load enables a more pronounced assessment of powertrain losses, regenerative braking performance, and thermal response under stress conditions. The elevation is not intended to represent a continuous real-world gradient but rather to simulate representative uphill demand for evaluation purposes. The chosen input values align with validated research from the literature [25,29,31,35] to deliver an accurate simulation representation of a real-world electric vehicle platform.
Table 2.
Parameters used in this study.
These assumptions were made to maintain simulation efficiency; however, they can influence the model’s accuracy under certain conditions. For instance, a constant ambient temperature may lead to underprediction of peak thermal loads during real-world high-temperature events, potentially overlooking thermal derating thresholds. Similarly, lumped-parameter thermal models cannot capture localized hot spots within components like motor windings or inverter switches, which may result in underestimated thermal gradients. Although these effects do not invalidate the overall system-level trends observed in the study, they may limit the precision of thermal predictions for design-critical applications.
2.5. Variables Monitored
The simulation monitored the following key variables to evaluate the powertrain’s performance:
- Battery SOC: the state of charge was tracked over time to determine the energy consumption and regeneration during the drive cycle.
- Motor efficiency: the torque–speed characteristics and energy losses were evaluated to assess motor efficiency across varying load conditions.
- Energy consumption: the simulation monitored the total energy drawn from the battery to propel the vehicle and analyzed the energy usage patterns during different driving conditions.
- Inverter and motor temperatures: Temperature variations were monitored to keep the inverter temperature within the usual operating parameters to avoid inefficient operation and possible system failure due to excessive heating. The results can also be used to evaluate the performance of the thermal management system and its part in helping to provide reliable inverter and motor operation during extended periods of use.
3. Results and Discussion
3.1. EV Efficiency by Cycle
This section presents a comparative analysis of the electric vehicle’s efficiency and energy usage across four standardized drive cycles: UDDS, HWFET, WLTP, and NEDC. These cycles are designed to replicate urban and highway driving conditions, with varying durations, acceleration profiles, and load demands. The analysis focuses on two key performance indicators: the instantaneous efficiency of the permanent magnet synchronous motor (PMSM) and the battery’s state of charge (SOC) over time. All simulations begin with a fully charged battery at 100% SOC and were conducted under nominal environmental conditions. The simulation results are based on four standard driving cycles, each with its own defined duration: UDDS (1370 s), HWFET (765 s), WLTP (1800 s), and NEDC (1180 s). These differences reflect the intended operating environment of each cycle, from urban stop-and-go to sustained highway driving. While the efficiency map provides accurate steady-state estimation of PMSM performance, it does not resolve transient effects during sharp torque variations or frequent regenerative-motoring transitions. This quasi-static assumption results in smoother efficiency trends, especially in dynamic cycles. We acknowledge this limitation and recommend future enhancements using coupled loss estimators or real-time data-driven loss models to capture these dynamics more accurately.
3.1.1. UDDS Cycle
UDDS demonstrates the driving behavior of city zones through numerous stops and starts accompanied by brief acceleration periods. The UDDS cycle extends for 1370 s through multiple speed variations that involve continuous starting and stopping. Figure 7 illustrates the PMSM’s operational efficiency during the entire UDDS duration. The repeated load transitions during motor operation lead to variations in torque together with speed conditions, resulting in significant changes to efficiency. Efficiency peaks briefly during low-load cruising conditions, but the average efficiency rate remains lower than highway cycles.
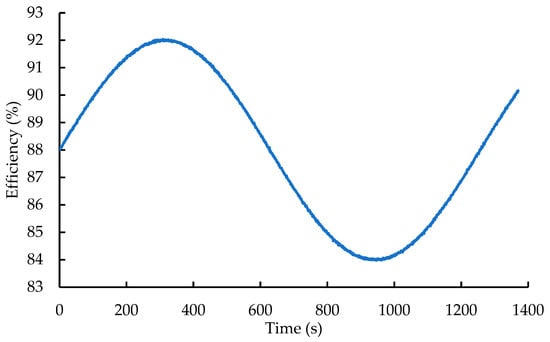
Figure 7.
PMSM efficiency variation over time during the UDDS drive cycle.
Figure 8 displays the SOC profile during the UDDS cycle. The battery discharges steadily due to the constant stop-and-go behavior, which requires frequent bursts of power. However, SOC increases slightly during regenerative braking phases, particularly in deceleration events following acceleration spikes. These recoveries highlight the importance of effective regeneration in urban environments.

Figure 8.
Battery SOC variation over time during the UDDS drive cycle.
3.1.2. HWFET Cycle
HWFET simulates smooth and continuous highway driving over a duration of 765 s. This cycle is characterized by low variability in speed and torque, with extended periods of steady-state operation. Figure 9 indicates that the PMSM efficiency in this cycle consistently remains high, typically ranging from 88% to 94%, as the motor operates closer to its optimal efficiency zone.
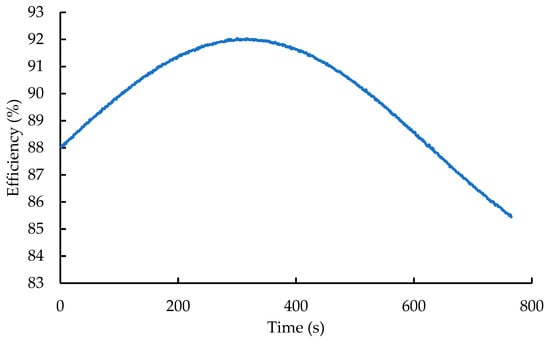
Figure 9.
PMSM efficiency variation over time during the HWFET drive cycle.
The SOC profile shown in Figure 10 demonstrates a gradual and linear decline with negligible energy recovery. Regenerative braking is rarely activated in this scenario due to minimal deceleration. The consistent efficiency and predictable load profile in the HWFET cycle make it a useful benchmark for thermal modeling and efficiency optimization under stable driving conditions.
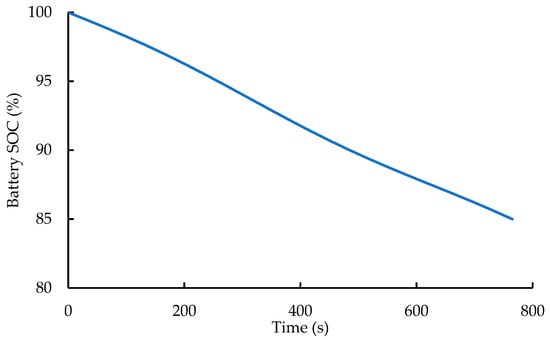
Figure 10.
Battery SOC variation over time during the HWFET drive cycle.
3.1.3. WLTP Cycle
WLTP incorporates urban, suburban, and highway driving behaviors over a duration of 1800 s. It presents a realistic and globally standardized test cycle. As illustrated in Figure 11, the PMSM’s efficiency varies significantly throughout the WLTP due to rapid changes in driving conditions. Efficiency dips are evident during periods of high torque demand in the acceleration phases, while higher efficiency levels are observed during cruising intervals.
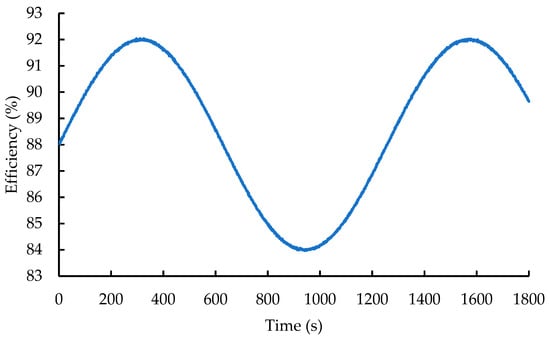
Figure 11.
PMSM efficiency variation over time during the WLTP drive cycle.
Figure 12 shows that SOC declines more rapidly in this cycle than in UDDS or HWFET, reflecting its combination of a high dynamic load and longer duration. Multiple instances of regenerative braking can be observed, as indicated by brief increases in SOC during deceleration segments. This highlights the value of optimized control strategies to leverage regenerative opportunities during mixed-condition driving.
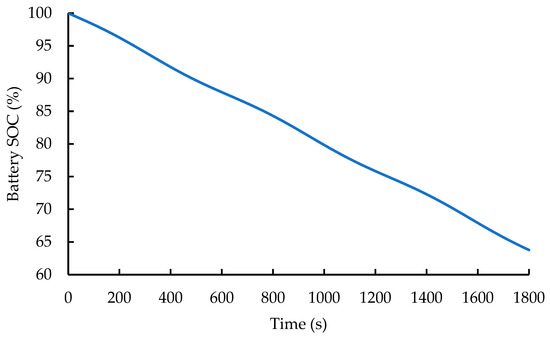
Figure 12.
Battery SOC variation over time during the WLTP drive cycle.
3.1.4. NEDC
The NEDC spans approximately 1180 s and consists of alternating urban and extra-urban segments. The cycle is less aggressive than WLTP, with more predictable speed profiles and fewer rapid acceleration events. As shown in Figure 13, the PMSM’s efficiency remains relatively steady, with modest fluctuations correlating to light load variations.
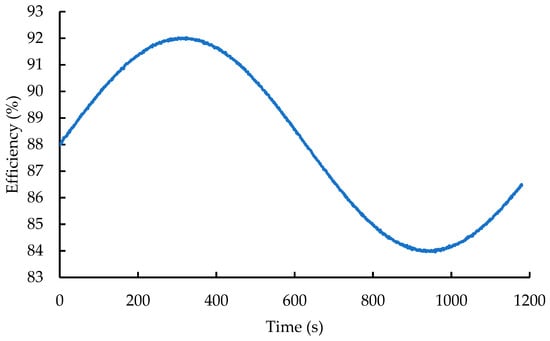
Figure 13.
PMSM efficiency variation over time during the NEDC.
Figure 14 presents the SOC profile for the NEDC. Although the battery discharges steadily, the overall energy consumption rate is lower compared to that of the WLTP and UDDS cycles. Regenerative braking is evident, though less pronounced, as the cycle includes fewer high-speed deceleration periods. The moderate nature of this cycle results in more conservative energy usage and relatively stable thermal behavior.

Figure 14.
Battery SOC variation over time during the NEDC.
3.1.5. Drive Cycle Influence on EV Efficiency and Energy Usage
The results presented across the four standard drive cycles, UDDS, HWFET, WLTP, and NEDC, highlight the significant influence of driving conditions on the overall efficiency and energy consumption of the electric vehicle system. The PMSM efficiency profiles demonstrate that highway-oriented cycles including HWFET sustain motor efficiency between 88% and 94% with stable performance. The stable speed profile combined with consistent loading conditions allow motors to operate inside their most efficient operating zone. The efficiency levels in UDDS and WLTP urban cycles experience broad fluctuations because driving conditions involve multiple speed and load changes. High efficiency reaching 90% and above only occurs during short periods of light-load cruising, but the average overall efficiency decreases due to the transient nature of operation.
The shapes of the SOC profiles demonstrate a similar pattern. The SOC value in HWFET steadily decreases over time because the vehicle mainly consumes power and performs limited regenerative braking. The UDDS and WLTP cycles demonstrate clearly changing SOC values because they take advantage of energy conservation during braking periods. Despite these regenerative events, their total SOC depletion is typically higher than in HWFET due to their dynamic driving nature and longer durations in the case of WLTP. Evaluating the evaluated cycles, we draw the following conclusions:
- HWFET demonstrates the most energy-efficient behavior due to steady-state operation and lower dynamic losses.
- WLTP results in the highest energy consumption, driven by its extended duration and varying load demands.
- UDDS illustrates the value of regenerative braking in urban contexts, though frequent load spikes challenge thermal and efficiency performance.
- NEDC maintains moderate efficiency throughout but reflects characteristics of both urban and extra-urban conditions with fewer regenerative benefits.
3.2. Thermal Behavior
This section presents the thermal behavior of the PMSM and inverter across four drive cycles, UDDS, HWFET, WLTP, and NEDC, based on the simulated temperature profiles. All simulations begin at 30 °C for the motor and 28 °C for the inverter under nominal cooling assumptions.
3.2.1. UDDS Cycle
As shown in Figure 15, the UDDS cycle generated the highest thermal stress among all drive cycles. Over the 1370 s simulation, the motor temperature increased by approximately 76.5 °C, while the inverter temperature rose by 52.0 °C. This significant rise is attributed to frequent acceleration and deceleration events, which lead to rapid fluctuations in load and high torque demand. These conditions drive higher current through the motor windings and switching components, resulting in sustained power losses and heat buildup. The results emphasize the need for robust cooling systems under urban stop-and-go driving conditions.
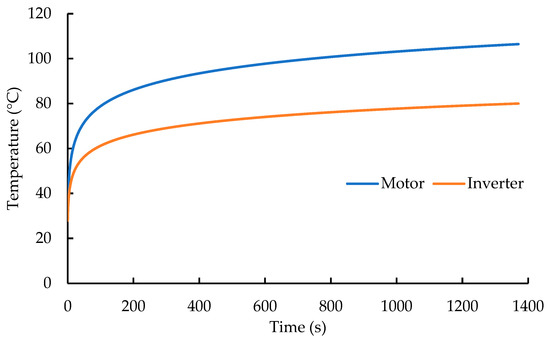
Figure 15.
Motor and inverter temperature rise under urban stop-and-go conditions.
3.2.2. HWFET Cycle
Despite being a highway cycle with relatively steady operating conditions, the HWFET simulation resulted in a motor temperature increase of 72.7 °C and an inverter temperature increase of 51.5 °C, as presented in Figure 16. Although load variability is minimal in this cycle, the motor and inverter operate for sustained durations at moderate to high power levels, contributing to continuous heat generation. The results suggest that while highway driving is less thermally aggressive than urban cycles, it still demands effective long-term heat dissipation mechanisms.
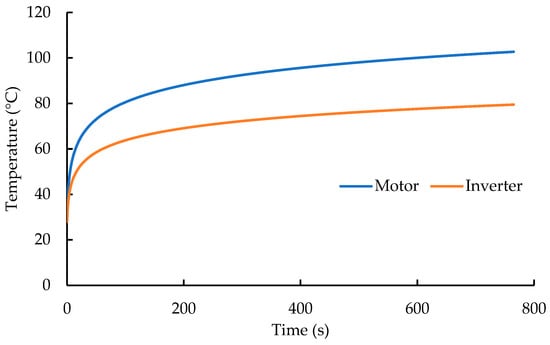
Figure 16.
Thermal behavior during steady-state highway driving.
3.2.3. WLTP Cycle
As presented in Figure 17, the WLTP cycle produced a motor temperature rise of 73.6 °C and an inverter rise of 51.6 °C, placing it between UDDS and HWFET in terms of thermal impact. As a mixed drive cycle that includes urban, suburban, and highway segments, WLTP presents alternating periods of dynamic and steady-state operation. Thermal peaks typically occurred during acceleration-heavy segments, while partial cooling was observed during steady cruising. This variation highlights the importance of adaptive thermal management strategies suited to mixed-condition driving.
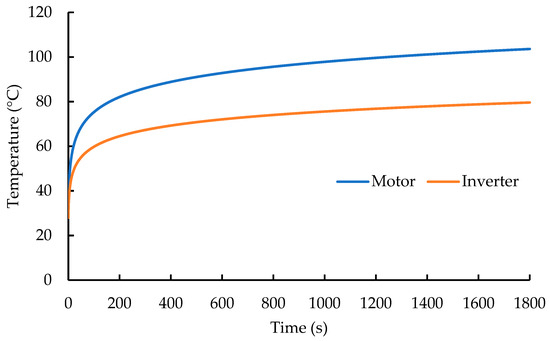
Figure 17.
Mixed-cycle temperature variation reflecting urban and highway segments.
3.2.4. NEDC
In the NEDC, the motor temperature increased by 75.1 °C, and the inverter temperature rose by 52.4 °C, as illustrated in Figure 18. Though generally less aggressive than WLTP, the NEDC includes both stop-and-go urban driving and extra-urban segments. As a result, the thermal impact closely resembles that of UDDS, especially due to repeated low-speed acceleration events. This underscores the importance of accounting for even moderate drive cycles when designing thermal protection and derating strategies.
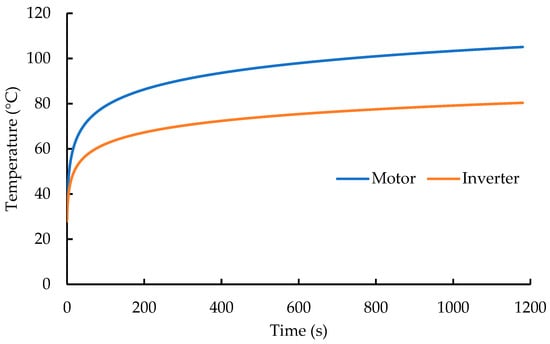
Figure 18.
Thermal behavior during urban and extra-urban driving.
3.3. Battery Power Profile
This section presents the instantaneous battery power profiles under four standard driving cycles: UDDS, HWFET, WLTP, and NEDC. The battery power reflects the net electrical energy drawn from or fed into the battery, accounting for vehicle traction demand and regenerative braking. In the revised model, regenerative braking is fully active and contributes to energy recovery during deceleration phases, as evidenced by the clearly visible negative power segments in the updated profiles. To enable consistent numerical integration and streamline data analysis, the battery power profile of each simulation was computed over a unified 1800 s timeline. For cycles with shorter durations, the input velocity trace ends at the designated time, and the vehicle dynamics and load conditions remain fixed in their final state without introducing new inputs. This modeling approach maintains a consistent solver structure and data length across simulations, enabling cycle-to-cycle comparisons without affecting the validity of the power flow results within the actual active cycle duration.
The plots exhibit sharp fluctuations in power, corresponding to transient accelerations, decelerations, and varying load conditions across the driving cycles. These dynamic responses illustrate the real-time energy flow patterns in the drivetrain and confirm that the simulation accurately captures motoring and regenerative phases, with no excessive filtering or signal smoothing applied. The realistic nature of these power curves strengthens the physical fidelity of the simulation and supports the reliability of downstream SOC and thermal analyses.
3.3.1. UDDS Cycle
The battery power profile for the UDDS cycle, shown in Figure 19, exhibits sharp and frequent fluctuations ranging from approximately −30 kW to 16.74 kW, consistent with the highly dynamic stop-and-go conditions of urban driving. These rapid transitions reflect successive acceleration and deceleration events, leading to significant variability in power demand. The presence of substantial negative power segments confirms that regenerative braking is active and contributes to energy recovery during deceleration phases. This bidirectional energy exchange enhances the cycle’s efficiency by partially offsetting consumption. The initial high positive peak corresponds to vehicle launch from rest, followed by irregular power changes driven by the imposed speed trace. Overall, the UDDS profile highlights the electrical and control challenges of urban environments, where frequent torque reversals and recovery events dominate the powertrain behavior.
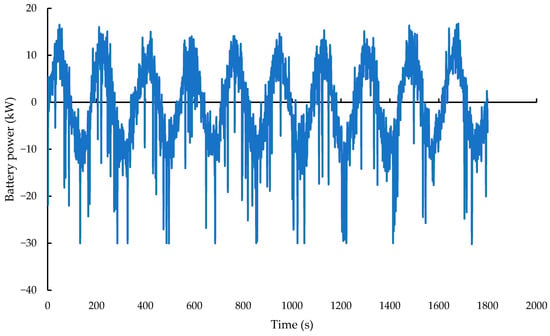
Figure 19.
Battery power profile with frequent peaks and early drop.
3.3.2. HWFET Cycle
The battery power profile for the HWFET cycle is shown in Figure 20. It features a smoother power demand compared to urban cycles but still includes frequent accelerations and decelerations. The power ranges from approximately −30 kW during regenerative braking to 19.3 kW during peak motoring phases, with an average around 6.8 kW. The periodic nature of speed variations is reflected in the battery power curve, which exhibits alternating positive and negative segments corresponding to propulsion and braking events, respectively. This confirms that regenerative braking is active and contributes to energy recovery during deceleration. The profile also highlights the lower average power demand of highway driving compared to urban cycles due to more consistent cruising speeds and fewer stops.
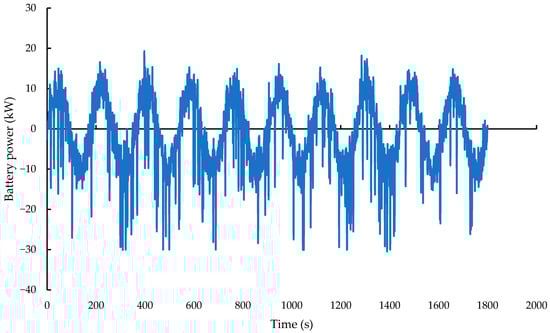
Figure 20.
Battery power profile during highway driving.
3.3.3. WLTP Cycle
The WLTP cycle, illustrated in Figure 21, exhibits frequent and irregular battery power fluctuations due to varying acceleration, deceleration, and coasting phases. The battery power ranges from approximately −30 kW during regenerative braking to 20.4 kW during peak acceleration. This range reflects the complex nature of WLTP and its intent to represent real-world driving. The negative power segments confirm the implementation of regenerative braking and its contribution to energy recovery. The waveform’s aggressive and oscillatory pattern highlights the need for responsive powertrain management under diverse and dynamic driving conditions.

Figure 21.
Battery power profile during mixed driving segments.
3.3.4. NEDC
The battery power profile for the NEDC, shown in Figure 22, exhibits a dynamic pattern influenced by alternating acceleration and deceleration phases. The power values range from approximately −30 kW to 17.65 kW, highlighting periods of regenerative braking alongside motoring demand. The profile is marked by frequent power fluctuations in response to the stop-and-go nature of urban driving mixed with moderate-speed cruising. Unlike previous results, the updated profile clearly demonstrates the presence of energy recovery during deceleration events, with well-defined negative power intervals. This improved representation enhances the physical accuracy of the simulation by capturing both motoring and regenerative phases, making it more consistent with real-world EV behavior during standardized cycles.
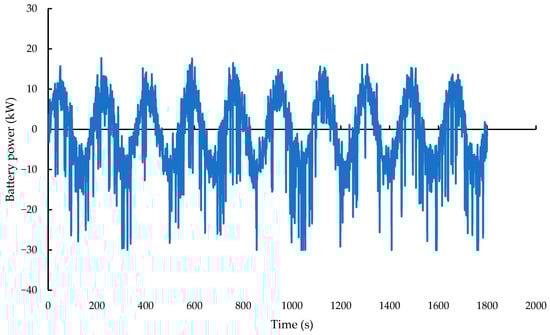
Figure 22.
Battery power profile during NEDC.
3.4. Validation of Results
Validation of the developed simulation framework was performed by comparing key output parameters with benchmark values reported in existing studies. The comparison focuses on peak and average battery power, state of charge (SOC) depletion, motor efficiency, and thermal behavior across different driving cycles. The results demonstrate strong consistency between the simulation outcomes and typical performance characteristics of electric vehicles under standardized driving conditions. A detailed comparison is presented in Table 3, highlighting the close agreement between the predicted and reference values and reinforcing the reliability and predictive capability of the proposed model.
Table 3.
Validation of the simulation results against existing literature benchmarks.
3.5. Performance Comparison Across Driving Cycles
To summarize the powertrain’s performance under different operational scenarios, Figure 23 presents a comparative overview of energy consumption, average power losses, and peak battery temperature across the four driving cycles. UDDS exhibited the highest energy demand and thermal stress, primarily due to frequent acceleration and deceleration phases. HWFET demonstrated the lowest energy consumption and thermal load, consistent with its steady highway cruising behavior. WLTP and NEDC showed intermediate results, with WLTP reflecting slightly higher losses and temperatures due to its inclusion of high-speed segments.
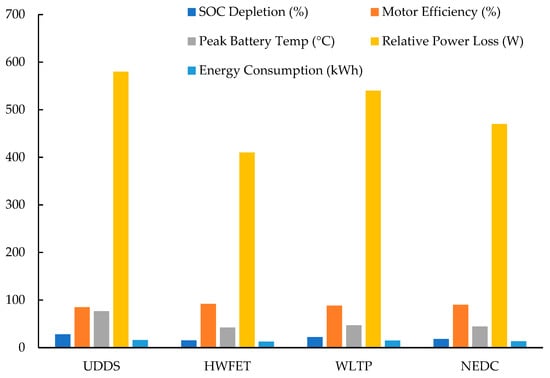
Figure 23.
Performance comparison across driving cycles.
This visual comparison highlights how driving patterns influence both electrical and thermal performance. Such comparisons are essential for guiding drive cycle-specific control strategies aimed at improving energy efficiency and managing thermal loads in electric vehicles.
3.6. Key Insights
The simulation results demonstrate a broad range of EV performance impacts arising from various commonly used standardized drive cycles on power flow dynamics, thermal behavior, energy efficiency and regenerative potential. It reveals the complexity of the vehicle energy management problem under different real-world driving scenarios and offers an important reference for powertrain design and control optimization.
3.6.1. Energy Demand and Efficiency Patterns
Among the four cycles studied, the UDDS cycle had the most energy-demanding profile, with maximum battery power ranging from −30 kW to 16.7 kW, because it is frequently a stop-and-go type of driving with repeated acceleration events. However, HWFET exhibited a smoother power profile ranging from −30 kW to 19.3 kW and better operational efficiency, as the motor was kept close to its optimal torque-speed region at virtually all times. Intermediate consumption levels were presented, with WLTP and NEDC levels having greater variability in the case of WLTP because it is a mixed-speed cycle. These observations were reinforced for the PMSM efficiency analysis. The average efficiency achieved by the HWFET cycle is the highest and the cycle consistently operates in the peak-efficiency envelope of the motor. The transient-heavy dynamics of UDDS, WLTP, and NEDC induced broader dispersion in efficiency values, often positioning the motor outside its optimal range. This highlighted the need for dynamic optimization strategies under WLTP in order to deal with frequent transitions.
3.6.2. Thermal Behavior and Powertrain Stress
Thermal analysis revealed greater heat buildup in the motor and inverter during cycles with higher acceleration frequency, such as UDDS and WLTP. The motor temperature increased by 76.5 °C and the inverter temperature increased by 52 °C, suggesting severe thermal stresses for UDDS. Similar trends were followed by WLTP. By contrast, HWFET operated in a steady state (72.7 °C motor, 51.5 °C inverter), illustrating that continuous operation at mid-torque minimizes thermal cycling and enhances system durability. A moderate thermal rise was observed during the NEDC, which can be attributed to its relatively low dynamic load profile.
3.6.3. State of Charge
The analysis of battery SOC confirmed that drive cycles with frequent braking events provide more opportunities for regenerative energy recovery. The SOC trends mimic energy depletion patterns that match the demands of the drive cycle. Repeated acceleration phases resulted in the highest SOC drop in UDDS (27%) and WLTP (34%), followed by a lower SOC decline observed at HWFET (15%) and NEDC (24%). Although the battery power profiles exhibit both motoring and regenerative phases, the state of charge (SOC) shows a net decreasing trend across all cycles. This is due to the cumulative impact of system losses, including inverter switching losses, motor copper and iron losses, mechanical transmission losses, and internal battery resistance. Additionally, regenerative braking is inherently limited by factors such as low-speed cutoffs and control thresholds, and not all deceleration energy is recoverable. The energy returned to the battery is further reduced by charging inefficiencies. As a result, despite visible negative power intervals, the recovered energy does not offset the total consumption, and the SOC decreases continuously, consistent with practical EV behavior under standard driving cycles.
3.6.4. Comparative Performance Insights
UDDS stands out for its high variability, strong energy consumption, and thermal burden, making it a worst-case benchmark for urban driving design and a critical target for regenerative optimization. HWFET demonstrates ideal thermal and efficiency behavior under continuous operation, providing a model scenario for long-range, high-efficiency highway travel. WLTP captures the real-world spectrum of driving conditions. It stresses both thermal and efficiency management systems, making it a crucial benchmark for validating adaptive control strategies. NEDC, while less aggressive, still presents moderate challenges in maintaining efficiency and managing heat under mixed but less dynamic transitions.
3.6.5. Strategic Implications
Addressing user concerns such as performance consistency and range reliability is also crucial, as these factors influence post-purchase satisfaction and long-term adoption [46]. Hence, the study emphasizes the necessity of drive cycle-aware energy management systems. Optimizing PMSM performance requires tailoring control strategies that keep motor operation within high-efficiency zones while mitigating the impact of frequent torque–speed transitions. Similarly, battery management systems should anticipate SOC depletion trends and leverage regenerative phases to extend range. Thermal management strategies should adapt to the thermal load profiles presented by different cycles, prioritizing active cooling in urban conditions and thermal stabilization under highway loads.
3.6.6. Thermal Propagation of Powertrain Losses
A closer examination of powertrain losses reveals that electrical losses originating in the battery and inverter propagate thermally to adjacent components. The inverter, in particular, serves as a critical thermal node due to its central role in current switching and bidirectional power flow during acceleration and regenerative events. These losses elevate its temperature, which is further transferred to the motor casing and surrounding thermal mass. During high-load periods (e.g., urban acceleration), inverter losses dominate, whereas under steady-state highway cruising, the motor’s copper and iron losses become the primary thermal contributors. The thermal model captures this propagation behavior using lumped-parameter resistances and capacitances, allowing quantification of temperature rise based on energy conversion inefficiencies and duty cycles. This thermal interaction underscores the importance of accurately modeling subsystem coupling when evaluating efficiency and thermal performance.
4. Conclusions
This study developed a comprehensive Simulink-based framework for analyzing electric vehicle (EV) power flow, thermal behavior, and energy efficiency across standardized driving cycles: UDDS, HWFET, WLTP, and NEDC. The integrated model incorporated the battery system, inverter, PMSM, drivetrain, and control strategy to evaluate performance under dynamic operating conditions. The key findings include the following:
- UDDS imposed the highest thermal loads, with motor temperature rising by 76.5 °C and inverter temperature by 52.0 °C; these changes were driven by frequent acceleration and braking events.
- HWFET exhibited the most stable performance, with PMSM efficiency reaching 92% and the lowest SOC depletion (15%), owing to its steady-speed driving profile.
- WLTP showed wide power fluctuations ranging from −30 kW to 19.3 kW, and a motor thermal rise of 73.6 °C, reflecting the impact of highly dynamic load conditions.
- NEDC resulted in a thermal increase of 75.1 °C, indicating moderate thermal stress under less aggressive, but still mixed, driving phases.
These results underscore the need for cycle-specific optimization of control and thermal management strategies. By coupling power flow analysis, thermal evaluation, and control modeling, the proposed framework offers a practical tool for EV performance enhancement. Future work will focus on the following factors:
- Integrating adaptive cooling strategies, including phase change materials (PCMs) and hybrid liquid–air systems, to mitigate thermal stress during regenerative braking [47].
- Incorporating thermal interface materials (TIMs) to enhance heat transfer from critical power electronics components [48,49,50].
- Developing AI-based predictive control algorithms to proactively manage energy and thermal loads in real time [51,52].
- Conducting sensitivity analyses of parameters such as battery capacity, inverter efficiency, and rolling resistance to guide system-level optimization.
- Performing experimental validation through hardware-in-the-loop (HIL) testing and integration with physical components to ensure real-world applicability.
Author Contributions
Conceptualization, J.M. and M.I.; methodology, J.M.; software, M.I. and A.O.; validation, M.I. and A.O.; formal analysis, J.M.; investigation, J.M.; resources, M.I. and A.O.; data curation, M.I.; writing—original draft preparation, J.M.; writing—review and editing, M.I.; visualization, A.O.; supervision, J.M.; project administration, J.M. All authors have read and agreed to the published version of the manuscript.
Funding
This research received no external funding.
Data Availability Statement
The original contributions presented in this study are included in the article; further inquiries can be directed to the corresponding author.
Acknowledgments
The authors acknowledge Palestine Technical University—Kadoorie (PTUK) for providing access to the computing resources and software necessary for this work. Appreciation is also extended to An-Najah National University, Amman Arab University, and Abdullah Al Salem University for their academic collaboration and support during the course of the research.
Conflicts of Interest
The authors declare no conflicts of interest.
Abbreviations
The following abbreviations are used in this manuscript:
| EV | Electric vehicle. |
| UDDS | Urban Dynamometer Driving Schedule. |
| HWFET | Highway Fuel Economy Test. |
| NEDC | New European Driving Cycle. |
| WLTP | Worldwide Harmonized Light Vehicle Test Procedure. |
| SOC | State of charge. |
| PMSM | Permanent magnet synchronous motor. |
| SiC | Silicon carbide. |
| BMS | Battery management system. |
| AI | Artificial intelligence. |
| PI | Proportional–integral. |
| FOC | Field-oriented control. |
| AC | Alternating current. |
| DC | Direct current. |
| FBD | Free-body diagram. |
| PCM | Phase change material. |
| TIM | Thermal interface material. |
| VSI | Voltage source inverter. |
| PWM | Pulse-width modulation. |
| EMF | Electromotive force. |
| RMS | Root mean square. |
| PTUK | Palestine Technical University—Kadoorie. |
| AAU | Amman Arab University. |
References
- Amer, M.; Masri, J.; Dababat, A.; Sajjad, U.; Hamid, K. Electric vehicles: Battery technologies, charging standards, AI communications, challenges, and future directions. Energy Convers. Manag. X 2024, 24, 100751. [Google Scholar] [CrossRef]
- Ekici, Y.E.; Akdağ, O.; Aydin, A.A.; Karadağ, T. A novel energy consumption prediction model of electric buses using real-time big data from route, environment, and vehicle parameters. IEEE Access 2023, 11, 104305–104322. [Google Scholar] [CrossRef]
- Martyushev, N.V.; Malozyomov, B.V.; Khalikov, I.H.; Kukartsev, V.A.; Kukartsev, V.V.; Tynchenko, V.S.; Tynchenko, Y.A.; Qi, M. Review of methods for improving the energy efficiency of electrified ground transport by optimizing battery consumption. Energies 2023, 16, 729. [Google Scholar] [CrossRef]
- Miri, I.; Fotouhi, A.; Ewin, N. Electric vehicle energy consumption modelling and estimation—A case study. Int. J. Energy Res. 2020, 45, 501–520. [Google Scholar] [CrossRef]
- Yang, C.; Sun, T.; Wang, W.; Li, Y.; Zhang, Y.; Zha, M. Regenerative braking system development and perspectives for electric vehicles: An overview. Renew. Sustain. Energy Rev. 2024, 198, 114389. [Google Scholar] [CrossRef]
- Asim, M.; Baig, T.; Siddiqui, F.R.; Khan, S.; Khan, S.A.; Babar, H.; Said, Z.; Zhao, J.; Abidi, I.H. Advancements in thermal management solutions for electric vehicle high-power electronics: Innovations, cooling methods, and future perspectives. J. Energy Storage 2025, 111, 115344. [Google Scholar] [CrossRef]
- Brady, J.; O’Mahony, M. Development of a driving cycle to evaluate the energy economy of electric vehicles in urban areas. Appl. Energy 2016, 177, 165–178. [Google Scholar] [CrossRef]
- Settey, T.; Gnap, J.; Synák, F.; Skrúcaný, T.; Dočkalik, M. Research into the impacts of driving cycles and load weight on the operation of a light commercial electric vehicle. Sustainability 2021, 13, 13872. [Google Scholar] [CrossRef]
- Shi, B.; Ramones, A.I.; Liu, Y.; Wang, H.; Li, Y.; Pischinger, S.; Andert, J. A Review of Silicon Carbide MOSFETs in Electrified Vehicles: Application, Challenges, and Future Development. IET Power Electron. 2023, 16, 2103–2120. [Google Scholar] [CrossRef]
- Heidari, H.; Rassõlkin, A.; Kallaste, A.; Vaimann, T.; Andriushchenko, E.; Belahcen, A.; Lukichev, D.V. A review of synchronous reluctance motor-drive advancements. Sustainability 2021, 13, 729. [Google Scholar] [CrossRef]
- Mei, J.; Zuo, Y.; Lee, C.H.T.; Kirtley, J.L. Modeling and optimizing method for axial flux induction motor of electric vehicles. IEEE Trans. Veh. Technol. 2020, 69, 12822–12831. [Google Scholar] [CrossRef]
- Roy, H.; Roy, B.N.; Hasanuzzaman, M.; Islam, M.S.; Abdel-Khalik, A.S.; Hamad, M.S.; Ahmed, S. Global advancements and current challenges of electric vehicle batteries and their prospects: A comprehensive review. Sustainability 2022, 14, 16684. [Google Scholar] [CrossRef]
- Fanoro, M.; Božanić, M.; Sinha, S. A review of the impact of battery degradation on energy management systems with a special emphasis on electric vehicles. Energies 2022, 15, 5889. [Google Scholar] [CrossRef]
- Mersha, T.K.; Du, C. Co-simulation and modeling of PMSM based on Ansys software and Simulink for EVs. World Electr. Veh. J. 2022, 13, 4. [Google Scholar] [CrossRef]
- Jaramillo, M.; Pavón, W.; Jaramillo, L. Adaptive forecasting in energy consumption: A bibliometric analysis and review. Data 2024, 9, 13. [Google Scholar] [CrossRef]
- Zhao, Z.; Li, L.; Ou, Y.; Wang, Y.; Wang, S.; Yu, J.; Feng, R. A comparative study on the energy flow of electric vehicle batteries among different environmental temperatures. Energies 2023, 16, 5253. [Google Scholar] [CrossRef]
- Sayed, K.; Kassem, A.; Saleeb, H.; Alghamdi, A.S.; Abo-Khalil, A.G. Energy-saving of battery electric vehicle powertrain and efficiency improvement during different standard driving cycles. Sustainability 2020, 12, 10466. [Google Scholar] [CrossRef]
- Teh, C.H. Quantifying the environmental and economic impact of motor vehicle braking: A method for computing energy, fuel, monetary, and carbon dioxide emissions costs. J. Eng. Sci. Technol. 2024, 19, 1065–1073. [Google Scholar]
- Kiyakli, A.O.; Solmaz, H. Modeling of an electric vehicle with MATLAB/Simulink. Int. J. Automot. Sci. Technol. 2018, 2, 9–15. [Google Scholar] [CrossRef]
- Wang, Y.; Xiang, H.; Soo, Y.-Y.; Fan, X. Aging mechanisms, prognostics and management for lithium-ion batteries: Recent advances. Renew. Sustain. Energy Rev. 2025, 207, 114915. [Google Scholar] [CrossRef]
- He, Z.; Guo, W.; Zhang, P. Performance prediction, optimal design and operational control of thermal energy storage using artificial intelligence methods. Renew. Sustain. Energy Rev. 2022, 156, 111977. [Google Scholar] [CrossRef]
- Saiteja, P.; Ashok, B.; Upadhyay, D. Evaluation of Electric Vehicle Performance Characteristics for Adaptive Supervisory Self-Learning-Based SR Motor Energy Management Controller under Real-Time Driving Conditions. Vehicles 2024, 6, 509–538. [Google Scholar] [CrossRef]
- Schaltz, E.; Soylu, S. Electrical Vehicle Design and Modeling; INTECH: Rijeka, Croatia, 2011; Chapter 1; pp. 1–24. [Google Scholar] [CrossRef]
- Assi, M.; Amer, M. A comparative analysis of lithium-ion batteries using a proposed electrothermal model based on numerical simulation. World Electr. Veh. J. 2025, 16, 60. [Google Scholar] [CrossRef]
- Adegbohun, F.; von Jouanne, A.; Phillips, B.; Agamloh, E.; Yokochi, A. High performance electric vehicle powertrain modeling, simulation, and validation. Energies 2021, 14, 1493. [Google Scholar] [CrossRef]
- Qin, Y.; Zhao, Z.; Wang, Z.; Li, G. Study of Longitudinal–Vertical Dynamics for In-Wheel Motor-Driven Electric Vehicles. Automot. Innov. 2021, 4, 227–237. [Google Scholar] [CrossRef]
- Jiang, S.; Li, W.; Wang, Y.; Yang, X.; Xu, S. Study on Electromechanical Coupling Torsional Resonance Characteristics of Gear System Driven by PMSM: A Case on Shearer Semi-Direct Drive Cutting Transmission System. Nonlinear Dyn. 2021, 104, 1205–1225. [Google Scholar] [CrossRef]
- Nowakowski, M.; Siminski, P.; Kosiuczenko, K. Analysis of the Relationship Between the Motion Resistive Force and the Road Surface for Special Purpose Off-Road Vehicle. Acta Mech. Slovaca 2024, 28, 62–66. [Google Scholar] [CrossRef]
- Salahuddin, H.; Imdad, K.; Chaudhry, M.U.; Iqbal, M.M.; Bolshev, V.; Hussain, A.; Flah, A.; Panchenko, V.; Jasiński, M. Electric vehicle transient speed control based on vector control FM-PI speed controller for induction motor. Appl. Sci. 2022, 12, 8694. [Google Scholar] [CrossRef]
- Talaoubrid, A.; Ait Gougam, Y.; Dermouche, R.; Zioui, N. Experimental Comparison of the Performance of PI and IP Controllers for a Field-Oriented Controlled Permanent Magnet Synchronous Motor Drive. Int. J. Dyn. Control 2024, 12, 2918–2928. [Google Scholar] [CrossRef]
- Elgbaily, M.; Anayi, F.; Alshbib, M.M. A combined control scheme of direct torque control and field-oriented control algorithms for three-phase induction motor: Experimental validation. Mathematics 2022, 10, 3842. [Google Scholar] [CrossRef]
- Konuhova, M. Induction Motor Dynamics Regimes: A Comprehensive Study of Mathematical Models and Validation. Appl. Sci. 2025, 15, 1527. [Google Scholar] [CrossRef]
- Su, B.; Sun, X.; Chen, L.; Yang, Z.; Li, K. Thermal Modeling and Analysis of Bearingless Permanent Magnet Synchronous Motors. Int. J. Appl. Electromagn. Mech. 2018, 56, 115–130. [Google Scholar] [CrossRef]
- Wu, G.; Xie, Y.; Liu, B.; Meng, Y.; Jiang, P.; Zhang, X.; Tan, J.; Zhao, J. Component Temperature Analysis in Power Modules: Coupling with Power Loss Evaluation and Thermal Network Models Considering Thermal Diffusion Effects. Int. Commun. Heat Mass Transf. 2025, 160, 108355. [Google Scholar] [CrossRef]
- Pavlović, T.; Župan, I.; Šunde, V.; Ban, Ž. HIL simulation of a tram regenerative braking system. Electronics 2021, 10, 1379. [Google Scholar] [CrossRef]
- Gray, T.; Wishart, J.; Shirk, M. 2011 Nissan Leaf VIN 0356 Electric Vehicle Battery Test Results; Technical Report INL/EXT-13-28025; Idaho National Laboratory: Idaho Falls, ID, USA, 2016. Available online: https://avt.inl.gov/sites/default/files/pdf/fsev/batteryrpt2011NissanLeaf0356.pdf (accessed on 1 May 2025).
- Aarniovuori, L.; Pyrhönen, J.; Liu, D.; Kauranen, P.; Korhonen, J.; Tikka, V. Energy Efficiency Analysis of Electric Vehicle System Components. In Proceedings of the 2023 IEEE Transportation Electrification Conference and Expo, Asia-Pacific (ITEC Asia-Pacific), Chiang Mai, Thailand, 28 November 2023; pp. 1–6. [Google Scholar] [CrossRef]
- Ben Hadj, N.; Abdelmoula, R.; Chaieb, M.; Neji, R. Permanent magnet motor efficiency map calculation and small electric vehicle consumption optimization. J. Electr. Syst. 2018, 14, 127–147. [Google Scholar]
- Garud, K.S.; Lee, M.Y. Thermal management characteristics of electric vehicle driving motor with oil spray cooling based on spray locations and oil types. Appl. Therm. Eng. 2024, 248, 123234. [Google Scholar] [CrossRef]
- U.S. Department of Energy. 2011 Nissan Leaf Vehicle Datasheet. Advanced Vehicle Testing Activity (AVTA), Energy Efficiency and Renewable Energy, U.S. DOE. February 2014. Available online: https://www.energy.gov/sites/prod/files/2014/02/f8/2011_nissan_leaf_fs.pdf (accessed on 2 May 2025).
- Schroen, E.; Mitsingas, C. Permanent magnet synchronous motor (PMSM) performance characterization in a hybrid-electric propulsion system. SAE Tech. Pap. 2024, 1, 4124. [Google Scholar] [CrossRef]
- Tao, X.; Zhou, K.; Wagner, J.R.; Hofmann, H. An electric motor thermal management system for hybrid vehicles: Modelling and control. Int. J. Veh. Perform. 2016, 2, 207–227. [Google Scholar] [CrossRef]
- Jose, A.; Shrivastava, S. Evolution of electrical vehicles, battery state estimation, and future research directions: A critical review. IEEE Access 2024, 12, 40884–40898. [Google Scholar] [CrossRef]
- Liu, X.; Zhao, F.; Hao, H.; Chen, K.; Liu, Z.; Babiker, H.; Amer, A.A. From NEDC to WLTP: Effect on the energy consumption, NEV credits, and subsidies policies of PHEV in the Chinese market. Sustainability 2020, 12, 5747. [Google Scholar] [CrossRef]
- Ali, S.M.N.; Hossain, M.J.; Sharma, V.; Kashif, M. Thermal control compensation of induction motor drive in electrified powertrain. In Proceedings of the 2020 IEEE Conference on Technologies for Sustainability (SusTech), Santa Ana, CA, USA, 23–25 April 2020; pp. 1–6. [Google Scholar] [CrossRef]
- Khraim, H. An exploratory study on factors associated with consumers’ post-purchase dissonance of electric vehicles. Innov. Mark. 2020, 16, 13–23. [Google Scholar] [CrossRef]
- Ali, Z.M.; Jurado, F.; Gandoman, F.H.; Ćalasan, M. Advancements in battery thermal management for electric vehicles: Types, technologies, and control strategies including deep learning methods. Ain Shams Eng. J. 2024, 15, 102908. [Google Scholar] [CrossRef]
- Wang, X.; Lu, C.; Rao, W. Liquid metal-based thermal interface materials with a high thermal conductivity for electronic cooling and bioheat-transfer applications. Appl. Therm. Eng. 2021, 192, 116937. [Google Scholar] [CrossRef]
- Hamza, A.; Mahmood, M.; Ulasyar, A.; Kazmi, S.N.A.; Iqbal, S.; Ghadi, Y.Y.; Almuflih, A.S.; Elbarbary, Z.M.S. Synthesis and analysis of a novel thermal interface material for DC-DC boost converter. Sci. Rep. 2024, 14, 22503. [Google Scholar] [CrossRef] [PubMed]
- Abdelhafez, E.; Abd-Alhamid, F.; Hamdan, M.; Alsaqoor, S.; Borowski, G.; Musa, A.; Ajib, S. Performance optimization of photovoltaic panels using hybrid nanofluid cooling with titanium oxide and aluminium oxide. Ecol. Eng. Environ. Technol. 2025, 6, 108–115. [Google Scholar] [CrossRef]
- Arévalo, P.; Ochoa-Correa, D.; Villa-Ávila, E. A systematic review on the integration of artificial intelligence into energy management systems for electric vehicles: Recent advances and future perspectives. World Electr. Veh. J. 2024, 15, 364. [Google Scholar] [CrossRef]
- Khasawneh, A.M.; Singh, P.; Aggarwal, G.; Rathore, R.S.; Kaiwartya, O. E-Mobility Advisor for Connected and Autonomous Vehicles Environments. Ad-Hoc Sens. Wirel. Netw. 2022, 53, 213–244. [Google Scholar] [CrossRef]

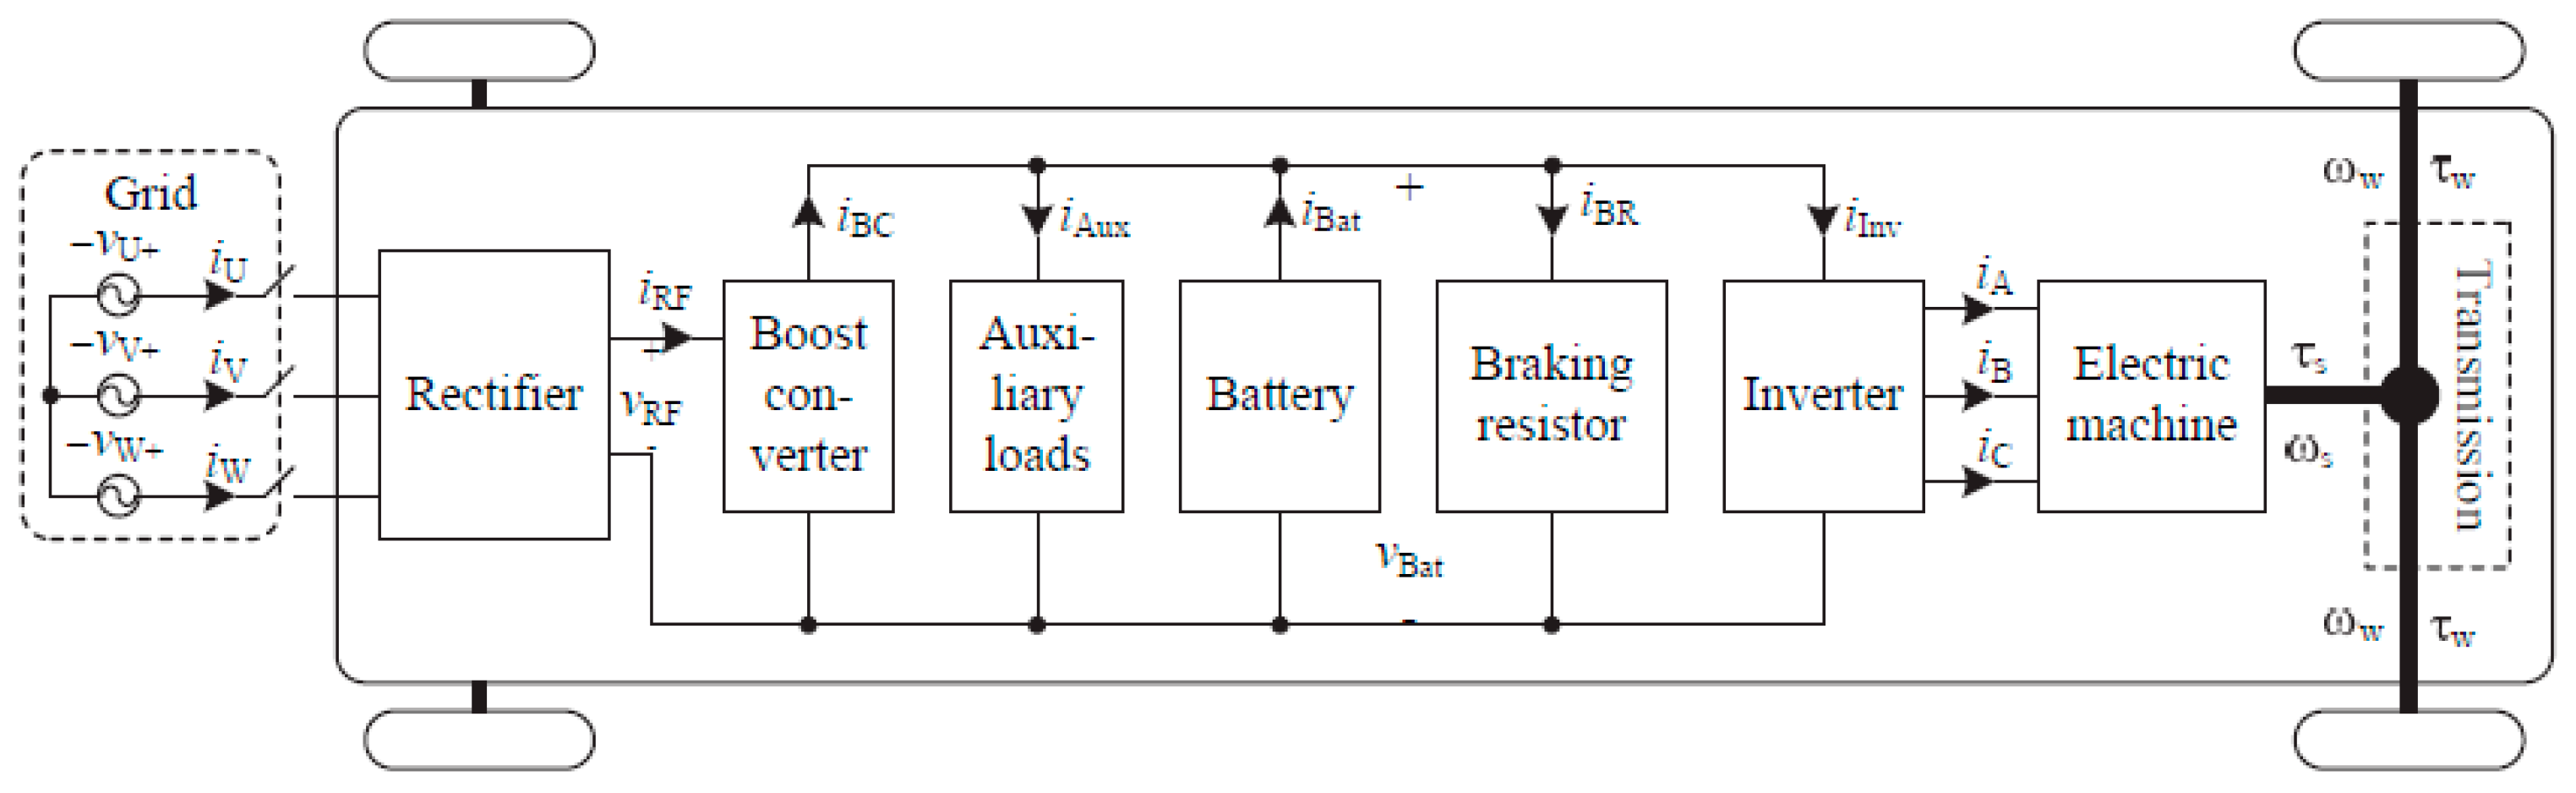
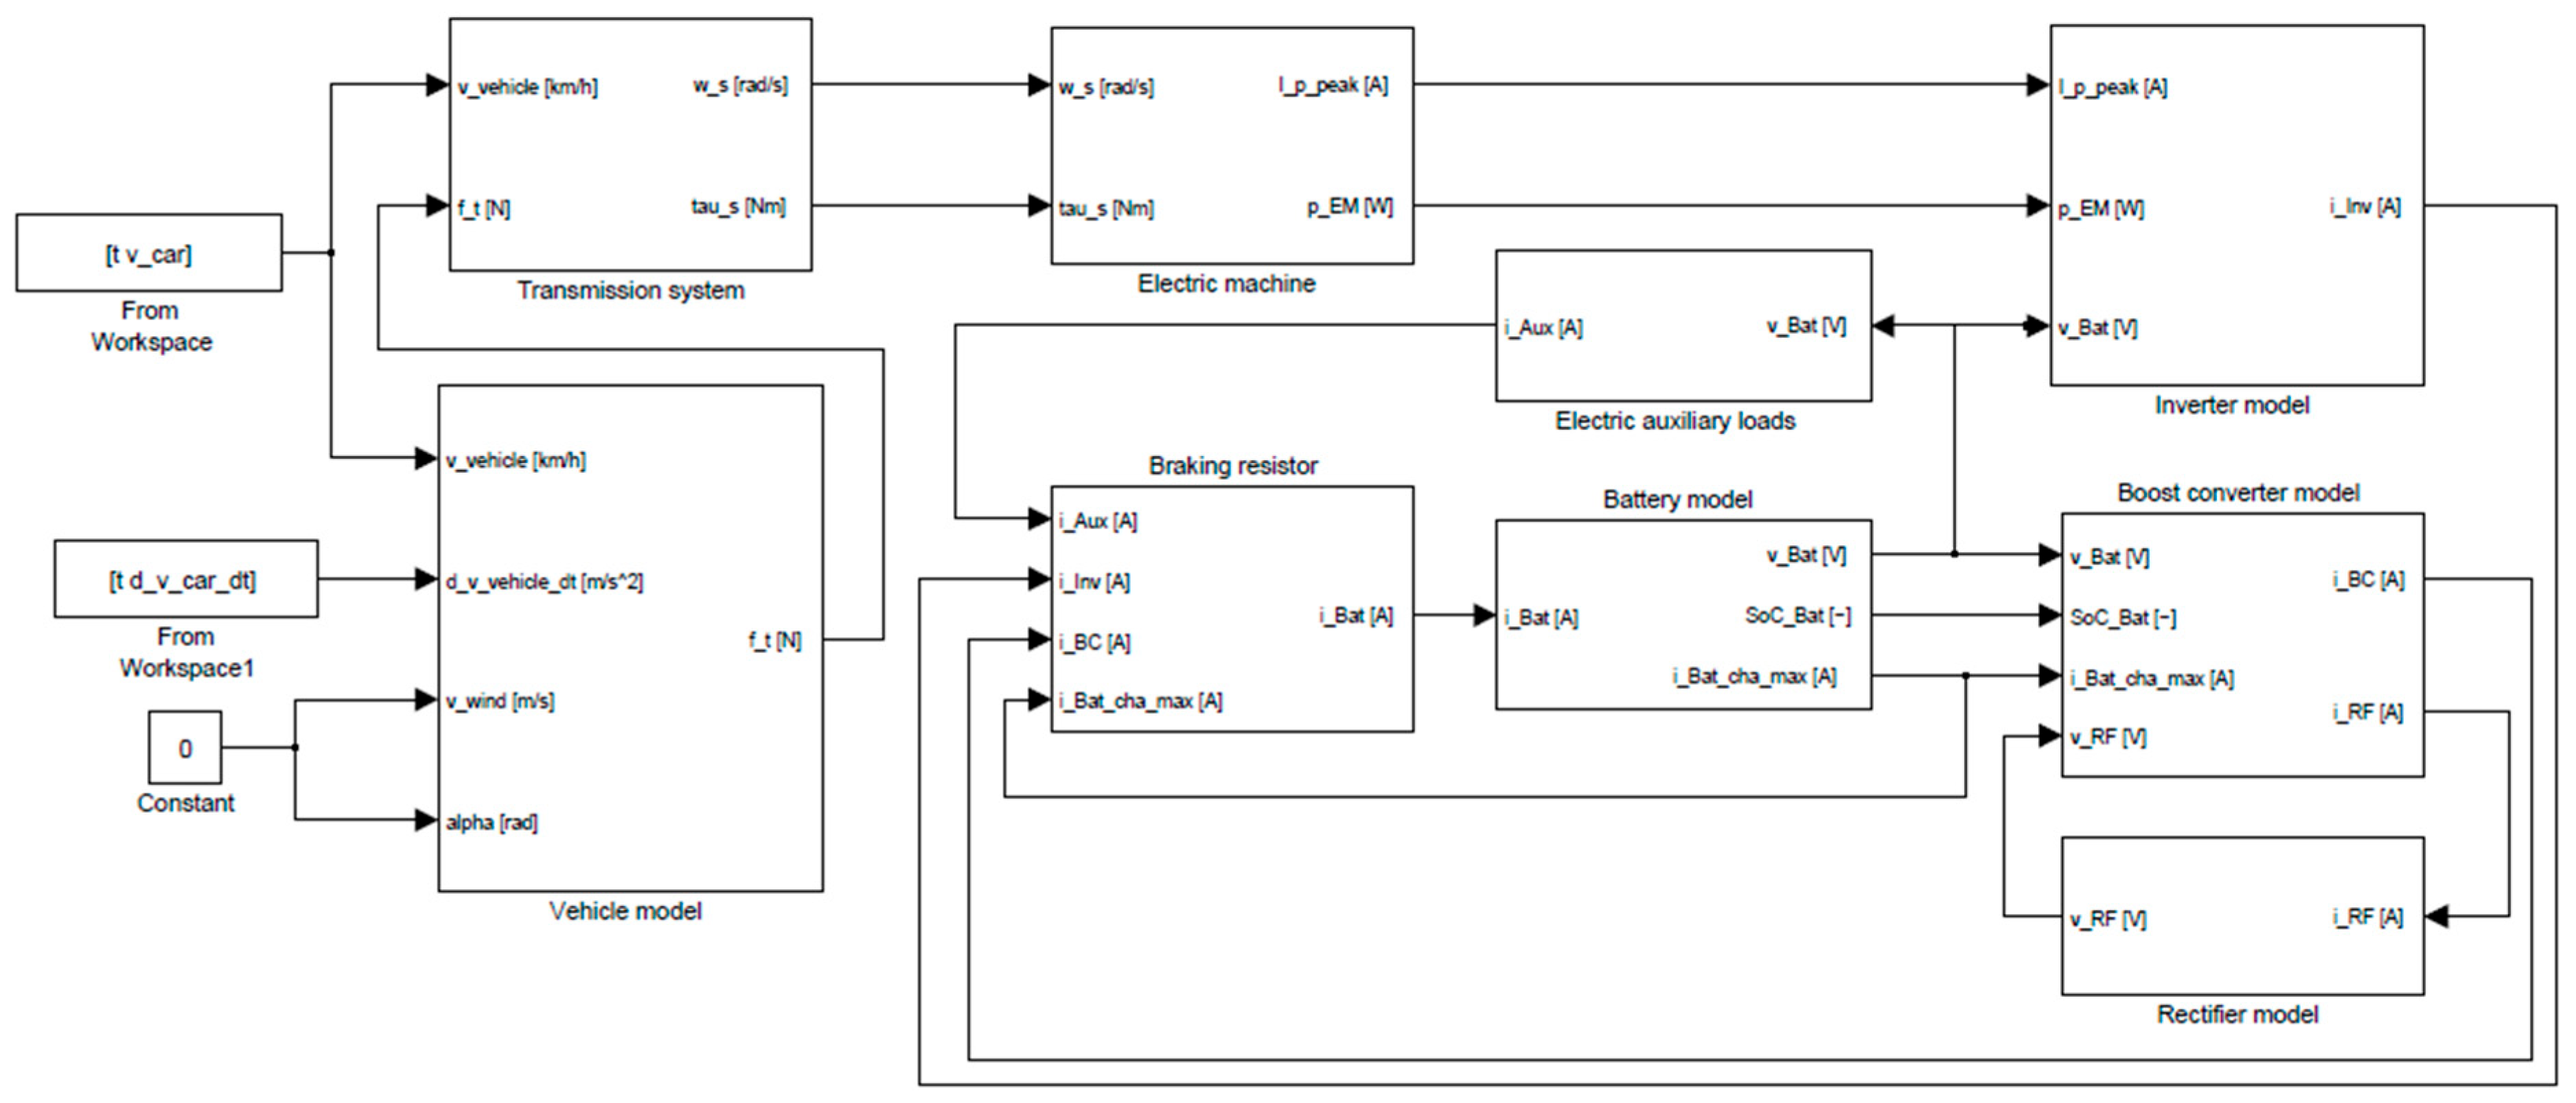
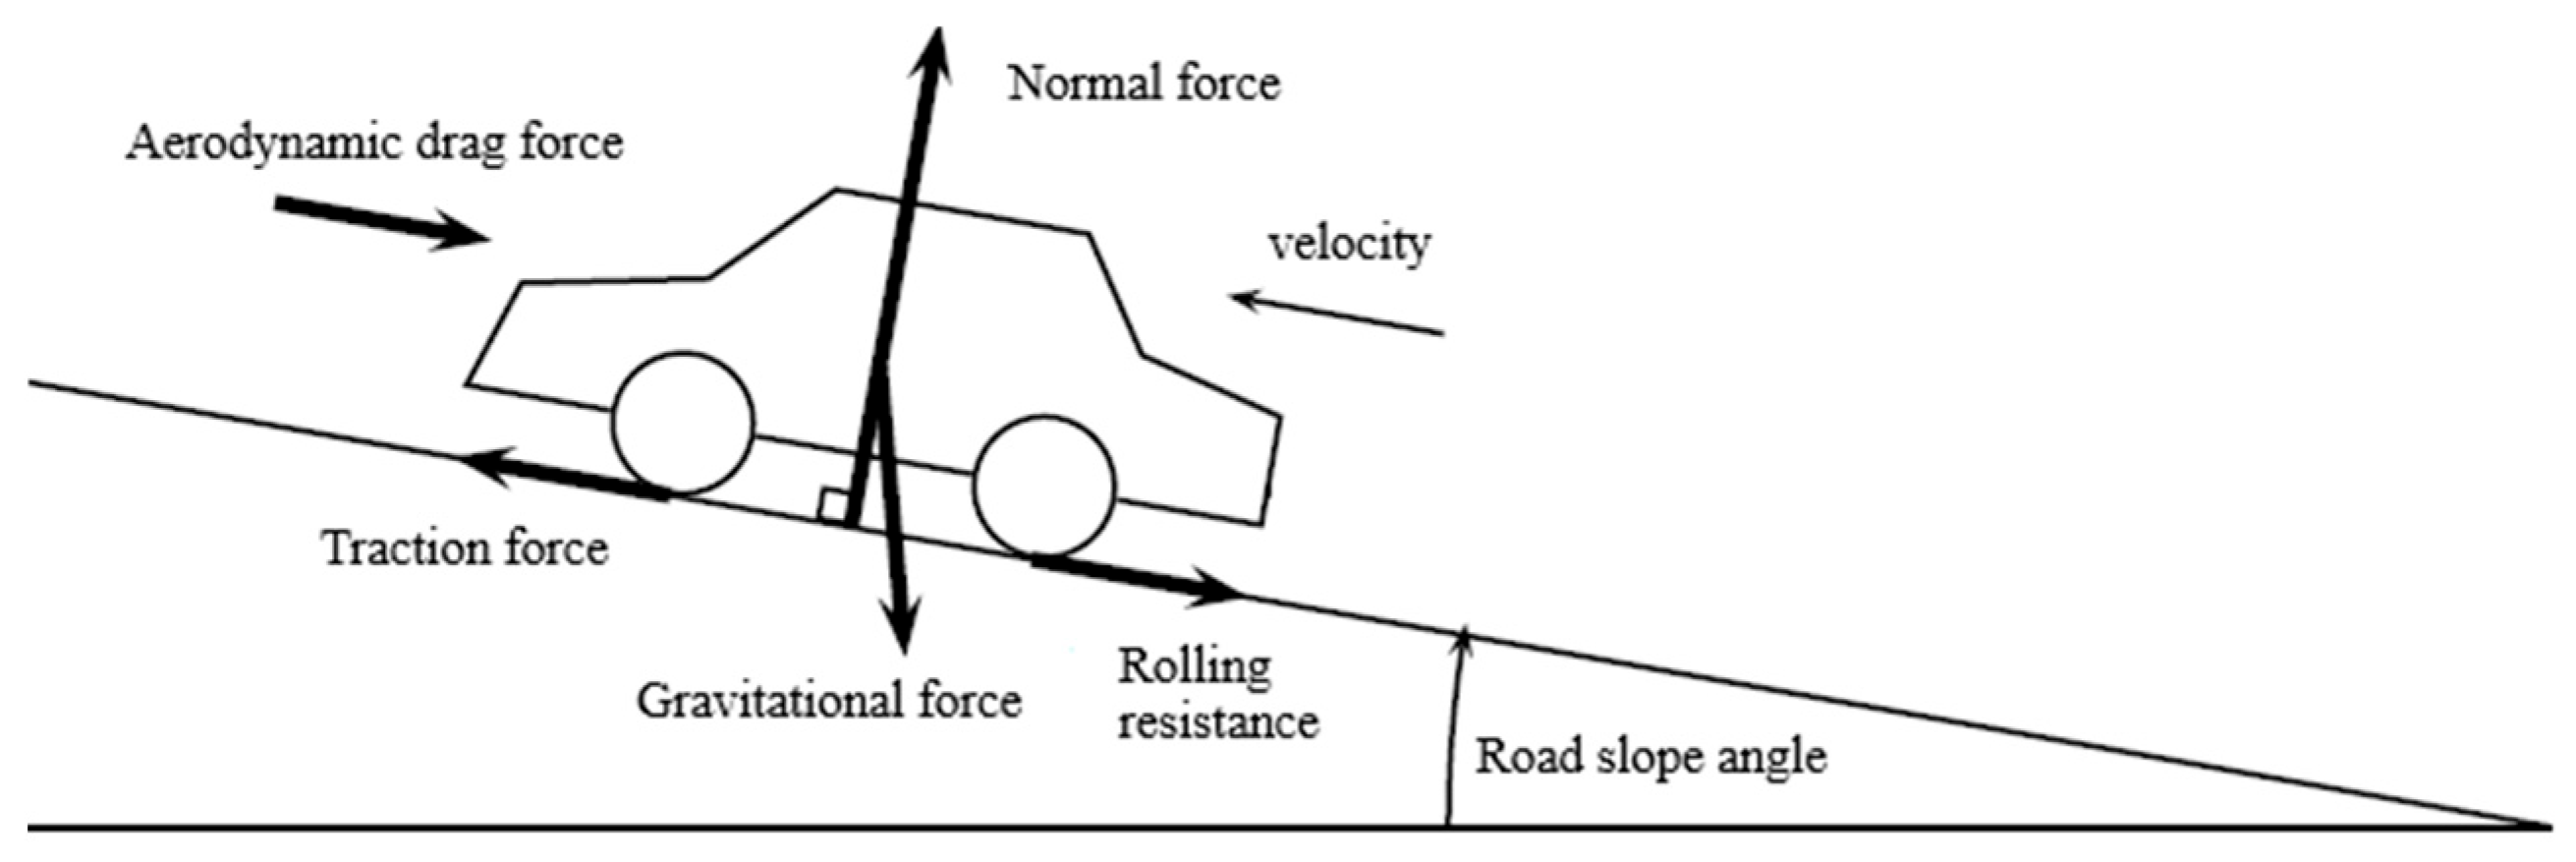
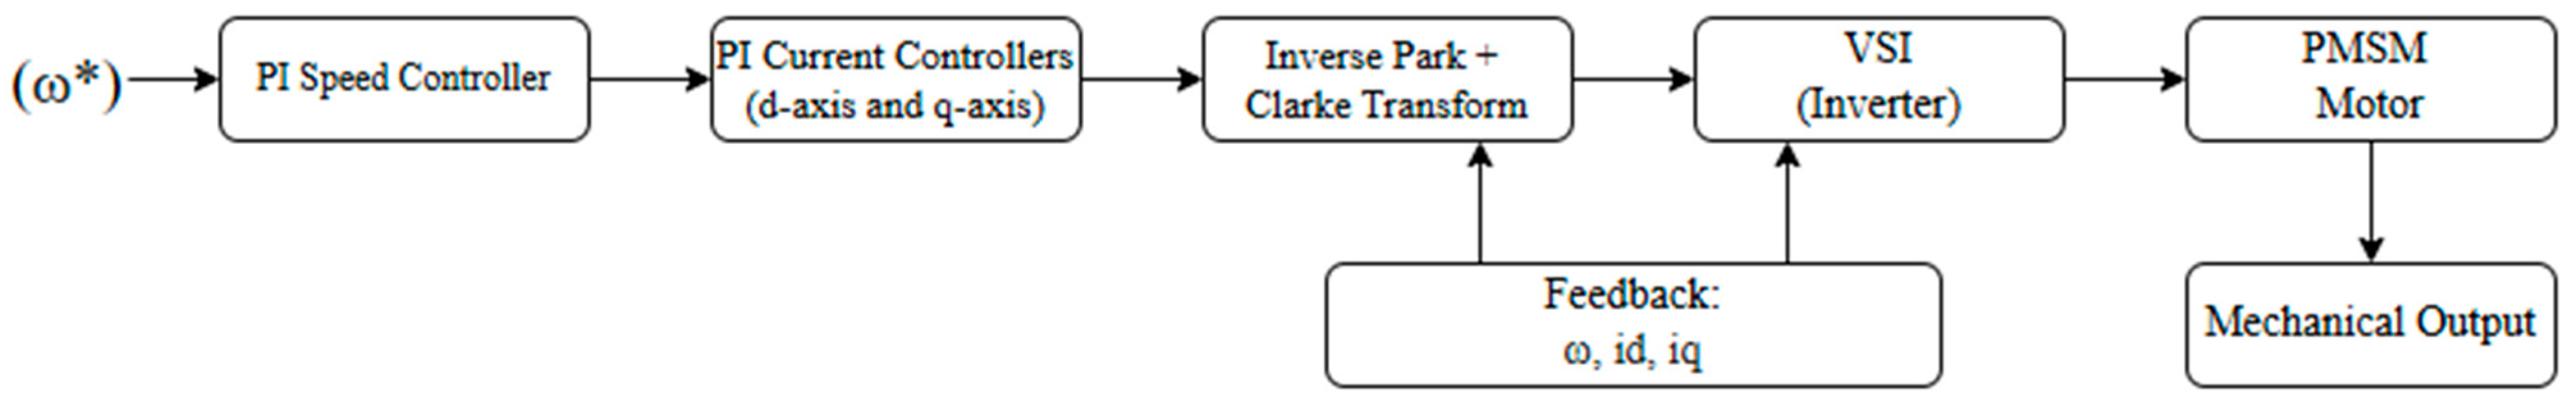
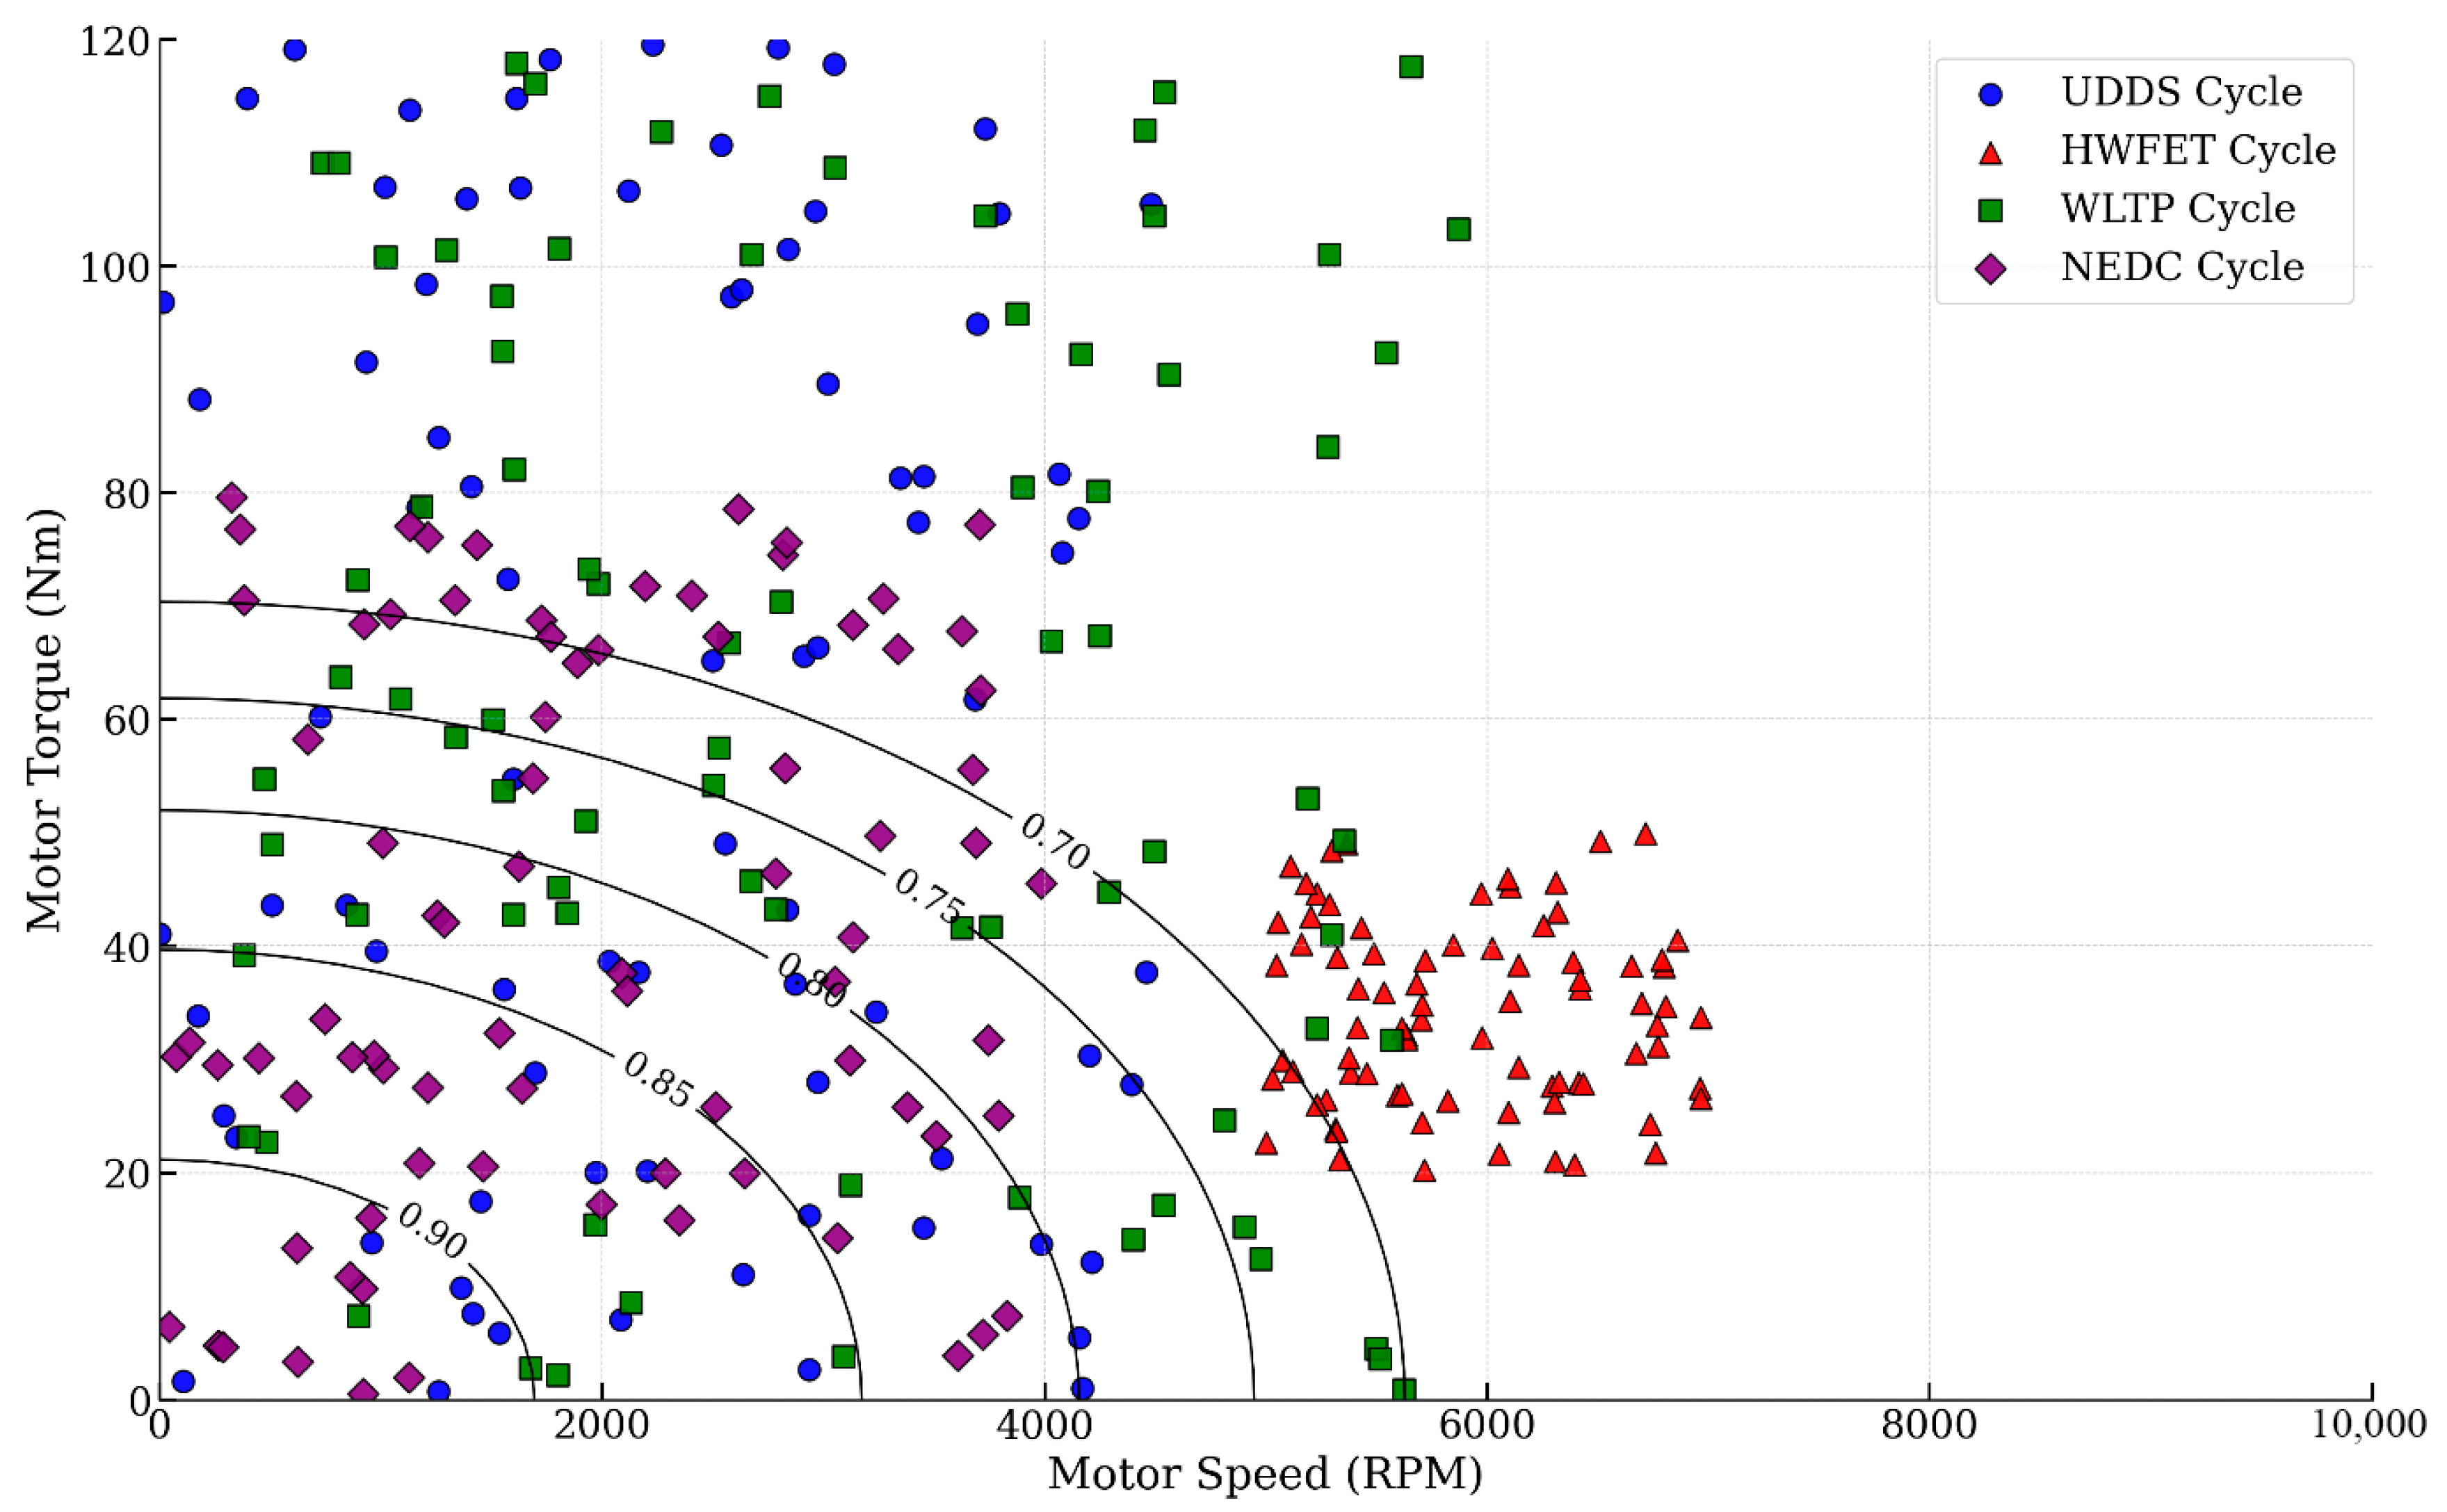
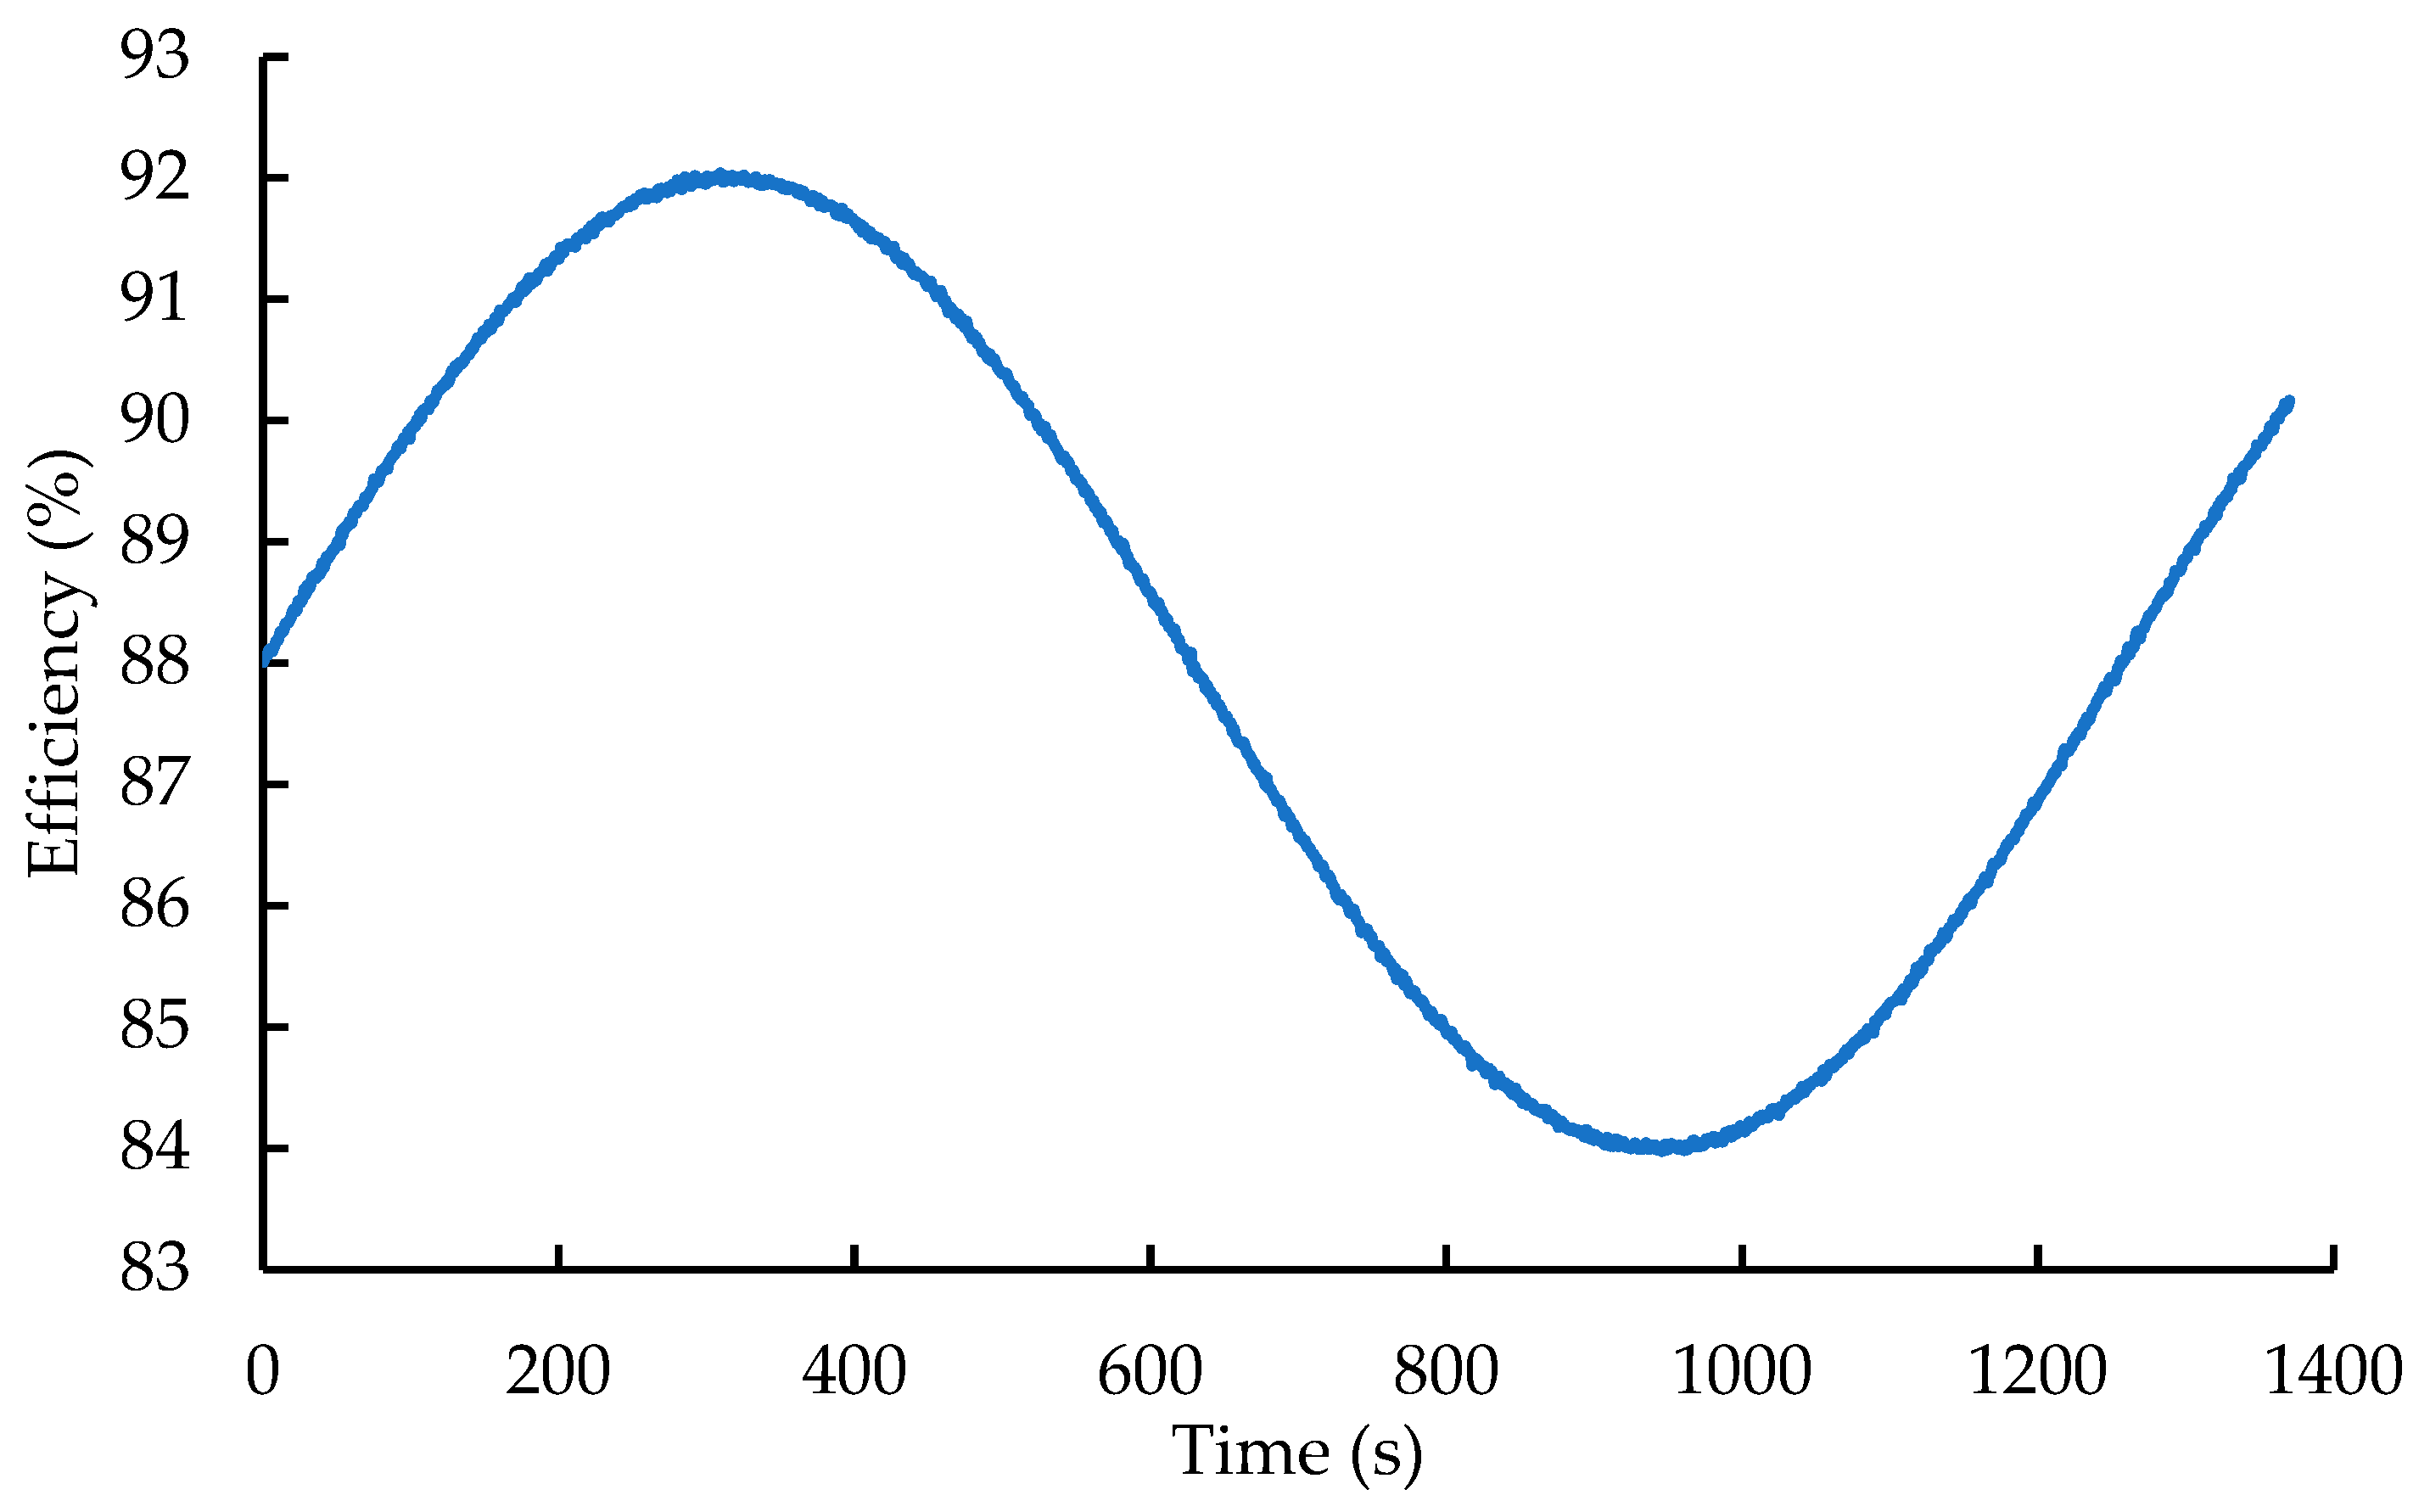
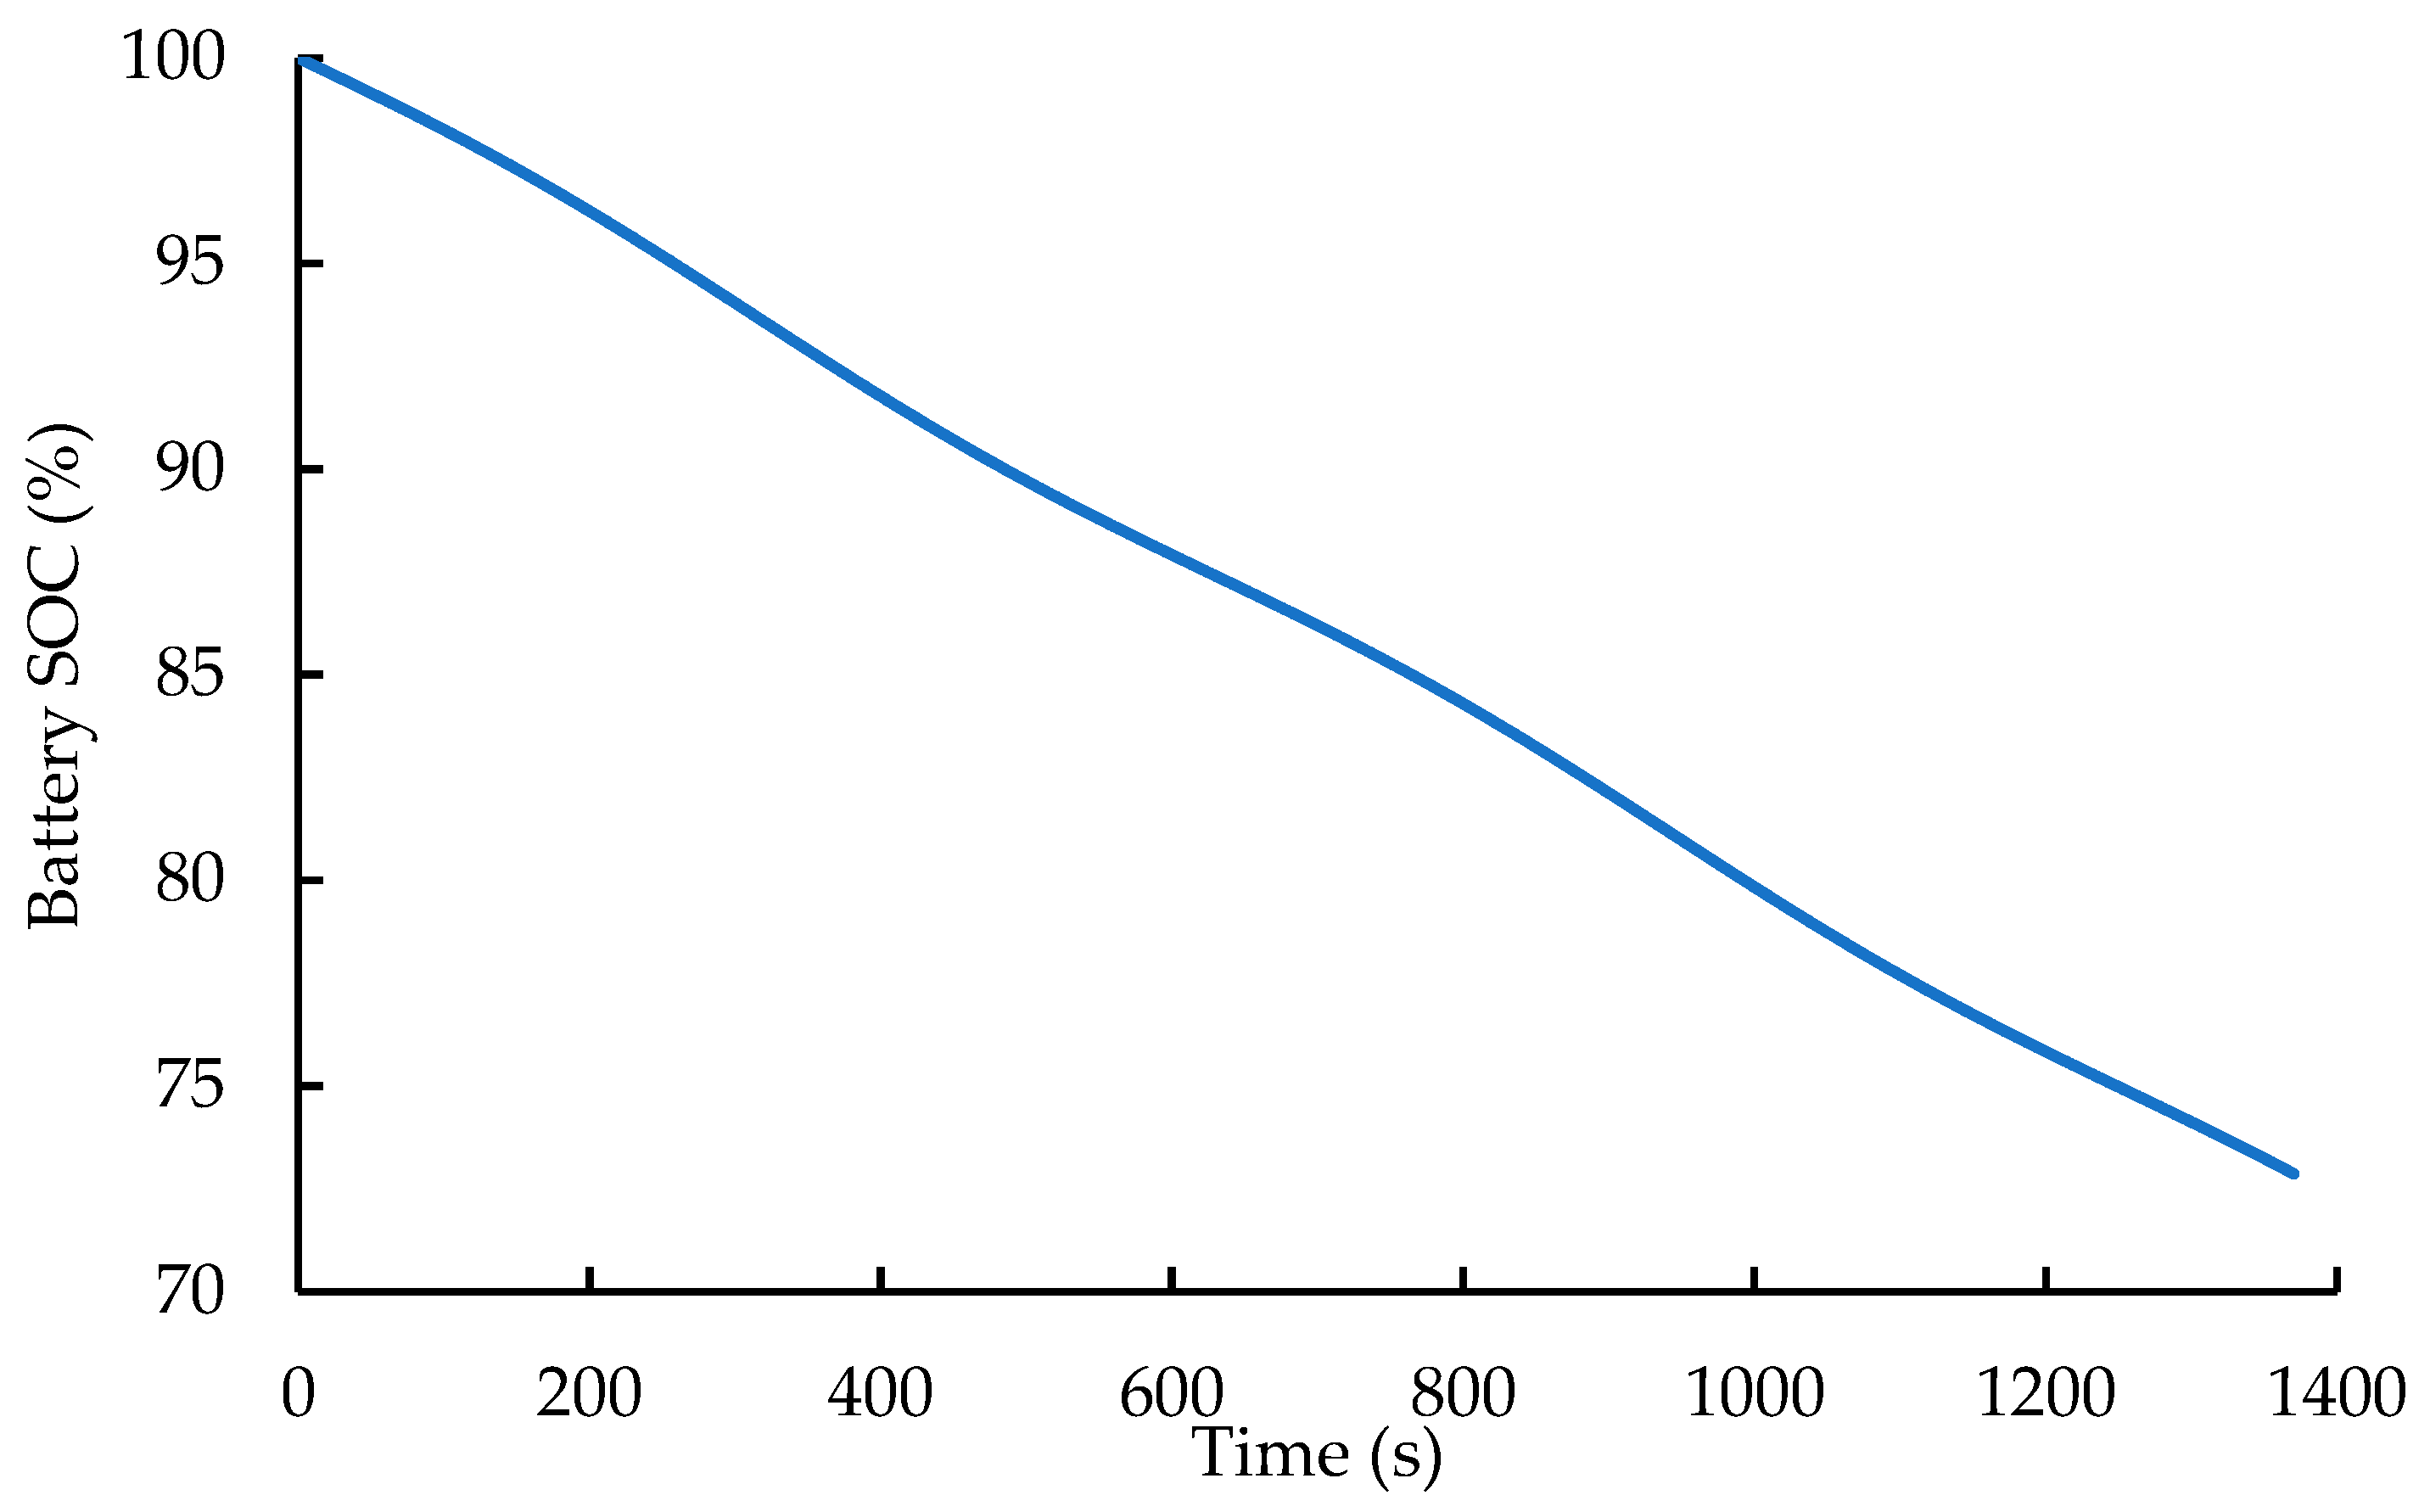

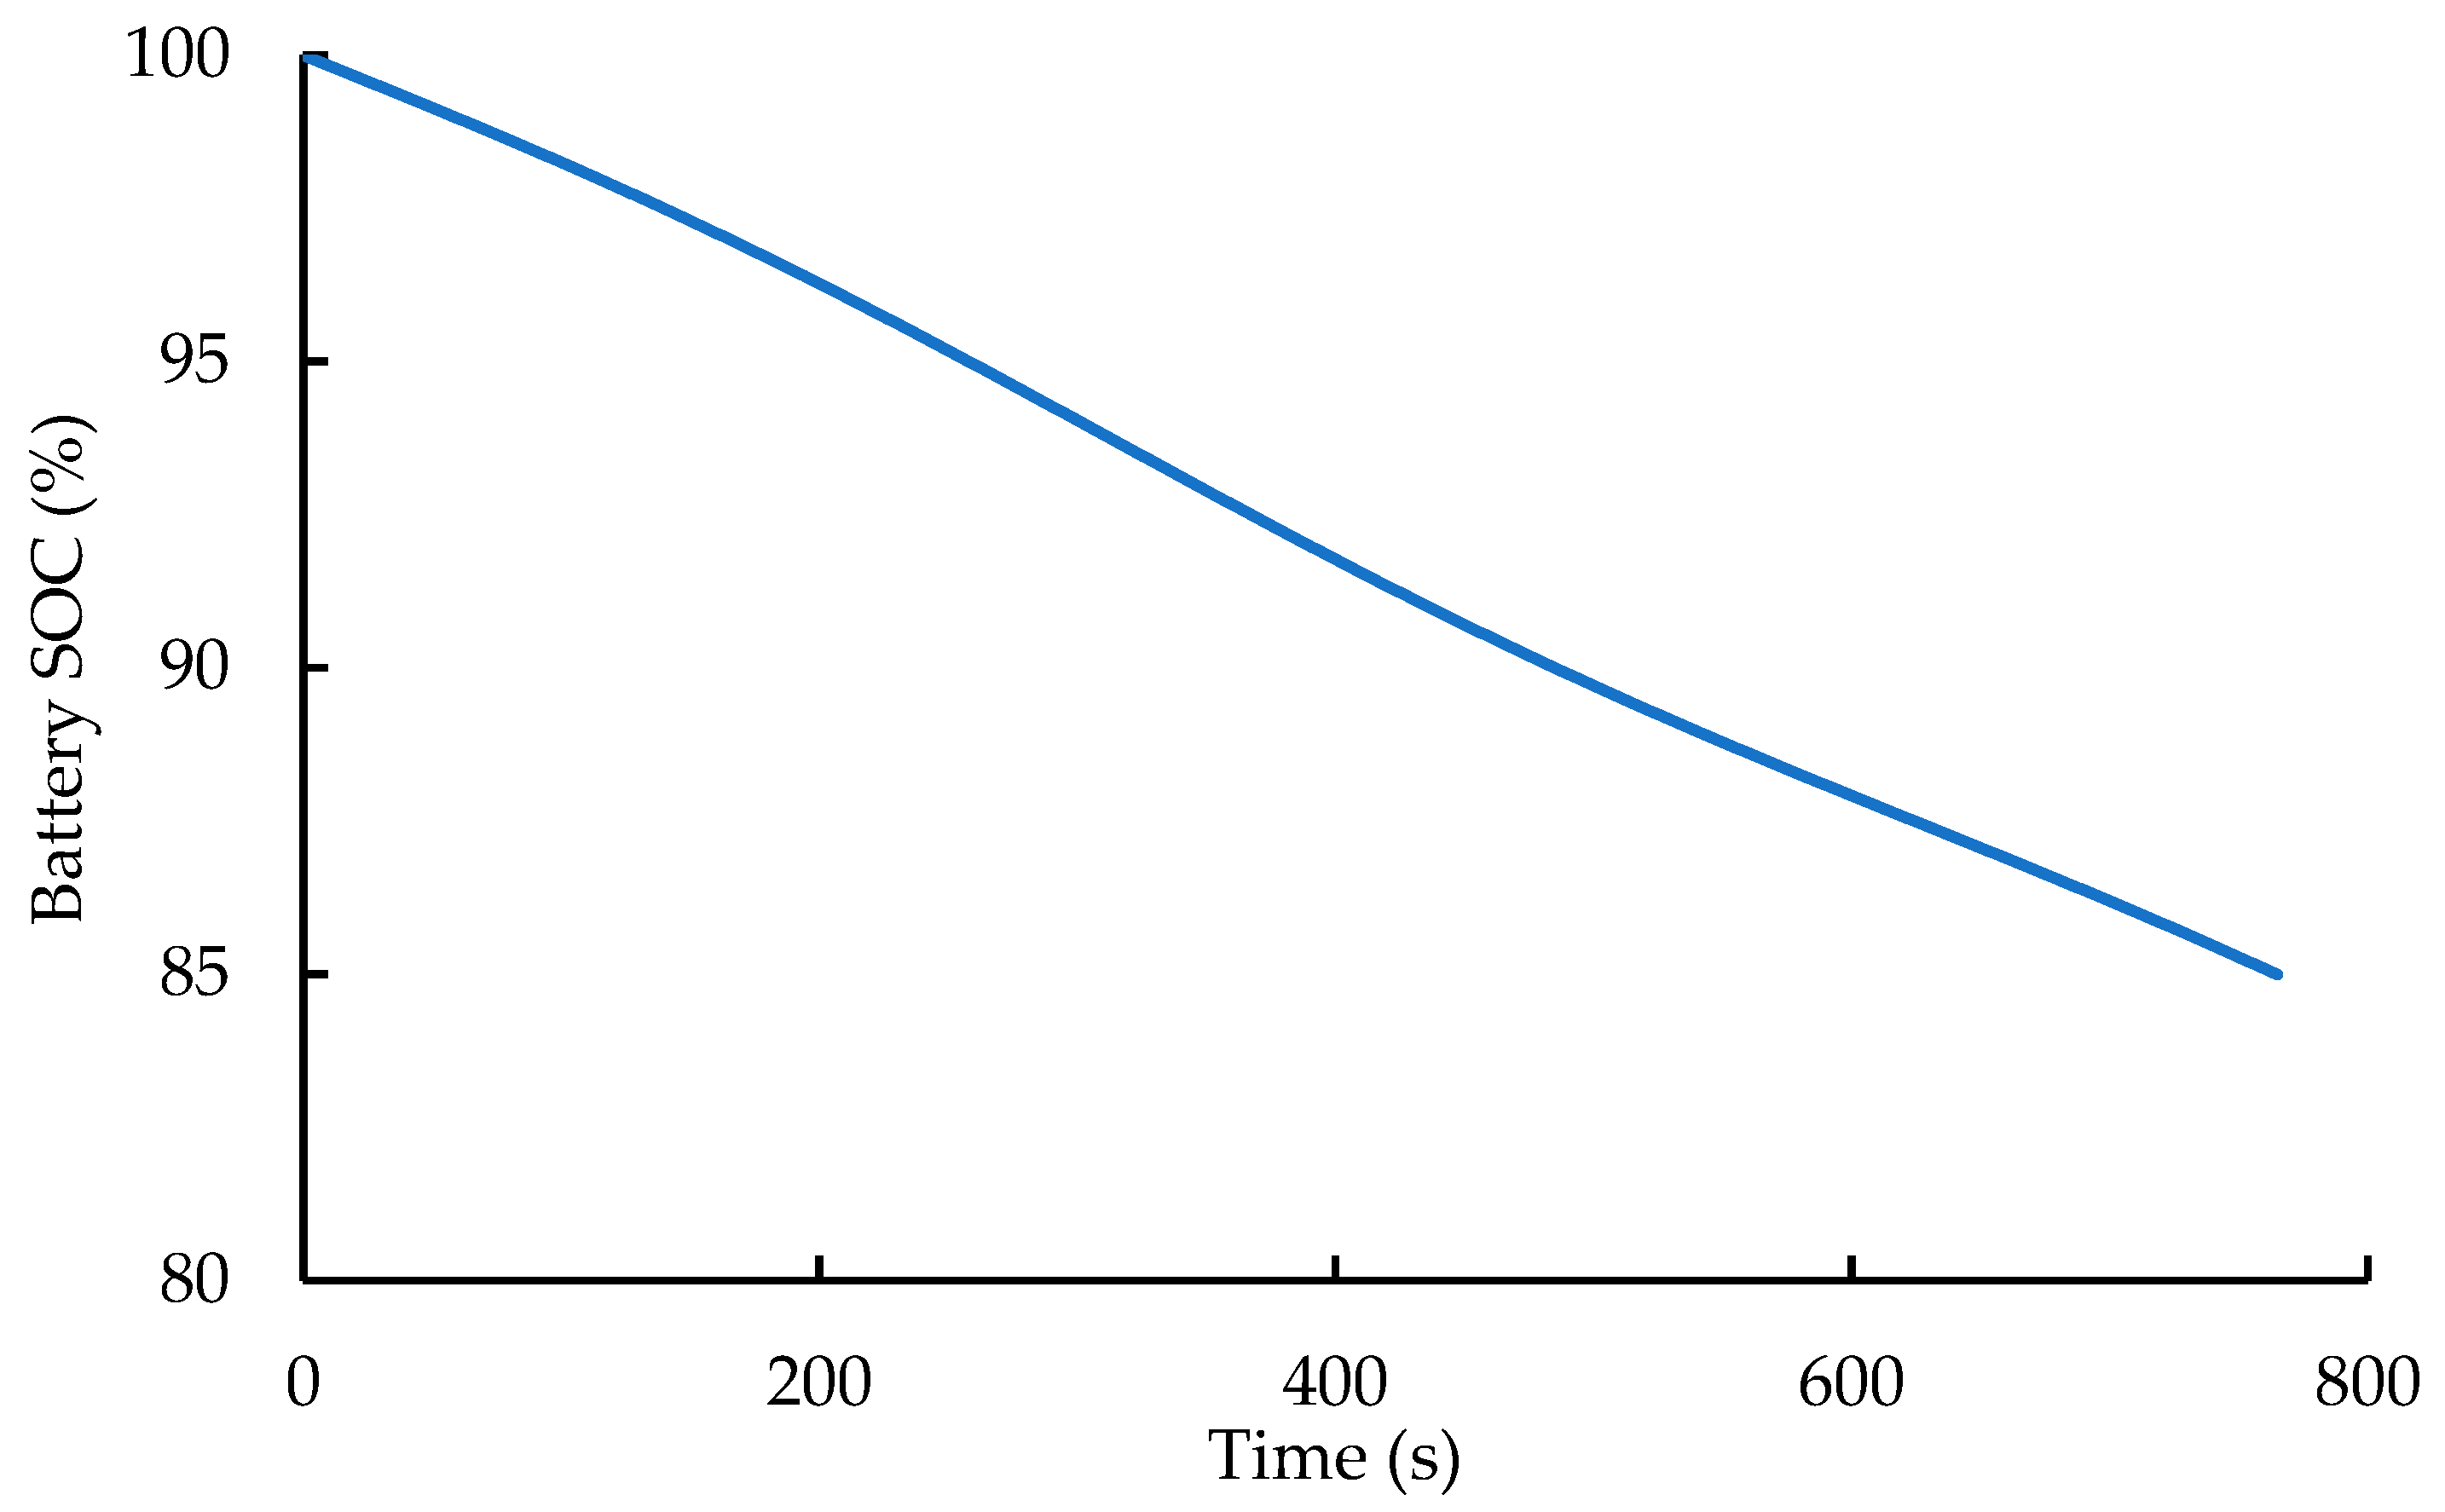
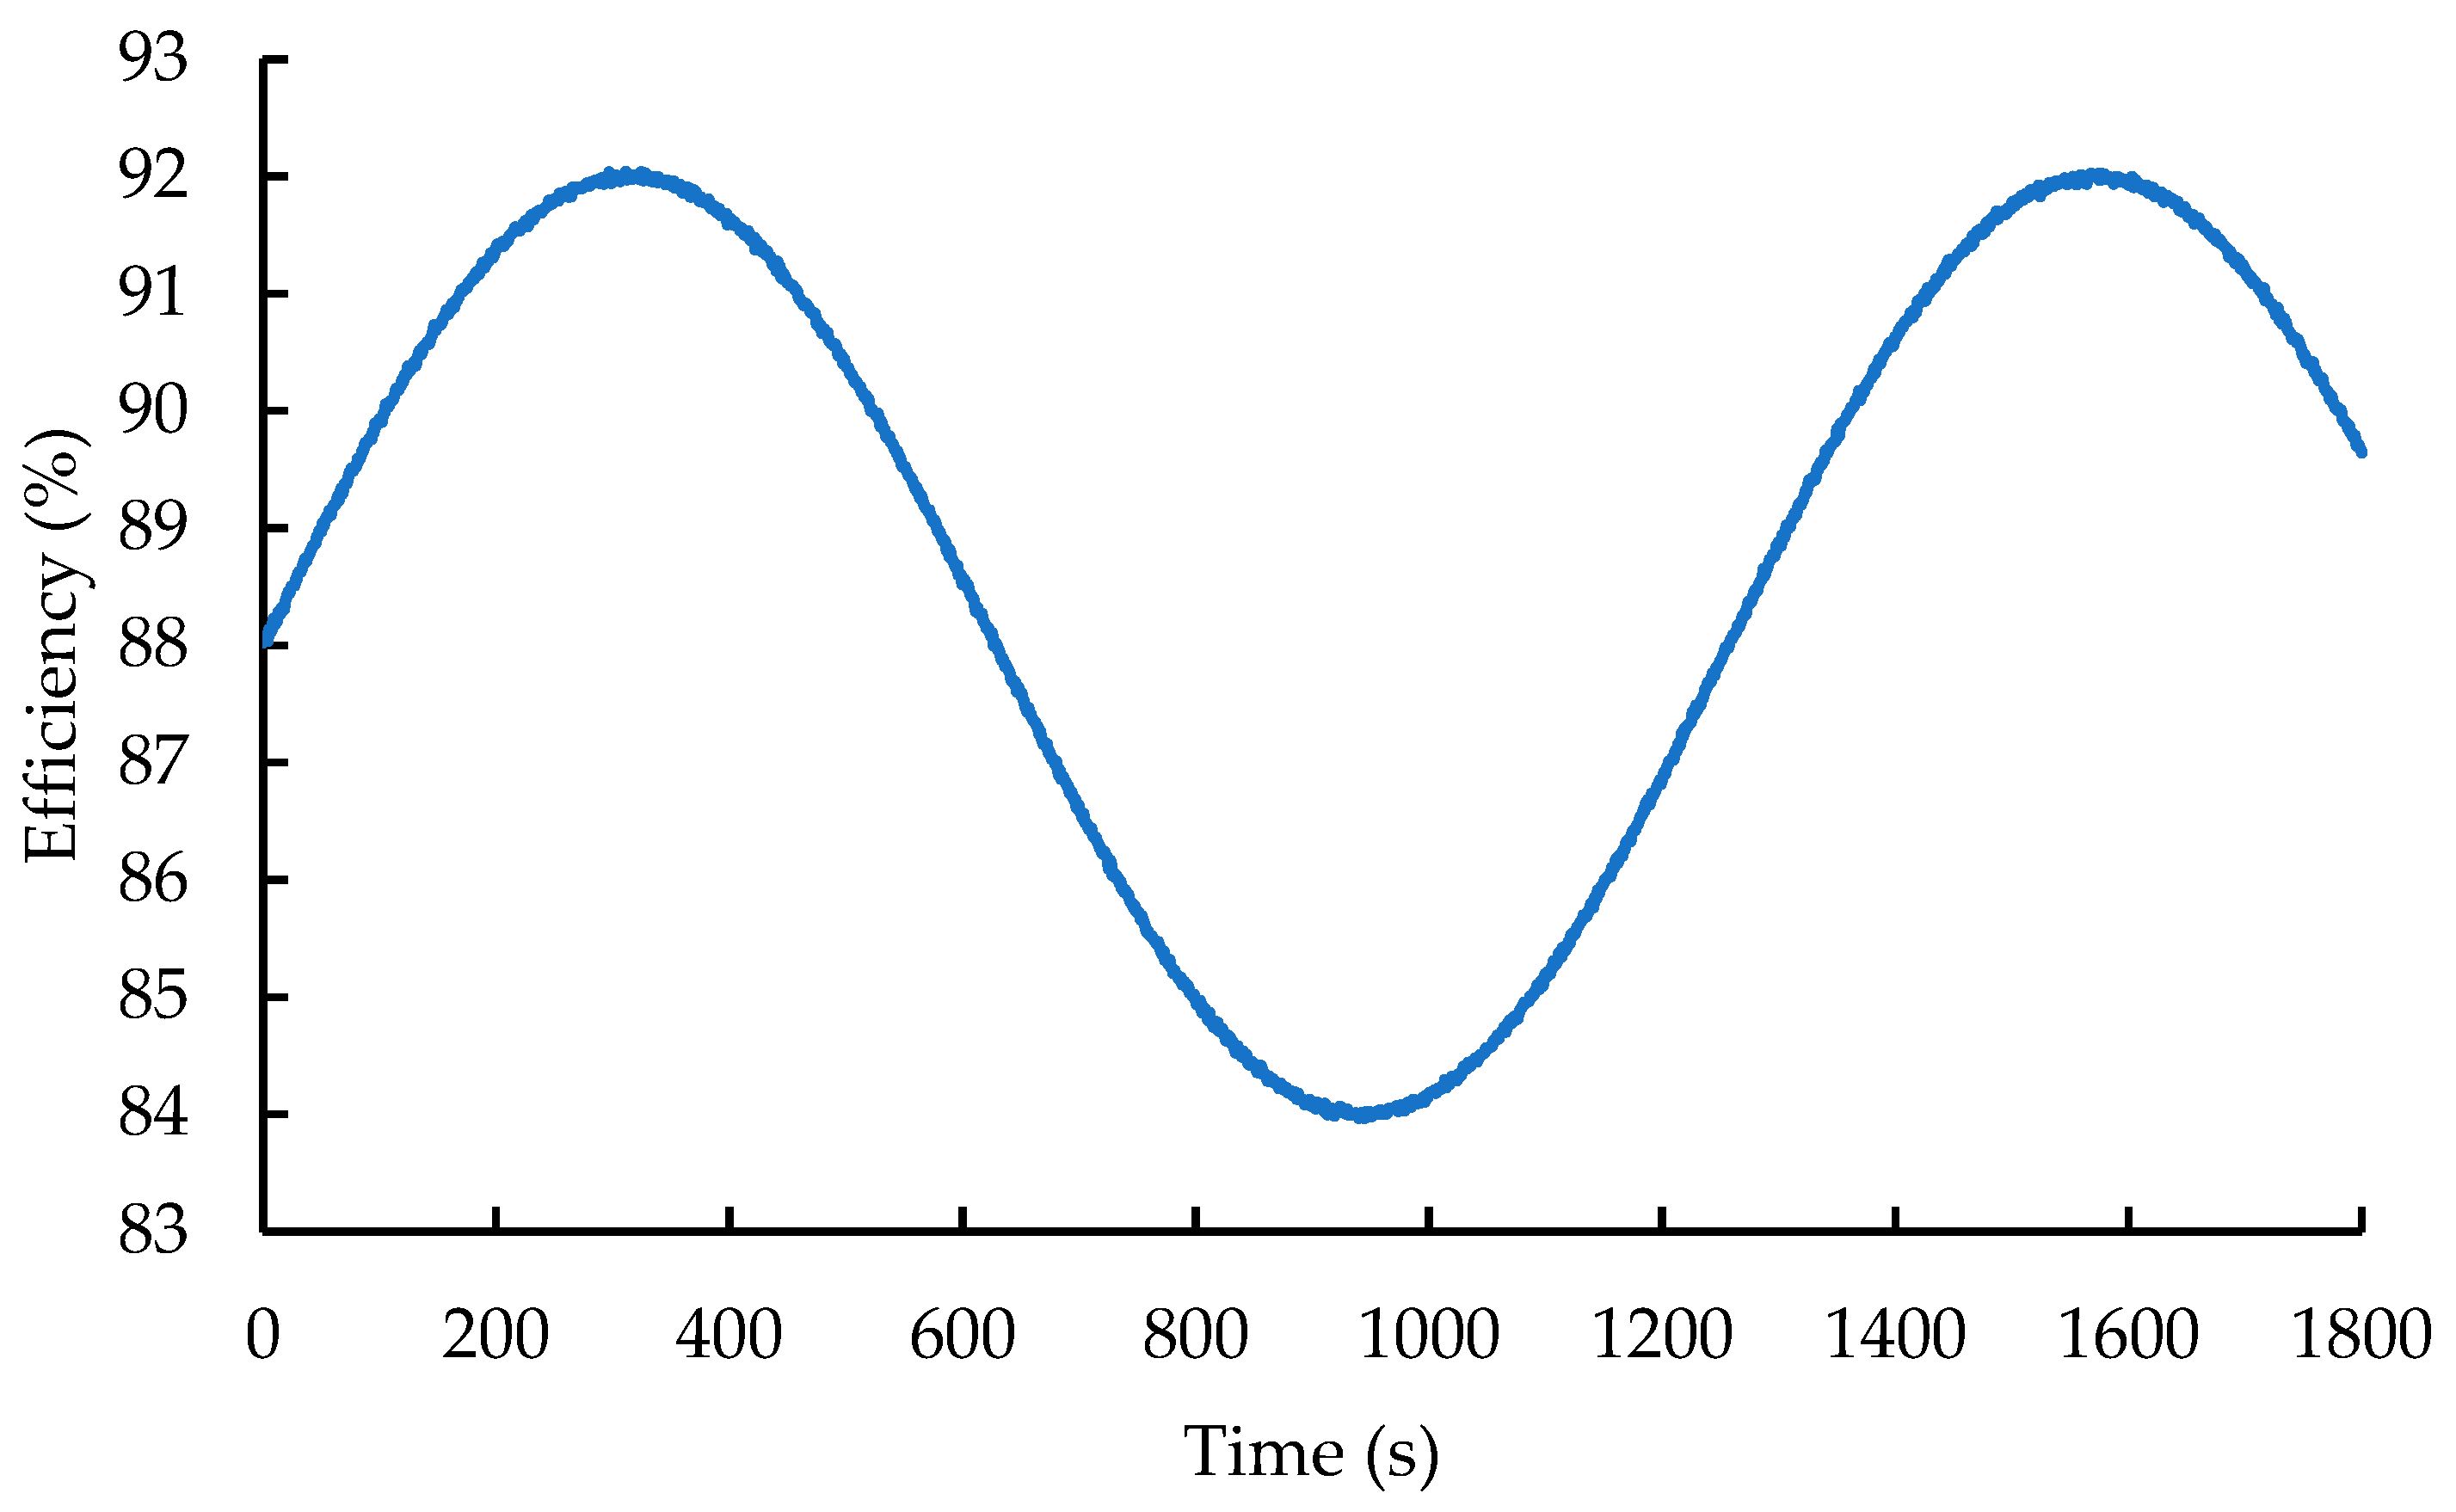
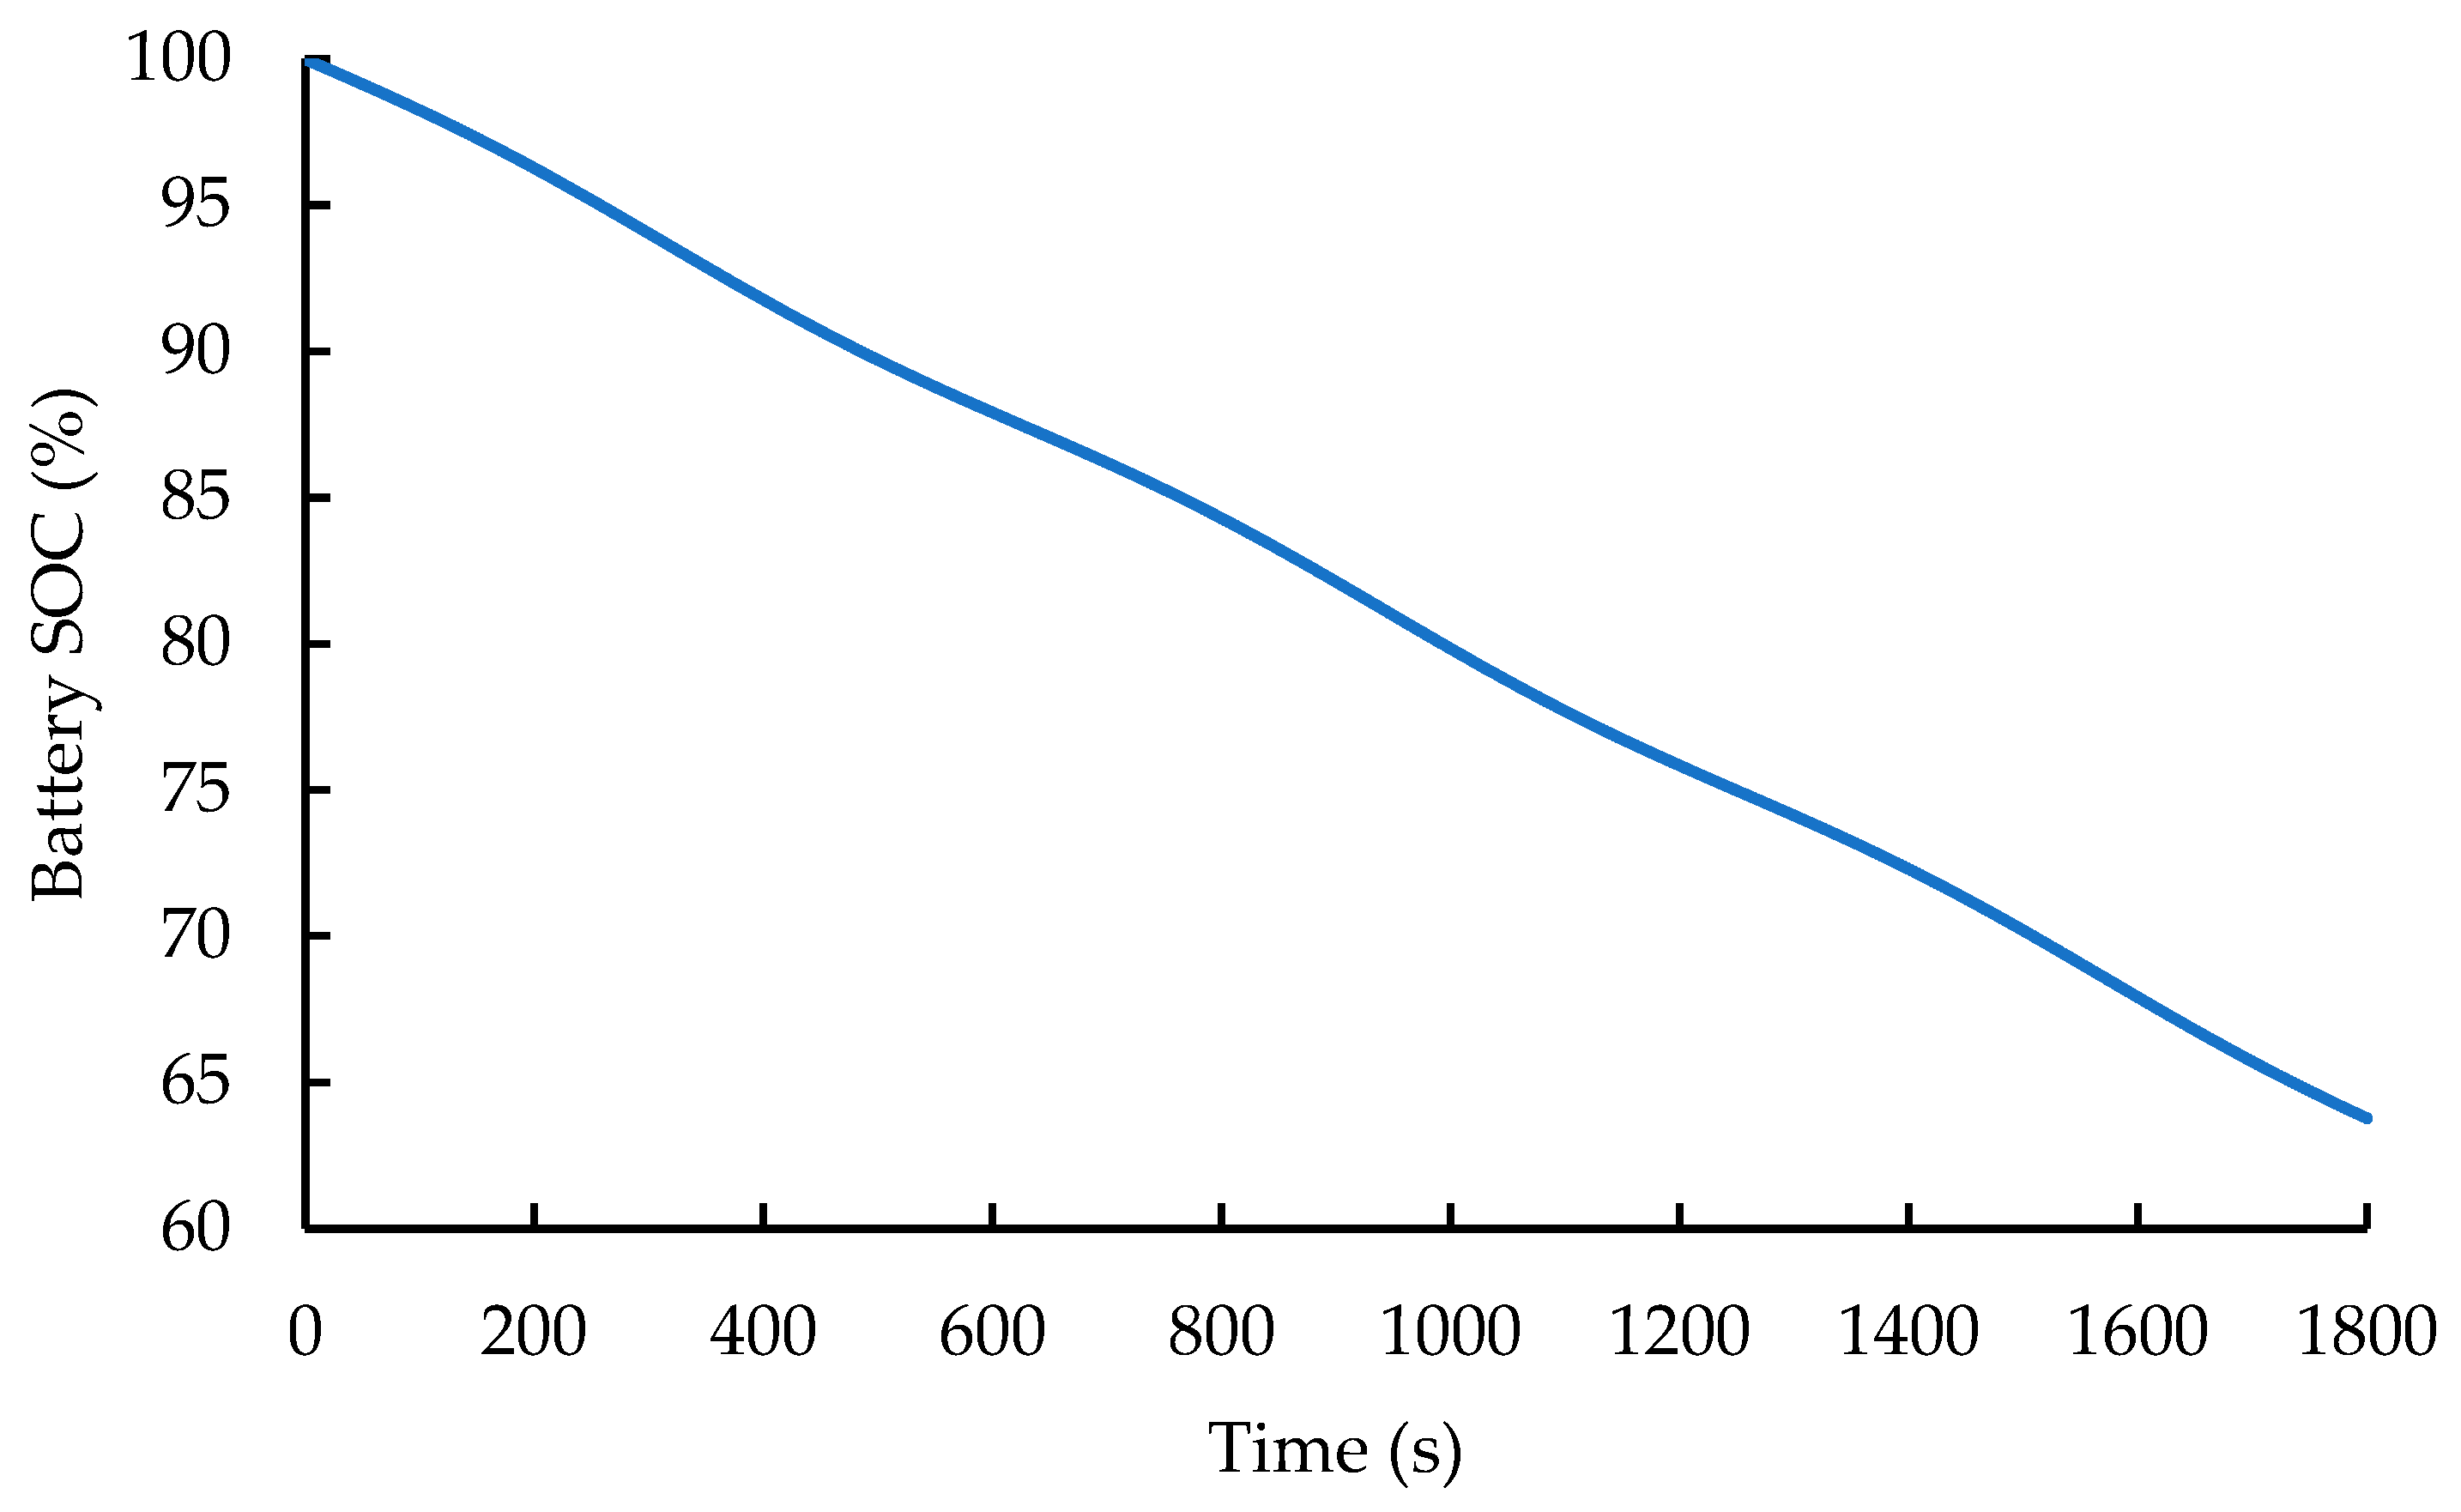
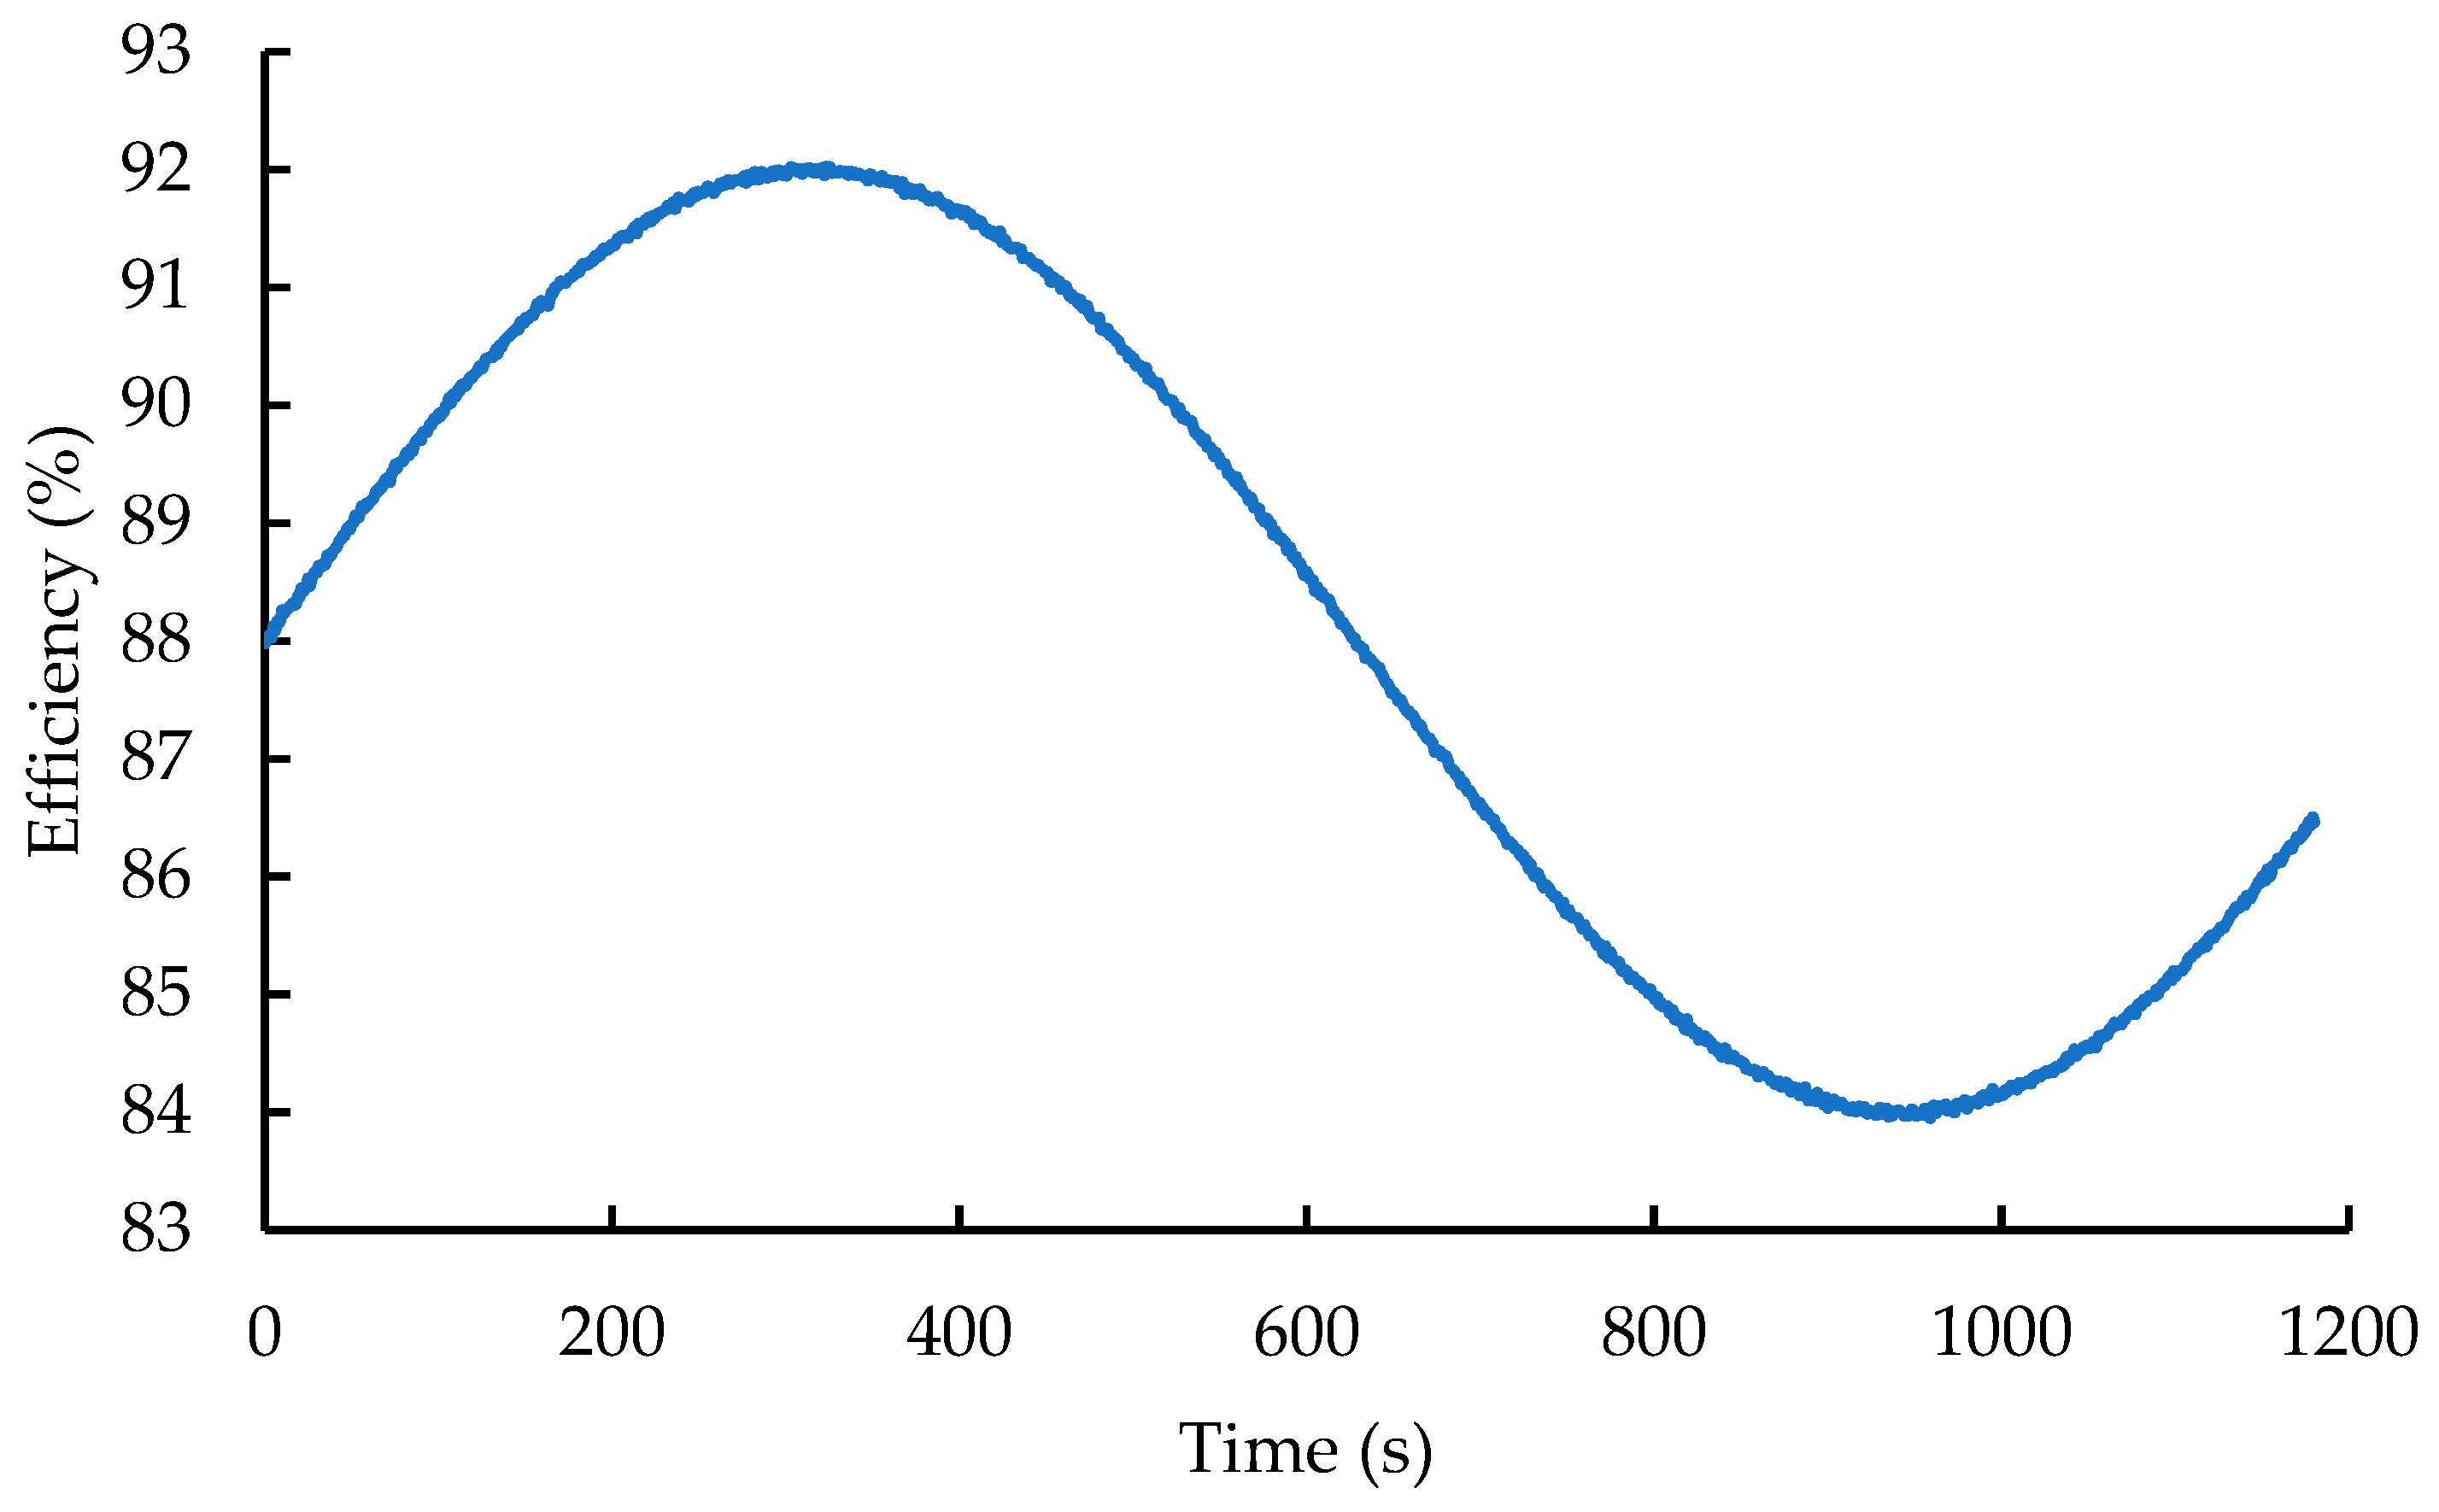
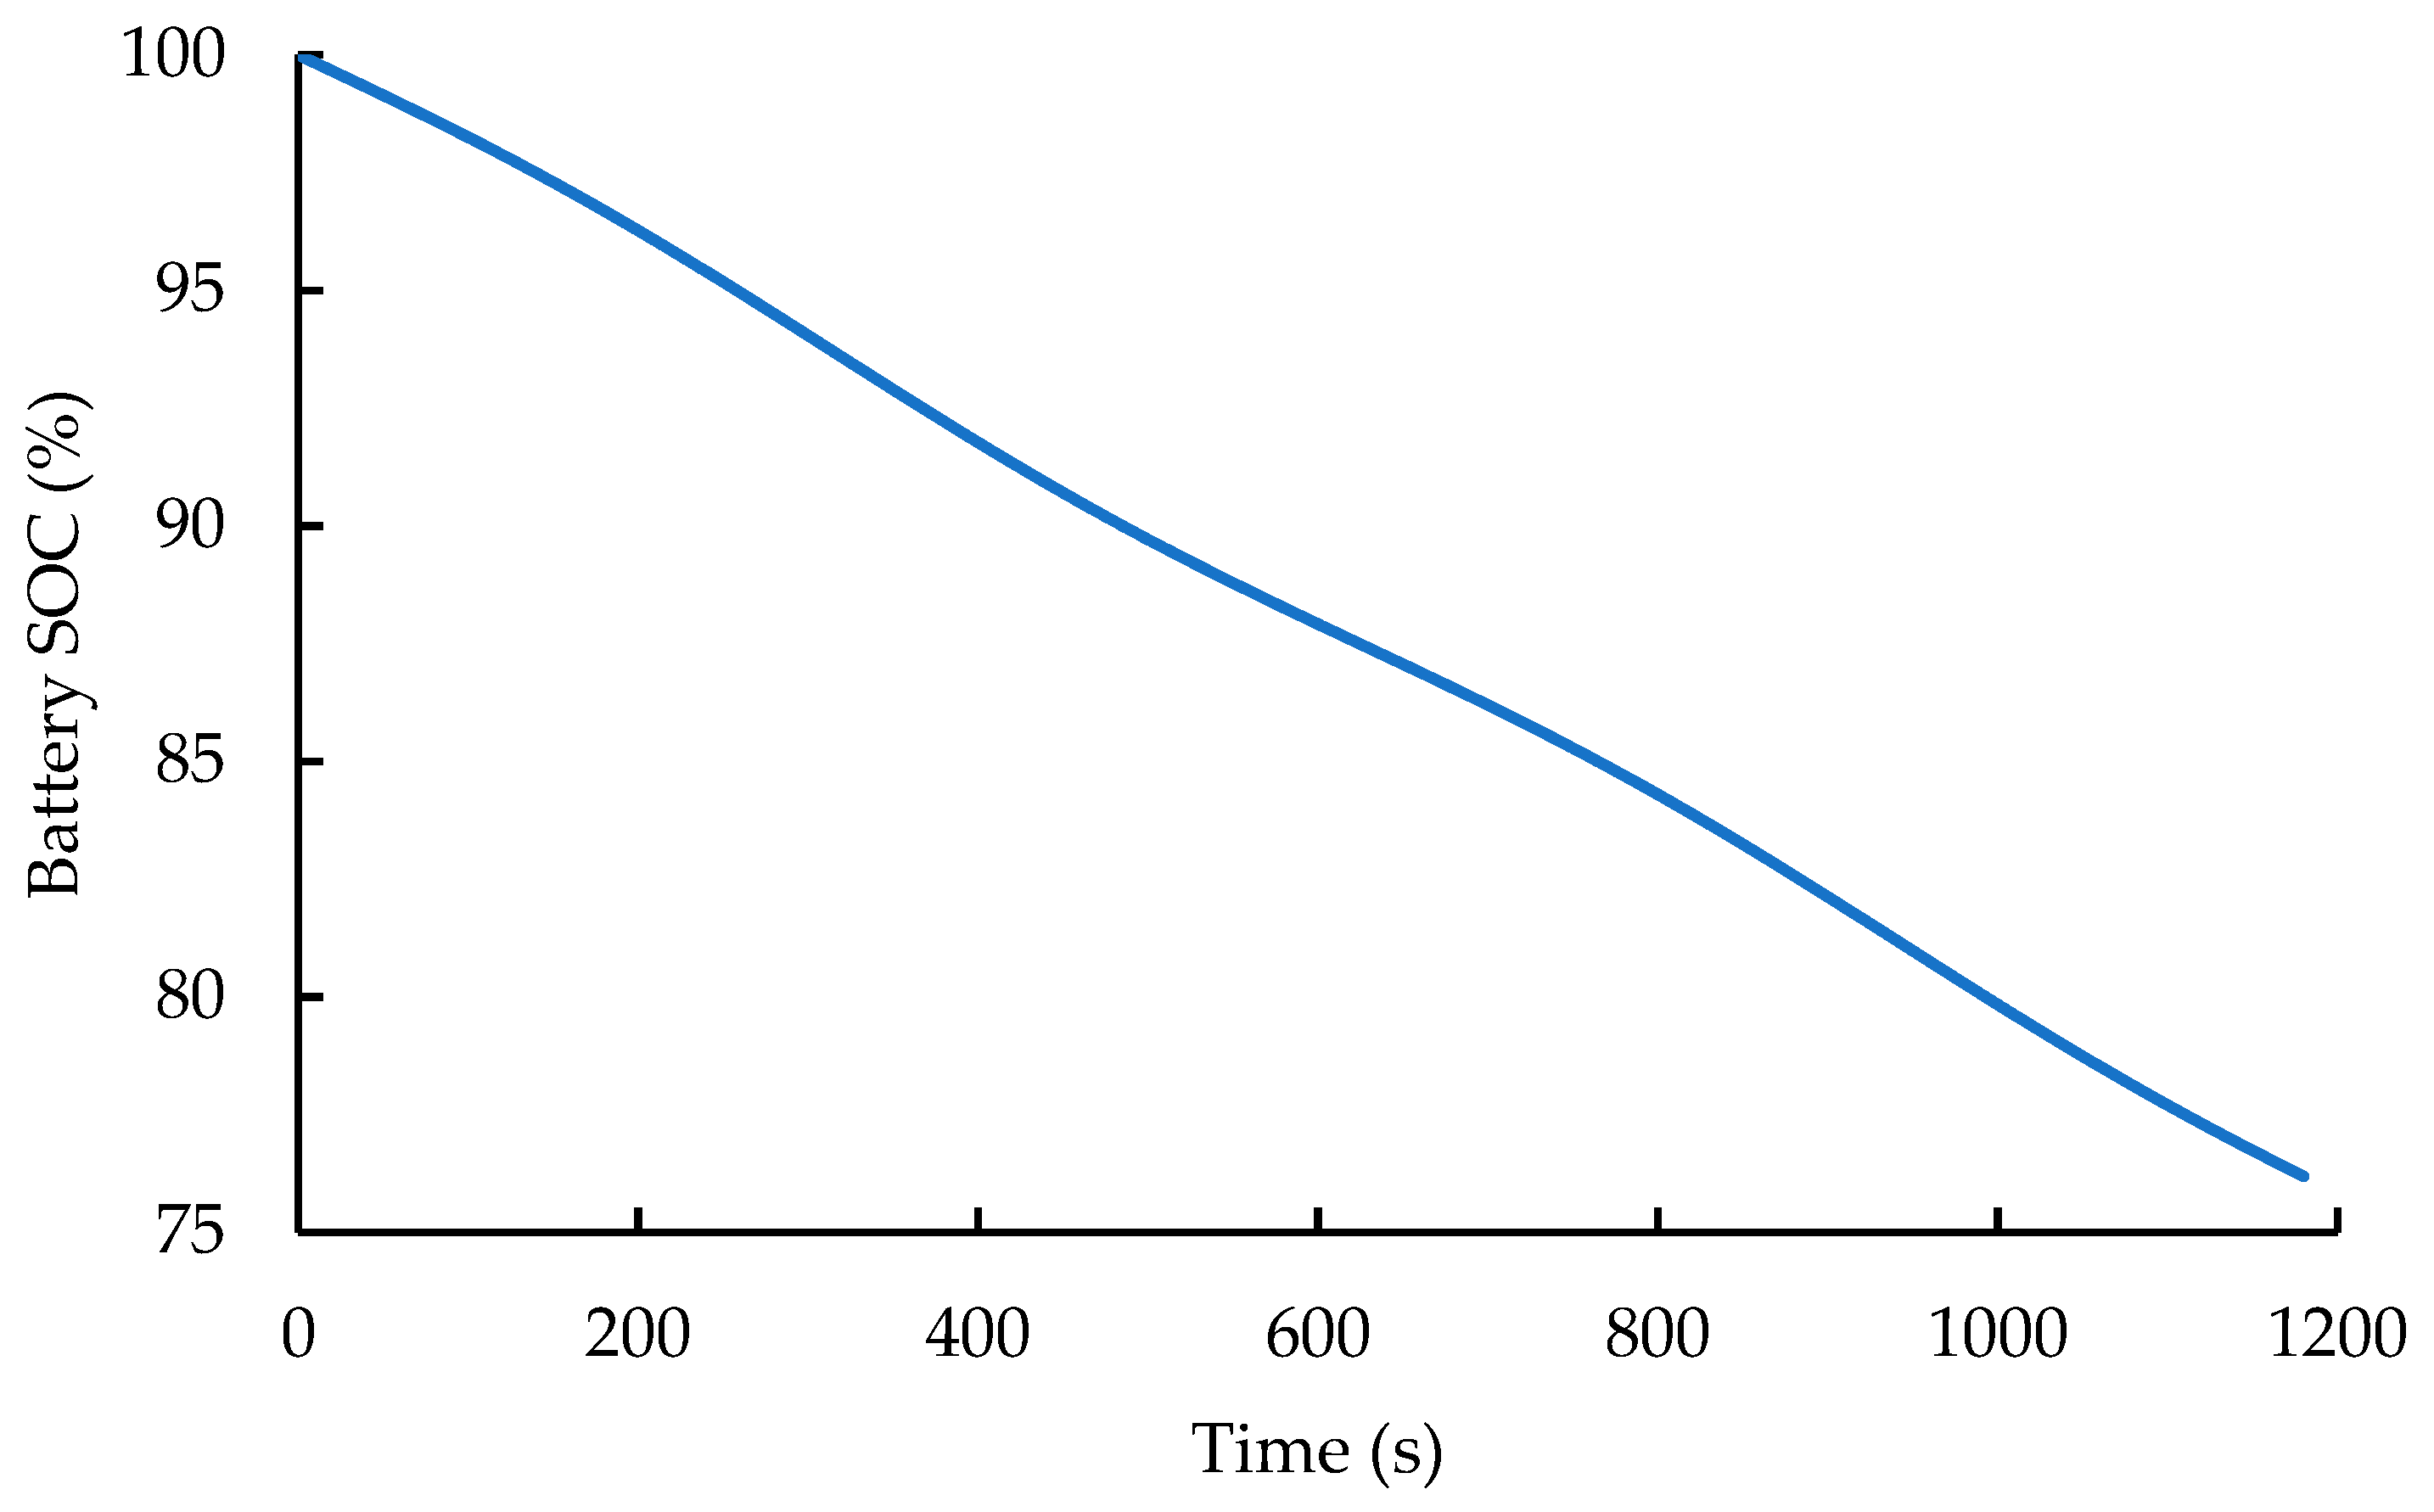

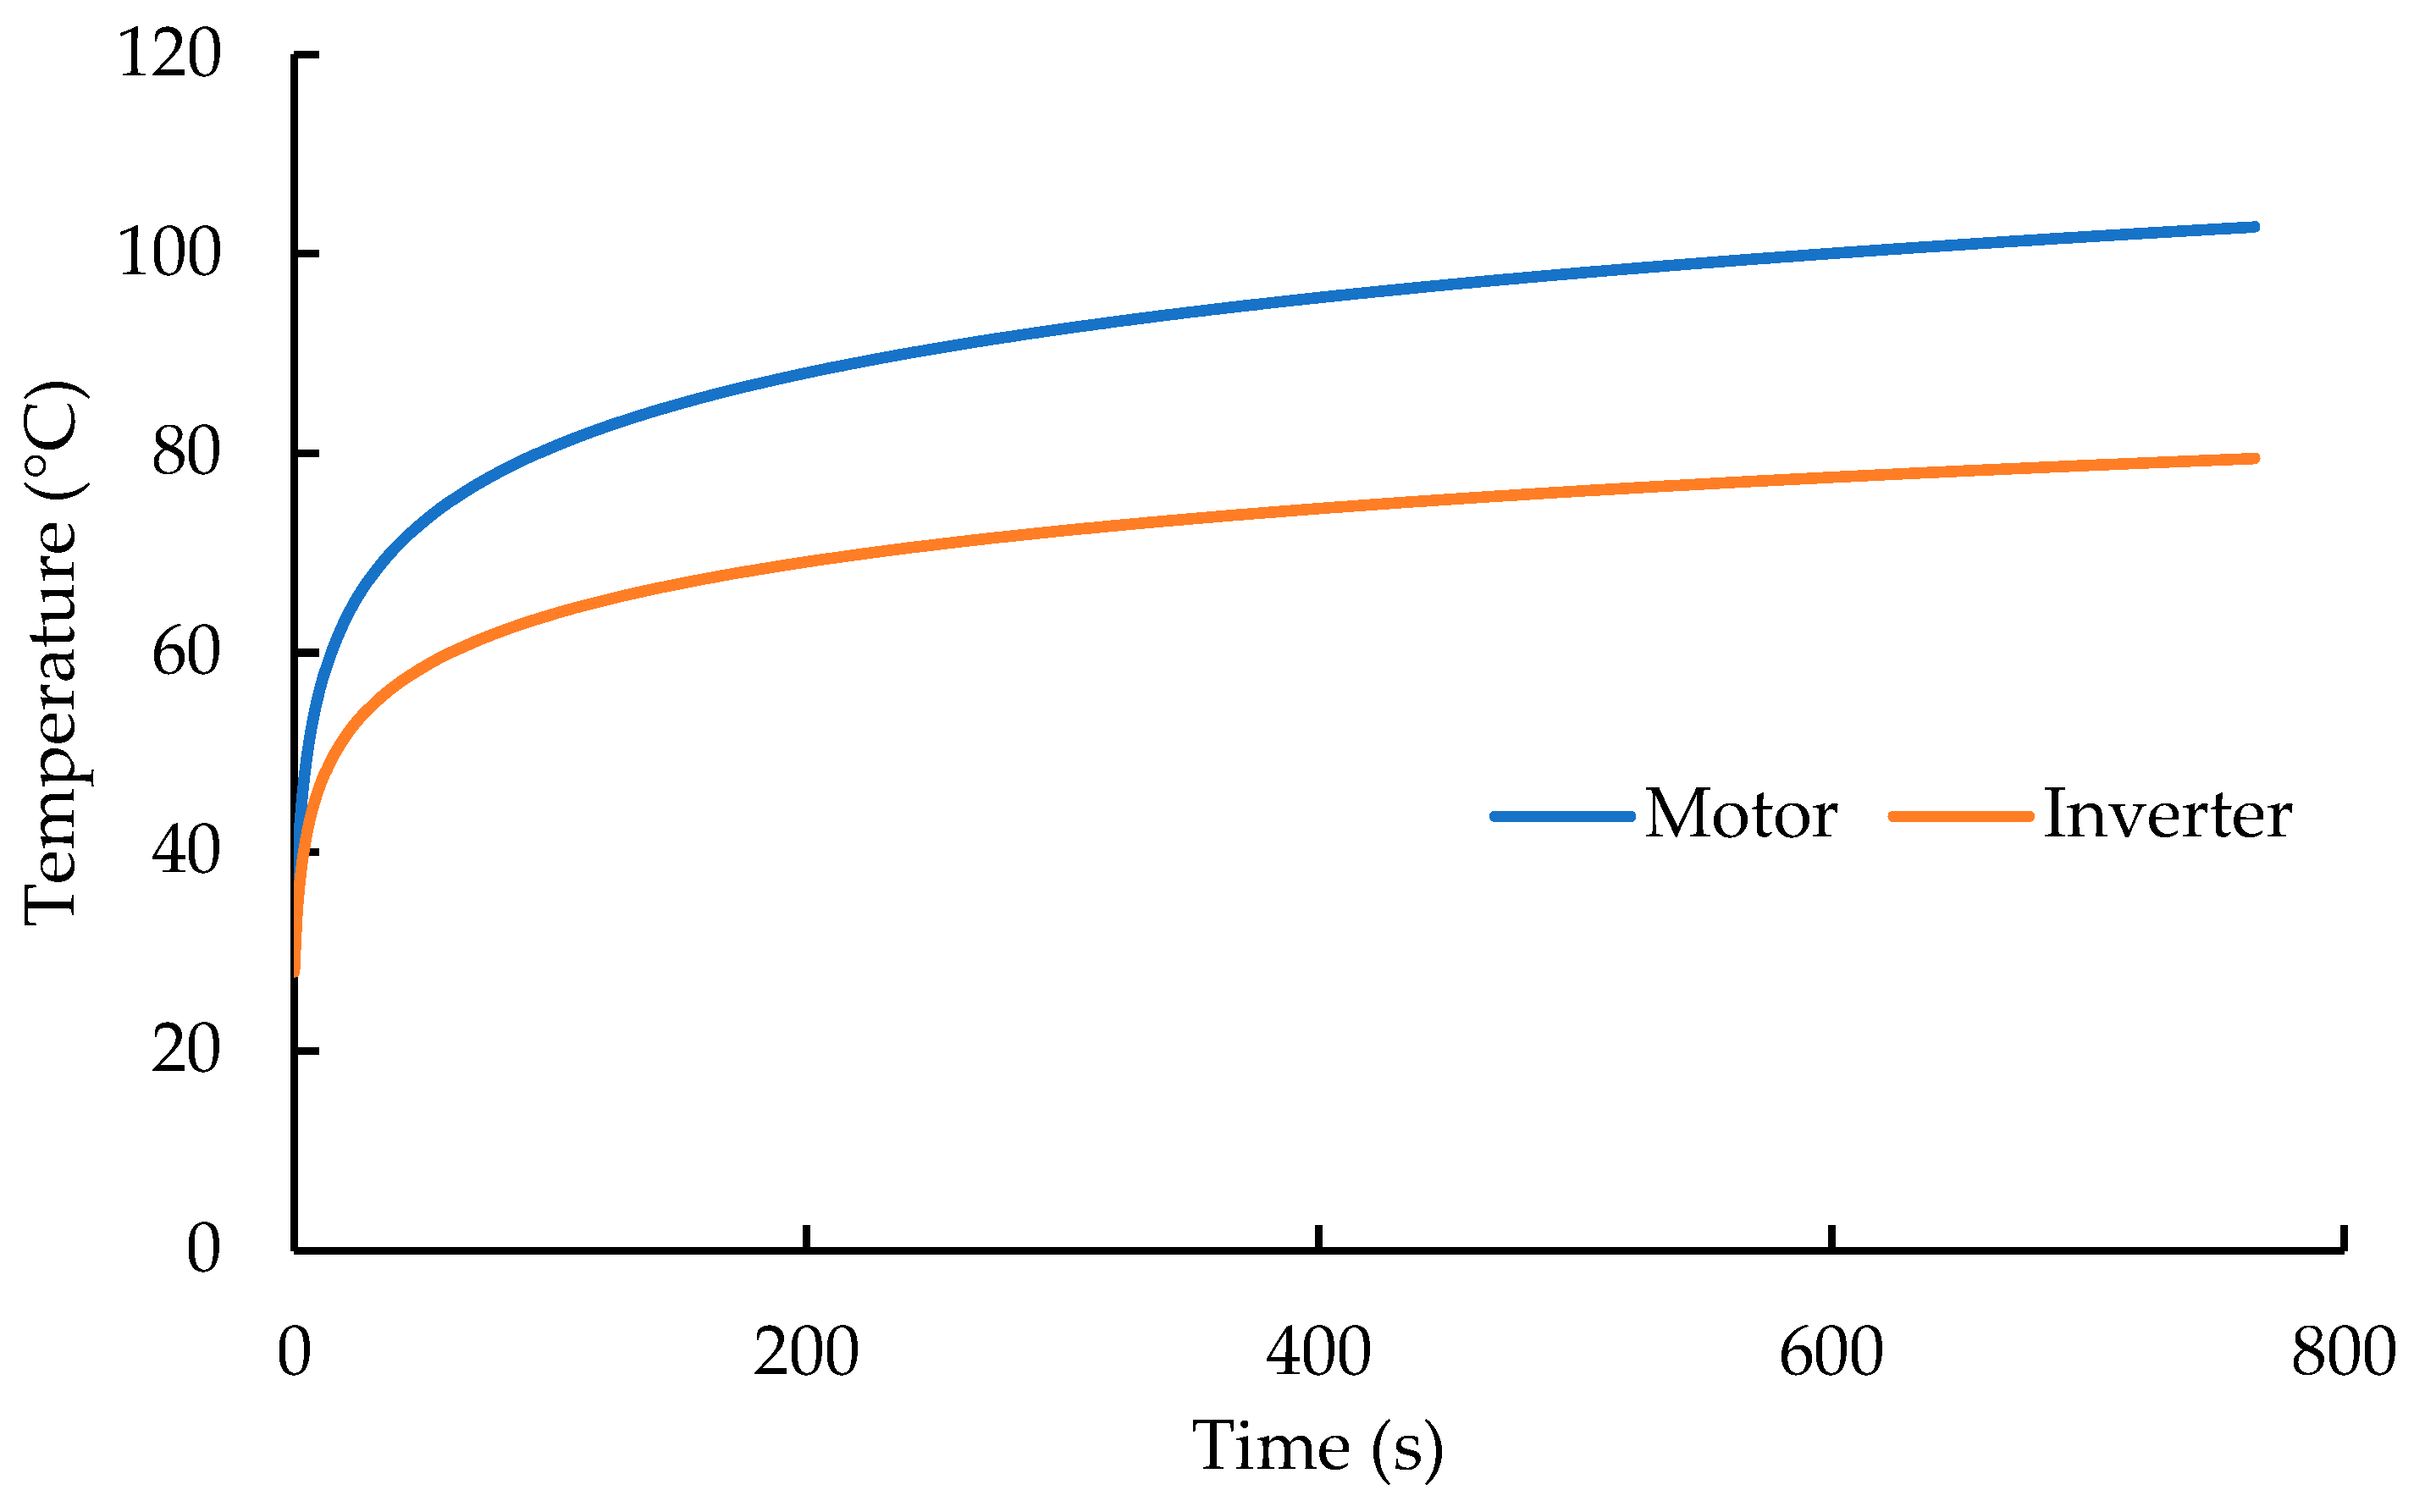
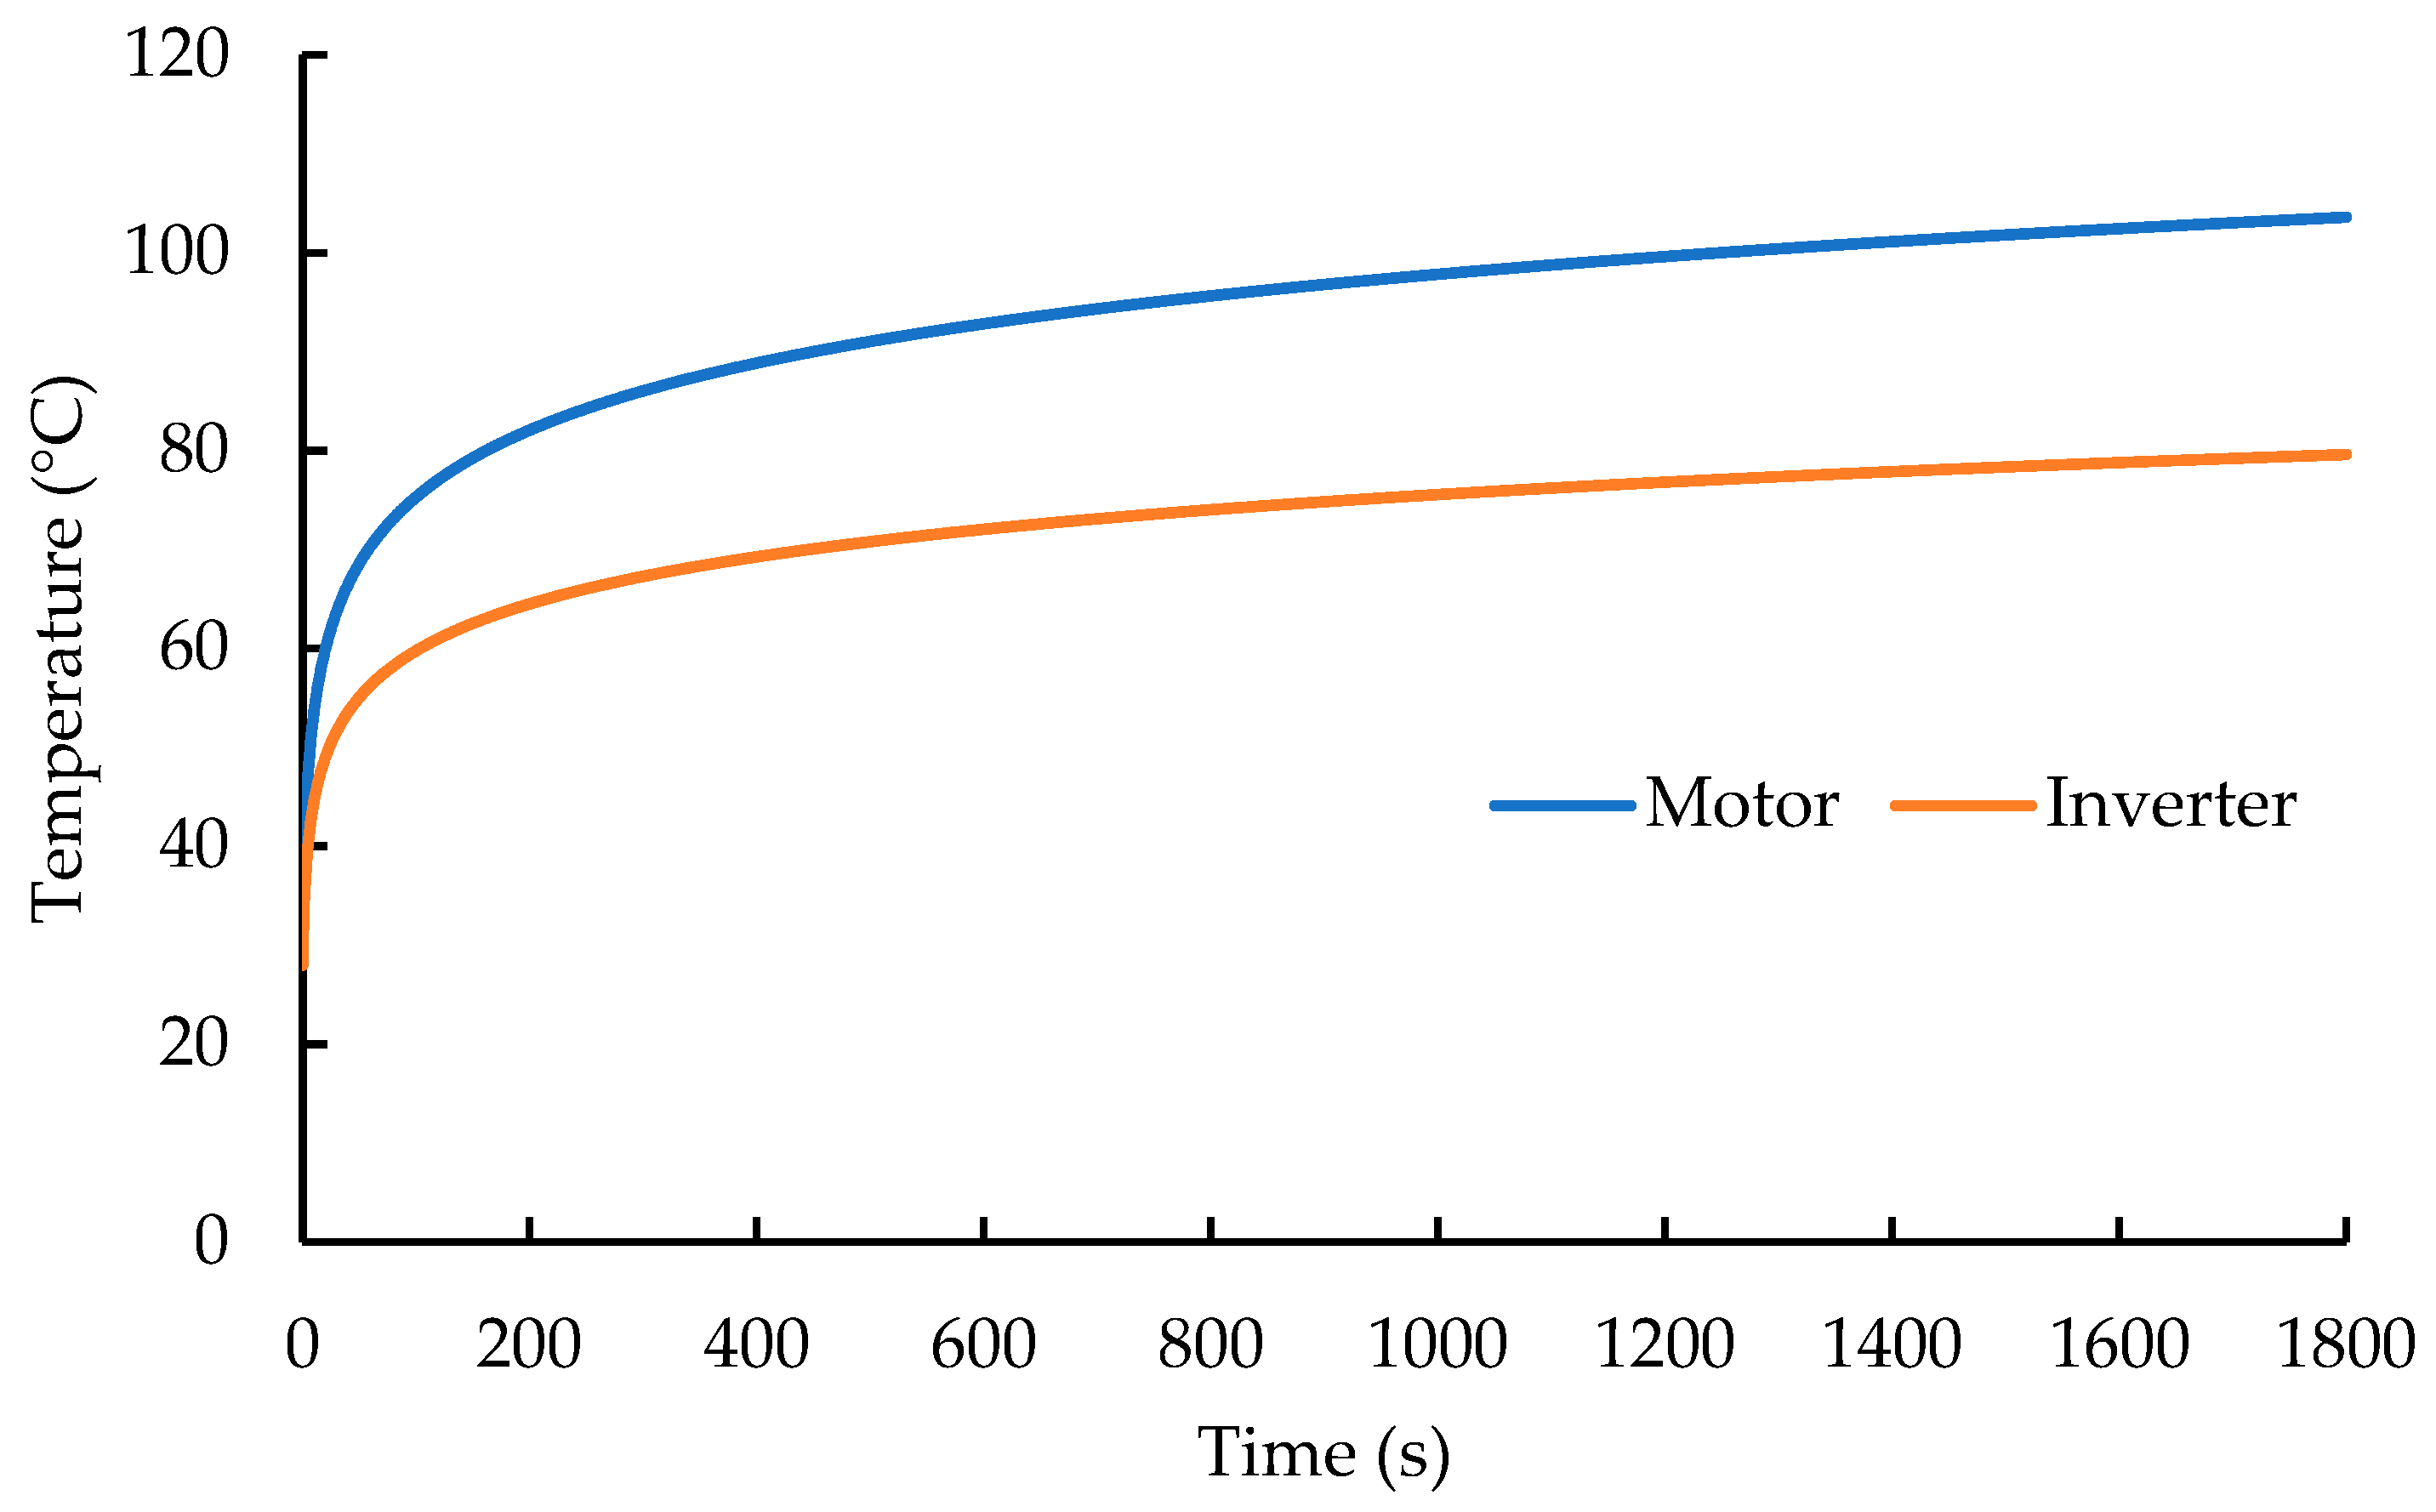
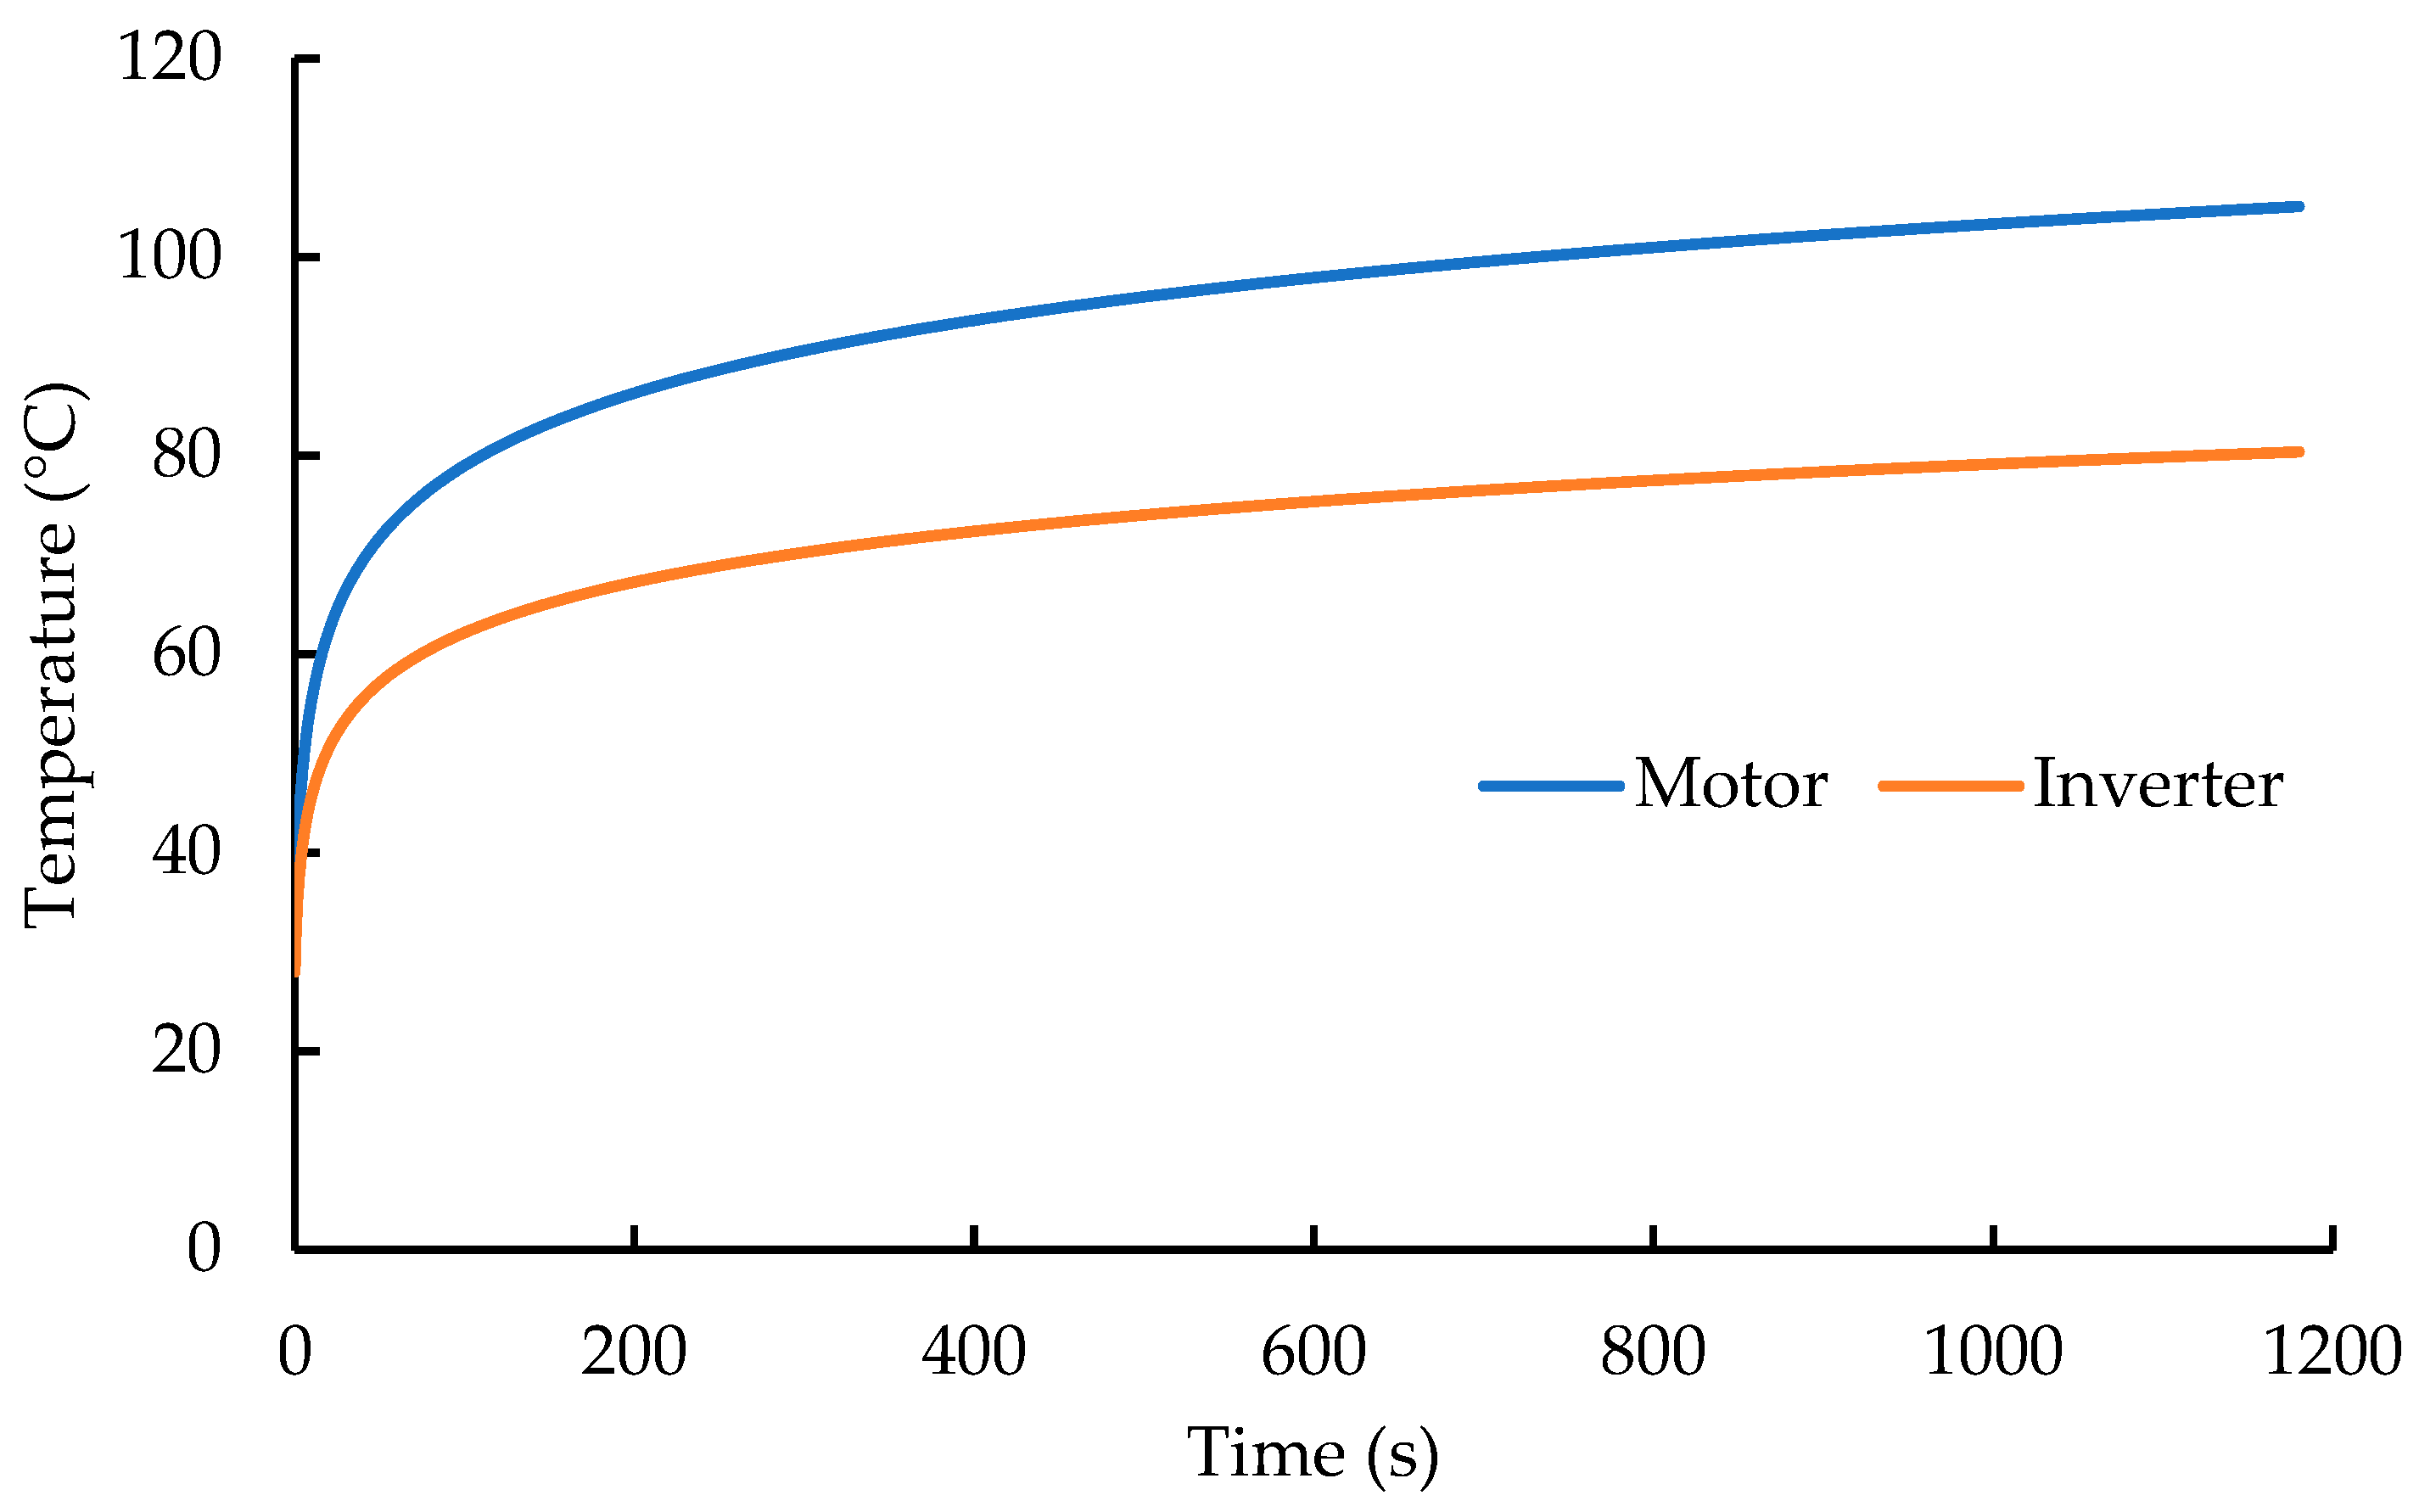
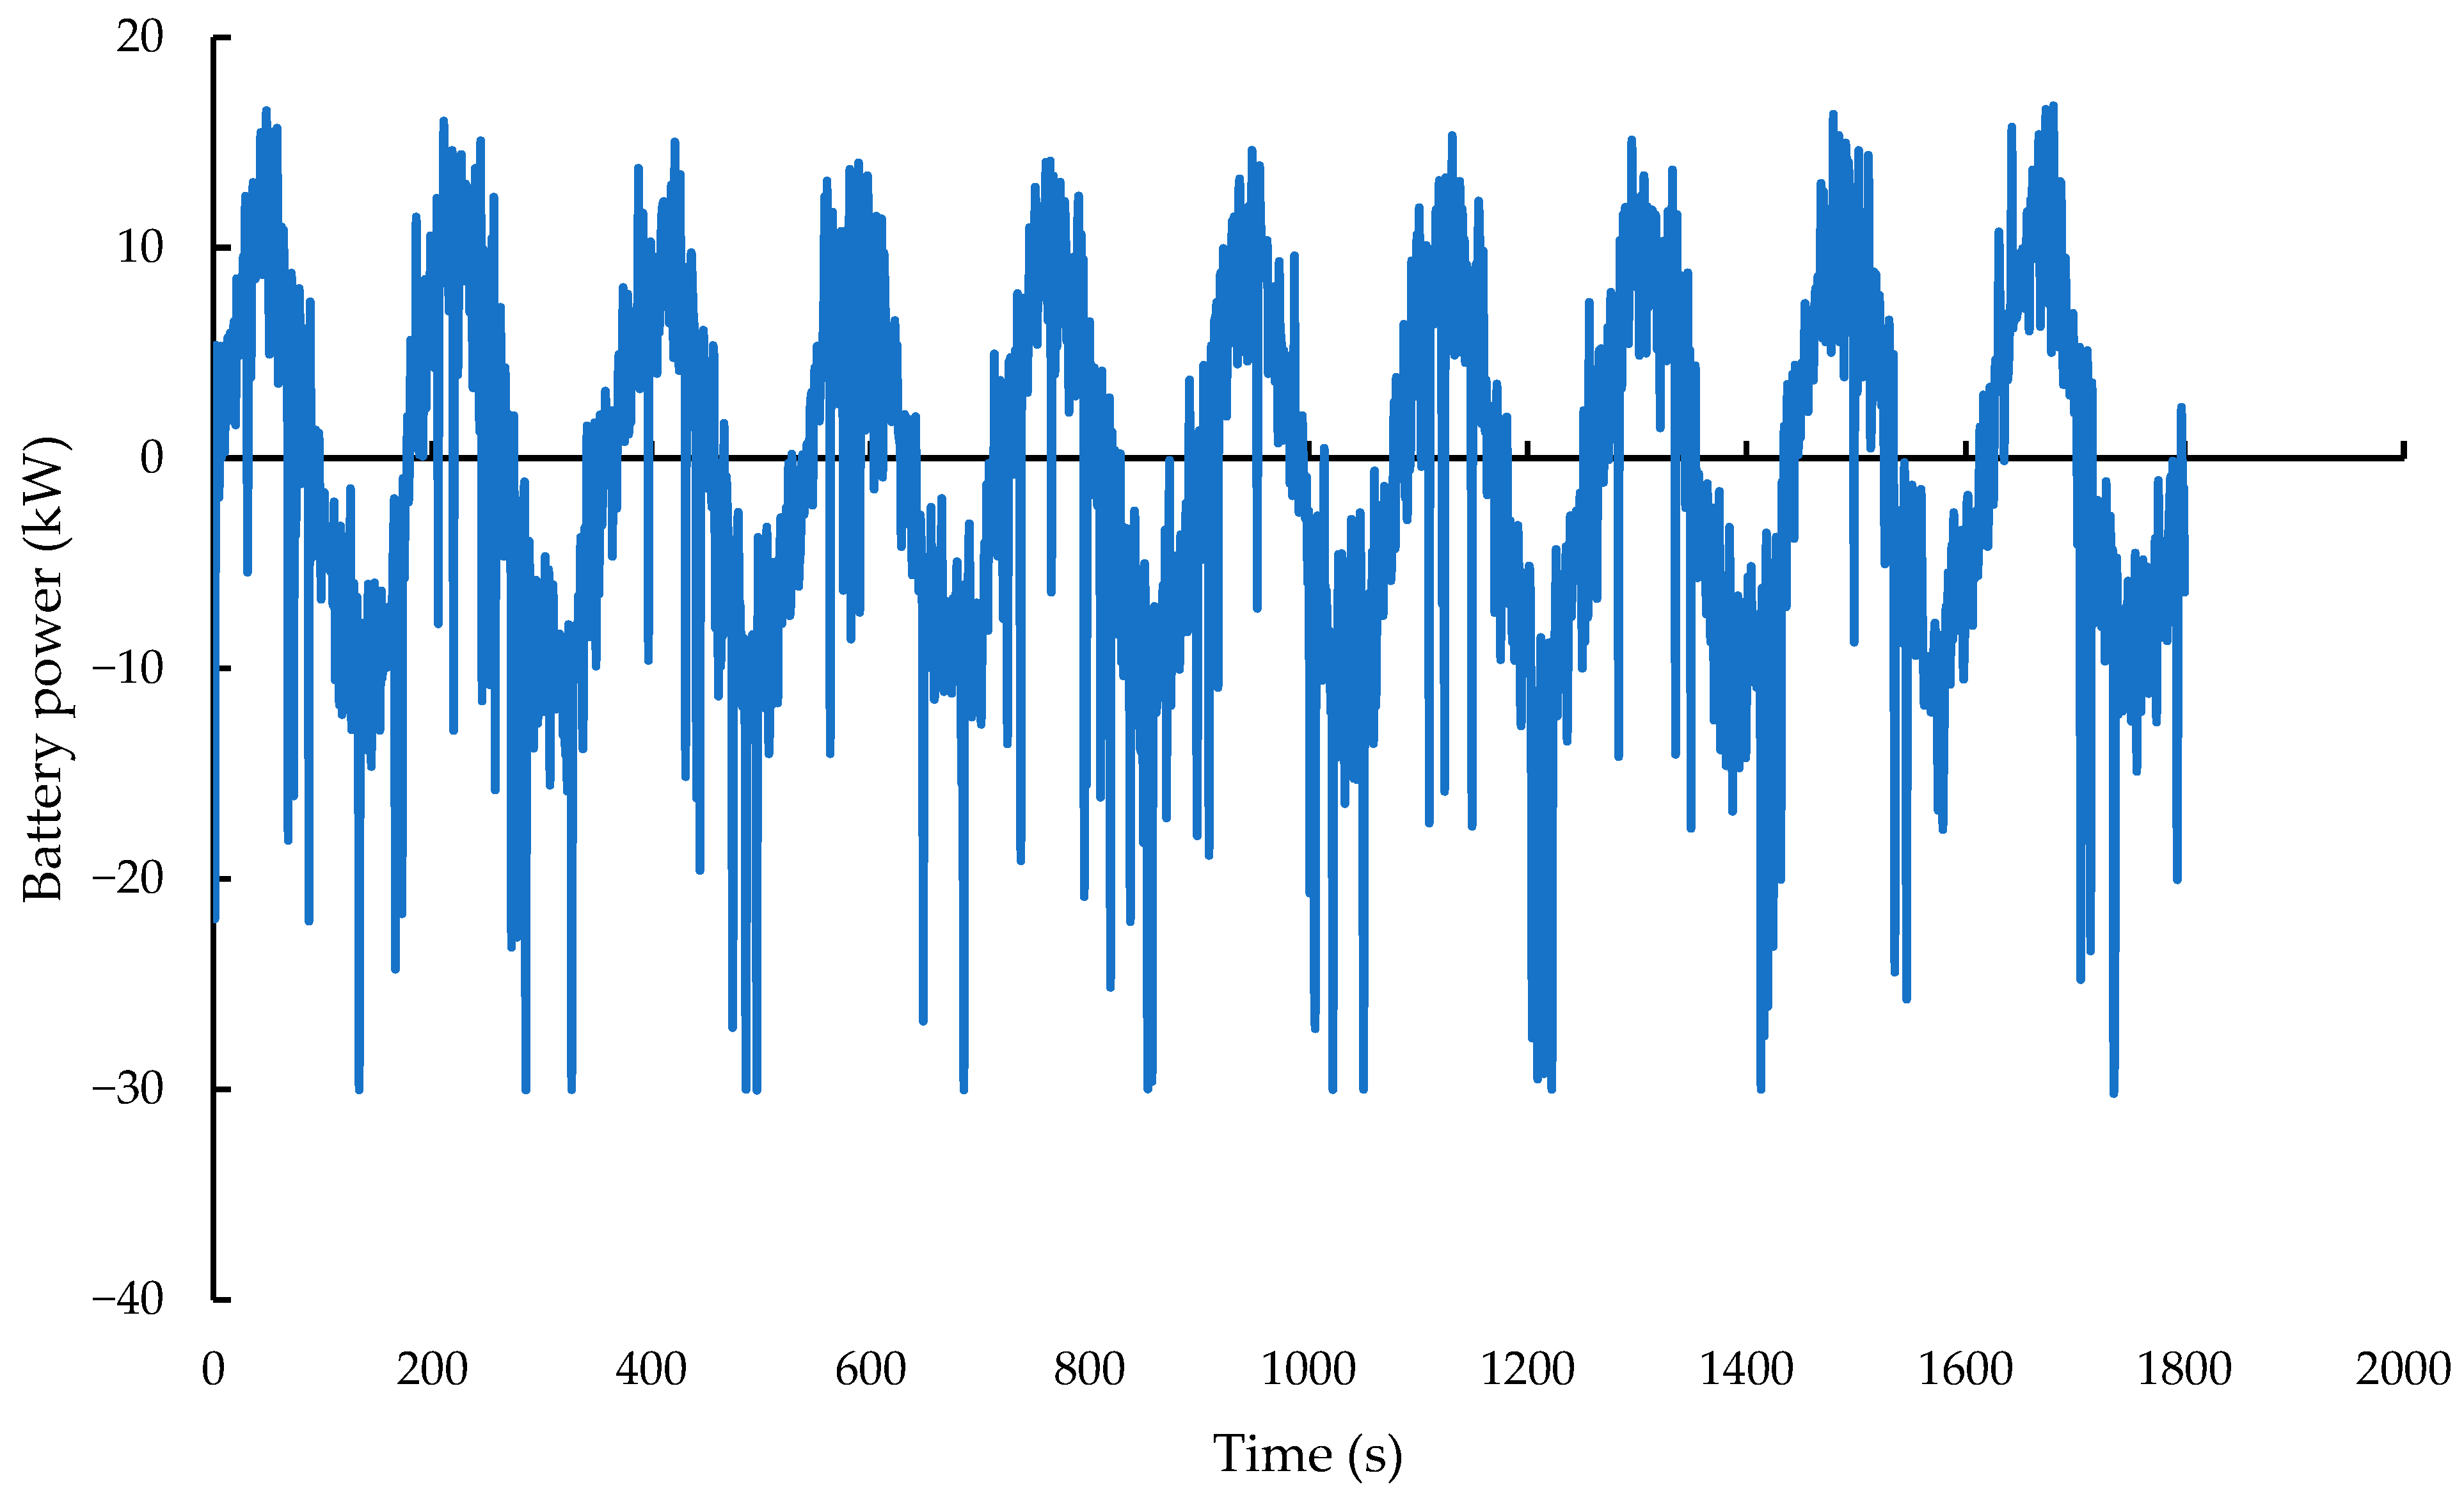
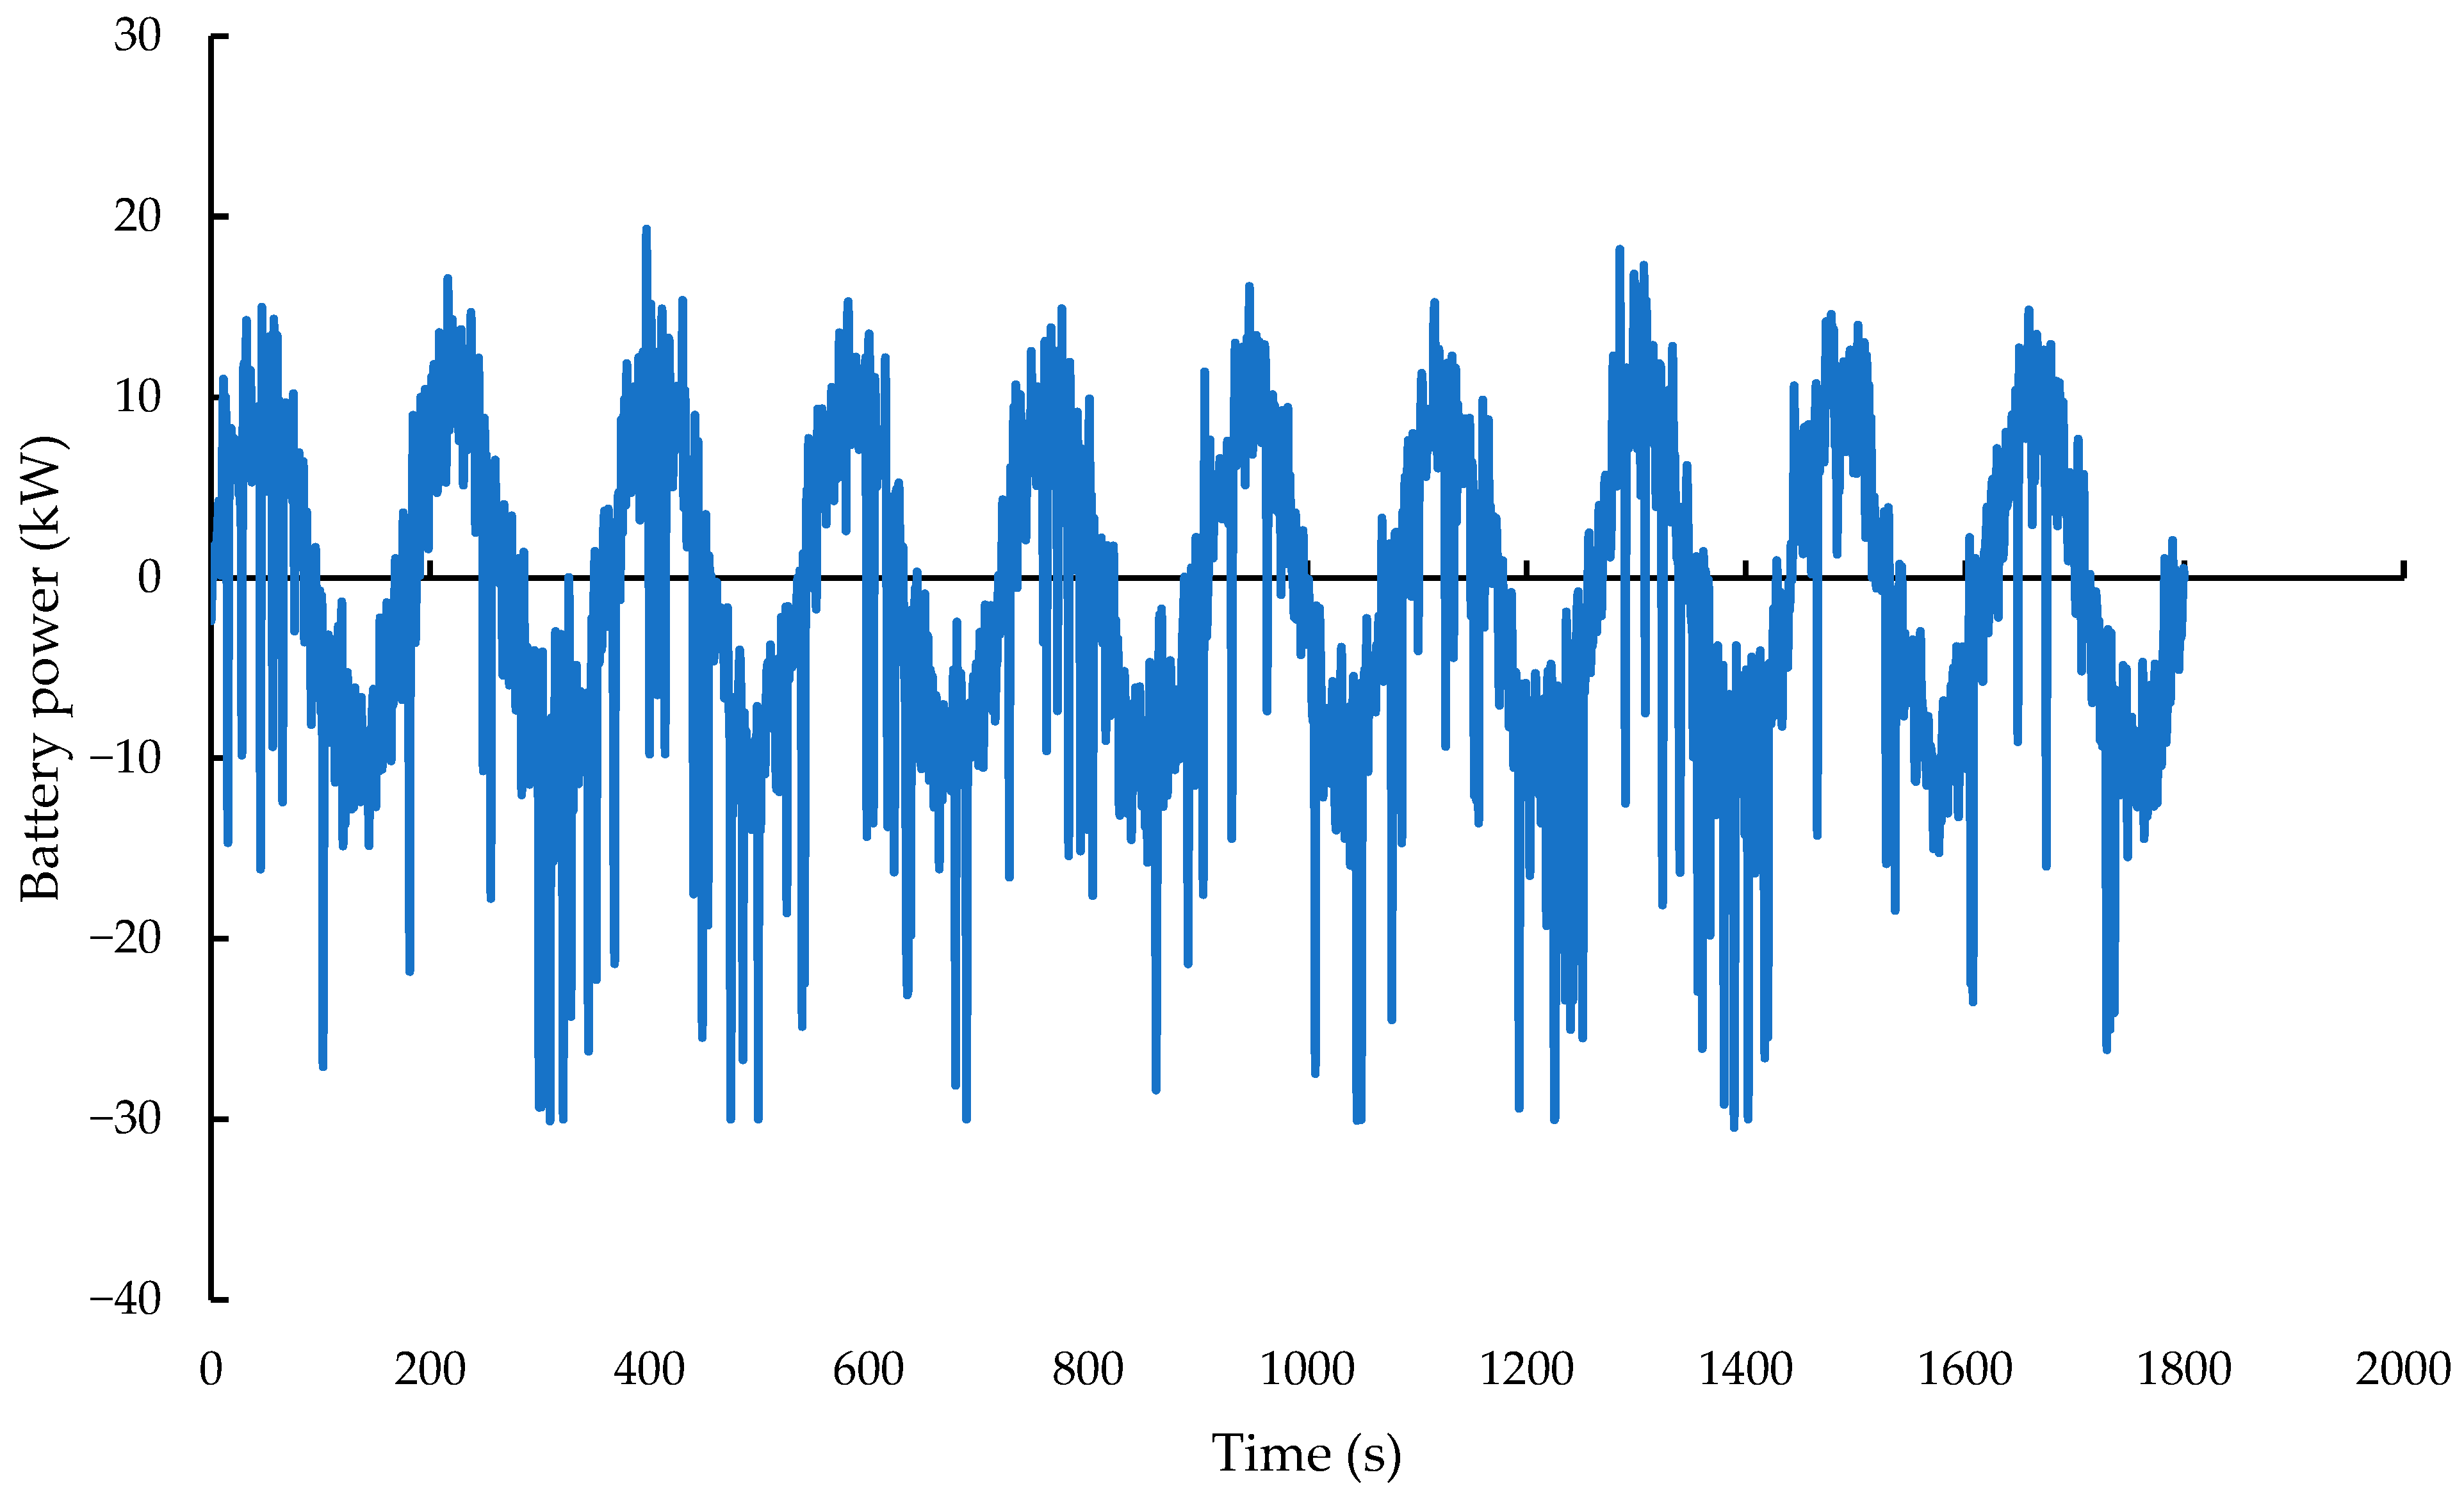
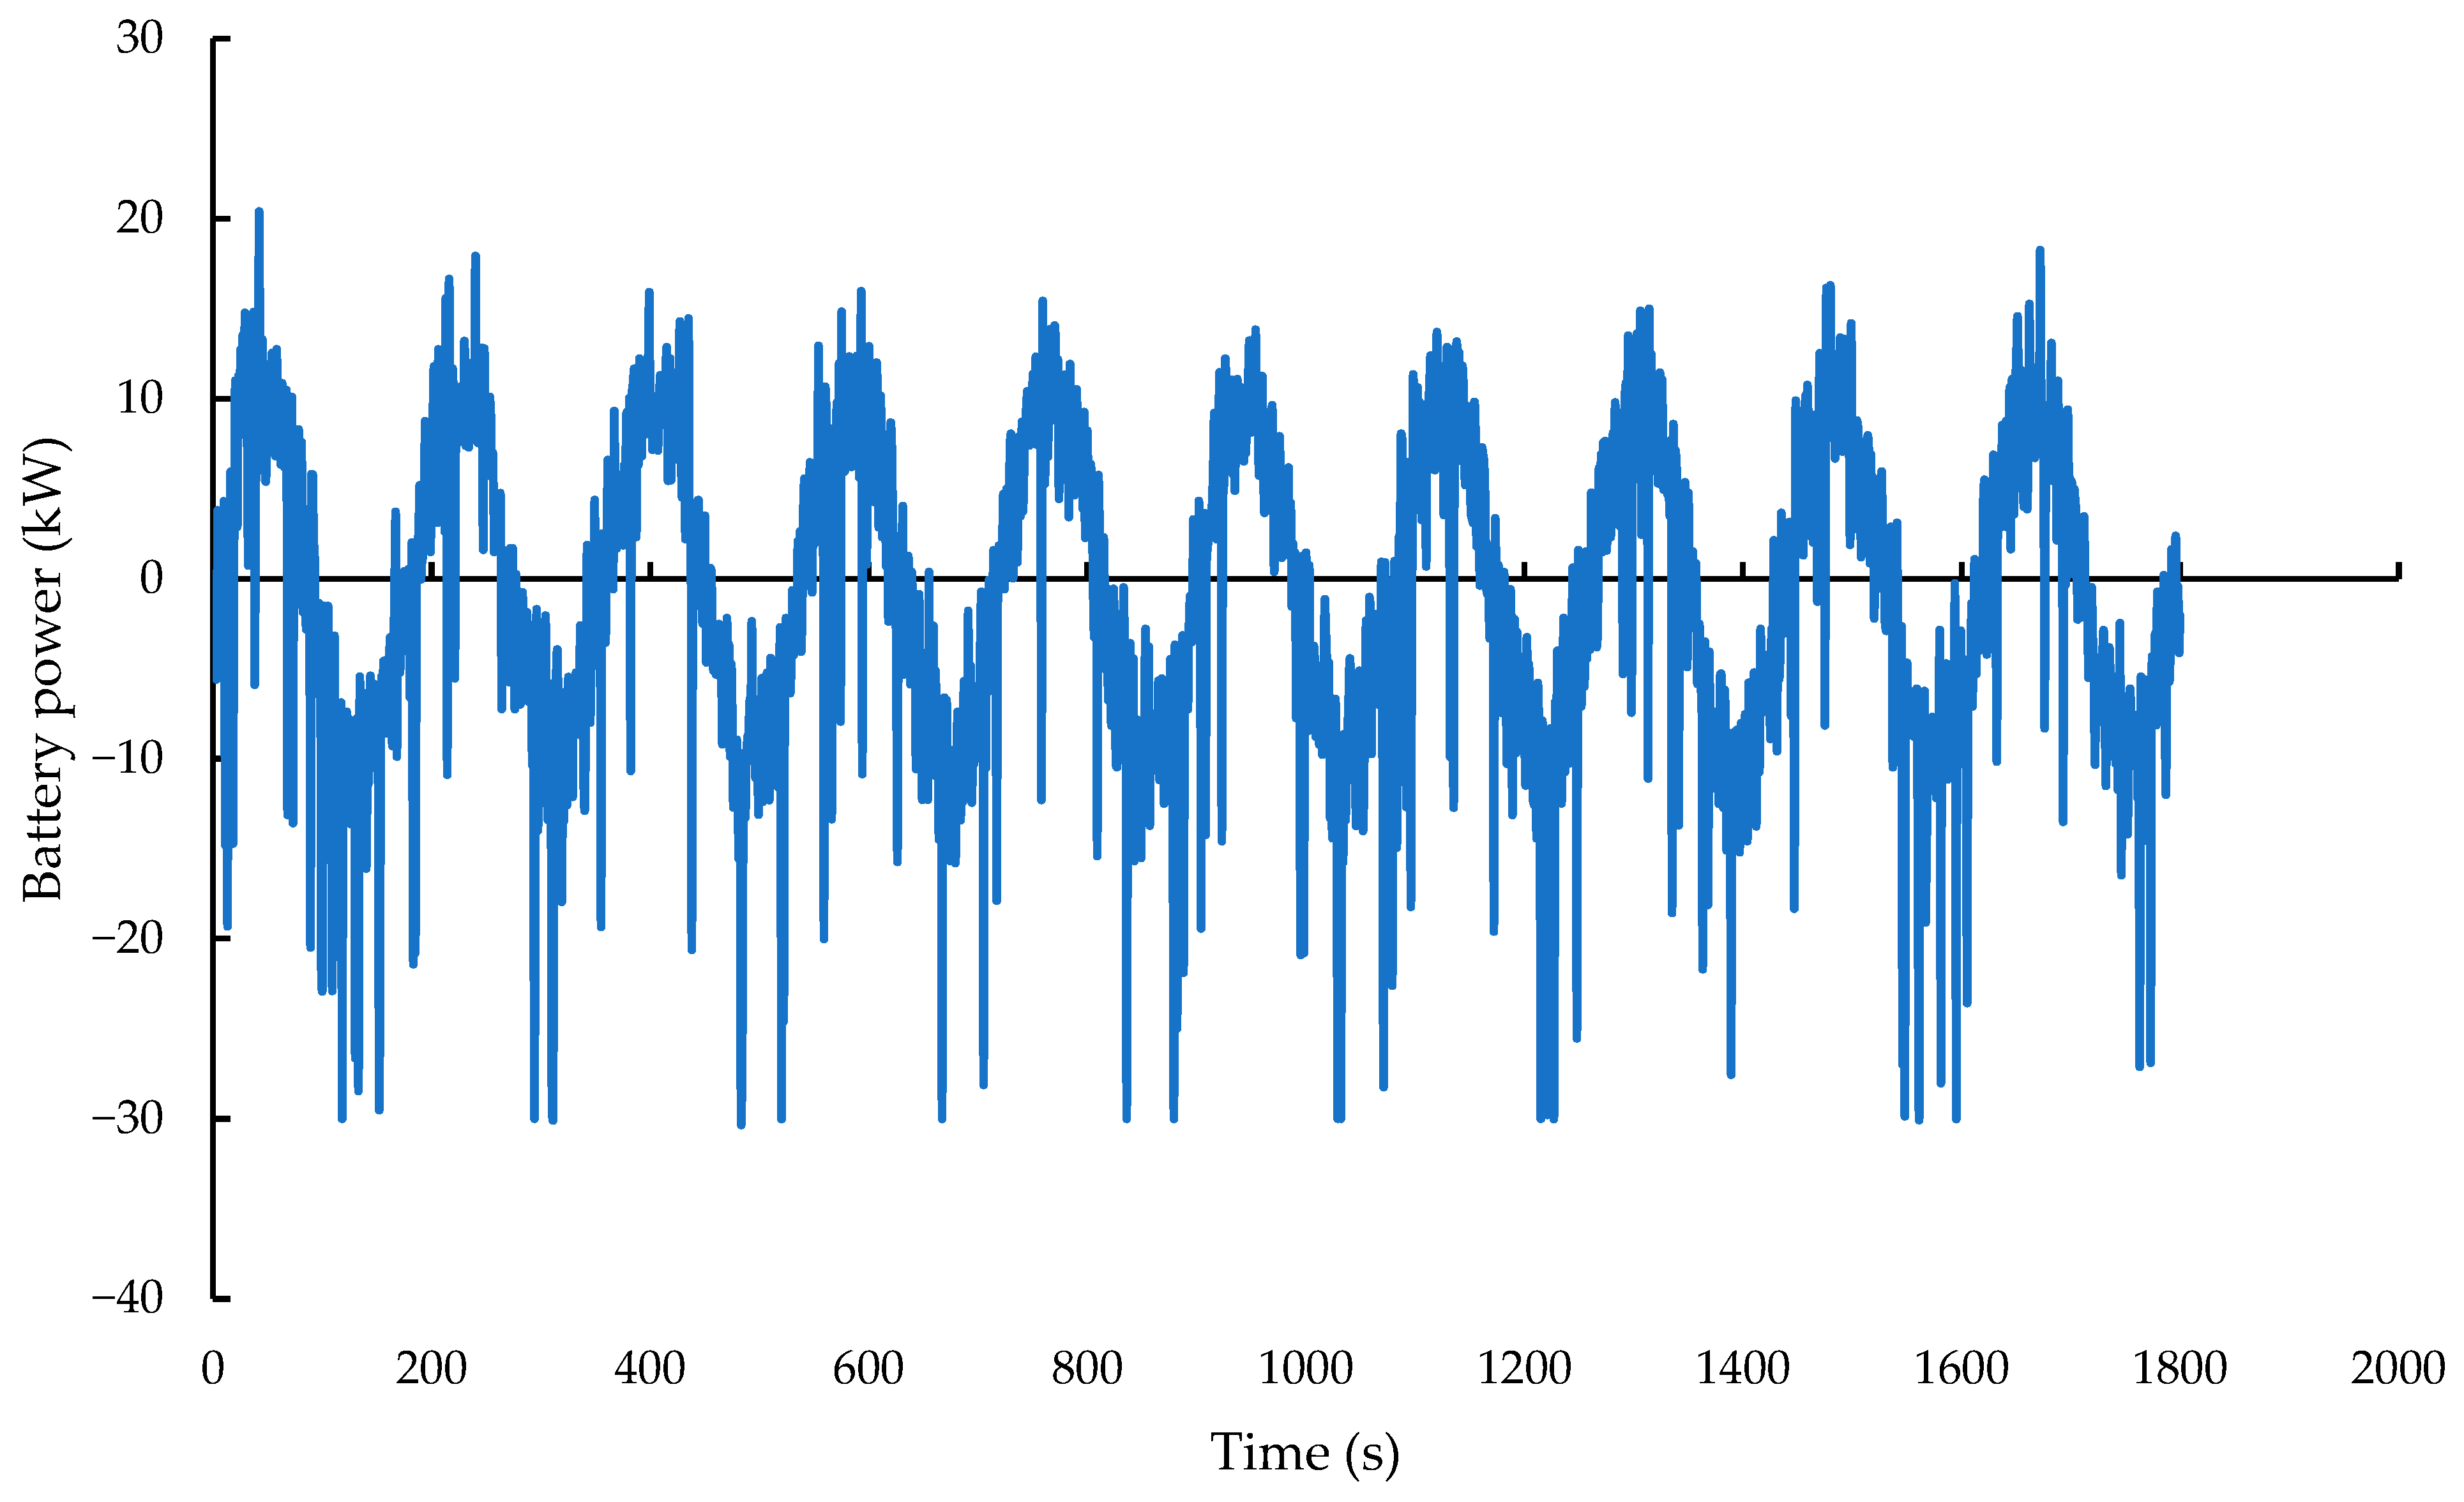
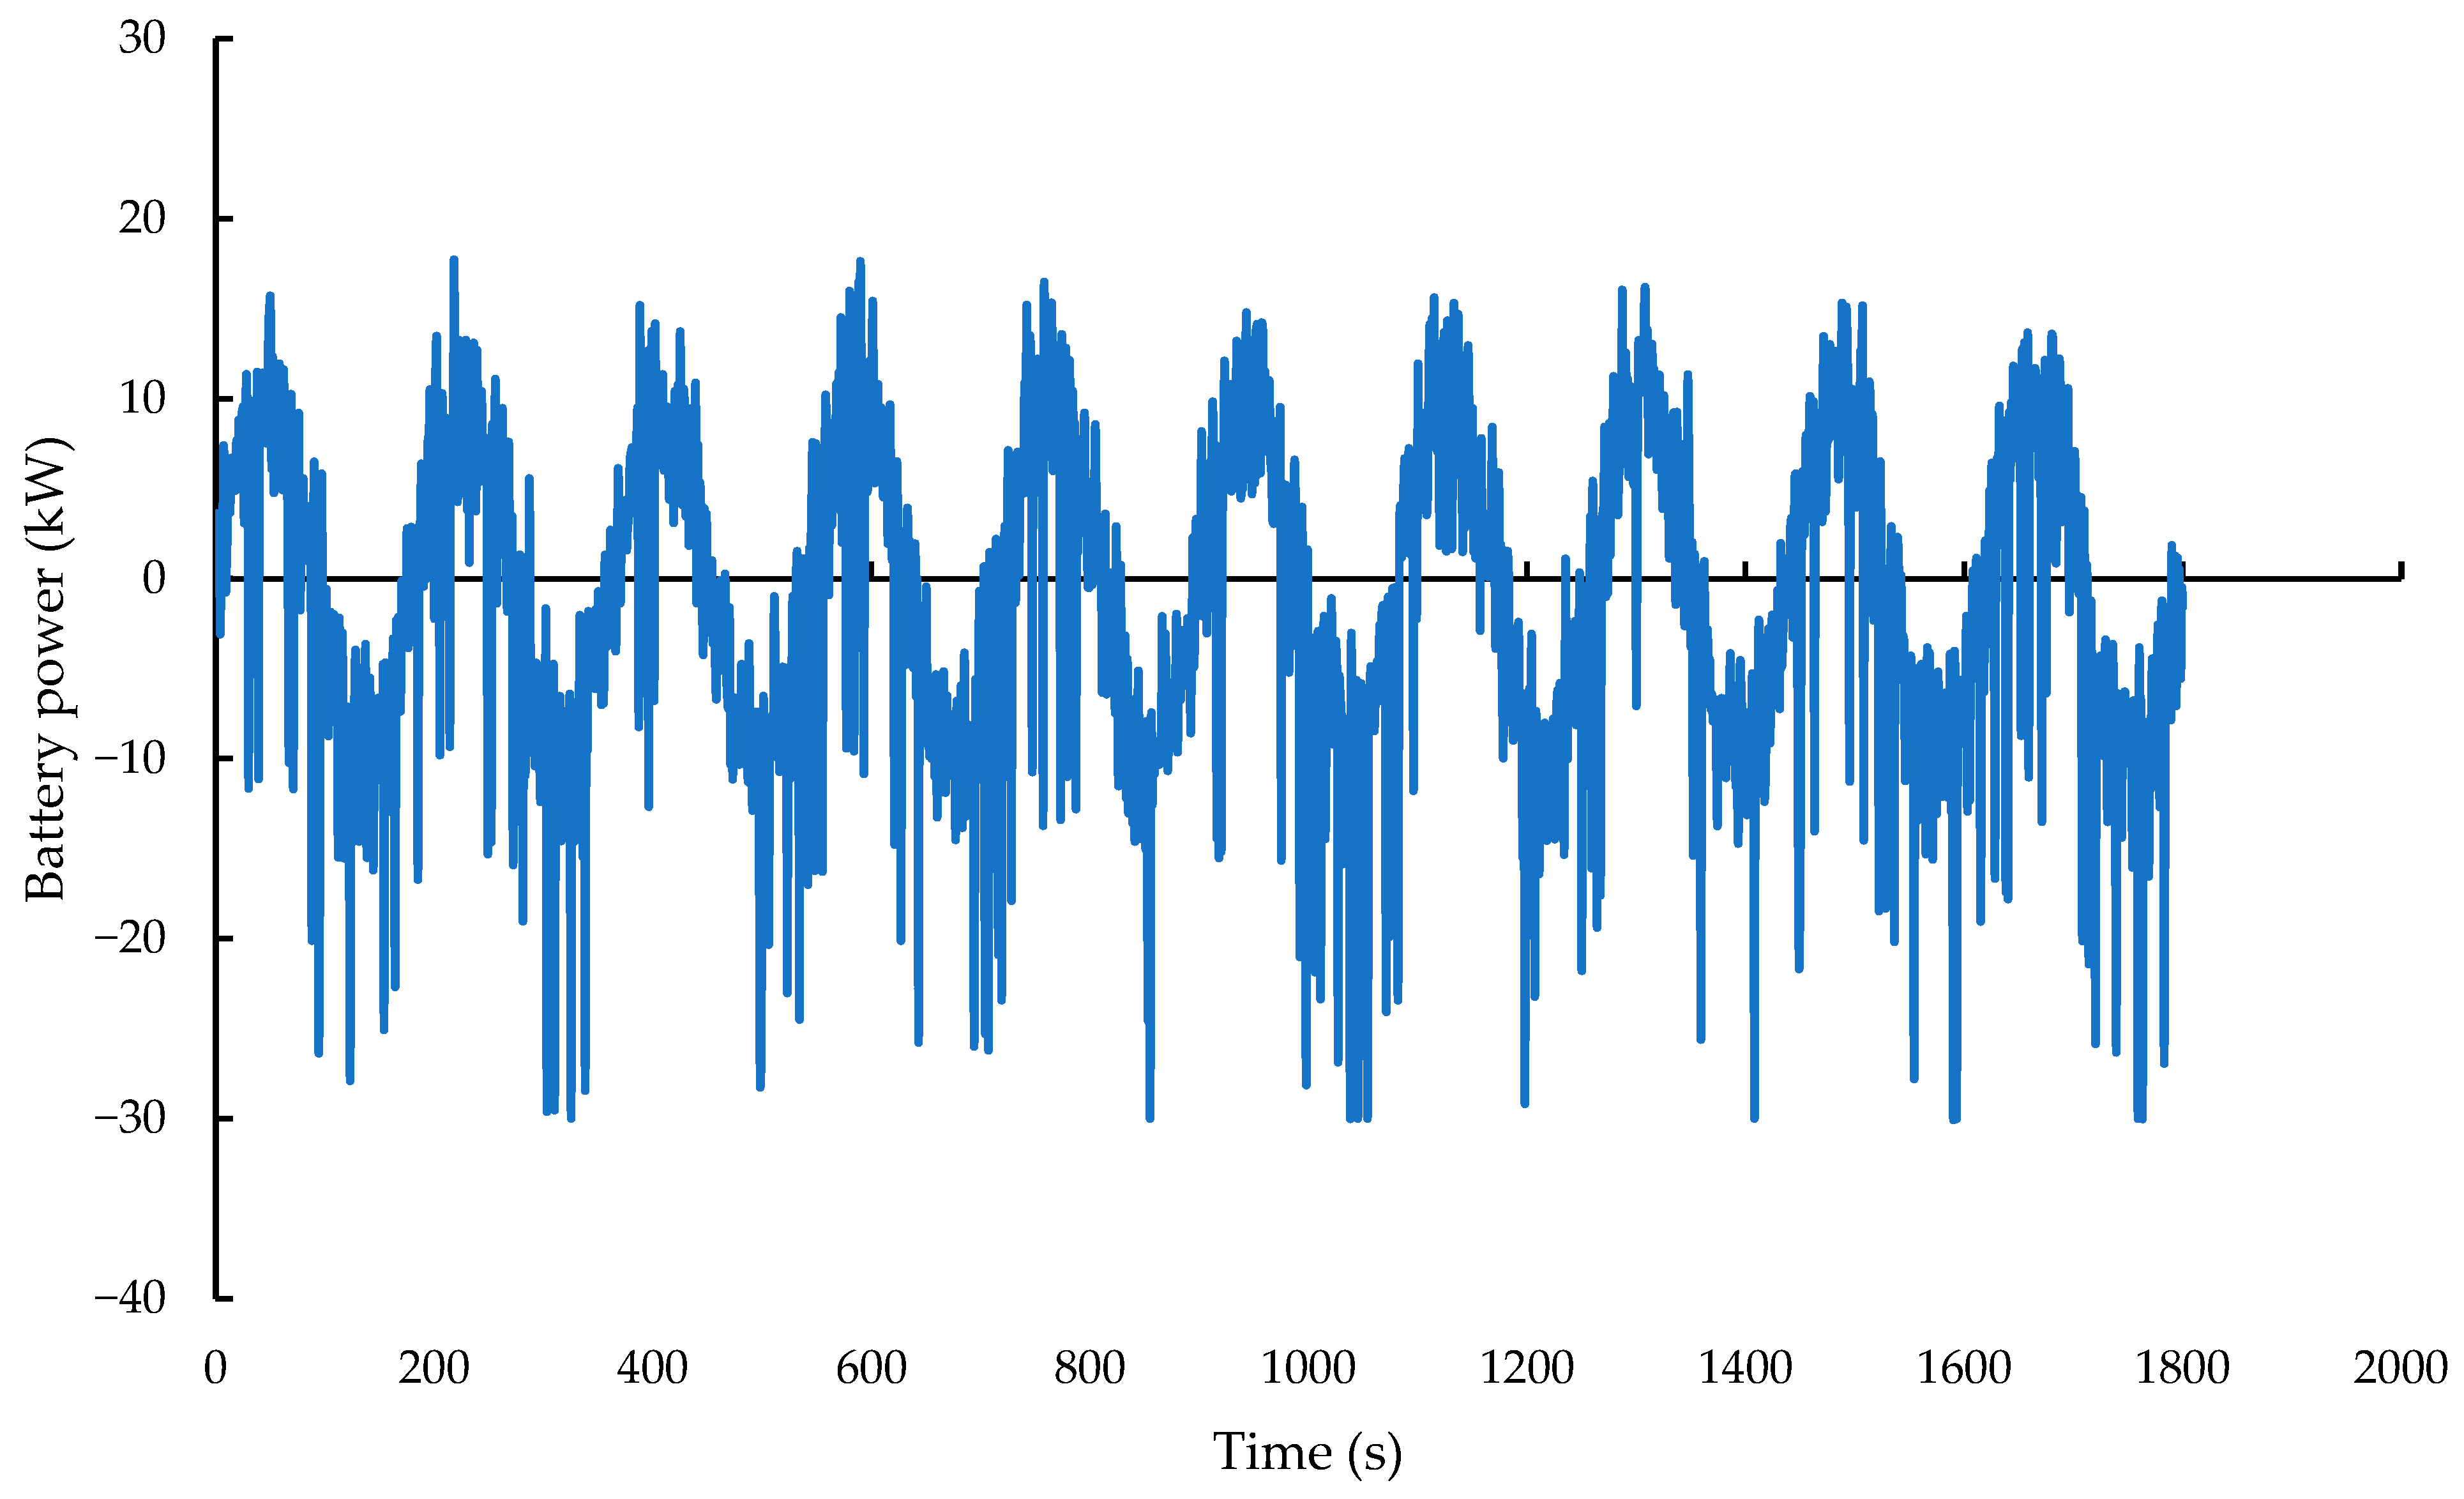
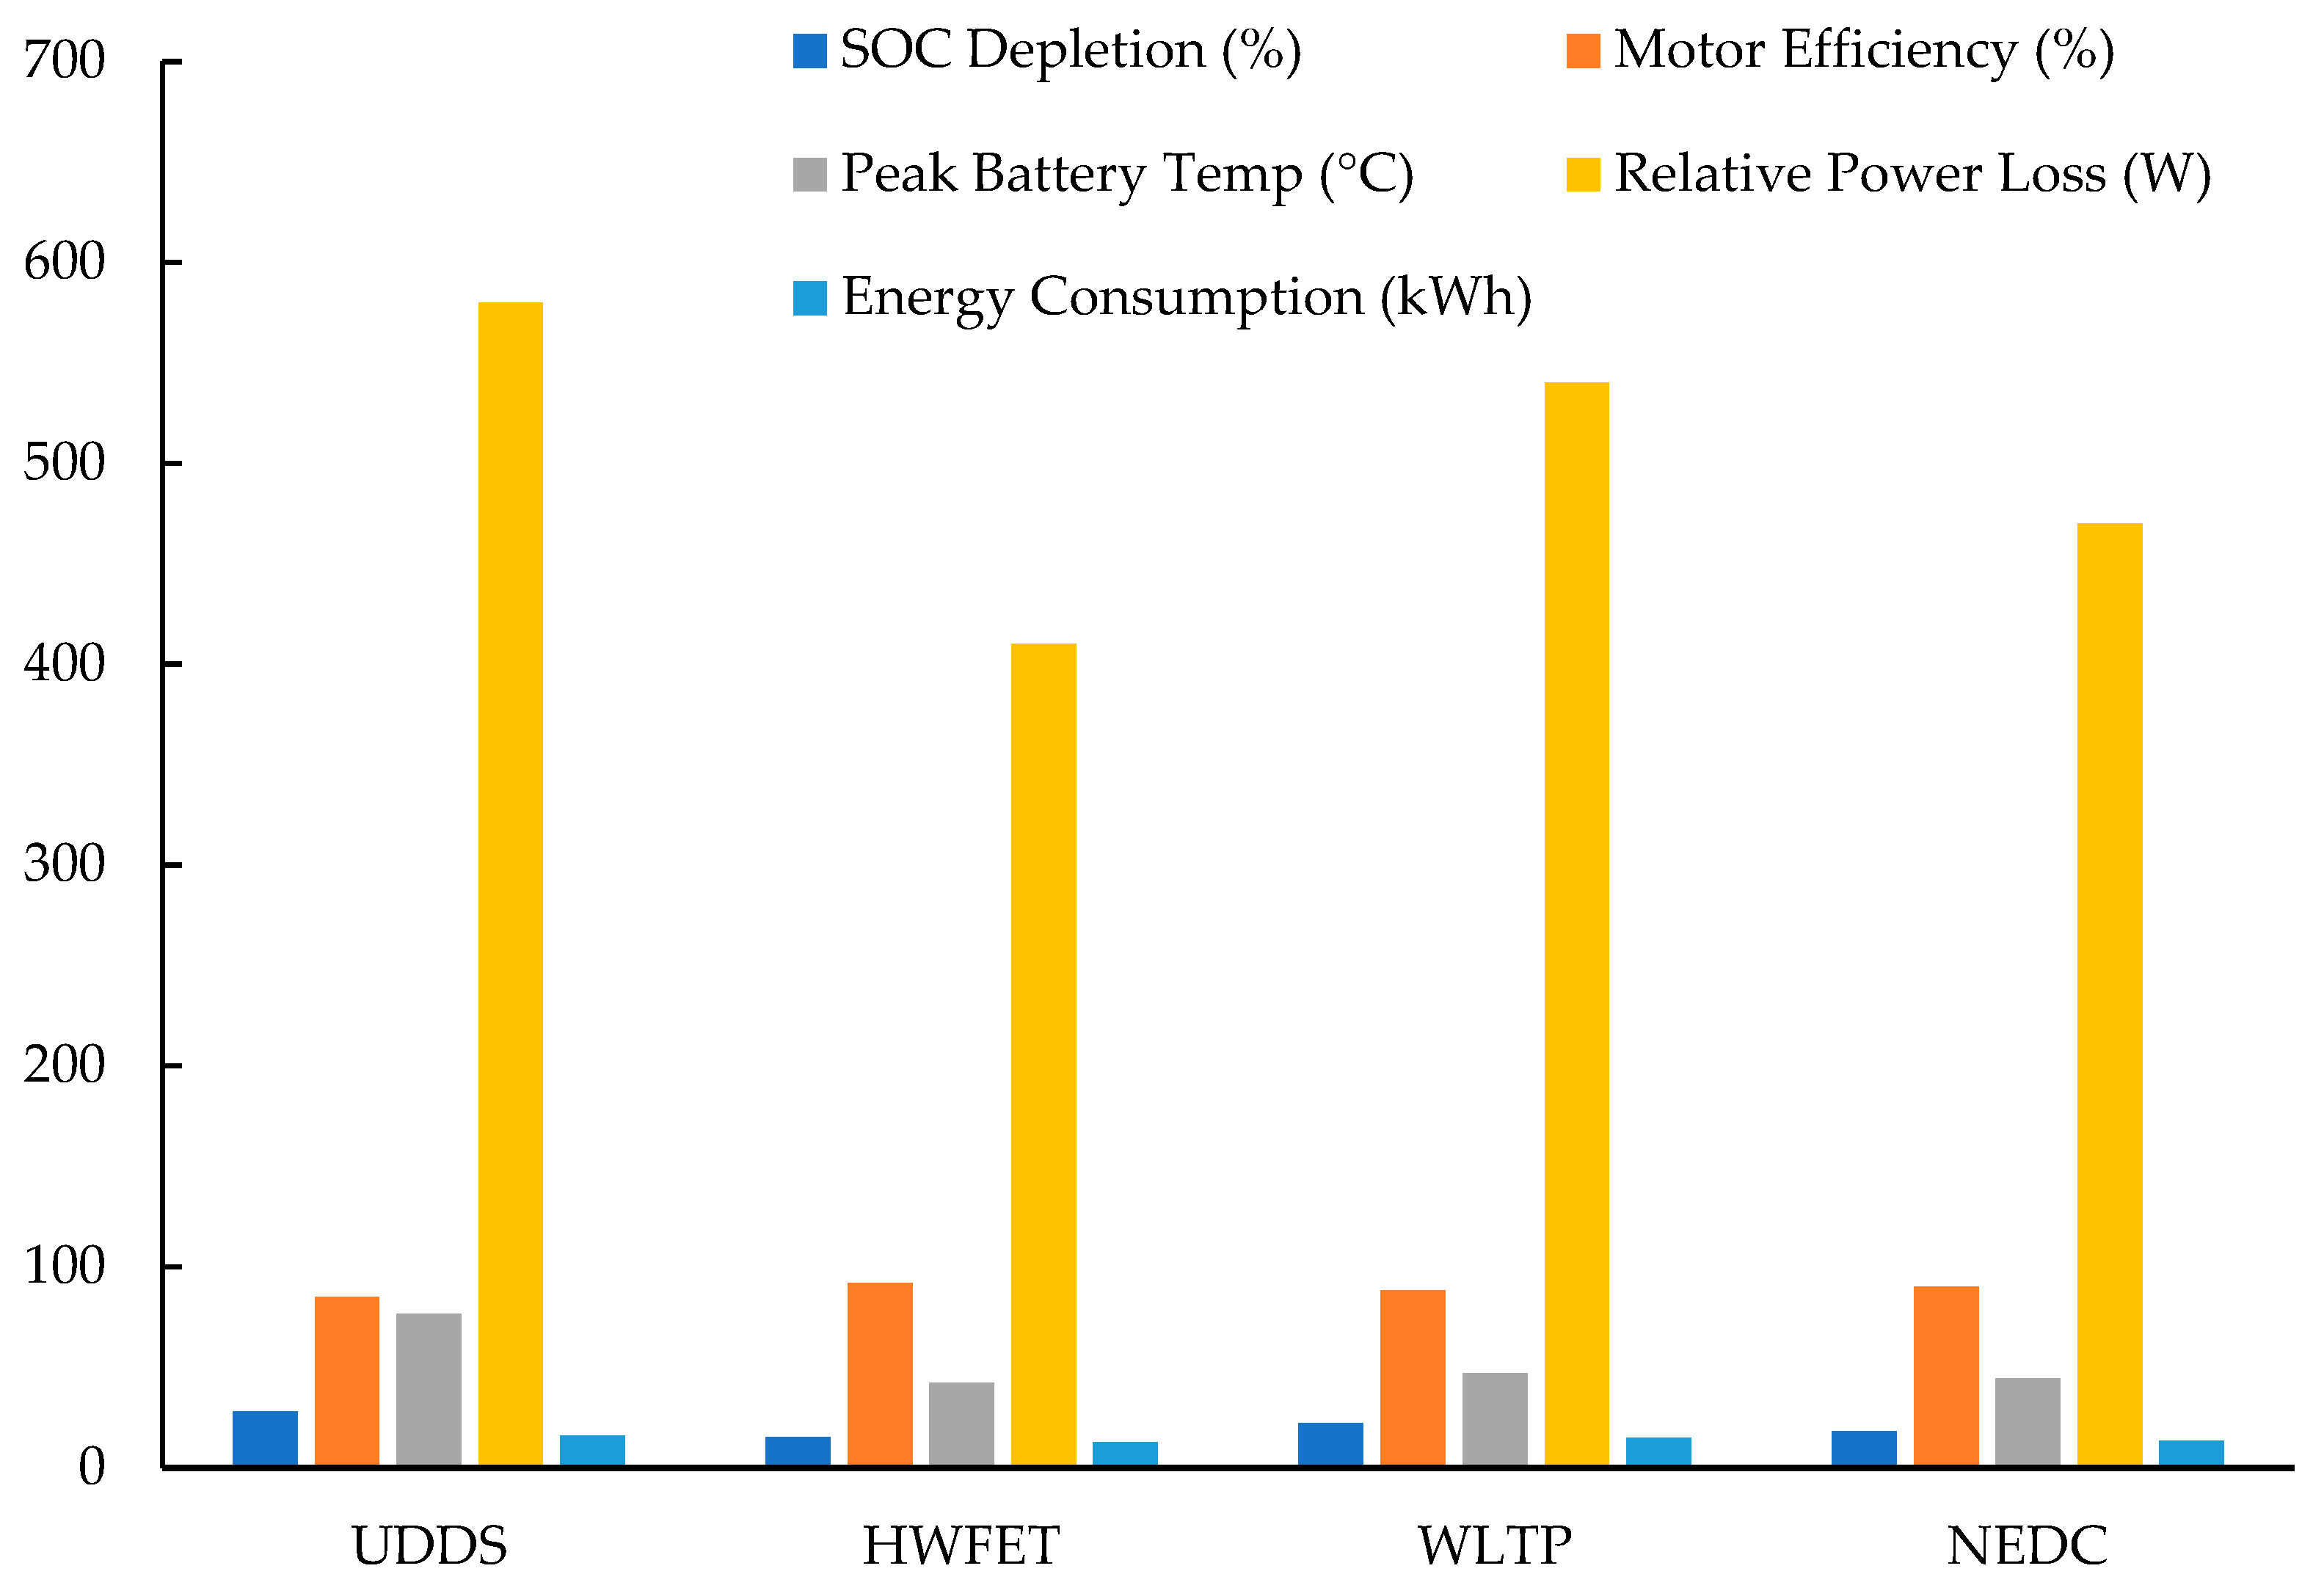
Disclaimer/Publisher’s Note: The statements, opinions and data contained in all publications are solely those of the individual author(s) and contributor(s) and not of MDPI and/or the editor(s). MDPI and/or the editor(s) disclaim responsibility for any injury to people or property resulting from any ideas, methods, instructions or products referred to in the content. |
© 2025 by the authors. Licensee MDPI, Basel, Switzerland. This article is an open access article distributed under the terms and conditions of the Creative Commons Attribution (CC BY) license (https://creativecommons.org/licenses/by/4.0/).