Abstract
This study presents a simulation-based analysis of a steel modular building that integrates technologies that support the energy transition in the built environment. The focus is placed on the implementation of building-integrated photovoltaics (BIPVs), with photovoltaic modules incorporated into the façade and balcony railings. Several modern photovoltaic façade systems were examined. In addition, the study considers the application of photovoltaic glazing enhanced with active quantum coatings. Seven distinct BIPV modules were analysed, each characterised by unique features, with particular emphasis on the influence of colour in tinted variants. A performance degradation analysis was conducted for railing-mounted modules with varying glass tints. The simulation results were correlated with the building’s electricity demand.
1. Introduction
In the face of the progress of climate change and the increase in energy demand, there is a growing need to implement solutions that improve the energy efficiency of buildings and contribute to climate neutrality [1,2,3]. Numerous researchers have employed numerical simulations to identify challenges and verify theoretical assumptions in practical contexts [4,5,6,7,8]. As part of the “Fit for 55” package, the European Union has committed to reducing CO2 emissions by 55% by 2030 [9]. This policy accelerates the transformation of the construction sector towards energy-efficient and low-emission technologies, such as building-integrated photovoltaic (BIPV) and prefabricated systems. The application of photovoltaic technologies in residential construction is becoming a key component of sustainable development strategies. Proper integration of PV systems can significantly enhance the energy performance of buildings [10].
At the same time, modular construction technologies are developing dynamically, offering shorter investment timelines, improved quality control, and a reduced environmental impact of the construction process [11,12,13]. The use of prefabricated modules—particularly in steel structures—is justified by their repeatability, efficiency, and compatibility with modern building systems [14,15,16]. Moreover, prefabricated construction systems can significantly improve the efficiency and sustainability of building projects due to precise manufacturing and assembly processes [17]. Modular construction has evolved over decades in response to the demand for faster project delivery and improved quality assurance [18].
In Poland, the initial implementations of such solutions date back to the second half of the 20th century, primarily in the context of lightweight steel construction. Currently, there is a noticeable increase in interest in prefabrication, not only in residential buildings but also in temporary and commercial facilities [19]. Prefabrication encompasses various levels of organisation of the construction process, ranging from the production of individual components to preliminary assemblies and fully integrated building modules [20,21]. This approach reduces on-site work, increases the repeatability and quality of work, and shortens construction timelines [21,22]. It is being adopted in many countries and sectors, confirming its versatility and development potential [22].
The integration of modular construction with BIPV systems represents an innovative direction in the design and construction of energy-efficient buildings [23], especially in the context of multifamily and collective housing developments [24,25]. However, such solutions require detailed analysis in terms of technical, functional, and energy-related aspects. Key considerations include the appropriate selection of photovoltaic systems, their placement and orientation with respect to cardinal directions, shading conditions, cell efficiency, integration with the building envelope, and the overall impact on the energy balance [18,26,27,28,29,30]. This article focuses on the analysis of modern BIPV solutions and their integration with modular building structures, highlighting approaches that may represent an innovative direction in the design and construction of energy-efficient buildings in the future.
2. Integrated Photovoltaic Systems
One of the key directions in the development of contemporary construction is the integration of renewable energy sources directly into the building structure, as exemplified by building-integrated photovoltaics (BIPVs) [31].
BIPV systems enable the replacement of conventional building materials with components that generate electricity, while simultaneously fulfilling both functional and aesthetic functions [6,16,31,32,33]. As a result, they are gaining increasing popularity in modern residential and commercial building projects, particularly in the context of nearly-zero-energy building (nZEB) standards [33]. Despite numerous advantages, BIPV systems are associated with significant technical and economic limitations. The lack of effective ventilation leads to overheating of the modules and a reduction in efficiency. The complexity of wiring, resulting from the customised nature of each installation, increases costs and complicates maintenance. Additionally, the high initial cost [29], related to non-standard components and demanding installation procedures, poses a barrier to implementation. Over the long term, aesthetic degradation of the modules may also become an issue, negatively affecting the building’s façade appearance and overall architectural perception. As noted in the literature, architects and designers rarely consider access to wiring or mounting elements during the conceptual design stage, which hampers future maintenance and replacement of damaged modules [31]. Moreover, BIPV systems, as external building envelopes, require regular cleaning—the frequency of which depends on climatic conditions and location—since maintaining a clean surface improves performance and slows down the rate of degradation [31].
2.1. Photovoltaic Ventilated Façade
A ventilated photovoltaic façade can be implemented in both newly constructed buildings and the thermal retrofitting of existing structures. The technical parameters of such systems are presented in Table 1. These modules can be integrated with various types of curtain wall systems. Ventilated façades consist of an insulation layer and an external cladding, separated by a ventilation gap. One of the main advantages of this system is the improvement of the thermal performance, which consequently reduces the risk of condensation of water vapour. Thus, a single component serves the dual function of providing weather protection and generating electricity for the building [24].

Table 1.
Technical parameters of the ventilated photovoltaic façade [34].
2.2. Photovoltaic Curtain Wall Façade
The façade of the photovoltaic curtain wall is a skeletal structure composed of horizontal and vertical profiles. It enables the creation of an aesthetically pleasing façade for various types and allows for the complete or partial fulfilment of the building’s energy demand of the building. These systems provide excellent thermal insulation, effectively protecting the interior from heat loss during winter and from overheating in summer. The technical parameters of the system are presented in Table 2. Due to the curtain wall façade, energy losses are reduced, resulting in lower heating and cooling demands and measurable energy savings. The system is characterised by low weight, good thermal insulation, and transparency. It is particularly recommended for large-area buildings but can also be applied in smaller structures, such as single-family houses [35].
Table 2.
Technical parameters of the photovoltaic post-and-beam façade [34].
2.3. Photovoltaic Façade Louvers
Photovoltaic façade louvers are systems designed not only to protect the interior from excessive solar radiation and overheating but also to reduce carbon dioxide emissions, often associated with the operation of systems such as air conditioning.
Two main variants of photovoltaic louver systems can be distinguished: fixed and movable. They typically take the form of slats integrated with PV modules. The technical parameters of these systems are presented in Table 3. Photovoltaic cells are embedded in the glass surfaces of louvers, which are mounted on aluminium structures and can be installed either on curtain wall façades or directly on the building envelope.
Table 3.
Technical parameters of the photovoltaic sunshades [34].
Movable louver systems allow one to adjust the tilt angle of the PV modules in response to the direction of solar radiation. A key advantage of this system is its ability to maximise solar energy utilisation. The tilt angle can be adjusted manually or automatically through control systems. Sensors provide data on wind, precipitation, and solar irradiance. In particular, louvers can respond autonomously to prevailing weather conditions—for example, by automatically removing snow [35,36,37].
2.4. Photovoltaic Balustrades
Photovoltaic balustrades represent an innovative architectural solution that combines user safety with energy generation functionality. These transparent barriers, designed to prevent falls from height, comply with the requirements of TRAV (Technische Regeln für absturzsichernde Verglasungen) due to the use of symmetrically constructed tempered and laminated safety glass (ESG + VSG).
To ensure safety, glass–glass technology is employed, which involves the lamination of two glass panes. Balustrade elements can be mounted using various systems, including wedge, pressure, or point fixings, allowing flexible adaptation to specific design and technological requirements.
The electricity generated by the balustrades can be used locally to power lighting, equipment, or charging systems, or it can be directed to energy storage systems, thus increasing the building’s energy autonomy of the building [35].
The technical parameters of this solution are presented in Table 4.
Table 4.
Technical parameters of the photovoltaic balustrades [34].
2.5. Glazing with an Active Quantum Dot Coating
An additional contemporary solution involves the use of glazing with an active quantum dot coating. Although it appears to be conventional, this type of glass performs all standard functions—such as providing thermal, wind, and precipitation protection, noise reduction, and natural daylighting—while also generating electricity from solar radiation.
A key advantage of this technology is that, visually, it is indistinguishable from traditional window glazing thanks to the application of the quantum dot layer. This coating functions as a spectral filter: it transmits visible light while converting harmful infrared and ultraviolet radiation into electrical energy.
The glass has a high thermal insulation coefficient and excellent light transmittance. The technical parameters of this solution are presented in Table 5.
Table 5.
Technical parameters of the glass with an active quantum coating [34].
An additional benefit includes the reduction in interior overheating and the mitigation of the urban heat island effect. This solution serves as a supplementary source of renewable solar energy [35,36].
3. Materials and Methods
3.1. Subject of Research
The analysis covered a modular steel building by Climatic, located in Kobyłka, Poland (Figure 1). The external walls of the modules are constructed using cement-bonded particleboards with a minimum thickness of 16 mm or 24 mm. The internal partitions consist of Fermacell boards and are insulated with mineral wool. The thermal transmittance for partitions is as follows:
- U ≤ 0.17 W/(m2·K) walls.
- U ≤ 0.12 W/(m2·K) roof.
- U ≤ 0.23 W/(m2·K) floor.

Figure 1.
Modular building structure in the analysed case; the arrow indicates the location of the wall-mounted panels [38].
Figure 1.
Modular building structure in the analysed case; the arrow indicates the location of the wall-mounted panels [38].

The materials used in the modular construction exhibit high resistance to moisture, as confirmed by the following parameters:
The swelling after 24 h, according to EN 317 [39], does not exceed 1.5%.
- Durability under cyclic moisture tests, i.e., reduction in tensile strength after testing according to EN 319 and EN 321 [40,41], does not exceed 0.3 N/mm2.
- The swelling after cyclic testing, according to EN 317 and EN 321 [39,41], does not exceed 1.5%.
In modular buildings, high-performance heating, cooling, and ventilation systems have been installed. In addition, alternative primary energy sources are utilised, complemented by energy-efficient LED lighting.
An analysis of the building was conducted using a ventilated photovoltaic façade installation (Figure 2), which proves to be highly suitable for implementation on an existing building.
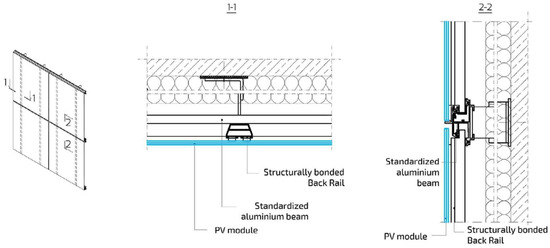
Figure 2.
Diagram of ventilated photovoltaic façade installation [34].
An analysis was performed for the building, which was based on a comparison of annual energy yield, type and power of modules, surface area, and location of the system. Exposure to the cardinal directions, the impact of solutions on aesthetics, and the possibility of balancing energy in the building were also taken into account.
3.2. Assumptions Used in the Analysis
To evaluate the energy performance of the building-integrated photovoltaic (BIPV) system—taking into account the geometry, orientation, and local environmental conditions of the building—a three-stage computational approach was adopted, consisting of the following:
- (1)
- Solar exposure analysis in an Autodesk RevitA 3D model of the building was utilised to perform solar exposure analysis, taking into account geometry and surrounding shading. This allowed identification of the most favourable surfaces for BIPV integration.
- (2)
- Analytical calculations: The energy yield was estimated using a formula incorporating solar irradiation, PV module rated power, system losses, and Standard Test Conditions (STCs). This enabled a comparative assessment of different panel arrangement scenarios and their energy potential.
- (3)
- PVGIS System: The Photovoltaic Geographical Information System (PVGIS) was used to simulate the annual energy output based on real climatic data and system-specific parameters. The output served to validate the analytical calculations.
The combined model integrates geometric, climatic, and spatial analysis [31], allowing for a reliable comparison of the energy performance associated with various BIPV implementation strategies. This methodology is applicable both in the design phase [25] and in the evaluation of retrofit projects that involve existing buildings [42].
In the analysis, the boundary conditions were assumed to be uniform for each variant:
- System losses were assumed at the level of 15%;
- Mounting position was considered as building-integrated photovoltaics (BIPVs);
- Tilt angle of 90°;
- Solar irradiance under which the modules were tested: 1000 W/m2.
Other boundary conditions depended on the orientation of the PV modules in relation to the cardinal directions. These included the following.
- Solar irradiation on a horizontal surface—obtained from solar irradiation maps: Photovoltaic Geographical Information System (PVGIS). Its value depends on the orientation of PV modules relative to the cardinal directions. The values adopted for the calculations were as follows:
- ○
- Modules facing E 85°—658 kWh/m2.
- ○
- Modules facing NE 65°—533 kWh/m2.
- ○
- Modules facing SE 155°—944 kWh/m2.
- Correction factor—obtained from the correction factor table; its value depends on the tilt and azimuth of the PV modules.
- Azimuth of the PV modules.
System losses were accounted for at a level of 15%. These losses primarily result from cable losses, inverter losses, temperature-related losses, losses due to operation under low solar irradiance, shading and soiling losses, current mismatch between modules, and losses on bypass diodes.
In the analysis, a surplus of photovoltaic system production in the range of 10–20% relative to annual energy consumption was assumed. This approach is commonly applied in design practice, as it allows for flexibility in case of future increases in energy demand, e.g., through the installation of a heat pump, an electric vehicle, or other high-consumption devices, without the need to expand the PV system itself. Moreover, it provides a buffer in the event of unforeseen system losses.
The 10–20% range represents a compromise between investment cost-effectiveness and minimising the risk of energy surpluses. Oversizing above 20% without energy storage may lead to significant feed-in of excess energy to the grid, extending the payback period and reducing the economic efficiency of the system.
In situations where PV system production exceeds the assumed threshold, the implementation of energy storage or the increase in self-consumption through the integration of additional loads may enable the economic utilisation of surplus energy without reducing the system’s capacity.
An energy audit was conducted to determine the electricity consumption of a four-story steel-frame modular building designed for collective residential occupancy, with a capacity of up to 150 people. The total calculated annual energy consumption per unit area was 3.93 kWh/m2·year. Based on the total floor area, the overall annual electricity demand was calculated as follows:
- Energy Yield Calculation for the Considered Variants
- Variant 1—PV modules with a rated power of 400 W.
- Variant 1A—PV modules with a rated power of 400 W + PV railings with a rated power of 200 W.
- Variant 2—Red PV modules with a rated power of 240 W.
- Variant 2A—Red PV modules with a rated power of 240 W + PV railings with a rated power of 200 W.
- Variant 2B—Red PV modules with a rated power of 240 W + PV railings with a rated power of 160 W.
- Variant 3—Grey PV modules with a rated power of 290 W.
- Variant 3A—Grey PV modules with a rated power of 290 W + PV railings with a rated power of 200 W.
- Variant 3B—Grey PV modules with a rated power of 290 W + PV railings with a rated power of 160 W.
- Variant 3C—Grey PV modules with a rated power of 290 W + PV railings with a rated power of 140 W.
- Variant 4—Green PV modules with a rated power of 290 W.
- Variant 4A—Green PV modules with a rated power of 290 W + PV railings with a rated power of 200 W.
- Variant 4B—Green PV modules with a rated power of 290 W + PV railings with a rated power of 260 W.
- Variant 5—PV modules with a rated power of 470 W.
- Variant 6—PV modules with a rated power of 480 W.
Table 6 presents the mechanical parameters of each type of PV module type, along with the calculated energy yields for the south-facing orientation, identified as having the highest solar potential. On the basis of the simulation results, the minimum total required module power was determined, enabling the calculation of the maximum feasible number of photovoltaic modules. It can be concluded that installing modules on the south-facing façade ensures compliance with the minimum energy yield requirement despite variations in module quantity. Within the set analysed, modules rated at 480 W are the least numerous, whereas green modules represent the majority. The variety of module types allows flexible configurations for integrating PV elements on both walls and balustrades, allowing for diverse installation arrangements.
Table 6.
Table of mechanical parameters and energy yields for different PV modules. Own elaboration.
Table 7 summarises the key technical parameters of photovoltaic blinds, enabling an assessment of their energy potential and installation possibilities. These parameters serve as an important reference point when selecting the appropriate configuration of a BIPV system integrated with the building façade.
Table 7.
Table of mechanical parameters of the photovoltaic sunshades [34].
Analysing the energy yield revealed that, owing to the flexibility in the dimensions of individual louvers and adjustable power ratings, a wide range of configurations is possible, enabling versatile adaptation of module power. Consequently, it can be assumed that the energy yield requirements are satisfied.
The subsequent solution examined was photovoltaic glass featuring an active quantum dot coating, with its technical specifications detailed in Table 8.
Table 8.
Technical parameters of the glass with an active quantum coating [34].
In the case of glass with an active quantum dot coating, because of the relatively low power output of these solutions, it was determined that they are better suited as an auxiliary source of solar energy rather than as a primary one. Taking into account the minimum required power for the PV modules, the necessary glazing area was calculated to allow the generation of free energy exclusively through this solution. The required area is 283.7 m2, which is quite large but feasible. Such solutions could prove effective on glazed façades of high-rise buildings, such as office towers. In residential buildings, however, the total glazed area within the external envelope is usually too limited to allow for the installation of the required surface area of glass with an active quantum dot coating. However, for this type of façade, the previously discussed installation of photovoltaic modules represents a more efficient solution.
4. Research Results
4.1. Insolation
To enable analysis aimed at maximising solar energy capture, numerical simulations of solar exposure were conducted using Autodesk Revit software, version 2023. According to the site development plan, the front façades face southeast and northeast, while the courtyard-facing walls are orientated toward the southwest and northwest. The window bays protruding from the façade are oriented eastward. The highest solar energy gains can be achieved from the south, whereas the lowest are from the north [36,43,44]. The analysis assumptions included, among others, the building’s location, its orientation relative to the cardinal directions, geographic coordinates, date, and time, as well as the sun’s angle and azimuth for the specified day and hours. Figure 3 and Figure 4 illustrate the solar exposure of the building at noon on both the longest and shortest days of the year.
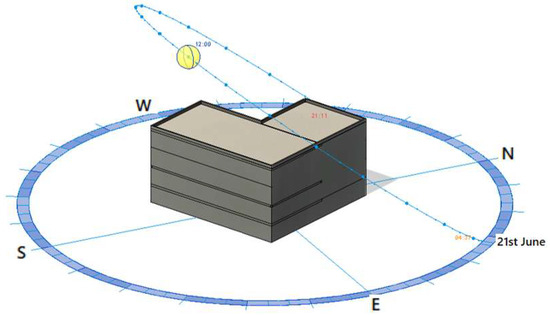
Figure 3.
Building solar exposure on the longest day of the year. Solar analysis of the building on the summer solstice (21 June), performed using Autodesk Revit. The model presents the trajectory of the sun over the building throughout the day—from sunrise (04:17) to sunset (21:11). The position of the sun at 12:00 PM is marked. This analysis enables the assessment of daylight availability, the potential for implementing BIPV systems, and the impact of shading on individual building façades. Geographical directions (N, S, E, W) are visible, allowing the model to be oriented in accordance with the actual site location. Analysis performed using Autodesk Revit software.
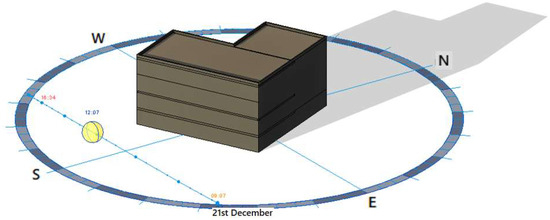
Figure 4.
Building solar exposure on the shortest day of the year. Solar analysis of the building on the winter solstice (21 December), performed using Autodesk Revit. The model presents the trajectory of the sun over the building throughout the day—from sunrise (09:07) to sunset (16:34), with the sun’s position marked at 12:00 PM. On this day, the sun follows the lowest path in the sky throughout the year, resulting in a shorter duration of sunlight and longer shadows cast by the building. The analysis enables the assessment of the impact of limited daylight access on individual façades, as well as the effectiveness of passive design strategies and BIPV systems under winter conditions. Geographical directions (N, S, E, W) are visible, allowing the analysis to be aligned with the actual site location. Analysis performed using Autodesk Revit software.
According to the analysis, the most favourable location for installing photovoltaic modules is the front wall facing southeast. However, due to the arrangement of the window openings on this facade, the installation of photovoltaic cladding is not feasible. Therefore, other façades must be considered.
The next best option in terms of potential solar energy yield is the wall facing the parking area; nevertheless, this wall also does not permit the installation of photovoltaic cladding.
Another viable option is the front wall facing northeast, which—despite having numerous window openings—provides a portion of surface area suitable for such an installation. Photovoltaic modules could be mounted on the left section of this wall, covering an approximate area of 12 × 6 = 72 m2.
The area of the wall suitable for installing the photovoltaic cladding is approximately 72 m2. A ventilated photovoltaic façade system can be applied to the analysed wall. Modules with various power ratings are used for this type of façade, and an energy yield analysis was performed for each variant of the module. The number of PV modules selected for each variant depends on the available wall area, assuming maximum utilisation of the surface for aesthetic purposes and to ensure the highest possible energy yield. In the case of photovoltaic balustrades, their quantity depends on the number of windows where the balustrades can be installed.
4.2. Energy Yield
4.2.1. Variant 1—Modules with a Power Rating of 400 W
A maximum of 36 modules can be installed, producing energy with a nominal power of 14.4 kW. The actual energy yield is ; however, the minimum required energy yield was not achieved. Figure 5 presents the graph of energy yield as a function of the month of the year. The highest energy yield occurs in June, reaching approximately 900 kWh.
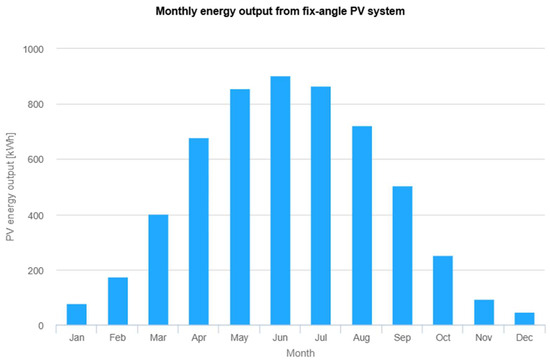
Figure 5.
Performance results of grid-connected PV. The vertical axis represents the PV energy yield per month throughout the year (kWh), while the horizontal axis represents the successive months of the year. The results, presented in the form of a bar chart, indicate the energy yield value for each month of the year in kWh/month. Source: Photovoltaic Geographical Information System (PVGIS).
To meet the required minimum energy yield, photovoltaic balustrades can be employed. So-called “French balconies” equipped with these photovoltaic balustrades can be installed on the building.
4.2.2. Variant 1A—400 W Modules and Balustrades with a Power Density of 2.0 kW/m2
French balconies (also known as portfenetres) can be installed on tall windows located on the front façades facing both the northeast and southeast directions. Due to the possibility of manufacturing balustrades in custom dimensions up to a maximum of 3.5 m, balustrades measuring 1.80 × 1.10 m have been selected for installation on four windows on the southeast side, while balustrades measuring 1.20 × 1.10 m will be installed on nine windows on the southeast side and eleven windows on the northeast side. The balustrades are designed with a maximum power density of 2.0 kW/m2.
The maximum power output of the modules integrated into the balustrades is 6.86 kW. The total actual energy yield from the photovoltaic modules on the balustrades facing southeast (SE 155°) amounts to , whereas the yield from those facing northeast (E 85°) is , resulting in a combined total of 3839.58 kWh. The total energy produced by the modules on the northeast façade and the photovoltaic balustrades is , thereby meeting the minimum energy production requirements.
The total generated energy exceeds the minimum required by 63%. Consequently, several optimisation solutions can be considered.
Discussion on the selection of the optimal solution for the significant energy surplus: The energy surplus exceeds 20%, making the application of photovoltaic modules in this configuration economically unviable. The energy surplus generated by photovoltaic (PV) modules should generally fall within the range of 10% to 20%, providing a technical buffer that compensates for potential losses caused by factors such as partial shading, soiling, or long-term module degradation. Maintaining this margin helps to ensure consistent system performance and prevents underproduction during less favourable conditions. When the surplus reaches approximately 20%, the excess energy can be either exported to the electrical grid or stored in an energy storage system (ESS), without causing operational inefficiencies or overgeneration issues.
To preserve the aesthetic quality regarding the placement and number of PV modules, it is recommended to reduce the power rating of the photovoltaic modules. In this case, tinted glass can be used, which will particularly enhance the visual appearance. Any glass colour can be applied; however, three variants with parameters specified in the manufacturer’s datasheet will be analysed.
4.2.3. Variant 2—Red Modules, 240 W
A maximum of 36 modules can be installed, producing energy with a rated power of 8.64 kW. The actual energy yield amounts to ; however, the minimum energy requirement is not met. Figure 6 presents a graph illustrating the monthly energy yield throughout the year. The highest energy yield is achieved in June, exceeding 500 kWh.
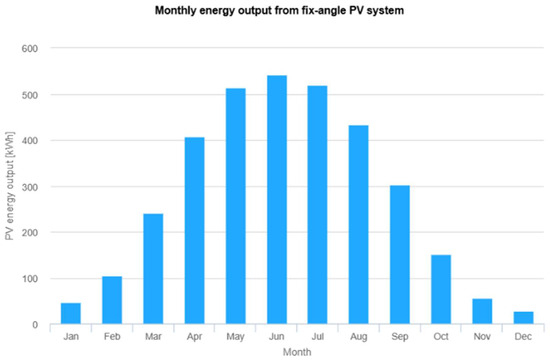
Figure 6.
Performance results of grid-connected PV. The vertical axis represents the PV energy yield per month throughout the year (kWh), while the horizontal axis represents the successive months of the year. The results, presented in the form of a bar chart, indicate the energy yield value for each month of the year in kWh/month. Source: Photovoltaic Geographical Information System (PVGIS).
4.2.4. Variant 2A—Red Modules 240 W Combined with Balustrades Rated at 2.0 kW/m2
Taking into account the photovoltaic balustrades the total actual energy produced by the modules on the northeast façade and the photovoltaic balustrades amounts to , thereby meeting the minimum energy yield requirement.
The total generated energy exceeds the minimum required by 21%.
This surplus should be reduced to improve the economic feasibility of the photovoltaic system.
The optimal solution is to decrease the power rating of the modules installed on the balustrades.
4.2.5. Variant 2B—Red Modules 240 W and Balustrades with a Power Density of 1.60 kW/m2
The maximum power of the modules is 5.49 kW. The total actual energy yield of photovoltaic modules on the balustrades facing southeast (SE 155°) is , while for those facing northeast (E 85°) it is , resulting in a combined total of 3047.51 kWh. The total energy produced by the modules on the northeast façade and the photovoltaic balustrades with a power density of 1.60 kW/m2 amounts to , thereby meeting the minimum energy yield requirement.
The total generated energy exceeds the minimum required by 11%, which is considered an optimal surplus.
4.2.6. Variant 3—Gray Modules, 290 W
A maximum of 36 modules can be used, producing energy with a rated power of 10.44 kW. The actual energy yield is , which does not meet the minimum energy requirement. Figure 7 presents a graph showing the monthly energy yield throughout the year. The highest energy yield is achieved in June, with a value of approximately 650 kWh.
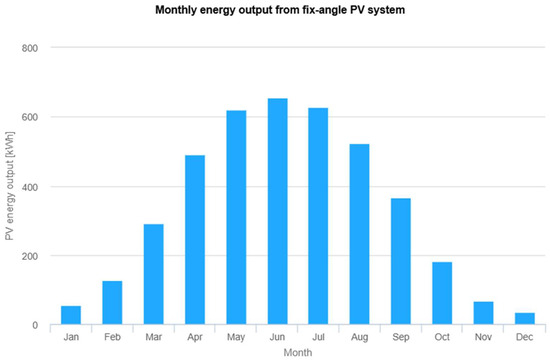
Figure 7.
Performance results of grid-connected PV. The vertical axis represents the PV energy yield per month throughout the year (kWh), while the horizontal axis represents the successive months of the year. The results, presented in the form of a bar chart, indicate the energy yield value for each month of the year in kWh/month. Source: Photovoltaic Geographical Information System (PVGIS).
4.2.7. Variant 3A—Grey Modules 290 W and Balustrades with a Power Density of 2.0 kW/m2
Taking into account photovoltaic balustrades, the total actual energy produced by the modules in the northeast façade and the photovoltaic balustrades amounts to , fulfilling the minimum energy yield requirement. The total generated energy exceeds the minimum required by 38%. This surplus should be reduced to improve the economic feasibility of the photovoltaic system. The optimal solution is to reduce the power rating of the modules installed on the balustrades.
4.2.8. Variant 3B—Grey Modules 290 W and Balustrades with a Power Density of 1.60 kW/m2
The total actual energy produced by the modules in the northeast façade and the photovoltaic balustrades is , meeting the minimum energy yield requirement.
The total generated energy exceeds the minimum required by 24%. This surplus should be reduced to improve the economic efficiency.
4.2.9. Variant 3C—Grey Modules 290 W and Balustrades with a Power Density of 1.40 kW/m2
Assuming that the maximum power photovoltaic modules for balustrades can produce is 1.40 kW/m2, the maximum module power is 4.80 kW. The total actual energy yield of photovoltaic modules on the balustrades facing southeast (SE 155°) is , while on those facing northeast (E 85°) it is , which together totals 2664.19 kWh. The total energy produced by the modules on the northeast façade and the photovoltaic balustrades with a power density of 1.40 kW/m2 amounts to , thus meeting the minimum energy yield requirement. The total generated energy exceeds the minimum required by 14%. This level of surplus is considered optimal.
4.2.10. Variant 4—Green Modules 200 W
A maximum of 42 modules can be installed, yielding a rated power of 8.40 kW. The actual energy yield amounts to , which fails to meet the minimum energy requirement. Figure 8 presents a graph that illustrates the monthly energy yield throughout the year, with the highest yield recorded in June, exceeding 500 kWh.
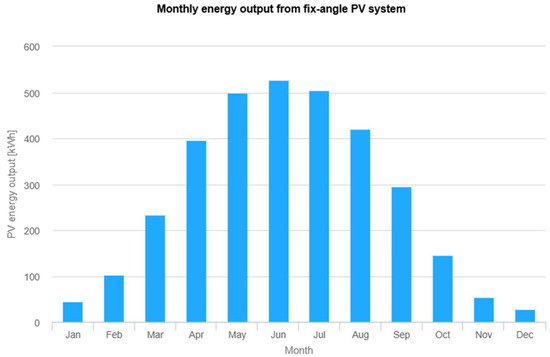
Figure 8.
Performance results of grid-connected PV. The vertical axis represents the PV energy yield per month throughout the year (kWh), while the horizontal axis represents the successive months of the year. The results, presented in the form of a bar chart, indicate the energy yield value for each month of the year in kWh/month. Source: Photovoltaic Geographical Information System (PVGIS).
4.2.11. Variant 4A—Green Modules 200 W and Balustrades with a Power Density of 2.0 kW/m2
Taking into account photovoltaic balustrades, the total actual energy produced by the modules on the northeast facing wall and the photovoltaic balustrades amounts to , fulfilling the minimum energy yield requirement.
The total energy produced is 25% higher than the minimum required. The surplus should be reduced to improve the cost-effectiveness of the photovoltaic system. The best solution is to reduce the power of the modules on the balustrades.
4.2.12. Variant 4B—Green Modules 200 W and Balustrades with a Power Density of 1.60 kW/m2
The total energy produced by the modules on the wall and the photovoltaic balustrades is , meeting the minimum energy yield requirement.
The total produced energy is 10% higher than the minimum required. This level of surplus is optimal.
4.2.13. Variant 5—Modules with a Power of 470 W
A maximum of 32 modules can be installed, providing a total nominal power of 15.04 kW. The actual annual energy yield is , which satisfies the minimum energy yield requirement. Figure 9 presents a graph that illustrates the variation in monthly energy yield throughout the year. The highest monthly energy production is observed in June, reaching approximately 900 kWh.
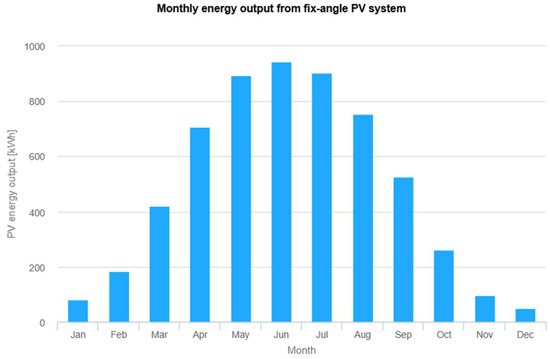
Figure 9.
Performance results of grid-connected PV. The vertical axis represents the PV energy yield per month throughout the year (kWh), while the horizontal axis represents the successive months of the year. The results, presented in the form of a bar chart, indicate the energy yield value for each month of the year in kWh/month. Source: Photovoltaic Geographical Information System (PVGIS).
Due to the failure to meet the minimum energy requirement based on manual calculations, it is necessary to increase the rated power of the photovoltaic modules. However, the application of photovoltaic balustrades in this configuration would result in a significant energy surplus, rendering the solution economically unviable. Therefore, an alternative scenario was analysed using modules with a rated power of 480 W.
4.2.14. Variant 6—480 W Module
A maximum of 32 modules can be installed, resulting in a total nominal power of 15.36 kW. The actual annual energy yield amounts to , thereby fulfilling the minimum energy requirement. Figure 10 presents a graph that illustrates the monthly distribution of energy production throughout the year. The highest energy yield is observed in June, approaching 1000 kWh.
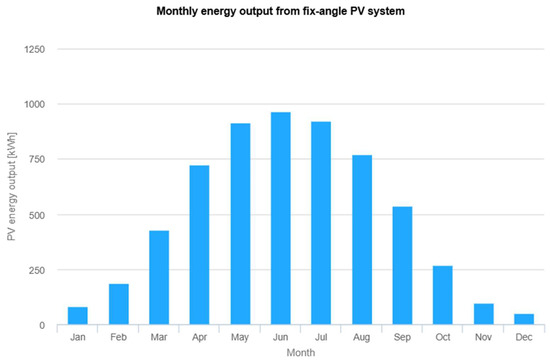
Figure 10.
Performance results of grid-connected PV. The vertical axis represents the PV energy yield per month throughout the year (kWh), while the horizontal axis represents the successive months of the year. The results, presented in the form of a bar chart, indicate the energy yield value for each month of the year in kWh/month. Source: Photovoltaic Geographical Information System (PVGIS).
5. Analysis of the Results
As part of this study, a comparative analysis of various layout and configuration options for photovoltaic modules within a BIPV system was conducted. The analysis included both vertically mounted façade-integrated modules and additional modules incorporated into balcony railings. A total of 14 variants were examined, involving different types (standard and coloured), rated power outputs (ranging from 200 W to 480 W), and numbers of installed units. Table 9 presents a summary of the BIPV variants, reflecting the influence of the module type on the performance of the system. For each configuration, the total installed capacity and the estimated annual electricity yield were calculated, taking into account contributions from modules mounted on the façade and integrated with the rails. This comparative approach enables an evaluation of the impact of aesthetic choices and technical configurations on the overall energy performance of the BIPV installation.
Table 9.
Comparison of BIPV installation variants. Own elaboration.
Figure 11 presents a graph illustrating the significant variation in total installed system capacity across the analysed BIPV variants. Base variants (1–6), which include only façade-mounted modules, provide installed capacities ranging from 8.4 kW to 15.36 kW, depending on the type and quantity. On the contrary, the extended variants—incorporating additional balcony railing modules (variants 1A, 2A, etc.)—increase the total capacity to more than 21 kW, as observed in variant 1A.
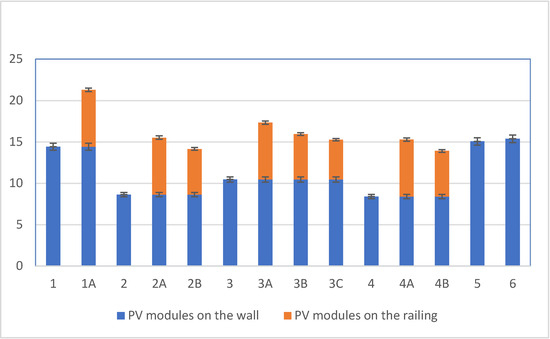
Figure 11.
Installed capacity of the BIPV system. Total installation power for individual variants. The vertical axis represents the total power (kW) of the analysed variants, while the horizontal axis represents the individual variants.
The most substantial increase in installed capacity was recorded in variants with integrated railing modules (variants labelled A, B, and C), where the balcony components contributed more than 30% of total system capacity. A standard deviation of 3% error was assumed.
Figure 12 presents a graph illustrating the projected annual energy yield for each variant analysed. The highest yield was achieved by variant 1A, reaching 9058.7 kWh per year, resulting from the use of high-efficiency 400 W modules on the façade combined with additional 200 W modules integrated into the balustrades. On the contrary, variants 2 and 4 (featuring red and green modules) without balustrades produced total yields not exceeding 3100–3200 kWh annually.
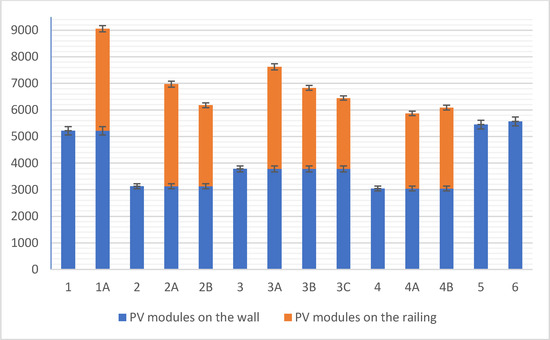
Figure 12.
Annual energy yield. Annual energy yield for individual variants. The vertical axis represents the total energy yield (kWh) of the analysed variants, while the horizontal axis represents the individual variants.
The inclusion of balustrades increased energy production by an average of 40–60% compared to base variants. For variants 2A–4B (coloured modules), the additional balustrade modules partially compensated for efficiency losses due to the lower optical performance of these modules. A standard deviation of 3% error was assumed.
To conduct a more detailed investigation, an uncertainty analysis was performed to assess the potential shading of the PV modules. Shading of the module surface can significantly affect system efficiency. It is assumed that shading at the level of a few percent can reduce efficiency by up to 50%. Accordingly, calculations were carried out for efficiency reductions of 25%, 40%, and 50%. The results are presented in Table 10.
Table 10.
Comparison of BIPV installation variants considering different efficiency losses due to shading. Own elaboration.
The analysis assessed the impact of shading at 25%, 40%, and 50% on meeting the minimum required energy yield and optimal production (10–20% surplus). The results indicate that only variants 1A, 2A, and 3A meet the minimum yield in all loss scenarios, with the optimal level of surplus achieved in variant 2A at 25% losses, in variant 3A at 40% losses, and in variant 3B at 25%. Although variant 1A meets the requirements, it generates a surplus above the optimal range in each configuration, suggesting system oversizing. Most of the remaining variants fail to achieve the minimum yield in any loss scenario, indicating insufficient system power under shading conditions.
Based on the presented table and chart, the results of the cost analysis and annual energy performance of various photovoltaic (PV) module variants can be summarised as follows:
Table 11 provides a comparison of the approximate purchase costs of PV modules for the analysed variants. These variants differ in the power rating of the wall-mounted and balustrade modules, as well as in their quantities. Costs have been converted to Polish zloty (PLN) and US dollars (USD). Additionally, the energy efficiency of each variant is indicated, where “YES” denotes an energy-efficient variant, and “NO” indicates a non-efficient one.
Table 11.
Comparison of approximate purchase costs of PV modules for the analysed variants. Own elaboration.
Out of the 14 analysed variants, only three (2B, 3C, 4B) were marked as energy efficient (green shading denotes variants that satisfy the energy optimality criterion, whereas red shading denotes variants that do not satisfy this criterion), indicating that their calculated energy yield relative to the generated surplus is the most favourable. Variants with balustrade modules rated at 160 W (e.g., 2B, 3C, 4B) exhibit higher efficiency despite higher purchase costs compared to variants without balustrade modules or with lower-power modules.
The bar chart (Figure 13) shows the annual energy performance (in USD on the vertical axis) for the individual variants (on the horizontal axis). Variants 2B, 3C, and 4B achieve high energy performance values at moderate costs. The cheapest variants (1, 1A, 6) do not necessarily translate into high energy efficiency, highlighting the need for thorough profitability analysis when investing in PV systems.
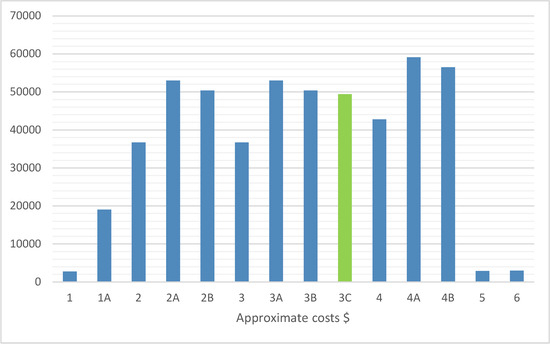
Figure 13.
Annual energy yield for individual variants. The vertical axis represents the approximate costs USD of the analysed variants, while the horizontal axis represents the individual variants.
In summary, variants with balustrade modules of 160 W (2B, 4B) and 140 W (3C) offer the best compromise between cost and annual energy yield, making them the most energy-efficient solutions among the analysed options. Among them, variant 3C (marked in green colour) meets the condition of energy profitability while having the lowest approximate cost. The remaining variants, despite their lower purchase costs, exhibit lower energy efficiency and may be less profitable during long-term operation.
The analysis was conducted based on the study [45], which demonstrated that, assuming the PV system operates over a 30-year period, the maintenance cost of the photovoltaic installation amounts to USD 3.55/kWh. The results were compared with the average annual electricity purchase cost, which for the analysed building totals USD 1689.06.
The lifecycle cost (LCC) analysis of the photovoltaic installations, presented in Table 12, indicated that all installation variants provide savings compared to conventional electricity purchase (USD 1689.06/year). The highest savings (78.67%) were achieved with variant 4, which includes exclusively 200 W wall-mounted modules, whereas variants with additional balustrade modules exhibited lower savings, e.g., variant 1A—36.54%. Considering the most energy-efficient variants, namely 2A, 3C, and 4B, the savings amount to approximately 54%.
Table 12.
Comparison of lifecycle costs of photovoltaic installations with energy purchased from suppliers. Own elaboration.
From the analysis carried out, the following conclusions can be drawn:
- Using only 400 W modules on the northeast facing façade does not meet the minimum energy yield requirement.
- The addition of photovoltaic balustrades on tall windows significantly exceeds the minimum energy production, resulting in an excessive surplus.
- Coloured photovoltaic modules provide more aesthetically favourable options but have lower energy yields; however, balustrades with a power density of 2.0 kW/m2 surpass the necessary energy production.
- Reducing the balustrade power density to 1.6 kW/m2 for the red and green modules and to 1.4 kW/m2 for the grey modules yields an optimal surplus, improving economic viability.
- Using 470 W modules alone on the northeast façade almost meets the requirement (only 1.3% shortfall); adding balustrades would create a significant surplus.
- Using 480 W modules alone on the northeast façade meets the minimum requirement, but with a margin below 1%, making further balustrade modules economically unjustified.
- Variants with balustrade modules rated at 160 W and 140 W (2B, 3C, 4B) provide the best compromise between purchase cost and annual energy performance.
- Variant 3C stands out as the most cost-effective option while maintaining high energy efficiency.
- Cheaper variants exhibit lower efficiency, which may lead to reduced savings over longer operational periods.
- Analysing the selection of the optimal variant with respect to potential shading of the installation, it can be observed that variant 3A performs best, as its energy production under shaded conditions remains optimal even with losses of up to 40%.
- Variant 3A can be considered optimal for losses of 25%, even in cases of a 23% surplus in generated energy, due to its favourable performance under 40% loss conditions.
- Considering the estimated costs of PV modules, the investment for variant 3A is approximately USD 3500 higher compared to variant 3C, which generates energy under standard conditions (i.e., without additional shading).
6. Discussion
The results of the conducted analysis confirm a significant dependence between location, module type, their power, and the total energy yield of BIPV systems. The highest efficiency was observed in variants with additional modules mounted on balustrades (e.g., variant 1A), which aligns with findings from other authors that highlight the importance of maximising PV exposure area in residential projects while maintaining a coherent architectural integration strategy.
Studies [30,33] indicate that the use of coloured modules—despite their efficiency limitations—can be justified from an aesthetic perspective, especially in projects with high architectural demands. In the variants 2 to 4 analysed (red, grey, and green modules), a significant decrease in energy yield was observed compared to variants with classic black modules (variants 1, 5, and 6). However, additional balustrade installations (e.g., variants 2A–4B) partially compensated for these differences, increasing energy production by 40% to 60%. In the study [1], the authors emphasise that BIPV should continue to develop as a key technology to accelerate the energy transition and achieve the NZEB targets.
The conclusions drawn from the conducted analysis are consistent with the observations made by the authors in [25], who highlighted a particular synergy between BIPV technology and modular construction in their review of the literature. They emphasise that the prefabrication of PV-integrated elements not only reduces assembly time and improves workmanship quality, but also facilitates the standardisation and scalability of solutions [36]. In the context of the modular building variants, incorporating balustrade elements with prefabricated PV modules aligns with the development trends identified in the literature, serving as a solution that promotes both energy efficiency and technological optimisation. This supports the view of prefabricated BIPV integration not only as an aesthetic addition but as an integral component of the building’s energy system.
Effective integration of BIPV systems requires not only considering potential energy yields but, more importantly, balancing them with user demand and the daily energy consumption profile of the building [46]. Therefore, in the variants analysed, the optimisation of the system should account for both solar exposure conditions and functional layout alongside the characteristics of the energy loads [47,48,49]. The results of the analysis may serve as practical support for engineers and architects designing modular buildings with integrated BIPV systems. The use of photovoltaic modules as façade elements requires consideration of both technical and aesthetic aspects, particularly in the context of prefabrication and the repeatability of building modules. The differences in performance identified in the study, depending on the type and arrangement of the modules, can be used to optimise design solutions, allowing for better adaptation of the BIPV system to the functional and visual requirements of a given building.
7. Conclusions
The drive toward climate neutrality imposes new requirements on zero-energy buildings. The development of integrated modular construction, recognised for being both cost-effective and environmentally friendly, should be harmonised with BIPV systems. The analysis confirms that the effectiveness of photovoltaic systems depends on several factors:
- The highest energy yields are achieved with configurations utilising classic (black), high-power modules combined with additional balustrade surfaces.
- Coloured modules, despite their lower efficiency, can be applied effectively in projects where aesthetic considerations are prioritised, provided the installation area remains reasonable.
- An integrated design approach that considers technical, architectural, and functional parameters is essential for the effective integration of BIPV in residential construction; this is also supported by recent international studies.
Additionally, simulations of the variants indicated that the optimal solution is a combination of photovoltaic balustrades on the windows and coloured photovoltaic modules on the walls. To further this research, it would be advisable to analyse modules in other colours, given the impact of the colour of the PV module on power output.
The conducted analyses indicate that the variants incorporating balustrade modules (2B, 3C, 4B) offer the optimal trade-off between initial investment cost and annual energy performance. Among these, variant 3C emerges as the most cost-efficient solution while still delivering high energy efficiency. Lower-cost alternatives exhibit reduced performance, which may lead to diminished savings over the long term. Moreover, when considering the estimated costs of PV modules, variant 3A is approximately USD 3500 more expensive than 3C, despite generating a comparable amount of energy under standard conditions (i.e., without additional shading).
Moreover, future research directions on BIPV systems should consider not only visual aspects but also technical and operational issues. In particular, it is worth exploring the integration with energy storage systems, the performance analysis of modules under varying climatic conditions, and the application of artificial intelligence-based optimisation algorithms for module layout planning. Such approaches may significantly enhance the energy efficiency and reliability of BIPV systems in engineering practice.
Note that the expected power output is not always attainable, as demonstrated by the analysis of various photovoltaic module solutions and configurations. The study revealed that each module type can be used in varying quantities, which consequently affects overall costs. The application of photovoltaic balustrades could have a particularly broad use in urban construction, given the prevalence of multifamily buildings and balconies.
These efforts align with the broader goals of transforming the energy sector within construction and advancing low-emission systems through modular building technologies. The results obtained may serve as a basis for further research into the integration and utilisation of building-integrated photovoltaic (BIPV) technology in next-generation modular systems.
Author Contributions
Conceptualisation, J.B. and B.K.; investigation, J.B.; data curation J.B. and B.K.; formal analysis, B.O.-K.; methodology, J.B. and B.K.; resources, J.B. and B.K.; software, J.B.; supervision, B.O.-K.; validation, J.B.; visualisation, J.B., B.K. and B.O.-K.; writing—original draft preparation J.B. and B.K.; writing—review and editing, J.B., B.K. and B.O.-K. All authors have read and agreed to the published version of the manuscript.
Funding
This research received no external funding.
Data Availability Statement
The original contributions presented in the study are included in the article, further inquiries can be directed to the corresponding author.
Conflicts of Interest
The authors declare no conflicts of interest.
References
- Walczak, Z.; Ksit, B.; Szymczak-Graczyk, A. Decision-support tools for diagnosing and selecting the optimal method of repairing buildings. Bull. Pol. Acad. Sciences. Tech. Sci. 2024, 72, e151382-1. [Google Scholar] [CrossRef]
- Siewczyńska, M.; Ksit, B. Effectiveness of Screens Shading Opaque Facades in Terms of Building Thermal Modernisation. Civ. Environ. Eng. Rep. 2024, 34, 126–137. [Google Scholar] [CrossRef]
- Nowogońska, B. Diagnoses in the Aging Process of Residential Buildings Constructed Using Traditional Technology. Buildings 2019, 9, 126. [Google Scholar] [CrossRef]
- Stefaniak, K.; Wierzbicki, J.; Ksit, B.; Szymczak-Graczyk, A. Biocementation as a Pro-Ecological Method of Stabilizing Construction Subsoil. Energies 2023, 16, 2849. [Google Scholar] [CrossRef]
- Smoczyk, M.; Ksit, B.; Szymczak-Graczyk, A. Numerical analysis of heat transfer and surface condensation risk in the plinth zone of basement-included building. Energy Build. 2025, 344, 116001. [Google Scholar] [CrossRef]
- Smoczyk, M.; Ksit, B.; Szymczak-Graczyk, A. Numerical analysis of the ground temperature function depending on edge thermal insulation parameters for shallow slab foundations. Energy 2025, 314, 134221. [Google Scholar] [CrossRef]
- Pokorska-Silva, I.; Kadela, M.; Orlik-Kożdoń, B.; Fedorowicz, L. Calculation of Building Heat Losses through Slab-on-Ground Structures Based on Soil Temperature Measured In Situ. Energies 2022, 15, 114. [Google Scholar] [CrossRef]
- Orlik-Kożdoń, B.; Radziszewska-Zielina, E.; Fedorczak-Cisak, M.; Steidl, T.; Białkiewicz, A.; Żychowska, M.; Muzychak, A. Historic Building Thermal Diagnostics Algorithm Presented for the Example of a Townhouse in Lviv. Energies 2020, 13, 5374. [Google Scholar] [CrossRef]
- Fedorczak-Cisak, M.; Radziszewska-Zielina, E.; Orlik-Kożdoń, B.; Steidl, T.; Tatara, T. Analysis of the Thermal Retrofitting Potential of the External Walls of Podhale’s Historical Timber Buildings in the Aspect of the Non-Deterioration of Their Technical Condition. Energies 2020, 13, 4610. [Google Scholar] [CrossRef]
- EEA. Communication from the Commission to the European Parliament, The Council, The European Economic and Social Committee and the Committee of The Regions. In ‘Fit For 55’: Delivering the Eu’s 2030 Climate Target on The Way to Climate Neutrality; European Commission: Brussels, Belgium, 2021; pp. 2–15. [Google Scholar]
- Mahmud, D.M.; Sule, E.E.; Wang, T.; Thomas, V. Towards clean energy: Design and integration strategy of photovoltaics for residential electrification. J. Eng. Res. 2025, 13, 1329–1343. [Google Scholar] [CrossRef]
- Rocha, P.F.; Ferreira, N.O.; Pimenta, F.; Pereira, N.B. Impacts of Prefabrication in the Building Construction Industry. Encyclopedia 2023, 3, 28–45. [Google Scholar] [CrossRef]
- Liu, S.; Li, Z.; Teng, Y.; Dai, L. A dynamic simulation study on the sustainability of prefabricated buildings. Sustain. Cities Soc. 2022, 77, 103551. [Google Scholar] [CrossRef]
- Zohourian, M.; Zohourian, M.; Kermanshachi, S.; Almaskati, D. Modular Construction: A Comprehensive Review. Buildings 2025, 15, 2020. [Google Scholar] [CrossRef]
- Farajian, M.; Sharafi, P.; Bigdeli, A.; Eslamnia, H.; Rahnamayiezekavat, P. Experimental Study on the Natural Dynamic Characteristics of Steel-Framed Modular Structures. Buildings 2022, 12, 587. [Google Scholar] [CrossRef]
- Guaygua, B.; Sánchez-Garrido, A.J.; Yepes, V. Life cycle assePREssment of seismic resistant prefabricated modular buildings. Heliyon 2024, 10, e39458. [Google Scholar] [CrossRef]
- Habib, O.; Al Houri, A.; Alibrahim, B.; Habib, M. Behavior and sustainability benefits of modular steel buildings. Int. J. Sustain. Eng. 2025, 18, 2459715. [Google Scholar] [CrossRef]
- Chippagiri, R.; Gavali, H.R.; Bras, A.; Ralegaonkar, R.V. Performance Evaluation of a Sustainable Prefabricated System Using Small-Scale Experimental Model Technique. Buildings 2022, 12, 2000. [Google Scholar] [CrossRef]
- Tomanek, M. Budownictwo Modułowe Czasowe; Wydawnictwo Naukowe Śląsk: Katowice, Poland, 2006; ISBN 978-83-7164-499-3. [Google Scholar]
- Goodier, C.I.; Gibb, A.; Mancini, M.; Turck, C.; Gjepali, O.; Daniels, E. Off-site Fabrication: Prefabrication, Pre-assembly and Modularisation. ICE Proc. Civ. Eng. 2019, 172, 1–45. [Google Scholar]
- Kazeem, K.O.; Olawumi, T.O.; Adam, J.J.; Lam, E.W.-M. Integration of Building Services in Modular Construction: A PRISMA Approach. Appl. Sci. 2024, 14, 4151. [Google Scholar] [CrossRef]
- Lawson, R.M.; Ogden, R.G.; Bergin, R. Application of modular construction in high rise buildings. J. Archit. Eng. 2012, 18, 148–154. [Google Scholar] [CrossRef]
- Runkiewicz, L.; Szulc, J.; Sieczkowski, J. The evolution of prefabricated construction in Poland. Build. Rev. 2020, 91, 12–15. [Google Scholar]
- Kong, J.; Dong, Y.; Poshnath, A.; Rismanchi, B.; Yap, P.-S. Application of Building Integrated Photovoltaic (BIPV) in Net-Zero Energy Buildings (NZEBs). Energies 2023, 16, 6401. [Google Scholar] [CrossRef]
- Bao, Y.; Xiang, C. Integration of BIPV technology with modular prefabricated building—A review. J. Build. Eng. 2025, 102, 111940. [Google Scholar] [CrossRef]
- Batista, F.; Guimarães, A.S.; Palmero-Marrero, A.I. Building Integrated Photovoltaics: A multi-level design review for optimized implementation. Renew. Sustain. Energy Rev. 2025, 220, 115837. [Google Scholar] [CrossRef]
- Carbone, R.; Borrello, C. A Building-Integrated Bifacial and Transparent PV Generator Operated by an “Under-Glass” Single Axis Solar Tracker. Energies 2023, 16, 6350. [Google Scholar] [CrossRef]
- Vodapally, S.N.; Ali, M.H. A Comprehensive Review of Solar Photovoltaic (PV) Technologies and Integration Methods. Energies 2023, 16, 319. [Google Scholar]
- Silva, L.A.C.; Ruiz, L.G.B.; Criado-Ramón, D.; Bessa, J.G.; Micheli, L.; Pegalajar Jiménez, M.C. Assessing the impact of soiling on photovoltaic efficiency using supervised learning techniques. Expert Syst. Appl. 2023, 231, 120816. [Google Scholar] [CrossRef]
- Pelle, M.; Causone, F.; Maturi, L.; Moser, D. Opaque Coloured Building Integrated Photovoltaic (BIPV): A Review of Models and Simulation Frameworks for Performance Optimisation. Energies 2023, 16, 1991. [Google Scholar] [CrossRef]
- Siraki, A.G.; Pillay, P. Study of optimum tilt angles for solar panels in different latitudes for urban applications. Solar Energy 2012, 86, 1920–1928. [Google Scholar] [CrossRef]
- Gholami, H.; Røstvik, H.N.; Steemers, K. The Contribution of Building-Integrated Photovoltaics (BIPV) to the Concept of Nearly Zero-Energy Cities in Europe: Potential and Challenges Ahead. Energies 2021, 14, 6015. [Google Scholar] [CrossRef]
- Liu, Y.; Wang, X.; Chen, J. Advances in colored building-integrated photovoltaics: Energy performance and aesthetic applications. Energies 2023, 1–5, 10–14. [Google Scholar]
- Available online: https://mlsystem.pl/ (accessed on 1 April 2025).
- Bonomo, P.; Frontini, F. Building Integrated Photovoltaics (BIPV): Analysis of the Technological Transfer Process and Innovation Dynamics in the Swiss Building Sector. Buildings 2024, 14, 151. [Google Scholar] [CrossRef]
- N’tsoukpoe, K.E. Effect of orientation and tilt angles of solar collectors on their performance: Analysis of the relevance of general recommendations in the West and Central African context. Sci. Afr. 2022, 15, e01069. [Google Scholar] [CrossRef]
- Yu, G.; Yang, H.; Luo, D.; Cheng, X.; Ansah, M.K. A review developments and researches of building integrated photovoltaic (BIPV) windows and shading blinds. Renew. Sustain. Energy Rev. 2021, 149, 111355. [Google Scholar] [CrossRef]
- Available online: https://climatic.pl/pl/ (accessed on 1 April 2025).
- PN-EN 317:1999; Particleboards and Fiberboards—Determination of Swelling in Thickness After Immersion in Water. European Committee for Standardization: Brussels, Belgium, 1999.
- PN-EN 319:1999; Particleboards and Fiberboards—Determination of Tensile Strength Perpendicular to the Plane of the Board. Polish Committee for Standardizatio: Warsaw, Poland, 1999.
- PN-EN 321:2004; Wood-Based Panels—Determination of Resistance to Cyclically Changing Humidity. iTeh Standards: San Francisco, CA, USA, 2004.
- Pero, C.D.; Leonforte, F.; Aste, N. Building-Integrated Photovoltaics in Existing Buildings: A Novel PV Roofing System. Buildings 2024, 14, 2270. [Google Scholar] [CrossRef]
- Ebhota, W.S.; Tabakov, P.Y. Impact of Photovoltaic Panel Orientation and Elevation Operating Temperature on Solar Photovoltaic System Performance. Int. J. Renew. Energy Dev. 2022, 11, 591–599. [Google Scholar] [CrossRef]
- Mostafa Habibi1, Mohammadhossein Azizibabani Evaluation of the orientation of residential buildings in Mashhad based on direct solar radiation reception. Civ. Eng. Archit. 2025, 24, 45–56.
- Huang, B.; Wang, Y.; Huang, Y.; Xu, X.; Chen, X.; Duan, L.; Yu, G.; Li, Z.; Liu, H.; Ku, H.W.; et al. Life cycle cost analysis of solar energy via environmental externality monetization. Sci. Total Environ. 2023, 856, 158910. [Google Scholar] [CrossRef]
- Zhou, Z.; Yuan, Z.; Yi, Z.; Xue, O.; Li, N.; Huang, F. Progress of semitransparent emerging photovoltaics for building integrated applications. Green Energy Environ. 2024, 9, 992–1015. [Google Scholar] [CrossRef]
- Habibi, S.; Valladares, O.P.; Peña, D.M. Sustainability performance by ten representative intelligent Façade technologies: A systematic review. Sustain. Energy Technol. Assess. 2022, 52, 102001. [Google Scholar] [CrossRef]
- Karthick, A.; Murugavel, K.; Kalaivani, L.; Babu, U.S. Performance study of building integrated photovoltaic modules. Adv. Build. Energy Res. 2017, 12, 178–194. [Google Scholar] [CrossRef]
- Barrutieta, X.; Kolbasnikova, A.; Irulegi, O.; Hernández, R. Decision-making framework for positive energy building design LOKAthrough key performance indicators relating geometry, localization, energy and PV system integration. Energy Build. 2023, 297, 113442. [Google Scholar] [CrossRef]


Disclaimer/Publisher’s Note: The statements, opinions and data contained in all publications are solely those of the individual author(s) and contributor(s) and not of MDPI and/or the editor(s). MDPI and/or the editor(s) disclaim responsibility for any injury to people or property resulting from any ideas, methods, instructions or products referred to in the content. |
© 2025 by the authors. Licensee MDPI, Basel, Switzerland. This article is an open access article distributed under the terms and conditions of the Creative Commons Attribution (CC BY) license (https://creativecommons.org/licenses/by/4.0/).