Article

Securing Smart Grids: A Triplet Loss Function Siamese Network-Based Approach for Detecting Electricity Theft in Power Utilities

1
College of Engineering, A’Sharqiyah University, Ibra 400, Oman
2
Multan Electric Power Company, Multan 60000, Pakistan
3
Department of Electrical Engineering, College of Engineering, University of Business and Technology, Jeddah 21361, Saudi Arabia
4
Department of Electrical Engineering, The Islamia University of Bahawalpur (IUB), Bahawalpur 63100, Pakistan
5
Department of Industrial Engineering, College of Engineering, University of Business and Technology, Jeddah 21361, Saudi Arabia
6
Department of Electrical Engineering, Abbottabad Campus, COMSATS University Islamabad, Islamabad 45550, Pakistan
*
Author to whom correspondence should be addressed.
Energies 2025, 18(18), 4957; https://doi.org/10.3390/en18184957
Submission received: 8 July 2025 / Revised: 31 August 2025 / Accepted: 16 September 2025 / Published: 18 September 2025

Abstract

Electricity theft in power grids results in significant economic losses for utility companies. While machine learning (ML) methods have shown promising results in detecting such frauds, they often suffer from low detection rates, leading to excessive physical inspections. In this study, we attempted to solve the above-mentioned problem using a novel approach. The proposed framework utilizes the intelligence of Siamese network architecture with the Triplet Loss function to detect electricity theft using a labeled dataset obtained from Multan Electric Power Company (MEPCO), Pakistan. The proposed method involves analyzing and comparing the consumption patterns of honest and fraudulent consumers, enabling the model to distinguish between the two categories with enhanced accuracy and detection rates. We incorporate advanced feature extraction techniques and data mining methods to transform raw consumption data into informative features, such as time-based consumption profiles and anomalous load behaviors, which are crucial for detecting abnormal patterns in electricity consumption. The refined dataset is then used to train the Siamese network, where the Triplet Loss function optimizes the model by maximizing the distance between dissimilar (fraudulent and honest) consumption patterns while minimizing the distance among similar ones. The results demonstrate that our proposed solution outperforms traditional methods by significantly improving accuracy (95.4%) and precision (92%). Eventually, the integration of feature extraction with Siamese networks and Triplet Loss offers a scalable and robust framework for enhancing the security and operational efficiency of power grids.

1. Introduction

The current trend of smart grid implementations in Pakistan is changing conventional electricity networks to more efficient, reliable, and sustainable networks. The most important part of these innovations is the introduction of Advanced Metering Infrastructure (AMI) with smart meter installation at consumer premises [1]. Grid modernization is particularly important for providing resiliency against malicious activities or even calamities [2]. These meters can be used to communicate both ways, which results in making real-time and detailed consumption information available to users and utilities. Although AMI has largely helped in restraining conventional types of electricity theft, it is vulnerable to cyberattacks and hence raises severe concerns about the integrity of data transmission. This aspect may lead fraudulent consumers to manipulate the consumption readings, thus making the electric supply company incur huge loss. ML solutions have been proven to be an excellent choice in classifying anomalies and forecasting load by directly analyzing the electricity consumption patterns of consumers [3]. These AI-based models are utilized in almost every domain to identify fraudulent behaviors in different industries. But with the increased training and class imbalance, the performance of these ML models is jeopardized, primarily due to overfitting [4]. The electric meter infrastructure system is tampered with to avoid detection, posing a significant challenge to the robustness of detection systems. Such undetectable changes may deceive ML models into recognizing fraudulent patterns as normal and thus allow consumers to slip through the radar of detection and go on with their theft of electricity. An increasing number of studies in the relevant field have been conducted in recent years. These methods are generally based on applying ML methods to detect electricity theft in smart grids. The general idea underlying such projects is to increase the accuracy of detection and resistance to theft attempts by malicious users [5]. A few of the important studies related to the mentioned field are quoted below.
The authors of [6] used an ML method for fraud detection by assessing the consumption pattern of multi-energy loads. The study showed a significant reduction in losses by accurately identifying fraudulent consumers; however, the real-time deployment of the proposed model may face challenges due to data privacy and computational concerns. In addition, it requires synchronized and accurate consumption data for multi-energy loads, which are generally not available across existing energy systems. Efforts to ensure power system security so far have laid emphasis on different levels of protection, ranging from the physical protection of transmission systems to the cyber-physical security of distribution systems and the detection of fraud. Whereas research papers such as [7] have taken into consideration the physical integrity of HVDC lines, our work focuses on the financial and functional integrity of the distribution grid to make sure that it is secured in terms of revenue by means of thorough theft detection. To overcome such critical issues of electricity theft detection (ETD) as data imbalance and too many false positives, Tursunboev et al. introduced a Multi-Objective Evolutionary Hybrid Deep Learning (MOE-HDL) model [8]. It employs an original evolutionary algorithm in order to optimize the parameters of the model and a dynamic detecting window that accurately identifies periodic consumption patterns. Their combination of deep learning, using these optimized parameters, outperformed eight other baselines in identifying electricity theft.
It is worthwhile to mention here that the methods used for the detection of electricity theft can be classified into two broad categories: shallow classifiers and deep learning (DL) models [9]. Every category is accompanied by its benefits and problems. A few traditional ML models, such as support vector machines (SVMs), decision trees (DTs), and ensemble methods, fall under the category of shallow classifiers. One of the prominent studies that utilizes a shallow classifier (SVM) was carried out by Jokar et al. [10]. The authors of the mentioned study developed a consumer-specific consumption pattern-based energy theft detector (CPBETD) using SVMs. The proposed model achieved better results than the traditional one-class SVM models in terms of minimizing false positives and improving accuracy. On the same note, the authors of [11] fused SVMs with DTs to enhance the detection rate by enhancing the feature-handling capabilities of decision trees. In another study conducted by Nawaz et al. [12], the XGBoost algorithm was proposed along with a convolutional neural network (CNN) as an ensemble algorithm, which was used to identify electricity theft based on real data, and the proposed model was more efficient than the conventional models of logistic regression (LR) and k-nearest neighbors (KNNs). Deep learning algorithms have become widely known in the recent past because of their advanced performance in identifying complicated patterns in big data sets. Zheng et al. presented a CNN detection-based approach for non-technical loss (NTL) detection in smart grids with a comparatively better performance than that of shallow classifiers [13]. They introduced a deep CNN detector operating on a 2-D model of electricity consumption data, and it successfully classified normal and abnormal consumption lifestyles. The models produced better results than logistic regression (LR), support vector machine (SVM), and conventional CNN models. Supervised machine learning methods helped Salman et al. classify label sets of data and improve the rate of detection of electricity theft. They used bagged decision trees and boosted C5.0 algorithms in their work to detect non-technical losses at power utilities, with great improvement in the accuracy of detection [14]. Likewise, bagged CHAID-based classification trees used in electricity theft detection have been promising for demonstrating that ensemble methods are capable of dramatically improving the accuracy of fraud detection of metered customers [15]. Furthermore, other research has suggested the application of recurrent neural networks (RNNs) and gated recurrent units (GRUs) to assess the temporal correlations based on electricity consumption data. Nabil et al. and Badr et al. implemented RNNs and GRUs in electricity theft detection and refined the model through hyperparameter optimization techniques, i.e., genetic algorithms and grid search [16]. These models have proved to be very accurate in predicting trends in time-series data that are important when pinpointing slight changes that may be caused by electricity theft. As ML models are being used more in critical infrastructure, there has been an increase in concern about the susceptibility of the models to overfit, identifying only the normal class (honest consumers not involved in fraud) due to class imbalance. The positive class, with minor modifications in input data, allows changing the point of decision in the model to identify a malicious action as benign. When applied in the context of electricity theft detection, an overfit model may seriously compromise the performance of the model [17].
To overcome the mentioned issues, this research work develops an electric theft detection framework that detects fraudulent consumers from a pool of provided consumer datasets with high precision and accuracy. The proposed framework utilizes Siamese networks with Triplet Loss, which provide high accuracy and precision by avoiding the necessity of knowing the special design parameters. Using the Triplet Loss operation with a Siamese network, the difference in the patterns of normal and fraudulent consumption can be accurately detected without requiring the tuning of parameters. In addition, we reduce the feature size by employing feature extraction and selection to boost the efficiency of the models applied, as only the most important information should be utilized, and this aspect is unlikely to provide overfitting. The transferability of traditional ML architecture, which has proved to be problematic, is also inherently reduced in the Siamese network with the mentioned loss function architecture. Compared to learning the relative closeness of data points, the model is better and safer and more secure in detecting electricity theft cases. Therefore, it provides high defense capability alongside high sensitivity, which can be considered a novel step in comparison with the developed methods. The findings of this research confirm that the suggested model not only enhances the detection rate but also leads to a stronger solution to the new complications of electricity theft in Pakistan.
The rest of the article is organized as follows: Section 2 explains the methodological framework of the study. Section 3 presents the state-of-the-art learning algorithms used for comparison purposes. Section 4 provides a detailed discussion on the evaluation metrics used for performance evaluation of the different classification methods used. In Section 5, the results are presented, while Section 6 ends the research by reporting the conclusion of the current research work.

2. Methodology

The data used in this research was collected from Multan Electric Power Company (MEPCO), Punjab, Pakistan and contained 3 years’ consumption patterns for both dishonest and honest consumers. A detailed flowchart of the methodology chosen for this research work is depicted in Figure 1.
At the start, the raw consumption data is pre-processed using a number of data mining methods, which are discussed in detail in the subsequent subsection. Afterwards, the proposed Siamese Triplet model is trained on the acquired features to detect patterns within the data. Finally, the results obtained are compared with other state-of-the-art machine learning algorithms such as SVM, Random Forest, and XGBoost based on some of the well-known performance evaluation metrics like accuracy, precision, F1 score, and AUC. To exclude the possibility of data leakage and to achieve strong evaluation, the 10-fold cross-validation method was adopted to define the groups by unique customer IDs. This is to ensure that the full range of monthly consumption values of any one customer is represented completely in either the training set or validation set of each fold, effectively simulating the deployment scenario of fraud detection of unobserved customers. Each of the stages used to accomplish the proposed task is detailed in subsequent subsections.

2.1. Data Collection and Pre-Preprocessing

In this research, we have taken a labeled dataset from MEPCO that includes information on the monthly kWh usage of 10,000 consumers over 36 months. MEPCO is one of the largest power utilities in Pakistan, providing electricity to around 7 million customers. The data contain the monthly kwh readings of consumers for the time span of 3 years. The data consist mainly of residential customers, who form the largest and most commonly audited customer group for theft detection activities in the MEPCO service area. The readings are of both honest consumers and dishonest consumers, in which the total number of consumers found to have committed fraud was 3436 and the remaining 6564 consumers were those for whom no fraudulent activity was verified by the meter and testing laboratory of MEPCO. Thus, the attained 34.4 percent rate of fraud is not indicative of the existing prevalence in a pre-selected sample of fraud (which is commonly below five percent), as this would have been statistically biased, but rather preset strategically to ensure adequate representation of fraud examples and generalizable consumption behavior within the service area. The fraudulent consumers were those who cheated on their usage of electricity by manipulating meter readings by tampering, bypassing, reversing, etc., to pay a lower electricity bill. These fraudulent customers were confirmed as fraudulent after physical examination, routine testing, and measurement by the meter and testing laboratory of MEPCO. To counter the severe imbalance between classes, we used a data augmentation technique comprising both SMOTE (Synthetic Minority Over-sampling Technique) algorithm and targeted perturbation. The SMOTE algorithm was set to use the nearest neighbors (k) of 5 to construct synthetic examples of a minority (fraudulent) class. Additionally, specific distortion was also provided by adding Gaussian noise (standard deviation 0.05) to important time characteristics like ‘Month-over-Month Change’ and ‘Seasonal Features’ to represent abnormal consumption behavior. Critically, complete augmentation was carried out in training folds only at each of the 10 cross-validation stages. To make the synthetic fraudulent samples valid and realistic, the SMOTE algorithm was carefully applied. We then identified the minority group (fraudulent consumers) and fitted them with the 5 nearest neighbors of the original fraudulent records. We generated new synthetic records within the feature space. The method guarantees that the data points created are within the possible regions of real occurrence of fraud. Moreover, targeted perturbed features were used, whereby important temporal characteristics like Month-over-Month Change and Season Features were subjected to noise (with a standard deviation of 0.05). This simulates the anomalous and irregular patterns of consumption normally brought about by manipulated meters (i.e., bypassing during times of high consumption). The augmented dataset was checked against the original fraudulent data to ensure that the statistical characteristics of the synthetic samples matched those of the original data (mean, standard deviation, distribution). The presence of outliers in the samples was avoided by discarding any sample that fell outside two standard deviations of the initial feature distribution to prevent other unrealistic manifestations. Such a strict procedure guaranteed that the synthetic data would be reflective of the habits of electricity theft without polluting the feature space.
Such synthetic examples serve to normalize the data, make the model less partial toward the negative group, and, as a result, help detect fraudulent consumers. We also applied class weighting in the model training process to make a distinction in the minority fraudulent group. In performing the above dataset balancing, our intention was to have the model learn to identify fraud better without being overwhelmed by the non-fraudulent data. The training data comprised of three different types of samples: honest, fraudulent, and invalid (missing data or no consumption due to the premises being unoccupied or no usage of electricity). To maintain a clear and consistent binary classification problem, all non-valid samples were removed. The final balanced labeled data used for training contained only consumers who were verified: 0 value was assigned to honest (benign) consumers and 1 to fraudulent consumers.

2.2. Feature Extraction

MEPCO was used as the source of raw data, which consisted of kWh monthly consumption readings. Although deep learning classifiers are able to discover relevant features automatically, we conducted manual feature extraction in order to add to domain knowledge and produce interpretable features that capture known patterns of fraudulent behavior, like seasonal anomalies and statistical anomalies. This methodology gives a compelling baseline performance and a clean view of what is happening to utility operators, but we are also conscious that end-to-end learning models might capture more complex, latent patterns. Feature extraction is important for increasing the accuracy of any model because it converts raw data to meaningful information and cuts most of the noise and unnecessary data. The model has a greater chance of identifying frauds and anomalies with the right features as they convey the exact information. The feature extraction procedure aims to process raw consumption information int oan interpretable pattern that is reported to correlate with electricity theft, as shown in earlier studies on the topic of electricity theft in research and practice [18]. This makes sure that the model is trained on the most informative and discriminating features, thus leading to improved efficiency and performance. The identified features that were chosen were based on their known usefulness in previous theft detection research studies [9] and specific field expertise from power utility operators.
i.
Seasonal Features
This aspect observes whether consumption during the summer months (May to August) increases, as is typical in most areas due to greater use of air conditioners and cooling devices. Healthy consumers tend to show increased consumption during this period, but this is not the case with fraudulent consumers, who might not depict such a rise but might exhibit some anomalies or plunges. Classification Benefit: This benefit helps the model learn that a good consumer will exhibit peak consumption in the summer, but a fraudulent consumer will not exhibit as much seasonality and may show sudden drops.
ii.
Month-over-Month Change
The feature indicates how the consumption percentage rises or falls between two subsequent months. Fraudulent consumers can appear to exhibit larger and irregular changes in results since they can be characterized by anomalies in consumption, whereas healthy consumers exhibit smooth changes, especially between the neighboring months. Classification Benefit: This attribute should be useful in differentiating between healthy and fraudulent consumers, since a large and sudden month-to-month change in consumption can be valid evidence of fraudulent behavior.
iii.
Rolling Average (3-Month Average)
A 3-month moving average of consumption eliminates the effect of temporary patterns and determines the trends. Healthy consumers generally maintain a consistent or regular rolling average, whereas fraudulent consumers might experience some peaks or declines in their consumption that are unrelated to the trend. Classification advantage: A sudden decline or jump in the rolling averages may show the occurrence of an anomaly that the model can use to distinguish between ordinary consumption patterns and fraud identification.
iv.
Consumption Trend (Year-over-Year or Slope)
The feature records the trend of consumption after a year or more, thereby locating any constant change of consumption over time. The changes in consumption are most likely to be gradual (or sometimes declining) among healthy consumers, whereas fraudulent consumers might show unpredictable (or sporadic) consumption. Classification benefit: This permits the model to realize that any unexplained spike or drop in consumption over time may be evidence of fraud, and this is not a characteristic of healthy consumers.
v.
Anomaly Flag
This indicator marks those months during which the consumption is abnormally high or low relative to the norm, using a cut-off point that is set by the mean consumption. Due to manipulations or deviations in the patterns of consumption, anomalies are more likely to prevail in fraudulent consumers. Classification Benefit: This capability explicitly identifies anomalies, which are common indicators of fraud. This aspect can be employed by the model to signal fraud by estimating it based on irregularities in regular consumption habits.
vi.
Z-Score Comparison
Healthy consumers will be nearer to zero in terms of values, which implies stable and predictable consumption. High Z-scores among fraudulent consumers are both positive and negative, indicating that their deviations largely exceed the mean, which is a characteristic of fraudulent cases (outliers). Classification benefit: It points out sudden deviations from the normal consumption style. Users who commit fraud are likely to have high Z-scores, which shows abnormal shifts in use.
vii.
Kurtosis Comparison
Healthy consumers have low kurtosis, and their data have more distribution that appears in the shape of a bell or normal distribution with fewer extreme values. Kurtosis is higher in the case of fraudulent consumers, and this is a measure that states that the extreme consumption recorded by consumers is more in the case of fraudulent consumers. Thus, it might indicate anomalies in consumption. Classification benefit: It indicates the existence of extreme consumption values. The large kurtosis among fraudulent users indicates sudden high peak loads and/or sudden drops.
viii.
Skewness Comparison
Healthy consumers are characterized by a skew that is relatively neutral (close to 0), meaning that they are relatively balanced. Cheating consumers could display a little skewness to the left (negative), and this could indicate that consumption is likely to be low during certain periods. Classification benefit: It detects imbalance in distribution of consumption. Negative skew can suggest consistent under-reporting of usage, which is frequent in theft cases.
ix.
MAD (Mean Absolute Deviation) Comparison
The healthy consumer has a reduced MAD level, which shows that they are less deviated from the median. It is observed that fraudulent consumers exhibit greater MAD, which implies greater consumption variance. Classification benefit: It measures defects in the median position. An MAD that is high indicates an irregular use pattern, which is common in meter tampering.
x.
Coefficient of Variation Comparison
Healthy consumers have lower CV indices, which are an indicator of a more consistent and stable consumption behavior. Dishonest buyers possess greater CV, which means more abnormal and unpredictable consumer behavior. Classification benefit: It focuses attention on the instability of consumption behavior. Malicious users tend to have greater CV because they have erratic load.
xi.
Interquartile Range Comparison
The IQR of healthy consumers is narrower, and this suggests that there is less dispersion between the percentiles of 25 and 75 in this group. Consumers who defraud have a greater IQR, implying that they have more variation in their consumption data. Classification benefit: It captures dispersion in mid-range consumption. Wider IQR values suggest irregular usage, a red flag for fraudulent activity.

2.3. Feature Selection for Siamese Network Optimization

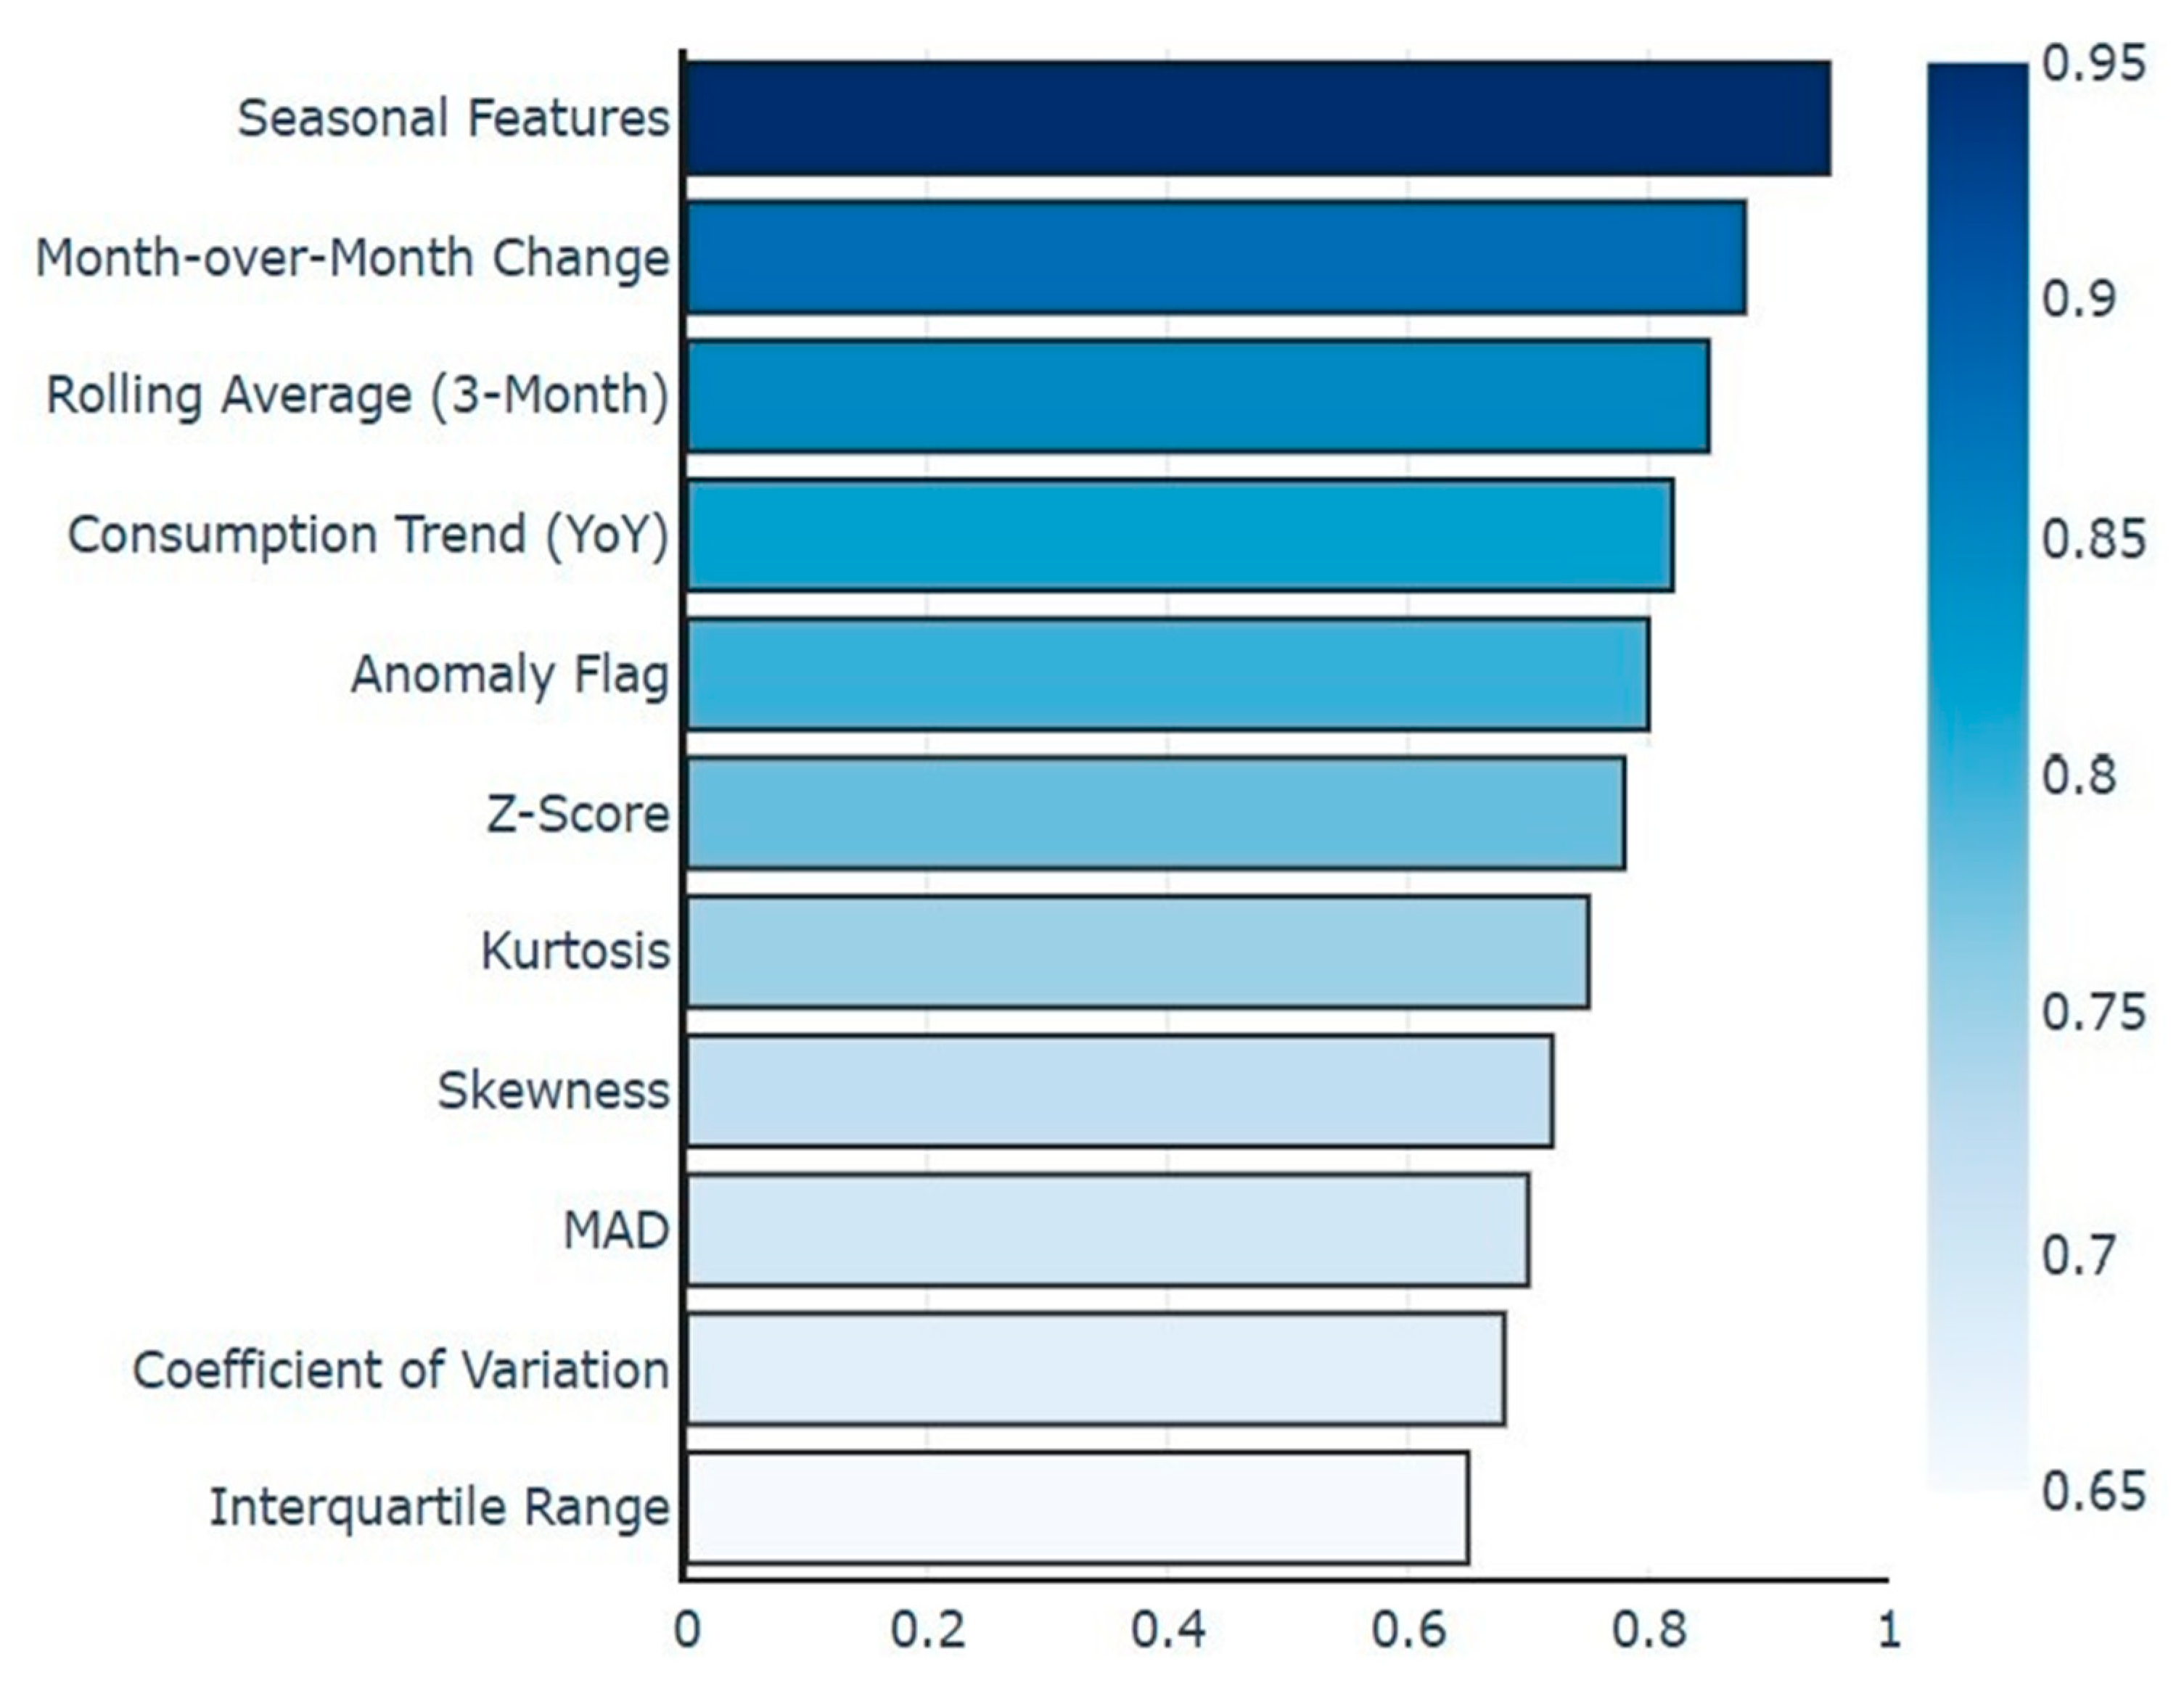
The Siamese network architecture uses mixture feature selection modeling with feature ranking based on statistical analysis and model-based feature importance. We used ANOVA F-value tests to determine features that are able to distinguish the consumption pattern of legitimate and fraudulent activity, combined with XGBoost-based feature importance ranking, to find the most predictive features. Such a two-fold approach guaranteed the retention of time-sensitive, statistically important characteristics that represent consumption anomalies typical of electricity theft. Figure 2 shows the feature ranking for electricity theft detection as per their importance. The combination of the attribute set, which consisted of seasonal trends, month-to-month variations, and statistical attributes such as kurtosis and skew, offered the discriminative power needed by the Triplet Loss function to distinguish between authentic and fraudulent embed-dings in feature space. Such a rigorous selection feature was key to improving the performance of the model without sacrificing computational time.

3. Siamese Networks with Triplet Loss for Classification

Siamese networks have been recently used for fraud detection in different fields, and they are more effective since they identify similarities and differences between normal and fraudulent patterns [19]. The Siamese network structure has widely been used in fields such as fraud detection because it learns similarity functions between a pair of inputs. Siamese networks can especially come in handy when it comes to fraud detection since they can compare different trends, as the models can be trained to be specific about the relative difference between regular and malicious habits [20]. The Triplet Loss commutation, which is usually utilized with Siamese networks, proceeds to make learning even more refined, since it makes certain that the false patterns are sent further away, in the feature space, compared to the common patterns [21]. This approach is different in that it has major benefits in cases where small differences between in consumption must be identified so that the appropriate theft can be detected. Our paper implements Siamese networks with Triplet Loss on electricity theft detection using a MEPCO-labeled dataset. We apply feature extraction to enhance the distinction of the model. Raw consumption data is transformed into meaningful data through the feature extraction process, and the dataset can be of high dimensionality with a multitude of features that do not contribute to the classification process, which aims to reduce the dimensionality of the dataset. It is an integration of Siamese networks with sophisticated data-processing methodologies that can present a resilient, scalable solution to electricity theft detection in Pakistan.

3.1. Basic Architecture of Siamese Network

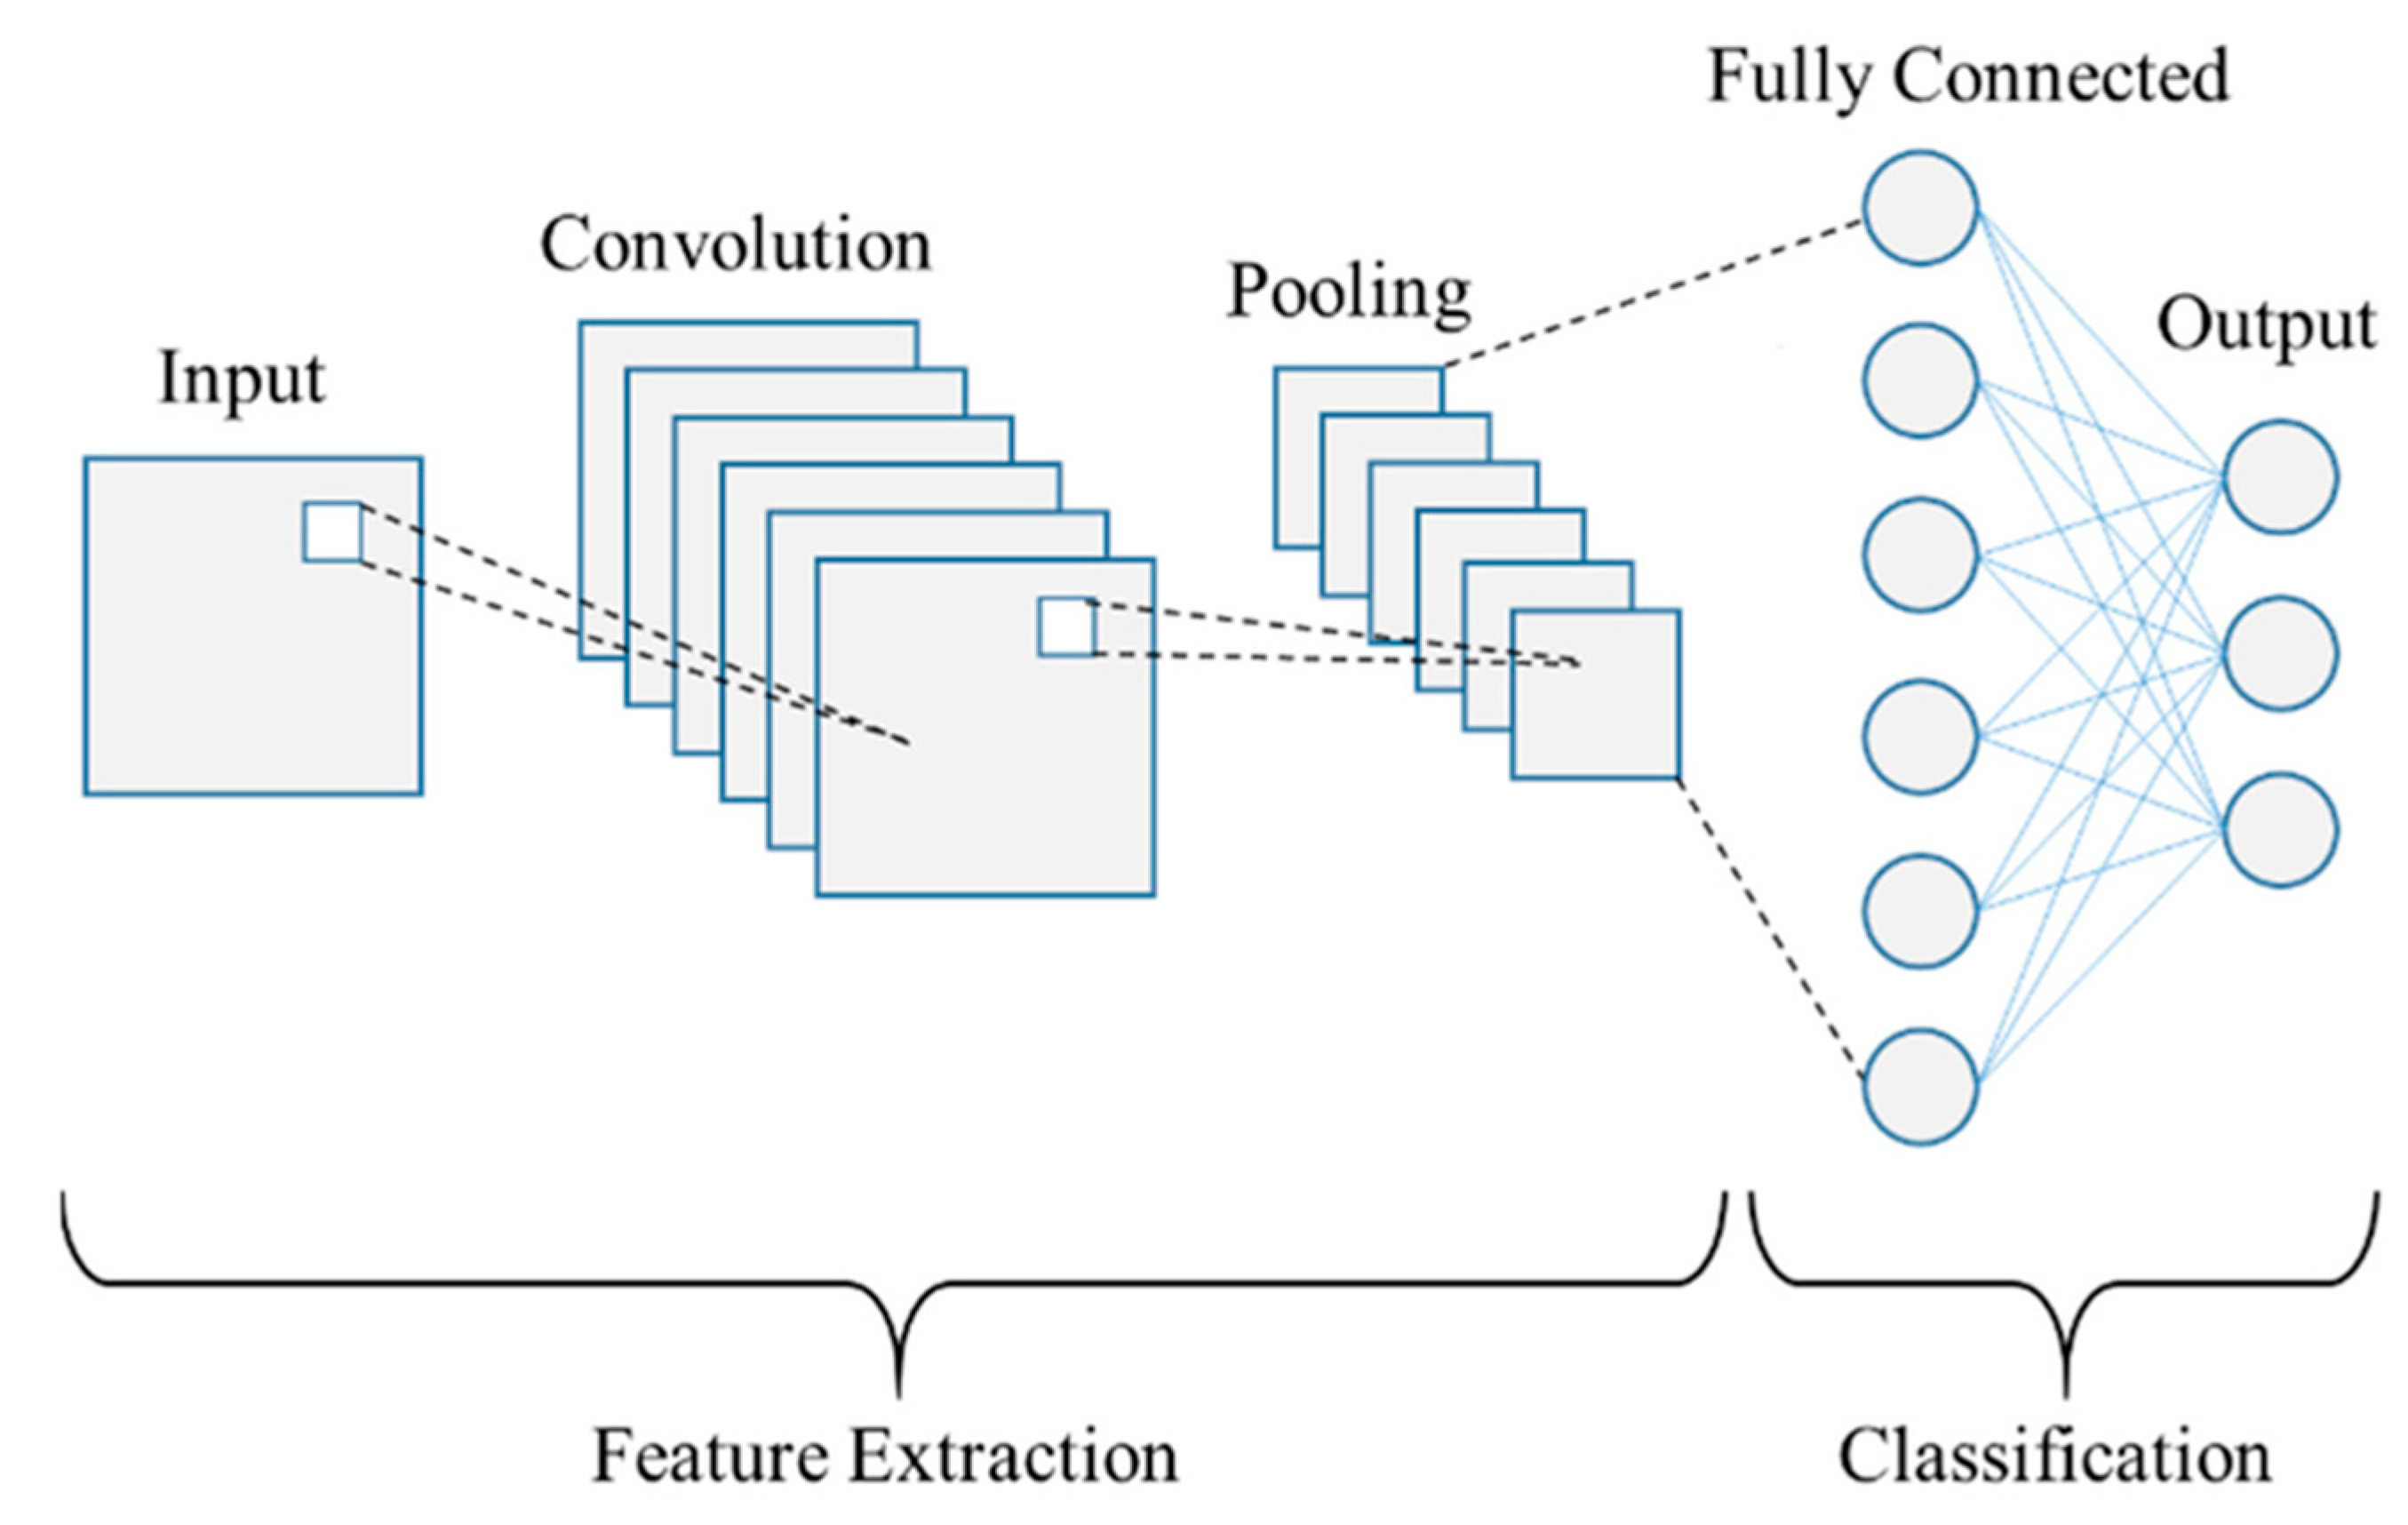
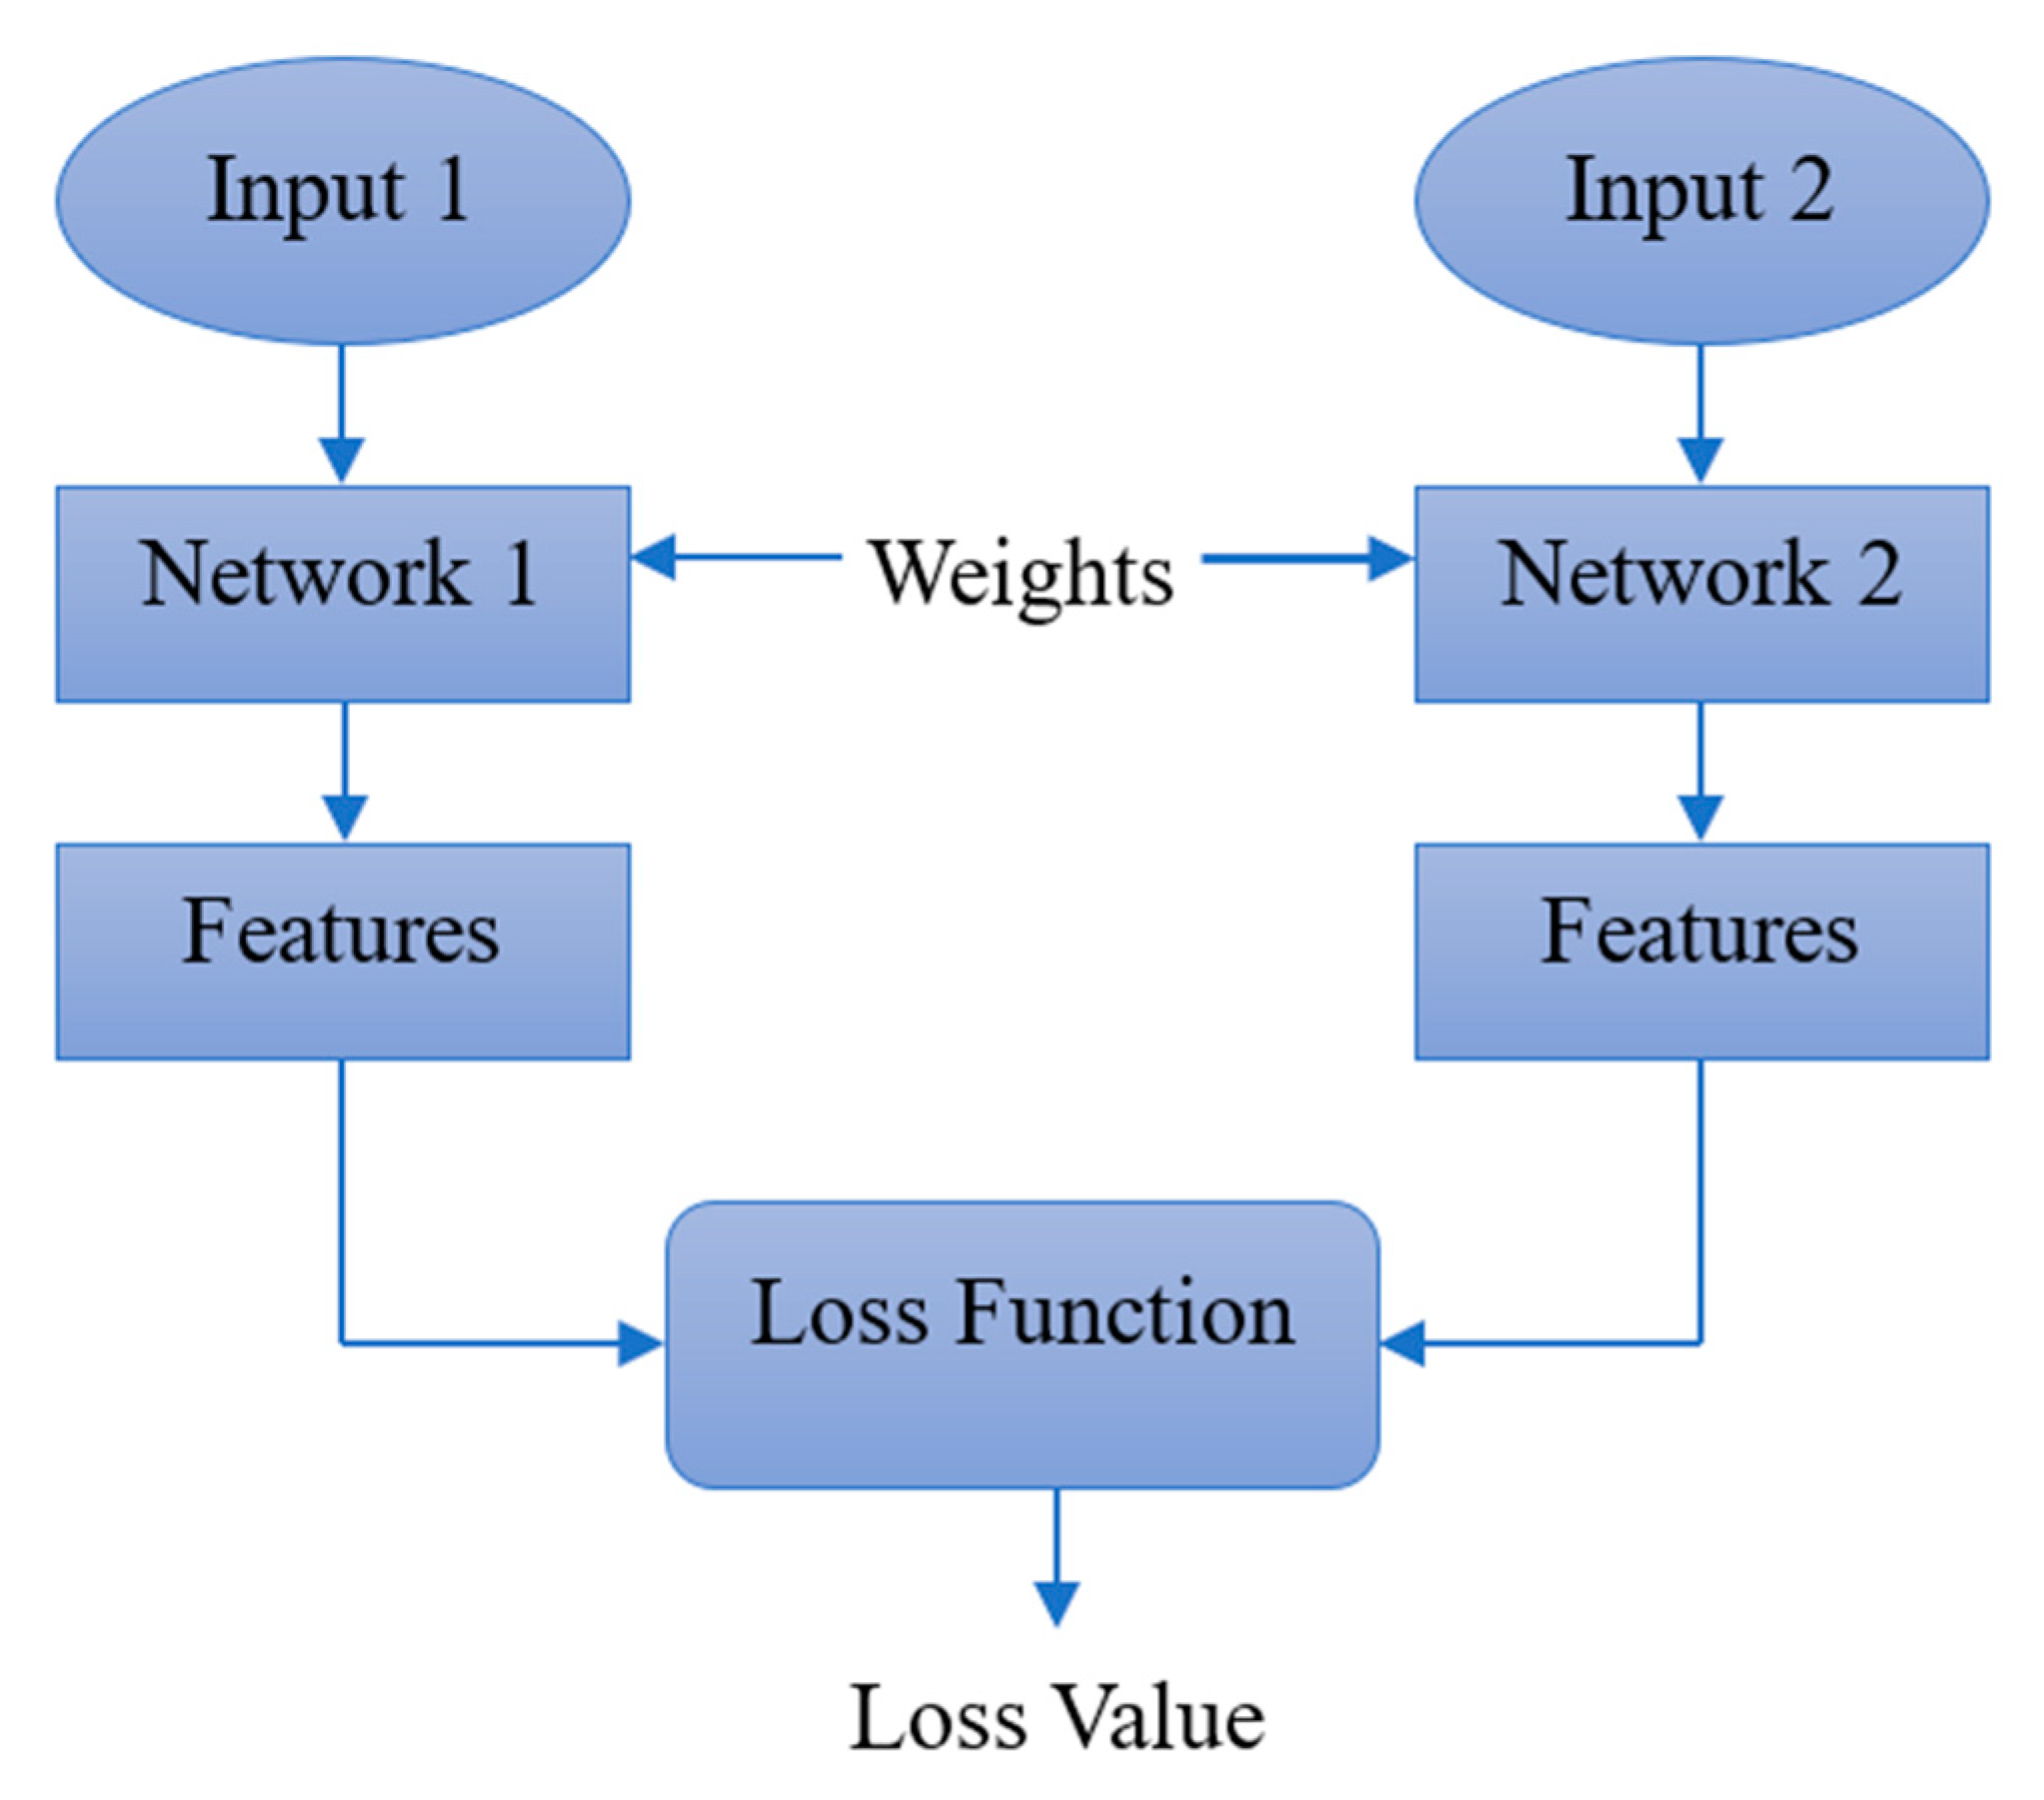
The Siamese network is a kind of neural network architecture that learns whether two input samples were similar or not based on comparisons in their features. It comprises two symmetries that have equivalent weights and normally employ the use of convolutional neural networks (CNNs) as a structure in feature extraction. CNNs use convolutional layers, which apply diverse filters to the input data to capture hierarchies of features in the space [22]. This process allows CNNs to fit complex patterns, starting with simple edges at the first layers and elaborate ones at the higher layers to describe the data at lower levels of detail; thus, they are most suitable when specific features of data should be analyzed, e.g., image and signal processing [23]. An overview of a CNN is shown in Figure 3.
As shown in Figure 3, a CNN is made up of two parallel structures of feature extraction using convolutional layers and pooling layers. The resulting extracted features are run through fully connected layers, and then the pooling layer classification is done to achieve the final output. The convolution and pooling layers are the ones doing the major work of hierarchy in feature extraction, and thus they are perfectly suitable for use in large data, image, and signal processing. The base structure of our Siamese network includes 2 identical subnetworks, with shared parameters. Each individual subnetwork can be classified as a hybrid model, with layer representations of 1D CNN preceded by a Bi-LSTM. The choice of design is to efficiently capture the sequential aspect of the consumption data: the 1D-CNN layers to identify the salient local patterns and features, and the bi-LSTM layer to learn long-range temporal contexts and dependencies. Each branch output provides a similarity comparison feature embedding vector.

3.2. Fundamentals of Bidirectional Long Short-Term Memory Networks

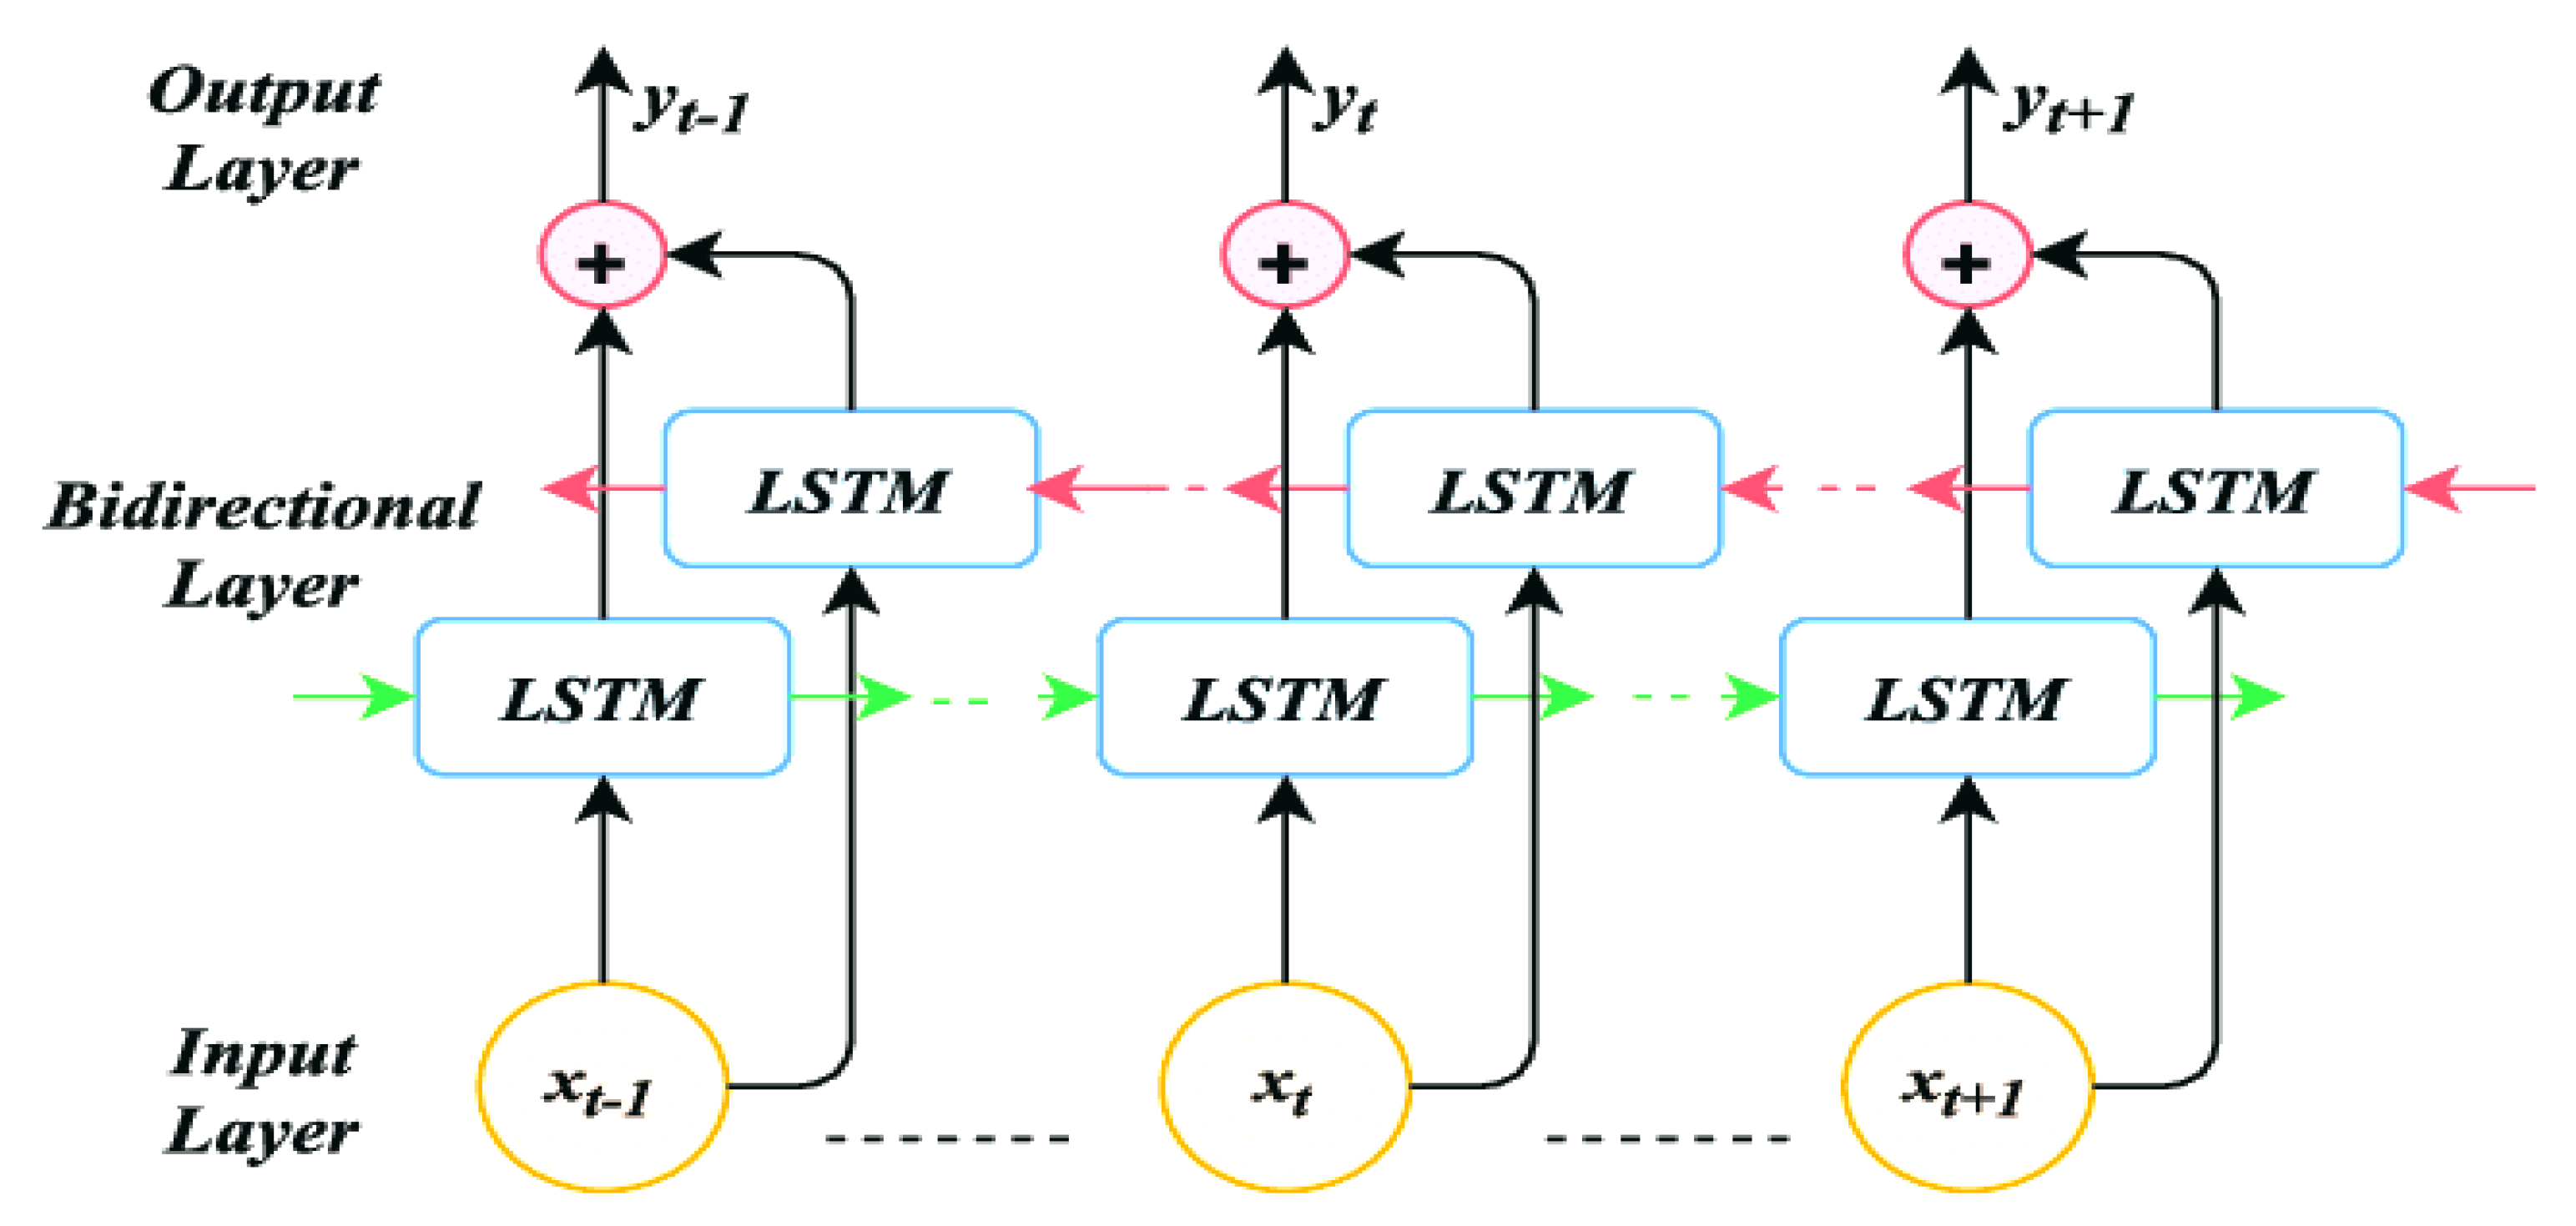
The Triplet Loss Siamese network aims to match the similarity of two input pairs or triplets. To enhance its performance in terms of detecting time-based energy consumption patterns in existing data, bidirectional long short-term memory networks (Bi-LSTMs) can be incorporated in each subnetwork. Such a combination makes Siamese architecture more effective in processing sequential data and enhancing its ability to differentiate between fraudulent and honest behavior. Bi-LSTM networks increase the functionality of conventional recurrent neural networks, since they treat each point of data in both directions, and reverse directions. A general overview of the Bi-LSTM network is shown in Figure 4.
This bidirectional nature makes this network sustain information of both the former and subsequent states, thus providing a more thorough account of time [24]. When it comes to time series data application, bi-LSTMs are especially good at it, e.g., speech and language processing, in which the two-sided situational context is essential for accurate interpretation.
Although the Bi-LSTM network is best suited for modeling bidirectional contextual dependency in time series data, introducing an attention mechanism can improve the network. Depending on the attention mechanism, the model can highlight a particular part of the input sequence, thus adding more value to the features that are crucial and resulting in better performance. The attention phenomenon, as shown in Figure 4, is used in a Siamese network, which allows the model to differentially weigh the components of the input in parallel and make decision-making more refined. The inputs are computed in parallel by shared weights (Q, K, V). The MathMul, Scale, and SoftMax functions are self-attention mechanisms, and the optional Mask implies sequential reading (e.g., NLP tasks). This structure computes similarity using two inputs at once in a Siamese network. In Triplet Loss, the network would embed anchor, with positive and negative samples, and the loss would only need to make sure that the anchor lies nearer the positive in the embedding space than the negative. The modular architecture emphasizes the effectiveness of weight-sharing and attention-based feature extraction. In the Siamese network architecture, the weight sharing principle is important and very useful, especially in matters concerning tasks that entail acquiring subtle differences regarding similar and dissimilar incidents. Furthermore, all the same subnetworks work on different input elements, mining pairs or triplets that have the same weights, so that every feature is extracted in the same way. The feature extraction performed by the subnetworks in Siamese networks is shown in Figure 5.
Due to uniformity and direct comparisons of various inputs, it is especially important to provide a valid comparison and contrast of inputs [25].

3.3. Stacking Meta-Classifier as a Decision Maker

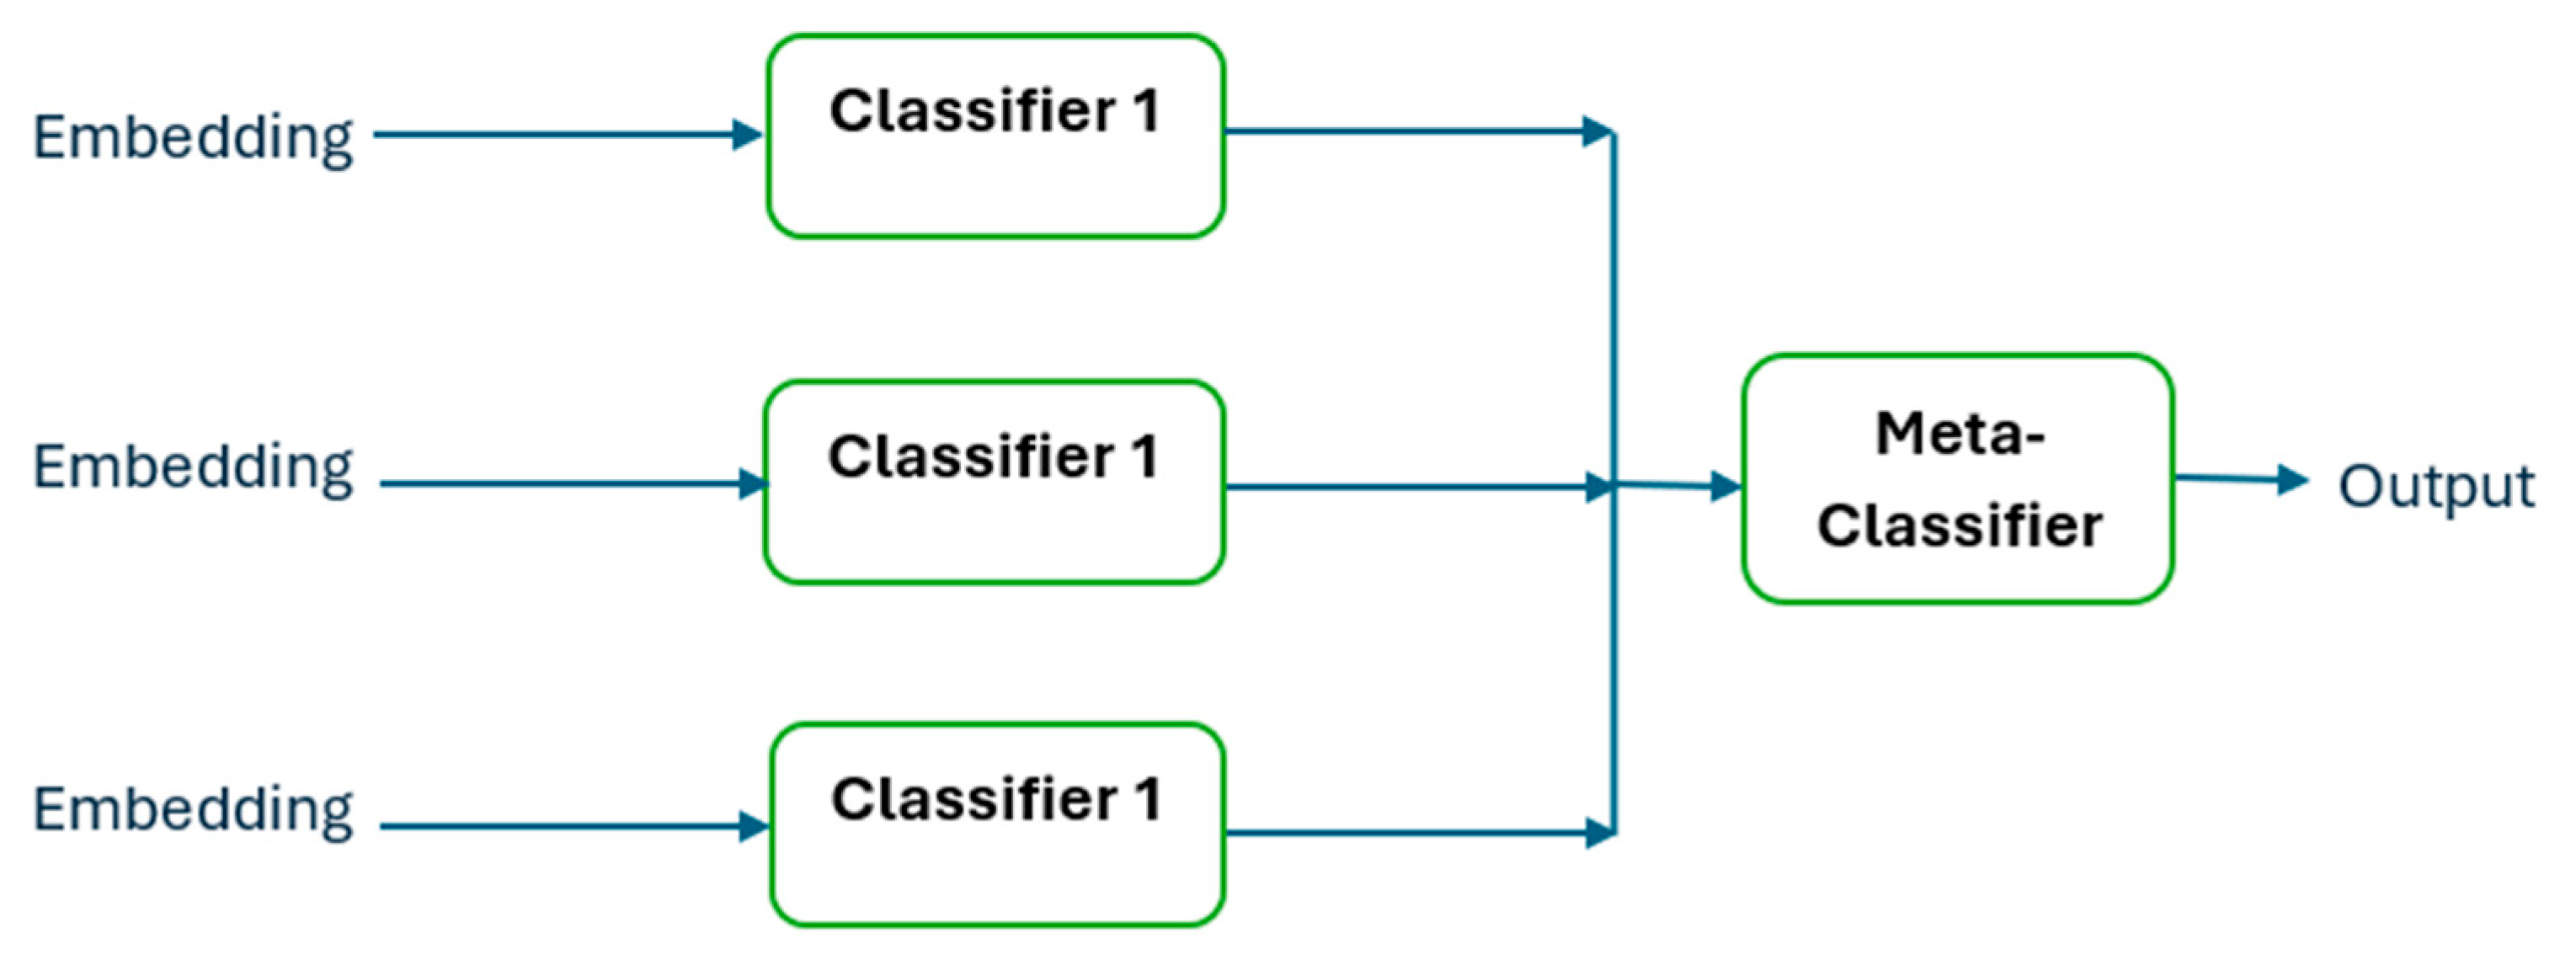
The last part of the intended system consists of the stacking meta-classifier, as shown in Figure 6. The meta-classifier performs the decision making and classifies the data into different classes. The meta-classifier is a combination of predictions with several base classifiers, following training on the embeddings [26]. The stacking method utilizes the disparity of its base classifiers, so it can make a classification decision that is more nuanced and thus more accurate. Figure 6 shows a block diagram of a stacking meta-classifier.
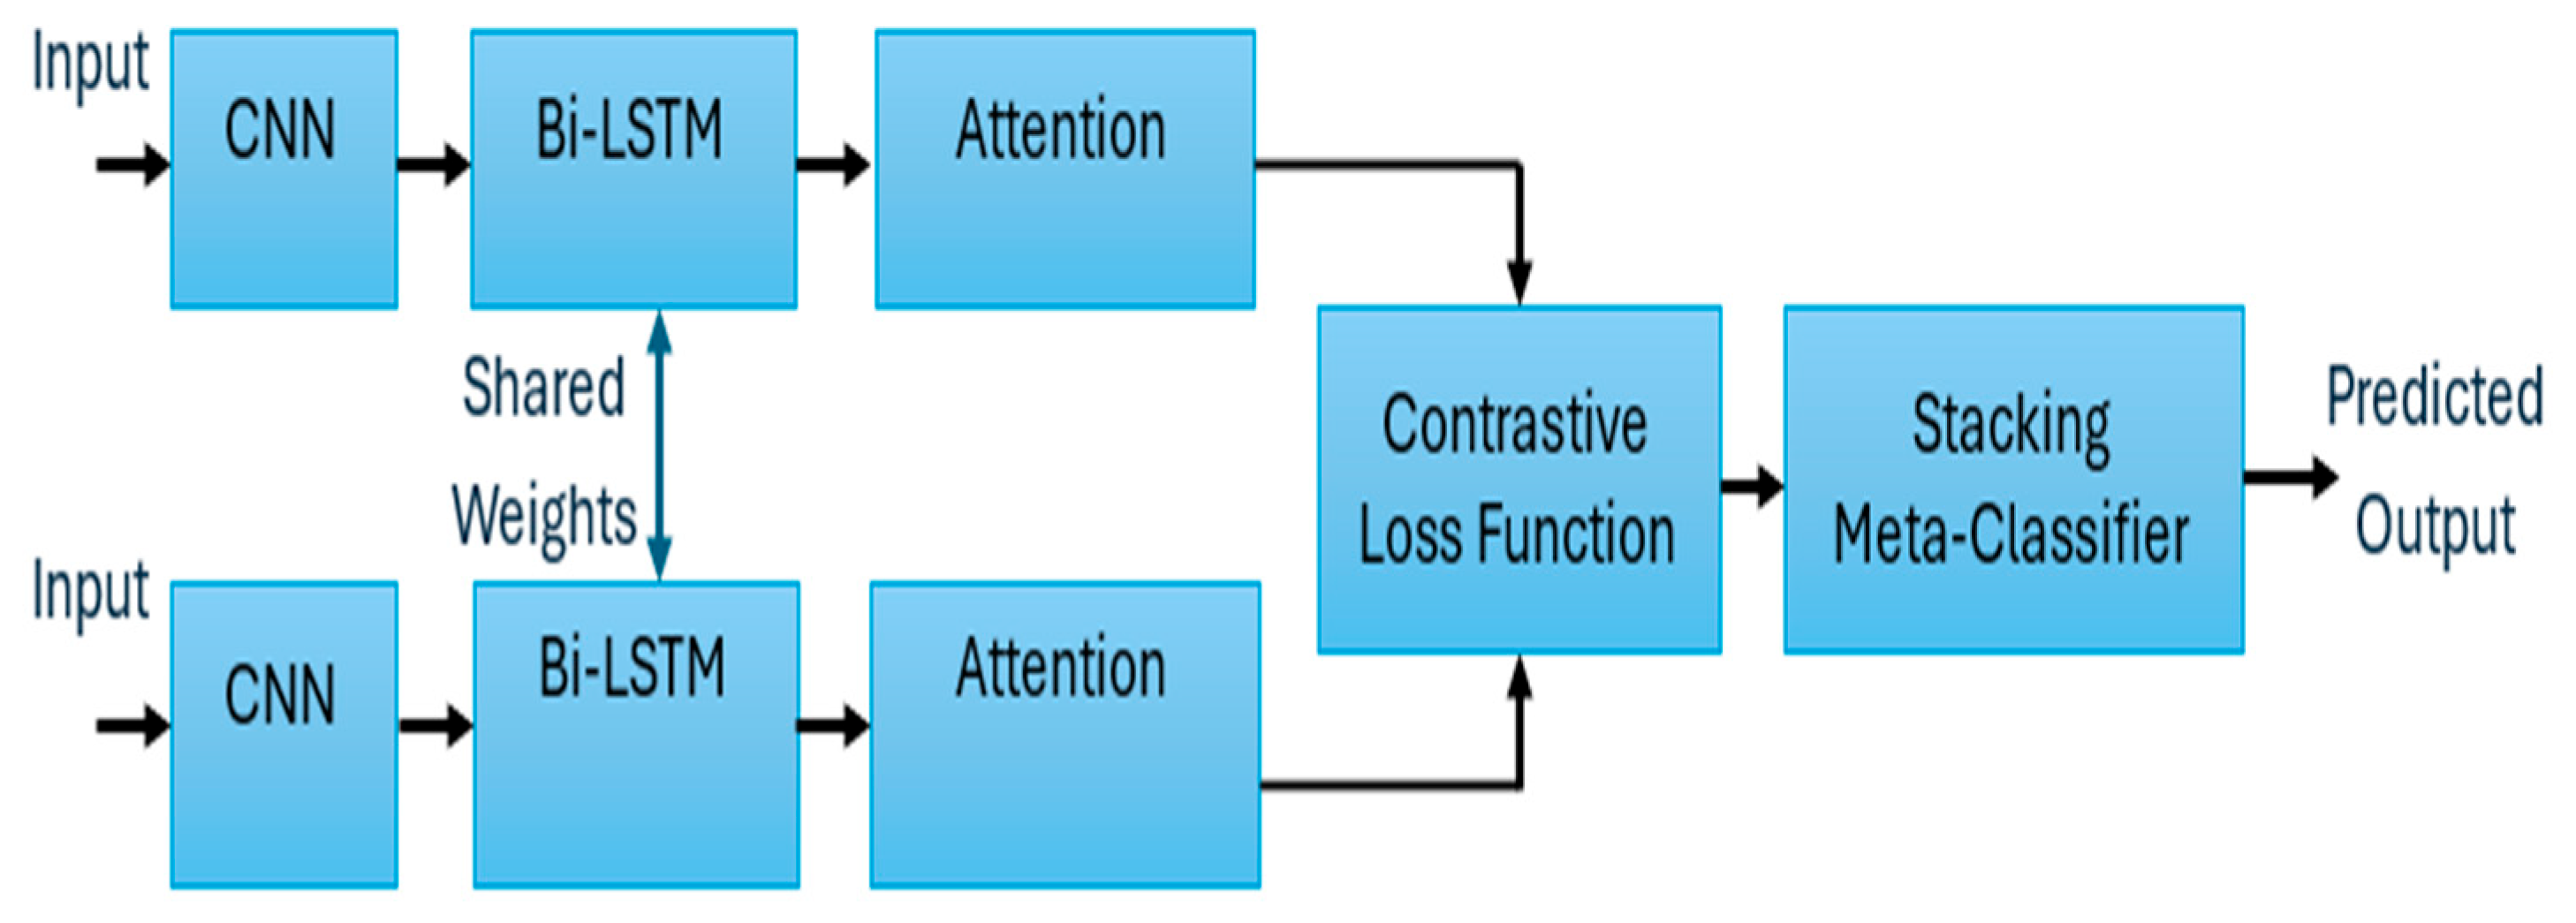
Finally, the whole phenomenon of a Siamese network with Triplet Loss that integrates the processing of input with convolutional neural networks (CNN) and bi-directional LSTMs (Bi-LSTM) is shown in Figure 7. The common weights of the two branches of a CNN and a Bi-LSTM are used to obtain features and are enhanced by the attention mechanism. The features are run through a Contrastive Loss function to gauge the distance between the inputs. Lastly, a stacking meta-classifier is applied to integrate the learnt features and output the final predicted result for classification. Figure 8 depicts the proposed Siamese neural network architecture with a contrastive loss function and a stacking meta-classifier.

3.4. Mathematical Model for Siamese Network and Loss Function

The input of both labeled classes x1 and x2 in the Siamese network are processed through identical subnetworks to obtain feature vectors for both positive class and negative class. The loss function is used to minimize the distance for similar pairs and maximize the distance for dissimilar pairs.
L c o n t r a s t i v e = y · D ( x 1 , x 2 ) 2 + 1 y · m a x ( 0 , m D ( x 1 , x 2 ) ) 2 2 1
where y is the label (1 for similar, 0 for dissimilar) and m is the margin. The final model output is the predicted similarity score.
ŷ = σ ( D ( x 1 , x 2 ) ) 2
The Triplet Loss function in the Siamese network ensures that the distance between the anchor and the positive pair is smaller than the distance between the anchor and the negative pair by a margin α:
L   t r i p l e t = m a x ( D ( a n c h o r p o s i t i v e ) 2 D a n c h o r n e g a t i v e ) 2 + α , 0
This function encourages the network to pull the anchor and the positive pair closer and push the anchor and negative pair farther apart. Hence, during training, the model minimizes the Triplet Loss by ensuring that the positive pair is closer than the negative pair.
M i n i m i z e   L   t r i p l e t = i = 1 N m a x ( D 2 ( a n c h o r i , p o s i t i v e i ) D 2 ( a n c h o r i , n e g a t i v e i ) + α , 0 )
This optimization process is carried out over all triplets in the training set. After training, the model outputs the feature vectors for the anchor, positive, and negative samples, which are used for similarity score calculation. Through rigorous Bayesian optimization, the final architecture of all Siamese branches, including their hyperparameters, was chosen to achieve the best performance. The feature extraction part is composed of two 1D convolutional layers with 64 and 32 filters, the perspective kernel size of 3, and ReLU activation, and it is followed by a max pooling layer. The final representation of the features is fed into a single-layer bi-directional LSTM that consists of 128 units going in each direction, with a dropout rate of 0.3 and a recursive dropout rate of 0.2. These vector outputs of the Bi-LSTM layer are used as input to a self-attention mechanism (additive style) to weight the most prominent temporal features. A context vector is then obtained by passing it through two fully connected layers (128 and 64 units, ReLU activation), and a dropout rate of 0.4 is applied to the first layer to obtain the final embedding vector. The training process of the model was performed with the Adam optimizer with a learning rate of 0.001 and a batch size of 64. The margin (a) of the Triplet Loss was set to 0.5. A Bayesian optimization search (100 trials) to maximize the F1 score on the validation set was used to select these particular values of the hyperparameters to ensure robust and reproducible model configurations.

4. Evaluation Metrics

The 10-fold cross-validation technique is used to measure the performance and robustness of the proposed Siamese network with Triplet Loss for electricity theft detection. This dataset is split into 10 equal subsets, and the model is trained on 9 subsets, and part of the 10 subsets that remain is left to test the model. This is done 10 times, with each subset taking its turn as the test set. Similar steps are used to obtain the average performance values (the accuracy, the precision, the TPR, the FPR, and the F1 score) using all 10 folds to obtain a more sound indication about the effectiveness of the model and also to make certain that the model can easily generalize across various splits of data in order to avoid any overfitting problems.
i.
Accuracy
Accuracy is an evaluation method of the overall correctness of a model calculating the ratio of the right instances predicted to the quantity of overall predictions.
A c c u r a c y = T P + T N T P + T N + F P + F N
where TP stands for true positive, TN stands for true negative, FP stands for false positive, and FN stands for false negative.
ii.
Precision
Precision tells us how many of the instances that have been positively predicted are really correct. It is a positive predictive value obtained by dividing true positives by the sum of true positives and false positives.
P r e c i s i o n = T P T P + F P
iii.
Sensitivity
Recall or sensitivity is the proportion of positive cases that are found by a model as a positive case.
S e n s i t i v i t y = T P T P + F N
iv.
False Positive Rate
The false positive rate (FPR) determines the percentage of the actual negative cases miscalculated as positive. It is the ratio of false positive to false positive and true negative.
F P R = F P F P + T N
v.
Area Under Curve (AUC)
It indicates the area under an ROC and is a single value that indicates the ability to differentiate the classes of the model into a single area across all thresholds.
vi.
F1 Score
The F1 score is the measure of the harmonic mean of precision and recall but exhibits the advantage of trading off between the two metrics to provide a more well-rounded measure of classification accuracy.
F 1   S c o r e = P e r c i s i o n . R e c a l l P e r c i s i o n + R e c a l l
These measures would help in assessing the overall performance of the model in various situations and make the model run optimally in various test setups.

5. Results and Discussion

The ROC and PR performance curve and their summary statistics (AUC and average precision) were computed using macro-averaging of all 10 folds of the cross-validation. This way of calculating the metrics measures the metrics on a per-class basis and combine them using unweighted averaging, thus providing a class-fair comparison, and is also resilient against the effects of class imbalance. The APS of precision–recall curve analysis is reported as a single scalar measurement representing an overall measure of the AP score. The suggested Siamese network with Triplet Loss is capable of greater performance in electricity theft detection than the rest of the machine learning models. It continued to show better accuracy, precision, and true positive rate (TPR) and kept the false positive rate (FPR) lower than that of other state-of-the-art machine learning algorithms such as SVM, decision trees, and other types of deep learning models [9,11,27]. Its resistance to adversarial evasion attacks further stands out, reporting excellent performance on all the important criteria, such as F1 score and AUC, as shown in Table 1.
The probability measures recorded in Table 1 (precision, FPR, etc.) involve a fixed probability level that would be considered positive (fraudulent) or negative (honest). The optimal cut-offs were defined on the validation set of each cross-validation fold, as the model with maximum Youden j statistic (J = Sens + Speicficity − 1). The approach will be used to choose a balanced operating point on the ROC that balances the two effects as equally important. The neural architecture formed by a CNN, a Bi-LSTM, and attention mechanisms is a complicated structure whose motivation for use needs to be demonstrated empirically. Table 2 reports the findings of a comprehensive ablation study, systematically examining how much performance is lost upon removing each component.
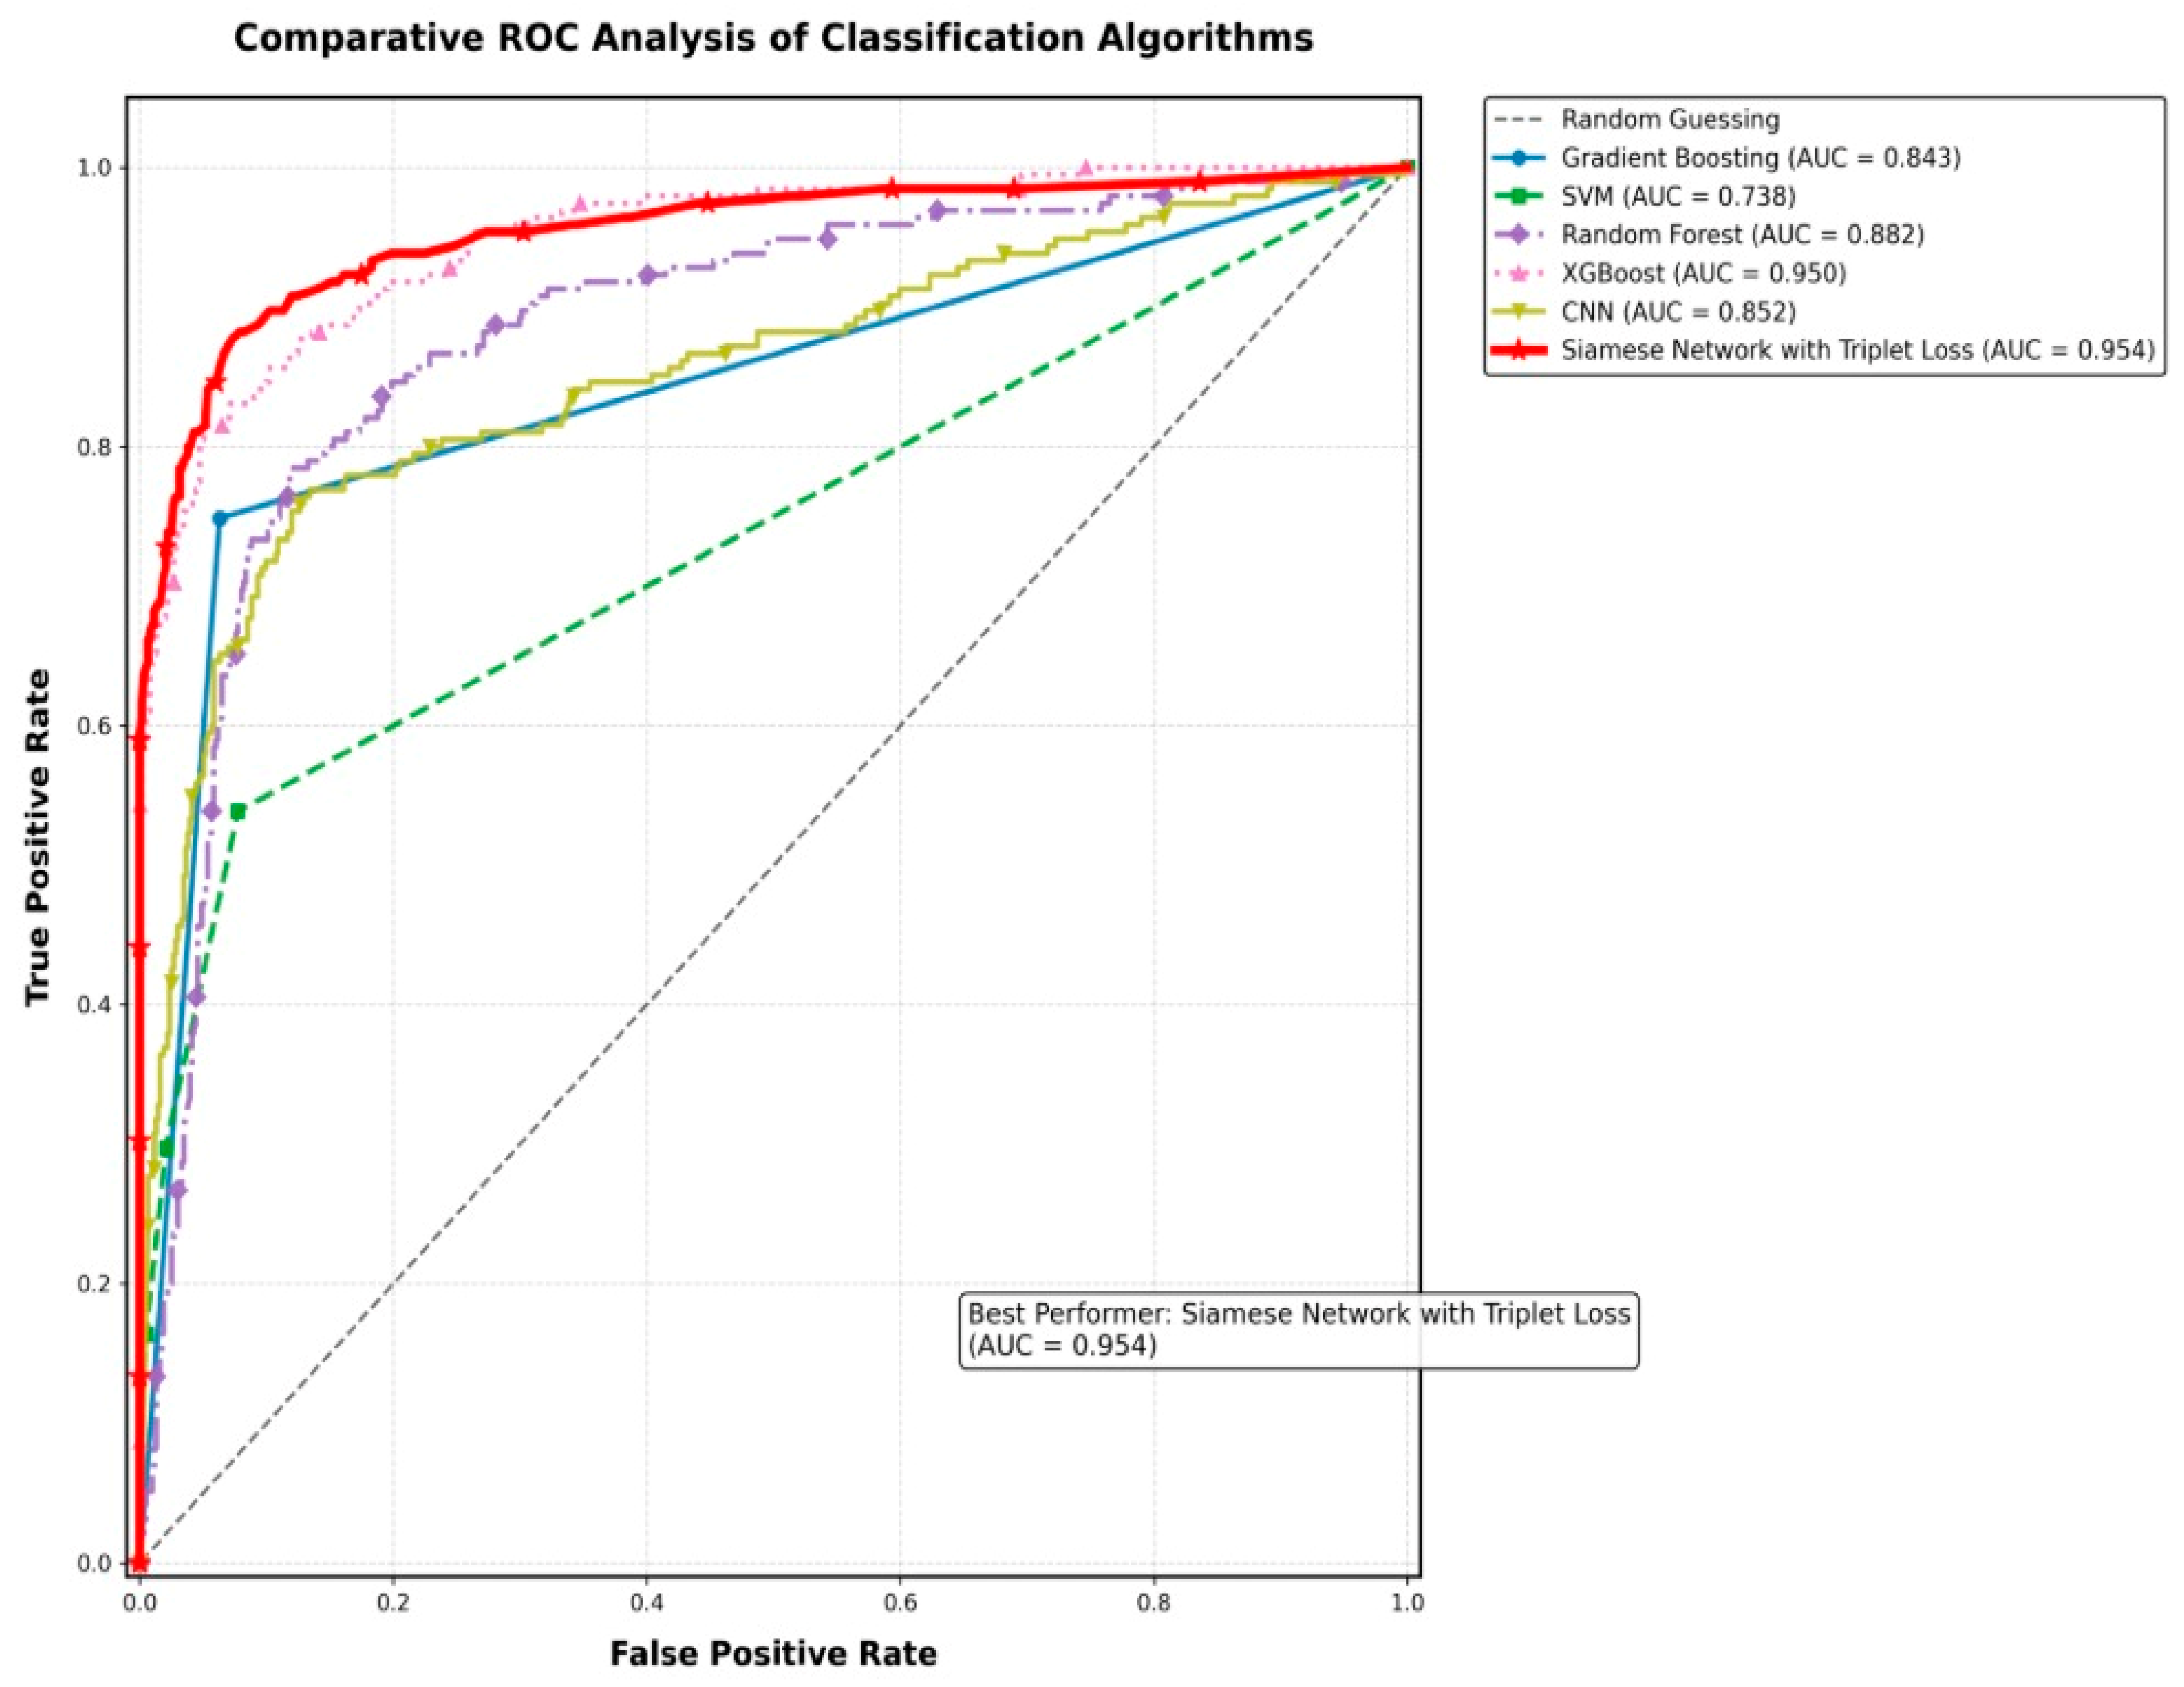
Such findings show that the Siamese network is effectively and reliably capable of detecting incorrect consumption patterns through smart grids. ROC curve analysis shows the high discriminative ability of the proposed Siamese Network with Triplet Loss, with an extremely high AUC score of 0.954, as shown in Figure 9, which is maximum compared to all the other evaluated learners. This is very good performance that bodes well with traditional algorithms and modern ensemble schemes. At each threshold, its ROC curve is closest to the upper-left corner; therefore, it has the best true positive values and few false alarms. The strength of this is attributed to the fact that it has strong potential toward metric learning, ensuring that classes are well separated in the embedding space. Its advantage over XGBoost and CNNs in terms of the AUC shows that it is a safe choice when it comes to the hard task of pattern recognition, particularly when features and their interrelationships are important.
Similarly, the precision–recall (PR) curve in Figure 10 shows that the Siamese network with Triplet Loss exhibits better performance compared to the conventional models, reaching an average precision that is significantly high.
The Siamese network demonstrates high precision (>90%) in all recall levels, implying that difficult situations should not be a problem. This improvement is due to its metric learning property, which does well in reducing the intra-class variance and in maximizing inter-class margin. The PR curve of the Siamese network dominates the top-right corner as it has the perfect balance between precision and recall, the essential chores of imbalanced datasets. These findings prove that it is superior in finely discriminative tasks.

5.1. Statistical Evaluation of Model Performance

In order to rigorously prove the performance boost of the proposed Siamese network and confirm that these results are statistically significant, we provided a statistical analysis based on the data obtained by 10-fold cross-validation. Table 3 presents the mean and standard deviation across folds only because there was no significant difference between the models or simulated measurements of the proposed evaluation metric. In addition, we tested the null hypothesis that the experiment comparing the proposed method with each baseline does not yield statistically significant results by using paired t-tests on the F1 scores as the robust metric that balances precision and recall.
The outcomes of the proposed and compared models presented in Table 1 show that the proposed model is superior to the other ones. Quantitatively, to clearly ensure that the improvements we observed were not based on chance at all but on dependable factors, we carried out a couple of statistical pair tests. Each test had the null hypothesis that would assert a lack of difference in the performance of the proposed Siamese network and a given baseline model. The results of these paired t-tests on the F1 scores for cross-validation folds are summarized in Table 4.

5.2. Computational Efficiency and Deployment Analysis

Although predictive accuracy is paramount, computational efficiency is also an important practical issue of deployment of the algorithm in the real-time environment of smart grid systems. In this regard, we measured the training and inference speed of all the models. All experiments were performed on a regular PC with the following specifications: Intel Core i7-10700K, 32 GB RAM, and one NVIDIA GeForce RTX 3080.
Table 5 demonstrates one of the main trade-offs; though simpler models, such as XGBoost, are more computationally efficient, the proposed Siamese network promises higher accuracy at the cost of longer training time. Importantly, its inference speed is feasible in large-scale batch processing, qualifying it as a candidate in utility backend systems in which detection is the main consideration. The superiority of the model is due to its design. The Triplet Loss approach uses metric learning, resulting in an embedding space where fraud and legitimate patterns are more distinguishable than in the feature space used by point-wise classifiers such as XGBoost. More importantly, the CNN-BiLSTM backbone can learn optimal features in hierarchies to detect both short- and long-term anomalies and contextual patterns more efficiently in comparison with manually engineered features. This is a combination that is uniquely matched to the esoteric character of electricity theft.

5.3. Limitations and Future Work

Although this work proves that the suggested Siamese network is highly accurate in electricity theft detection, we also admit that the study has some limitations corresponding to the areas of possible future research studies. Adversarial Robustness: Our work has not affirmed the robustness of the model against intelligent adversaries. An adversary might also train optimum perturbations into consumption data to create adversarial examples that might avoid detection. The next important step would be to explore defensive strategies like adversarial training or certified ro-bust training of Siamese networks to make the model more robust to such targeted adversaries before deployment into the real world.
Real-Time Deployment: The proposed model was analyzed in an offline, offline batch-processing environment. In real-time operation, where the detection of fraud can be flagged at minutes or hours, even more optimization is possible. Table 5 (computational performance) reveals that our model is acceptable for use in the daily closing analysis of websites but yet to pass the test of real-time restriction-bound systems. We are currently working on compression methods for the model, including pruning and quantization, and on the development of a trimmer version of the architecture to allow streaming analysis as well as incorporation of the analysis into edge devices or smart meter gateways within the AMI network. Sensitivity to Data Characteristics: The model performance with regard to different class imbalances or differences in the scale of the fraud (i.e., small-scale vs. large-scale theft) was not extensively evaluated. A worthwhile future improvement would be to conduct a sensitivity analysis to evaluate the robustness of the model under variations in these variables and to extend further to more advanced techniques of generative learning networks such as generative adversarial networks (GANs) to generate synthetic fraudulent consumption data. Future research projects on enhancing the robustness, efficiency, and potential applicability of the suggested detection system will be based on overcoming these limitations.

6. Conclusions

In this study, the Siamese network with Triplet Loss was proposed to detect electricity theft in smart grids. The experimental findings, which are proved by rigorous 10-fold cross-validation, show that the proposed model performs better than all baseline models, thereby demonstrating state-of-the-art performance. Quantitatively, the model performance was 95.4% (accuracy, 0.018) and 92.0% (precision), whereas the F1 score was 93.0% (0.010), which is a significant improvement compared to the second-best model, XGBoost, with an F1 score of 89.0%. Moreover, these improvements are significant, as statistical testing showed that the paired t-test against all the baselines yielded p-values < 0.001. The model was also able to produce the highest AUC (0.96) as well as the smallest false positive rate (0.05), which demonstrates the reliability and precision of the model in the context of discriminating between fraudulent and legitimate consumers. This paper proposed a novel ML-based technique to detect electricity theft in smart grids using Siamese networks with the Triplet Loss function. The combination of the Siamese network and the Triplet Loss function provides model with excellent ability to differentiate between legitimate and fraudulent consumption patterns. The 10-fold cross-validation was used to generalize the results and avoid overfitting. The proposed model outperformed conventional ML models in terms of all utilized performance evaluation metrics under identical features and computational resources. Our findings show that the proposed method is not only a more accurate way of detecting anomalies, but it also provides greater robustness to adversarial manipulations, thus making it a feasible solution for securing smart grid infrastructures. Its ability to perform well in detecting scenarios, together with the capability of withholding evasion attacks, makes the Siamese network with Triplet Loss a potential tool for emerging practical electricity detection systems used in modern smart grids.

Author Contributions

Conceptualization, T.A. and M.S.S.; methodology, M.S.S. and Z.A.A.; software, M.S.S. and M.A.; validation. M.I.M., M.B. and T.A.; formal analysis, M.S.S. and M.S.; investigation, M.I.M. and M.S.; resources, M.I.M.; data curation, T.A.; writing—original draft preparation, T.A. and M.S.; writing—review and editing, T.A.; visualization, M.I.M.; supervision, M.B.; project administration, M.I.M.; funding acquisition, M.I.M. All authors have read and agreed to the published version of the manuscript.

Funding

This research received no external funding.

Data Availability Statement

The data presented in this study are available on request from the corresponding author.

Conflicts of Interest

Author Muhammad Salman Saeed was employed by the Multan Electric Power Company. The remaining authors declare that the research was conducted in the absence of any commercial or financial relationships that could be construed as a potential conflict of interest.

References

  1. Kessides, I.N. Chaos in power: Pakistan’s electricity crisis. Energy Policy 2013, 55, 271–285. [Google Scholar] [CrossRef]
  2. Wang, Z.; Hou, H.; Wei, R.; Li, Z. A Distributed Market-Aided Restoration Approach of Multi-Energy Distribution Systems Considering Comprehensive Uncertainties from Typhoon Disaster. IEEE Trans. Smart Grid 2025, 16, 3743–3757. [Google Scholar] [CrossRef]
  3. Saeed, M.S.; Mustafa, M.W.; Sheikh, U.U.; Jumani, T.A.; Mirjat, N.H. Ensemble bagged tree based classification for reducing non-technical losses in multan electric power company of Pakistan. Electronics 2019, 8, 860. [Google Scholar] [CrossRef]
  4. Guo, X.; Yin, Y.; Dong, C.; Yang, G.; Zhou, G. On the class imbalance problem. In Proceedings of the 2008 Fourth International Conference on Natural Computation, Jinan, China, 18–20 October 2008. [Google Scholar] [CrossRef]
  5. Hussain, S.; Mustafa, M.W.; Jumani, T.A.; Baloch, S.K.; Saeed, M.S. A novel unsupervised feature-based approach for electricity theft detection using robust PCA and outlier removal clustering algorithm. Int. Trans. Electr. Energy Syst. 2020, 30, e12572. [Google Scholar] [CrossRef]
  6. Liao, W.; Yang, D.; Ge, L.; Jia, Y.; Yang, Z. Electricity theft detection in integrated energy systems considering multi-energy loads. Int. J. Electr. Power Energy Syst. 2025, 164, 110428. [Google Scholar] [CrossRef]
  7. Tiwari, R.S.; Sharma, J.P.; Gupta, O.H.; Ahmed Abdullah Sufyan, M. Extension of pole differential current based relaying for bipolar LCC HVDC lines. Sci. Rep. 2025, 15, 16142. [Google Scholar] [CrossRef] [PubMed]
  8. Tursunboev, J.; Palakonda, V.; Kang, J.M. Multi-Objective Evolutionary Hybrid Deep Learning for energy theft detection. Appl. Energy 2024, 363, 122847. [Google Scholar] [CrossRef]
  9. Messinis, G.M.; Hatziargyriou, N.D. Review of non-technical loss detection methods. Electr. Power Syst. Res. 2018, 158, 250–266. [Google Scholar] [CrossRef]
  10. Jokar, P.; Arianpoo, N.; Leung, V.C.M. Electricity theft detection in AMI using customers’ consumption patterns. IEEE Trans. Smart Grid 2016, 7, 216–226. [Google Scholar] [CrossRef]
  11. Jindal, A.; Dua, A.; Kaur, K.; Singh, M.; Kumar, N.; Mishra, S. Decision Tree and SVM-Based Data Analytics for Theft Detection in Smart Grid. IEEE Trans. Ind. Inform. 2016, 12, 1005–1016. [Google Scholar] [CrossRef]
  12. Nawaz, A.; Ali, T.; Mustafa, G.; Rehman, S.U.; Rashid, M.R. A novel technique for detecting electricity theft in secure smart grids using CNN and XG-boost. Intell. Syst. Appl. 2023, 17, 200168. [Google Scholar] [CrossRef]
  13. Zheng, Z.; Yang, Y.; Niu, X.; Dai, H.-N.; Zhou, Y. Wide and Deep Convolutional Neural Networks for Electricity-Theft Detection to Secure Smart Grids. IEEE Trans. Ind. Inform. 2018, 14, 1606–1615. [Google Scholar] [CrossRef]
  14. Salman Saeed, M.; Mustafa, M.W.; Sheikh, U.U.; Jumani, T.A.; Khan, I.; Atawneh, S.; Hamadneh, N.N. An Efficient Boosted C5.0 Decision-Tree-Based Classification Approach for Detecting Non-Technical Losses in Power Utilities. Energies 2020, 13, 3242. [Google Scholar] [CrossRef]
  15. Saeed, M.S.; Mustafa, M.W.; Sheikh, U.U.; Khidrani, A.; Mohd, M.N.H. Theft Detection in Power Utilities Using Ensemble of Chaid Decision Tree Algorithm. Sci. Proc. Ser. 2020, 2, 161–165. [Google Scholar] [CrossRef]
  16. Nabil, M.; Ismail, M.; Mohmoud, M.; Shahin, M.; Qaraqe, K.; Serpedin, E. Deep Recurrent Electricity Theft Detection in AMI Networks with Random Tuning of Hyper-parameters. arXiv 2018, arXiv:1809.01774v1. [Google Scholar] [CrossRef]
  17. Glauner, P.; Boechat, A.; Dolberg, L.; State, R.; Bettinger, F.; Rangoni, Y.; Duarte, D. Large-scale detection of non-technical losses in imbalanced data sets. In Proceedings of the 2016 IEEE Power and Energy Society Innovative Smart Grid Technologies Conference, ISGT 2016, Minneapolis, MN, USA, 6–9 September 2016; pp. 1–5. [Google Scholar] [CrossRef]
  18. Xia, X.; Xiao, Y.; Liang, W.; Cui, J. Detection Methods in Smart Meters for Electricity Thefts: A Survey. Proc. IEEE 2022, 110, 273–319. [Google Scholar] [CrossRef]
  19. Reddy, M.S.; Lakshmi, A.A.; Reddy, G.S.; Madhavi, B.K.; Panigrahi, B.S.; Mohan, V. Signature Forgery Detection using Siamese-Convolutional Neural Network. In Proceedings of the 2024 1st International Conference on Cognitive, Green and Ubiquitous Computing (IC-CGU), Bhubaneswar, India, 1–2 March 2024; pp. 1–5. [Google Scholar] [CrossRef]
  20. Gupta, R.; Kashyap, I.; Jindal, V. SBiLM: Siamese Bi-LSTM model for handling imbalance in fake review detection. Procedia Comput. Sci. 2024, 235, 1157–1166. [Google Scholar] [CrossRef]
  21. Tapia, J.E.; Schulz, D.; Busch, C. Single-morphing attack detection using few-shot learning and triplet-loss. Neurocomputing 2025, 636, 130033. [Google Scholar] [CrossRef]
  22. Ullah, K.; Ahsan, M.; Hasanat, S.M.; Haris, M.; Yousaf, H.; Raza, S.F.; Tandon, R.; Abid, S.; Ullah, Z. Short-Term Load Forecasting: A Comprehensive Review and Simulation Study with CNN-LSTM Hybrids Approach. IEEE Access 2024, 12, 111858–111881. [Google Scholar] [CrossRef]
  23. Dao, F.; Zeng, Y.; Qian, J. Fault diagnosis of hydro-turbine via the incorporation of bayesian algorithm optimized CNN-LSTM neural network. Energy 2024, 290, 130326. [Google Scholar] [CrossRef]
  24. Sherkatghanad, Z.; Ghazanfari, A.; Makarenkov, V. A self-attention-based CNN-Bi-LSTM model for accurate state-of-charge estimation of lithium-ion batteries. J. Energy Storage 2024, 88, 111524. [Google Scholar] [CrossRef]
  25. Mahmudul Hasan, A.S.M.; Diepeveen, D.; Laga, H.; Jones, M.G.; Muzahid, A.; Sohel, F. Morphology-based weed type recognition using Siamese network. Eur. J. Agron. 2025, 163, 127439. [Google Scholar] [CrossRef]
  26. Liu, Z.; Huang, H.; Dong, H.; Xing, F. IoU-guided Siamese network with high-confidence template fusion for visual tracking. Neurocomputing 2025, 614, 128774. [Google Scholar] [CrossRef]
  27. Nagi, J.; Yap, K.S.; Tiong, S.K.; Ahmed, S.K.; Nagi, F. Improving SVM-based nontechnical loss detection in power utility using the fuzzy inference system. IEEE Trans. Power Deliv. 2011, 26, 1284–1285. [Google Scholar] [CrossRef]
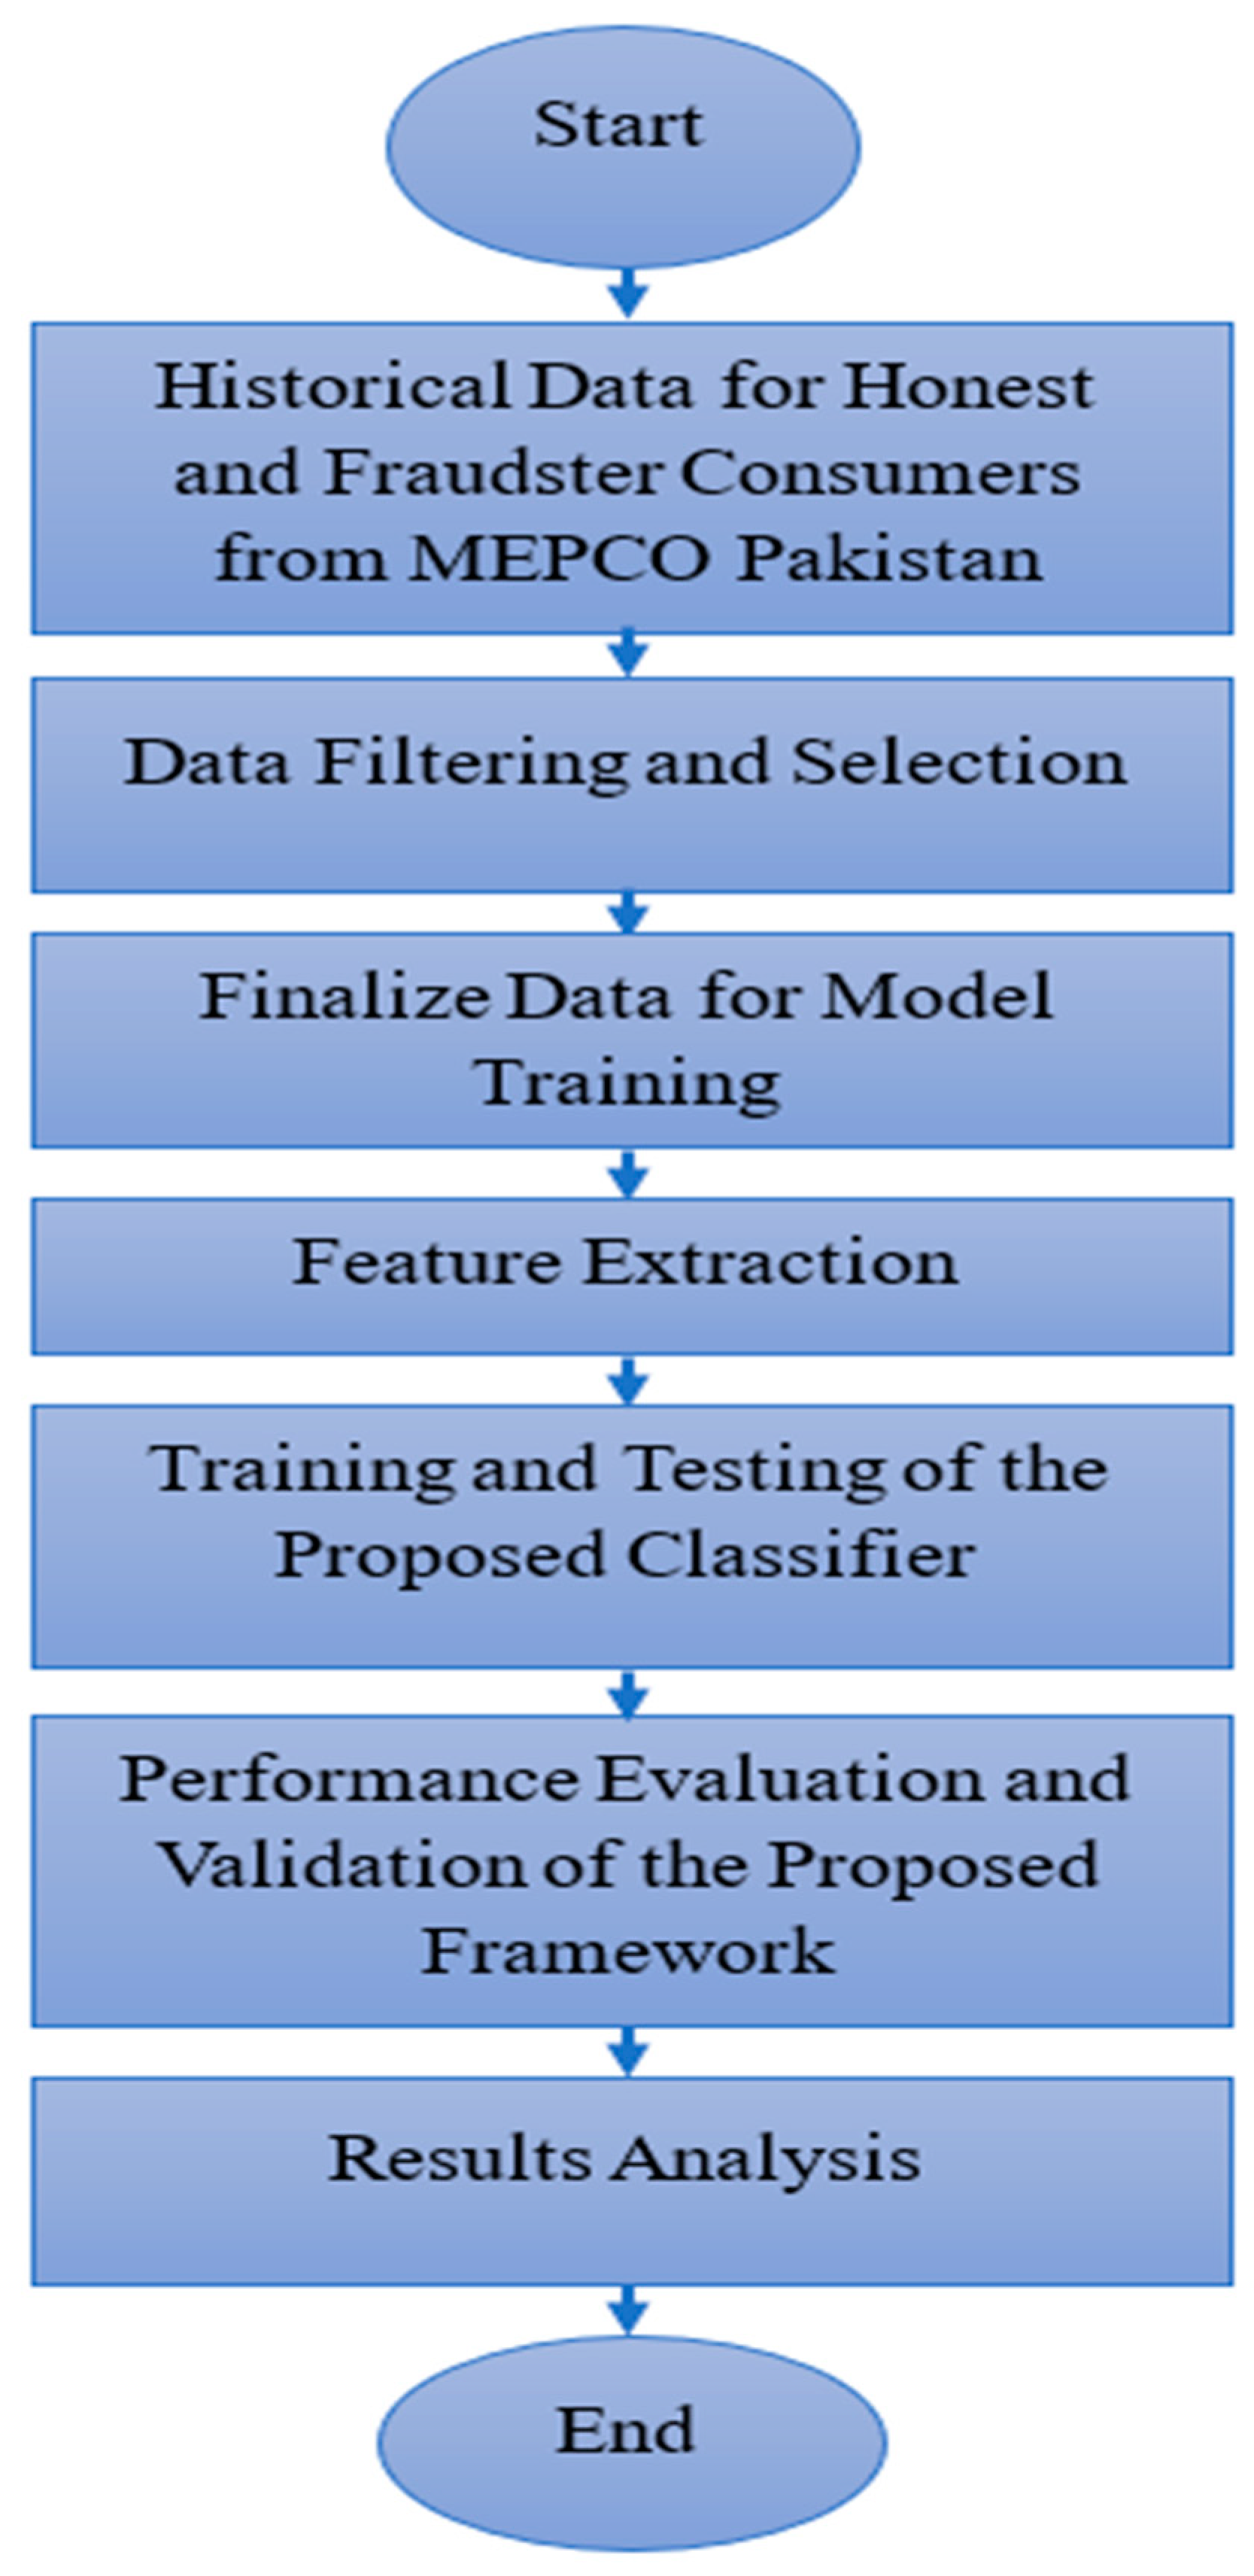
Figure 1. Methodological flowchart of the proposed framework.
Energies 18 04957 g001
Figure 2. Feature importance ranking for electricity theft detection.
Energies 18 04957 g002
Figure 3. Convolutional neural network architecture [22].
Energies 18 04957 g003
Figure 4. Bi-LSTM network [24].
Energies 18 04957 g004
Figure 5. Attention phenomenon in a Siamese network [24].
Energies 18 04957 g005
Figure 6. Generic Siamese network.
Energies 18 04957 g006
Figure 7. Block diagram representation of a stacking meta-classifier.
Energies 18 04957 g007
Figure 8. Siamese network-based model for classification.
Energies 18 04957 g008
Figure 9. Comparison of ROC performance of all classification algorithms.
Energies 18 04957 g009
Figure 10. Comparison of the precision–recall performance of all classification algorithms.
Energies 18 04957 g010
Table 1. Comparison of the proposed Siamese model and other algorithms.
AlgorithmAccuracyPrecisionTPR (Recall)FPRAUCF1 Score
SVM0.85 ± 0.020.84 ± 0.030.83 ± 0.030.12 ± 0.020.89 ± 0.010.83 ± 0.02
Random Forest0.88 ± 0.010.86 ± 0.020.85 ± 0.020.10 ± 0.010.88 ± 0.010.85 ± 0.02
Gradient Boosting0.90 ± 0.010.88 ± 0.020.89 ± 0.020.08 ± 0.010.92 ± 0.010.88 ± 0.02
XGBoost0.91 ± 0.010.89 ± 0.020.90 ± 0.020.07 ± 0.010.93 ± 0.010.89 ± 0.01
CNN0.87 ± 0.020.86 ± 0.030.85 ± 0.030.11 ± 0.020.90 ± 0.010.85 ± 0.02
Siamese Network (Proposed)0.954 ± 0.0080.92 ± 0.010.94 ± 0.010.05 ± 0.0080.96 ± 0.0070.93 ± 0.009
Results are reported as mean ± standard deviation across 10-fold cross-validation. The classification threshold for point metrics was selected per fold by maximizing Youden’s J statistic.
Table 2. Ablation study on the input of major architectural units in the model performance.
Model VariantAccuracyPrecisionF1-ScoreAUC
Full Proposed Model0.954 ± 0.0080.920 ± 0.0160.930 ± 0.0100.960 ± 0.012
w/o Bi-LSTM0.925 ± 0.0120.885 ± 0.0200.895 ± 0.0150.935 ± 0.015
w/o Attention0.938 ± 0.0100.905 ± 0.0180.915 ± 0.0130.948 ± 0.014
w/o Meta-Classifier0.931 ± 0.0110.892 ± 0.0190.905 ± 0.0140.941 ± 0.016
CNN-Only Backbone0.910 ± 0.0150.870 ± 0.0220.880 ± 0.0170.925 ± 0.018
Table 3. Comparative performance analysis of different algorithms (mean ± standard deviation).
AlgorithmAccuracyPrecisionTPRFPRAUCF1 Score
SVM0.850 ± 0.0220.840 ± 0.0250.830 ± 0.0200.120 ± 0.0150.890 ± 0.0180.830 ± 0.015
Random Forest0.880 ± 0.0180.860 ± 0.0200.850 ± 0.0180.100 ± 0.0120.880 ± 0.0150.850 ± 0.012
Gradient Boosting0.900 ± 0.0160.880 ± 0.0180.890 ± 0.0160.080 ± 0.0100.920 ± 0.0140.880 ± 0.012
XGBoost0.910 ± 0.0150.890 ± 0.0170.900 ± 0.0150.070 ± 0.0090.930 ± 0.0130.890 ± 0.011
CNN0.870 ± 0.0190.860 ± 0.0210.850 ± 0.0190.110 ± 0.0140.900 ± 0.0160.850 ± 0.013
Siamese Network (Proposed)0.954 ± 0.0180.920 ± 0.0160.940 ± 0.0150.050 ± 0.0080.960 ± 0.0120.930 ± 0.010
Table 4. Statistically significant improvement in F1 score.
Comparison ModelMean F1 Differencet-Statisticp-Value
SVM−0.100−25.00<0.001
Random Forest−0.080−22.00<0.001
Gradient Boosting−0.050−18.00<0.001
XGBoost−0.040−15.00<0.001
CNN−0.080−20.00<0.001
The p-value of paired t-test of the improvement of F1 score between baselines and the proposed Siamese network.
Table 5. Computational performance comparison of the evaluated models.
ModelAvg. Training Time (s)Avg. Inference Time per Sample (ms)Model Size (MB)
SVM12.5 ± 2.10.05 ± 0.011.2
Random Forest8.3 ± 1.50.15 ± 0.033.8
Gradient Boosting22.7 ± 3.80.08 ± 0.022.5
XGBoost6.1 ± 1.20.04 ± 0.010.9
CNN145.3 ± 15.61.25 ± 0.1515.7
Siamese Network (Ours)183.5 ± 18.91.42 ± 0.1818.2
Disclaimer/Publisher’s Note: The statements, opinions and data contained in all publications are solely those of the individual author(s) and contributor(s) and not of MDPI and/or the editor(s). MDPI and/or the editor(s) disclaim responsibility for any injury to people or property resulting from any ideas, methods, instructions or products referred to in the content.