Article

Has the “Belt and Road Initiative” Promoted Chinese OFDI in Green Energy? Evidence from Chinese Energy Engagement in BRI Countries

1
School of Business, Qingdao University, Qingdao 266071, China
2
Institute of Belt and Road, Qingdao University, Qingdao 266071, China
3
State Key Laboratory of Tibetan Plateau Earth System, Environment and Resources (TPESER), Institute of Tibetan Plateau Research, Chinese Academy of Sciences, Beijing 100101, China
4
Faculty of Geographical Science, Beijing Normal University, Beijing 100875, China
*
Author to whom correspondence should be addressed.
Energies 2025, 18(19), 5268; https://doi.org/10.3390/en18195268
Submission received: 20 August 2025 / Revised: 27 September 2025 / Accepted: 28 September 2025 / Published: 3 October 2025
(This article belongs to the Section B: Energy and Environment)

Abstract

The advancement of green energy is a crucial mechanism for balancing economic growth with environmental sustainability, helping to mitigate conflicts between development and ecological preservation. This paper assesses the policy effects of the Belt and Road Initiative (BRI) on China’s overseas green energy projects (including gas) using the difference-in-difference (DID) model from 2009 to 2022. The findings show that, overall, the BRI has notably augmented China’s green energy projects in the BRI countries. This result remains robust after excluding potential interference from Nationally Determined Contributions (NDCs). Specifically, its promotional effect shows heterogeneity. Firstly, the BRI has shown significant regional differences in promoting the development of China’s overseas green energy projects. Secondly, the BRI is more effective in promoting green energy projects in developing and low-risk countries compared to developed and high-risk countries. Additionally, it indicates that the BRI boosts green energy projects in BRI countries by enhancing their infrastructure quality, encompassing transportation, energy, communication, and financial infrastructure. Finally, based on the above findings, this paper provides context-specific recommendations aimed at enhancing the effectiveness of the BRI in promoting sustainable green energy cooperation.

1. Introduction

The world is currently grappling with a range of challenges, including the depletion of energy resources [1], intensifying climate change [2], and pressing energy security issues [3]. Enhancing energy efficiency and accelerating the adoption of green energy have become central pillars in addressing these pressing challenges. Consequently, countries around the world are making significant deployments in green energy, with notable initiatives including the EU’s REPowerEU and the United States’ Inflation Reduction Act [4]. The Belt and Road Initiative (BRI) presents China with an opportunity to take a leading role within the global shift toward renewable energy [5]. While extensive attention has been devoted to examining the policy implications of the BRI, its potential for global sustainable development and climate governance leadership remains underestimated [6].
With the growing concern about climate change, the link between the BRI and sustainable development has become a public theme in many areas [7]. While numerous empirical studies have shown that China’s BRI can effectively improve energy efficiency [8], reduce carbon emissions [9,10], and enhance environmental quality [11,12], other research has raised concerns about the environmental risks associated with BRI projects [13,14]. Developing countries participate in the BRI in pursuit of shared development and inequality reduction, which are fundamental rights for people and nations. It is inappropriate to discuss the impact of the BRI on sustainable development in a manner that completely ignores the economic interests of the participating countries, since the concept of sustainable development aims to integrate environmental concerns with socioeconomic dimensions [15]. The advancement of green energy is an effective mechanism for reconciling economic development and environmental conservation [16,17]. However, although green energy is a central topic within the BRI, there remains a lack of research on the causal identification of policy effects taking green energy as the entry point. This paper examines the ways in which the BRI affects China’s green energy projects to contribute valuable insights to the literature on its role in promoting energy transition and enrich the broader discourse on the implications of China’s international cooperation on sustainable development.
Since the BRI was proposed in 2013, China’s energy investment has demonstrated rapid growth, thanks to the Chinese government’s comprehensive policy communication, strategic alignment, and market operation with BRI countries [18,19]. China’s role in the global energy market has surpassed its traditional position as an energy producer and importer, evolving into a significant investor and practitioner in energy projects [20]. The shift in China’s energy engagement towards green energy [21] will undoubtedly contribute to enhancing energy efficiency and accelerating the energy transition. Liu et al. [22] examined the BRI’s promotional influence on China’s green energy investment based on micro-enterprise-level data. Wang and Lin [23] found that China’s energy projects are cleaner than those from other countries after the BRI by constructing a counterfactual scenario. While these studies provide valuable insights, they exhibit several limitations: First, Liu et al. [22] studied the impact of BRI on Chinese enterprises’ green energy investments without accounting for domestic and firm-level influencing factors. Second, they focus on direct impact, without further exploring the underlying mechanisms through which the BRI affects China’s green energy projects across partner nations. Therefore, this paper aims to further examine the promoting effects of the BRI on China’s overseas green energy engagement, building on existing research, and to provide a systematic analysis of its underlying mechanisms.
The research in this paper differs from prior studies in the following ways: (1) it focuses on China’s green energy projects (including not only renewable energy but also gas) and empirically examines the policy impact of the BRI using a difference-in-differences (DID) model, based on aggregated national-level panel data. Results based only on alternative energy and hydro projects are also presented; (2) unlike previous studies that only focus on policy effects, it further explores the mechanism of the BRI to promote China’s overseas green energy projects, and reveals how the BRI have improved the infrastructure conditions of BRI countries, thereby influencing the location choice of green energy projects; (3) it expands the determinants of green energy projects through an examination of the heterogeneous characteristics of the policy effect, and identifies the role of improving the institutional environment in attracting China’s green energy investment, contributing to the development of the “Green Silk Road”.

2. Literature Review and Hypothesis

2.1. China’s BRI and Green Energy Projects

The transition toward low-emission fuels and renewable energy has been recognized as a key strategy to simultaneously address sustainable energy supply and climate issues [24]. Green energy can minimize the detrimental effects on the environment while meeting the energy needs of industry and local applications. Consequently, it provides developing nations with limited environmental governance capacity an opportunity to pursue climate goals alongside economic development [25]. Nevertheless, green energy projects confront persistent barriers due to high investment costs, high risks, and long payback periods [26,27]. Historically, technology transfer referred specifically to North–South transfers [28] because green energy technology has been dominated by developed countries. China’s growing capacity for innovation has reshaped this dynamic, establishing South–South and South–North technology cooperation as a new framework [29]. Under this framework, China becomes a major player in the global green energy transition [30], complementing the green infrastructure financing of developed investors [31].
Policy plays a significant role in influencing investment. Governments in emerging markets can stimulate investment and foster enterprise development through institutional support and the formulation of effective policies [32]. Home country institutions, in the form of policies, can significantly influence the willingness and capacity of emerging market firms to make overseas investments by providing financial support, information, protection, and other channels [33]. The BRI has notably diminished policy uncertainty in host countries [34] and mitigated the adverse effects of host country political risk [35] on China’s overseas investment. Regarding the relationship between the BRI and energy transition, existing studies have found that the initiative not only promotes China’s overseas green energy investments [22] and projects [23], but also enhances renewable energy financing by Chinese policy banks [36], contributing to the energy transition [37]. Early investment endeavors by China in BRI countries were primarily concentrated in the energy and mining sectors, particularly focusing on traditional energy sources. In 2021, China made a commitment to refrain from constructing any new overseas coal power projects and pledged robust support for the advancement of green energy in developing countries. Among the eight actions outlined during the Third “Belt and Road” International Cooperation Summit Forum, there is a clear emphasis on promoting green development, which includes fostering cooperation in green infrastructure, green energy, and green transportation. These actions demonstrate China’s determination to tackle climate change. Currently, China has emerged as the largest contributor to global energy transition investments. China’s cumulative energy transition investments have reached half of the global total. In 2023, China’s energy transition investment reached $676 billion, representing 38% of the total global energy transition investments [38]. China’s investment in BRI countries has transitioned towards clean energy and eco-friendly investments, with investments in green and low-carbon energy already surpassing those in traditional energy sources. As Figure 1 shows, after 2013, the proportion of China’s green energy projects has been on an overall upward trend. Drawing upon the preceding analysis, this paper proposes the first hypothesis:
H1. 
The BRI can promote China’s green energy projects.

2.2. China’s BRI, Infrastructure and Green Energy Projects

Connectivity serves as the foundational requirement for regions to benefit from globalization [39]. Before the BRI was proposed, developing countries were being marginalized within the global policy arena, constraining their participation in global sustainable development governance [40]. The BRI has a special focus on least developed countries, landlocked developing countries, small island developing states, and middle-income countries [41] to provide them with reliable and affordable infrastructure [42].
The characteristics of green energy dictate the high requirements for power infrastructure [43] and financial instruments [44]. Infrastructure availability is routinely incorporated in evaluating the economic potential of fossil fuel resource investments. Importantly, this factor retains equivalent significance for evaluating the economic potential of renewable energy investments. In the era of decarbonization, advantages and disadvantages will increasingly be contingent on access to technology and infrastructure rather than solely on access to energy resources [45]. Kozlova & Collan [46] suggested measuring regional accessibility in terms of transportation costs and infrastructure quality, particularly focusing on the condition of the electricity grid, when assessing the investment appeal of renewable energy projects. Renewable energy sources inherently place demand on the power system. Consequently, all power systems must possess substantial infrastructure primarily dedicated to maintaining grid stability and reliability [47]. Furthermore, the level of financial development can signify the ease or difficulty of green investment [48]. A sound financial system is particularly crucial for renewable energy projects, given their typically higher investment requirements compared to non-renewable energy ventures [49]. Countries with well-developed financial systems are capable of offering tailored financial instruments needed for investments in green energy and innovation [50], lowering the investment expenses associated with renewable energy projects. Skare et al. [51] identified the financial system in East Asia and the Pacific as a key impediment to investment in sustainable technologies. In addition, transportation efficiency and the quality and accessibility of telecommunication networks are key determinants in the decision-making of foreign investors [34,52,53,54,55,56].
Most of the BRI countries are relatively underdeveloped in terms of infrastructure: deficiencies in transportation (e.g., roads, railways, and ports), energy and electricity infrastructure shortages, and limited communication networks not only hinder the economic development of these countries, but also impede trade cooperation and the attraction of investment from other countries [56,57]. As a platform for practical cooperation centered on infrastructure construction [58,59], the BRI has demonstrated great potential to improve the hard infrastructure of transportation, communication [60], and financial infrastructure [61], and reduce the cost of the grid [62], enabling these countries to quickly integrate into the process of economic globalization [42]. Therefore, this paper proposes the second hypothesis:
H2. 
The BRI can lead to an increase in China’s green energy projects by improving necessary infrastructure conditions in home countries.
Building on the two hypotheses outlined above, a framework is proposed (see Figure 2) to depict how the BRI exerts its effects on China’s overseas green energy engagement.

3. Materials and Methods

3.1. Sample and Data

The data on green energy projects is a summary of the amount of investment and construction projects invested by China’s energy companies at the host country level, sourced from the Chinese Global Investment Tracker [63]. Trade data are obtained from UN Comtrade, and the other control data are obtained from the World Bank Development Indicator Database and World Bank Worldwide Governance Indicators Database. From 2009 to 2022, 543 investment and construction events in the green energy sector by China’s firms in 106 host countries were compiled, an initial sample of 355 observations. Due to missing key data for several countries (Including Brunei, Cuba, Equatorial Guinea, Eritrea, Moldova, Myanmar, South Sudan, Syria, Turkey, Turkmenistan, Yemen, and Venezuela), the final dataset covers 95 host countries (42 BRI countries) with 329 valid observations. The specific 42 BRI countries involved in China’s green energy projects are shown in Table 1, and the key descriptive metrics for the control variables included in the regression analysis are shown in Table 2.
Dependent variable: The dependent variable, lnP, represents China’s green energy projects and is measured by the logarithmic term of project values (in million USD), including China’s overseas investment and construction in alternative, hydro, and gas. In a narrow sense, green energy is limited to renewable energy sources that can be naturally replenished after use and generate minimal or no pollutants. However, in a broader sense, green energy extends to certain non-renewable energy sources, including coal and oil processed using clean energy technologies, natural gas, and nuclear energy, which can minimize ecological pollution during production and consumption [64]. The shift to renewable energy is critical to achieving carbon neutrality, but requires a stable energy source for the transition. The inherent uncertainty and intermittent nature of renewable energy generation affect power system stability [65], and these challenges are exacerbated as the penetration of renewable energy source systems increases [66]. Therefore, in the short to medium term, humankind will not be able to break away from its dependence on non-renewable energy and will have to try to choose relatively clean non-renewable energy for proper utilization. Natural gas is regarded as a relatively clean energy source, emitting minimal pollutants compared to other fossil fuels [67] and thus serves as an important transitional energy source and has a significant role in the early stages of the energy transition [68]. Therefore, this paper operationalizes projects in the fields of alternative energy, hydropower, and gas as green energy projects.
Control variables: The control variables are the characteristics of the host country, including economic conditions, natural resources, and institutional quality. The control variables are as follows: (1) Per capita GDP (perGDP) and GDP growth (GDPgrowth): they reflect the size of the economy and energy market potential. (2) Natural resource endowment (Res): it measures the natural resource abundance. (3) Total population (Pop): It reflects the energy market size. (4) Electric power gap (PG): It reflects the self-sufficiency in electricity and the potential for the development of the electricity market. (5) Trade (Tra): it reflects the level of activity in its external economic engagements between the host country and China. (6) Dependence on foreign investment (Fdi): it not only reflects the extent to which economic growth depends on foreign investment but also can reflect the economic openness and investment attractiveness. (7) Institutional variables, including institutional distance (ID), the control of corruption (Cor), the efficiency of the government (Gov), the voice and accountability (Voi), and the level of the rule of law (Law): they reflect the institutional environment of the host country and the degree of difference in the institutional environments between two countries or regions. These factors all have a potential impact on cross-border energy projects.

3.2. Model Setting

The DID model is an effective method for assessing the effectiveness of policy implementation. It can eliminate the permanent differences between treatment and control groups, as well as biases arising from temporal variations [69], and identify the net effect of policy. By 2024, China has signed cooperation documents on the BRI with 152 countries and 32 international organizations. However, taking into account various challenges, including the identification of BRI members and the availability of data, this paper draws on the methodologies of Fang et al. [70] and Muhammad et al. [71] to adopt the commonly used list of 65 countries as participants in the BRI (In the final analysis sample, 42 of these 65 countries are included (Table 1).). This offers an effective quasi-natural experiment for evaluating the promotion effect on China’s green energy projects through a specific policy event. Therefore, this paper identifies the BRI-participating countries as the treatment group and the non-BRI countries as the control group. The DID model is then constructed as follows to estimate the difference in China’s overseas green energy projects before and after the BRI:
ln P i t = β × bri _ after it + γ X i t + φ t + α i   +   ε i t
b r i _ a f t e r i t =   b r i i   ×   a f t e r t
where Formula (1) is a DID model that incorporates both year and country fixed effects. In the model, i denotes the host country, t denotes the year and lnPit is the explanatory variable in this paper, denoting the logarithm of the item amount of green energy in host country i in year t. brii and aftert are dummy variables. brii is a treatment group dummy variable that takes the value of 1 if the host country is a BRI country and 0 if the host country is a non-BRI country. aftert is a treatment effect period dummy variable that takes the value of 1 if the year is after 2013, and zero otherwise. bri_aftertit is the DID interaction term, which is the core explanatory variable in this paper, employed to estimate the policy impact of the BRI. Xit represents a set of country-level characteristic variables, φt controls for time fixed effect, αi controls for country fixed effect, εit represents the random perturbation term and β is the estimated coefficient of most interest, which can be interpreted as the effect of the BRI on China’s overseas green energy projects in this model.

4. Empirical Results

4.1. Benchmark Regression

This paper evaluates the influence of the BRI on China’s green energy projects by constructing the DID model, and the estimation results are shown in Table 3 Column (1) reports the baseline regression results without control variables, while Column (2) presents the results with controls. The findings consistently indicate that the BRI has a significant promotional effect on the development of China’s large-scale green energy projects, regardless of the inclusion of control variables. Thus, Hypothesis 1 is empirically supported.

4.2. Parallel Trend Assumption Test

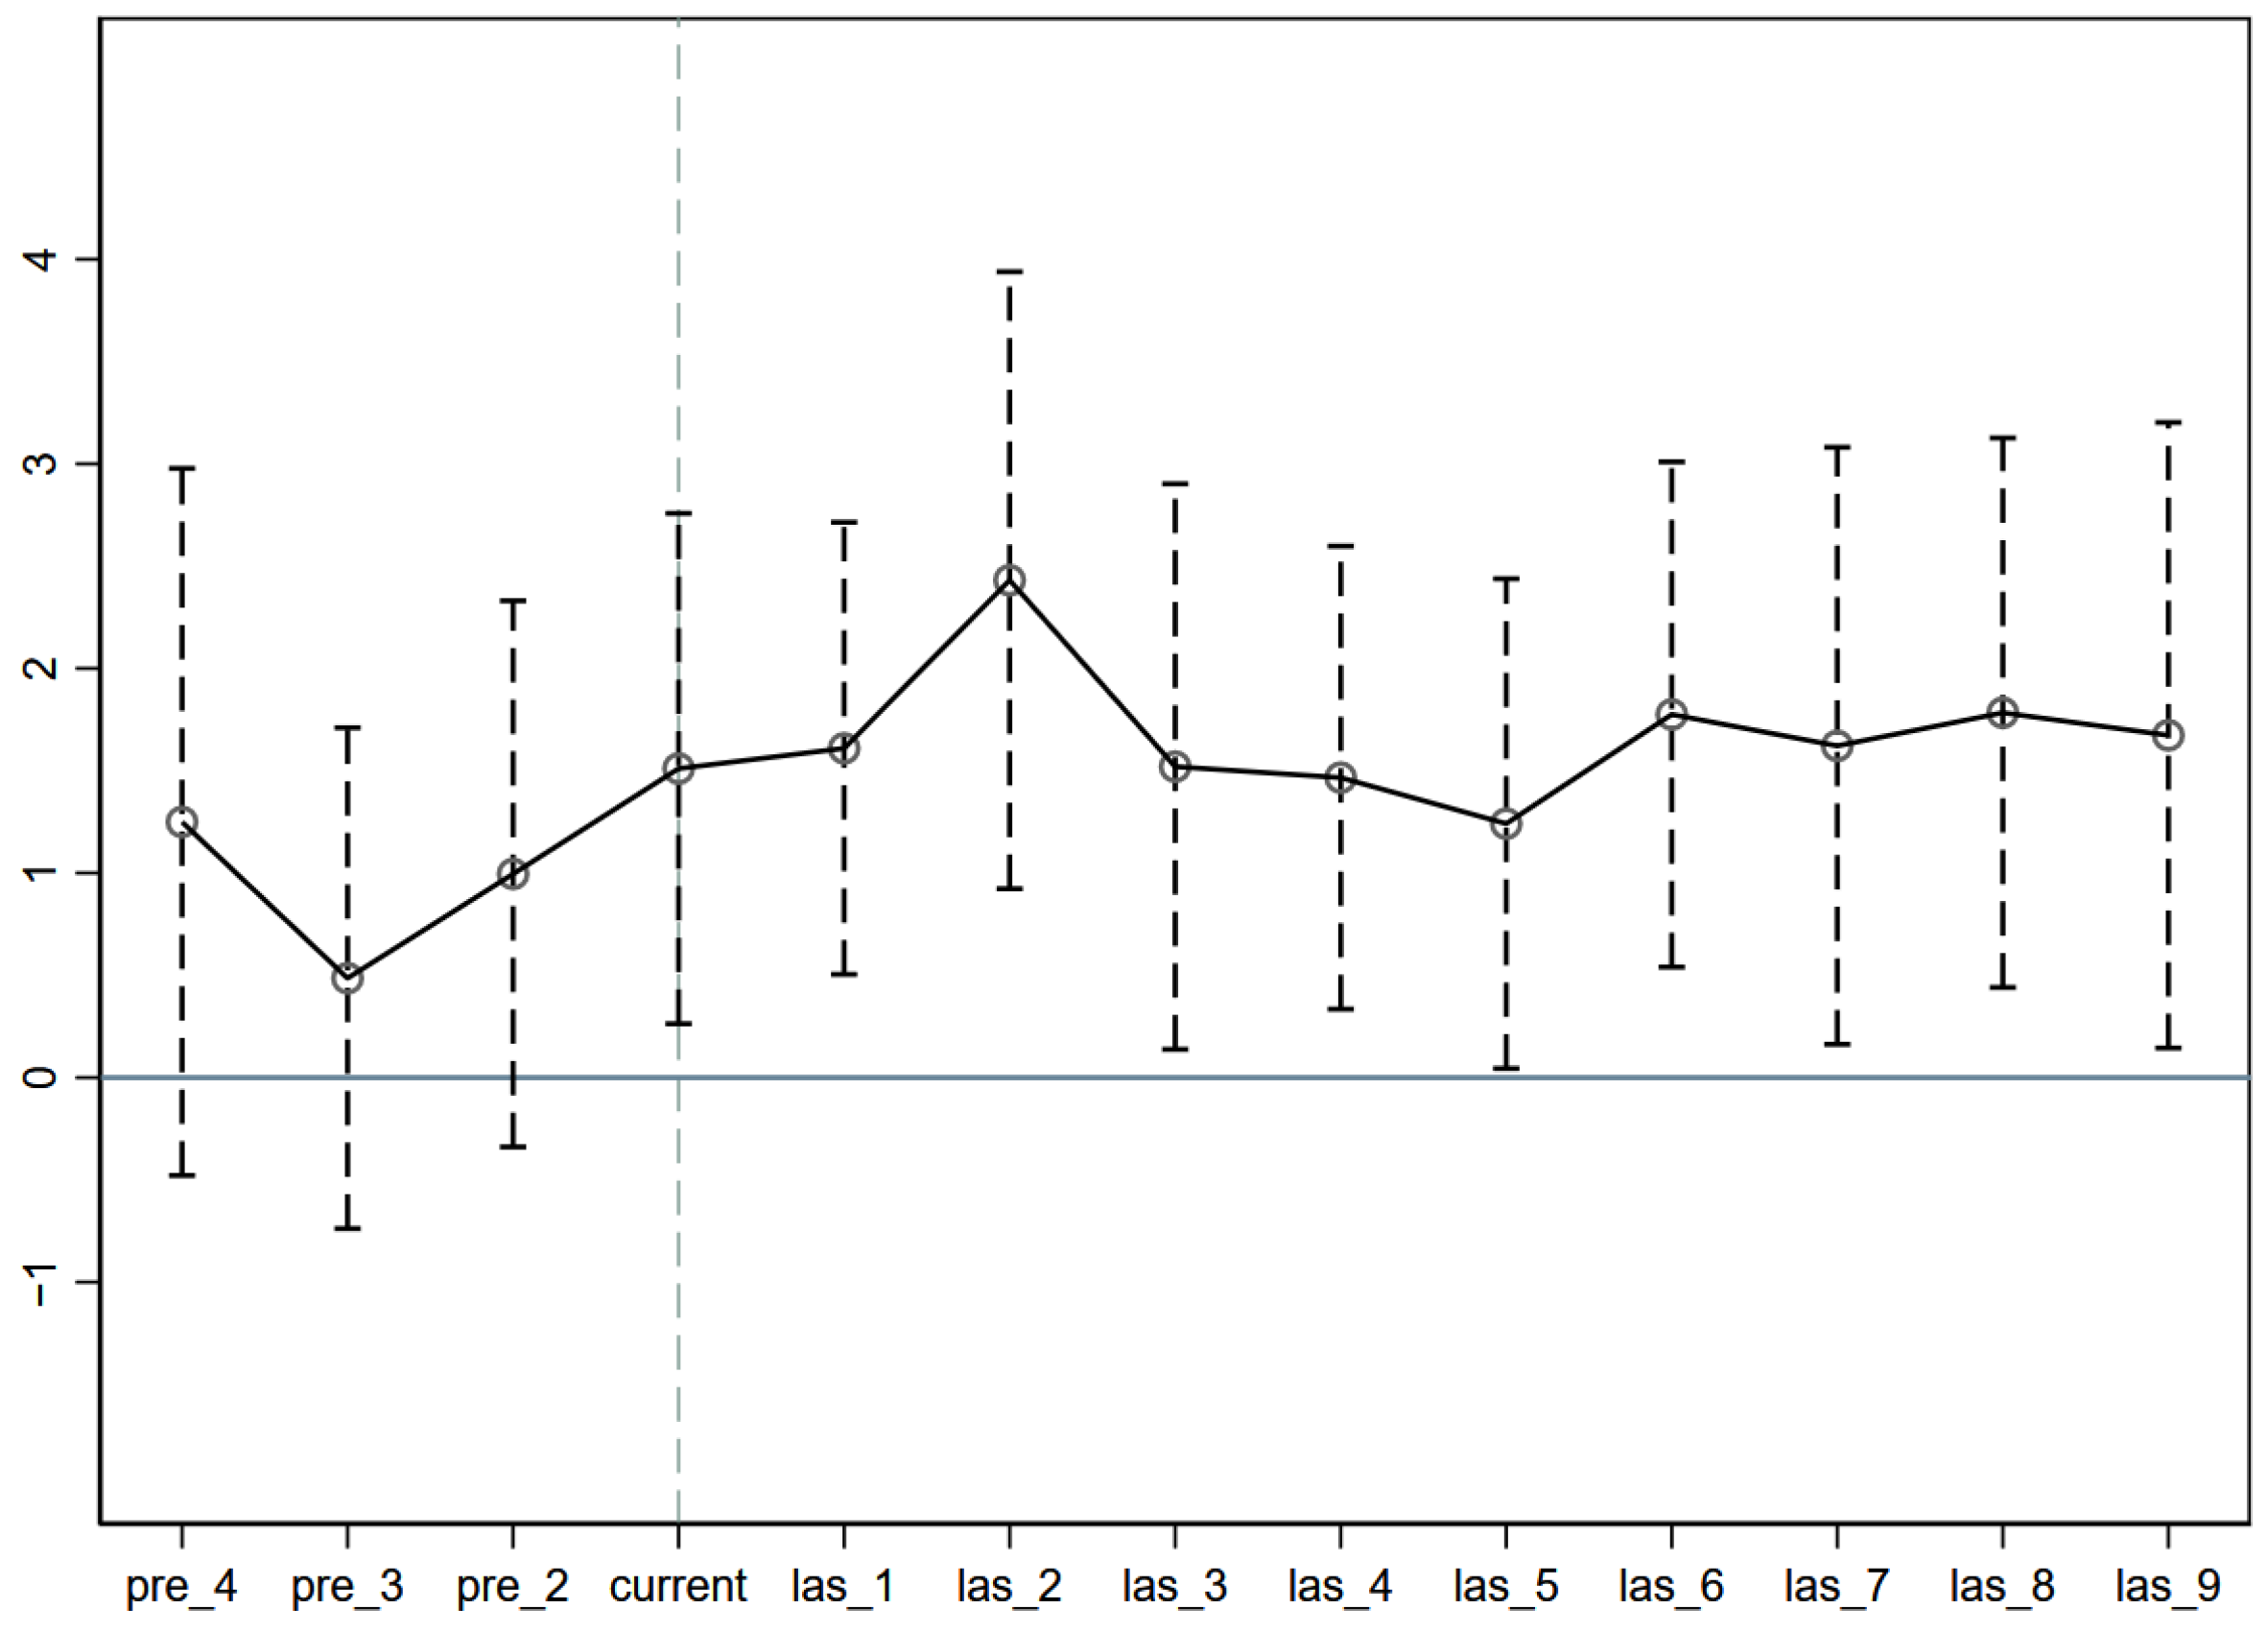
The “parallel trends” assumption constitutes the central premise of difference–differences methodology [72]. This hypothesis suggests that although the treatment and control groups may have had different levels of outcomes prior to the start of treatment, they should have had the same trend in outcomes prior to treatment, implying that any differences in outcomes between control and treatment groups are attributable to the policy and not to differences in pre-existing trends in outcomes [73]. Specifically, the pre-implementation year is set as the baseline period to examine the dynamic effects before and after the introduction of the initiative. As illustrated in Figure 3 and Table 4, the results reveal that the treatment and control groups followed parallel trends before the implementation, validating the parallel trend assumption. The joint pre-trend test indicates that the null hypothesis that all pre-treatment coefficients are jointly equal to zero cannot be rejected (F = 1.20, p = 0.3160), suggesting that the parallel trends assumption holds. The catalytic effect of the BRI on green energy projects was evident in the year it was proposed. With the extension of the policy implementation time, the marginal effect waned from 2015 onwards, which can be attributed to the transition from the initial phase of intensive promotion to a more refined phase of implementation. In addition, the establishment of the Belt and Road International Alliance for Green Development in 2019 and China’s announcement in 2021 that it will no longer build new overseas coal projects signaled a renewed focus on sustainability and green cooperation in the BRI, which has strengthened and sustained the promotional effect of green energy projects.

4.3. Robustness Tests

4.3.1. Eliminate Other Policy Interferences

China’s increasing engagement in overseas green energy projects, in part, is inevitably influenced by the global shift towards renewable energy and the climate policy of host countries. The Paris Agreement, as an important international treaty on climate change, reflects the irreversible global trend of green and low-carbon transformation [74]. The agreement adopts a new “bottom-up” governance model, in which countries independently determine their Nationally Determined Contributions (“NDCs”) according to their national conditions and development stages [75]. This paper uses the “Search documents” function of the Global Stocktake Explorer to determine the submission time of each country’s first NDC and then generates the dummy variable NDCs to try to reduce the impact of this policy. Specifically, the dummy variable NDCs equals 1 in that year and beyond if country i has submitted its first NDC in year t; otherwise, it equals 0. The results are shown in Column (1) of Table 5 and remain significant after controlling for NDCs.

4.3.2. Placebo Test

To assess the robustness of our results, we perform two placebo tests: a policy timing placebo test and a treatment group placebo test, which together evaluate the reliability of the empirical findings.
The underlying premise of the DID model is that there are no substantial differences in China’s overseas project conduct before the policy event. Therefore, if any year prior to the implementation of the policy is chosen as the “dummy” policy implementation point and the DID estimation is re-run, the regression results should not be significant. If statistical significance is maintained for the coefficients of the interaction terms after advancing the time of policy onset, then it implies that there are some potentially unobservable factors that may have contributed to China’s green energy projects, but not solely the promotion effect stemming from the initiation of the BRI. The specific approach is to assume that the BRI was proposed in the years 2010, 2011, and 2012, respectively, to test whether the promotion effect of China’s BRI still exists. The corresponding estimation results are reported in Table 6.
Although a series of time-varying country-level characteristic variables have been controlled for in the previous process of identifying policy effects, and year fixed effects have also been added to control for country characteristics that do not vary over time, there may still be interference from omitted variables, random factors and other potentially confounding variables. To eliminate interference, this paper conducts a placebo treatment group test on the main results by randomly selecting countries as a “dummy” treatment group for analysis. First, 50 host countries are randomly selected from all observed countries, which are set as the “dummy” treatment group, and the remaining countries are set as the control group, whereby a randomized experiment is constructed for the regression. Because the treatment combination control group was randomly generated, the “dummy” crossover coefficient in the placebo test should be 0. To verify the robustness of the findings, the process was repeated 500 times. The distribution of the estimated coefficients for bri × after, the kernel densities of the estimated coefficients for the group of 500 randomly generated treatments, as well as the distribution of the corresponding p-values, are shown in Figure 4. The estimated coefficients for bri × after are centrally clustered around 0. The majority of the p-values are above 0.1. Compared to the “dummy” estimated coefficients (clustered in [−0.4, 0.4]), 0.906 (the actual estimated coefficient) is much larger, suggesting that the result is unlikely to have occurred by chance. Based on the above information, it can be concluded that the core conclusions obtained are robust.

4.3.3. Sample Selection Bias

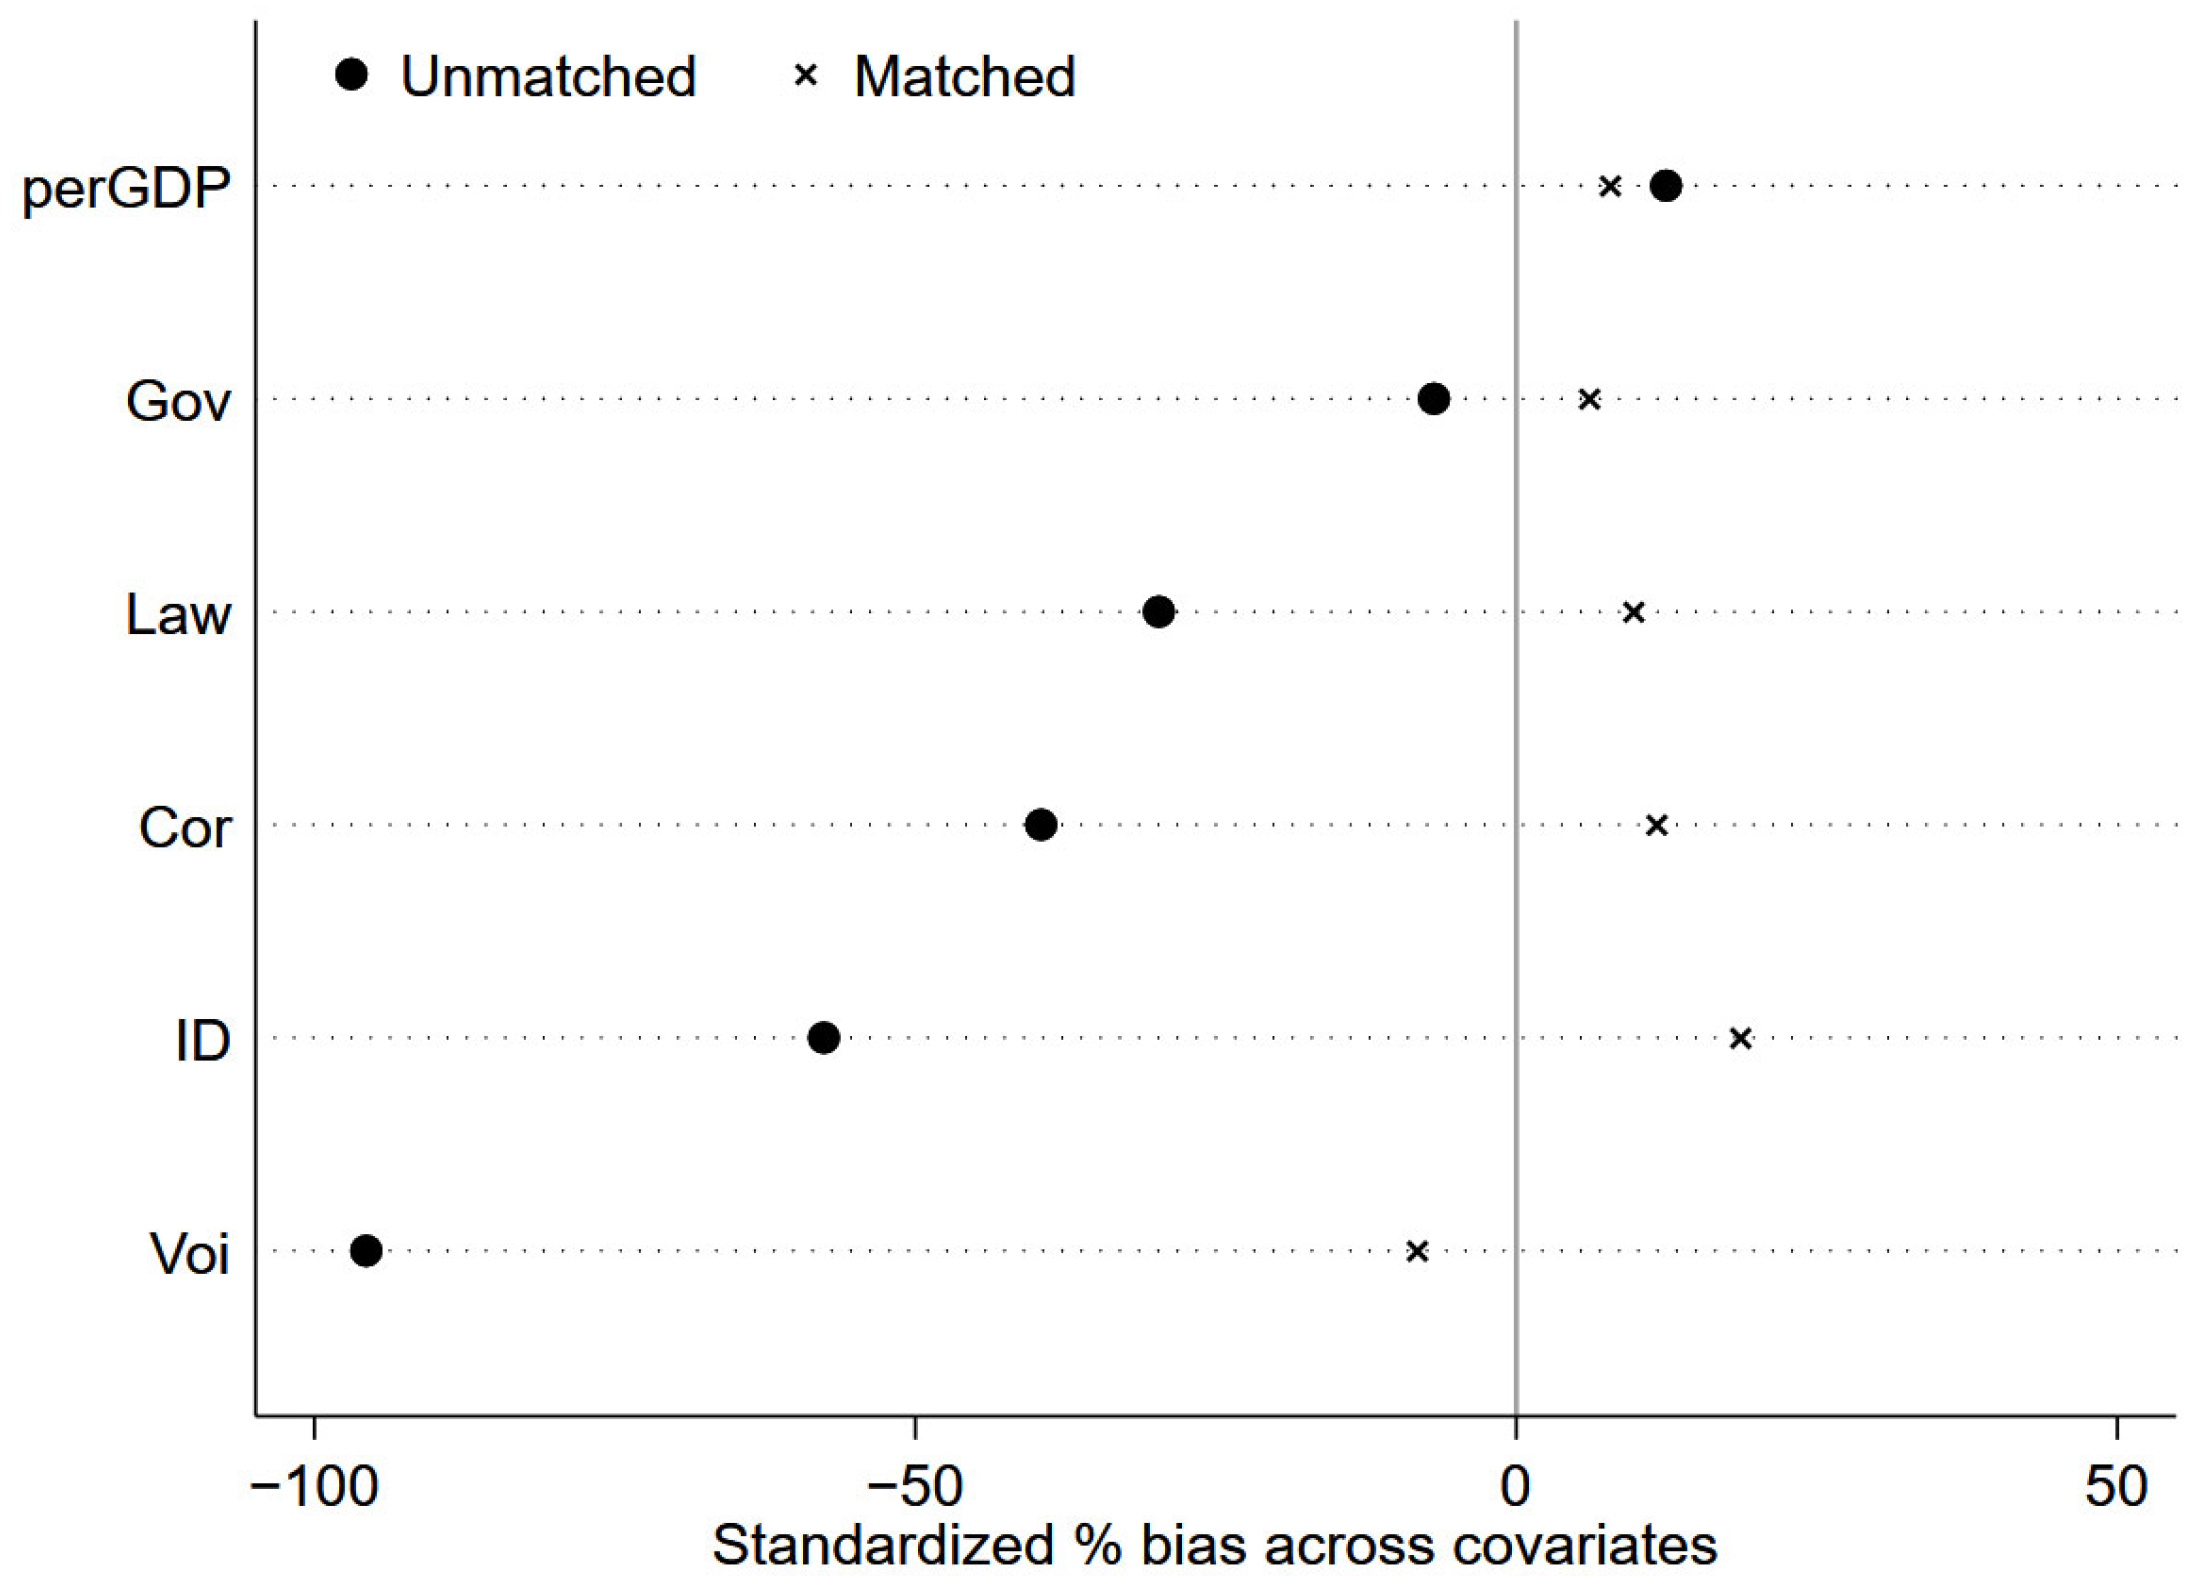
This paper adopts the propensity score matching (PSM) analysis to mitigate sample selection bias and further test the causal relationship between the BRI and the growth of China’s overseas green energy projects. Specifically, nearest-neighbor matching within a caliper of 0.05 is adopted as the matching method. GDP per capita (perGDP) and institutional variables (ID, Gov, Cor, Law, and Voi) that can reflect the key economic and institutional environment are selected as covariates to estimate the propensity score using a logit model. The matched samples have been better balanced in covariate (Figure 5), and the difference between the treatment and control groups was significantly lower after matching compared to before matching. The result of the benchmark regression after performing PSM is shown in Table 7. The bri × after correspondence coefficients are positive and significant at the 1% level after matching, fully consistent with the unmatching benchmark result.

4.3.4. Replacing the Measure of the Dependent Variable

In this paper, the number of projects (N), the number of China’s investment and construction projects in a year, is chosen to replace the original volume of investments and is included in the regression. The number of projects can reflect the investment preference of China for host countries and is reasonable as a proxy variable for green energy projects. The regression results can be seen in Column (1) in Table 8.
Secondly, to avoid a potential overestimation of the green promotion effect, the dependent variable is replaced with the logarithm of investment in renewable energy. The regression results can be seen in Column (2) in Table 8. The fact that the regression results remain significant after replacing the explanatory variables can further indicate that the regression results are robust.

4.3.5. Replacing the Data Processing Method

Although the China Global Investment Tracker data cannot confirm that no investment occurred in a given year, in order to control for potential bias and maintain the completeness of the panel, zeros were imputed for country–year observations with no investment, setting the investment amount to zero for those years. This approach is intended to prevent sample selection bias that could result from excluding zero-investment years. Regression analysis was then performed using the Poisson Pseudo Maximum Likelihood (PPML) estimation. The PPML model is capable of handling zero values and heteroskedasticity, and it directly models the expected investment amount without requiring a logarithmic transformation of the dependent variable. The results, shown in Table 9, are consistent with previous findings.

4.3.6. Staggered DID

Based on the timing of countries’ signing of the BRI Memorandum of Understanding, this paper accurately identifies their participation in the BRI and subsequently examines the policy effects. In view of the potential heterogeneous treatment effects of DID models, this paper follows Guo [76] and adopts the “group-time average treatment effects” (CSDID) estimation strategy proposed by Callaway and Sant’Anna [77] to identify the causal effects of the BRI on China’s green energy projects. However, given the relatively small sample size and unbalanced panel structure, this paper adopts the CSDID estimation strategy, incorporating zero-value filling of project data, to improve the feasibility and effectiveness of identification. In addition, in order to alleviate the interference of undesirable covariates, this paper introduces the covariates before policy implementation as control variables in the model. As shown in Table 10, the direction of the estimation coefficient is consistent with the benchmark DID results, indicating that the policy effect direction is relatively stable to a certain extent.

5. Further Analysis

5.1. Mechanism Analysis

The preceding analysis confirms that the BRI substantially augments China’s green energy projects in BRI countries. However, the precise mechanism of this impact remains unclear. This paper argues that the BRI can improve the infrastructure of the host country to improve the environment for green energy investment and construction. The first thing that comes to mind when it comes to investment and construction projects is that a lot of the CO2 will be released in the process. However, in the long run, a favorable business environment not only enhances the attractiveness of the investment market but also provides a stable foundation for high-end talent development.
The concept of infrastructure is very broad, with common classifications including network systems that provide services such as transportation, communication, water, energy, and waste management. However, more expansive interpretations also include social infrastructures such as systems of social protection, public health, finance, education, and legal enforcement and adjudication [78]. Considering the specific characteristics of energy projects, we draw on Donaubauer et al. [56] and Sun et al. [79] to categorize infrastructure development into three dimensions: communication, financial, and energy infrastructure. The reason is that we believe that sound transportation, communication, financial, and energy infrastructures play an important role in attracting investments in green energy. Specifically, sound transportation infrastructure attracts greater FDI inflows by reducing transaction costs and increasing market access [80,81]. Universal communications infrastructure facilitates more cost-effective, transparent, and efficient management by firms [82], thereby reducing production and other transaction costs for foreign investors and increasing FDI inflows to emerging economies. Sound financial infrastructure can improve the ease and security of foreign investment and attract more foreign investors to the market. High-quality energy infrastructure is one of the key factors in attracting investment in green energy, which usually includes reliable power supply, advanced technological facilities, and efficient energy production and transmission systems. This is because green energy investors usually consider factors such as the reliability, safety, environmental friendliness, and future development potential of the host country’s energy infrastructure. Additionally, these elements can attract more entrepreneurs, facilitate efficient resource integration and exchange, thereby fostering a more dynamic entrepreneurial ecosystem [83].
This paper uses the indicator of the natural logarithm of passengers carried by air transport as a proxy for transportation infrastructure, the number of people using the Internet (% of population) as a proxy for communication infrastructure, the domestic credit to private sector by banks (% of GDP) as a proxy for financial infrastructure, and electricity installed capacity as a proxy for energy infrastructure. The above data were mainly obtained from the World Bank. The results of the mechanism tests are presented in Table 11. This suggests that the BRI can have a positive effect on the improvement of infrastructure (communications, transportation, finance, and energy infrastructure) in BRI countries, thus creating positive conditions for China’s green energy projects. Based on the above analysis, hypothesis 2 is proven.

5.2. Heterogeneity Test

5.2.1. Heterogeneity Tests for Different Regions

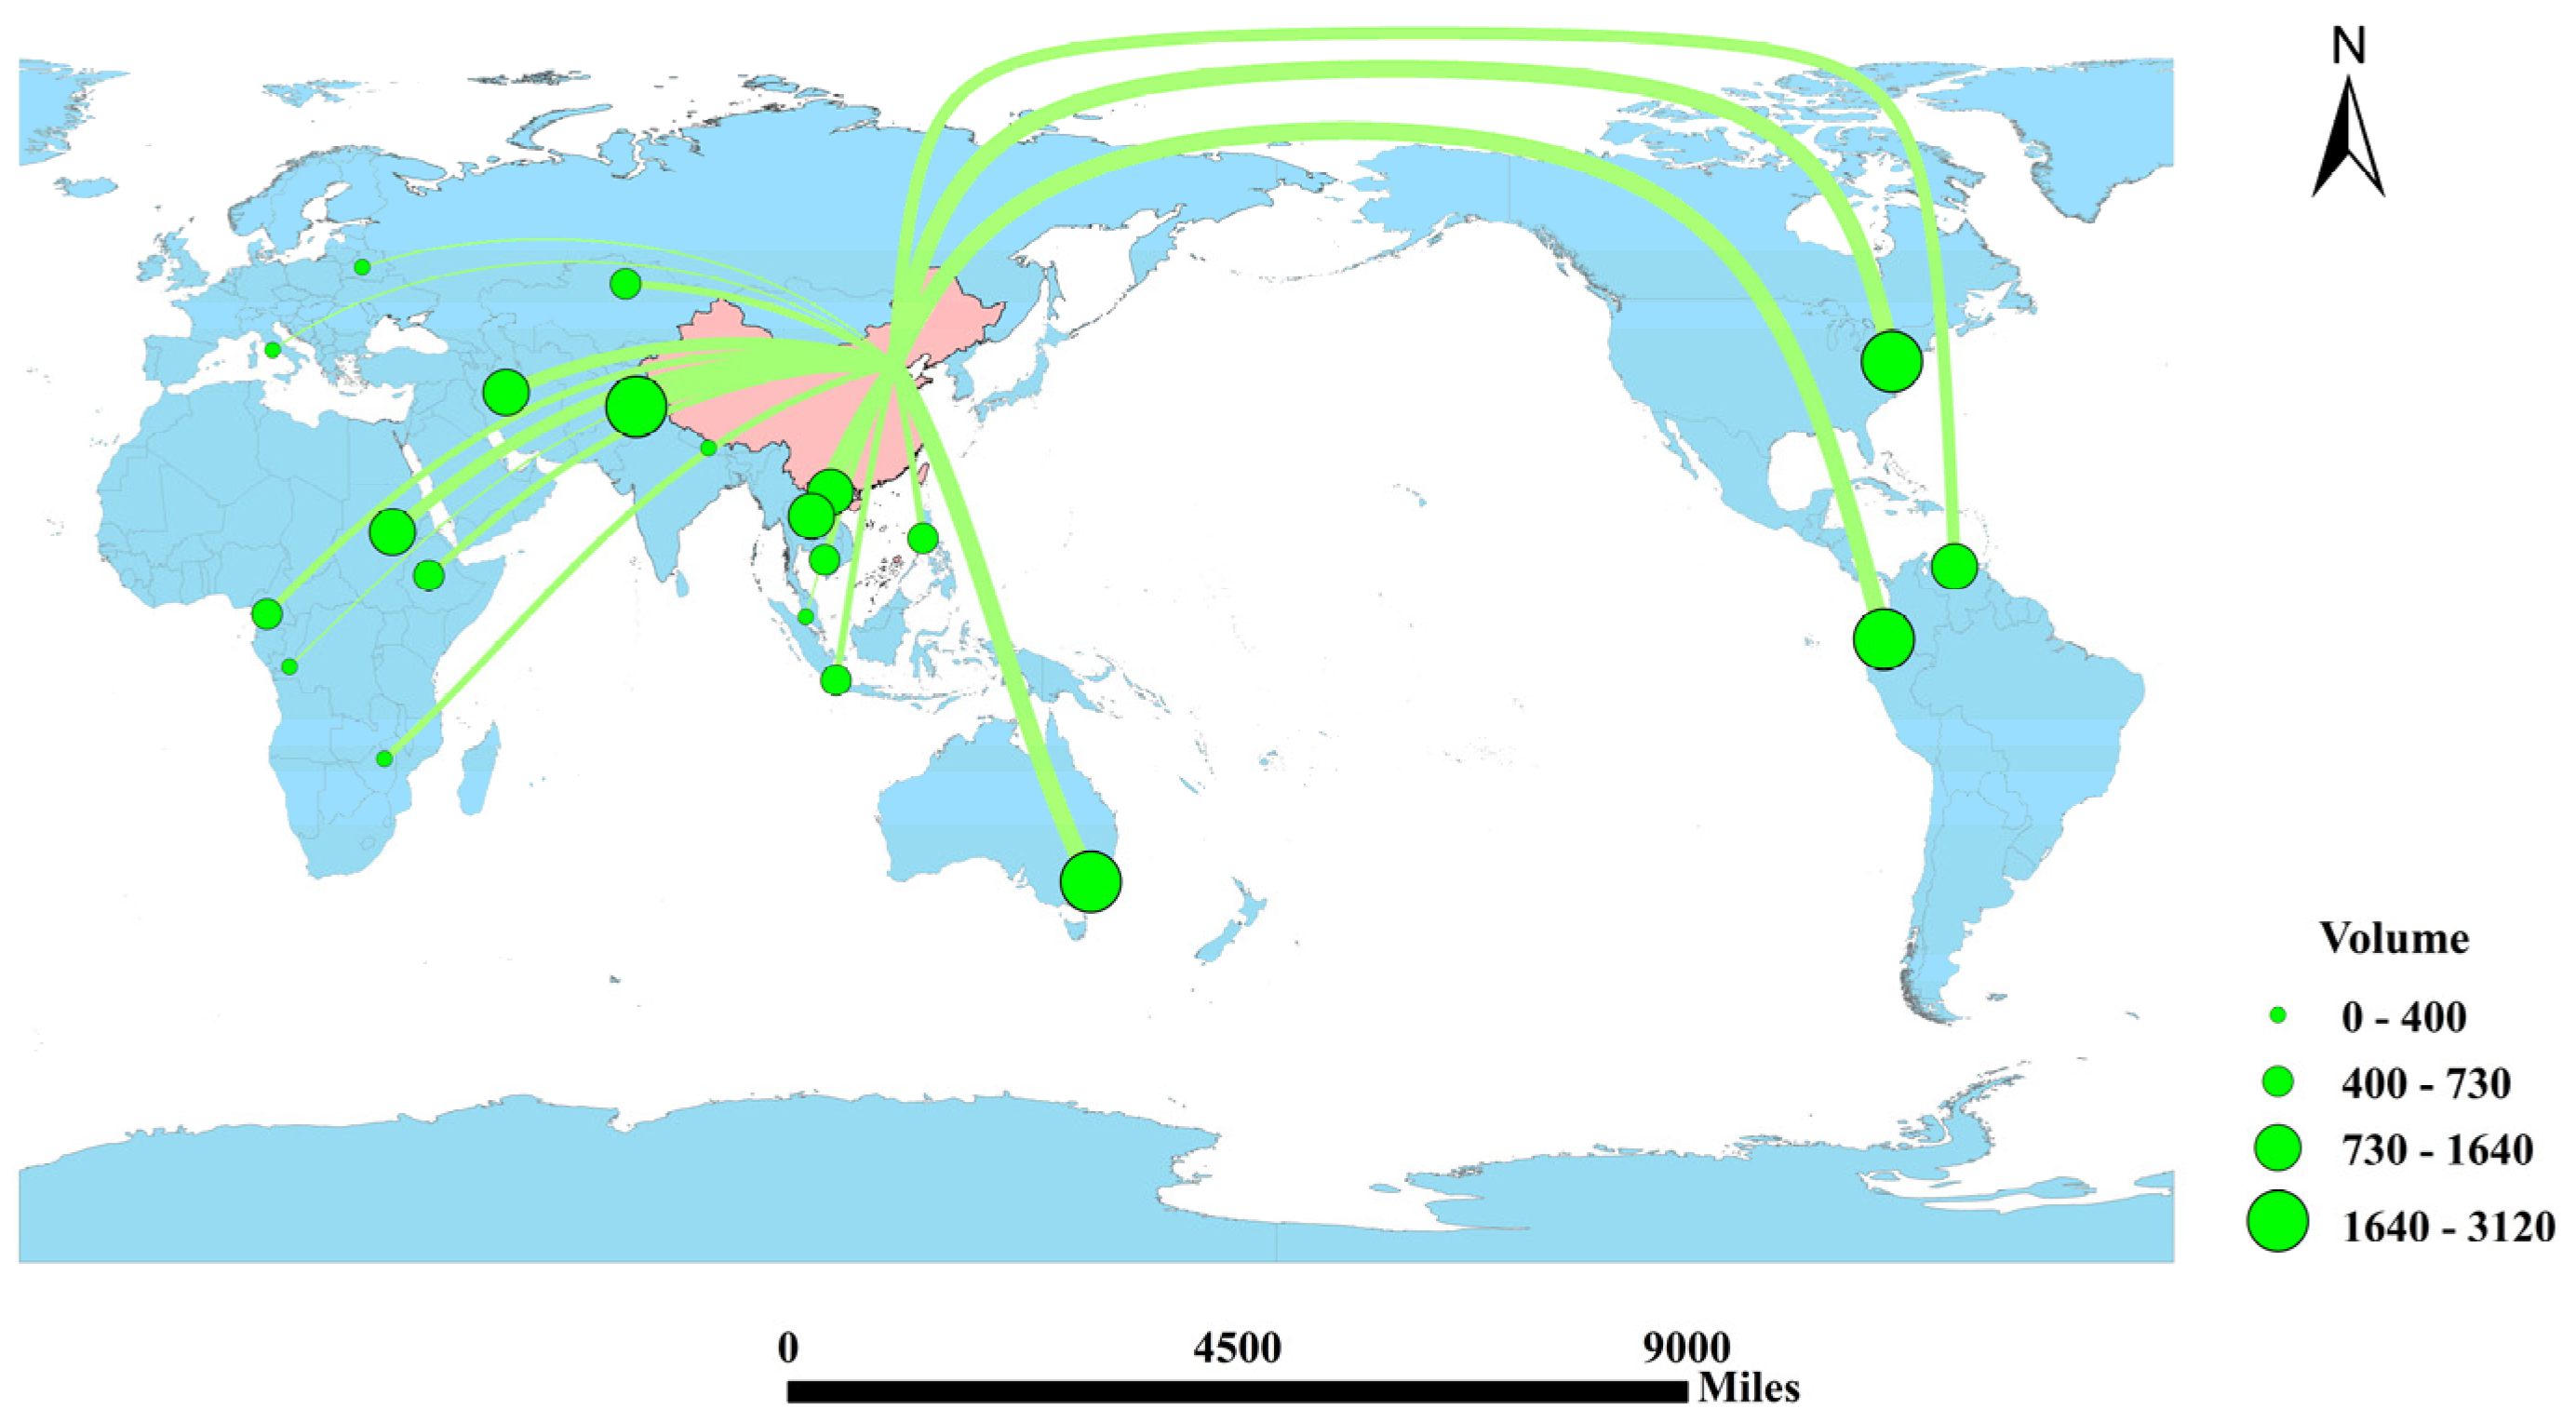
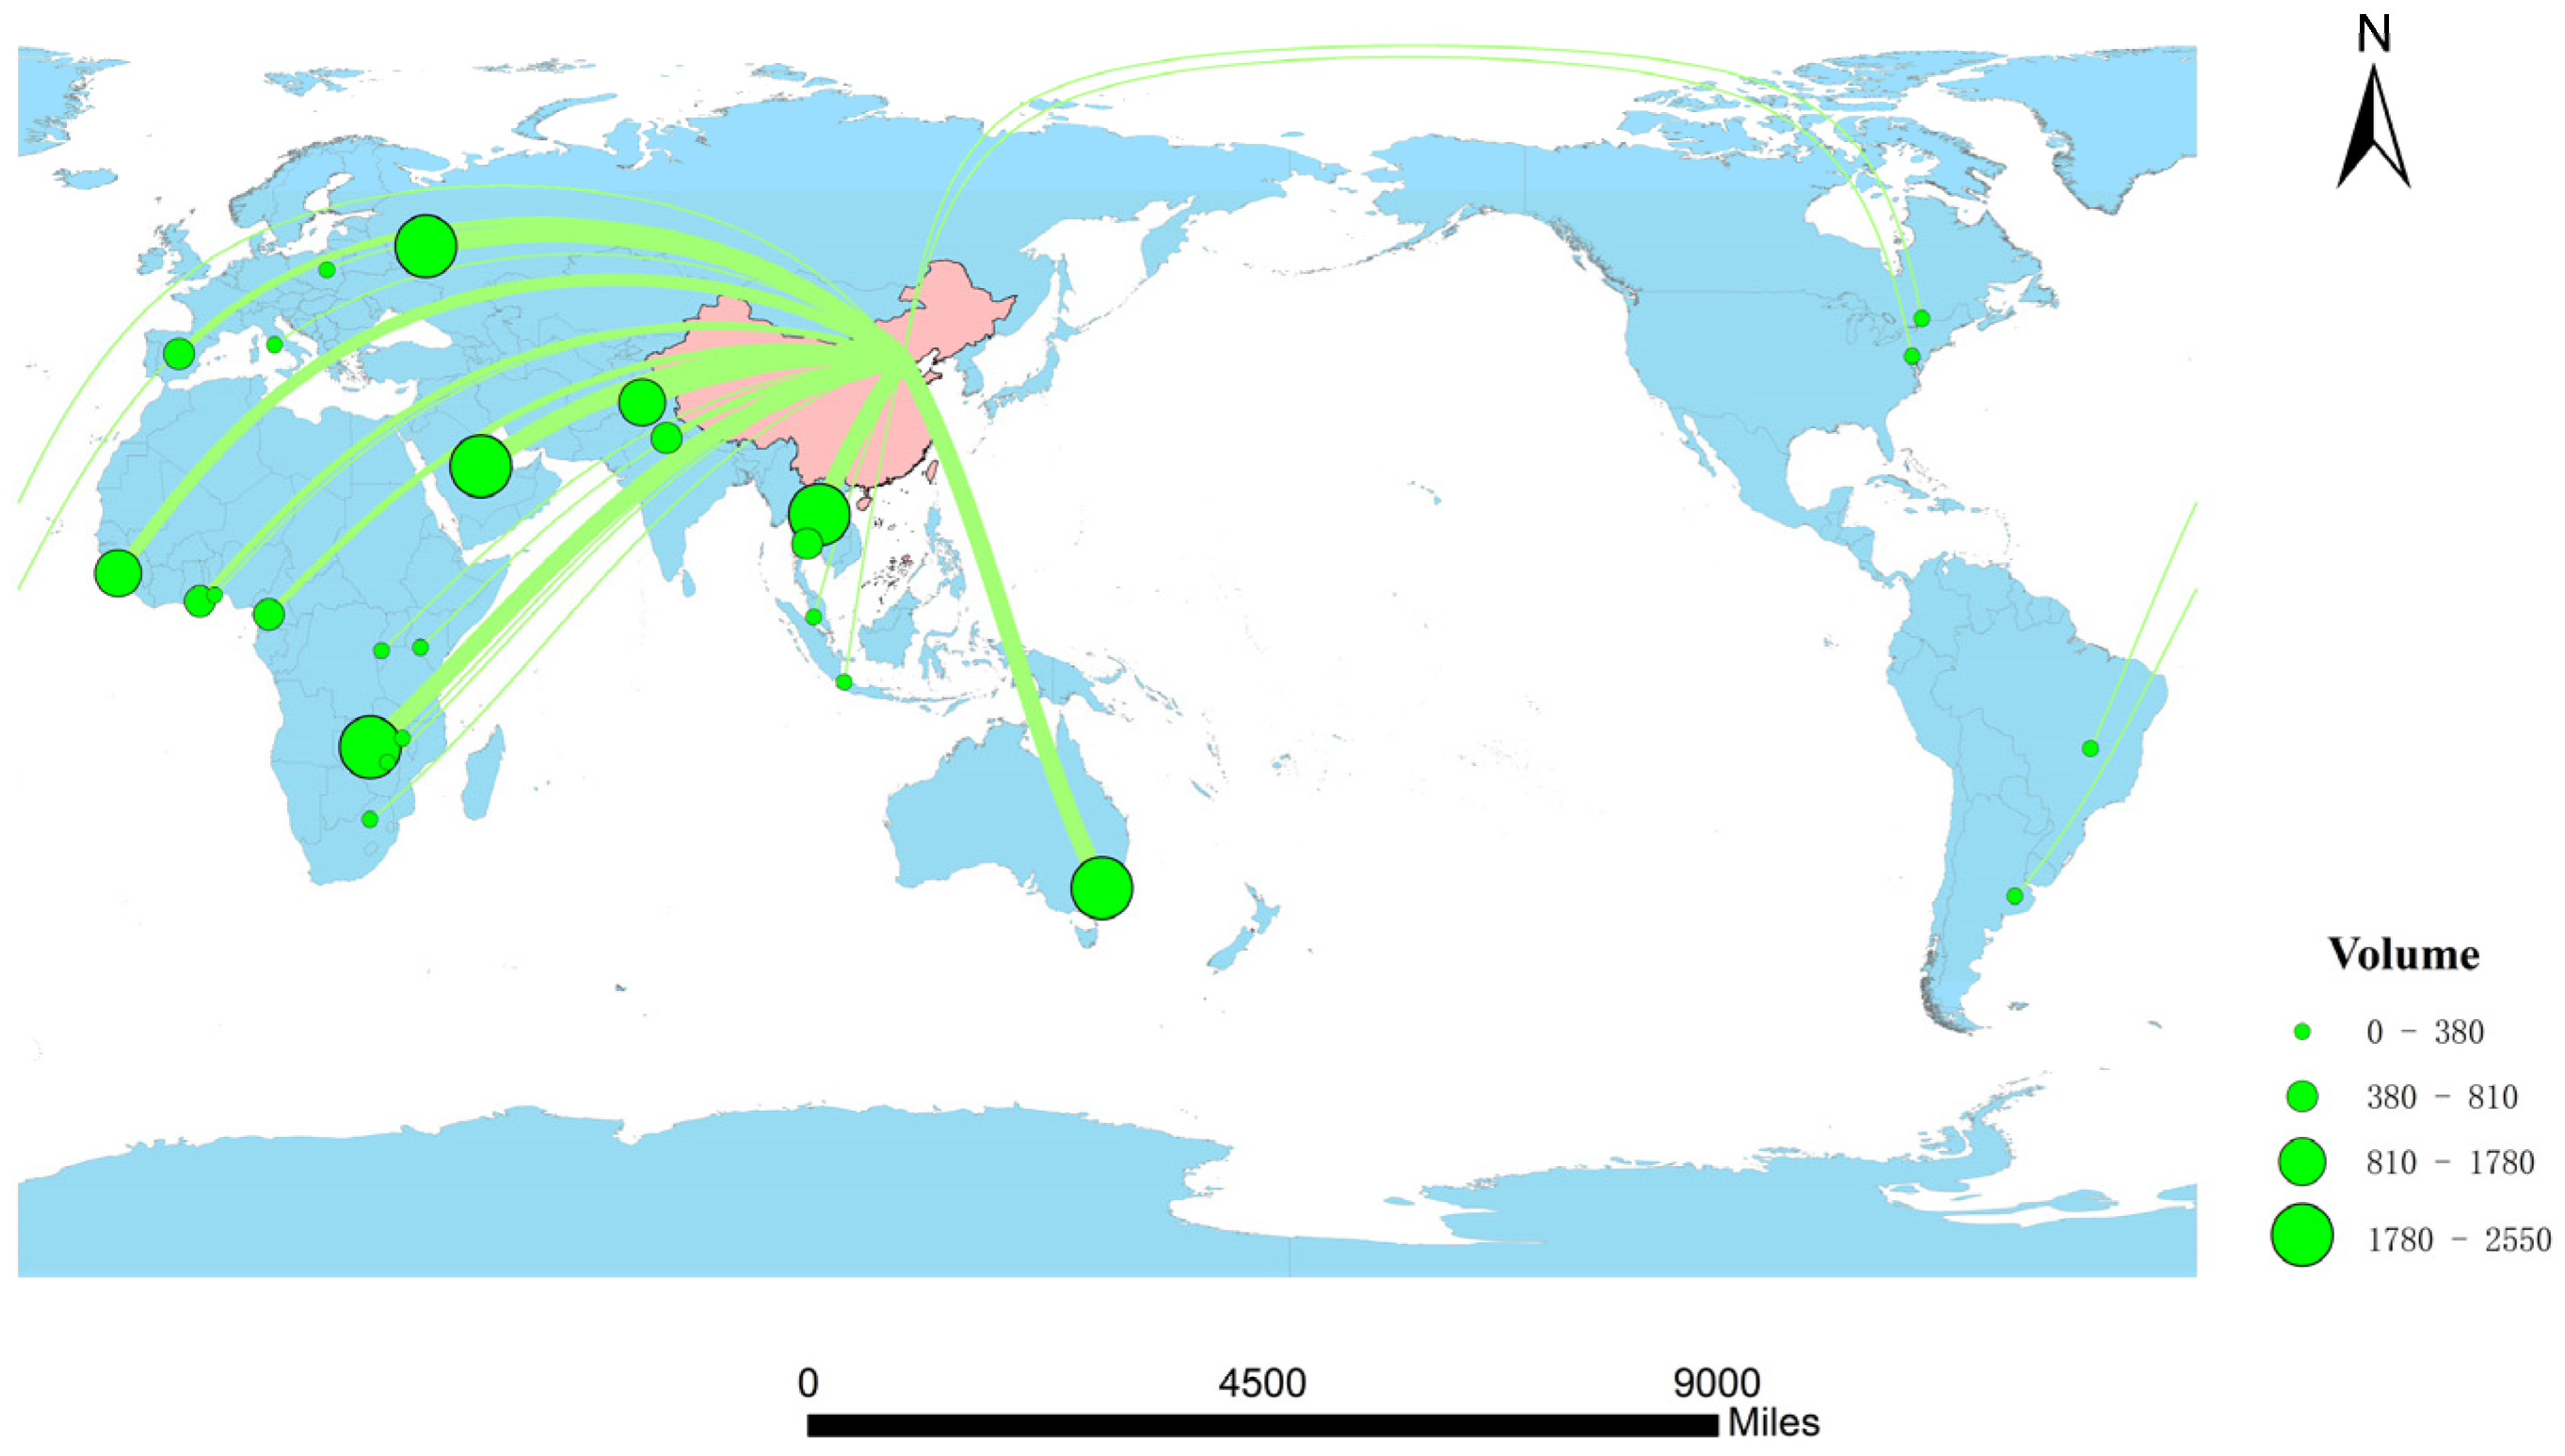
The regions of China’s green energy projects can be divided into Central Asia, West Asia, South Asia, Southeast Asia, Northeast Asia, Africa, and Europe. This paper examines regional differences in the impact of the BRI on green energy sector projects, with the regression results reported in Table 12. According to the regression results in Table 12, it can be observed that the promotion effect of the BRI on China’s green energy projects is mainly embodied in South Asia. The effect on Southeast Asia and West Asia is not significant. There is even a negative and significant interaction coefficient for the Central Asian region. The DID method requires the difference between the treatment group and the control group before and after the policy. However, there is no continuous data on China’s green energy projects of more than 100 million US dollars in BRI countries in the regions of Europe and Northeast Asia before and after 2013. In order to further test the effect of the BRI on the promotion of China’s green energy projects in different regions, we add the investment distribution maps of 2010, 2015, 2020, and 2022 as a supplement (The base map is obtained from the Institute of Geographic Sciences and Resources of the Chinese Academy of Sciences).
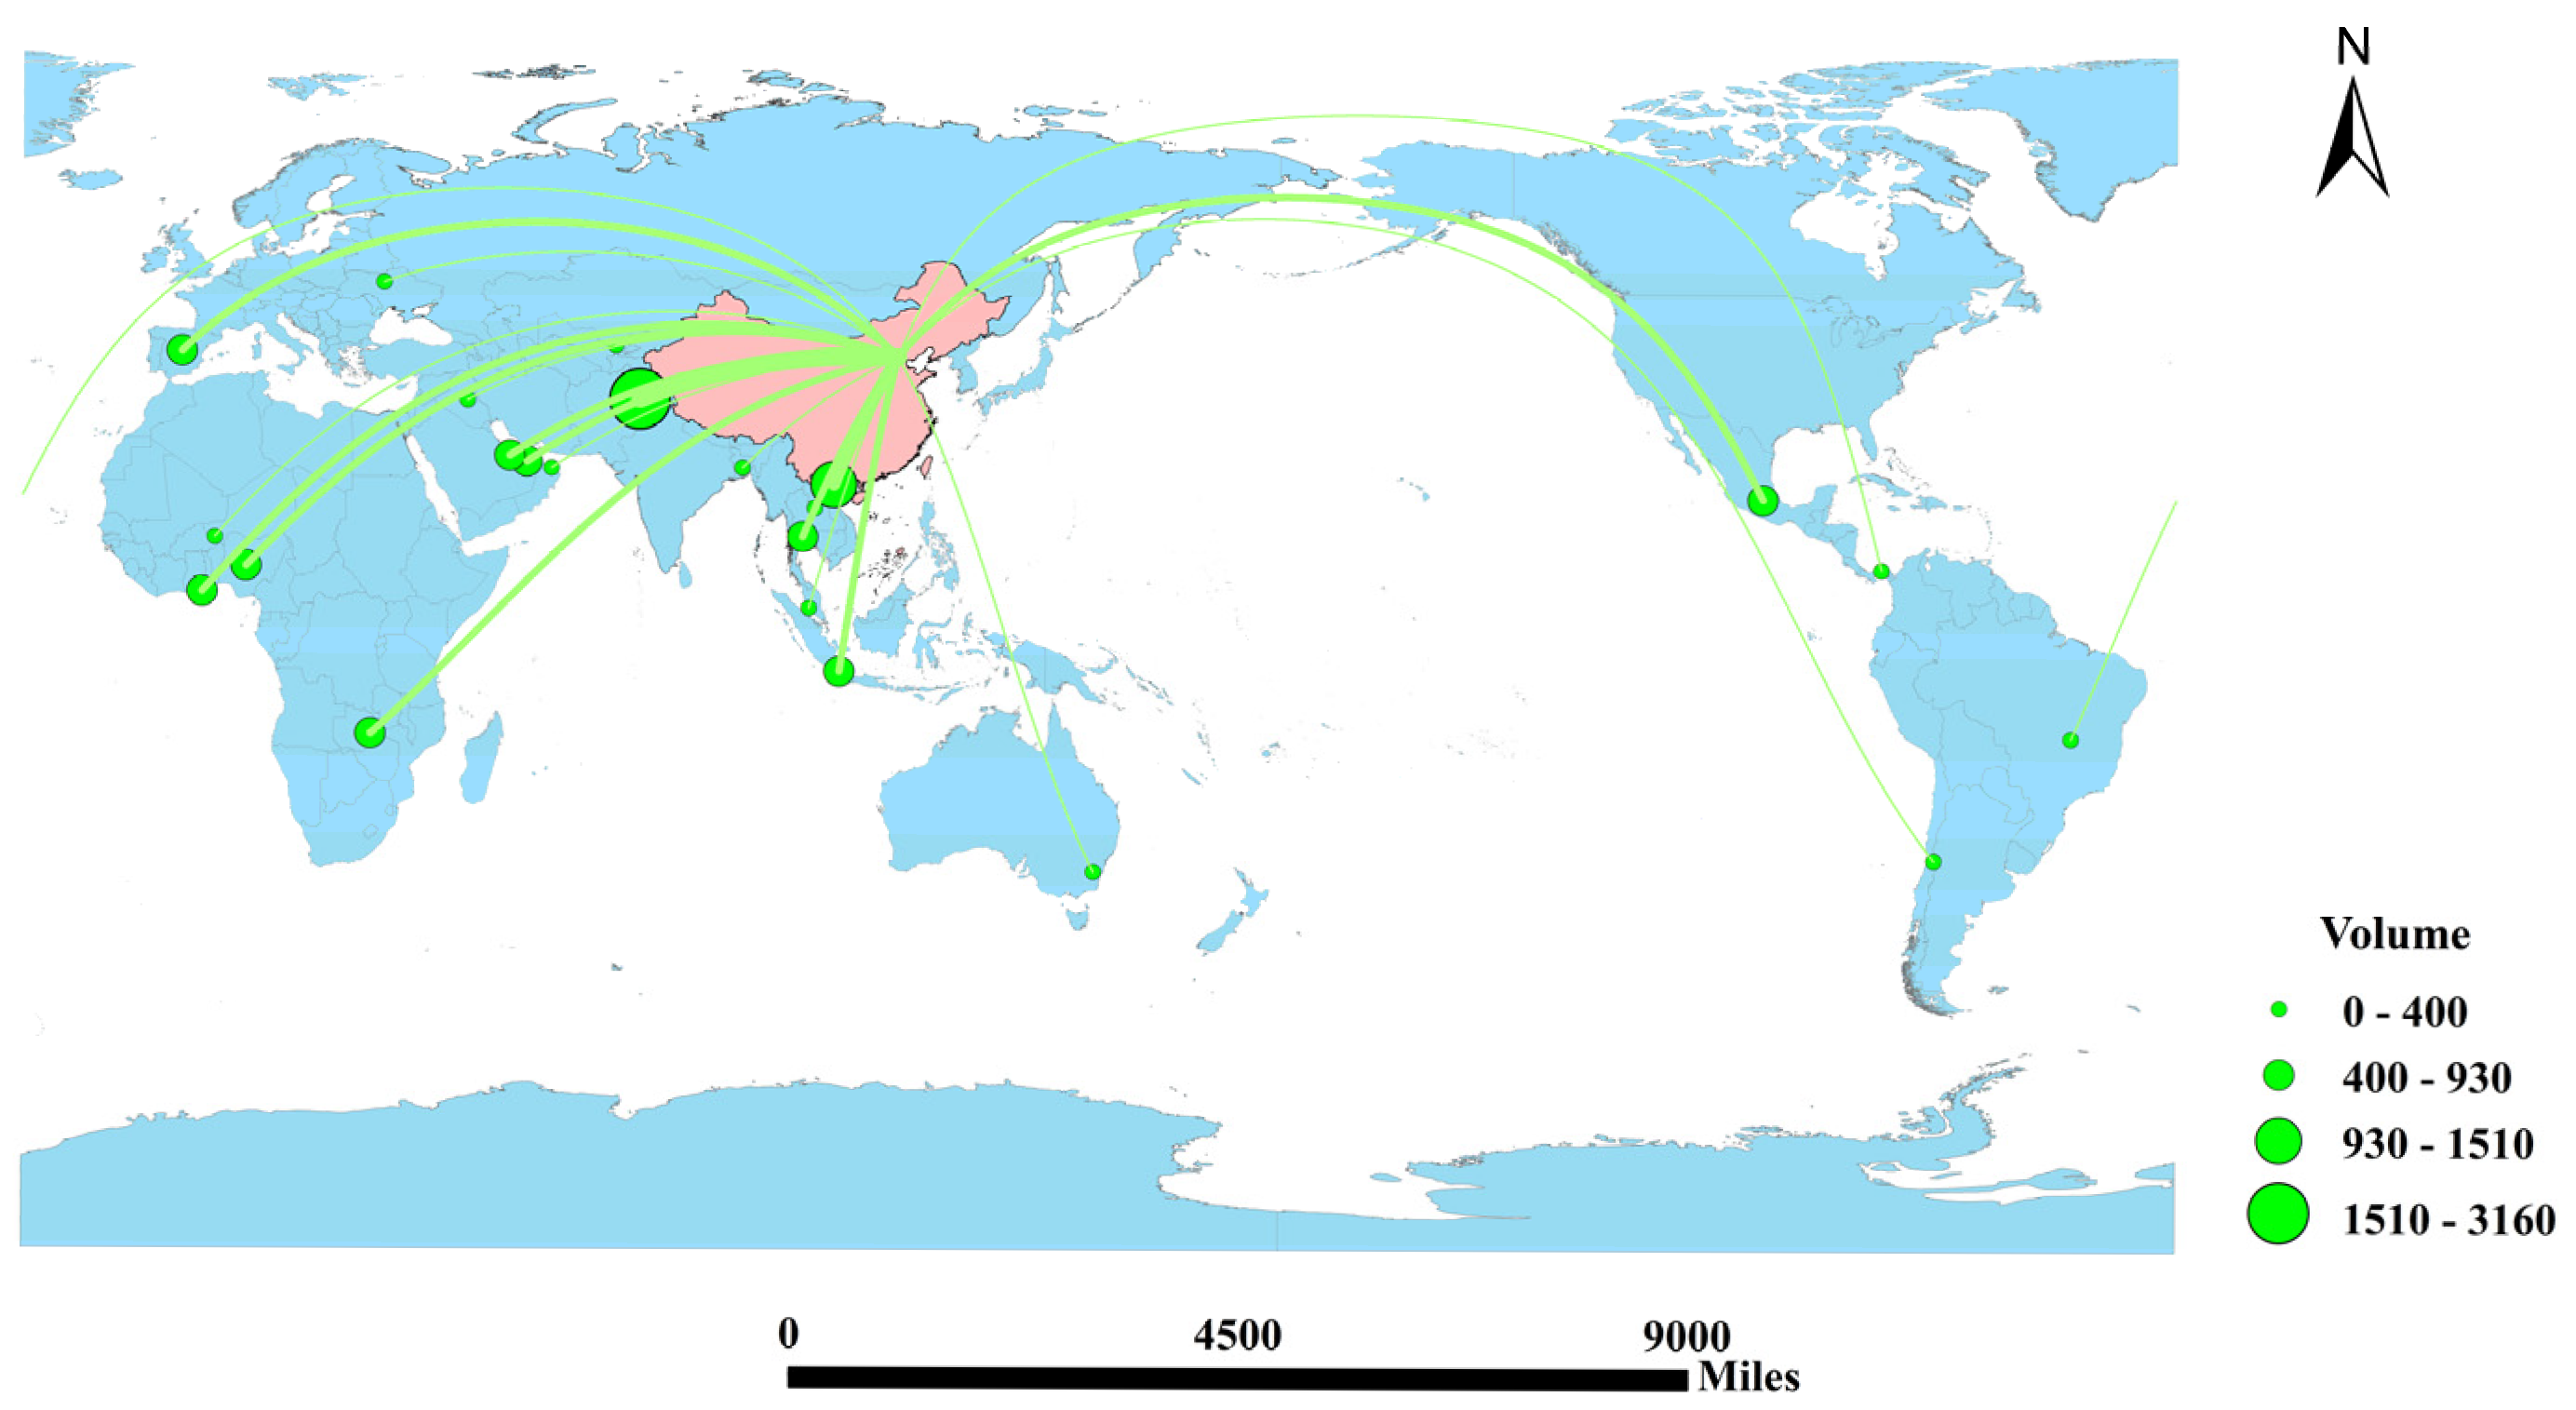
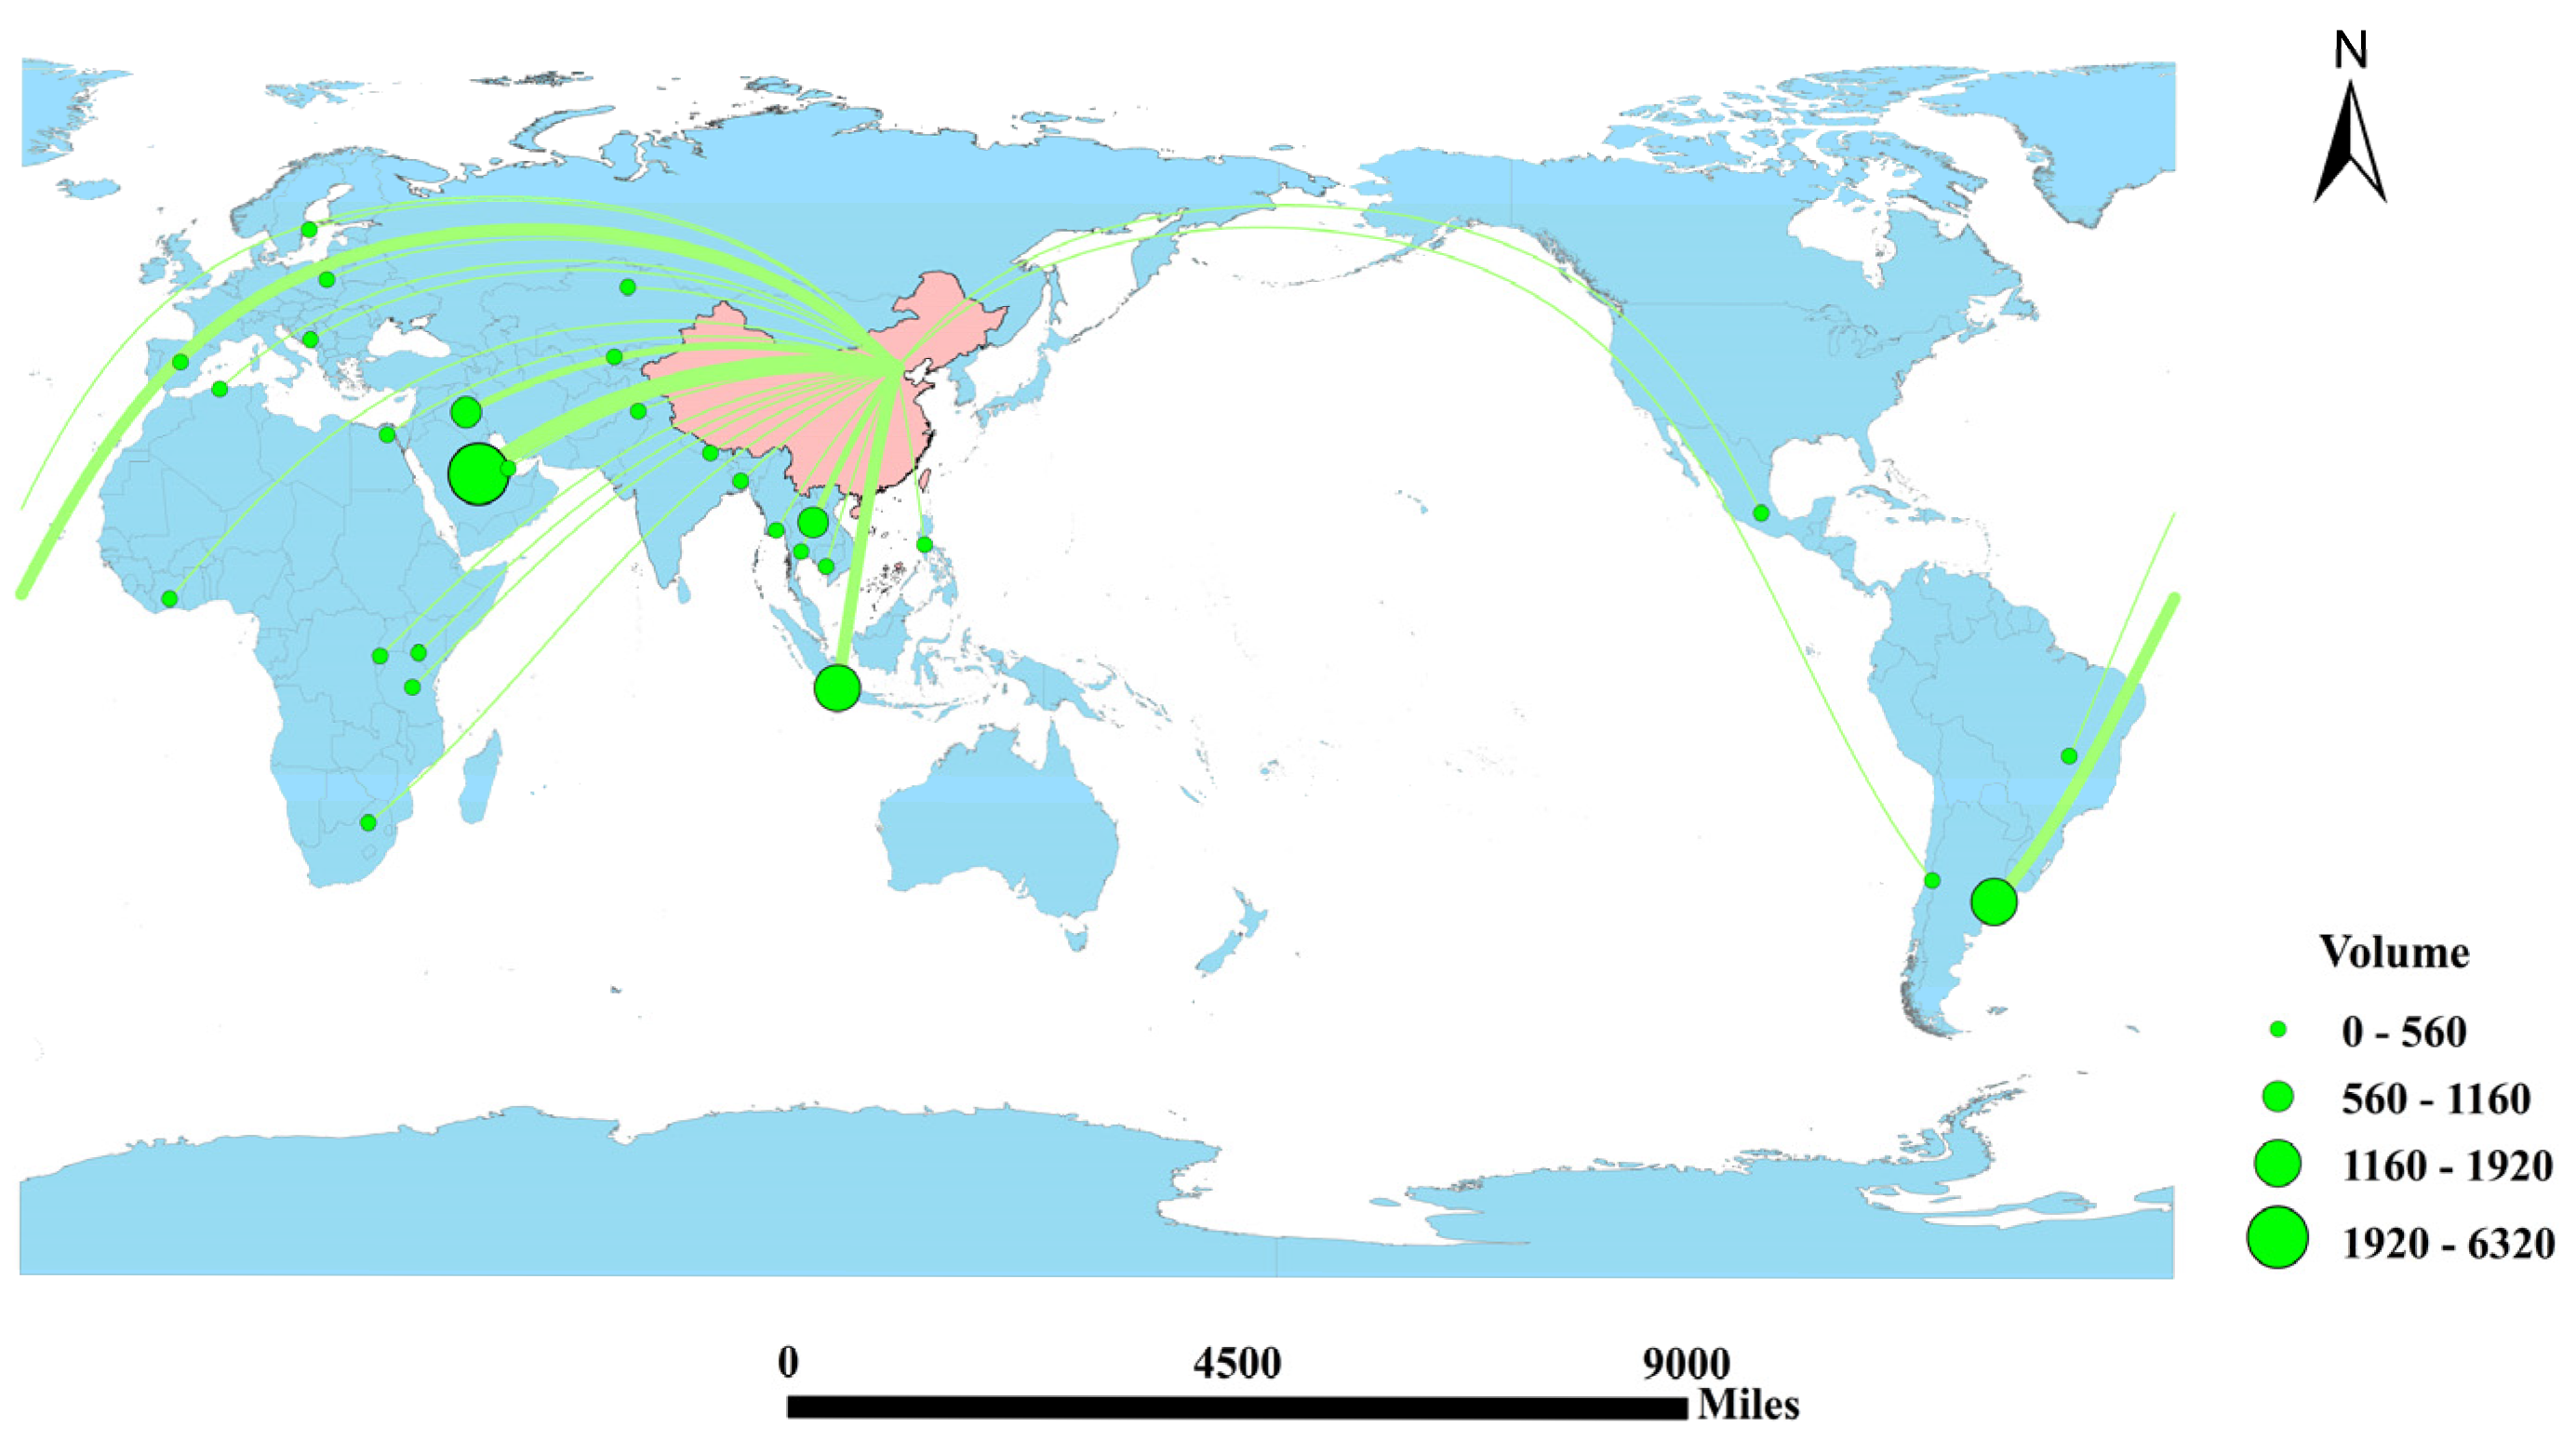
According to the distribution chart of China’s green energy projects in 2010, 2015, 2020, and 2022 (Figure 6, Figure 7, Figure 8 and Figure 9), it can be seen that China is increasingly inclined to carry out green energy projects in Asia and Africa. This means that China, through the BRI, is providing more opportunities for developing countries, which is of significant importance for the green energy development of these nations. Specific to the national level, in 2010, the China’s green energy projects in Central Asia were reflected in the projects in Kazakhstan, but by 2015 and 2020, there are no projects exceeding $100 million dollars in Central Asia, and by 2022, only Kazakhstan and Uzbekistan have projects exceeding $100 million dollars, but the scale of projects is relatively small. China’s green energy projects in the European region were only in Belarus and Spain in 2010, with Poland and Italy added in 2015, and little change in 2020 and 2022. West Asia and Southeast Asia have always been the main regions for China’s green energy projects. Although the specific host countries have changed, the size and number of projects have always been at the forefront. Africa becomes an important destination for China’s green energy projects. There was a sharp increase in green energy projects landing in Africa in 2015 compared to 2010.
The Central and West Asia region itself is abundant in coal and oil resources. The availability of these cheap and abundant resources has led to the dominance of traditional fossil energy in the energy structure of the Central and West Asia region for a long time. Southeast Asian countries are rich in hydropower resources, but renewable energy has not played a significant role in solving the problem of energy shortages caused by economic growth and increased demand [84]. Southeast Asian countries are still heavily reliant on fossil energy sources [85]. In contrast, due to varying resource endowments, economic levels, and historical and cultural factors, energy shortages have become commonplace in South Asia. In such conditions, the development of renewable energy has emerged as an inevitable choice to enhance energy security. Moreover, in India, Pakistan, and Bangladesh, renewable energy accounts for 45% of indigenous energy production [86]. Therefore, South Asia possesses a relatively solid foundation and promising market prospects for renewable energy development. Africa possesses abundant renewable energy sources. Specifically, Egypt shows potential in harnessing its hydroelectric and burgeoning solar power capabilities, and its government implements many government incentives to promote renewable energy generation [87]. The above may be the reasons for the regional differences in the policy effects of the BRI.
The potential for renewable energy development in Central Asia [88], West Asia [89], and Southeast Asia is substantial. Restricted by the historical framework of cooperation, traditional energy remains the main line of energy cooperation between China and Central and West Asia, even though China’s investments and technology exports in these regions have been shifting towards green energy. Therefore, in the future, China should deepen its cooperation in green energy with these countries and regions, fueling the potential for energy cooperation to develop in a more diversified and sustainable direction.

5.2.2. Heterogeneity Tests for Developing and Developed Countries

Most countries participating in the BRI are developing or emerging economies, with limited ability to respond to their shift in energy requirements. Hence, these nations exhibit a strong need for high-quality investment and external support in green energy. China, having gained extensive practical experience and technological know-how in green energy transition, positioned to contribute effectively to meeting this demand [22]. Hence, it is necessary to examine whether the BRI has truly effectively promoted China’s green energy projects in developing countries. According to the Human Development Report, countries with a HDI ≥0.800 are defined as having a “very high” level of human development. This paper considers the Human Development Index (HDI) as the grouping criterion to test whether the BRI offers more opportunities for green energy development in developing countries, which takes into account not only income or productivity, but also how income translates into “opportunities for education and health, and thus into higher levels of human development”. Column (1) of Table 13 illustrates the results of the test of whether the impact of the BRI is different for host countries at different levels of development. The BRI can promote China’s green energy projects in developing countries rather than developed countries. This finding demonstrates the strategic alignment of the BRI with the United Nations Sustainable Development Goals (SDGs) in the area of green energy, with the common goal of improving access to affordable and clean energy in developing countries.

5.2.3. Heterogeneity Tests for High-Risk and Low-Risk Countries

Some studies have argued that China’s model of investment contradicts international investment theory, i.e., it tends to be more attracted to countries with poorer institutional quality [90,91]. However, other studies have argued that the so-called risk preference phenomenon of China’s investment projects is only caused by statistical methods, and that, in fact, China’s multinational corporations are more inclined to open their investments to countries with high institutional quality and rich natural resources [92]. Therefore, in this part, the risk factor of the host country will be introduced to explore whether the promotion effect of the BRI on China’s green energy projects is affected by the level of risk of the host country. The International Country Risk Guide (ICRG) provides ratings and forecasts of political, economic, financial, and composite risks, which can be used as a valid proxy for country risk, with higher values indicating less uncertainty about the country’s market conditions. In this paper, we use the composite risk rating indicator provided by the database as a proxy for the risk level of the host country, and if the value of the composite risk indicator is above the median, it is a low-risk economy, and vice versa for a high-risk economy. As shown in Column (2) of Table 13, the results indicate that in higher-risk economies, the investment promotion effect of the BRI is not effectively exerted, and the estimated coefficient of the interaction term is negative and insignificant, while in lower-risk economies, the BRI has a significant impact on green energy projects. This is consistent with J.-H. Yang et al. [92] found that China’s green energy projects are not more likely to be attracted by countries with higher risks. Therefore, strengthening risk management and providing better protection for firms can help attract China’s green energy projects.

6. Conclusions and Policy Implications

6.1. Conclusions

This paper evaluates the policy effects of the BRI on China’s overseas green energy projects by employing the DID model, using data on China’s overseas projects in the fields of alternative, hydro, and gas from 2009 to 2022. The empirical analysis provides consistent evidence supporting both Hypothesis 1 and Hypothesis 2 proposed in this study. The findings show that the BRI significantly promotes China’s green energy projects. This result remains robust after excluding potential interference from Nationally Determined Contributions (NDCs), placebo test, PSM, and substitution of explanatory variables. Secondly, we find that there is heterogeneity in the impact of the BRI on China’s green energy projects. The positive impacts of the BRI play out differently among regions, with the most significant effect on the promotion of investment in green energy in South Asia, and a negative impact on investment in Central Asia. Additionally, the BRI is more effective in promoting green energy projects in developing and low-risk countries compared to developed and high-risk countries. Finally, we explore the mediation effect mechanism of the BRI that promotes China’s green energy projects from the perspective of infrastructure development. Specifically, the BRI can increase green energy investment in BRI countries by “increasing infrastructure (communications, transportation, finance, and energy infrastructure) construction in the host countries → improving the environment for investment and construction in the host country”.

6.2. Policy Implications

This paper presents empirical evidence that after the announcement of the BRI, China has increased its international green energy engagement. Such efforts aid in constructing China’s identity as a ‘responsible country,’ thereby mitigating anxieties surrounding its expanding investment footprint and large-scale infrastructure initiatives. At the same time, we also make the following suggestions:
First, the host countries should improve critical infrastructure, including transportation, power supply, communication networks, and smart grids, to support the construction and operation of new energy projects. It is recommended to prioritize the development of logistics networks and transmission and distribution systems to reduce project costs and enhance efficiency. Second, energy cooperation between China and Central and West Asian countries needs to accelerate the transition from traditional energy to green energy. In this process, both sides can fully leverage their comparative advantages. Central Asia possesses key elements for the development of new energy industries (including photovoltaics, wind energy, and energy storage batteries), including lithium, nickel, and rare earths. West Asia has abundant solar and wind energy resources. China is a global leader in green energy technology, industrial chain integration, and new energy equipment manufacturing (such as solar panel production). Therefore, tripartite stakeholders can establish a new ecosystem of resource-technology-industry synergy based on the China–Central Asia–West Asia Economic Corridor (CCAWEC). Finally, host countries should improve their capacity to respond to emergencies and mitigate geopolitical risks, so as to create a conducive environment for green energy projects. Policymakers also need to accelerate the development of an internationally aligned environmental impact assessment (EIA) system to prevent the transfer of pollution.
Although this study provides further evidence of the positive impact of the BRI on China’s green energy projects and explores the underlying mechanisms at an early stage, several limitations remain due to data constraints. Firstly, this paper only examines hard facilities such as transportation and finance when discussing the mechanism of the BRI, and provides only a partial exploration of the potential channels. Secondly, this paper estimates the effect of BRI on the total value of green energy projects, including natural gas. Even with robustness checks excluding natural gas projects and focusing on alternative energy and hydro projects, gaps remain compared with studies that focus on renewable energy. Finally, this study only conducts exploratory analysis using a staggered DID framework in the robustness checks, based on the precise timing of member countries’ participation in the BRI, rather than a fully comprehensive assessment. Future research should undertake a more rigorous examination of the dynamic policy effects.

Author Contributions

Y.L.: Conceptualization, Funding acquisition, Project administration, Writing—review and editing, Supervision. M.X.: Data Curation, Investigation, Validation, Methodology, Writing—original draft, Formal analysis. Y.H.: Funding acquisition, Writing—review. N.F.: Visualization, Writing—review. All authors have read and agreed to the published version of the manuscript.

Funding

The work was supported by the National Social Science Foundation of China (Grant No. 24CGJ048), National Science Foundation of China (Grant No. 42001151, 42101231) and Shandong Provincial Social Science Planning Research Project and Innovation Project of Shandong Academy of Social Sciences, China (Grant No. 20CCXJ04).

Data Availability Statement

The data used are publicly available data. They can be accessed from the Chinese Global Investment Tracker [63], the UN Comrade, the World Bank Development Indicator Database and World Bank Worldwide Governance Indicators Database (UN Comrade, https://comtradeplus.un.org, accessed on 23 January 2024. World Bank Development Indicator Database, https://databank.worldbank.org/source/world-development-indicators, accessed on 9 November 2023. World Bank Worldwide Governance Indicators Database, https://databank.worldbank.org/source/worldwide-governance-indicators, accessed on 9 November 2023.).

Acknowledgments

The authors gratefully acknowledge the helpful reviews and comments from the editors and anonymous reviewers, which improved this manuscript considerably. Any remaining errors are solely the responsibility of the authors.

Conflicts of Interest

The authors declare that they have no known competing financial interests or personal relationships that could have appeared to influence the work reported in this paper.

References

  1. Li, B.; Han, Y.; Wang, C.; Sun, W. Did Civilized City Policy Improve Energy Efficiency of Resource-Based Cities? Prefecture-Level Evidence from China. SSRN Electron. J. 2022. [Google Scholar] [CrossRef]
  2. Wang, J.; Shahbaz, M.; Song, M. Evaluating Energy Economic Security and Its Influencing Factors in China. Energy 2021, 229, 120638. [Google Scholar] [CrossRef]
  3. Su, C.-W.; Pang, L.-D.; Qin, M.; Lobonţ, O.-R.; Umar, M. The Spillover Effects among Fossil Fuel, Renewables and Carbon Markets: Evidence under the Dual Dilemma of Climate Change and Energy Crises. Energy 2023, 274, 127304. [Google Scholar] [CrossRef]
  4. IEA. Net Zero Roadmap: A Global Pathway to Keep the 1.5 °C Goal in Reach—Analysis; IEA: Paris, France, 2023. [Google Scholar]
  5. Greenpeace Sustainability Should Be Priority for China’s Belt and Road-Greenpeace. Available online: https://www.greenpeace.org/eastasia/press/1383/sustainability-should-be-priority-for-chinas-belt-and-road-greenpeace/ (accessed on 10 October 2023).
  6. Hurri, K. Rethinking Climate Leadership: Annex I Countries’ Expectations for China’s Leadership Role in the Post-Paris UN Climate Negotiations. Environ. Dev. 2020, 35, 100544. [Google Scholar] [CrossRef]
  7. Tan, X.-C.; Zhu, K.-W.; Sun, Y.-L.; Zhao, W.-Y.; Chen, F. Bibliometric Research on the Development of Climate Change in the BRI Regions. Adv. Clim. Change Res. 2021, 12, 254–262. [Google Scholar] [CrossRef]
  8. Peng, H.-R.; Tan, X.; Managi, S.; Taghizadeh-Hesary, F. Club Convergence in Energy Efficiency of Belt and Road Initiative Countries: The Role of China’s Outward Foreign Direct Investment. Energy Policy 2022, 168, 113139. [Google Scholar] [CrossRef]
  9. Wu, Y.; Chen, C.; Hu, C. Does the Belt and Road Initiative Increase the Carbon Emission Intensity of Participating Countries? China World Econ. 2021, 29, 1–25. [Google Scholar] [CrossRef]
  10. Zhao, J.; Pan, J.; Xie, X.; Su, M. Green Outward Foreign Direct Investment and Host Country Environmental Effects: The Home Country’s Carbon Emission Reduction System Is Crucial. Energy 2024, 290, 130182. [Google Scholar] [CrossRef]
  11. Li, B.; Hu, J.; Chen, G.; Xiao, D.; Cheng, S. The Environmental Effects of Regional Economic Cooperation: Evidence from the Belt and Road Initiative. Front. Environ. Sci. 2022, 10, 1020502. [Google Scholar] [CrossRef]
  12. Tawiah, V.K.; Zakari, A.; Khan, I. The Environmental Footprint of China-Africa Engagement: An Analysis of the Effect of China–Africa Partnership on Carbon Emissions. Sci. Total Environ. 2021, 756, 143603. [Google Scholar] [CrossRef]
  13. Hughes, A.C. Understanding and Minimizing Environmental Impacts of the Belt and Road Initiative. Conserv. Biol. 2019, 33, 883–894. [Google Scholar] [CrossRef] [PubMed]
  14. Ng, L.S.; Campos-Arceiz, A.; Sloan, S.; Hughes, A.C.; Tiang, D.C.F.; Li, B.V.; Lechner, A.M. The Scale of Biodiversity Impacts of the Belt and Road Initiative in Southeast Asia. Biol. Conserv. 2020, 248, 108691. [Google Scholar] [CrossRef]
  15. Hopwood, B.; Mellor, M.; O’Brien, G. Sustainable Development: Mapping Different Approaches. Sustain. Dev. 2005, 13, 38–52. [Google Scholar] [CrossRef]
  16. Khan, I.; Zakari, A.; Zhang, J.; Dagar, V.; Singh, S. A Study of Trilemma Energy Balance, Clean Energy Transitions, and Economic Expansion in the Midst of Environmental Sustainability: New Insights from Three Trilemma Leadership. Energy 2022, 248, 123619. [Google Scholar] [CrossRef]
  17. Zhang, D.; Kong, Q. Green Energy Transition and Sustainable Development of Energy Firms: An Assessment of Renewable Energy Policy. Energy Econ. 2022, 111, 106060. [Google Scholar] [CrossRef]
  18. Huang, Y.; Yu, Y. Determinants of Chinese Energy OFDI Location Decisions and Entry Failure Risk: The Roles of Public Diplomacy Endeavors and Firm Investment Strategies. Energy 2023, 267, 126570. [Google Scholar] [CrossRef]
  19. Razzaq, A.; An, H.; Delpachitra, S. Does Technology Gap Increase FDI Spillovers on Productivity Growth? Evidence from Chinese Outward FDI in Belt and Road Host Countries. Technol. Forecast. Soc. Change 2021, 172, 121050. [Google Scholar] [CrossRef]
  20. Gong, X. Energy Security through a Financial Lens: Rethinking Geopolitics, Strategic Investment, and Governance in China’s Global Energy Expansion. Energy Res. Soc. Sci. 2022, 83, 102341. [Google Scholar] [CrossRef]
  21. Jackson, M.M.; Lewis, J.I.; Zhang, X. A Green Expansion: China’s Role in the Global Deployment and Transfer of Solar Photovoltaic Technology. Energy Sustain. Dev. 2021, 60, 90–101. [Google Scholar] [CrossRef]
  22. Liu, H.; Wang, Y.; Jiang, J.; Wu, P. How Green Is the “Belt and Road Initiative”?—Evidence from Chinese OFDI in the Energy Sector. Energy Policy 2020, 145, 111709. [Google Scholar] [CrossRef]
  23. Wang, B.; Lin, P. Whether China’s Overseas Energy Infrastructure Projects Dirtier or Cleaner after the Belt and Road Initiative? Energy Policy 2022, 166, 113007. [Google Scholar] [CrossRef]
  24. Omer, A.M. Green Energies and the Environment. Renew. Sustain. Energy Rev. 2008, 12, 1789–1821. [Google Scholar] [CrossRef]
  25. Midilli, A.; Dincer, I.; Ay, M. Green Energy Strategies for Sustainable Development. Energy Policy 2006, 34, 3623–3633. [Google Scholar] [CrossRef]
  26. Rao, A.; Lucey, B.; Kumar, S.; Lim, W.M. Do Green Energy Markets Catch Cold When Conventional Energy Markets Sneeze? Energy Econ. 2023, 127, 107035. [Google Scholar] [CrossRef]
  27. Seetharaman; Moorthy, K.; Patwa, N.; Saravanan; Gupta, Y. Breaking Barriers in Deployment of Renewable Energy. Heliyon 2019, 5, e01166. [Google Scholar] [CrossRef] [PubMed]
  28. Karakosta, C.; Doukas, H.; Psarras, J. Technology Transfer through Climate Change: Setting a Sustainable Energy Pattern. Renew. Sustain. Energy Rev. 2010, 14, 1546–1557. [Google Scholar] [CrossRef]
  29. Urban, F. China’s Rise: Challenging the North-South Technology Transfer Paradigm for Climate Change Mitigation and Low Carbon Energy. Energy Policy 2018, 113, 320–330. [Google Scholar] [CrossRef]
  30. Zeng, W. Towards Growth-Driven Environmentalism: The Green Energy Transition and Local State in China. Energy Res. Soc. Sci. 2024, 117, 103726. [Google Scholar] [CrossRef]
  31. Chen, Y.; Landry, D. Capturing the Rains: Comparing Chinese and World Bank Hydropower Projects in Cameroon and Pathways for South-South and North South Technology Transfer. Energy Policy 2018, 115, 561–571. [Google Scholar] [CrossRef]
  32. Luo, Y.; Xue, Q.; Han, B. How Emerging Market Governments Promote Outward FDI: Experience from China. J. World Bus. 2010, 45, 68–79. [Google Scholar] [CrossRef]
  33. Zhang, C.; Zheng, W.; Hong, J.; Kafouros, M. The Role of Government Policies in Explaining the Internationalization of Chinese Firms. J. Bus. Res. 2022, 141, 552–563. [Google Scholar] [CrossRef]
  34. Du, J.; Zhang, Y. Does One Belt One Road Strategy Promote Chinese Overseas Direct Investment? China Econ. Rev. 2018, 47, 189–205. [Google Scholar] [CrossRef]
  35. Shao, X. Chinese OFDI Responses to the B&R Initiative: Evidence from a Quasi-Natural Experiment. China Econ. Rev. 2020, 61, 101435. [Google Scholar] [CrossRef]
  36. Cheng, S.; Wang, B. Impact of the Belt and Road Initiative on China’s Overseas Renewable Energy Development Finance: Effects and Features. Renew. Energy 2023, 206, 1036–1048. [Google Scholar] [CrossRef]
  37. Zuo, M.; Yu, S. Dual Dividends of Multilateral Energy Cooperation: Renewable Investment Surge and Air Quality Improvements under the Belt and Road Energy Partnership. Renew. Energy 2026, 256, 124164. [Google Scholar] [CrossRef]
  38. BloombergNEF. Energy Transition Investment Trends. 2024. Available online: https://about.bnef.com/energy-transition-investment/ (accessed on 23 October 2024).
  39. Sheppard, E.S. Limits to Globalization: Disruptive Geographies of Capitalist Development; Oxford University Press: Oxford, UK, 2016; ISBN 978-0-19-968116-7. [Google Scholar]
  40. Fisher, D.R.; Green, J.F. Understanding Disenfranchisement: Civil Society and Developing Countries’ Influence and Participation in Global Governance for Sustainable Development. Glob. Environ. Polit. 2004, 4, 65–84. [Google Scholar] [CrossRef]
  41. Belt and Road Portal. Joint Communiqué of the Roundtable Summit of the “Belt and Road” International Co-Operation Forum (Full Text). Available online: https://eng.yidaiyilu.gov.cn/ (accessed on 28 March 2025).
  42. Liu, W.; Dunford, M.; Gao, B. A Discursive Construction of the Belt and Road Initiative: From Neo-Liberal to Inclusive Globalization. J. Geogr. Sci. 2018, 28, 1199–1214. [Google Scholar] [CrossRef]
  43. Shaikh, F.; Ji, Q.; Fan, Y. The Diagnosis of an Electricity Crisis and Alternative Energy Development in Pakistan. Renew. Sustain. Energy Rev. 2015, 52, 1172–1185. [Google Scholar] [CrossRef]
  44. Lam, P.T.I.; Law, A.O.K. Financing for Renewable Energy Projects: A Decision Guide by Developmental Stages with Case Studies. Renew. Sustain. Energy Rev. 2018, 90, 937–944. [Google Scholar] [CrossRef]
  45. Casier, T. The Geopolitics of the EU’s Decarbonization Strategy: A Bird’s Eye Perspective. In Decarbonization in the European Union; Dupont, C., Oberthür, S., Eds.; Palgrave Macmillan UK: London, UK, 2015; pp. 159–179. ISBN 978-1-349-68088-7. [Google Scholar]
  46. Kozlova, M.; Collan, M. Renewable Energy Investment Attractiveness: Enabling Multi-Criteria Cross-Regional Analysis from the Investors’ Perspective. Renew. Energy 2020, 150, 382–400. [Google Scholar] [CrossRef]
  47. Stram, B.N. Key Challenges to Expanding Renewable Energy. Energy Policy 2016, 96, 728–734. [Google Scholar] [CrossRef]
  48. Wang, Y.; Xu, A. Green Investments and Development of Renewable Energy Projects: Evidence from 15 RCEP Member Countries. Renew. Energy 2023, 211, 1045–1050. [Google Scholar] [CrossRef]
  49. Shahbaz, M.; Topcu, B.A.; Sarıgül, S.S.; Vo, X.V. The Effect of Financial Development on Renewable Energy Demand: The Case of Developing Countries. Renew. Energy 2021, 178, 1370–1380. [Google Scholar] [CrossRef]
  50. Qin, Y.; Xu, Z.; Wang, X.; Škare, M. The Effects of Financial Institutions on the Green Energy Transition: A Cross-Sectional Panel Study. Econ. Anal. Policy 2023, 78, 524–542. [Google Scholar] [CrossRef]
  51. Skare, M.; Gavurova, B.; Sinkovic, D. Regional Aspects of Financial Development and Renewable Energy: A Cross-Sectional Study in 214 Countries. Econ. Anal. Policy 2023, 78, 1142–1157. [Google Scholar] [CrossRef]
  52. Asiedu, E. On the Determinants of Foreign Direct Investment to Developing Countries: Is Africa Different? World Dev. 2002, 30, 107–119. [Google Scholar] [CrossRef]
  53. Bellak, C.; Leibrecht, M.; Damijan, J.P. Infrastructure Endowment and Corporate Income Taxes as Determinants of Foreign Direct Investment in Central and Eastern European Countries. World Econ. 2009, 32, 267–290. [Google Scholar] [CrossRef]
  54. Chen, H.; Gangopadhyay, P.; Singh, B.; Chen, K. What Motivates Chinese Multinational Firms to Invest in Asia? Poor Institutions versus Rich Infrastructures of a Host Country. Technol. Forecast. Soc. Change 2023, 189, 122323. [Google Scholar] [CrossRef]
  55. Cheng, L.K.; Kwan, Y.K. What Are the Determinants of the Location of Foreign Direct Investment? The Chinese Experience. J. Int. Econ. 2000, 51, 379–400. [Google Scholar] [CrossRef]
  56. Donaubauer, J.; Meyer, B.; Nunnenkamp, P. Aid, Infrastructure, and FDI: Assessing the Transmission Channel with a New Index of Infrastructure. World Dev. 2016, 78, 230–245. [Google Scholar] [CrossRef]
  57. Kinda, T. Investment Climate and FDI in Developing Countries: Firm-Level Evidence. World Dev. 2010, 38, 498–513. [Google Scholar] [CrossRef]
  58. Huang, Y. Understanding China’s Belt & Road Initiative: Motivation, Framework and Assessment. China Econ. Rev. 2016, 40, 314–321. [Google Scholar] [CrossRef]
  59. Yu, H. Motivation behind China’s ‘One Belt, One Road’ Initiatives and Establishment of the Asian Infrastructure Investment Bank. J. Contemp. China 2017, 26, 353–368. [Google Scholar] [CrossRef]
  60. Ho, C.-Y.; Narins, T.P.; Sung, W. Developing Information and Communication Technology with the Belt and Road Initiative and the Digital Silk Road. Telecommun. Policy 2023, 47, 102672. [Google Scholar] [CrossRef]
  61. Petry, J. Beyond Ports, Roads and Railways: Chinese Economic Statecraft, the Belt and Road Initiative and the Politics of Financial Infrastructures. Eur. J. Int. Relat. 2023, 29, 319–351. [Google Scholar] [CrossRef]
  62. Chishti, M.Z.; Xia, X.; Du, A.M.; Özkan, O. Digital Financial Inclusion, the Belt and Road Initiative, and the Paris Agreement: Impacts on Energy Transition Grid Costs. Finance Res. Lett. 2025, 72, 106517. [Google Scholar] [CrossRef]
  63. American Enterprise Institute and Heritage Foundation. China Global Investment Tracker 2023. Available online: https://www.aei.org/china-global-investment-tracker/ (accessed on 23 October 2024).
  64. Li, J.; Umar, M.; Huo, J. The Spillover Effect between Chinese Crude Oil Futures Market and Chinese Green Energy Stock Market. Energy Econ. 2023, 119, 106568. [Google Scholar] [CrossRef]
  65. Hasan, K.N.; Preece, R.; Milanović, J.V. Existing Approaches and Trends in Uncertainty Modelling and Probabilistic Stability Analysis of Power Systems with Renewable Generation. Renew. Sustain. Energy Rev. 2019, 101, 168–180. [Google Scholar] [CrossRef]
  66. Alsayegh, O.; Alhajraf, S.; Albusairi, H. Grid-Connected Renewable Energy Source Systems: Challenges and Proposed Management Schemes. Energy Convers. Manag. 2010, 51, 1690–1693. [Google Scholar] [CrossRef]
  67. Zeng, J.; Bao, R.; McFarland, M. Clean Energy Substitution: The Effect of Transitioning from Coal to Gas on Air Pollution. Energy Econ. 2022, 107, 105816. [Google Scholar] [CrossRef]
  68. Zhao, N.; You, F. Can Renewable Generation, Energy Storage and Energy Efficient Technologies Enable Carbon Neutral Energy Transition? Appl. Energy 2020, 279, 115889. [Google Scholar] [CrossRef]
  69. Imbens, G.W.; Wooldridge, J.M. Recent Developments in the Econometrics of Program Evaluation. J. Econ. Lit. 2009, 47, 5–86. [Google Scholar] [CrossRef]
  70. Fang, K.; Wang, S.; He, J.; Song, J.; Fang, C.; Jia, X. Mapping the Environmental Footprints of Nations Partnering the Belt and Road Initiative. Resour. Conserv. Recycl. 2021, 164, 105068. [Google Scholar] [CrossRef]
  71. Muhammad, S.; Long, X.; Salman, M.; Dauda, L. Effect of Urbanization and International Trade on CO2 Emissions across 65 Belt and Road Initiative Countries. Energy 2020, 196, 117102. [Google Scholar] [CrossRef]
  72. Angrist, J.D.; Pischke, J.-S. Mostly Harmless Econometrics: An Empiricist’s Companion; Princeton University Press: Princeton, NJ, USA, 2009; ISBN 978-0-691-12034-8. [Google Scholar]
  73. Ryan, A.M.; Burgess, J.F.; Dimick, J.B. Why We Should Not Be Indifferent to Specification Choices for Difference-in-Differences. Health Serv. Res. 2015, 50, 1211–1235. [Google Scholar] [CrossRef]
  74. Schleussner, C.-F.; Rogelj, J.; Schaeffer, M.; Lissner, T.; Licker, R.; Fischer, E.M.; Knutti, R.; Levermann, A.; Frieler, K.; Hare, W. Science and Policy Characteristics of the Paris Agreement Temperature Goal. Nat. Clim. Change 2016, 6, 827–835. [Google Scholar] [CrossRef]
  75. Falkner, R. The Paris Agreement and the New Logic of International Climate Politics. Int. Aff. 2016, 92, 1107–1125. [Google Scholar] [CrossRef]
  76. Guo, J. Public Data Openness and China’s Green Total Factor Productivity: A Perspective of Data Factor. Econ. Res. J. 2025, 60, 56–72. [Google Scholar]
  77. Callaway, B.; Sant’Anna, P.H.C. Difference-in-Differences with Multiple Time Periods. J. Econ. 2021, 225, 200–230. [Google Scholar] [CrossRef]
  78. Thacker, S.; Adshead, D.; Fay, M.; Hallegatte, S.; Harvey, M.; Meller, H.; O’Regan, N.; Rozenberg, J.; Watkins, G.; Hall, J.W. Infrastructure for Sustainable Development. Nat. Sustain. 2019, 2, 324–331. [Google Scholar] [CrossRef]
  79. Sun, Y.; Ajaz, T.; Razzaq, A. How Infrastructure Development and Technical Efficiency Change Caused Resources Consumption in BRICS Countries: Analysis Based on Energy, Transport, ICT, and Financial Infrastructure Indices. Resour. Policy 2022, 79, 102942. [Google Scholar] [CrossRef]
  80. Donaldson, D. Railroads of the Raj: Estimating the Impact of Transportation Infrastructure. Am. Econ. Rev. 2018, 108, 899–934. [Google Scholar] [CrossRef]
  81. Yang, G.; Huang, X.; Huang, J.; Chen, H. Assessment of the Effects of Infrastructure Investment under the Belt and Road Initiative. China Econ. Rev. 2020, 60, 101418. [Google Scholar] [CrossRef]
  82. Arvin, M.B.; Pradhan, R.P.; Nair, M. Uncovering Interlinks among ICT Connectivity and Penetration, Trade Openness, Foreign Direct Investment, and Economic Growth: The Case of the G-20 Countries. Telemat. Inform. 2021, 60, 101567. [Google Scholar] [CrossRef]
  83. Wang, Q.; Zhou, J. Study on Evolution and Governance of Maker Space Ecosystem; China Social Sciences Press: Beijing, China, 2022; ISBN 978-7-5203-9855-8. [Google Scholar]
  84. Bakhtyar, B.; Sopian, K.; Sulaiman, M.Y.; Ahmad, S.A. Renewable Energy in Five South East Asian Countries: Review on Electricity Consumption and Economic Growth. Renew. Sustain. Energy Rev. 2013, 26, 506–514. [Google Scholar] [CrossRef]
  85. Erdiwansyah; Mamat, R.; Sani, M.S.M.; Sudhakar, K. Renewable Energy in Southeast Asia: Policies and Recommendations. Sci. Total Environ. 2019, 670, 1095–1102. [Google Scholar] [CrossRef]
  86. Kumar Singh, B. South Asia Energy Security: Challenges and Opportunities. Energy Policy 2013, 63, 458–468. [Google Scholar] [CrossRef]
  87. Aliyu, A.K.; Modu, B.; Tan, C.W. A Review of Renewable Energy Development in Africa: A Focus in South Africa, Egypt and Nigeria. Renew. Sustain. Energy Rev. 2018, 81, 2502–2518. [Google Scholar] [CrossRef]
  88. Vakulchuk, R.; Overland, I. Central Asia Is a Missing Link in Analyses of Critical Materials for the Global Clean Energy Transition. One Earth 2021, 4, 1678–1692. [Google Scholar] [CrossRef]
  89. Nematollahi, O.; Hoghooghi, H.; Rasti, M.; Sedaghat, A. Energy Demands and Renewable Energy Resources in the Middle East. Renew. Sustain. Energy Rev. 2016, 54, 1172–1181. [Google Scholar] [CrossRef]
  90. Buckley, P.J.; Clegg, L.J.; Cross, A.R.; Liu, X.; Voss, H.; Zheng, P. Erratum: The Determinants of Chinese Outward Foreign Direct Investment. J. Int. Bus. Stud. 2009, 40, 353–354. [Google Scholar] [CrossRef]
  91. Kolstad, I.; Wiig, A. What Determines Chinese Outward FDI? J. World Bus. 2012, 47, 26–34. [Google Scholar] [CrossRef]
  92. Yang, J.-H.; Wang, W.; Wang, K.-L.; Yeh, C.-Y. Capital Intensity, Natural Resources, and Institutional Risk Preferences in Chinese Outward Foreign Direct Investment. Int. Rev. Econ. Finance 2018, 55, 259–272. [Google Scholar] [CrossRef]
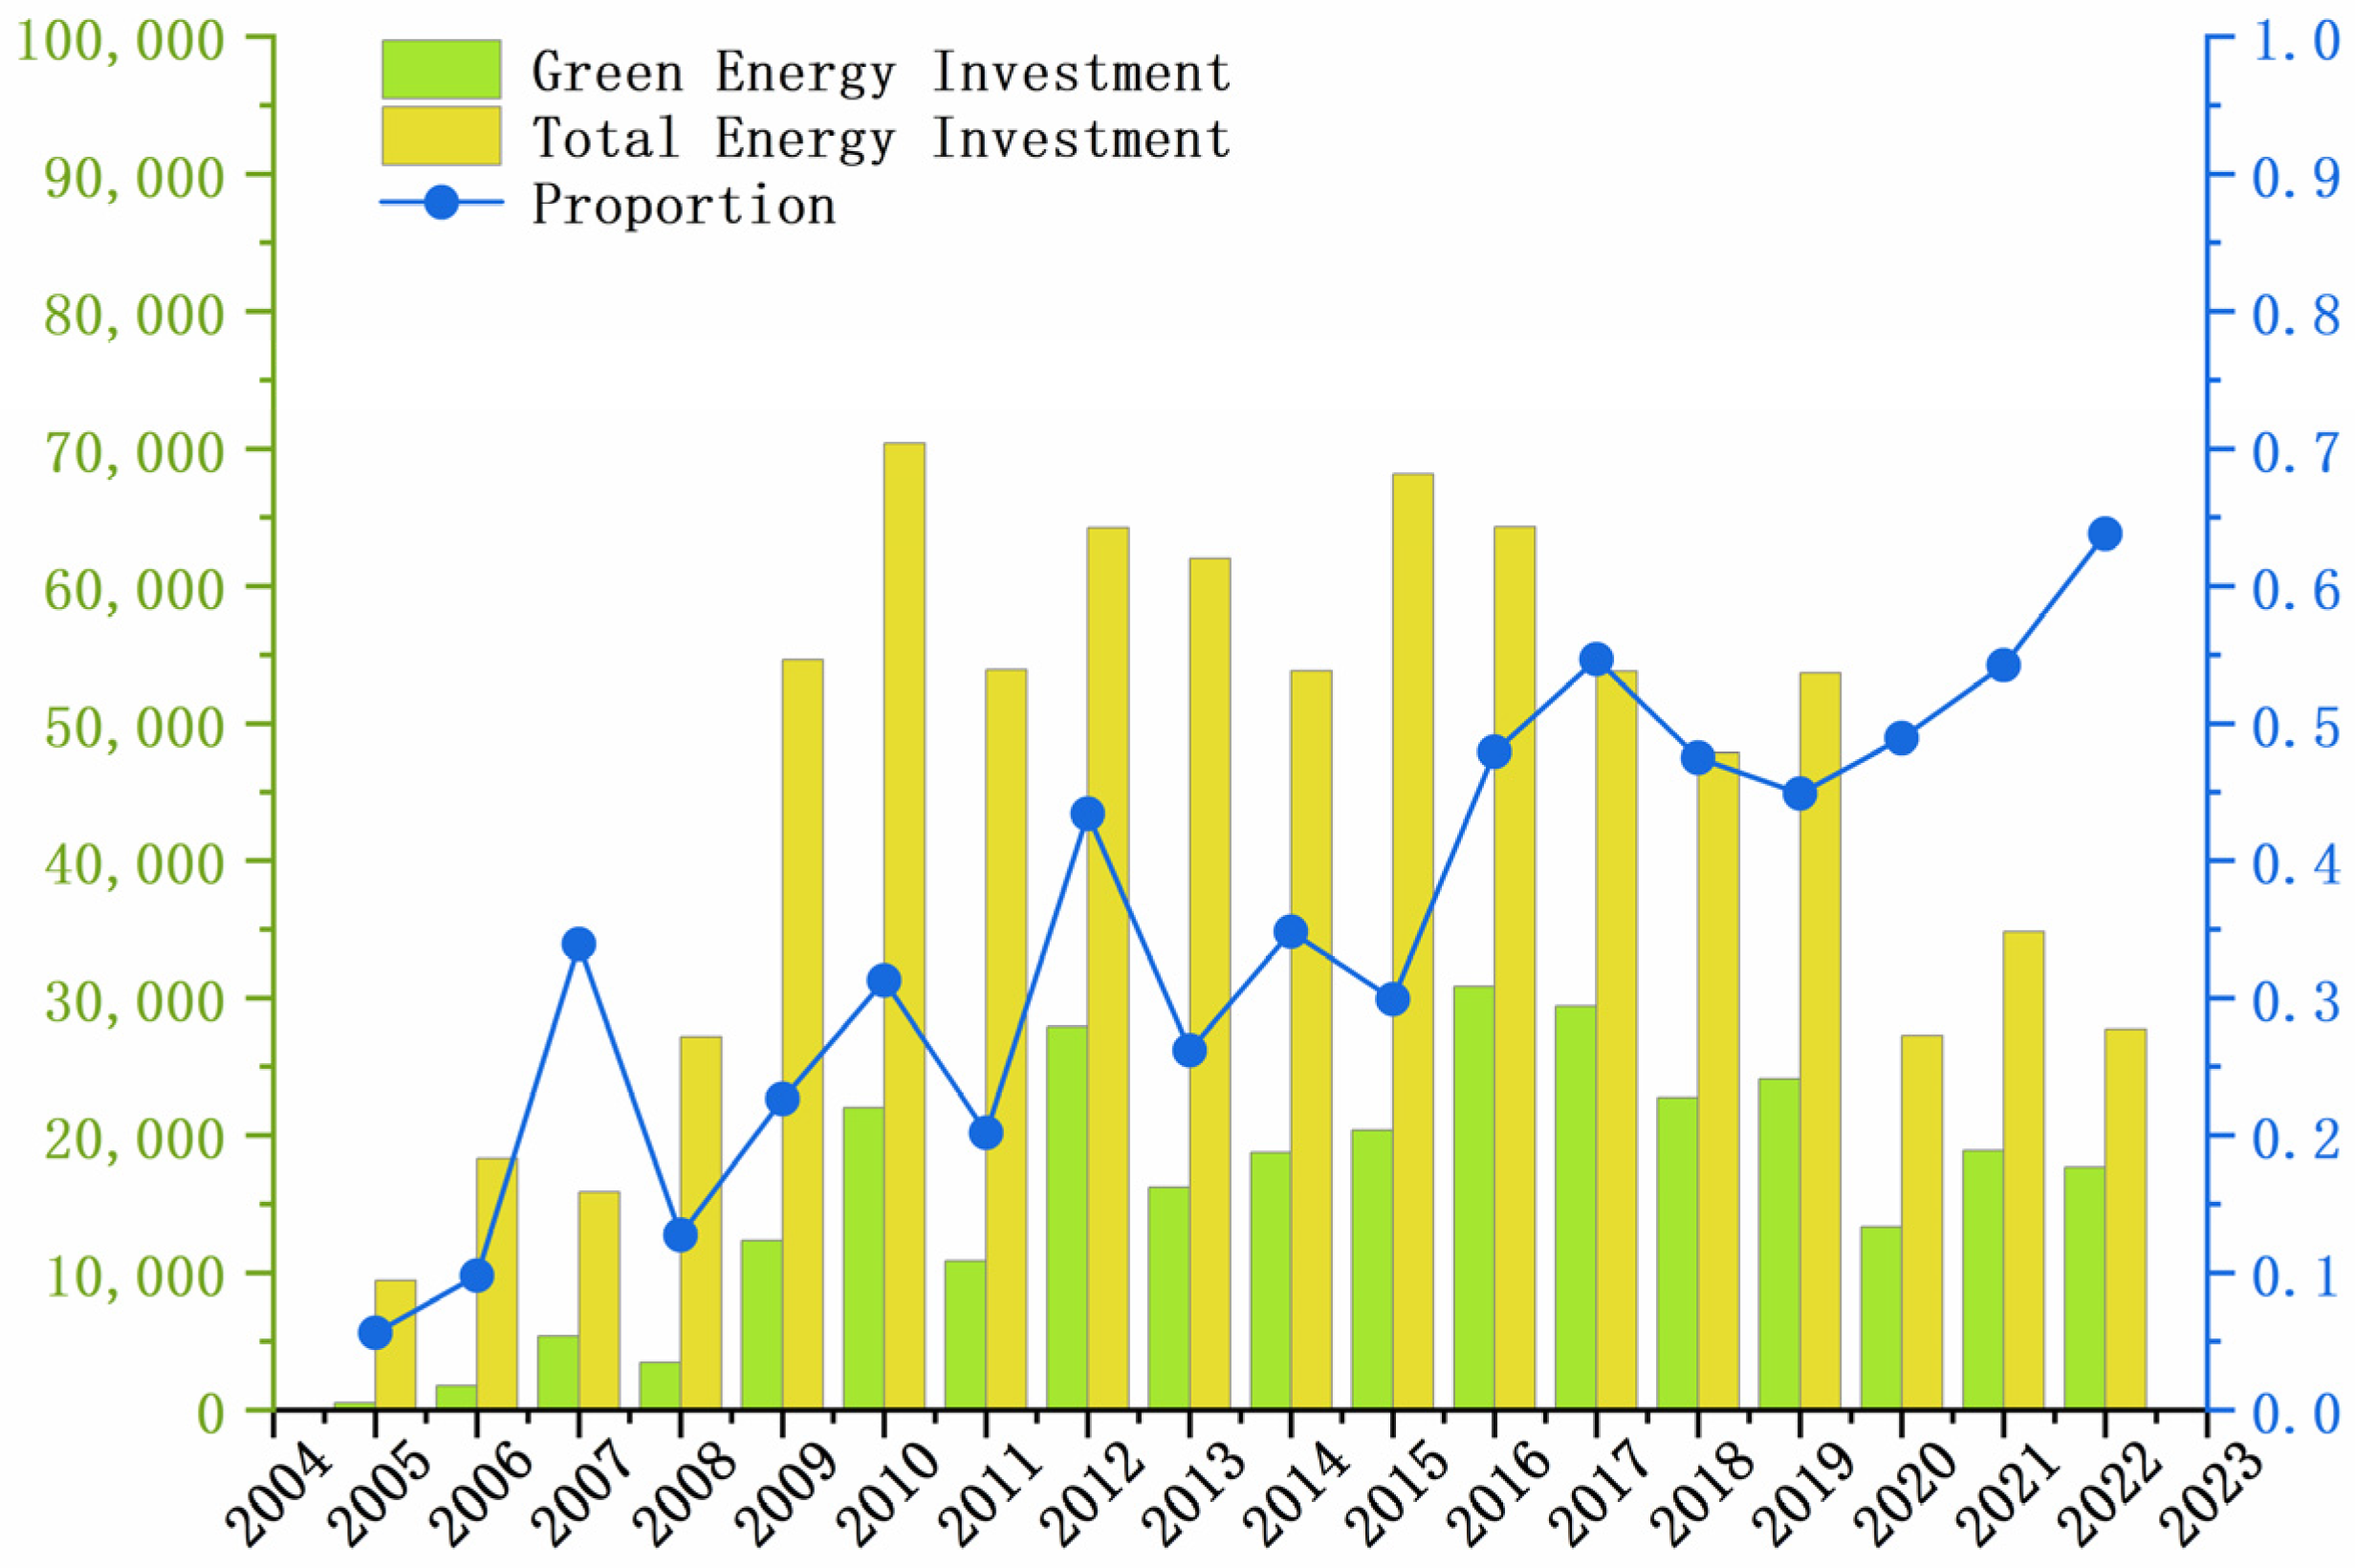
Figure 1. 2004–2023 Chinese investment in the energy sector.
Energies 18 05268 g001
Figure 2. Mechanism of the BRI’s Impact on China’s Green Energy Projects.
Energies 18 05268 g002
Figure 3. Parallel trend test. Bars denote 95% confidence intervals, and standard errors are clustered by country.
Energies 18 05268 g003
Figure 4. The estimated coefficient and p value of the “dummy” treatment group.
Energies 18 05268 g004
Figure 5. Standardized % bias across covariates before and after matching.
Energies 18 05268 g005
Figure 6. Distribution of China’s Green Energy projects in 2010.
Energies 18 05268 g006
Figure 7. Distribution of China’s Green Energy projects in 2015.
Energies 18 05268 g007
Figure 8. Distribution of China’s Green Energy projects in 2020.
Energies 18 05268 g008
Figure 9. Distribution of China’s Green Energy projects in 2022.
Energies 18 05268 g009
Table 1. 42 BRI countries involved in China’s green energy projects.
AreaCountryNumber
Central AsiaTajikistan, Kyrgyzstan, Kazakhstan, Uzbekistan4
West AsiaIran, Iraq, Jordan, Israel, Saudi Arabia, Oman, Qatar, Kuwait, Georgia, UAE, Afghanistan11
Southeast AsiaSingapore, Malaysia, Indonesia, Thailand, Laos, Cambodia, Vietnam, Philippines8
South AsiaIndia, Pakistan, Sri Lanka, Nepal, Bangladesh5
Northeast AsiaMongolia, Russia2
AfricaEgypt1
EuropeUkraine, Belarus, Poland, Czech Republic, Hungary, Croatia, Montenegro, Serbia, Greece, Romania, Bosnia and Herzegovina11
Table 2. Descriptive statistics of control variables.
VariablesVariable MeasurementMeanSDMinMax
perGDPThe natural logarithm of the per capital GDP9.4321.1146.97211.696
GDPgrowthGDP growth (annual %)3.443.789−17.66821.452
ResThe total natural resources’ rents (% of GDP)7.3178.283053.971
PopThe natural logarithm of the population17.311.3313.34121.041
PGElectric power consumption—Electric power production−19.82641.081−27427
TraThe natural logarithm of the import value from China by the host country22.6211.82016.65827.066
FdiForeign direct investment, net inflows (% of GDP)3.4245.857−37.17359.91
IDInstitution Distance0.610.5680.0082.227
GovThe efficiency of the Government−0.1070.872−1.8072.232
CorThe control of corruption−0.2790.912−1.5972.223
LawThe level of the rule of law−0.2070.890−1.8382.024
VoiThe voice and accountability−0.3130.915−2.0341.684
Table 3. Benchmark regression results of BRI on China’s green energy projects.
(1)(2)
lnPlnP
bri × after0.801 **0.889 **
(0.378)(0.342)
_cons6.114 ***21.80
(0.553)(25.46)
controlnoyes
country effectyesyes
time effectyesyes
Observations329329
N9595
R20.1350.168
Note: Robust standard errors clustered at the country level are reported in parentheses, *** means 1% level is significant, ** means 5% level is significant.
Table 4. Results of event study.
Event TimeCoefficient95% CI Lower95% CI Upper
pre_41.400−0.299843.100203
pre_30.419−0.728281.567036
pre_20.974−0.357352.30453
current1.568 **0.3333082.803068
las_11.7160 ***0.5795862.852549
las_22.483 ***0.9953093.970655
las_31.576 **0.1822652.968883
las_41.504 ***0.3606442.646746
las_51.266 **0.0833292.449139
las_61.824 ***0.5684913.078899
las_71.664 **0.1775283.149509
las_81.828 ***0.466133.189673
las_91.702 **0.1922863.211064
Note: Robust standard errors clustered at the country level are reported in parentheses, *** means 1% level is significant, ** means 5% level is significant.
Table 5. Results of elimination of other policy.
LnP
bri × after0.868 **
(0.340)
NDCs0.308
(0.227)
_cons20.51
(25.52)
controlyes
country effectyes
time effectyes
Observations329
N95
R20.172
Note: Robust standard errors clustered at the country level are reported in parentheses, ** means 5% level is significant.
Table 6. Results of the placebo policy timing.
(1)(2)(3)
LnPLnPLnP
dummy bri × after0.6050.4870.383
(0.944)(0.333)(0.264)
_cons26.4826.9424.72
(29.61)(29.25)(28.42)
controlyesyesyes
country effectyesyesyes
time effectyesyesyes
Observations329329329
N959595
R20.1410.1430.143
Note: Robust standard errors clustered at the country level are reported in parentheses.
Table 7. Results of the PSM-DID.
(1) Before Matching(2) After Matching
LnPLnP
bri×after0.889 **1.117 ***
(0.342)(0.343)
_cons21.8026.22
(25.46)(26.03)
controlyesyes
country effectyesyes
time effectyesyes
Observations329268
N9592
R20.1680.235
Note: Robust standard errors clustered at the country level are reported in parentheses, *** means 1% level is significant, ** means 5% level is significant.
Table 8. Replacing the measure of the dependent variable.
(1)(2)
NNLnRePLnReP
bri × after0.871 ***0.762 ***0.597 **0.648 **
(0.315)(0.261)(0.289)(0.322)
_cons1.320 ***25.205.914 ***−6.255
(0.280)(24.22)(0.565)(31.38)
controlnoyesnoyes
country effectyesyesyesyes
time effectyesyesyesyes
Observations329329256256
N95958989
R20.1030.1650.1570.196
Note: Robust standard errors clustered at the country level are reported in parentheses, *** means 1% level is significant, ** means 5% level is significant.
Table 9. Results of the rebuilding of a full country–year panel.
(1)(2)
qtyN
bri × after0.911 *0.641 **
(0.495)(0.317)
_cons43.6740.89 *
(36.56)(23.90)
controlyesyes
country effectyesyes
time effectyesyes
Observations13231323
N9494
pseudo-R20.40350.2336
Note: Robust standard errors clustered at the country level are reported in parentheses, ** means 5% level is significant, * means 10% level is significant.
Table 10. Results of the staggered DID based on zero-value filling of projects data.
(1)(2)
LnqtyLnqty
ATT0.1110.454
(0.462)(0.783)
controlnoyes
country effectyesyes
time effectyesyes
Observations13301325
Note: Robust standard errors clustered at the country level are reported in parentheses.
Table 11. Results of the mechanisms of infrastructure testing.
(1)(2)(3)(4)
TransportCommunicationsFinancialEnergy
bri × after0.720 **6.808 ***8.924 **0.152 ***
(0.333)(2.318)(4.269)(0.0446)
_cons−16.81−11.29−1668 ***5.682
(52.17)(294.8)(487.2)(6.729)
controlyesyesyesyes
country effectyesyesyesyes
time effectyesyesyesyes
Observations293328303329
N89949395
R20.2890.8430.2770.727
Note: Robust standard errors clustered at the country level are reported in parentheses, *** means 1% level is significant, ** means 5% level is significant.
Table 12. Results of heterogeneity tests for different regions.
(1)(2)(3)(4)
lnPlnPLnPlnP
Central Asia × bri × after−2.443 ***
(0.431)
Western Asia × bri × after 0.991
(0.950)
Southeast Asia × bri × after 0.715
(0.444)
South Asia × bri × after 1.213 ***
(0.397)
_cons34.2739.1516.3317.86
(29.17)(32.59)(30.15)(29.77)
controlyesyesyesyes
country effectyesyesyesyes
time effectyesyesyesyes
Observations329329329329
N95959595
R20.1900.1400.1520.168
Note: Robust standard errors clustered at the country level are reported in parentheses, *** means 1% level is significant.
Table 13. Results of heterogeneity tests between high-risk and low-risk countries.
(1)(2)
DevelopedDevelopingHigh RiskLow Risk
bri × after1.4450.680 *0.4921.822 **
(0.949)(0.361)(0.676)(0.788)
_cons−14.83102.0 ***49.68304.0 **
(67.35)(36.38)(64.22)(119.2)
controlyesyesyesyes
country effectyesyesyesyes
time effectyesyesyesyes
Observations116213136117
N36595148
R20.3080.2740.3380.402
Note: Robust standard errors clustered at the country level are reported in parentheses, *** means 1% level is significant, ** means 5% level is significant, * means 10% level is significant.
Disclaimer/Publisher’s Note: The statements, opinions and data contained in all publications are solely those of the individual author(s) and contributor(s) and not of MDPI and/or the editor(s). MDPI and/or the editor(s) disclaim responsibility for any injury to people or property resulting from any ideas, methods, instructions or products referred to in the content.