Abstract
This paper develops an economic evaluation framework for pumped storage hydropower (PSH) projects based on real options, addressing the limitations of traditional economic evaluation methods that neglect investment flexibility and path dependence. The framework integrates an annual net cash flow model with an improved mean-reverting electricity price model to generate thousands of electricity price trajectories, while backward dynamic programming dynamically values abandonment options. The core innovation of this study lies in the dynamic pricing mechanism of abandonment options, which explicitly captures the flexibility of terminating projects under adverse conditions. A comparative analysis between the traditional NPV approach and the real options method reveals significant differences: the average NPV under base scenario is −38.35 million CNY, whereas option scenario yields an average NPV of 143.15 million CNY. The average value of real options is 181.5 million yuan, and it increases the average internal rate of return by 0.34%. These results demonstrate that incorporating real options prevents the underestimation of project value and provides more robust decision-making support under uncertainty, thereby offering methodological and policy insights for the investment appraisal of large-scale energy storage projects.
1. Introduction
With the increasing share of renewable energy in power systems, energy storage technologies play a vital role in mitigating electricity price volatility and supporting peak shaving in the grid [1,2]. Among the available storage options, PSH stands out due to its large capacity, long storage duration, and high conversion efficiency [3]. It is currently the most mature, reliable, and secure storage technology, offering both scalability and cost-effectiveness. PSH can effectively smooth the variability of intermittent renewable generation and provides multiple ancillary services, such as peak shaving and valley filling, frequency and voltage regulation, spinning reserve, and black start capability. These functions are essential for power system restructuring and maintaining secure and stable grid operation [4,5,6,7].
To assess the economic benefits of PSH, numerous research methods have been proposed. Reference [8] developed a comprehensive evaluation framework for PSH operation in new-type power systems across four dimensions: economic efficiency, decarbonization, flexibility, and reliability. Reference [9] proposed a multi-objective optimization model for a PSH–PV–wind–battery system, incorporating a peak–valley price mechanism and green power subsidies. Reference [10] quantitatively assessed how peak–valley regulation affected generation and profits in hybrid PSH plants, proposing a multi-timescale peak-shaving operation strategy and an internal benefit allocation mechanism for hybrid pumped storage hydropower plants involving multiple stakeholders. Reference [11] proposed an optimization algorithm integrating both market and plant models, aiming to maximize PSH profits across different scenarios and thereby identify the best operation strategy among multiple markets.
Under uncertain investment environments, investors can manage investment opportunities by optimally selecting the timing of their decisions to maximize returns [12]. Conventional approaches such as the NPV method are widely applied for evaluating long-term energy investments [13]. However, traditional investment decision-making approaches for PSH projects often assume that decisions are made irreversibly at the outset of the project. Such approaches fail to capture the flexibility arising from adjusting operational strategies under varying market environments, which may lead to underestimation of both the project’s true value and its risk management potential.
As the largest and longest-lifetime flexible resource in power systems, PSH investments are characterized by strong irreversibility, long construction cycles, and high capital intensity. Moreover, their long-term profitability critically depends on external uncertainties such as electricity price fluctuations, policy adjustments, and ancillary service compensation [14,15,16]. Compared with conventional NPV analysis, the real options method is better suited to capture the flexibility and value of uncertainty in PSH investment.
The real options approach extends traditional discounted cash flow analysis by allowing investors to incorporate the value of uncertainty and flexibility into their decisions, including the option to delay investment [17,18,19]. This makes real options analysis a highly regarded method for project valuation. In recent years, real options theory has been applied to investment decisions in renewable energy generation, waste-to-energy projects, and hydropower development [20,21,22]. However, its application to PSH remains limited. To address this gap, this paper proposes an economic analysis model for PSH investment based on real options.
This paper first develops an annual net cash flow model for the pumped-storage hydropower plant. An improved mean-reverting electricity price model is then employed to generate stochastic trajectories of annual average feed-in prices and pumping purchase prices over the project lifetime, yielding thousands of simulated price paths. By applying backward dynamic programming, each path is evaluated for option valuation. Subsequently, the equivalent NPV incorporating real option value and the internal rate of return (IRR) are calculated, and the proposed framework is validated through a representative case study. Figure 1 shows a flowchart for the proposed method.
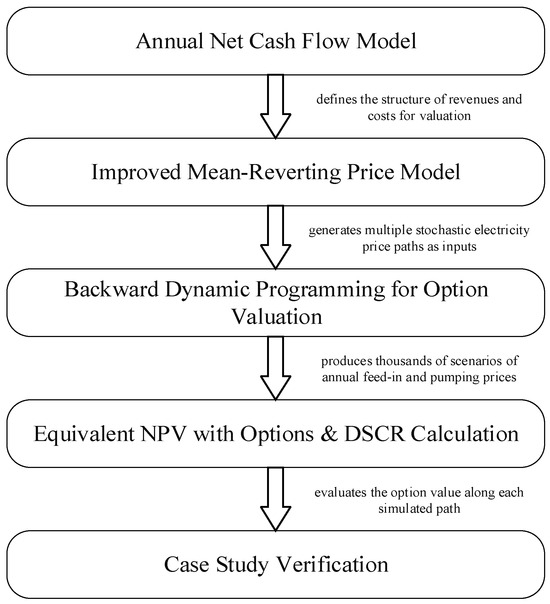
Figure 1.
Flowchart for method.
2. Economy Modeling Based on Real Options
2.1. Improved Mean-Reverting Electricity Price Model
The mean-reverting process is a widely used method for modeling uncertainty in energy and financial markets. Its core principle is that prices or variables fluctuate randomly but tend to revert around a long-term equilibrium level, rather than diverging indefinitely. Compared with the traditional geometric Brownian motion (GBM), the mean-reverting model better reflects the actual characteristics of electricity markets, where prices typically exhibit mean-reverting behavior under the influence of policy regulation, fuel cost constraints, and market mechanisms.
For PSH plants, their primary revenue relies on arbitrage between “low-price pumping and high-price generation.” The magnitude of such arbitrage is determined jointly by electricity price volatility and mean reversion. Therefore, employing a mean-reverting model to simulate electricity prices enables more accurate characterization of the uncertainties in PSH’s peak–valley arbitrage, risk hedging, and investment valuation, providing a reliable foundation for economic analysis and real options pricing.
To capture key features of PSH electricity prices such as mean reversion, price spikes, seasonality, and policy interventions, this paper develops an improved mean-reverting model based on the traditional GBM framework.
The logarithmic price of electricity tariff is modeled according to an improved mean-reversion model as:
The model consists of three components: the mean-reverting term, the diffusion term, and the jump term.
In mean-reverting term, is the speed of mean reversion; is the long-term mean, modeled as a time-dependent function to incorporate seasonality and policy interventions.
Diffusion term represents the Brownian motion term, characterizing everyday fluctuations, where is the volatility. indicates that within a small time interval , the increment in Brownian motion is a normal random variable with mean zero and variance .
The jump term is modeled using a Poisson process. The Poisson process is a common type of sparse event process, where the expected number of events occurring per unit time is governed by the intensity parameter . Within a small time interval , if the probability of a spike event occurring is approximately , the electricity price process can be modeled by superimposing discrete jumps triggered by a Poisson process onto the continuous fluctuations in Brownian motion. This approach more accurately captures the sudden extreme volatility observed in the market. J represents the jump magnitude, typically modeled as a log-normal distribution . When no electricity price jump occurs, ; when an electricity price jump occurs, .
In accordance with policy requirements, the pumping electricity price is set at 75% of the benchmark coal-fired on-grid tariff in regions where the spot market has not yet been established, and therefore fluctuates proportionally with the feed-in tariff.
2.2. Annual Net Cash Flow Model
To assess the financial feasibility and operational effectiveness of PSH plants, this paper constructs an annual net cash flow model. The model quantifies the annual cash inflows and outflows generated by plant operations and computes the key net cash flow values.
Equation (1) is the mathematical formulation of the annual net cash flow model:
where Rh is generation feed-in revenue; Rcap is capacity compensation revenue; Cp is pumping power purchase cost; Com is operation and maintenance (O&M) cost, including fixed O&M cost and variable O&M cost; ε is income tax expense; D is annual depreciation, which is equal for each year.
CF(t) = Rh(t) + Rcap(t) − Cp(t) − Com(t) − ε(t) + D
2.2.1. Annual Pumping and Generation
During off-peak load periods, PSH plants use surplus electricity to pump water from the lower reservoir to the upper reservoir, thereby converting electrical energy into stored potential energy. During peak load hours, water is released from the upper reservoir to the lower reservoir for power generation, converting potential energy back into electricity to supply peak demand and provide peak-shaving services for the power system.
Equation (2) is expression for the annual pumping electricity consumption Ep:
where Ep is the annual electricity consumed during pumping operation; C is the total installed capacity; denotes the annual operating hours of pumping units; ηp is the pumping efficiency.
Equation (3) is expression for the annual electricity generation Eh:
where Eh is the annual electricity output under generation mode; denotes the annual operating hours of generating units; ηh is the generation efficiency.
2.2.2. Annual Revenues and Expenditures
In China, PSH plants are subject to a two-part electricity pricing policy. On one hand, the energy price is determined competitively: when the electricity spot market is in operation, energy prices are settled according to spot market rules; when the spot market is not available, the pumping price is set at 75% of the coal-fired benchmark on-grid tariff, while the generation price follows the coal-fired benchmark tariff. On the other hand, the capacity price is set by government regulation. A dedicated methodology has been established to determine PSH capacity tariffs, which are aligned with provincial transmission and distribution tariff regulatory cycles. Overall, this framework constitutes a comprehensive PSH pricing mechanism, with the core objective of enhancing cost recovery efficiency and operability [23].
The generation revenue, as the main source of income for PSH plants, can be expressed as:
where psell is the average feed-in tariff.
Rh = Eh × psell
To compensate for fixed costs and rationalize profitability, capacity revenue is provided:
where pcap is the capacity tariff.
Rcap = C × pcap
The expenditure part is mainly divided into pumping power purchase cost and O&M cost.
The pumping electricity purchase cost, the largest single cash outflow, is defined as:
where pbuy is the average pumping electricity price.
Cp = Ep × pbuy
O&M costs include fixed and variable components: the fixed O&M cost must be paid regardless of generation, while the variable O&M cost increases proportionally with generation.
The O&M expenditure is given by:
where omfixed is the annual fixed O&M cost; omvar is the variable O&M cost per unit of electricity generated.
Com = omfixed + Eh × omvar
Annual depreciation D refers to the depreciation amount of fixed asset equipment for one year, which can be calculated using the straight-line method:
where I0 is the initial investment amount; S is the residual value at the end of the project life; T is the project lifetime.
D = (I0 − S)/T
If no tax incentives are granted, taxation must be incorporated into the annual NCF model.
The profit before tax is:
where i denotes the annual interest expense on debt.
Rbt = Rh + Rcap − Cp − Com − D − i
The annual income tax payable is then:
where τ is the income tax rate.
ε = Rbt × τ
2.3. Real Options Pricing Model
In project evaluation, the real option considered is an abandonment option, which grants the investor the right to terminate the project at any point during its lifetime and receive the residual value.
This paper uses dynamic programming method for option pricing, specifically employing backward induction to trace back from the project completion year.
The project value function indicates that the project value at a certain option decision node is the maximum value between immediate exercise and continued holding of the option:
where t is the option decision node; V(t) is the project value at this decision node; Ve(t) is the immediate exercise option value; Vh(t) is the continued holding option value.
V(t) = max{Ve(t), Vh(t)}
The project boundary condition indicates that the project value at the end of the project year is the maximum value of the residual value and the perpetual value:
where T is the overall life of the power plant; V(T) is the project value in the final year; VR(T) is the residual value in the final year; VP(T) is the perpetual value in the final year.
V(t) = max{VR(t), VP(t)}
At each decision node t, the project value can be judged according to the following formula:
If the option had been exercised immediately in that year, the value of exercising the option immediately would have been equal to the residual value for that year:
Ve(t) = VR(t)
Equation (15) is expression for the salvage value for the current year:
VR(t) = I0 − (I0 − S) × t/T
If the option had been retained at that time, the value of retaining the option could be calculated based on the cash flow and project value for the following year:
where r is the discount rate.
Vh(t) = [CF(t + 1) + V(t + 1)]/(1 + r)
If the cash flow is not zero at the end of the project, the perpetual value is given by:
VP(t) = max{0, CF(t)/r}
2.4. NPV and IRR Calculation
NPV is defined as the difference between the discounted value of future cash flows and the initial investment cost. It is calculated by discounting each year’s cash flow at the discount rate and summing all discounted cash flows. A positive NPV indicates that the project is economically viable, with larger NPVs reflecting greater profitability, whereas a negative NPV suggests the project is not viable.
Without considering options, the NPV is computed as:
When options are considered, the NPV incorporates the project value derived from the option pricing model:
The Internal Rate of Return (IRR) is a key indicator for evaluating investment profitability, defined as the discount rate at which the NPV of a project equals zero. It reflects the actual rate of return generated by a project after accounting for the time value of money. A project is considered financially viable if its IRR exceeds the cost of capital or the required rate of return.
The IRR satisfies the formula:
3. Case Analysis
In order to verify the feasibility of the method proposed in this paper, the pumped storage power station in Tai’an City, Shandong Province, is selected as the research object. The parameter data used in the case are shown in Table 1.

Table 1.
Parameter data.
3.1. Typical Electricity Price Simulation Path
Figure 2 shows a typical electricity price simulation path for an improved mean-reversion electricity pricing model, which simulates the fluctuation in the average feed-in tariff and the average pumped purchased power tariff over the lifetime, laying the foundation for the calculation of the cash flow and the construction of the option model.
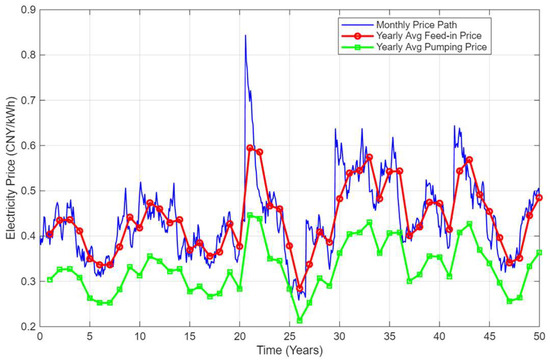
Figure 2.
Typical tariff simulation path diagram.
3.2. Analysis of Model Results
This paper sets up two scenarios: Scenario I: Base Scenario and Scenario II: Option Scenario. Compared to Scenario I, Scenario II incorporates the variable of real options to explore the additional value that the real options approach brings to the project.
Table 2 presents the average NPV values for Scenario I and Scenario II, along with the average real option values under the thousand-time electricity price path.
Table 2.
Model results.
In Scenario I, the negative average NPV indicates that the PSH project is generally unprofitable under the baseline setting. By contrast, the average NPV in Scenario II is substantially greater, with the difference representing the average value of the embedded real option. Incorporating real options enhances the project’s average NPV by approximately 4.7 times the loss magnitude observed in the baseline case, while the average IRR also increases by 0.34%.
Figure 3 and Figure 4 present the NPV distributions for Scenario I and Scenario II, respectively, using bar charts.
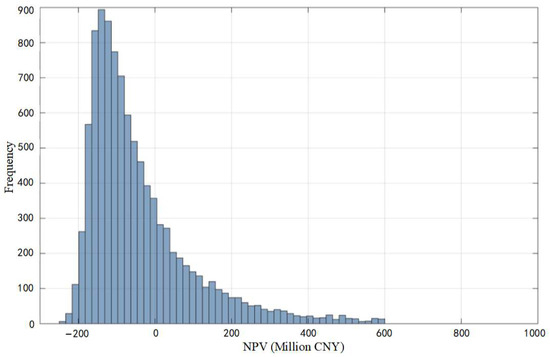
Figure 3.
NPV distribution of Scenario I.
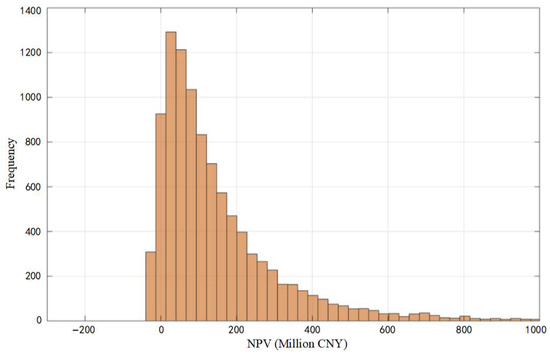
Figure 4.
NPV distribution of Scenario II.
Overall, the NPV distributions in both scenarios deviate from a standard normal form, exhibiting a roughly bell-shaped profile with higher densities in the middle and thinner tails at both ends.
Compared with Scenario I, Scenario II demonstrates a pronounced asymmetry in return characteristics, effectively granting managers the dual capacity of “downside protection and upside potential.” Specifically, under unfavorable market conditions such as sharp declines in electricity prices, the embedded real options allow managers to mitigate substantial losses by suspending operations or reducing scale, thereby capping potential losses and truncating the left tail of the distribution, which establishes a lower bound on project NPV. Conversely, under favorable conditions such as electricity price surges or supportive policy interventions, the project can exploit additional revenues through mechanisms like participation in ancillary services. This leads to theoretically unbounded upside gains, manifested as a fattened and elongated right tail in the NPV distribution.
Figure 5 shows the boxplot of the NPV distributions for both projects.
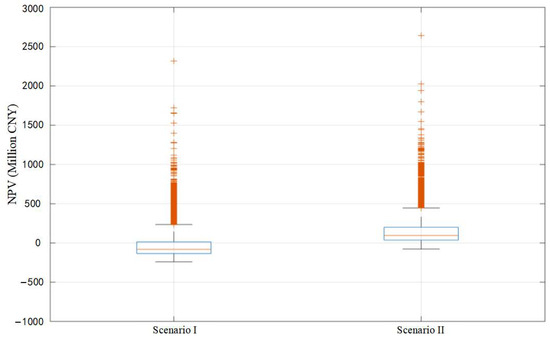
Figure 5.
Boxplot of NPV distribution.
The lower and upper edges of box correspond to the first (Q1) and third (Q3) quartiles, while the horizontal line within the box denotes the median. The box height represents the interquartile range (IQR = Q3 − Q1), covering the central 50% of the data. The whiskers extend to Q1 − 1.5 × IQR and Q3 + 1.5 × IQR, which are statistical limits rather than the observed minimum and maximum values. Data points lying beyond these boundaries are plotted as outliers.
Boxplot provides a more intuitive representation than bar charts of the contribution of real options to project value.
Figure 6 illustrates the distribution of option values, which likewise exhibits a non-standard normal pattern, with the highest frequency observed around 170 million CNY.
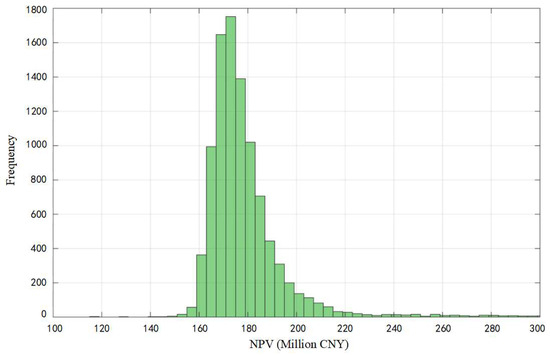
Figure 6.
Option value distribution.
The incorporation of real options leads to higher NPVs compared with Scenario I, with the incremental value arising from managerial flexibility and strategic opportunities that are not captured by the conventional NPV framework. Fundamentally, these additional values reflect the ability of project managers to proactively adjust operational strategies in response to future uncertainties. Such timing flexibility enables the realization of excess returns in volatile markets.
4. Conclusions
This study proposes an analytical framework for the economic evaluation of PSH plants based on real options. By integrating an annual net cash flow model, an improved mean-reverting electricity price model, and dynamic programming with backward induction, the method quantifies the economic and financial performance of PSH projects under uncertainty. The case study demonstrates that incorporating abandonment options substantially enhances project value and solvency, highlighting the benefits of managerial flexibility in volatile electricity markets.
However, several limitations should be acknowledged. First, the improved mean-reverting model is primarily applicable to medium-term price fluctuations with seasonality, spikes, and policy interventions; it may be less effective in capturing prolonged structural shifts in electricity markets or extreme tail risks. Second, the model assumes stable regulatory and institutional conditions, which may not hold in the face of future reforms in electricity pricing mechanisms. Finally, the analysis does not yet incorporate environmental and social benefits, which are increasingly relevant to the comprehensive evaluation of PSH investments.
Based on these findings, several policy recommendations are suggested. Policymakers should further refine the capacity pricing mechanism to ensure adequate cost recovery, accelerate the development of spot electricity markets to improve price signals for arbitrage operations, and establish supportive policies that recognize the option value and flexibility of PSH investments. Such measures can create a more favorable investment environment, enhance the resilience of power systems, and promote large-scale deployment of energy storage.
Author Contributions
Conceptualization, J.F.; Methodology, J.L.; Investigation, G.Z. and L.C.; Data curation, L.D.; Writing—original draft, W.W.; Writing—review and editing, J.L.; Funding acquisition, J.F. All authors have read and agreed to the published version of the manuscript.
Funding
This work is supported by the Science and Technology Project of State Grid Corporation of China “Technologies Research for Enhancing the Regulation and Stability Support Capabilities and Coordinated Operation of Pumped Storage Units” (No. 4000-202499363A-3-1-DG).
Data Availability Statement
The original contributions presented in this study are included in the article. Further inquiries can be directed to the corresponding author(s).
Conflicts of Interest
Author Gong Zhang was employed by the company Pumped-storage Technological & Economic Research Institute, State Grid Xinyuan Co., Ltd. Author Longxiang Chen was employed by the company State Grid Corporation of China and Lei Deng was employed by the company State Grid Electric Power Engineering Research Institute Co., Ltd. The remaining authors declare that the research was conducted in the absence of any commercial or financial relationships that could be construed as a potential conflict of interest.
References
- Castagneto Gissey, G.; Subkhankulova, D.; Dodds, P.E.; Barrett, M. Value of energy storage aggregation to the electricity system. Energy Policy 2019, 128, 685–696. [Google Scholar] [CrossRef]
- Masoumzadeh, A.; Nekouei, E.; Alpcan, T.; Chattopadhyay, D. Impact of Optimal Storage Allocation on Price Volatility in Energy-Only Electricity Markets. IEEE Trans. Power Syst. 2018, 33, 1903–1914. [Google Scholar] [CrossRef]
- IHA Water Batteries for the Renewable Energy Sector. Available online: https://www.hydropower.org/factsheets/pumped-storage (accessed on 3 September 2025).
- Li, Y.; Yang, W.; Zhao, Z.; Huang, Y.; Liao, Y.; Yang, J. Ancillary service quantitative evaluation for primary frequency regulation of pumped storage units considering refined hydraulic characteristics. J. Energy Storage 2022, 45, 103414. [Google Scholar] [CrossRef]
- Tian, B.; He, Y.; Zhou, J.; Wang, B.; Wang, Y.; Shi, W. Cost-sharing mechanisms for pumped storage plants at different market stages in China. Renew. Energy 2023, 217, 119183. [Google Scholar] [CrossRef]
- Zhao, Y.; Zhang, T.; Sun, L.; Zhao, X.; Tong, L.; Wang, L.; Ding, J.; Ding, Y. Energy storage for black start services: A review. Int. J. Miner. Metall. Mater. 2022, 29, 691–704. [Google Scholar] [CrossRef]
- Kong, Y.; Kong, Z.; Liu, Z.; Wei, C.; Zhang, J.; An, G. Pumped storage power stations in China: The past, the present, and the future. Renew. Sustain. Energy Rev. 2017, 71, 720–731. [Google Scholar] [CrossRef]
- Yang, Y.; Yang, Y.; Lu, Q.; Liu, D.; Xie, P.; Wang, M.; Yu, Z.; Liu, Y. Comprehensive Evaluation of a Pumped Storage Operation Effect Considering Multidimensional Benefits of a New Power System. Energies 2024, 17, 4449. [Google Scholar] [CrossRef]
- Tang, H.; Li, R.; Song, T.; Ju, S. Short-term optimal scheduling and comprehensive assessment of hydro-photovoltaic-wind systems augmented with hybrid pumped storage hydropower plants and diversified energy storage configurations. Appl. Energy 2025, 389, 125787. [Google Scholar] [CrossRef]
- Xie, Z.; Wang, Y.; Chang, J.; Guo, A.; Niu, C.; Zheng, Y.; Tian, Z. Optimal scheduling and benefit sharing of hybrid pumped storage hydropower plants with multiple operators. Energy 2025, 333, 137242. [Google Scholar] [CrossRef]
- Ruppert, L.; Schürhuber, R.; List, B.; Lechner, A.; Bauer, C. An analysis of different pumped storage schemes from a technological and economic perspective. Energy 2017, 141, 368–379. [Google Scholar] [CrossRef]
- Zhang, M.; Liu, L.; Wang, Q.; Zhou, D. Valuing investment decisions of renewable energy projects considering changing volatility. Energy Econ. 2020, 92, 104954. [Google Scholar] [CrossRef]
- Shimbar, A.; Ebrahimi, S.B. Political risk and valuation of renewable energy investments in developing countries. Renew. Energy 2020, 145, 1325–1333. [Google Scholar] [CrossRef]
- Liu, Y.; He, Y.; Li, M.; Zhang, Y. Design of Price Market Linkage Mechanism and Economic Benefit Evaluation of Pumped Storage Power Station Under the Power Market Environment. Mod. Electr. Power 2023, 40, 42–49. [Google Scholar] [CrossRef]
- Li, H.; Li, X. Research on High Quality Development of Pumped Storage Stations under New Power System. J. N. China Electr. Power Univ. (Soc. Sci.) 2024, 5, 51–59. [Google Scholar]
- Wei, Z. Research on Market-based Transaction Model of Pumped Storage Power Stations in Shandong Province. Sino Glob. Energy 2025, 30, 7. [Google Scholar]
- Isaza Cuervo, F.; Arredondo-Orozco, C.A.; Marenco-Maldonado, G.C. Photovoltaic power purchase agreement valuation under real options approach. Renew. Energy Focus 2021, 36, 96–107. [Google Scholar] [CrossRef]
- Delapedra-Silva, V.; Ferreira, P.; Cunha, J.; Kimura, H. Methods for Financial Assessment of Renewable Energy Projects: A Review. Processes 2022, 10, 184. [Google Scholar] [CrossRef]
- Bangjun, W.; Feng, Z.; Feng, J.; Yu, P.; Cui, L. Decision making on investments in photovoltaic power generation projects based on renewable portfolio standard: Perspective of real option. Renew. Energy 2022, 189, 1033–1045. [Google Scholar] [CrossRef]
- Yang, X.; Yang, F. Investment Decision of Energy Storage in Wind Power Generation Based on Real Options. Mod. Electr. Power 2021, 38, 442–448. [Google Scholar] [CrossRef]
- Shi, X.; Wang, L.; Mo, Y. Research on Investment Decision of Hydropower Project Based on Fuzzy Real Option. Yellow River 2023, 45, 141–145. [Google Scholar]
- Hu, J.; Chen, H. Flexible Investment Decision of Waste-to-energy Projects under Carbon Trading Mechanism. Chin. J. Manag. Sci. 2025, 33, 320–331. [Google Scholar]
- Opinions on Further Improving the Pricing Mechanism for Pumped Storage Energy. Available online: https://www.gov.cn/zhengce/zhengceku/2021-05/08/content_5605367.htm (accessed on 1 September 2025).


Disclaimer/Publisher’s Note: The statements, opinions and data contained in all publications are solely those of the individual author(s) and contributor(s) and not of MDPI and/or the editor(s). MDPI and/or the editor(s) disclaim responsibility for any injury to people or property resulting from any ideas, methods, instructions or products referred to in the content. |
© 2025 by the authors. Licensee MDPI, Basel, Switzerland. This article is an open access article distributed under the terms and conditions of the Creative Commons Attribution (CC BY) license (https://creativecommons.org/licenses/by/4.0/).